macroeconomic policies and achievements in · web viewmacroeconomic policies and achievements in...
TRANSCRIPT

Macroeconomic Policies and Achievements inTransition Economies, 1989-1999*
STANISLAW GOMULKA**
Introduction
The primary purpose of this paper is to consider and answer the following questions:
● How far have the transition economies of Central Europe (CE) and the former Soviet Union (FSU) been able to establish the macroeconomic framework needed for sustaining investment and economic growth?
● What distinguishes the more successful from the less successful: initial conditions, the political environment, the state of institutions?
● How far have weak or missing institutions hampered effectual policy-making?
● Have macroeconomic policy dilemmas been intensified by weak institutions?
● Has too much emphasis been placed on lowering inflation – or reducing it too rapidly – at the expense of economic growth?
● What lessons can be drawn for those transition economies which are still struggling to achieve macroeconomic stability and economic growth?
● Under the emerging economic system, what is the potential contribution togrowth of the technological convergence (catching-up) factor?
These specific questions are addressed in Part B of the paper.1 The wider issues
of reform strategy and the content of the main macroeconomic policies are discussed in
Part A. The transition countries covered in this survey are listed in Table 1. They are
divided into two groups: 13 Central European and Baltic countries and 12 members of the
Commonwealth of Independent States (CIS). This division is motivated, in part, by
similarities in the choice of reform strategies made by the countries in each group.
Table 1 also gives two GDP estimates for each country in 1998, one based on market
* An invited paper prepared for presentation at the United Nations’Economic Commission for Europe Annual Seminar, Geneva, 2 May 2000.** London School of Economics, Department of Economics.1 All these questions except the last one were formulated by Paul Rayment, Director of the Economic Analysis Division of the UN’s Economic Commission for Europe, on behalf of the Seminar’s organisers.
exchange rates and the other based purchasing power parity (PPP) exchange rates. The
latter estimates are used to obtain each country’s weighting. These weightings are then
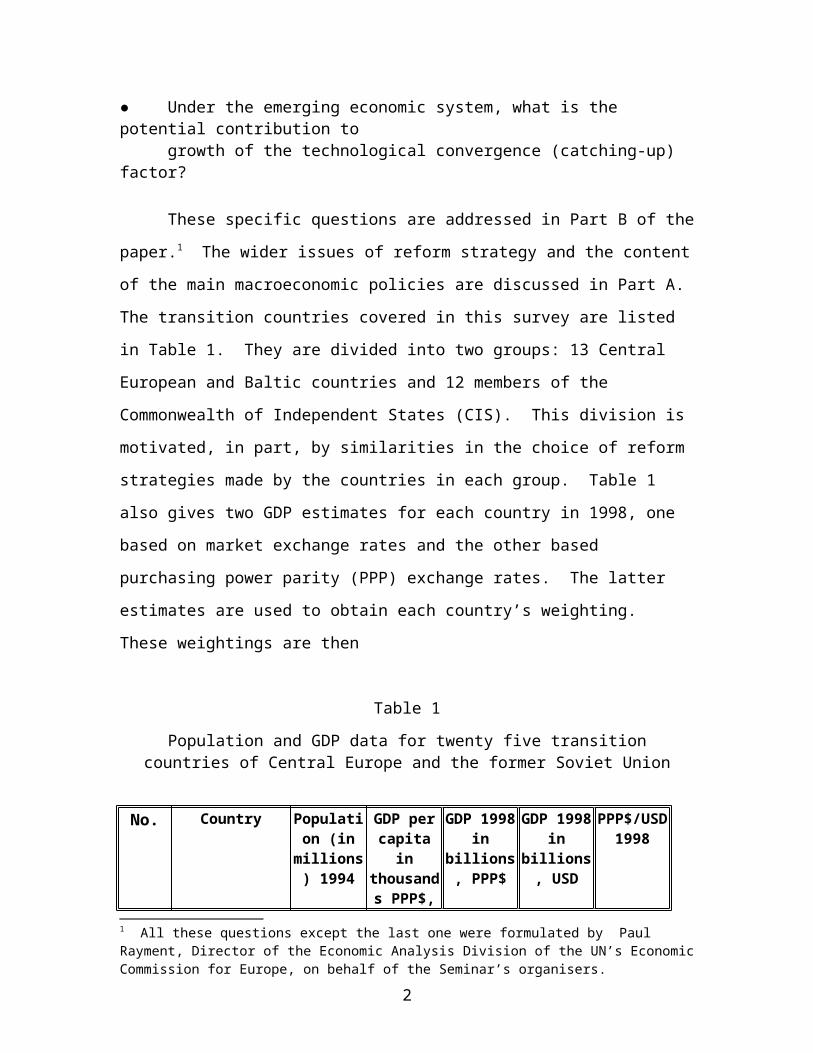
Table 1
Population and GDP data for twenty five transitioncountries of Central Europe and the former Soviet Union
No. Country Population (in millions)
1994
GDP per capita in
thousands PPP$, 1998
GDP 1998 in billions,
PPP$
GDP 1998 in billions,
USD
PPP$/USD1998
1 Albania 3.4 2.9 9.9 3.2 3.1
2 Bulgaria 8.4 4.8 40.3 10.9 3.7
3 Croatia 4.5 6.8 30.6 21.9 1.4
4 Czech Republic 10.3 12.5 129 56.0 2.3
5 Estonia 1.5 7.6 11.4 5.4 2.1
6 FYR Macedonia 2.1 4.4 9.2 3.3 2.8
7 Hungary 10.3 10.2 105 47.8 2.2
8 Latvia 2.6 5.6 14.6 6.9 2.1
9 Lithuania 3.7 6.4 23.7 10.8 2.2
10 Poland 38.5 7.7 296 148 2.0
11 Romania 22.7 5.6 127 38.5 3.3
12 Slovak Republic 5.4 9.8 52.9 20.4 2.6
13 Slovenia 2 14.3 28.6 19.1 1.5CIS
1 Armenia 3.6 2.2 7.9 1.8 4.3
2 Azerbaijan 7.5 2.2 16.5 4.0 4.1
3 Bielarus 10.4 6.1 63.4 14.4 4.4
4 Georgia 5.5 3.3 18.2 5.3 3.4
5 Kazakhstan 17 4.3 73.1 25.2 2.9
6 Kyrgyz Republic 4.6 2.3 10.6 1.6 6.5
7 Moldova 4.4 1.9 8.4 1.9 4.4
8 Russia 148 6.5 962 275 3.5
9 Tajikistan 5.8 0.9 5.2 1.2 4.2
10 Turkmenistan 4 3.2 12.8 1.7 7.6
11 Ukraine 51.9 3.2 166 43.7 3.8
12 Uzbekistan 22.4 2.1 47.0 13.1 3.6
Sources:GDP per capita in US dollar PPP terms from World Economic Outlook, October 1999, IMF 1999.GDP (1998) levels in US dollars at market exchange rates are from Transition Report 1999, EBRD.Part B of the paper to produce weighted averages and absolute mean deviations for the
main macroeconomic variables; also weighted econometric estimates of the correlation
coefficients between output falls and inflation rates, all for the years 1991-1998.
2
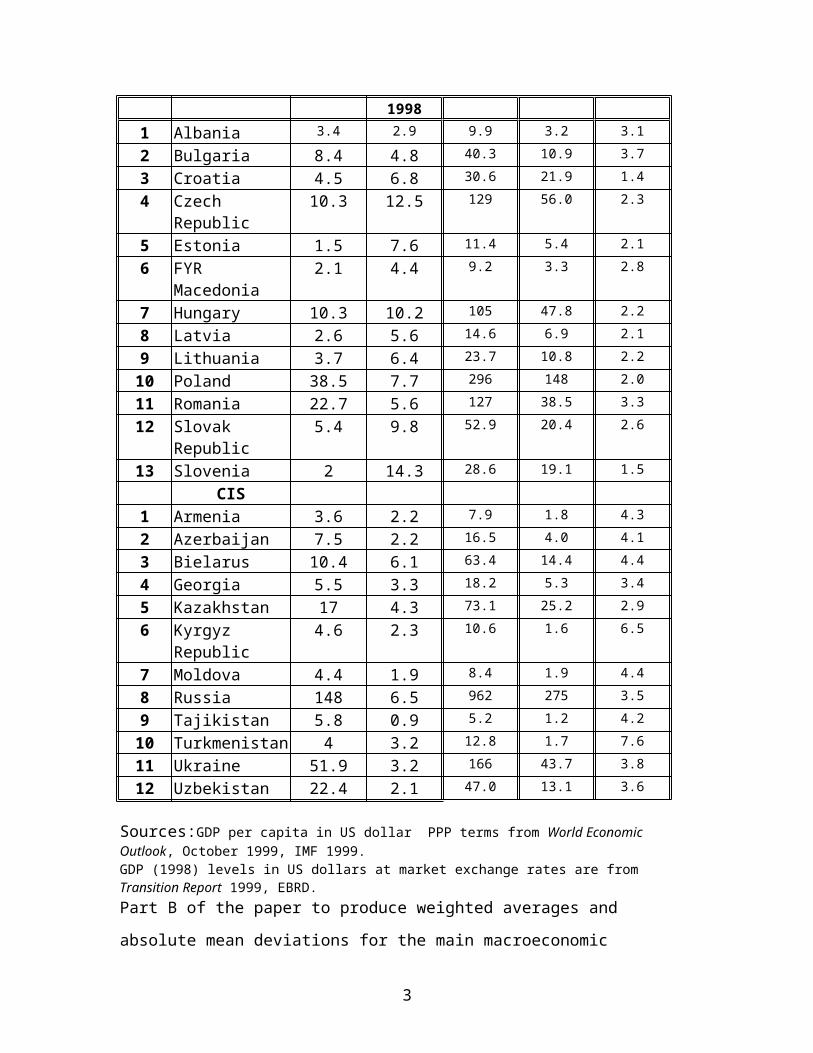
The PPP estimates of GDP imply that, in 1998, the combined weighting of the CIS region
was 2.6 % of the world economy and the combined weighting of the CE and Baltic
countries was 1.6 %.
PART A. An Overview of Reforms and Policies
1. Reform StrategyThe reform of economic system which occurred in Central Europe and the FSU in the
1990s has been fundamental, involving major changes of institutions, types of ownership,
corporate governance, laws, modes of interpersonal behaviour, and attitudes to work.
Some institutions were cut in size or closed down, others expanded or created. These
institutional changes were superimposed on massive changes in relative prices and the
pattern of foreign trade; the latter changes caused in their turn major shifts in the
composition of output. In terms of institutions, skills, prices and products, there was
therefore a large distance between the initial point (where a given post-socialist economy
found itself just before the reform) and the end point of its intended transition. Reform
strategies have addressed the content, the sequence and the speed of reforms required to
effect this transition.
In adopting a broad reform strategy and specific polices, a transition country had
to take into account its particular economic circumstances and political constraints. Such
a strategy had typically six major components: micro-liberalisation (especially with
regard to prices, trade and entry), macro-stabilisation (especially with regard to inflation,
public finances and foreign debt), structural changes (especially privatisation and
international trade), new market institutions (especially with regard to commercial codes,
property rights and the financial/capital markets sector), safety nets, and external
assistance. The first four were crucial components of any reform package. Soaring
unemployment and the elimination of most subsidies to households required a complete
re-modelling of the welfare system. With the exception of the former East Germany, and
to some extent also Bulgaria, Poland and parts of the former Yugoslavia (Bosnia,
Kosovo) external assistance was typically small and of limited impact.
3
The inherited circumstances fall into two categories, common and country-
specific. As the reform policies and transition paths have exhibited some basic
similarities among countries, the common category would seem to have dominated.
Nevertheless, the variations in country-specific circumstances were substantial enough to
have a major impact on the choice of overall reform strategy as well as specific policies.
The similarities were possibly greatest with respect to micro-liberalisation and
certain important structural changes, notably re-orientation of foreign trade and
privatisation. Somewhat unexpectedly, the greatest differences initially emerged in the
area of macroeconomic policy. These differences, however, narrowed down in the
second half of the 1990s.
Three broad reform strategies may be distinguished: the ‘shock therapy’, rapid
adjustment and gradual change. The shock therapy approach was applied really only in
the former East Germany. Although this strategy offered the potential for a fast
reallocation of resources, it proved far too costly in the short and medium term to be of
interest to any other post-communist country.2 At the other end of the spectrum is a
gradual strategy. This has been pursued successfully by China since the late 1970s.
However, in conditions of a total (economic, institutional and political) crisis, virtually
the only choice open for the FSU and Central Europe was a form of rapid adjustment. A
strong variant of it (variant S below) was adopted by some countries, e.g. Croatia, Czech
Republic, Estonia, Hungary, Latvia, Lithuania, Poland, Slovakia and Slovenia, and a
weak variant (variant W) by most other countries, particularly Russia and Ukraine. The
differences between the two variants have been substantial, especially during the first few
years of transition.
Variant S (most Central European and Baltic countries)
2 J. Kornai in “Ten Years After The Road to a Free Economy” (The Author’s Self-Evaluation, the World Bank’s Annual Conference on Development Economics, April 18-20, 2000, Washington, D.C.) suggests that, in the early 1990s, “many participants in the post-socialist transformation suffered from an obsession with speed”, and notes that “excessive emphasis on speed leads to impatience, aggressiveness and arrogance”. He uses mass-privatization programmes in the Czech Republic and Russia as examples. However, actual policies of many reformers were often much less radical than their rethorics. This applies also to the possibly most influential reformers of the region: Balcerowicz, Gaidar and Klaus.
4

One way of defining this variant was formulated by Vaclav Klaus, the then Prime
Minister of the Czech Republic, in the shape of Ten Commandments.3 They are as
follows:
(i) Reforms in post-communist countries are the outcome of a complex social
and political process, and cannot therefore be pre-planned or socially-engineered
by any one person or centre.
(ii) The role of foreign aid is marginal.
(iii) An economic shock, meaning a large fall in output, is inevitable.
(iv) Dramatic actions are required to impose a restrictive macroeconomic
policy, liberalise prices and foreign trade, and establish a process for
privatisation.
(v) A restrictive macroeconomic policy must be sustained.
(vi) The price shock resulting from price liberalisation must be vigorously
defended and survived.
(vii) Economic restructuring requires comprehensive privatisation.
(viii) Transformation costs must be widely shared.
(ix) Successful transformation requires the opening of markets to foreign
goods and the free flow of peoples and ideas.
(x) Successful transformation requires successful politicians.
These commandments well encapsulate the views of a substantial body of
reformers – both decision-makers and their advisers, in the early 1990s. However, actual
developments provide the basis for significant modifications to this original formulation.
The choice of reforms, while certainly the outcome of a political process, has been
limited by the overriding goal of imitating or even replicating the well-known solutions,
in terms of both institutions and policies, of market-based capitalist economies.
Moreover, reformers can have, should have and usually do have specific reform
blueprints for achieving this goal. These blueprints have been useful even if the
timetable, the sequencing and the methods of their implementation may have changed
under the weight of political pressures.
3 V. Klaus “The Ten Commandments of Systemic Reform”, Group of Thirty, Occasional Paper No.43, Washington D.C., 1993.
5
With respect to foreign aid, the main reason for its marginal role for most
countries has been the size of their economies. Using the 1998 purchasing power parity
(PPP) exchange rates, the combined GDP of the FSU and Central Europe was, on the eve
of the reforms, some 3500 billion US dollars (Data in Table 1 imply that it was 2300
billion US dollars in 1998). The investment needed to restructure economies of that size,
so as to regain the pre-reform level of GDP, is probably of the same order of magnitude.
The combined resources of the IMF, the World Bank and the EBRD available to
transition countries have been, by comparison, small, and can, in any case, be provided
only on a commercial basis, and therefore subject to performance conditions which
economies in transition cannot easily meet. Only transfers to the former East Germany
have been really large in relation to its own GDP, and, indeed, have been several times
larger than the total aid extended to all other transition countries. However, the impact on
economic recovery has been moderate. Moreover, in the case of Russia, it was not an
extension of external financing but its discontinuation, following the crisis of August
1998, that forced the domestic adjustments in policies which accelerated the reform
process. Still, there are a few countries, e.g. Bulgaria and Poland, in which foreign aid,
especially in the form of partial debt cancellations, has been important and helpful.
Commandments Four to Seven formed the core of reform efforts. Short-term
gains (if any) arising from conducting a loose macroeconomic policy turned out to be
small, while medium and long-term gains from establishing a stable macroeconomic
environment are commonly thought to be large. Initially, the main objective of a
stabilisation policy may, and possibly should, be moderate inflation rather than stable
prices. Only once a country has moved from transformation to recovery and sustainable
growth, a high quality macroeconomic stability becomes essential. This requirement
applies, above all, for the candidate members of the European Union. A similar caveat
can be made with respect to Klaus’s Seventh Commandment, concerning the need for
rapid privatisation. In Poland, state-driven privatisation has been slow. But a rapid
autonomous growth of the original private sector has ensured that the total private sector
accounted, in 1999, for about 65% of GDP. Privatisation of SOEs, while usually helpful,
may thus not be as necessary as some reformers initially believed. The quality of
privatisation has proved to be very important, and there is a trade-off between speed and
quality.
6

The Tenth Commandment has also proved to overstate the case. Successful
politicians can be helpful, but not necessary for a successful transformation. Reform
must be legitimised through a democratic political process. This is vital. But the initial
legitimisation was provided by the collapse of the communist system. This collapse
offered a window of opportunity, the Balcerowicz period of ‘extraordinary politics’, to
initiate the kind of reforms which could not be easily reversed under more hostile
political conditions which prevailed later on. The socially costly phase of transition took
place at a time when democratic institutions were in their early infancy. Consequently
there were (and in most cases, still are) typically too many small parties with ill-defined
policies, the division of power between the main central institutions has often been
unclear and many politicians lack experience of efficient communication with the
electorate. Such circumstances can produce confusion and political instability which
hinder the process of economic reform and pose a continual threat to democratic politics.
The result has been frequent changes of government and, in many cases, legislation
slowdowns. However, such frequent changes have also provided an opportunity to
employ the political capital of a large pool of politicians during the socially most costly
phase of transformation.
From today’s perspective, it is also noticeable that Klaus’ formulation understates
the importance of the task of creating a new legal and institutional environment and a
new culture of habits and attitudes which a modern market economy requires. This task
has been particularly important in the countries of the FSU.
The more successful transitions of the Central European and Baltics countries are
associated with the S-variant of the rapid adjustment model. One of the most successful
countries has been Poland, where real GDP was, in 1999, one quarter higher than at the
beginning of the transition in 1989 - by far the best result in the region. After a
contraction of about 15 percent in 1990 and 1991, the economy has grown at an average
rate of 5 percent per annum. Estonia, Hungary Latvia, Lithuania, Slovakia and Slovenia
have also experienced rapid growth in the last few years.
7
The Polish model of transition consisted of five main elements:4
1. complete liberalisation of de novo private sector entry into almost all areas
of economic activity (January 1989 and January 1990);
2. adoption of the pre-1939 commercial code (1982) and abolition of communist
party organisations in SOEs, which gave real power to the workers’ councils that
had formally exercised it since 1981 (end 1989);
3. very rapid price liberalisation (during 1989 the share of freely determined
prices rose from 25% to 90%);
4. introduction of hard budget constraints on SOEs and a sharp reduction of
inflation to a moderate level, through fiscal, monetary and wages polices
(January 1990), followed by gradual dis-inflation;
5. current account convertibility of the currency and almost complete foreign
trade liberalisation (January 1990).
The Polish programme was gradual in many important respects: it took 10 years to reduce
inflation to below 1% a month, mass privatisation was limited to small enterprises, social
transfers have been large (pensions increased substantially in relation to wages) and
budget deficits remained significant throughout the 1990s. The results of the programme
were, on the positive side: the fast introduction of market prices based on relative scarcity
and world prices for traded goods; a financial squeeze on SOEs, which forced them to
release rapidly excess labour and physical capital (this is known as asset privatisation);
the maintenance of a minimum tolerable level of effective corporate governance in SOEs
(due in part to the workers’ councils); and very rapid development of the de novo private
sector. On the negative side, the restructuring of public services and public finances has
been inadequate, limiting the growth of domestic savings and investments.
The Hungarian model has been similar. The same five main elements of reform
were introduced as enacted and implemented that is in Poland, although their
implementation was somewhat more gradual and workers councils had little importance.
However, the bankruptcy law that was enacted and implemented has been possibly the 4 This description of the programme and the model follows that given by M. Dabrowski, S. Gomulka and J. Rostowski, in “Whence Reform? A Critique of the Stiglitz Perspective”, London School of Economics and the Central European University, mimeo, 2000. More details of the model may be found in S. Gomulka, 1998, “The Polish Model of Transformation and Growth”, Economics of Transition, vol.6(1); 163-171, and in M. Dabrowski, 1999, “Ten Years of the Polish Economic Transition 1989-1999”, paper presented at the 5th Dubrovnik Conference on Transition Economies: Ten Years of Transition: What Have we Learned and What Lies Ahead, June 23-25 Dubrovnik.
8
most radical in Central Europe. Also the growth of the domestic de novo private sector
tended to be in services rather than in manufacturing, where there was a fairly rapid
development due to foreign direct investment (FDI). A larger external debt burden and
poorer macroeconomic policies meant that stabilisation of the GDP contraction took
longer than in Poland and – which was more significant - the beginning of rapid growth
was delayed by five years (until 1997).
Slovenia was also somewhat of an exception, on two counts: earlier, pre-transition
reforms had been more substantial than elsewhere in Central Europe and the initial crisis
was much more limited. Hence a more gradual transformation was feasible and, indeed,
adopted in the early 1990s.
Following the adoption of such programmes, the experience of successful
transitions indicate that growth can resume quickly and can proceed at a rapid pace. This
growth has been driven almost entirely by de novo private sector development, rather
than through the restructuring of SOEs, privatised or otherwise. 5 De novo private
activity, which at first was predominantly domestic and concentrated in services, as time
went on, in all successful countries came to involve significant foreign FDI and to expand
into manufacturing industry.
The experience of the Central European and Baltic countries demonstrates: the
usefulness of pre-existing rules and institutions (workers’ councils, a commercial code, a
legal system); the importance of macro-economic stabilisation and the accompanying
imposition of hard budge constraints; and the importance of the liberalisation of prices,
trade and entry (PTE) for growth of new private enterprise.
Variant W (most CIS countries)
In Russia, the 1992 attempt at sharp budget hardening/disinflation cum full PTE
liberalisation, the Gaidar plan failed. This meant that enterprises have, subsequently,
been under less pressure to divest physical assets and shed labour they did not need, thus
effectively denying de novo private firms the resources they need for their development.
The failure to liberalise thoroughly kept the set-up costs for new firms high. For several
years large subsidised credits and entry barriers undermined the credibility of the
5 J. Rostowski, 1993, “Private Sector Development, Structural Changes and Macroeconomic Stabilisation: The Case of Poland 1998-93”, LSE’s Centre for Economic Performance, DP no. 159, and S. Gomulka, 1998, “The Polish Model of Transformation and Growth”, Economics of Transition, vol.6(1): 163-171.
9

strategy, inducing capital flight, creating opportunities for tax avoidance and criminal
asset stripping, as well as slowing down the restructuring by old firms. The Russian
reform was nevertheless radical, since by and large prices and wages were liberalised
quickly. As a result, markets started to develop, taking over from the planners the
informational and co-ordination roles. A large-scale privatisation programme was also
initiated early on and implemented quickly. This embarking on privatisation before full
liberalisation (involving not just product prices, exchange rates and interest rates but also
trade and entry terms), and before the hardening of budget constraints for enterprises and
disinflation was the key characteristic feature of the reform strategy adopted by Russia
and most other CIS countries in the first few years of transition. However, these
differences between variants S and W have narrowed down in the late 1990s.
2. Has the Output Collapse been Inevitable?The phenomenon of large falls in output in the economies of CE and FSU during
their systemic transformation in the 1990s is one of the most researched - yet one of the
most controversial. Kornai proposed the term ‘transformational recession’ to indicate
that these falls were directly related to the change of economic system rather than to
transition policies. However, these falls occurred against a background of rapid growth
in China and Vietnam, which had also been introducing fundamental changes in their
economic systems. This may indicate that the falls were related not merely to the
systemic transformation as such, but also to its speed. Stiglitz , among others, argues that
the speed of transition was a choice variable, and that choosing high speed was a major
error.6 In a recent survey of evidence and interpretations of the recession, the present
author suggested that, unlike in China and Vietnam, in the countries of CE and the FSU
(and Mongolia) the rapid speed was forced principally by the initial conditions of their
deep and all-embracing (economic, institutional and political) crisis7. In the survey, I
identified four classes of specific causes of output falls: (1) massive and rapid changes in
relative prices in conditions of limited resource mobility; (2) the elimination of excessive
6 J. Stiglitz, 1999, “Whither Reform”, Annual Bank Conference in Development Economics, World Bank, Washington D.C., and “Quis Custodiet Ipsos Custodies?” Annual Bank Conference on Development Economics_Europe, World Bank, 1999, Paris.7 S. Gomulka, 1998, “Output: Causes of the Decline and the Recovery”, in Emerging from Communism: Lessons from Russia, China and Eastern Europe, eds. P. Boone, S. Gomulka and R. Layard, MIT Press, Cambridge, MA.
10

real aggregate demand to establish buyers’ markets; (3) the collapse of captive markets
within the former CMEA area; and (4) collapse of the arms industry and of state-financed
investments in housing, energy, agriculture, and the infrastructure. Relative prices
changed mainly as a result of rapid price and trade liberalisations, sharp increases in
interest rates, large up-front devaluations, and considerable harmonisations in turnover
and border tax rates.
A sharp price liberalisation caused large supply-side and demand-side shocks that
reduced outputs and increased prices. However, the high speed of price liberalisation was
in part a consequence of the collapse of central planning institutions, since this collapse
created the need to establish immediately a market-based co-ordination mechanism, of
which market-clearing (free) prices were an essential part. A fairly rapid PTE
liberalisation was also needed to enhance competition and begin structural changes.
In the initial period of transition, economic developments in the FSU and CE
reflected not so much the quality of current reforms, but the pre-reform crisis conditions,
which had led to the collapse of the Soviet style economic, military and political system.
In Russia, because of this crisis, industrial output had started to fall sharply already in
1991, still under the old system. Whether reform had taken place or not, this fall would
have presumably continued as the system unwound, as the experience of slow and/or late
reformers would indicate, e.g. Bulgaria, Romania and Belarus. For the collapse of the
Warsaw Pact (and the associated contraction of the defence industry), of the CMEA (and
the associated contraction of trade) and of the USSR itself (and the associated disruption
of intra-Soviet production links), have all been the largely inevitable consequences of
earlier events, in Russia and elsewhere. The reduction in the output of the defence and
defence-related industries alone, according to one knowledgeable source, accounts for
60% of the fall in industrial production in Russia8.
In his forceful challenge of the merits of fast liberalisation and stabilisation,
Stiglitz accepts that, according to economic theory, reducing price distortions through
price and trade liberalisation and price stabilisation, should in addition to improving
incentives through privatisation, “have moved countries closer to their production
possibilities curve”.9 The problem for him is that “output should have soared – instead it
8 Y. Yassin, 1999, “Defeat or Retreat? Russia’s Reforms and the Financial Crisis”, mimeo. Moscow.9 References in footnote 4.
11

plummeted”. Much of his challenge to the conventional theory is motivated by this
apparent contradiction. However, Stiglitz ignores the arguments which associate output
falls in the initial phase of transition mainly with unusually large inherited (structural and
price) distortions and with the institutional crises which forced the tempo of price
liberalisation. Despite wide differences in reform policies, the cumulative falls in
industrial output, at 40-60%, were not just large but also similar between countries. He
also ignores the fact that, as Aslund, Boone and Johnson first showed,10 the speed of
macroeconomic stabilisation had a significant effect on the time profile of decline, but
had little impact upon the magnitude of the cumulative fall of output. These falls tended
to be larger in the countries which were slow in bringing inflation to moderate levels, say
below 40% per annum. The evidence is too weak to suggest the presence of causality
from higher inflation to larger cumulative output falls. It is probably more likely that the
countries (mainly within the FSU) which were subjected to larger supply-side and
demand-side shocks also experienced larger output falls and, simultaneously, higher
inflation (I shall return to this point in Part B, Section 5). Nevertheless, apart from
increasing inflation, the main effect of a loose macroeconomic policy would appear to
have been, in most cases, to reduce the rate of fall and, therefore, to extend the length of
the transformational recession 11. However, as the EBRD’s Transition Reports 1995-
1999 note, the evidence goes to support the proposition that, in the countries which
liberalised and stabilised to a greater extent, output not only stopped falling earlier, but
also started to recover faster.
The medium-term purpose of the reforms is to restructure transition economies in
favour of activities producing more value added per unit of primary inputs (of labour and
capital). If restructuring needs had been small, real wages highly flexible and labour and
capital resources easily moveable, then large output falls would have been unnecessary to
effect such a restructuring. However, restructuring needs were, in fact, exceptionally
large and the mobility of resources was quite limited. In such circumstances
unemployment, although it does involve short term costs, performs a positive signalling
role, by making it clear to people that they have to either change skills and move to
higher productivity work or accept lower real incomes. Therefore, the welfare cost
10 A. Aaslund, P. Boone and S. Johnson, 1996, “How to Stabilize: Lessons from Post-Communist Countries”, Brookings Papers on Economic Activity, 81(1) 217-315.11 On this point, see also EBRD’s Transition Report 1999, p.64.
12

associated with a temporary rise in unemployment can be thought of as a form of
investment needed to achieve a permanent welfare gain from a better allocation of labour
and other resources.
3. Money Has Been the Key Nominal AnchorIn most countries of Central and Eastern Europe it was assumed that stabilisation
of the liberalised prices must be based on the standard International Monetary Fund
(IMF) approach, with an important role of nominal anchors assigned to an incomes policy
and – when feasible - a fixed exchange rate, in addition to restrictive fiscal and monetary
policies. In the event, however, the supply of credit to governments and enterprises
proved by far the dominant nominal anchor, with the exchange rate and the incomes
policy playing only supportive roles.
Two related broad conclusions can be drawn from the evidence regarding dis-
inflation experiences in transition countries. One is that fiscal fundamentals, that is, the
size of the budget deficit of general government and the way it is financed, have been the
key to dis-inflation. The other is that the policy of a fixed nominal exchange rate was
helpful but not essential, and that, in any case, its survival was strictly conditional on a
sound fiscal policy.12 Also, “the transition record suggests that innovative exchange rate
arrangements can provide only a brief interval during which sound fiscal discipline needs
to be put in place for controlling inflation”.13 With respect to the exchange rate, low
levels of international reserves and poor credibility of macroeconomic policies just before
the start of transition, forced large up-front devaluations in all countries except Hungary.
The result was that, initially, world prices offered little discipline for domestic prices. A
restrictive incomes policy was intended to achieve a targeted inflation rate with less
restrictive other policies and, hence, a somewhat smaller recession. However, given the
large changes and uncertainties, it has proved difficult to co-ordinate incomes policy with
main (fiscal and monetary) macroeconomic policies. In Poland in 1990 and Czecho-
Slovakia in 1991, for instance, those main policies were initially so restrictive that in
most enterprises incomes policies were not binding. In the FSU the authorities took the 12 D. Begg, “Disinflation in Central and Eastern Europe”, and S. Gomulka, “Comment on Begg”, both in Moderate Inflation: The Experience of Transition Economies, IMF and National Bank of Hungary, eds. C. Cottarelli ang G. Szepary, 1998, Washington , D.C.13 P. Desai, “Macroeconomic Fragility and Exchange Rate Vulnerability: A Cautionary Record of Transition Economies”, Journal of Comparative Economics, vol.26(4): 621-641, 1998.
13

view that a restrictive incomes policy could not be implemented for political reasons. In
the CIS countries the politically dependent central banks became initially, in their credit
policy for enterprises, concerned above all with the level of economic activity, typically
the chief domain of governments. As noted earlier, in the first few years of transition, the
CIS governments themselves ran large budget deficits which were monetized (Table 3).
The consequence was wage-price inflationary spirals and (near) hyperinflations.
In the initial years some central banks made successful use of the instrument of
credit limits. Deploying this instrument means that real interest rates need not be high -
though they should not have been as negative as they were in most of the FSU. These
rates may have to be higher in the intermediate stage of transition when credit limits are
lifted and the real exchange rate has had the time to appreciate. During that stage high
interest rates became the key policy instrument for protecting bank savings and
restraining wage inflation. However, in the advanced stage of transition, higher
credibility and capital account liberalisations have resulted in increased international
capital mobility. This in turn forces some convergence of high domestic interest rates to
low world interest rates.
4. The Exchange Rate PolicyThe freedom to set the exchange rate policy was initially highly constrained by
low levels of international reserves and an urgent need to win credibility to the new
policy of full current account convertibility at a uniform rate. It was desirable to have a
regime of a fixed nominal exchange rate in order for the rate to serve as an anchor for
domestic prices, thus reducing inflationary expectations and inflation itself. However,
the countries which adopted such a regime had to devalue up-front strongly to ensure a
sufficiently competitive rate, so that reserves would increase. As I have already noted,
such devaluations opened up large gaps between domestic and foreign prices, thereby
undermining the anchoring role of the exchange rate. In Russia (and many other CIS
countries) international reserves were too low and the monetary and fiscal policies too lax
to contemplate nominal exchange rate pegging. A floating exchange rate regime was
therefore adopted. However, the need to build up reserves meant that Russia and other
floaters could not adopt a pure float. Once the reserves become large as a result of
interventions in the exchange market, the case for a pure float is stronger. A broad
14
generalisation would be that, at the (early) stabilisation stage of transition, a concern with
dis-inflation favoured nominal exchange rate pegging while at the (later) advanced stage
when inflation is already low, the need to limit the destabilising effects of capital inflows
favoured a more flexible exchange rate regime, including pure float as an extreme option.
Between these two stages, both the inflation rate and reserves would be of moderate
sizes, and the concern to remain competitive favoured the adoption of a regime for the
exchange rate determination that would combine some flexibility in nominal terms with
some stability in real terms. The regime chosen for this intermediate stage was typically
a crawling band, with the pre-announced rate of crawl linked to anticipated inflation.
This rate would therefore decline as dis-inflation progressed, while the band would be
narrow initially and widen over time to a maximum of the ERM-2 size of ±15%. To limit
the domestic cost of any external shock, it was also desirable to peg to a basket of
currencies, with a composition reflecting trade flows, rather than to any single currency.
Exchange rate movements in all transition economies, with the notable exception
of Hungary, have followed a similar path, with a sharp depreciation at the start of
transition followed by gradual real appreciation. Such a path is hardly surprising given
the initial conditions: low levels of international reserves, large risks associated with
transition, inexperienced policy makers, no record of convertibility, and typically poor
credibility of policies14.
Several countries adopted the institution of a currency board, under which
nominal pegging is combined with full backing of the base money by international
reserves. The key benefit of such an arrangement is a sizeable instant gain in credibility.
This lowers immediately inflationary expectations, which in turn reduce market interest
rates, both nominal and real. As the experience of Baltic countries in early 1990s and
Bulgaria in 1997 showed, falls in interest rates could be large and rapid. In the short
term, lower interest rates reduce the cost of servicing debt, both private and public, which
in turn reduces both the stock of under-performing assets of the banking sector and the
budget deficit of the government, thus further improving credibility. A currency board
14 Economic and other factors which underlie exchange rate movements in transition economies are discussed by L.Halpern and C. Wyplosz, 1997, “Equilibrium Real Exchange Rates in Transition Economies”, IMF Staff Papers, 44(4):430-460 and by the Symposium on Exchange Rates, Journal of Comparative Economics, vol.26(4), December 1998. The main reason for the Hungary’s exception was, probably, the country’s high standing among foreign investors at the start of transition.
15
also helps to instil confidence among investors and hence supports recovery of the
enterprise sector.
However, the strait-jacket of the currency board deprives the macroeconomic
framework of any flexibility with respect to the exchange rate. This, and indeed, any
fixed nominal exchange rate regime may mislead the private sector into believing that the
exchange rate risk is completely absent. The result is an in-built tendency to contract a
large foreign debt, which was the case not only in South-East Asia but also in the Czech
Republic. This tendency is particularly strong in countries with weak financial
institutions, to which category most transition countries still belong.15 Such a debt,
whether public or private, in turn produces a risk of a currency attack, which, if
successful, leads to sharp devaluation and stagflation.
PART B. A Detailed Discussion of Specific Issues
1. The macroeconomic framework: what progress?To be conducive to investment and growth, the macroeconomic environment has
to meet several criteria. I shall first articulate these criteria and then use them for an
evaluation of the progress which the 25 transition countries have made during the 1990s.
The criteria which, I suggest, would be desirable to meet are as follows:
(i) The inflation rate to be in the moderate range of 10-40%, with a good
prospect of it falling below 10% and remaining in the 0-10% range.
(ii) The general government (GG) budget deficit to be reduced from the initial 5-30%
of GDP for most countries to a level below 3% of GDP, with a high premium
given to a policy of a budget surplus.
(iii) The public debt to be stable at a level significantly below 60% of GDP.
(iv) The GG expenditure to be reduced from its pre- transition level of some 50%
to 60% of GDP to a level in the range of 30% to 40% of GDP.
(v) Official reserves of international exchange to equal at least 4 months of imports 15 S. Fries, M. Raiser and N. Stern, in “Stress test for reforms: Transition and East Asia ‘contagion’”, Economics of Transition, vol.7(2); 535-567, find that more vulnerable to contagion have been the transition countries with large public or private sector imbalances and low reserve cover of short-term debt and that these weak fundamentals have their origin in inadequate structural and institutional reforms.
16

of goods and services, exceed total (public and private) short-term foreign debt,
and be equal to at least of public foreign debt.
(vi) Direct taxes (especially profit taxes) to be low, together with social insurance
contributions providing revenues of less than, say, 20% of GDP.
(vii) The monetization of the economy to be substantial, equal at least to 30% of
GDP.
(viii) The lending rate to be below 20% in nominal terms and below 10% in real
terms.
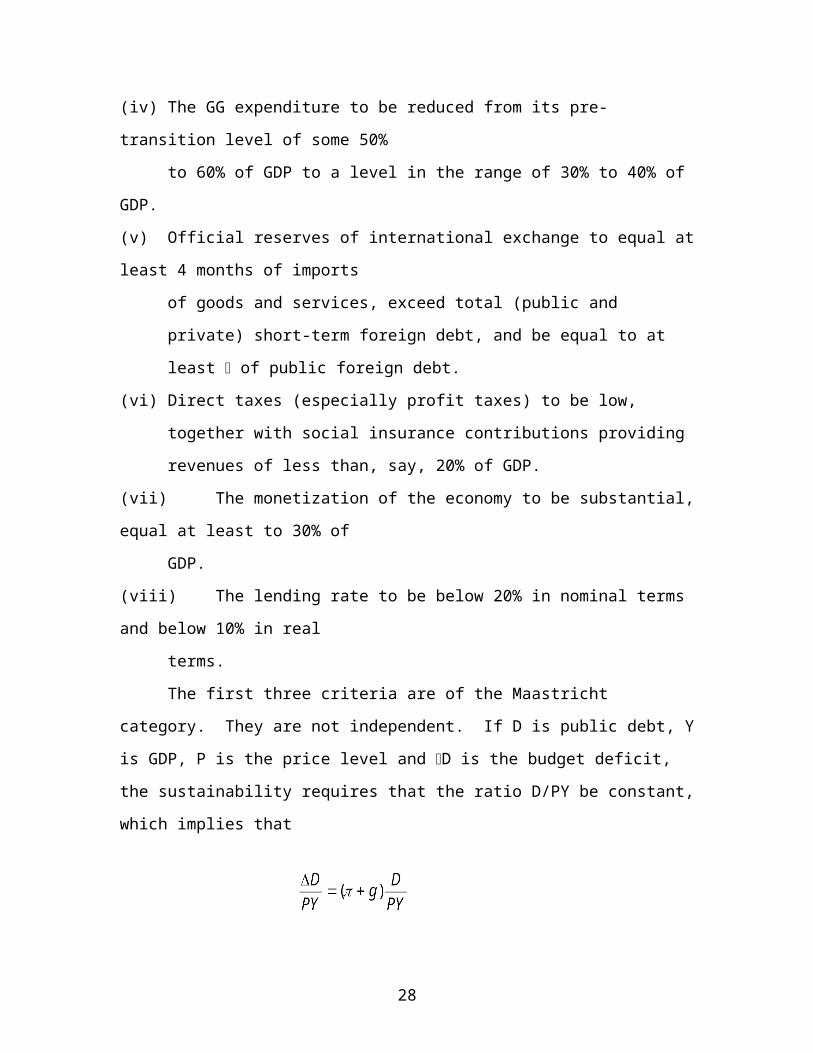
The first three criteria are of the Maastricht category. They are not independent.
If D is public debt, Y is GDP, P is the price level and D is the budget deficit, the
sustainability requires that the ratio D/PY be constant, which implies that
where is the rate of inflation and g is the growth rate of GDP. The LHS of (1) is the
budget deficit as a proportion of GDP, and D/PY on the RHS is the targeted debt-to-GDP
ratio. For most of the EU member countries, the rate g is expected to be low,
say 3%. The maximum budget deficit of 3% is thus consistent with the maximum debt of
60% only if the inflation rate is maintained, in this case, at 2%. Transition economies are
expected to grow at a rate (significantly) higher than 3%. Those countries which intend
to join the EMU will need to meet the Maastricht criteria on inflation and the budget
deficit, hence (i) implies that they would have to keep public debt at a level
(significantly) lower than 60% of their GDP.16 Criteria (ii), (iv) and (vi) are also related.
Their common motivation is to increase national savings and improve incentives for work
and investment. Criterion (v) is intended to reduce the exchange rate risk and criterion
(vii) serves to indicate that the banking sector has developed sufficiently to intermediate
effectively between savers (mainly households) and investors (mainly enterprises).
16 Fiscal sustainability in transition economies has been discussed recently by several authors, e.g. W.H. Buiter, 1997, “Aspects of Fiscal Policy in Some Transition Economies under Fund-Supported Programs”, IMF WP No.31, April.
17
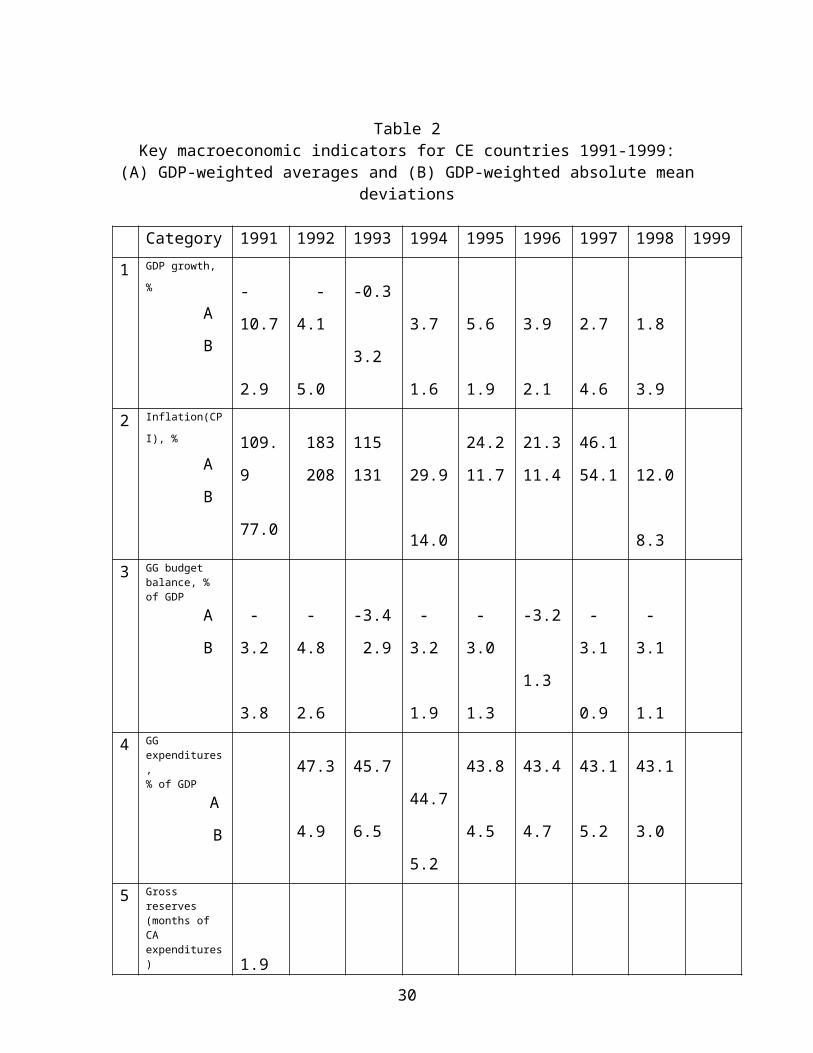
Table 2Key macroeconomic indicators for CE countries 1991-1999:
(A) GDP-weighted averages and (B) GDP-weighted absolute mean deviations
Category 1991 1992 1993 1994 1995 1996 1997 1998 1999
1 GDP growth, %
A
B
-10.7
2.9
-4.1
5.0
-0.3
3.2
3.7
1.6
5.6
1.9
3.9
2.1
2.7
4.6
1.8
3.9
2 Inflation(CPI), %
A
B
109.9
77.0
183
208
115
131
29.9
14.0
24.2
11.7
21.3
11.4
46.1
54.1
12.0
8.3
3 GG budget balance, % of GDP
A
B
-3.2
3.8
-4.8
2.6
-3.4
2.9
-3.2
1.9
-3.0
1.3
-3.2
1.3
-3.1
0.9
-3.1
1.1
4 GG expenditures, % of GDP
A
B
47.3
4.9
45.7
6.5
44.7
5.2
43.8
4.5
43.4
4.7
43.1
5.2
43.1
3.0
5 Gross reserves (months of CA expenditures)
A
B
1.9
0.9 2.1
1.0
2.5
0.8
3.0
0.9
4.4
2.0
3.9
1.7
4.1
1.4
4.5
1.8
6 Broad money, % of GDP
A
B
47.2
15.5
44.7
16.8
44.6
16.6
44.8
15.2
45.7
14.5
44.5
12.4
43.8
117.
7 Lending rate, %
A
B
141
196
45.9
26.3
35.7
16.4
27.7
9.3
45.9
42.2
25.4
9.4
24.4
10.0
Source: Author’s calculations based on official data, as reported in the EBRD Transition Report 1999. The GDP weights calculated from Table 1, using the PPP GDP estimates.Notation: GG stands for general government (central, local and extra-budgetary funds), CA stands for current account. Broad money includes cash in circulation, current deposits and time deposits, in both domestic and foreign currencies.
18

Table 3Key macroeconomic indicators for CIS countries 1991-1999:
(A) GDP-weighted averages and (B) GDP-weighted absolute mean deviations.
No. Category 1991 1992 1993 1994 1995 1996 1997 1998 19991 GDP growth
%
AB
-6.2 2.7
-14.32.1
-9.62.0
-13.72.6
-5.32.5
-3.32.1
1.01.7
-2.92.4
2 Inflation (CPI) %
AB
15510.5
2391303
24312435
514471
15151
30.213.2
15.18.1
70.629.4
3 GG budget balance, % of
GDP
AB
-36.510.2
-15.93.0
-10.42.6
-6.41.1
-7.62.2
-6.81.9
-5.10.8
-5.31.3
4 GG expenditures,
% of GDP
AB
64.89.1
45.24.0
44.03.5
35.63.3
37.15.2
38.24.4
35.04.0
5 Gross reserves months of CA expenditures
AB 1.6
0.82.60.7
2.51.0
2.61.0
2.00.6
6 Broad money, % of GDP
AB
39.33.3
25.46.4
19.25.8
13.70.9
12.81.1
13.90.9
16.61.9
7 Lending rate %
AB
19149
65.25.3
36.64.2
39.63.9
Source: Author’s calculations based on official data, as reported in EBRD Transition Report 1999. The GDP weights calculated from Table 1, using the PPP GDP estimates.Notation: as in Table 2.
19
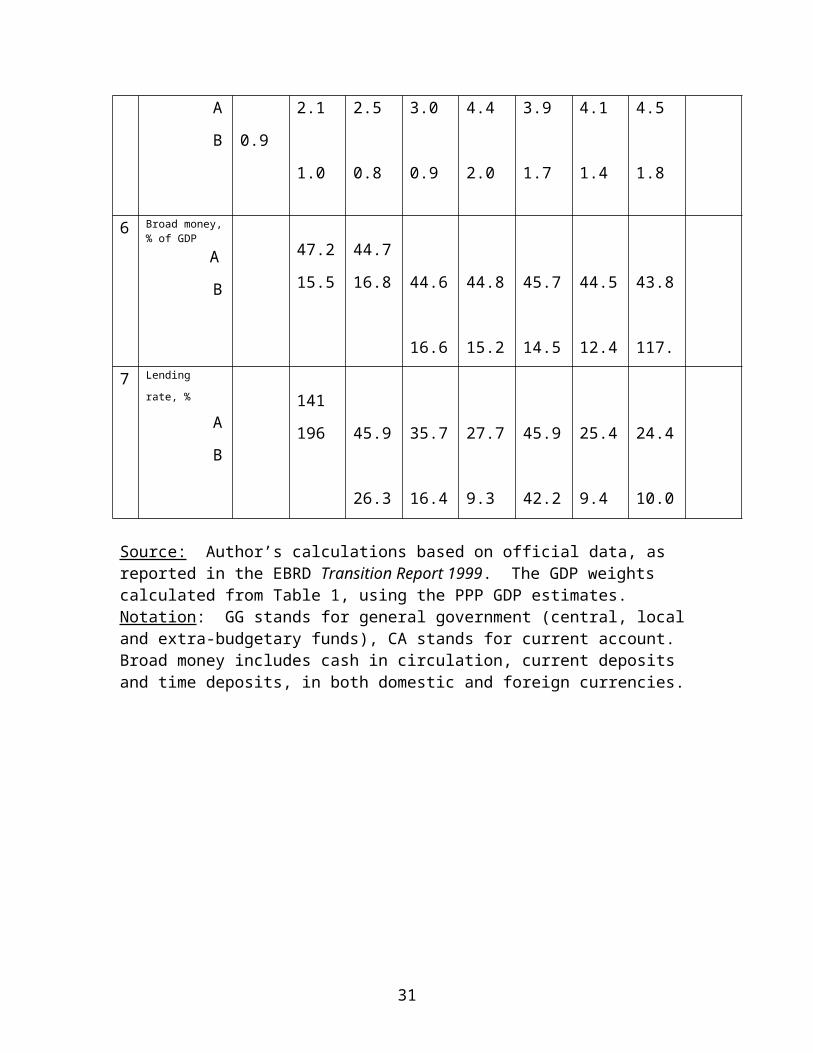
The differences between the two groups of countries can be noted. Compared to the CE
and Baltic countries, in the CIS countries both inflation and budget deficits have been
much higher, but public expenditures have declined more sharply. Gross reserves have
increased to adequate levels in the CE countries, but still remain very low in the CIS
region. The ratios of broad money to nominal GDP have been remarkably stable, at
moderately high levels, in the CE and Baltic countries, but declined sharply, as one would
except, during the high inflation period in the CIS region, where they now stand at very
low levels. Despite these significant differences, a considerable convergence has taken
place in macroeconomic conditions between and within the two groups, together with a
sharp improvement over time in both.
In terms of our eight macroeconomic criteria, the CE and Baltic countries are
close to meeting the criteria with respect to variables 2 to 7 in Table 2. The data on
public debt and taxes also indicate compliance with the criteria for these two additional
indicators. For the CIS region, the macroeconomic balance is still fragile, and the
macroeconomic environment, while no longer hostile to growth as it was in the early
1990s, needs to be significantly improved to become growth-friendly. The financial
crisis of August 1998 revealed the extent of Russia’s macroeconomic imbalance.
However, following this crisis, policy adjustments in Russia and elsewhere in the CIS
group have contained its destabilising effects, restored equilibrium and, consequently,
reduced further the performance gap between this group and the CE and Baltic countries.
2. What distinguishes the more successful from the less successful countries?
I propose to measure the success of reforms in the transition countries by their
ability to recreate the (institutional, legal and economic) conditions for rapid and
sustainable growth. This ability is indicated by the increase in output since the start of
recovery. It is this yardstick which differentiates strongly the Baltic countries from, for
example, Russia and Ukraine within the FSU, and much of Central Europe from much of
the FSU. It is natural to ask about the factors underlying these differences: are they initial
conditions, the state of institutions or the political environment?
20

The cumulative output changes between 1989 and 1998, and between the lowest
level and year 1998, are shown in Table 4, in which the countries are also graded
according to their commitment to liberalisation and stabilisation. Several countries
achieved significant recoveries in GDP growth, but some of these recoveries are not
reform-related. A near civil war led to a recession over-shooting in Albania, Armenia,
Azerbaijan and Georgia. Subsequent improvements in political stability would have
contributed much to the recovery of those countries’ economies. There are also two
countries, Bielarus and the Kyrgyz Republic, where substantial recoveries may have been
artificial, as they reflect in part the postponement of the needed structural changes.17
There is a substantial volume of empirical studies attempting to provide
explanations of the wide variation in the rate and length of recovery. These studies fall
into two broad groups, one based on macroeconomic data and the other on enterprise
data. The latest comprehensive study in the first group, using a general-to-specific
modelling approach, finds some evidence in support of “the pre-eminence of structural
reforms over both initial conditions and macroeconomic variables in explaining cross-
country differences in performance and the timing of the recovery”.18 In particular, more
liberalised economies grow faster. However, as the periods of recovery have been short
for most countries, econometric results are not yet stable. The wide differences in
performance within countries suggest that initial conditions might be more potent than
indicated by aggregate data.
17 According to the Bielarus Minister of Economy, economic growth “during the second half of the 1990s was substantially initiated by additional loading of old manufacturing facilities and was boosted…by emission credits [which] allowed Bielarus to preserve her manufacturing potentials and to solve some important social problems”, V. Shimov, Report presented at the UN/ECE Spring Seminar, May 2, 2000, Geneva.18 A. Berg, E. Borensztein, R. Sahay, and J. Zettelmyer, “The Evolution of Output in Transition Economies: Explaining the Differences”, WP, IMF, 1999.
21

Table 4GDP Growth and Reforms
CE and Baltics Growth % Reforms, indexNO. Country 1998 from
lowest level 1989-1998 Liberalisation Stabilisation
1 Albania 43.1 -14 3 5
2 Bulgaria 3.5 -34 3 5
3 Croatia 20.6 -22 3 5
4 Czech Republic 12.7 -5 5 5
5 Estonia 25.7 -24 5 5
6 FYR Macedonia 5.3 -28 3 3
7 Hungary 16.2 -5 5 5
8 Latvia 14.0 -41 3 5
9 Lithuania 19.8 -35 3 5
10 Poland 42.5 +17 5 5
11 Romania 1.8 -24 3 5
12 Slovak Republic 32.9 0 5 5
13 Slovenia 25.7 4 5 5
CIS
1 Armenia 31.8 -59 3 3
2 Azerbaijan 17.9 -56 1 3
3 Bielarus 22.6 -22 1 3
4 Georgia 29.2 -67 3 3
5 Kazakhstan 0.0 -39 3 3
6 Kyrgyz Republic 20.4 -40 3 5
7 Moldova 0.0 -68 3 5
8 Russia 0.0 -45 3 3
9 Tajikistan 5.8 -58 1 3
10 Turkmenistan 4.2 -56 1 3
11 Ukraine 0.0 -63 1 3
12 Uzbekistan 6.1 -10 1 3
Source: EBRD, Transition Report 1999. Early liberalisers are given grade 5. They are defined as countries that had achieved “complete price liberalisation, full current account convertability and almost complete small-scale privatisation”. Late liberalisers achieved these thresholds after 1993. They are given grade 3. The remaining countries are given grade 1. With respect to stabilisation, countries are divided into early stabilisers, those which stabilised before the end of 1993, and late stabilisers (all other countries). The grades given are, respectively, 5 and 3.
The periods of positive growth have been short for most countries, but especially
for the three main CIS countries - Russia, Ukraine and Kazakhstan, and for Bulgaria and
Romania in Central Europe. These five countries (together with Moldova) are clearly the
least successful of all the twenty-five transition countries in our table. Recovery in both
the Czech Republic (1997-1999) and Hungary (1995-1996) have suffered unexpectedly
from macroeconomic instabilities. The long pause in recovery in the Czech Republic has
prompted a reappraisal of the virtues of rapid voucher-type privatisation. It is this
negative experience of the Czech Republic and a much better growth performance of
Poland, Estonia and, recently, also Hungary which led to the new wisdom, namely that
the success of transition depends above all on a rapid creation of conditions –
institutional, legal, microeconomic and macroeconomic – which are conducive to the
development and growth of a new private sector (including FDI). From this current
perspective, it is clear that with the exception of some authors, notably Kornai19, the early
conventional view overestimated the positive impact on performance of a fast
privatization of SOEs and, by the same token, failed to appreciate strongly enough the
key role that a completely new private sector would play in the recovery and growth.
Given the central role of the new private sector in recovery and post-transition
growth, it is worth noting the presence of wide international differences in the
domestic/foreign composition of that sector, with Poland and Hungary being the extreme
cases and Estonia somewhere in between. In all these three countries, strong
liberalisation policies with respect to prices, trade and entry were adopted early, and in
conjunction with a policy of harder budget constraints and increased competition
pressures for SOEs. Poland was also helped by the presence of a sizeable private sector
outside agriculture at the beginning of transition.
19 J. Kornai, 1980, The Road to a Free Economy, Norton & Co. New York and London.

3. How far have weak or missing institutions hampered effectual policy-making?
In the first decade of the transformation, the institutional deficiency was severe,
and this added an additional dimension of difficulty to policy-making. Macroeconomic
management was particularly difficult in the new countries of the FSU, which initially
lacked their own currencies and central banks and where international reserves were
almost non-existent. With the exception of Hungary, the introduction of personal taxes
and the replacement of turnover taxes by a proper VAT could not take place at the start of
the transition. The capital market was initially almost non-existent and its development
has been slow. The result of these two types of deficiencies was that budget deficits were
larger and their financing was to a greater extent done by outright monetization than
would otherwise have been the case. Large or hyper inflations wiped out most bank
savings in all but few transition countries, thus limiting the role of the banking sector in
economic restructuring. Politically independent bank supervision did not exist under the
old system, and its necessarily gradual establishment during transition meant that in many
countries it was too weak to prevent bank failures. High inflation and poor banking
practice must have been major factors underlying low bank savings, the flight from
domestic money, and the use of parallel currencies (especially US dollars and German
marks).
Given these extreme initial circumstances, it is remarkable that it took the new
countries of the FSU only some 4-5 years for them to establish the basic institutional
framework needed to conduct a reasonable macroeconomic policy - by creating central
banks, new currencies, bank supervision, international payments systems, new taxes and
tax collection systems, stock exchanges, securities commissions, labour exchanges, and
new social benefits systems. The result has been a vast improvement in the
macroeconomic environment of those countries in the second half of the 1990s.
Nevertheless, the new central institutions still lack high quality personnel, and they have
yet to establish a tradition of trust and behaviour based on transparent and stable rules,
consistent with long-term public interest and market principles.
The ultimate success of transition will depend on the establishment of appropriate
market institutions supporting macroeconomic stability, entrepreneurship and
25

competition. Such institutional changes are inherently slow and depend on the political
commitment to reform of governments and parliaments, and on their practical
effectiveness in implementing reforms and policies. This commitment was clearly
stronger and its effectiveness probably greater in Central Europe and the Baltic countries
than in the Commonwealth of Independent States (CIS). This difference reflects not only
the longer and stricter socialist central planning in the CIS, but also a much stronger
influence of the European Union in Central Europe and the Baltic countries, including (in
contrast to the CIS) the embracement of the strategic aim of European Union
membership.
4. Have policy dilemmas been intensified by weak institutions?
In several instances, weak institutions led to a renewal of macroeconomic
instability or to a serious threat of such an instability. A clear case was Albania in 1996,
when rapid growth of a pyramid system led to a general crisis of confidence and almost
to civil war. Another, and more important, example was the case of Bulgaria in 1997,
when poor banking supervision led to a sharp growth of under-performing assets. This in
turn forced interest rates to such high levels that the cost of servicing Bulgaria’s public
debt became unsustainable. There were two policy options for Bulgaria (and the IMF).
One was to inflate away this debt by a non-equivalent currency change or by printing a
great deal of money, and then introduce a stabilisation programme. The other was,
effectively, to abolish the central bank and introduce in its place a currency board. Such
an institutional reform meant replacing domestic monetary control by nominal exchange
rate targeting and depriving the government of the monetization option for financing its
budget deficit. The currency board option was, in fact, adopted on the assumption that
the gain in credibility would be large enough to bring about sharp falls in both inflation
and interest rates. This assumption was later vindicated by actual developments.
Currency boards had been adopted earlier by the Baltic countries for similar reasons.
However, the most spectacular institutional failure was in Russia. There, poor co-
operation between the executive and the legislative branches of government, the
weakness of the tax administration and lax expenditure controls led to an excessive short
26
term foreign borrowing in 1997-1998, and resulted in a financial crisis in August 1998.
In Poland, during the early stage of transition the central bank operated a system of credit
limits for commercial banks. This practice was discontinued only with the development
of an inter-bank money market. The performance of transition economies and, indirectly,
the conduct of macroeconomic policies, were also influenced by weak corporate
governance and uncertainties with respect to enforcement of contracts, including those
concerning property rights. These factors have probably contributed to the phenomenon
of capital flight from Russia and may account for the limited foreign direct investment to
most countries of the CIS region. The recent prolonged depression in the Czech Republic
(1997-1999) is also difficult to explain without reference to the quality of the corporate
governance of the country’s enterprises, following its coupon privatisation programme.
Finally, banking supervision may have been inadequate to prevent the growth of under-
performing loans in many countries, including the Czech Republic and Romania. This in
its turn required repeated and expensive re-capitalisations of state-owned banks by
governments.
5. Has too much emphasis been placed on lowering inflation – orreducing it too rapidly – at the expense of economic growth?
As I discussed elsewhere, the first IMF-supported programmes for Poland and
Russia placed much emphasis on a swift disinflation.20 But these programmes tended
also to underestimate the severity of the supply-and-demand shocks associated with the
institutional crisis and price liberalisation, and did not sufficiently appreciate the fact that
such shocks would at the same time sharply reduce output and be highly inflationary. For
the years 1992-1998 and for all the 25 transition countries listed in Table 4, there are
fairly strong associations between output falls and inflation rates. These are as follows (t-
ratios in parantheses):
20 S. Gomulka, 1995, “The IMF-Supported Programs of Poland and Russia, 1990-1994: Principles, Errors and Results”, Journal of Competitive Economics, vol.20(3): 316-346.
27

(3.6) (-4.6) (-7.9) (2)
N = 175, R2 =0.61, i=1, 2…..,25
(5.3) (-2.2) (-9.2) (3)
N=200, R2 =0.53, i = 1, 2……25
In these two equations, gY,t is the percentage change of GDP in year t and πt is the
percentage inflation rate, divided by 100, in year t. N is the number of observations and i
the number of the country. For the purpose of estimation, both gYi and πi have been
weighted by the square root of the country’s i share in total GDP, expressed in terms of
PPP dollars.21 These estimates indicate that last-year inflation reduces current growth and
last-year fall of output increases current inflation. However, the tightest association is
between current output falls and current inflation. This evidence supports the view of the
transformational recession as being essentially of the stagflation type, whereby both
output falls and inflation have to some extent common causes.
The policy mix required to achieve dis-inflation under such circumstances is one
of a tight fiscal policy combined with an accommodating monetary policy. The dis-
inflation process may also have to be gradual to accommodate more easily large changes
in relative prices. In practice, dis-inflation was swift only in Croatia. In the Central
European and Baltic countries – with the exception of Romania in 1993 and 1997 and
Bulgaria in 1997, which experienced strong inflation reversals – the dis-inflation process
has been more or less gradual. However, most CIS countries failed to keep their budget
deficits under control and, consequently, experienced periods of very high inflation, even
hyper-inflation. As I already noted in Part A, in those countries the recession has been
prolonged and the recovery either has been modest or has not yet materialised. Thus, in
practice, the clear failure of macroeconomic policy was limited mainly to the CIS
21 For a linear system of the form: yj = ∑ aixij + ej, the standard OLS estimates of the parameters a1, a2…an minimise ∑ (yj - ∑ aixij)2. Weighted OLS estimates minimise ∑ wj(yj - ∑ aixij )2 or ∑(wj
½yj-∑ ai wj½xij)2,
where ∑wj=1. This is equivalent to estimating a system in which original variables are re-scaled by square roots of the respective weightings.
28
countries in the years 1992-1994 (In Tajikistan and Turkmenistan this continued also in
1995).
At the advanced stage of transition, the rate of dis-inflation is constrained by
international capital mobility, which limits the freedom of central banks to set and
maintain interest rates much above the world level. The attendant dilemmas are well-
known. If the exchange rate is fixed, a restrictive monetary policy induces capital
inflows, as borrowers substitute domestic debt by foreign debt and foreign investors buy
domestic assets. The sterilisation of such inflows is possible, but expensive and therefore
has its limits. If the exchange rate is floating, capital inflows induce an appreciation of
the domestic currency. This helps to reduce inflation in the short-term, but may also lead
to a large current account deficit and, therefore, increases the risk of sudden devaluation
and higher inflation in the medium-term. Borrowers in transition economies have little
experience in estimating the exchange rate risk. Misjudgements are especially likely
during expectations-forming, prolonged periods of real effective appreciation. The
appreciation trend is a feature of transition. This trend is sustained by several factors, the
two crucial ones being: depressed exchange rates at the starting point and rapid
improvements in productivity and rates of return during transition. Productivity
improvements are particularly rapid in countries whose reforms have been successful.
Such countries are also credible candidates for membership of the European Union and,
for that reason attract more FDI than others, giving the appreciation trend a further
support. Such circumstances call for an interest rate policy that is not very restrictive,
and place an even bigger burden on governments to conduct a restrictive fiscal policy.
However, if such a fiscal policy is not adopted, then any attempt to dis-inflate quickly
nevertheless, by means of highly restrictive monetary and exchange rate policies, may
easily backfire, as it would cause a large current account deficit which may at some point
trigger a crisis of confidence and result in stagflation. A short-term gain in the rate of
dis-inflation is then obtained at the cost of a higher risk of macroeconomic instability.
During the run-up period to EU membership, a short-term foreign debt tends to increase
rapidly. It is therefore a prudent precaution, during this period, to keep international
29

reserves high and increasing, even if this concern about stability causes a certain slowing
down of the rate of dis-inflation.22
6. What lessons can be drawn for those transition economies still struggling to achieve macroeconomic stability and economic growth?
The lessons which I propose to draw from these ten years of transition are as
follows:
(i) Most former SOEs, especially those of large size, have suffered from the British
Leyland/Rover syndrome: the accumulation of structural problems of such
magnitude that they are not amenable to significant ‘strategic’ restructuring and
growth whatever their new ownership and regulatory framework. Given the
financial, managerial and other constraints, and poor positive incentives, such
enterprises – unless taken over by large foreign investors - are capable mainly and
merely of ‘defensive’ restructuring.
(ii) The success of transition depends above all on the rapid creation of conditions –
institutional, legal, microeconomic and macroeconomic – which are conducive to
the development and growth of a new private sector, domestic and/or foreign.
(iii) This new sector development is facilitated by increased competition through
price liberalisation, by permitting SOEs to sell capital assets, by imposing hard
budget constraints on them, by encouraging FDI and by lowering the entry
barriers for new businesses. The number of these businesses should be, outside of
agriculture, about 0.5 million per 10 million of the population, and the small and
medium size enterprises should eventually account for some 50-60% of GDP.
(iv) The inflation rate need not, and initially should not, be very low, but it must
not be high (not more than 40% p.a.), and it should be seen to be converging to
the EU level.
(v) A dis-inflation policy should involve all the key macroeconomic components:
22 These issues are discussed comprehensively by several authors in the book edited by Z.Drabek and S. Griffith-Jones, Managing Capital Flows in Turbulent Times: The Experience of Europe’s Emerging Economies in Global Perspective. Armonk, NY: M.E.Sharpe, 1999.
fiscal, monetary, the exchange rate and (when applicable) wages and benefits.
Given the close link between budget deficits and money growth in transition
countries, a tight fiscal policy is necessary. But it may not be sufficient, and other
policies should be used in supporting roles.
The cost of dis-inflation is lower if the monetary authorities are politically
independent. Although an extreme solution, currency boards can be useful.
(vi) The choice of an exchange rate regime is not very important from the point
of view of an anti-inflation policy, but it helps to have, at some point,
a moderately or even fully flexible regime, in order to provide the private sector
with better information about the exchange rate risk and so establish a better
defence against speculative capital inflows and an excessive growth of private
foreign debt.
(vii) The essential institutional basis for a stable macroeconomic environment
includes, apart from an independent central bank, a solid regulatory
framework for financial institutions: banks, insurance and pension funds,
and stock exchanges.
(viii) To attract foreign direct investment and eliminate capital flight, external
credibility is vital. In order to build up this credibility, the exchange rate should
be competitive most of the time to ensure that international reserves are high in
relation to imports and foreign debt, especially short-term debt.
(ix) The fiscal policy, in order to be consistent with the stability objective, should aim
to meet the Maastricht criteria with respect to the general government budget
deficit and public debt. However, if the policy is also to serve developmental
objectives, it should additionally aim to keep taxes (and therefore public
expenditures) low in relation to GDP and, within public expenditures, should
favour spending on education and infrastructure at the expense of social transfers,
defence and subsidies.
(x) The high rate of structural unemployment requires changes in the labour
code to increase flexibility of labour markets, e.g. by reducing hiring and firing
costs. It also requires an active role of governments in education and training.
These ten lessons overlap with the following conclusions reached by Charles Wyplosz in
his own recent survey: it has paid to start early and move fast; macro-stabilisation is a
pre-requisite for growth; the exchange rate regime is largely irrelevant for dis-inflation;
and microeconomic foundations/structural reforms are important for both stability and
growth.23 But the matters which I am emphasising additionally, are the links between
policies and growth of the new private sector, and the importance of the exchange rate
policy for competitiveness, credibility and stability.
Recent comparative empirical studies of enterprise performance, in CIS countries
on the one hand and in the more successful countries on the other, attempt to identify the
key underlying factors. According to S. Johnson, J. McMillan and C. Woodruff,
macroeconomic stability is not sufficient for private sector growth, and an essential
institutional feature for entrepreneurship to develop is the presence of a legal system
sufficiently strong to secure property rights.24 Such a feature is, however, probably only
one of several necessary conditions. After all, the legal system is the same throughout
Hungary or Poland, but private sector development is still weak in the countryside and
small towns, and heavily concentrated in the capitals and major cities where the supply of
labour skills and infrastructure facilities is high and where there are more individuals with
entrepreneurship abilities.
7. What are the long-term growth prospects for transition economies?
In most of these countries, the institutional reforms of the1990s have created a
microeconomic and institutional environment conducive to the effective use of their
entrepreneurship capital. In such countries, the magnitude of international technology
transfer can be assumed to be related positively to both capital accumulation and the
development gap. This transfer may also be expected to be greater in countries which
succeeded in creating and maintaining a stable macroeconomic environment.
23 C. Wyplosz, “The Ten Years of Transformation: Macroeconomic Lessons”, March 2000, CEPR, DP. No.2254.24 S. Johnson, J. McMilan and C. Woodruff, “Entrepreneurs and the ordering of institutional reform: Poland, Slovakia, Romania, Russia and Ukraine compared”, Economics of Transition, vol.8(1)2000,1.36).

Elsewhere I have reported the results of an empirical test of such propositions,
using the post-WW2 data for 20 countries in Western Europe, Latin America and the
Pacific rim.24 These regression results are as follows:
gY= -2.22+0.195(I/Y)+5.63 log10(yUSA/y)-5.92 log10(1+gp) (4)
(-3.6) (7.9) (14.5) (-6.8)
where t-ratios are indicated in parantheses, and where R2=0.80. In this relationship, the
time unit is a 10-year period, and gY is the percentage growth rate of GDP, I/Y is the
gross investment/GDP ratio, y is the per-capita GDP at purchasing power parities, and gp
is the percentage rate of inflation (of the GDP deflator) divided by 100, all variables
being 10-year averages.
In the regression equation, log(1+gp) equals approximately gp (expressed as a
fraction of 100), so (4) tells us that an increase in the trend rate of inflation by a
percentage point reduces the trend growth rate of GDP by 0.06%. The inflation rate is
strongly correlated with the inflation variance, so the latter may also serve as an
instrumental variable for instability factors.
For those transition economies which are EU candidates, the ratio yUSA/y equals
about 4, and log 4=0.6. Thus, according to this Gomulka-Dumas equation, the catching-
up factor contributes now about 3.3 percentage points to their growth of GDP. For a EU
candidate country with the I/Y ratio in the range of 20 to 25% and the inflation rate 10 to
15%, our growth equation predicts a GDP growth rate in the range from 4% (for I/Y
equal to 20% and gp=15%) to 5.4% (for I/Y equal to 25% and gp =10%). A further
increase of the I/Y ratio by 5 percentage points, to 30%, would raise the growth rate to
6.4% and a reduction of the inflation rate by 7 percentage points, to 3%, would raise it
further to 6.8%. However, after a decade of growth at between 5 to 7%, the ratio yUSA/y
would decline from the present level of 4 to about 3, reducing the contribution of the
catching-up factor by 0.6 percentage points, and reducing the growth rate from 6.8% to
6.2%, by the year 2010.
24 S. Gomulka, 1999, “Growth Convergence: A Comment on Warner”, London School of Economics, mimeo, forthcoming in a book edited by L.Orlowski and to be published by Elgar.
This exercise is not intended to provide precise estimates of the growth rate for
specific time periods and specific countries. The purpose is rather to estimate the
potential trend growth rate which reflects broad and long-term experience of a group of
countries thought to be representative of medium-developed and market-based
economies.

Table 5GDP growth and GDP per capita ratio (USA GDP per capita = 1)
for selected countries (1998 is the initial year, t denotes years from 1998, s is the investment/GDP ratio in percents)
s=20 s=30
t 0 10 20 30 40 50 0 10 20 30 40 50Russia
gY 4.66 4.09 3.65 3.29 3.02 6.24 5.34 4.63 4.07 3.63yt/(1.02)t 0.22 0.29 0.36 0.43 0.50 0.55 0.22 0.34 0.49 0.65 0.81 0.96
PolandgY 4.33 3.83 3.44 3.13 2.89 5.91 5.08 4.42 3.91 3.50
yt/(1.02)t 0.26 0.33 0.40 0.47 0.53 0.58 0.26 0.39 0.54 0.70 0.86 1.01Ukraine
gY 6.03 5.17 4.50 3.97 3.55 7.61 6.43 5.49 4.75 4.16yt/(1.02)t 0.11 0.17 0.23 0.31 0.38 0.45 0.11 0.20 0.31 0.46 0.62 0.78
Czech RepublicgY 3.37 3.07 2.84 2.66 2.52 4.94 4.32 3.82 3.43 3.13
yt/(1.02)t 0.41 0.48 0.54 0.59 0.64 0.68 0.41 0.57 0.73 0.89 1.04 1.18Hungary
gY 3.77 3.39 3.09 2.86 2.67 5.34 4.63 4.07 3.63 3.28yt/(1.02)t 0.34 0.41 0.48 0.54 0.59 0.64 0.34 0.49 0.65 0.81 0.96 1.11
Source: Author’s estimates on the basis of equation (4), and under the assumption that the USA GDP per capita will be increasing at a constant rate of 2% per annum.

The estimates reported in Table 5 should be interpreted in this spirit, as an
indication of what growth is possible for the countries listed, within the next 50 years,
given the declining role of the ‘advantages of backwardness’ factor. Policy options are
represented by two savings ratios.
The important role of capital accumulation in this growth projection is
indicated by an implicit assumption that international technology transfer is proportional
to investment. This assumption may be realistic when the technological gap is large, in
the first 20-30 years of the projection. In the closing years of the period, declining
returns to capital must set in, so the projection in Table 5 is then less realistic.
After the first decade of transition, domestic savings tend to be low in most
transition countries. This is so, essentially, for two reasons: inherited policies of large
social transfers and the negative effect on incomes of the transformational recession.
Following the first wave of reforms (liberalisation, stabilization and privatisation), the
transition countries turn to implementing reforms and policies intended specifically to
promote savings. These include pension reforms, whereby state pensions are sharply
reduced and private pension schemes established, and tax reforms intended to lower
sharply both subsidies and direct taxes of individuals and companies.
The European Union candidates can also attract foreign direct investments in a
volume that is significant in relation to GDP. The macroeconomic risks to investors
could be reduced further, and substantially, once the new EU members become a part of
Euroland. When this happens, and only then, domestic savings could no longer be a
constraint on investment, and hence would no longer be a constraint on growth.
Public investments have a significant contribution to make in promoting growth in
all those areas in which positive externalities are present. These areas include, typically,
physical infrastructure, research and education. Public spending in these areas has been
radically curtained during the first decade of the transition. A reduction of social
transfers is also needed for the purpose of reversing this past trend.
8. Concluding remarksIn all the transition countries covered by this paper, the liberalisation and
stabilisation measures of the 1990s have been fundamental in helping to foster a rapid

expansion of the new private sector, a contraction and restructuring of the state sector,
and a profound re-orientation and rapid growth of international trade. In most of these
countries, the GDP per capita was about 15% to 30% of the level in the USA at the
beginning of the 20th century, and is at about the same percentage level at the end of this
century. The economic transformation of the last decade has contributed significantly to
meeting the strategic aim of creating an economic system that will enable these countries
to make substantial progress in removing this income gap in the 21st century.
Dramatic macroeconomic imbalances and extraordinarily large structural
distortions have been the key problems that the twenty-five post-socialist countries of
Central Europe and the FSU inherited and had to face and solve, during the first decade
of their transition. The reform packages which most Central European and Baltic
countries have adopted, broadly corresponded to the severity of the macroeconomic crisis
and the magnitude of these inherited structural problems. They aimed at regaining
macroeconomic stability quickly, rapidly liberalising prices, trade and entry, and
establishing an infrastructure of institutions and laws capable of servicing a well-
functioning, competitive market economy. The reform strategy adopted by most of the
CIS countries embraced considerable, but less extensive PTE liberalisations, and placed
rapid privatisation before macroeconomic stabilisation. In those countries structural
distortions were initially larger, private sectors smaller, and earlier market reforms more
limited. These more hostile initial conditions had a major impact on reforms, policies and
progress of transition. However, the differences in reform strategies between the two
groups of countries and within each group have narrowed down considerably in the
second half of the 1990s.
Acknowledgement
The author wishes to acknowledge the debt to the organisers of the UN’s ECE Seminar,
especially to Paul Rayment, for proposing the theme and the main questions of this paper.
The final version benefited from the discussion at the seminar’s meeting. I am
particularly grateful to the three official discussants, George Kopits, Silvana Malle and
Joze Mencinger, and to Vincent Koen for their stimulating comments.
37