macroeconomic factors and stock market movement: evidence
TRANSCRIPT
Munich Personal RePEc Archive
Macroeconomic Factors and Stock
Market Movement: Evidence from
Ghana
Adam, Anokye M. and Tweneboah, George
October 2008
Online at https://mpra.ub.uni-muenchen.de/14079/
MPRA Paper No. 14079, posted 15 Mar 2009 03:10 UTC

Macroeconomic Factors and Stock Market Movement: Evidence from Ghana
Anokye M. Adam
School of Management, University of Leicester, UK
E-mail: [email protected] or [email protected]
and
George Tweneboah
School of Management, University of Leicester, UK
E-mail: [email protected] or [email protected]
Abstract
This study examines the effects of macroeconomic variables on the movement stock
prices in Ghana. We analyze both long-run and short-run dynamic relationships between
the stock market index and macroeconomic variables including inward foreign direct
investments, Treasury bill rate, consumer price index, and exchange rate from 1991:1 to
2006:4 using Johansen's multivariate cointegration test and innovation accounting
techniques. We established that there is cointegration between macroeconomic variables
and stock prices in Ghana indicating long-run relationship. Further tests indicate that, in
the short-run, inflation and exchange rates matter for share price movements in Ghana,
however, interest rate and inflation prove very significant in the long-run.
Keywords: Cointegration, Foreign Direct Investment, Innovation Accounting
JEL Classification: C22, E44, G10

2
1. Introduction
The relationship between macroeconomic factors and stock market development has
dominated in the academic and practitioners’ literature over the past decades. Some
fundamental macroeconomic variables such as exchange rate, interest rate, industrial
production and inflation have been argued to be the determinants of stock prices. It is
believed that government financial policies and macroeconomic events have large
influence on general economic activities including the stock market. This has motivated
many researchers to investigate the dynamic relationship between stock returns and
macroeconomic variables. For example, using the Arbitrage Pricing Theory (APT)
developed by Ross (1976), Chen et al. (1986) used some macroeconomic variables to
explain stock returns in the US stock markets. They show that industrial production,
changes in risk premiums, and changes in the term structure are positively related to the
expected stock returns, while both the anticipated and unanticipated inflation rates
negatively relate to the expected stock returns. Other researchers who studied the
relationship between stock returns and macroeconomic variables in developed countries
such as Japan, US, Australia, Canada and European countries (see, inter alia, Cheung and
Ng, 1998; McMillan and Humpe, 1997; Mukherjee and Naka, 1995; Kwon and Shin,
1999; and Maysami and Koh, 2000) employ cointegration.
In spite of the increasing migration of capital from developed to emerging
economies and its associated high returns (see Ushad et al, 2008; Osinubi, 2004),
emerging stock markets have not been well explored. In 2006 for example, foreign equity
accounted for 75.3% of the equity finance recorded in Ghana compared to 29.9% in 2001
according to the December, 2007 Quarterly Report of the Ghana Investment Promotion
3
Centre (GIPC).
Over the past years, macroeconomic activity in Ghana has seen a tremendous
improvement as the Bank of Ghana continues its mandate of maintaining price stability, a
strong and stable exchange rate, a low inflation rate, and low interest rates. The interest
rates dropped from 40.95% by the end of 2001 to 9.95% in 2006, the cedi/dollar
depreciation decreased from 104.4% in 1999 to 2.0% in 2006 as well as inflation rate
from 59.56% in 1995 to 32.91% in 2001 and then to 10.96% in 2006.
In spite of the increase in overall government fiscal deficit from 8.0% of the GDP
in 2002 to 12.4% of GDP in 2006, real GDP growth increased from 5.9% in 2005 to 6.2%
in 2006. At the same time, the net foreign direct investment increased from 1.6% of GDP
in 2001 to 3.37% of GDP in 2006. Comparatively, this performance was only surpassed
by the 4.28% record in 1994 when Ashanti Goldfield Company Limited (AGC) now
AngloGold Ashanti (AGA) was listed on GSE. The AGC effect saw the market
capitalization accounting for 34.37% of GDP in 1994 as compared to 1.98% in 1993.
The growing interest in the performance of emerging markets has been attributed
to the conduct of sound macroeconomic policies, privatisation, stock market reform and
financial liberalization in recent years.
The objective of the present study is to contribute to the existing literature by
examining the effects of macroeconomic variables on the movement of Ghana stock
market proxy by Databank Stock Index (DSI). Our results indicate that stock prices in
Ghana is consistently influenced by changes in macroeconomic variables consistent
with the findings of studies in developed and emerging markets like the US, Japan, UK,
Malaysia, New Zealand and Korea.

4
The next section is a review of the relevant literature on the relationship between
macroeconmic variables and stock market movement. Section 4 presents a brief history
of the Ghana Stock Exchange (GSE). In Section 5 we describe the data and the
cointegration methodology employed in the study. Section 6 covers the empirical results
and the last section concludes.
2. Stock Returns and Macroeconomic Variables: Literature Review
Probably the relationship between stock prices and macroeconomic variables is well
illustrated by the Dividend Discount Model (DDM) proposed by Miller and Modigliani
(1961) than any other theoretical stock valuation model. According to the model the
current price of an equity share equals the present value of all future cash flows to the
share. Thus, the determinants of share prices are the required rate of return and expected
cash flows (see Oyama, 1997; Gan et al 2006; Humpe and Mcmillan, 2007; Leibowitz,
Sorensen, Arnott and Hansen, 1989; and Tessaromatis, 2003) suggesting that economic
factors that influence the expected future cash flow and required rate of return affect the
share price. Fama and Gibbon (1982) find that expected real returns on bills and expected
inflation rates are inversely related. This is due to the positive correlation between
expected real returns on financial assets and real activity.
Using the multi-factor APT framework, Hamao (1988) shows that inflation
significantly influenced Japanese stock returns. An investigation of the relationships
between stock prices and real activity, inflation, and money conducted by Fama in 1981
shows a strong positive correlation between common stock returns and real variables.
Kaneko and Lee (1995) and Lee (1992) find similar results. By examining the
5
relationship between inflation and stock prices in 16 industrialized countries, Rapach
(2002) agues that increase in inflation does not result in persistent depreciation of share
real value.
The exchange rate which indicates the movement of currency affects stock prices
in a way similar to the inflation variable. Depreciation of the local currency makes import
expensive compared to export, leading to increased production cost of import companies.
Since all the cost cannot be passed on to the consumer due to the competitiveness of the
market, corporate earnings, which are a determinant of stock prices according to the
DDM, fall. Although Solnik (1987) proved that exchange rate is a non-significant factor
in explaining development of stock prices, Jorion (1990) finds some relationship between
stock returns of US multinational companies and the effective US dollar exchange rate
for the period 1971-87. Aggarwal (1981) also finds a positive relationship between
revaluation of the US dollar and stock prices. Mukherjee and Naka (1995) also find that
exchange rate positively relates to stock prices in Japan and Indonesia. On the contrary,
Soenen and Hennigar (1988) reported that US dollar effective exchange rate negatively
affect US stock market index during 1980-86.
Adler and Dumas (1984) argue that even firms whose entire operations are
domestic may be affected by exchange rates, if their input and output prices are
influenced by currency movements. Other studies have argued that depreciation of the
local currency increases export, and hence stock prices. Lueherman (1991) finds that
although exchange rate movements affect stock prices depreciation of the local currency
does not constitute competitive advantage for home companies as argued.
According to the DDM, required rate of return and the share price are inversely
6
related. Gan et al (2006) ague that opportunity costs of holding cash rises with increase
in interest rate, and the trade-off to holding other interest bearing securities would lead to
a decrease in share price. Theoretically, French et al. (1987) find negative relationship
between stock returns and both the long term and short term interest rates. Furthermore,
positive correlation among previous month’s US stock price, money supply, federal debt,
tax-exempt government debt, long-term unemployment, the broad money supply and the
federal were documented by Bulmash and Trivoli (1991). On the other hand, the same
study established a negative relationship between stock prices and the Treasury bill rate.
As claimed by Alagidede (2008), the risk perceptions remains an obstacle to
increased access to capital markets in Africa, and have set apart stock markets from other
regions due to their small size and highly illiquid nature. These negative effects that
marred emerging stock market are likely to reduce if open to foreign investors. For
example, large investment inflows to South East Europe (SEE) supported the economic
growth rates and pushed up stock prices at the major equity markets in the region (SEE
Investment Guide, 2006). Oyama (1997) pointed out that the risk premium for Venezuela
stock market, Jordan and Pakistan declined sharply between 1990 and 1992 following
liberalization of stock investment by foreigners in 1990, and increase of the amount of
home currency and foreign exchange that could be taken abroad by residents and non-
residents.
3. Ghana Stock Exchange
The idea of establishing a stock exchange in Ghana, which led to the promulgation of the
Stock Market Act of 1971 to lay the foundation for the establishment of the Accra Stock
7
Market Limited (ASML) in the same year, dates back to 1968. Unfavourable
macroeconomic environment, political instability and lack of government support
undermined the take off of the market.
Under the surveillance of the International Monetary Fund and the World Bank,
Ghana underwent structural reforms in 1983 to deal with distortions in the economy
together with other financial reforms. This led to the deregulation of interest rates,
removal of credit controls, floating of exchange rates and many others. After the financial
liberalization and the divestiture of a host of state-owned enterprise the need for stock
market in Ghana became unavoidable.
The Ghana Stock Exchange was incorporated in July 1989 as a private company
under the Ghana companies’ code 1963 (Act 179). The exchange was given recognition
as an authorized stock exchange under the Stock Exchange Act of 1971. Trading on the
floor of the exchange commenced on November 12, 1990. In spite of the early set backs,
two stock brokerage firms-the National Trust Holding Company Ltd (NTHC) and
National Stockbrokers Ltd now Merban Stockbrokers-did over-the-counter (OTC) trading
in shares of some foreign-owned companies prior to the establishment in 1990. However,
the status of the company was changed to a public company under the Company’s Code
in April 1994. With regards to the number of listed companies, it increased to 13 in 1991,
19 in 1995 and currently stands at 34 (GSE, June 2007). The increase in the number of
listings has also reflected on market capitalization. The GSE capital appreciated by 116%
in 1993 and gained 124.3% in its index level in 1994 (GSE, March 1995). As a result, the
Ghana stock market was voted the sixth market in 1993 as well as the best performing
emerging market in 1994. Surprisingly, however, the market performed disappointingly
8
between 1995 and 2000 when interest rate and inflation were both soaring. This
abysmally performance was partly attributed to the high inflation and interest rates at that
time. At the end of 2004, market capitalization stood at US$2,644 million while annual
turnover ratio just remained at about 3.2% in 2004, from an all-time high of 6.5% in
1998. As of October 2006 the market capitalization of the GSE stood at about US$11,500
million.
Currently, the main indices are the GSE All-Share Index and the Databank Stock
Index (DSI). Three new indices comprising the SAS Index (SAS-I), SAS Manufacturing
Index (SAS-MI) and the SAS Financial Index (SAS-FI) have also been published by the
Strategic African Securities Limited. Daily trading of the exchange take place on the floor
of the exchange, except Ashanti Gold shares which can be traded both through the GSE
and over-the-counter after GSE trading hours. Those traded over-the-counter are
subsequently reported at the next trading session.
4.0 Data and Methodology
4.1 Data Selection Justification and Hypothesis
In this section we justify the selection of the variables used for the analysis in this study.
Databank Stock Index: This variable which serves as the dependent variable in our
analysis captures the performance of the market and it is the dependent variable in our
regression analysis. It is the first ever index computed by Databank Group. Its selection is
motivated by data availability.
Inflation: High rates of inflation increase the cost of living and a shift of resources from
investments to consumption. This leads to a fall in the demand for market instruments

9
and subsequently leads to a reduction in the volume of stock traded. Also the monetary
policy responds to the increase in the rate of inflation with economic tightening policies,
which in turn increases the nominal risk-free rate and hence raises the discount rate in the
valuation model. DeFina (1991) argues that nominal contracts that disallow the
immediate adjustment of the firm’s revenues and costs prevent cash flow to grow at the
same rate as inflation. We therefore expect negative relationship between inflation and
stock market.
Exchange rate: Ghana’s import sector dominates the export sector; therefore
depreciation of the Ghana cedi will lead to an increase in prices of production and
thereby reducing cash flows to the import dominated companies. Repatriation of earning
will also be relatively unattractive to foreign portfolio investors who play a major role on
the GSE. We hypothesize negative impact on the performance of DSI.
Interest rate: The relationship between interest rates and stock prices is well established.
An increase in interest rate will increase the opportunity cost of holding money and
investors substitute holding interest bearing securities for share hence falling stock prices.
The Treasury bill rate is used as a measure of interest rate in this study because investing
in Treasury bill is seen as opportunity cost for holding shares. High-treasury bill rates
encourage investors to purchase more government instruments. Treasury bills thus tend to
compete with stocks and bonds for the resources of investors. The expected relationship
between stock prices and Treasury bill rates is thus negative.
Net Foreign Direct Investment: Foreign capital inflows can make significant
contributions to the host country's economic growth and development by lessening and
cushioning shocks resulting from low domestic saving and investment. Increase in net
10
FDI therefore has positive effect on the liquidity and size of the GSE. Foreign equity
finance account for over 70% of total equity investments in 2006. It is believed that the
increase in market capitalization of GSE from 1.98% of GDP in 1993 to 34.37% of GDP
in 1994 followed the exchange to foreigners and non-resident Ghanaian in 1993. Over the
same period, an increase in net FDI from 2.10% of GDP to 4.28% of GDP was recorded.
We therefore hypothesize a positive relationship between Net FDI and the exchange.
As mentioned earlier, when AGC was first listed on GSE in 1994 it accounted for about
90% of the total market capitalization. This changed the face of the exchange and
attracted many foreign investors; therefore it is reasonable to discuss its expected
influence on fundamental market attributes such as liquidity, volatility and turnover.
Following this, we include a dummy to account for the structural effect of the listing, and
assign 0 and 1 respectively to the period before and after the listing of AGC on the
exchange.
4.2 Data Sources
We make use of quarterly data for DSI, CPI, EX, TB and FDI from 1991:1 to 2006:4 for
the study. The data on DSI were obtained from Databank Group Research. All the other
data except Inward FDI were extracted from the June 2008 edition of the International
Monetary Fund’s International Financial Statistics database. The Inward FDI data were
extracted from the United Nations Conference on Trade and Development (UNCTAD).
The FDI data were obtained in annual form and interpolated by the method proposed by
Goldstein and Khan (1976) to quarterly. A brief description of the variables is presented
in Table 1 below.

11
Table 1: Description and source of data
Variable Concept
Description
Units Source
LDSI Log of Databank Stock Index
Databank Stock Index 30 Nov. 1990= 79.83 Databank Group Research and Information Limited
LFDI Log of net Foreign Direct Investment Inflow
Volume of foreign capital invested in the economy
Millions of US Dollar UNCTAD Database
LXR Log of exchange rate (as a measure of macroeconomic stability)
Principal rate (National Currency per USD)
Index number IFS Database
LCPI Log of consumer price index (as a measure of inflation)
Consumer Price Index Percentage per annum (200=100)
IFS Database
LTB Log of Interest rate (as a measure of interest rates)
91-day Treasury bill rate
Percentage per annum IFS Database
4.3 Methodology
The principal method employed to analyse the time series behaviour of the data involves
cointegration and the estimation of a Vector Error Correction Model (VECM).
Specifically, we employ the Johansen maximum likelihood procedure. This technique has
been well popularized for testing the long-run relationships among variables so we briefly
explain the methodological aspects directly relevant to this study and refer interested
readers to the relevant literature1 for detailed discussion and advantages of this method.
In estimating the cointegration we first consider whether each of the series is integrated
of the same order. To do this we consider the standard Augmented Dickey-Fuller test and
Phillips-Perrons unit root tests. The number of cointegration ranks (r) is tested with the
maximum eigenvalue and trace test. The maximum eigenvalue statistics test the null
1 See, for example, Johansen (1991, 1995), Johansen and Juselius (1990) and Cheung and Ng (1998).

12
hypothesis that there are r cointegrating vectors against the alternative of r+1
cointegrating vectors. The trace statistics tests the null hypothesis of no cointegrating
vector against the alternative of at least one cointegrating vector. The asymptotic critical
values are given in Johansen (1991) and MacKinnon-Haug-Michelis (1999).
From the above theoretical, intuitive, and empirical discussion, we postulate the
relationship between stock prices and selected macroeconomic variables as described
above as follows:
tttttt LFDILTBLXRLCPILDSI 43210 (1)
0 is a constant, 1 ,..................................................... , 4 are the sensitivity of each of
the macroeconomic variables to stock prices and t is a stationary error correction term.
5.0 Empirical Analysis
5.1 Descriptive Statistics
Table 2 presents a summary of descriptive statistics of the variable. Sample mean,
standard deviation, skewness and kurtosis, and the Jacque-Bera statistic and p-value have
been reported. The high standard deviation of LDSI with respect to the mean is an
indication of high volatility in the stock market. From the p-values, the null hypothesis
that LCPI, LTB, LXR and LFDI are normally distributed at 10% level of significance can
not be rejected.

13
Figure 1: Logarithms of Variables
-2
0
2
4
6
8
10
1992 1994 1996 1998 2000 2002 2004 2006
LDSI LFDI LTBLXR LCPI
Table 2: Summary Statistics of variables
LDSI LFDI LCPI LXR LTB
Mean 2.898272 7.431932 1.828133 -1.316873 1.492419 Std. Dev. 0.613817 0.374028 0.453579 1.116258 0.203617
Skewness 0.011984 -1.147513 -0.302435 -0.351034 0.960284 Kurtosis 2.154169 4.691274 1.778526 1.750799 4.855756
Jarque-Bera 1.909346 21.67348 4.954311 5.475736 19.01977 Probability 0.384938 0.000020 0.083982 0.064708 0.000074
Sum 185.4894 475.6437 117.0005 -84.27985 95.51480
Sum Sq. Dev. 23.73658 8.813512 12.96126 78.49999 2.611972
5.2 Unit Root Test
Table 3 shows unit root test to determine the order of integration and stationarity of the
variables. Augmented Dickey-Fuller (ADF) and Phillips-Perron tests were used. Both
results indicate that all the data are non-stationary at levels but first differences are

14
stationary at 5% significant level. Consistent with Figure 1, we conclude that all the
variables are I (1).
Table 3: ADF and PP Unit Root Test
Variables ADF Unit Root Test PP Unit Root Test
Levels First Difference Levels First Difference
LDSI -1.124073 -4.604914** -0.755972 -4.604914** LXR -1.941035 -3.618842** -1.867166 -3.713154**
LFDI -2.548019 -4.099517** -1.988769 -4.259959**
LCPI -1.877965 -2.981643** -1.835472 -3.277407**
LTB -1.943722 -7.682588** -2.220418 -7.682616**
5.3 Cointegration Test and Vector Error Correction Model
The next step involves estimating the model and determining the rank, r to find the
number of cointegrating relations in our model. The optimal lag length was determined
by both Schwarz (SIC) and Akaike Information Criterion (AIC) using 5 maximum lags in
the general VAR model. The aim is to choose the number of parameters, which minimizes
the value of the information criteria. The SIC has the tendency to underestimate the lag
order, while adding more lags increases the penalty for the loss of degrees of freedom. To
make sure that there is no remaining autocorrelation in the VAR model, AIC is selected as
the leading indicator. The model lag length reported in Table 4 indicates appropriate lag
length of 4 for SIC.
We proceed to test for the presence of long-run relationship among the variables
by using Johansen's Maximum Likelihood approach. An intercept and no trend are
specified for the cointegration test. The trace statistic suggests four cointegrating vectors,
and the maximum eigenvalue statistic indicates one cointegrating vector at the 5%
significance level. Given evidence in favour of at least one cointegration relation, a test of

15
zero coefficients on each factor in the cointegrating vector is conducted to determine
whether the coefficients for all factors in the cointegrating VAR model are significantly
different from zero. The likelihood ratio test rejects the null hypothesis of a zero
restriction for all the five macroeconomic factors at the 95% level, except for AG ( 2 (1)
= 3.443, with probability value 0.064). This suggests that AG may not be forcing the
system in the long-run at 95% level but there may be still be significant in the short run
dynamics. Further tests to confirm the weak exogeneity of AG gives ( 2 (1) =0.0549,
with probability value 0.8147) at the 95% level, indicating that AG is weakly exogenous
(i.e. not error correcting).
With the AG included as an exogenous variable, both trace test and the maximum
eigenvalue test suggests two cointegrating vectors at the 5% significance level (see Table
4). This indicates co-movement between stock market index and macroeconomic
variables in a long-run equilibrium path. The cointegration graph (see Figure 2 below)
confirms that there are more than “one” mean reversion effect in the cointegration vector
over the period and signifies a good error correction behaviour in the cointegration
system. Consequently, the estimated long-run relationship via cointegration analysis and
the error correction coefficients are appropriate. The long-run cointegrating relation
between the macroeconomic factors and stock prices normalised on LDSI is given by:
tY
000.1
tLDSI
4031.0tLFDI
7472.0
tLTB
6873.0
tLXR
9038.1tLCPI
8675.2
C
(2)
This can be re-parameterized as:

16
8675.29038.16873.07472.04031.0 ttttt LCPILXRLTBLFDILDSI (3)
[-7.60271] [8.06367] [5.01753] [-11.3490]
Table 4: Multivariate Johansen Cointegration Test Lag r 0 r 1 r 2 r 3 r 4
trace 4 99.68**[69.81] 59.50**[47.85] 23.14[29.79] 10.33[15.49] 3.32 [3.84]
max 4 40.17** [33.87] 36.36**[27.58] 12.80[21.13] 7.01 [14.26] 3.32 [3.84]
Note: The null hypothesis for these two tests here is that the data generating processes under consideration are not cointegrated. Critical values in [] for both trace and maximum-eigenvalue statistics at the 5% level are given by MacKinnon-Haugh-Michelis(1999). ** denotes the rejection of the hypothesis at the 1% level
Figure 2: A Plot of Cointegration Vector normalised on LDSI
-.4
-.3
-.2
-.1
.0
.1
.2
.3
.4
1992 1994 1996 1998 2000 2002 2004 2006
Cointegrating relation 1
The coefficients of LTB, LXR and LFDI are correctly sign. Contrary to our expectation,
LCPI has positive signs. The negative relationship between LTB and LDSI is expected
because Treasury bill acts as the rate of return offered by the risk-free asset. The shifting
of funds between risky equity and risk-free assets by portfolio managers is thus expected

17
in such a situation. When T-bill rate is high, rational investors would tend to invest in less
risky assets with high returns. This was the case in Ghana between 1995 and 1999 which
affected the performance of the exchange.
With regards to the positive relationship between LFDI and LDSI, we argue that
the opening of the market to non-resident Ghanaians and foreigners in June 1993 was a
big boost to the development of the market. The exchange control permission given to
investors to invest through the exchange without prior approval attracted a number of
top-rated foreign institutional buyers.
The positive relation between LCPI and LDSI though not expected may be in
support of the Fisher (1930) hypothesis which implies a positive one-to -one relationship
between stock returns and inflation. It also implies that investors are compensated for
inflationary increase in prices.
The negative relationship between LDSI and LXR suggests that depreciation of
the Ghana Cedi (GHS) makes shares unattractive for investors to invest in the Ghana
stock market. Also the long-run negative relationship is that the cost of imported goods
becomes expensive to producers. As an import dominated economy the depreciation of
the GHS may be regarded as a curse to the economy. The Ashanti Goldfield Company
dummy (Ag) used in our study has negative and significant impact on stock price in
Ghana.
Given the evidence in favour of at least one cointegrating vector, we proceed to
estimate the VECM to examine the short-run causal linkages between the variables. The
result of the VECM estimation is reported in Table 5.
18
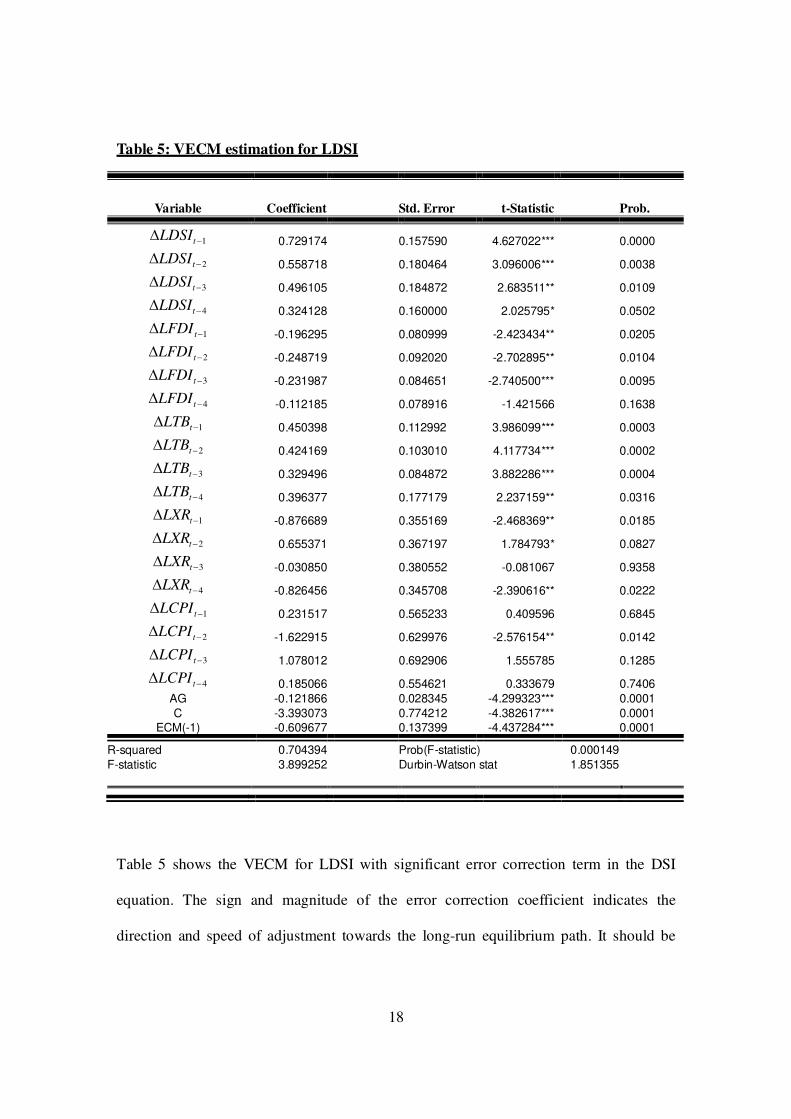
Table 5: VECM estimation for LDSI
Variable Coefficient
Std. Error t-Statistic
Prob.
1 tLDSI 0.729174 0.157590 4.627022***
0.0000
2 tLDSI 0.558718 0.180464 3.096006***
0.0038
3 tLDSI 0.496105 0.184872 2.683511**
0.0109
4 tLDSI 0.324128 0.160000 2.025795*
0.0502
1 tLFDI -0.196295 0.080999 -2.423434**
0.0205
2 tLFDI -0.248719 0.092020 -2.702895**
0.0104
3 tLFDI -0.231987 0.084651 -2.740500***
0.0095
4 tLFDI -0.112185 0.078916 -1.421566
0.1638
1 tLTB 0.450398 0.112992 3.986099***
0.0003
2 tLTB 0.424169 0.103010 4.117734***
0.0002
3 tLTB 0.329496 0.084872 3.882286***
0.0004
4 tLTB 0.396377 0.177179 2.237159**
0.0316
1 tLXR -0.876689 0.355169 -2.468369**
0.0185
2 tLXR 0.655371 0.367197 1.784793*
0.0827
3 tLXR -0.030850 0.380552 -0.081067
0.9358
4 tLXR -0.826456 0.345708 -2.390616**
0.0222
1 tLCPI 0.231517 0.565233 0.409596
0.6845
2 tLCPI -1.622915 0.629976 -2.576154**
0.0142
3 tLCPI 1.078012 0.692906 1.555785
0.1285
4 tLCPI 0.185066 0.554621 0.333679
0.7406
AG -0.121866 0.028345 -4.299323*** 0.0001
C -3.393073 0.774212 -4.382617*** 0.0001
ECM(-1) -0.609677 0.137399 -4.437284*** 0.0001
R-squared 0.704394 Prob(F-statistic) 0.000149
F-statistic 3.899252 Durbin-Watson stat 1.851355
Table 5 shows the VECM for LDSI with significant error correction term in the DSI
equation. The sign and magnitude of the error correction coefficient indicates the
direction and speed of adjustment towards the long-run equilibrium path. It should be

19
negative and significant, which is the case here. The negative sign implies that, in the
absence of variation in the independent variables, the model’s deviation from the long-
run relation is corrected by increase in the dependant variable. Bannerjee et al. (1998)
holds that a highly significant error correction term is further proof of the existence of a
stable long-term relationship. The estimated coefficient of the ECM (–1) is -0.609 [p-
value=0.000] suggesting that-in the absence of changes in other variables-deviation of the
model from the long-term path is balanced by 60.9 per cent increase in DSI per quarter.
This means that deviation from the long run relationship takes less than two quarters to
be corrected. The results also show that all the variables significantly explain the
variation in the performance of the DSI.
The listing of the AGC on the market has been thought to have caused major
transformation of the exchange but our result is contrary to that. The AGC dummy (AG)
has negative impact on the performance of DSI. It is an indication of negative effect of
AGC high concentration on the market; rendering the market inactive and for that matter
illiquid. Lack of liquidity on the exchange would affect ability of the listed firms on the
market in raising the needed long-term capital to finance investment and production
The key regression statistics show that 2R is high implying that overall goodness
of fit of the VEC model is satisfactory. The diagnostic test statistics reported in Table 6
indicates that the model passes serial correlation, functional form misspecification, non-
normal errors and heteroscedasticity test at the 5%. The cumulative sum (CUSUM) and
cumulative sum of squares (CUSUMQ) plots (see Fig. 3) from a recursive estimation of
the model also indicate stability in the coefficients over the sample period.

20
Table 6: VECM Model Diagnostic Tests
Serial Correlation F(2, 34)=0.391996[0.6782] Functional Form F(2, 34)=2.5492[0.0930]
Heteroskedasticity F(22, 36)=0.51219[0.7571] Normality 2 (2)=0.245425[0.884518]
Figure 3: Plots of CUSUM and CUSUM of Squares of Recursive Residuals
-20
-15
-10
-5
0
5
10
15
20
96 97 98 99 00 01 02 03 04 05 06
CUSUM 5% Significance
-0.4
-0.2
0.0
0.2
0.4
0.6
0.8
1.0
1.2
1.4
96 97 98 99 00 01 02 03 04 05 06
CUSUM of Squares 5% Significance
5.4 Innovation Accounting
The cointegration analysis only captures the long-run relationship among the variables.
Since it does not provide information on responses of variables to shocks or innovations
in other variables, we employ the Impulse Response Function and Forecast Error
Variance Decomposition based on the VECM to examine how DSI responds to shocks in
the other variables. Figure 4 shows the impulse response functions while the variance
decomposition at the 5% significance level is presented in Table 7.
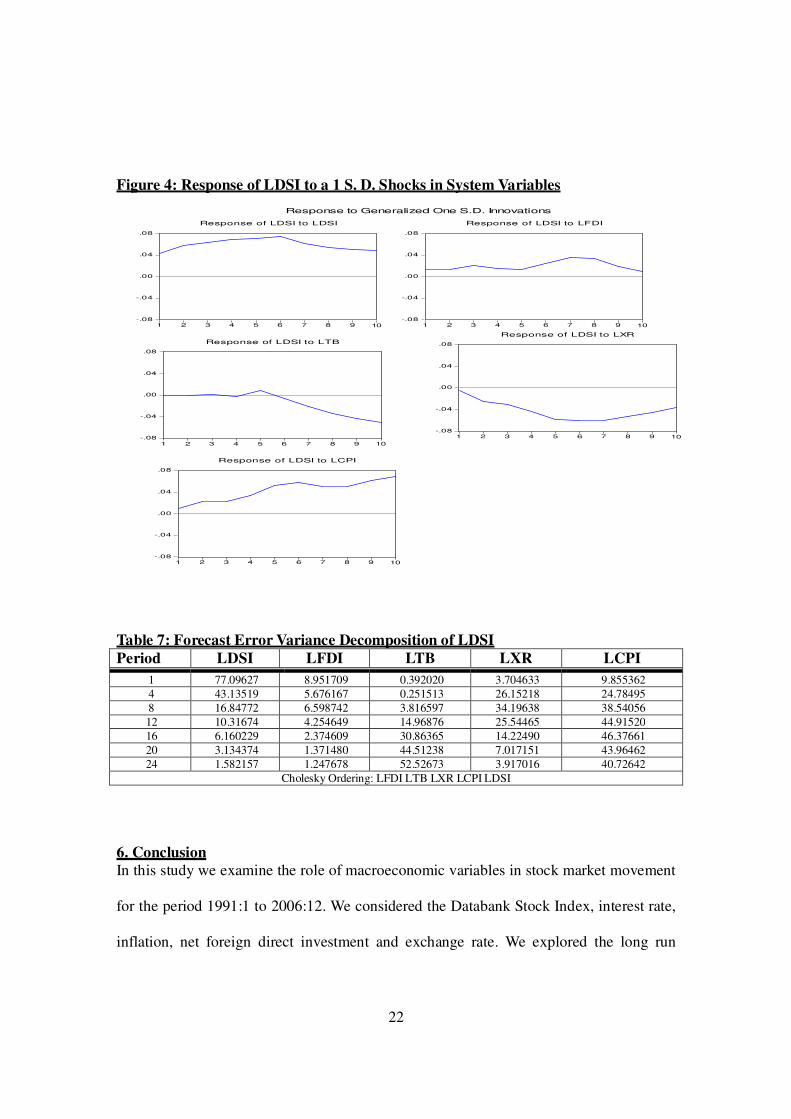
We observe an immediate response of LDSI to innovations in LCPI. The rise in
LDSI implies that the market efficiently allocates resources by adjusting to general
increase in prices in the long run. The response of LDSI to LXR and LTB are in line with
other research findings for both advanced and emerging markets. A shock in LTB leads to
a sharp reduction in LDSI after 5 quarters. This explains the strong inverse relation

21
between the T-bill and stock market investment in Ghana.
Figure 4 also indicates that LDSI instantly rises after a shock in LFDI, peaks after
seven quarters and begins to decline. This supports the claim by Oyama (1997) that
increase in foreign investors increase the liquidity of the stock market and reduce the risk
premium.
We observe from the variance decomposition in Table 7 that the variations in
LDSI are mainly due to its own variations at the end of the first quarter while LFDI and
LCPI account for 8.95% and 9.85% respectively. After 4 quarters LXR and LCPI become
dominant factors through to 8 quarters explaining a total of 50% in the fourth quarter and
about 72% of LDSI variation in 8 quarters. The variation in LDSI is significantly
explained by LTB after 12 quarters by accounting for 14%. However, the fraction
accounted for by LFDI dropped to less than 5% after 12 quarters. The LCPI and LTB
prove to be the most significant factors for stock price movement respectively accounting
for 40.7% and 52.5% at the end of 24 quarters. This means that the Ghana equity market
responds well to shocks in real economic activities.
22
Figure 4: Response of LDSI to a 1 S. D. Shocks in System Variables
-.08
-.04
.00
.04
.08
1 2 3 4 5 6 7 8 9 10
Response of LDSI to LDSI
-.08
-.04
.00
.04
.08
1 2 3 4 5 6 7 8 9 10
Response of LDSI to LFDI
-.08
-.04
.00
.04
.08
1 2 3 4 5 6 7 8 9 10
Response of LDSI to LTB
-.08
-.04
.00
.04
.08
1 2 3 4 5 6 7 8 9 10
Response of LDSI to LXR
-.08
-.04
.00
.04
.08
1 2 3 4 5 6 7 8 9 10
Response of LDSI to LCPI
Response to Generalized One S.D. Innovations
Table 7: Forecast Error Variance Decomposition of LDSI
Period LDSI LFDI LTB LXR LCPI
1 77.09627 8.951709 0.392020 3.704633 9.855362
4 43.13519 5.676167 0.251513 26.15218 24.78495
8 16.84772 6.598742 3.816597 34.19638 38.54056
12 10.31674 4.254649 14.96876 25.54465 44.91520
16 6.160229 2.374609 30.86365 14.22490 46.37661
20 3.134374 1.371480 44.51238 7.017151 43.96462
24 1.582157 1.247678 52.52673 3.917016 40.72642
Cholesky Ordering: LFDI LTB LXR LCPI LDSI
6. Conclusion
In this study we examine the role of macroeconomic variables in stock market movement
for the period 1991:1 to 2006:12. We considered the Databank Stock Index, interest rate,
inflation, net foreign direct investment and exchange rate. We explored the long run
23
relationship between the variables using Johansen's multivariate cointegration tests.
Short-run dynamics were traced by means of impulse response function and forecast error
variance decomposition analysis. The cointegration analysis provides evidence in support
of a long-run relationship between variables over the time horizon. Contrary to our
hypothesis, we find inflation to positively relate to DSI, which implies that- consistent
with the finding of Firth (1979), Anari and Kolari (2001), Luintel and Paudyal (2006),
and Gultekin (1983)-the stock market partly or fully provides a hedge against inflation.
The FEVD indicates that interest rate and exchange rates explain small proportion of the
variation of the share prices in the first quarter compared to inflation rate and net FDI
inflow. This means that the elimination of the 10% limit placed on non-resident foreign
investors’ holdings in securities listed on GSE and 74% limit on holdings of all non-
resident foreign investors in any listed security under the Foreign Exchange Act of 2006
(Act 723) is a positive signal to boost investments in the stock market.
Based on the results, we recommend that potential investors pay more attention to
inflation and exchange rate dynamics followed by net FDI inflow rather than interest rate.
However, in the long run attention should be on interest rate and inflation rates.
References 1. Adler, M., & Dumas B. (1984). Exposure to currency risk: Definition and measurement. Financial Management, 13 (Summer), 41-50. 2. Aggarwal, R. (1981). “Exchange rates and stock prices: A study of the US capital markets under floating exchange rates”. Akron Business and Economic Review 12: 7-12. 3. Alagidede, P. (2008) How integrated are African Financial Markets with the rest of the World? EEFS Conference Paper. 4. Anari, A. and Kolari, J., (2001). “Stock prices and inflation”, Journal of Financial
Research 24, 587–602.

24
5. Bulmash, S. and Trivoli, G. (1991), “Time-lagged interactions between stock prices and selected economic variables”, Journal of Portfolio Management, Vol. 17 No. 4, pp. 61-7. Chen, N.F., R. Roll and S.A. Ross, (1986), “Economic Forces and the Stock Market”, Journal of Business 59, 383-403. 6. Cheung, Y. and Ng, L., (1998), “International evidence on the stock market and aggregate economic activity”, Journal of Empirical Finance, 5, 281-296. 7. DeFina, R.H., (1991), “Does Inflation Depress the Stock Market?”, Business Review, Federal Reserve Bank of Philadelphia, 3-12. 8. Fama, E.F., (1981), “Stock Returns, Real Activity, Inflation and Money”, American
Economic Review 71, 545-565 9. Fama, E.F. and Gibbons, M. (1982), “Inflation, Real Returns and Capital Investment” Journal of Monetary Economics, 1982, Vol. 9, No. 3, pp. 545-565. 10. Firth, M. ,(1979), “The Relationship between Stocks Market Returns and of Inflation”, Journal of Finance 34 (June 1979). 11. Fisher, I., (1930). The Theory of Interest, Macmillan, New York. 12. French, K. R., Schwert, G. W. and Stambaugh, R. E. (1987)), “Expected Stock Return and Volatility”, Journal of Financial Economics, 19, 3-29 13. Gan, C., Lee, M., Young, H.W.A. and Zhang, J., (2006), “Macroeconomic Variables and Stock Market Interaction:New Zealand Evidence”, Investment Management and
Financial Innovations, Volume 3, Issue 4 14. Geske, R. and Roll, R., (1983). “The fiscal and monetary linkage between stock returns and inflation”, Journal of Finance 38, 1-33. 15. Ghana Investment Promotion Centre Quarterly Report, December 2007. 16. Ghana Stock Exchange Quarterly Report, June 2007. 17. Goldstein, M., and Khan, M.S., (1976). “Large Versus Small Price Changes and the Demand for Imports.” IMF Staff Papers 23, 200-225. 18. Granger, C.W.J., (1986), “Developments in the Study of Cointegrated Economic Variables”, Oxford Bulletin of Economics and Statistics 48, 213-27. 19. Granger, C., (1987), “Co-Integration and Error Correction: Representation, Estimation, and Testing”, Econometrica, 55, 251-276
25
20. Gultekin, N. B. (1983), “Stock market returns and inflation: evidence from other countries”, Journal of Finance 38, 49-65. 21. Gunasekarage, A. and Power, D.M., (2001), “The Profitability of Moving Average TradingRules in South Asian Stock Markets”, Emerging Markets Review, 2: 17–33. 22. Hamao, Y. (1988), “An empirical investigation of the arbitrage pricing theory”, Japan
and the World economy, 1, 45-61. 23. Ho, Y., 1983, Money Supply and Equity Prices: An Empirical Note on Far Eastern Countries, Economic Letters 11, 161 – 165. 24. Humpe, A., and Macmillan, P.,(2007), “Can Macroeconomic Variables Explain Long Term Stock Market Movements? A Comparison of the US and Japan”, CDMA Working
Paper No. 07/20 25. Hussain. F., and Mahmood.T., (2001), “The stock Market and the Economy of Pakistan”,.The Pakistan development Review 40:2. 107-114 26. International Financial Statistics, September 2008 issue. 27. Johansen, S., (1991), “Estimation and Hypothesis Testing of Cointegrating Vectors in Gaussian Vector Autoregressive Models”, Econometrica 59, 1551-1580. 28. Johansen, S., (1995), Likelihood based Inference in Cointegrated Vector Auto-
Regressive Models,Oxford University Press. 29. Johansen, S. and Juselius, K. ,(1990), “Maximum Likelihood Estimation and Inference on Cointegration with Application to the Demand for Money”, Oxford Bulletin
of Economics and Statistics 52, 169-210. 30. Jorion, P. (1990). “The Exchange rate exposure of U.S. multinational”. Journal of
Business, Vol. 63 No: 3, 331-345 31. Kaneko, T., & Lee, B. S. (1995). “Relative importance of economic factors in the U.S. and Japanese stock markets”. Journal of the Japanese and International Economies
9, 290–307. 32. Kwon , C.S. and Shin, T.S. “ Cointegration and Causality between Macroeconomic Variables And Stock Market Returns” Global Finance Journal, 1999 Vol. 10, No. 1, pp. 71-81. 33. Lee, B.S, (1992), “Causal Relationships Among Stock Returns, Interest Rates, Real Activity, and Inflation”, Journal of Finance, 47, 1591-1603.
26
34. Luehrman, T. A.,(1991), “Exchange rate changes and the distribution of industry value”. Journal of International Business Studies, 22, 619-649. 35. Luintel, K.B., and Paudyal, K (2006). “Are Common Stocks A Hedge against Inflation?” Journal of Financial Research XXIX, (1), 1–19. 36. MacKinnon, J. G., Haug, A. A. and Michelis, L. (1999), “Numerical Distribution Functions of Likelihood Ratio Tests for Cointegration,” Journal of Applied
Econometrics, 14, 563-577 37. Maysami, R. C. and Koh, T. S., (2000), “A Vector Error Correction Model of the Singapore Stock Market, International Review of Economics and Finance 9, 79 – 96. 38. Osinubi, T. S. (2004) “Does Stock Market Promote Economic Growth in Nigeria?” The ICFAI Journal of Applied Finance, IJAF Volume 10, Number 3, pp 17-35, 39. Oyama, Tsuyoshi (1997), “Determinants of Stock Prices: The Case of Zimbabwe 1997”, IMF Working Paper No. 97/117
40. Rapach, D. E. (2002). “The long-run relationship between inflation and real stock prices.” Journal of Macroeconomics, 24, 331–351
41. Soenen L.A. and Hennigar E.S. (1988). “An Analysis of Exchange Rates and Stock Prices: The US Experience between 1980 and 1986”Akron Business and Economic Review 19: 71-76
42. Solnik, B. (1987) “Using Financial Prices to Test Exchange Rate Models” Journal of
Finance 42, 141–149. 43. South East Europe Investment Guide, 2006 issue. 44. Ushad, S. A.; Fowdar, S.; Sannassee, R. V. and Jowaheer, M., (2008) “Return Distributions: Evidence from Emerging African Stock Exchanges” The Icfai University
Journal of Financial Economics, Vol. VI, No. 3, pp. 41-52.