macroeconomic cost-benefit analysis for renewable …gizenergy.org.vn/media/app/media/giz_report_cba...
TRANSCRIPT

Macroeconomic Cost-Benefit Analysis for Renewable Energy Integration
08 Fall
2
Imprint
Published by the
Deutsche Gesellschaft für
Internationale Zusammenarbeit (GIZ) GmbH
Registered offices
Bonn and Eschborn, Germany
Energy Support Programme Unit 042A, 4th Floor, Coco Building,
14 Thuy Khue, Tay Ho District
Hanoi, Vietnam
T + 84 4 39 41 26 05
F + 84 4 39 41 26 06
[email protected]/viet-nam
As at
November 2017
Text
Aisma Vītiņa (Ea Energy Analyses)
Silvia Huber (DHI GRAS)
GIZ is responsible for the content of this publication.
On behalf of the
German Federal Ministry for Economic Cooperation and
Development (BMZ)Alternatively: German Federal Foreign Office

3
Foreword
This is the Final Report relating to the project ‘Macroeconomic Cost-Benefit Analysis for Renewable
Energy Integration’. The project is being carried out by Ea Energy Analyses in collaboration with DHI
GRAS and the Institute of Energy (Viện Năng lượng) within the framework of the Danish-Vietnamese
cooperation between the Danish Energy Agency and the Ministry of Industry and Trade of Vietnam.
The funding of the project is provided by GIZ.
This project is a supporting activity for the currently on-going initiative of the Danish-Vietnamese
cooperation programme, the Model-Based Power Sector Scenarios for Vietnam.
4
Table of Contents Foreword ..................................................................................................................................................................................................................................... 3
Table of Contents ...................................................................................................................................................................................................................... 4
List of table.................................................................................................................................................................................................................................. 6
List of figures .............................................................................................................................................................................................................................. 8
Abbreviations ......................................................................................................................................................................................................................... 11
Disclaimer ................................................................................................................................................................................................................................ 12
Executive Summary .............................................................................................................................................................................................................. 13
Introduction ............................................................................................................................................................................................................................ 23
1. Study methodology........................................................................................................................................................................................................... 25
1.1 GIS analysis framework .....................................................................................................................................................................................................................25
1.2 Screening criteria .................................................................................................................................................................................................................................26
1.3 Other assumptions ...............................................................................................................................................................................................................................28
1.4 Economic analysis ................................................................................................................................................................................................................................29
2. GIS analysis data sources ............................................................................................................................................................................................... 31
2.1 Data sources used in national and detailed provincial analysis ......................................................................................................................................31
2.2 Data sources only used in the national analysis .....................................................................................................................................................................35
2.3 Data sources used in the detailed provincial analysis .........................................................................................................................................................37
3. LCOE analysis data sources and inputs ..................................................................................................................................................................... 40
3.1 Wind power project costs and characteristics ........................................................................................................................................................................40
3.2 Infrastructure costs .............................................................................................................................................................................................................................41
3.2.1 Allocation of infrastructure costs in the LCOE calculation ................................................................................................................................................... 43
3.3 Annual Energy Production estimation ........................................................................................................................................................................................43
4. Limitations .......................................................................................................................................................................................................................... 48
4.1 Wind energy resources ......................................................................................................................................................................................................................48
5. Results ................................................................................................................................................................................................................................... 51
5.1 National wind resource mapping ..................................................................................................................................................................................................51
5.1.1 National exclusion criteria.................................................................................................................................................................................................................. 51
5.1.2 National wind resource potential scenarios ............................................................................................................................................................................... 56
5.2 Provincial wind resource mapping ..............................................................................................................................................................................................62
5.2.1 Provincial exclusion criteria .............................................................................................................................................................................................................. 63
5.3 LCOE perspective .................................................................................................................................................................................................................................65
5.3.1 Cluster analysis – national level ....................................................................................................................................................................................................... 66
5.3.2 Cluster analysis – provincial level ................................................................................................................................................................................................... 72
5.3.3 Cluster analysis – overall comparison ........................................................................................................................................................................................... 76

5
5.4 Solar PV and biomass .........................................................................................................................................................................................................................78
5.4.1 Solar PV resource potential ................................................................................................................................................................................................................ 78
5.4.2 Biomass resource potential ................................................................................................................................................................................................................ 80
6. Discussion and conclusion ............................................................................................................................................................................................ 85
7. Recommendations for future analyses ..................................................................................................................................................................... 92
8. References ........................................................................................................................................................................................................................... 93
Appendix I ................................................................................................................................................................................................................................ 95
Data requirements for power system modelling using the Balmorel model ....................................................................................................................95
Appendix II ............................................................................................................................................................................................................................... 96
Infrastructure cost variation depending on project size and infrastructure proximity...............................................................................................96
Appendix III ............................................................................................................................................................................................................................. 98
Technical potential land area per national cluster across wind speed ranges.................................................................................................................98
Technical potential capacity per national cluster across wind speed ranges ................................................................................................................ 100
Appendix IV ........................................................................................................................................................................................................................... 102
Technical potential land area per provincial cluster across wind speed ranges .......................................................................................................... 102
Technical potential capacity per provincial cluster across wind speed ranges ............................................................................................................ 103
Appendix V ............................................................................................................................................................................................................................. 104
LCOE Base Case calculation for the national cluster ................................................................................................................................................................. 104
LCOE Low case calculation for the national clusters ................................................................................................................................................................ 106
Appendix VI ........................................................................................................................................................................................................................... 108
LCOE Base Case calculation for the provincial clusters ........................................................................................................................................................... 108
LCOE Low case calculation for the provincial clusters ............................................................................................................................................................ 110
Appendix VII .......................................................................................................................................................................................................................... 112
Provincial technical potential land area across wind speed ranges .................................................................................................................................. 112
Provincial technical potential capacity across wind speed ranges..................................................................................................................................... 112
Appendix VIII ........................................................................................................................................................................................................................ 114
Biomass resource technical potential per region in 2014, 2020 and 2030 .................................................................................................................... 114
Appendix IX ........................................................................................................................................................................................................................... 118
Wind power annual production potential estimates ................................................................................................................................................................ 118
Appendix X ............................................................................................................................................................................................................................. 121
NTP and the projections of PDP 7 revised ..................................................................................................................................................................................... 121

6
List of table Table 1: National Technical Potential (NTP) across regions and wind speed ranges (expressed in km2 and MW) ............................................................................................................................................................................................. 14
Table 2: National technical potential scenarios across regions (expressed in km2 and MW, wind speeds from 4,5m/s) .................................................................................................................................................................................... 15
Table 3: Provincial technical potential wind power capacity across wind speed ranges expressed in MW ........................................................................................................................................................................................................ 16
Table 4: Wind power resource technical potential estimation exclusion criteria ............................................. 27
Table 5. Typical key values for footprints for wind and solar projects (‘greenfield’ site). In the last column, standard values of 3000 and 1500 full-load hours are assumed for wind and solar. .................... 29
Table 6. CCI Land Cover Classes used in the national analysis and aggregations .............................................. 35
Table 7: Overview of key wind power project cost and characteristic parameters used in the cluster LCOE analysis ................................................................................................................................................................................... 40
Table 8: Assumptions used in the estimation of WACC for the LCOE Base Case. Data source: GIZ. .......... 41
Table 9: Infrastructure cost components used in the analysis. Data provided by GIZ .................................... 41
Table 10: Infrastructure element and cost range assumptions used based on project size ranges .......... 42
Table 11: Infrastructure cost variation (as an on-cost to plant CapEx) depending on project size and infrastructure proximity ............................................................................................................................................................. 42
Table 12: Average FLHs estimates per annual average wind speed ranges used in the analysis, representative of a cluster of 200 W/m2 wind turbines with hub height of 100 metres .............................. 46
Table 13. Suitable land area and impact of each exclusion criterion....................................................................... 56
Table 14: National land-based wind power potential scenarios analysed ........................................................... 57
Table 15: National technical potential scenarios across regions and wind speed ranges (expressed in km2 and MW) ................................................................................................................................................................................... 59
Table 16: Estimated annual wind power production potential in TWh (for a ‘normal’ wind year) based on the national technical potential scenarios. Production estimates based on 200 W/m2 wind turbine technology with 100m hub height (please see section Annual Energy Production estimation) at 0.1m/s mean annual wind speed steps ................................................................................................................................................ 61
Table 17. Suitable land area and impact of each exclusion criterion for the provincial analysis. .............. 64
Table 18: Technical potential for land-based wind power per province (expressed in land area in km2 and wind power capacity in MW) ........................................................................................................................................... 64
Table 19: Overview of the clusters selected and their total area in km2 and capacity (MW) ....................... 67
Table 20: Overview of infrastructure proximity (220 kV grid and road) to the centroid of each cluster. * Distance calculated based on the centroid of core cluster with highest wind speeds. ................................... 70
Table 21: Overview of the clusters selected: their total area in km2, capacity (MW), and infrastructure proximity (220 kV / 110 kV grid and road) to the centroid of each cluster. * Distance calculated based on the centroid of core cluster with highest wind speeds. ** Distance to 110kV grid point used (due to the size of the project suitable for the connection) ......................................................................................................... 74
Table 22: National solar PV resource potential (theoretical and technical) in Vietnam. Source: Institute of Energy. ........................................................................................................................................................................................... 78
Table 23: Area exclusion criteria applied in the solar PV national resource mapping analysis. Source: Institute of Energy ......................................................................................................................................................................... 78
7
Table 24: National technical potential for biomass in Vietnam in MW capacity for 2020 and 2030 (GIZ, 2017) .................................................................................................................................................................................................... 81
Table 25: Indicative biomass power plant investment cost estimated for Vietnam. Data source: (GIZ, 2017) .................................................................................................................................................................................................... 83
Table 26: Overview of infrastructure cost variation depending on project size and infrastructure proximity ............................................................................................................................................................................................ 96
Table 27: Technical potential wind power land area per national cluster across wind speed ranges expressed in km2 ............................................................................................................................................................................ 98
Table 28: Technical potential wind power capacity per national cluster across wind speed ranges expressed in MW ......................................................................................................................................................................... 100
Table 29: Technical potential wind power land area per national cluster across wind speed ranges expressed in km2 ......................................................................................................................................................................... 102
Table 30: Technical potential wind power capacity per national cluster across wind speed ranges expressed in MW ......................................................................................................................................................................... 103
Table 31: LCOE Base Case calculation for the national clusters (USD cents / kWh). Plant CapEx = 1870 USD/kW; WAC C= 10.8%; O&M costs = 50 USD/kW/year; Plant lifetime = 20 years. * Based on centroid of core cluster with high wind speeds. .............................................................................................................................. 104
Table 32: LCOE Base Case calculation for the national clusters (USD cents / kWh). Plant CapEx = 1500 USD/kW; WACC = 7%; O&M costs = 45 USD/kW/year; Plant lifetime = 22 years. * Based on centroid of core cluster with high wind speeds..................................................................................................................................... 106
Table 33: LCOE Base Case calculation for the provincial clusters (USD cents / kWh). Plant CapEx = 1870 USD/kW; WACC= 10.8%; O&M costs = 50 USD/kW/year; Plant lifetime = 20 years. * Based on centroid of core cluster with high wind speeds. ** Distance to 110kV grid point used (due to the size of the project suitable for the connection) ............................................................................................................................ 108
Table 34: LCOE Base Case calculation for the provincial clusters (USD cents / kWh). Plant CapEx = 1500 USD/kW; WACC = 7%; O&M costs = 45 USD/kW/year; Plant lifetime = 22 years. * Based on centroid of core cluster with high wind speeds. ** Distance to 110kV grid point used (due to the size of the project suitable for the connection) ............................................................................................................................ 110
Table 35: Provincial technical potential land area across wind speed ranges expressed in km2 ............ 112
Table 36: Provincial technical potential wind power capacity across wind speed ranges expressed in MW ..................................................................................................................................................................................................... 112
Table 37: Biomass resource technical potential per region in 2014. Unit: millions of tons. Source: (GIZ, 2017) ................................................................................................................................................................................................. 114
Table 38: Biomass resource technical potential per region in 2020. Unit: millions of tons. Source: (GIZ, 2017) ................................................................................................................................................................................................. 116
Table 39: Biomass resource technical potential per region in 2030. Unit: millions of tons. Source: (GIZ, 2017) ................................................................................................................................................................................................. 117
Table 40: Estimated annual wind power production potential (for a ‘normal’ wind year) based on the national technical potential scenarios. Production estimates based on 200 W/m2 wind turbine technology with 100m hub height (please see section Annual Energy Production estimation) at 0.1m/s mean annual wind speed steps ............................................................................................................................................. 118
Table 41: Projections of PDP 7 revised for 2020, 2025 and 2030 vis-à-vis the NTP estimates for wind, solar PV biomass in MW, estimated total possible power generation based on NTP in TWh, and the respective shares of national power production. * Share calculation based on projected national power demand for 2020 of PDP 7 revised ...................................................................................................................................... 121
8
List of figures Figure 1. Suitable areas of National Technical Potential (NTP) overlaid with average wind speed (left) and provincial technical potential (right). .......................................................................................................................... 13
Figure 2: National (left) and provincial (center and right) clusters explored in the LCOE analysis ......... 18
Figure 3: LCOE overview per provincial cluster (LCOE Base Case and LCOE Low) across average annual wind speed ranges. Selection of representative clusters (close and large distance to infrastructure) ... 19
Figure 4: Compounded average LCOE (capacity-weighted across wind class ranges) per cluster in $ct/kWh. ............................................................................................................................................................................................. 20
Figure 5: National Technical Potential (NTP) power generation estimates for wind, solar PV and biomass compared to the national power demand projections in PDP 7 revised for 2020 and 2030, respectively. (Please see Appendix X for full comparison.) Unit: power generation / demand in TWh. 21
Figure 6. Levels of resource potential. Illustration source: (NREL, 2012) ............................................................ 25
Figure 7. Illustration of the analysis steps in the current study ................................................................................ 26
Figure 8. The Global Wind Atlas wind map by DTU for Viet Nam ............................................................................. 31
Figure 9. NASA SRTM topology data. ..................................................................................................................................... 32
Figure 10. Population density from Asia Pop. .................................................................................................................... 33
Figure 11. Protected areas for Viet Nam extracted from the World Database on Protected Areas (WDPA). .............................................................................................................................................................................................. 34
Figure 12. Provinces of Viet Nam extracted from the Global Administrative Areas (GADM) v2.8 database. ............................................................................................................................................................................................. 35
Figure 13. 220 kV transmission lines. .................................................................................................................................... 35
Figure 14. ESA CCI Land cover map (left) and water bodies mask (right). ........................................................... 36
Figure 15. Main roads and railways for Viet Nam. ........................................................................................................... 37
Figure 16. Land cover data used for specialised analysis of 6 provinces provided by local consultant. As an example, the land cover map of Quang Ngai is presented. .................................................................................... 38
Figure 17. 110 KV transmission lines for six provinces in Viet Nam. ...................................................................... 38
Figure 18: Modelled hourly wind speed time series locations nationally (indicated with red triangles). The underlying resource map is consistent with the ‘NTP 20km infrastructure proximity’ scenario (used for illustration). .................................................................................................................................................................. 44
Figure 19: Example of hourly wind speed time series (Ninh Binh, Nghe An and Ha Tinh provinces) over a 3-week period .............................................................................................................................................................................. 45
Figure 20: Power curve used in the wind power energy production calculation (before and after smoothening). Calibrated to correspond to the expected production of a 200 W/m2 turbine under normal conditions. ......................................................................................................................................................................... 45
Figure 21: Calculated FLHs of each of the 63 wind speed time series locations (based on the power curve) and the linear best fit function (R2 of 0.9744) .................................................................................................... 46
Figure 22: Average annual wind speeds of 9 measurement masts by GIZ (for 2012/2013) compared to modelled DTU wind speeds from nearby locations (for 2003-2011). .................................................................... 49
Figure 23. Suitable areas after removing locations with wind speeds lower than 4.5 m/s (left) and after removing protected areas (right). .......................................................................................................................................... 51
Figure 24. Suitable areas after removing areas located higher than 2000m asl (left) and densely populated areas including a 500m buffer (right). ........................................................................................................... 52
9
Figure 25. Suitable areas after removing water bodies including a 100m buffer (left) and urban areas including a 1km buffer (right). ................................................................................................................................................. 53
Figure 26. Suitable areas after removing flooded trees (left) and forests (right), both with a 100m buffer to the excluded area. ....................................................................................................................................................... 54
Figure 27. Suitable areas after removing slopes > 30% (left) and roads and railroads including a 250 m buffer (right). .................................................................................................................................................................................... 54
Figure 28. National Technical Potential (NTP) for Viet Nam. ..................................................................................... 55
Figure 29. Map of suitable areas illustrating the NTP 215 GW scenario (left) and the NTP No croplands 89 GW scenario (right). ............................................................................................................................................................... 57
Figure 30. Map of suitable areas illustrating the NTP 10km 78 GW scenario (left) and the NTP 20km 143 GW scenario (right). ............................................................................................................................................................. 58
Figure 31. Map of suitable areas illustrating the NTP No croplands 10km 27 GW scenario (left) and the NTP No croplands 20km 54 GW scenario (right). ........................................................................................................... 58
Figure 32. Map showing distance to the 220 KV transmission line grid (left) and distance to main roads (right). ................................................................................................................................................................................................. 62
Figure 33. Wind potential after removing areas with wind speeds lower than 4.5m/s, altitudes higher than 2000m, high population density, protected areas and areas close to the coast (100m) (left), and finally after removing areas covering relevant land use classes as well as slope > 30% as defined in Table 4 (right). ................................................................................................................................................................................. 63
Figure 34: Wind technical potential overview per province (land area in km2), across average annual wind speed ranges. ........................................................................................................................................................................ 65
Figure 35: Wind technical potential overview per province (wind power capacity in MW), across average annual wind speed ranges. ....................................................................................................................................... 65
Figure 36. Location, size and wind potential of selected clusters. Selection was based on wind speeds and cluster size. ............................................................................................................................................................................... 66
Figure 37: Wind technical potential overview per national cluster (wind power capacity in MW), across average annual wind speed ranges. Selection of the largest clusters. .................................................................... 68
Figure 38: Wind technical potential overview per national cluster (wind power capacity in MW), across average annual wind speed ranges. Selection of the smaller clusters. ................................................................... 68
Figure 39. Map showing the connectivity of the clusters to infrastructure. Distances to grid and main roads were calculated from the cluster centroids. .......................................................................................................... 69
Figure 40: LCOE overview per cluster (LCOE Base Case and LCOE Low) across average annual wind speed ranges. Selection of the largest clusters. ................................................................................................................. 71
Figure 41: LCOE overview per cluster (LCOE Base Case and LCOE Low) across average annual wind speed ranges. Selection of the smaller clusters. ............................................................................................................... 71
Figure 42. Clusters close to 110 and 220 KV transmission lines and proximity to grid. ................................ 72
Figure 43. Clusters far away from transmission lines; 110 KV grid (upper left and 220 KV grid (upper right) and proximity to grid (lower left). ............................................................................................................................. 73
Figure 44: Wind technical potential overview per provincial cluster (wind power capacity in MW), across average annual wind speed ranges. ......................................................................................................................... 75
Figure 45: LCOE overview per provincial cluster (LCOE Base Case and LCOE Low) across average annual wind speed ranges. Selection of the clusters in close proximity to infrastructure ............................ 75
Figure 46: LCOE overview per provincial cluster (LCOE Base Case and LCOE Low) across average annual wind speed ranges. Selection of the clusters more remote from the infrastructure ........................ 76
Figure 47: Compounded average LCOE (capacity-weighted across wind class ranges) per cluster in $ct/kWh. ............................................................................................................................................................................................. 77

10
Figure 48: National technical solar PV resource potential per region (based on IoE analysis) in MW. Size of the yellow bubbles correspond to the size of the potential. Base map: solar PV electricity output map. Source: Solargis 2017. Available at: Global Solar Atlas, ESMAP, the World Bank Group. .... 79
Figure 49: Learning curve projections for solar PV - Total system costs (USD2015/kW) ............................ 80
Figure 50: Envisioned biomass project locations based on data provided by GIZ. Base map: land use map of Vietnam. .............................................................................................................................................................................. 82
Figure 51: Wind turbines in rice paddy field, Japan. Illustration source: http://footage.framepool.com/en/shot/208589300-paddy-field-rice-electricity-generation-wind-turbine ................................................................................................................................................................................................. 86
Figure 52: National Technical Potential (NTP) power generation estimates for wind, solar PV and biomass compared to the national power demand projections in PDP 7 revised for 2020 and 2030, respectively. (Please see Appendix X for full comparison.) Unit: power generation / demand in TWh. 89
11
Abbreviations
AECID Agencia Española de Cooperación Internacional para el Desarrollo; Spanish Agency for
International Development Cooperation
AEP Annual Energy Production
CapEx Capital Expenditure
CL Cluster
CO2 Carbon Dioxide
DEA Danish Energy Agency
ESA CCI European Space Agency Climate Change Initiative
EUR Euro
FLH Full Load Hour
FIT Feed-In-Tariff
GADM Global Administrative Areas
GDE General Directorate of Energy
GDP Gross Domestic Product
GHG Green House Gas
GIS Geographic Information System
GIZ Deutsche Gesellschaft für Internationale Zusammenarbeit (GIZ) GmbH
GHI Global Horizontal Irradiation
IEA International Energy Agency
LCOE Levelized Costs of Electricity
MoIT Ministry of Industry and Trade, Vietnam
NREL American National Renewable Energy Laboratory
NTP National Technical Potential
O&M Operation and Maintenance (costs)
OpEx Operational Expenditure
PCL Provincial cluster
PCL_F Provincial cluster Far (from infrastructure)
PV Photovoltaics
RE Renewable Energy
SRTM Shuttle Radar Topographic Mission
WACC Weighted Average Cost of Capital
WDPA World Database on Protected Areas
WEO World Energy Outlook (IEA publication)

12
Disclaimer
The results of the present study are intended for top-level power system development planning
purposes on a regional/cluster level, and are not to be used for individual RE project site selection.
Wind energy resource potential data used in the present study is based on meteorological modelling,
and not on-site measurements. The analysis results are subject to the accuracy of input data sources
and development projection assumptions used.
13
Executive Summary
The current report presents the details and results of the land-based wind resource mapping GIS
analysis, as well as provides the Levelised Cost of Energy (LCOE) perspective on selected wind
resource clusters characterized by above-average wind resource. A more detailed wind resource
mapping analysis has been carried out for selected six provinces: Binh Thuan, Ninh Thuan, Khanh Hoa,
Phu Yen, Binh Dinh and Quang Ngai.
The GIS analysis of land-based wind resources within the current study follows the resource potential
estimation approach whereby the total (theoretical) resource potential is constrained (based on
topography and land use limitations, population density and terrain slope etc.) to represent the
technically feasible potential. The technically feasible potential has thereafter been evaluated using
economic criteria, in this case additional costs associated with infrastructure proximity (distance to
main roads and transmission grid) and projected annual wind power generation. Both 220 kV
(national and regional) and 110 kV (regional) transmission network are used in the analysis subject to
the identified cluster size.
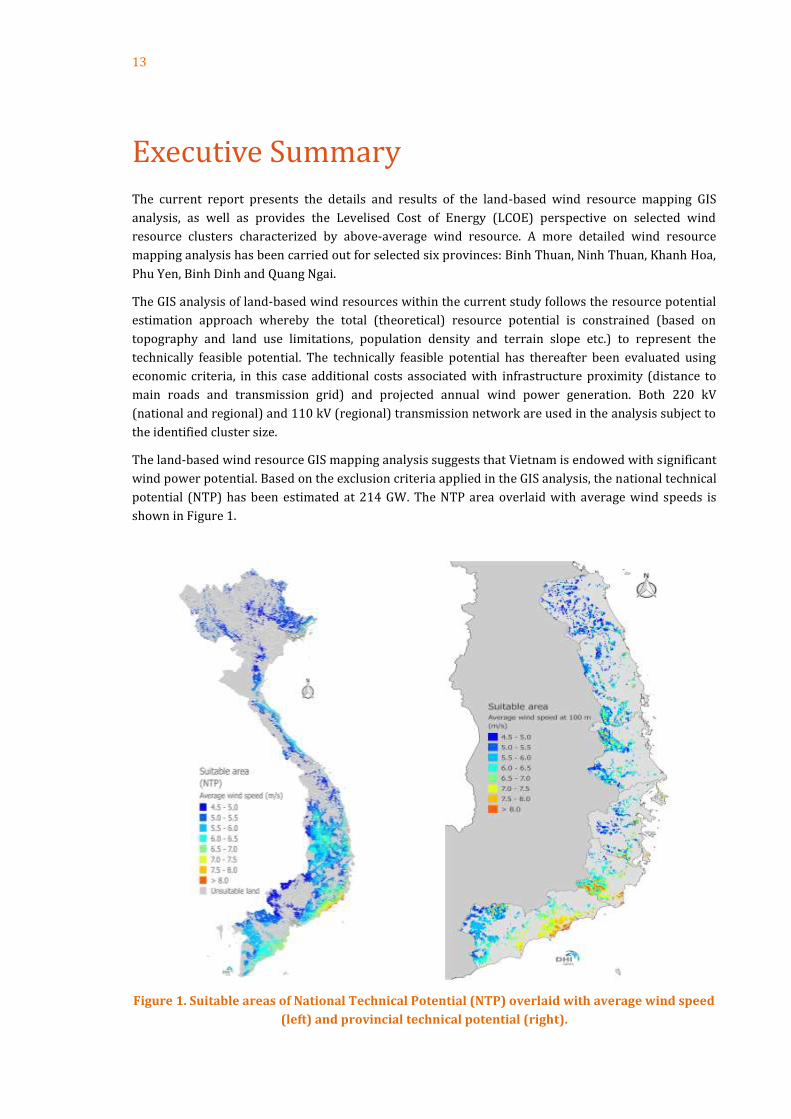
The land-based wind resource GIS mapping analysis suggests that Vietnam is endowed with significant
wind power potential. Based on the exclusion criteria applied in the GIS analysis, the national technical
potential (NTP) has been estimated at 214 GW. The NTP area overlaid with average wind speeds is
shown in Figure 1.
Figure 1. Suitable areas of National Technical Potential (NTP) overlaid with average wind speed
(left) and provincial technical potential (right).

14
For this study wind speeds from 4.5 m/s have been considered based on the screening criterion used
in (IRENA, 2016). The vast majority of the Vietnamese NTP is characterized by relatively low wind
resource quality (mean annual wind speed of 4.5 – 6m/s at 100m height). However, ca 25% of the
national NTP (ca 52 GW) is located in areas with mean annual wind speed of 6m/s and higher.
Central region has the largest share of the higher quality wind resource locations, corresponding to 37
GW, followed by South at 14 GW. Only 1.2 GW of the higher quality wind resource is located in the
North. Table 1 provides an overview of the NTP across regions and wind speed ranges.
Table 1: National Technical Potential (NTP) across regions and wind speed ranges (expressed in
km2 and MW)
Technical potential land area (km2) Technical potential wind capacity (MW)
Wind speed range
North Central South TOTAL North Central South TOTAL
National technical potential (NTP)
4.5 - 5.0 m/s
5,167 4,720 3,945 13,832 15,501 14,160 11,835 41,496
5.0 - 5.5 m/s
3,086 10,150 5,400 18,636 9,258 30,450 16,200 55,911
5.5 - 6.0 m/s
954 14,600 6,127 21,681 2,862 43,800 18,381 65,043
6.0 - 6.5 m/s
281 7,866 3,345 11,492 843 23,598 10,035 34,476
6.5 - 7.0 m/s
104 2,487 949 3,540 312 7,461 2,847 10,620
7.0 - 7.5 m/s
11 1,323 217 1,551 33 3,969 651 4,650
7.5 - 8.0 m/s
2 543 19 564 6 1,629 57 1,692
Over 8.0 m/s
1 264 0 265 3 792 - 795
TOTAL 9,606 41,953 20,002 71,561 28,818 125,859 60,006 214,683
TOTAL (6+ m/s)
399 12,483
4,530 17,411 1,197 37,449 13,590 52,233
The GIS analysis steps highlight the relative share of importance of the different exclusion criteria
towards the NTP. Almost a quarter of the total land area in Vietnam has been excluded based on mean
annual wind speed threshold criterion, i.e. areas with mean annual wind speed at 100m height not
reaching 4.5m/s. Further significant land exclusion criteria (i.e. resulting in large land exclusion areas)
have been based on populated areas / population density, protected areas, forests, as well as areas
characterized by high terrain steepness.
NTP scenarios
The alternative scenarios based on infrastructure proximity and availability of agricultural land
provide further insights. It should though be noted that only existing infrastructure of transmission
grid and roads has been included in the analysis (i.e. no envisioned development of the infrastructure
network has been considered due to data availability). Hence, the infrastructure proximity of the wind
resource areas could improve over time as infrastructure development continues.
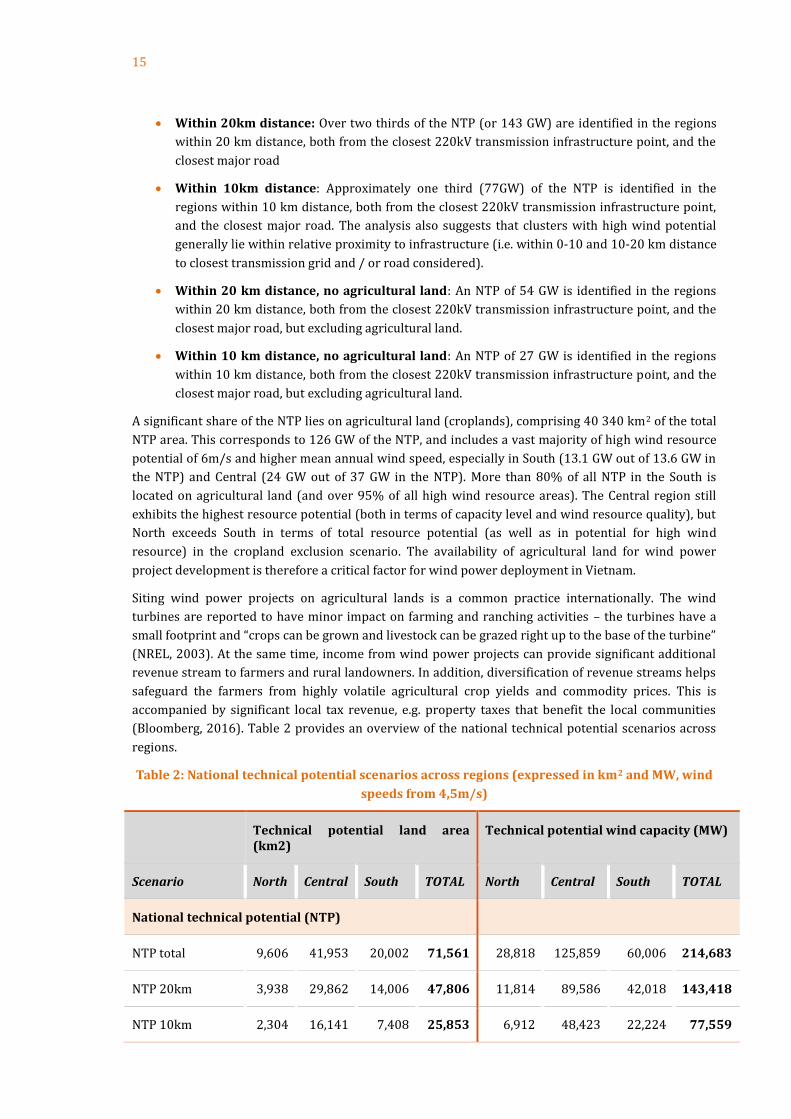
15
Within 20km distance: Over two thirds of the NTP (or 143 GW) are identified in the regions
within 20 km distance, both from the closest 220kV transmission infrastructure point, and the
closest major road
Within 10km distance: Approximately one third (77GW) of the NTP is identified in the
regions within 10 km distance, both from the closest 220kV transmission infrastructure point,
and the closest major road. The analysis also suggests that clusters with high wind potential
generally lie within relative proximity to infrastructure (i.e. within 0-10 and 10-20 km distance
to closest transmission grid and / or road considered).
Within 20 km distance, no agricultural land: An NTP of 54 GW is identified in the regions
within 20 km distance, both from the closest 220kV transmission infrastructure point, and the
closest major road, but excluding agricultural land.
Within 10 km distance, no agricultural land: An NTP of 27 GW is identified in the regions
within 10 km distance, both from the closest 220kV transmission infrastructure point, and the
closest major road, but excluding agricultural land.
A significant share of the NTP lies on agricultural land (croplands), comprising 40 340 km2 of the total
NTP area. This corresponds to 126 GW of the NTP, and includes a vast majority of high wind resource
potential of 6m/s and higher mean annual wind speed, especially in South (13.1 GW out of 13.6 GW in
the NTP) and Central (24 GW out of 37 GW in the NTP). More than 80% of all NTP in the South is
located on agricultural land (and over 95% of all high wind resource areas). The Central region still
exhibits the highest resource potential (both in terms of capacity level and wind resource quality), but
North exceeds South in terms of total resource potential (as well as in potential for high wind
resource) in the cropland exclusion scenario. The availability of agricultural land for wind power
project development is therefore a critical factor for wind power deployment in Vietnam.
Siting wind power projects on agricultural lands is a common practice internationally. The wind
turbines are reported to have minor impact on farming and ranching activities – the turbines have a
small footprint and “crops can be grown and livestock can be grazed right up to the base of the turbine”
(NREL, 2003). At the same time, income from wind power projects can provide significant additional
revenue stream to farmers and rural landowners. In addition, diversification of revenue streams helps
safeguard the farmers from highly volatile agricultural crop yields and commodity prices. This is
accompanied by significant local tax revenue, e.g. property taxes that benefit the local communities
(Bloomberg, 2016). Table 2 provides an overview of the national technical potential scenarios across
regions.
Table 2: National technical potential scenarios across regions (expressed in km2 and MW, wind
speeds from 4,5m/s)
Technical potential land area (km2)
Technical potential wind capacity (MW)
Scenario North Central South TOTAL North Central South TOTAL
National technical potential (NTP)
NTP total 9,606 41,953 20,002 71,561 28,818 125,859 60,006 214,683
NTP 20km 3,938 29,862 14,006 47,806 11,814 89,586 42,018 143,418
NTP 10km 2,304 16,141 7,408 25,853 6,912 48,423 22,224 77,559
16
NTP No croplands 6,214 19,920 3,469 29,603 18,642 59,760 10,407 88,809
NTP No croplands 20km
2,637 13,095 2,286 18,018 7,911 39,285 6,858 54,054
NTP No croplands 10km
1,504 6,416 1,127 9,047 4,512 19,248 3,381 27,141
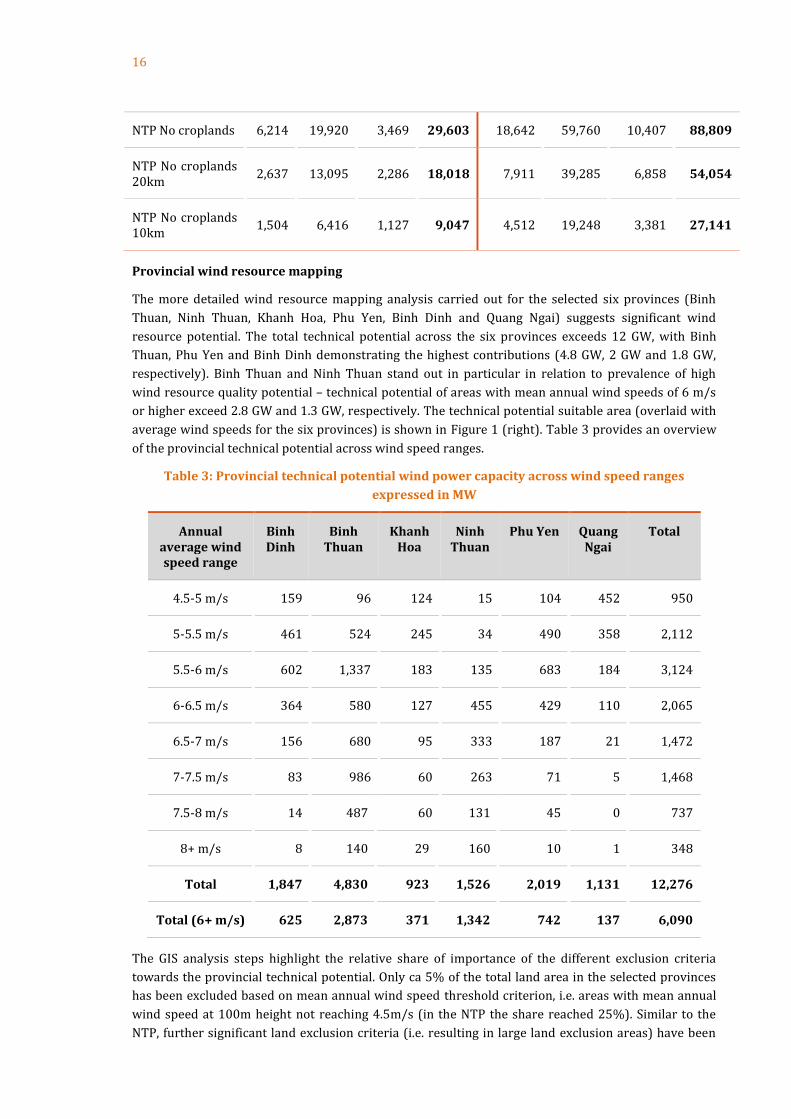
Provincial wind resource mapping
The more detailed wind resource mapping analysis carried out for the selected six provinces (Binh
Thuan, Ninh Thuan, Khanh Hoa, Phu Yen, Binh Dinh and Quang Ngai) suggests significant wind
resource potential. The total technical potential across the six provinces exceeds 12 GW, with Binh
Thuan, Phu Yen and Binh Dinh demonstrating the highest contributions (4.8 GW, 2 GW and 1.8 GW,
respectively). Binh Thuan and Ninh Thuan stand out in particular in relation to prevalence of high
wind resource quality potential – technical potential of areas with mean annual wind speeds of 6 m/s
or higher exceed 2.8 GW and 1.3 GW, respectively. The technical potential suitable area (overlaid with
average wind speeds for the six provinces) is shown in Figure 1 (right). Table 3 provides an overview
of the provincial technical potential across wind speed ranges.
Table 3: Provincial technical potential wind power capacity across wind speed ranges
expressed in MW
Annual average wind speed range
Binh Dinh
Binh Thuan
Khanh Hoa
Ninh Thuan
Phu Yen Quang Ngai
Total
4.5-5 m/s 159 96 124 15 104 452 950
5-5.5 m/s 461 524 245 34 490 358 2,112
5.5-6 m/s 602 1,337 183 135 683 184 3,124
6-6.5 m/s 364 580 127 455 429 110 2,065
6.5-7 m/s 156 680 95 333 187 21 1,472
7-7.5 m/s 83 986 60 263 71 5 1,468
7.5-8 m/s 14 487 60 131 45 0 737
8+ m/s 8 140 29 160 10 1 348
Total 1,847 4,830 923 1,526 2,019 1,131 12,276
Total (6+ m/s) 625 2,873 371 1,342 742 137 6,090
The GIS analysis steps highlight the relative share of importance of the different exclusion criteria
towards the provincial technical potential. Only ca 5% of the total land area in the selected provinces
has been excluded based on mean annual wind speed threshold criterion, i.e. areas with mean annual
wind speed at 100m height not reaching 4.5m/s (in the NTP the share reached 25%). Similar to the
NTP, further significant land exclusion criteria (i.e. resulting in large land exclusion areas) have been

17
based on populated areas / population density, protected areas, forests, as well as areas characterized
by high terrain steepness. Another criterion (specific to the provincial analysis) resulting in major
additional land exclusion area has been residential and public lands.
The analysis also suggests that, akin to the findings of the NTP analysis, clusters with high wind
potential in the selected provinces generally lie within relative proximity to infrastructure (i.e. within
0-10 and 10-20 km distance to closest transmission grid and / or road considered). Overall, the
infrastructure proximity for the selected clusters can be assessed as non-prohibitive. For context, the
threshold for grid connection proximity used in IRENA analysis in relation to wind power projects in
Latin America has been set at 75 km (IRENA, 2016).
LCOE analysis
The LCOE analysis explored ‘clusters’, i.e. areas characterised by significant proportion of adjacent
above-average wind resource cells, both nationally, and within the six selected provinces. It should be
noted, however, that the clusters identified have been based exclusively on accumulation of feasible
resource potential adjacent to above-average wind resource quality cells, and have been used for
illustrative purposes. The clusters hereby identified are not to be used as recommendations for wind
power project site boundary selection. The clusters explored in the LCOE analysis are represented in
Figure 2.
It should be noted that the LCOE values are highly dependent on the wind time series used. As
discussed in Chapter 5, the wind series used in this study are subject to limitations connected to
meteorological modelling as opposed to on-site measurements.
The results should also be seen in the context of the wind farm size assumed. Size-dependent
infrastructure costs have been considered in the LCOE calculations, as documented in Appendix II. The
wind farm size in the LCOE calculations has been based on the potential of the individual cluster.
However smaller projects might have higher LCOEs, e.g. in the national cluster Bac Lieu, in the wind
class 6-6.5 m/s, a 600 MW installation would have a Base Case LCOE of 10.65 $ct/kWh where a 30 MW
farm would have LCOEs of 12.03 $ct/kWh (13% increase). The increase in LCOE when comparing a 30
MW farm to a 600 Mw farm is very dependent on the distance from roads and grid. On average, an
increase of 20% can be expected in Base Case LCOEs when comparing wind farm size of 600 MW to 30
MW (22% in the Low Case). No size-dependence of the remaining capital costs has been included in the
calculations, which might increase the LCOEs for small wind farms even further due to wind farm costs
that do not scale linearly with size.

18
Figure 2: National (left) and provincial (center and right) clusters explored in the LCOE analysis
Two LCOE cases were developed: LCOE Base Case and LCOE Low. LCOE Base Case is based on
assumptions deemed to be representative of the situation in Vietnam currently. LCOE Low, in turn, can
be interpreted as the assumptions projected to be representative of the near- to mid-term future as the
wind power industry in Vietnam would mature, economies of scale would develop, and the cost levels
would increasingly converge with the international averages.
Of course, it should be noted that the LCOE Base Case analysis is only indicative of overall project costs,
and does not reflect the specific conditions of the individual project (e.g. differences in
administrative/permitting and financing conditions of larger versus smaller projects).
Similarly, LCOE Low case illustrates one potential technology and cost development projection, and is
subject to high degree of uncertainty. The LCOE levels have been estimated assuming infrastructure
cost sharing across the entire cluster, please see Allocation of infrastructure costs in the LCOE
calculation section for a description of the approach used.
LCOE Base Case: Overall, the LCOE of clusters range from just under 8 $ct/kWh to 14
$ct/kWh in the LCOE Base Case. However, most of the clusters are within the 9.5-12.5
$ct/kWh range.
o Good locations (6 - 7.5m/s): The LCOE Base Case analysis suggests good locations
could be developed in an LCOE range of ca 8 – 11 $ct/kWh
o Best locations (+ 7.5m/s): In addition, limited ‘best’ locations could be developed
down to under 7 $ct/kWh
o Worst locations (4.5 - 5m/s): The LCOE increases progressively along with
decreasing wind resource quality, the 4.5-5 m/s mean annual wind speed locations
reaching ca. 20 $ct/kWh.
LCOE Low Case: The LCOE Low case analysis suggests that more favourable project
development and technology conditions could yield significant LCOE reductions (e.g. in the

19
medium term), and the absolute reductions are most prominent for lower wind resource
locations – both nationally, and within the selected provinces. Overall, the LCOE of clusters
range from just 5 $ cent/kWh to 9 $ cent/kWh in the in the LCOE Low Case. However, most of
the clusters are within the 6-8 $ cent/kWh range.
o Good locations (6 - 7.5m/s): The LCOE Low Case analysis suggests good locations
could be developed in an LCOE range of 5.2 – 6.9 $ct/kWh.
o Best locations (+ 7.5m/s): Limited ‘best’ locations could be developed in the range of
4.2 – 4.7 $ct/kWh.
o Worst locations (4.5 - 5m/s): Locations with 4.5-5 m/s mean annual wind speed
yield an average of ca. 13 $ct/kWh, which is a significant reduction from the 20
$ct/kWh in the LCOE Base Case.
Figure 3 provides a representative overview of the LCOE Base Case and LCOE Low across wind speed
ranges for a selection of provincial clusters.
Figure 3: LCOE overview per provincial cluster (LCOE Base Case and LCOE Low) across average annual wind speed ranges. Selection of representative clusters (close and large distance to
infrastructure)
The compound LCOE values per cluster (the capacity-weighted LCOE values per wind speed ranges of
each cluster) indicate that the clusters’ lowest overall LCOE are located in the provinces with the best
wind resource (Central and South regions), whilst the cluster with the highest LCOE is located in the
North (Quang Ninh) as presented in Figure 4. Larger clusters that feature a wide spectrum of different
wind resource sites (including large shares of lower wind speed sites) also generally exhibit higher
LCOE values. Interestingly, a cluster with good wind resource yet in relatively longer distance from
infrastructure (PCL_F3 in Ninh Thuan province) ranks among the lowest cost clusters, supporting the
finding of the possibility of infrastructure costs becoming a minor factor in wind power project
competitiveness.
0
5
10
15
20
25
LCOEBase case
LCOELow
LCOEBase case
LCOELow
LCOEBase case
LCOELow
LCOEBase case
LCOELow
LCOEBase case
LCOELow
PCL_F1_Binh Dinh PCL_F2_Phu Yen PCL_F3_Ninh Thuan PCL1_Binh Thuan PCL2_Ninh Thuan
LC
OE
(U
SD c
ents
/ k
Wh
)
Sum of 4.5-5 m/s Sum of 5-5.5 m/s Sum of 5.5-6 m/s Sum of 6-6.5 m/s
Sum of 6.5-7 m/s Sum of 7-7.5 m/s Sum of 7.5-8 m/s Sum of 8+ m/s
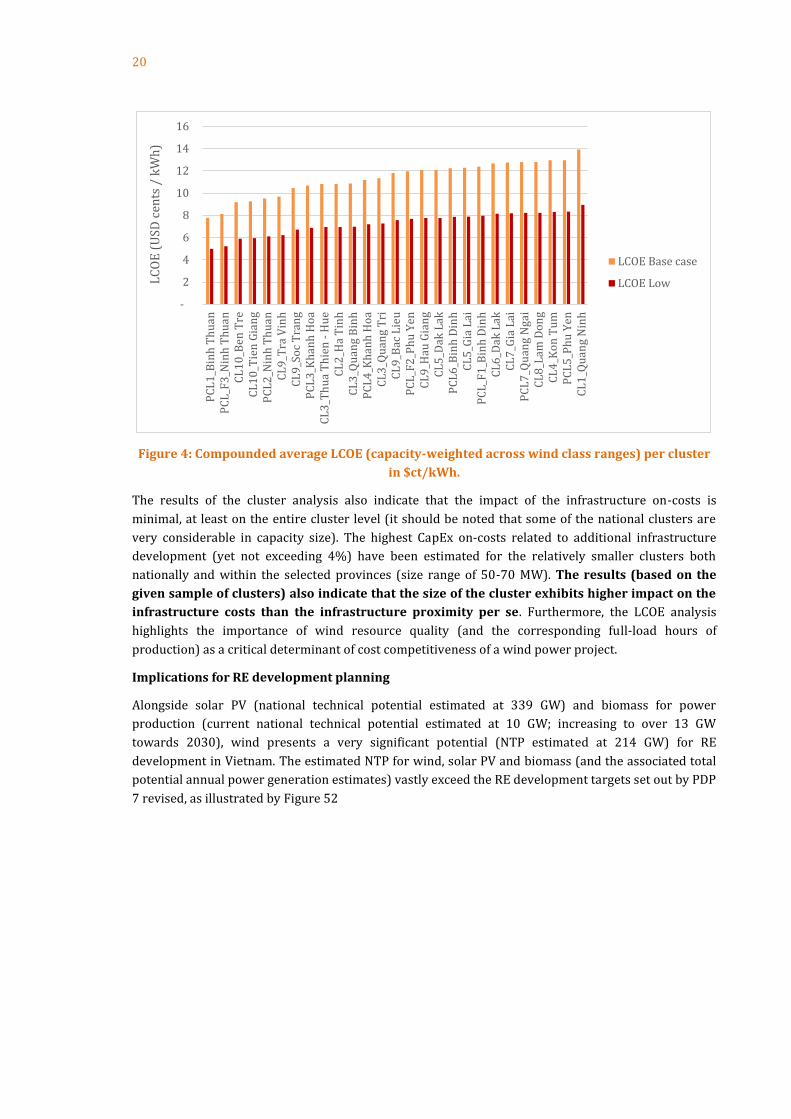
20
Figure 4: Compounded average LCOE (capacity-weighted across wind class ranges) per cluster
in $ct/kWh.
The results of the cluster analysis also indicate that the impact of the infrastructure on-costs is
minimal, at least on the entire cluster level (it should be noted that some of the national clusters are
very considerable in capacity size). The highest CapEx on-costs related to additional infrastructure
development (yet not exceeding 4%) have been estimated for the relatively smaller clusters both
nationally and within the selected provinces (size range of 50-70 MW). The results (based on the
given sample of clusters) also indicate that the size of the cluster exhibits higher impact on the
infrastructure costs than the infrastructure proximity per se. Furthermore, the LCOE analysis
highlights the importance of wind resource quality (and the corresponding full-load hours of
production) as a critical determinant of cost competitiveness of a wind power project.
Implications for RE development planning
Alongside solar PV (national technical potential estimated at 339 GW) and biomass for power
production (current national technical potential estimated at 10 GW; increasing to over 13 GW
towards 2030), wind presents a very significant potential (NTP estimated at 214 GW) for RE
development in Vietnam. The estimated NTP for wind, solar PV and biomass (and the associated total
potential annual power generation estimates) vastly exceed the RE development targets set out by PDP
7 revised, as illustrated by Figure 52
-
2
4
6
8
10
12
14
16
PC
L1
_Bin
h T
hu
anP
CL
_F3
_Nin
h T
hu
anC
L1
0_B
en T
reC
L1
0_T
ien
Gia
ng
PC
L2
_Nin
h T
hu
anC
L9
_Tra
Vin
hC
L9
_So
c T
ran
gP
CL
3_K
han
h H
oa
CL
3_T
hu
a T
hie
n -
Hu
eC
L2
_Ha
Tin
hC
L3
_Qu
ang
Bin
hP
CL
4_K
han
h H
oa
CL
3_Q
uan
g T
riC
L9
_Bac
Lie
uP
CL
_F2
_Ph
u Y
enC
L9
_Hau
Gia
ng
CL
5_D
ak L
akP
CL
6_B
inh
Din
hC
L5
_Gia
Lai
PC
L_F
1_B
inh
Din
hC
L6
_Dak
Lak
CL
7_G
ia L
aiP
CL
7_Q
uan
g N
gai
CL
8_L
am D
on
gC
L4
_Ko
n T
um
PC
L5
_Ph
u Y
enC
L1
_Qu
ang
Nin
h
LC
OE
(U
SD c
ents
/ k
Wh
)
LCOE Base case
LCOE Low

21
Figure 5: National Technical Potential (NTP) power generation estimates for wind, solar PV and
biomass compared to the national power demand projections in PDP 7 revised for 2020 and
2030, respectively. (Please see Appendix X for full comparison.) Unit: power generation /
demand in TWh.
By 2030, PDP 7 revised envisions 6 GW of wind and 12 GW of solar PV in the Vietnamese power
system, corresponding to 2.1 and 3.3 % (and 2.1% for biomass) of the total national power production,
respectively. The analysis suggests that the abundance of technically feasible RE potential could allow
for significantly higher shares of RES generation in the Vietnamese power system in the future.
Whilst the overall wind resource quality in Vietnam is relatively low, large potential also for wind
resource areas exceeding 6 m/s of mean annual wind speed have been identified nationally, reaching
52 GW. Based on the LCOE Base Case assumptions representative of the current situation in Vietnam,
these areas could be developed at a cost range of 6-10 $ct/kWh. Provided increasing maturation of the
wind power industry in Vietnam and further improvements and cost reductions in wind power
technology globally, the LCOE for areas with lower wind resource quality in the medium term could
decrease to a cost range of 8-13 $ct/kWh, making them more cost competitive. Prerequisites for a
mature market development have been listed in the paragraph below.
The infrastructure cost parameter analysis, as well as the LCOE perspective on wind energy resource
‘clusters’ has highlighted that the on-cost borne by additional infrastructure development
(transmission grid and road) can be negligible, provided that the cost is shared across the entire
cluster. In power system and RE deployment planning perspective, this could suggest that it would be
socio-economically advantageous to coordinate infrastructure development in the long-term, taking
into account prospective wind power project development areas.
Wind power project siting on agricultural land is common practice internationally. The operation of
wind power projects does not impede farming activities, whilst providing additional income
opportunities to the local land-owners and residents (e.g. through job creation). Obstacles (e.g.
procedural or regulatory) to wind power project development on agricultural land could therefore
pose a significant challenge for large scale and cost-efficient wind power deployment in Vietnam, given
the very significant (and superior) wind resource potential located on agricultural land.
Prerequisites for successful RE development
Significant RE resource potential does not guarantee successful RE project development per se. A
number of important preconditions are required in order to enable and encourage the development of
a viable RE industry (based on “Up-Scaling of Wind Power in Viet Nam - Capacity Needs Assessment for
Nationalpower
demandWind Solar PV Biomass
Sum of PDP 7 rev. 2020 265 2 1 3
Sum of PDP 7 rev. 2030 570 12 19 12
Sum of NTP 2020 437 436 86
-
100
200
300
400
500
600
Po
wer
gen
erat
ion
(T
Wh
)

22
Wind Power” (GIZ, 2016) and “LCOE of current wind projects in Viet Nam and recommendations for an
improved support mechanism” (GIZ, 2017)):
Adequate legal and regulatory framework;
o Streamlined procedures to mitigate lengthy permitting process;
Adequate support level for RE development:
o More support needed in nascent markets, to compensate the high risk and enable
service and human capital development;
o Support can be gradually reduced once the market matures;
Opportunities for RE-focused education;
RE-focused engineering disciplines at universities and vocational education and training
possibilities to be encouraged.
23
Introduction
In order for the Government of Viet Nam to economically optimize the integration of variable
renewable energy into the energy system for the national benefit and achieve the long-term objectives
of utilizing RE and reducing the GHG emission, an energy planning exercise is required.
In this context, the Danish Energy Agency (DEA) is undertaking a study for model-based power sector
scenarios, using the Balmorel model1. This model has been used in collaboration with the government
of Vietnam in 2015, and has proved its value with a pilot model of the Vietnamese energy mix creating
optimal dispatch on an hourly basis, as well as optimal generation and transmission development
planning. A group of experts has been trained on the model’s key features and input data was reviewed
according to feedback. Following this, the DEA and it local partners have decided to further develop the
model, build up the local capacities to operate it, and prepare an energy outlook up to 2050 for the
country based on the results obtained.
Among the inputs for this modelling exercise, renewable energy resources and investment costs are
crucial. With its long-standing experience in renewable energy in Vietnam and its first-hand data, GIZ
is collaborating with the Danish Energy Agency on this preliminary step.
The main objective of the current study was to obtain improved high-level RES resource potential data
for planning activities of the future Vietnamese power sector. The main focus is on land-based wind
power, whereby data has been collected and analyzed using GIS, to arrive at theoretical potential, and
technical and economic feasibility. The data was then adapted for use in the Balmorel model in the
long-term power system planning scenarios.
The current report presents the details and results of the land-based wind resource mapping GIS
analysis, as well as provides the Levelised Cost of Energy (LCOE) perspective on selected wind
resource clusters characterized by above-average wind resource. A more detailed wind resource
mapping analysis has been carried out for selected six provinces: Binh Thuan, Ninh Thuan, Khanh Hoa,
Phu Yen, Binh Dinh and Quang Ngai. In addition, an overview of regional solar PV and biomass (for use
in power production) resource potentials in Vietnam has been provided for context.
1 Please see Appendix I for more information

24
01
Study Methodology

25
1. Study methodology
The analysis of land-based wind resources within the current study will follow the resource potential
estimation approach whereby the total (theoretical) resource potential is constrained (based on
topography and land use limitations, population density and infrastructure proximity etc.) to represent
the technically feasible potential. The technically feasible potential will thereafter be evaluated using
economic criteria, in this case infrastructure proximity (distance to roads and transmission grid) and
projected annual wind power generation. Market factors (e.g. support schemes, regulatory national
targets, value of electricity) are not within the scope of the current study, as illustrated in Figure 6.
Figure 6. Levels of resource potential. Illustration source: (NREL, 2012)
1.1 GIS analysis framework
The following analysis steps have been applied within the study:
GIS layer with annual resource for wind is plotted, representing the theoretical resource
potential, and covering all of Vietnam
GIS layers representing topology, land use, protected areas and population etc. are added.
Based on the exclusion criteria applied (see section Screening criteria), the technical resource
potential is estimated by excluding the areas where wind power project development would
not be possible (e.g. on steep slopes, in national parks, in urban areas etc.)
o National results for technical potential land-based wind resource potential are
presented
Technical potential areas characterised by significant proportion of adjacent above-average
wind resource cells are selected and grouped into ‘clusters’
GIS data on electricity grid is collected and plotted, along with the GIS layer of the road
network. For each technical potential ‘cluster’ identified, distance to roads and transmission
grid is determined
Scope of the current study
26
Based on the hourly wind speed time series data set, the annual energy production per
‘cluster’ is estimated
Levelised Cost of Electricity (LCOE) overview is provided for the selected ‘clusters’, taking into
account the infrastructure proximity (and their associated costs), as well as the estimated
annual energy production
In addition, more detailed provincial land-based wind resource GIS analysis is carried out for
selected six provinces: Binh Thuan, Ninh Thuan, Khanh Hoa, Phu Yen, Binh Dinh and Quang
Ngai
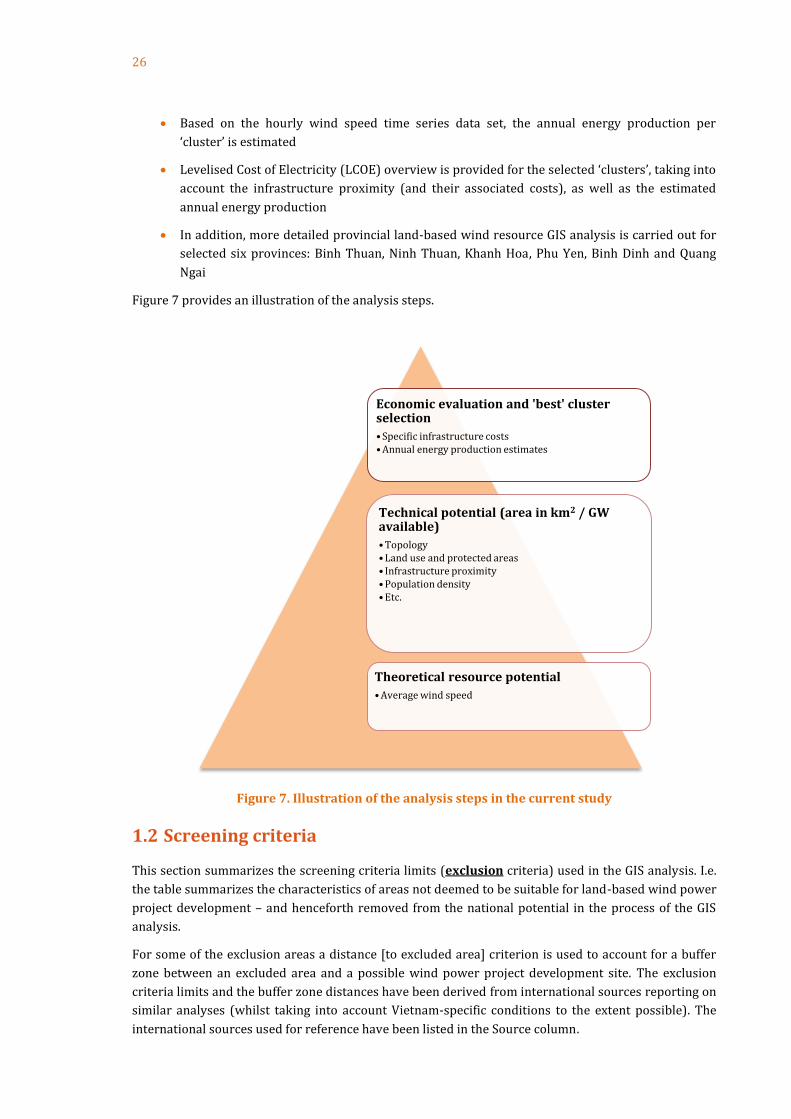
Figure 7 provides an illustration of the analysis steps.
Figure 7. Illustration of the analysis steps in the current study
1.2 Screening criteria
This section summarizes the screening criteria limits (exclusion criteria) used in the GIS analysis. I.e.
the table summarizes the characteristics of areas not deemed to be suitable for land-based wind power
project development – and henceforth removed from the national potential in the process of the GIS
analysis.
For some of the exclusion areas a distance [to excluded area] criterion is used to account for a buffer
zone between an excluded area and a possible wind power project development site. The exclusion
criteria limits and the buffer zone distances have been derived from international sources reporting on
similar analyses (whilst taking into account Vietnam-specific conditions to the extent possible). The
international sources used for reference have been listed in the Source column.
Economic evaluation and 'best' cluster selection
• Specific infrastructure costs • Annual energy production estimates
Technical potential (area in km2 / GW available)
• Topology • Land use and protected areas • Infrastructure proximity • Population density • Etc.
Theoretical resource potential
• Average wind speed

27
Table 4: Wind power resource technical potential estimation exclusion criteria
Dimension Exclusion criteria Distance Source
Wind speed Under 4.5 m/s (IRENA, 2016)
Topography Slope over 30%
(Yang, 2013), (Rodman &
Meentemeyer, 2006)
Altitude Over 2000m (IRENA, 2016)
Population density
Over 500 persons/km2 500m (IRENA, 2016), (Yang, 2013)
Protected areas
Listed as protected area 1km
WDPA2, (Yang, 2013), (Rodman & Meentemeyer, 2006)
Coast Proximity to coast 100m (Stenz, Malaney, Gillman, & Crill, 2010)
Land use (NTP)
Urban areas 1 km
(Stenz, Malaney, Gillman, & Crill, 2010), (IRENA, 2016), (NREL, 2012)
Water bodies 100m
Forests (cover > 15%) and flooded trees (e.g., Mangroves)
100m
Roads and railroads 250m
Land use (detailed provincial analysis)
Commercial, Industrial and Non-Agricultural Land
1km
(Stenz, Malaney, Gillman, & Crill, 2010)
National Defense and Religious Land
1km (Stenz, Malaney, Gillman, & Crill, 2010)
Residential and Public Land 1km (Stenz, Malaney, Gillman, & Crill, 2010)
Special Forest Land 1km
(Yang, 2013), (Rodman & Meentemeyer, 2006)
Transportation 250m (Stenz, Malaney, Gillman, & Crill, 2010)
Water bodies 100m (Stenz, Malaney, Gillman, & Crill, 2010)
The wind speed exclusion criterion removes the areas where average annual wind speeds would not
be sufficient for wind power projects, based on (IRENA, 2016).
The topography exclusion criterion removes the areas where siting of wind power projects would not
be possible due to the steepness of the terrain. Slope thresholds used in wind power-related GIS
2 https://www.iucn.org/theme/protected-areas/our-work/world-database-protected-areas

28
analyses varies greatly in international literature, ranging from 9% to 40% in the sources reviewed.
Slope threshold of 30% has been selected for the purposes of the current study used in (Yang, 2013),
based on (Rodman & Meentemeyer, 2006).
The altitude exclusion criterion removes high-altitude areas that are not conducive for wind power
project development (IRENA, 2016). The IRENA study states, however: “A maximum altitude of 2000
m was considered as a limitation for wind power installation for this analysis. However, this
preliminary assessment should not be interpreted as a statement against wind development above
that level.” It should be noted that in the case of Vietnam, the land area exceeding 2000m height
threshold is negligible.
The population density exclusion criterion is employed to avoid proximity to population centers and as
a proxy to buildings, with the assumptions that buildings are where people are and that the denser the
population per km2 the denser the built-up area and potentially higher the buildings. The population
density exclusion criterion threshold of 500 persons / km2 is based on (IRENA, 2016). In addition,
500m buffer zone area exclusion criterion is further added based on (Yang, 2013), reported to
correspond to a distance providing acceptable sound pressure levels (between 40 and 55 dB) for the
people living in the vicinity of wind turbine locations (HGC Engineering, 2007).
The protected areas exclusion criterion is used to remove the areas where large scale construction
projects are likely to be prohibited, e.g. nature reserves, national parks, protected landscapes etc.
based on World Database on Protected Areas (WDPA). In addition, a buffer zone exclusion criterion is
further added to account for the possible limitations of construction in the immediate vicinity to the
protected areas due to noise and visual impact concerns. Buffer zone threshold of 1000m has been
applied in the current analysis, derived from state parkland buffer zone threshold used in (Yang,
2013), based on (Rodman & Meentemeyer, 2006).
The coast exclusion criterion is used to remove areas in close proximity to the coast. No specific
planning regulations for Vietnam have been identified, hence a 100m buffer zone threshold has been
applied based on (Stenz, Malaney, Gillman, & Crill, 2010).
The land use exclusion criterion removes the areas where siting of wind power projects would not be
possible, e.g., in cities and residential areas, on commercial or industrial land, in lakes and rivers, in
forests and on roads and railroads (NREL, 2012), (IRENA, 2016). In addition, buffer zone thresholds
have been added to each of the exclusion criteria based on (Stenz, Malaney, Gillman, & Crill, 2010).
Finally, the more detailed land use data for the more detailed provincial analysis has been analyzed
and corresponding land use exclusion criteria have been set forth as for the National Technical
Potential analysis, with the buffer zone exclusion criteria adapted from (Stenz, Malaney, Gillman, &
Crill, 2010) and (Yang, 2013).
The terrain roughness exclusion criterion has been evaluated within the current analysis, but found
not to be relevant. Hence it is not included in the analysis.
The exclusion criteria have been applied step-wise so as to allow for the assessment for the individual
impact of each of the criteria.
1.3 Other assumptions
The GIS analysis defines the available land area for wind and solar. In order to convert the land area
into an estimate for wind power generation capacity, footprint assumptions are being used. Wind and
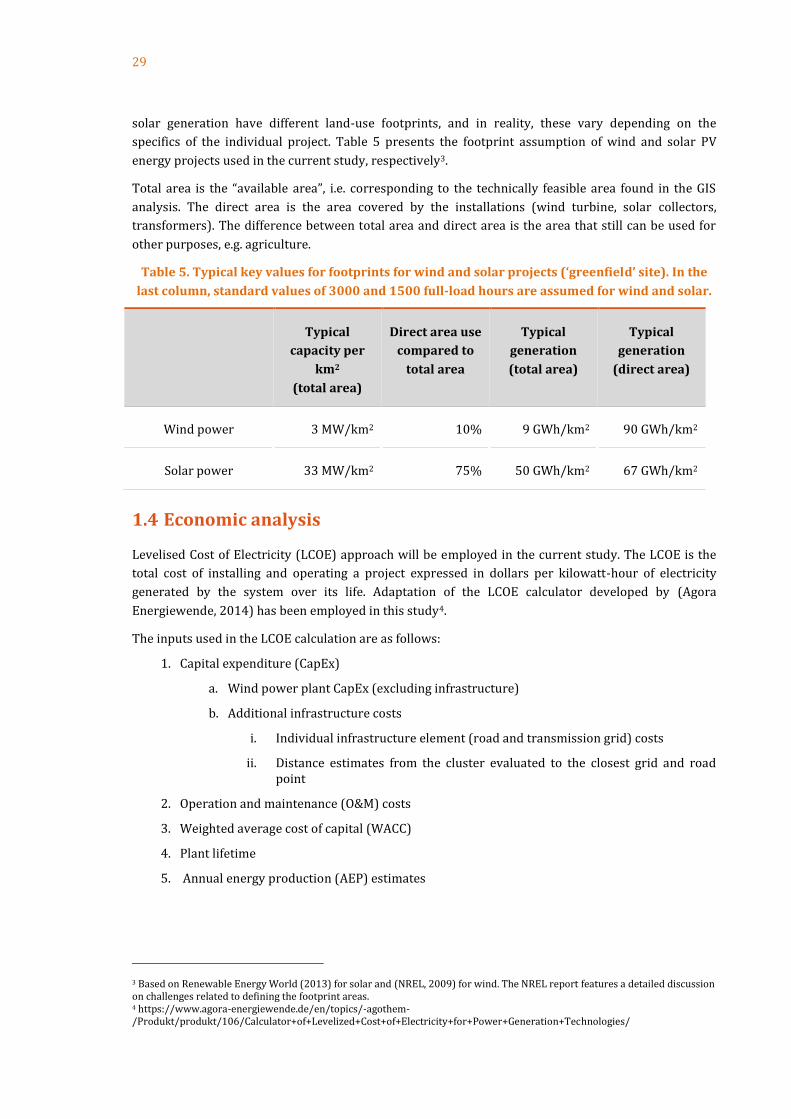
29
solar generation have different land-use footprints, and in reality, these vary depending on the
specifics of the individual project. Table 5 presents the footprint assumption of wind and solar PV
energy projects used in the current study, respectively3.
Total area is the “available area”, i.e. corresponding to the technically feasible area found in the GIS
analysis. The direct area is the area covered by the installations (wind turbine, solar collectors,
transformers). The difference between total area and direct area is the area that still can be used for
other purposes, e.g. agriculture.
Table 5. Typical key values for footprints for wind and solar projects (‘greenfield’ site). In the
last column, standard values of 3000 and 1500 full-load hours are assumed for wind and solar.
Typical
capacity per
km2
(total area)
Direct area use
compared to
total area
Typical
generation
(total area)
Typical
generation
(direct area)
Wind power 3 MW/km2 10% 9 GWh/km2 90 GWh/km2
Solar power 33 MW/km2 75% 50 GWh/km2 67 GWh/km2
1.4 Economic analysis
Levelised Cost of Electricity (LCOE) approach will be employed in the current study. The LCOE is the
total cost of installing and operating a project expressed in dollars per kilowatt-hour of electricity
generated by the system over its life. Adaptation of the LCOE calculator developed by (Agora
Energiewende, 2014) has been employed in this study4.
The inputs used in the LCOE calculation are as follows:
1. Capital expenditure (CapEx)
a. Wind power plant CapEx (excluding infrastructure)
b. Additional infrastructure costs
i. Individual infrastructure element (road and transmission grid) costs
ii. Distance estimates from the cluster evaluated to the closest grid and road point
2. Operation and maintenance (O&M) costs
3. Weighted average cost of capital (WACC)
4. Plant lifetime
5. Annual energy production (AEP) estimates
3 Based on Renewable Energy World (2013) for solar and (NREL, 2009) for wind. The NREL report features a detailed discussion on challenges related to defining the footprint areas. 4 https://www.agora-energiewende.de/en/topics/-agothem-/Produkt/produkt/106/Calculator+of+Levelized+Cost+of+Electricity+for+Power+Generation+Technologies/

30
02
GIS Analysis Sources
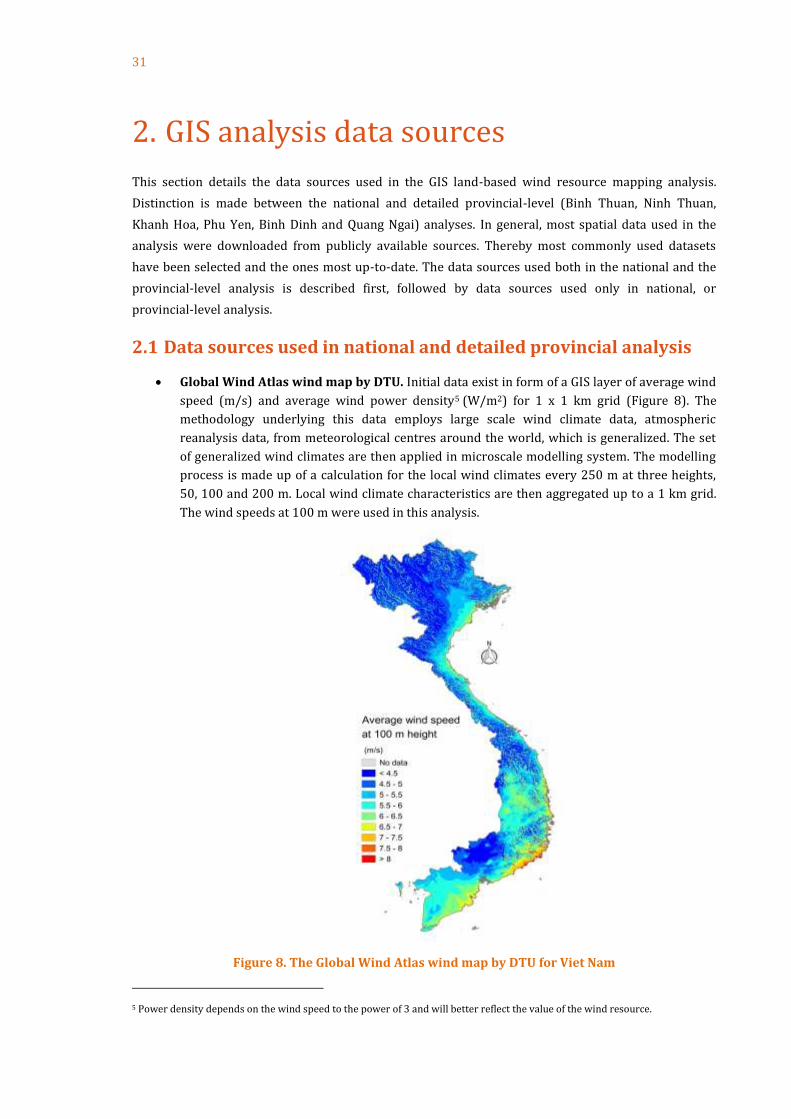
31
2. GIS analysis data sources
This section details the data sources used in the GIS land-based wind resource mapping analysis.
Distinction is made between the national and detailed provincial-level (Binh Thuan, Ninh Thuan,
Khanh Hoa, Phu Yen, Binh Dinh and Quang Ngai) analyses. In general, most spatial data used in the
analysis were downloaded from publicly available sources. Thereby most commonly used datasets
have been selected and the ones most up-to-date. The data sources used both in the national and the
provincial-level analysis is described first, followed by data sources used only in national, or
provincial-level analysis.
2.1 Data sources used in national and detailed provincial analysis
Global Wind Atlas wind map by DTU. Initial data exist in form of a GIS layer of average wind
speed (m/s) and average wind power density5 (W/m2) for 1 x 1 km grid (Figure 8). The
methodology underlying this data employs large scale wind climate data, atmospheric
reanalysis data, from meteorological centres around the world, which is generalized. The set
of generalized wind climates are then applied in microscale modelling system. The modelling
process is made up of a calculation for the local wind climates every 250 m at three heights,
50, 100 and 200 m. Local wind climate characteristics are then aggregated up to a 1 km grid.
The wind speeds at 100 m were used in this analysis.
Figure 8. The Global Wind Atlas wind map by DTU for Viet Nam
5 Power density depends on the wind speed to the power of 3 and will better reflect the value of the wind resource.

32
Topology. NASA Shuttle Radar Topographic Mission (SRTM) Digital Elevation Database v4.1.
The SRTM has provided digital elevation data (DEMs) for over 80% of the globe. This data is
currently distributed free of charge by USGS and is available for download from the National
Map Seamless Data Distribution System, or the USGS ftp site. The 90 m spatial resolution data
product was used in this analysis6. See Figure 9. From the DEM, terrain slope and elevation
was derived.
Figure 9. NASA SRTM topology data.
Population density. AsiaPop provides estimates of numbers of people residing in each
100x100m grid cell. Through integrating census, survey, satellite and GIS datasets in a flexible
machine-learning framework, high resolution maps of population count and densities for
2000-2020 are produced, along with accompanying metadata7.
6 See: www.cgiar-csi.org/data/srtm-90m-digital-elevation-database-v4-1 7 See: www.worldpop.org.uk/data/summary/?contselect=Asia&countselect=Vietnam&typeselect=Population
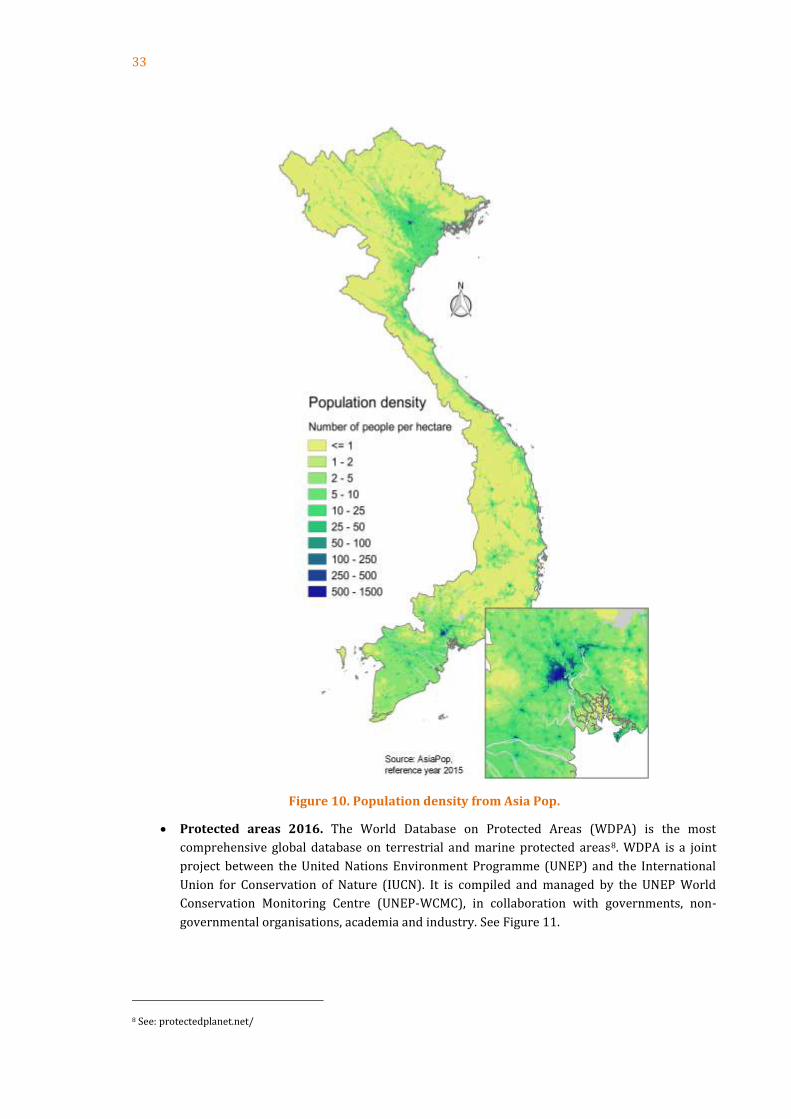
33
Figure 10. Population density from Asia Pop.
Protected areas 2016. The World Database on Protected Areas (WDPA) is the most
comprehensive global database on terrestrial and marine protected areas8. WDPA is a joint
project between the United Nations Environment Programme (UNEP) and the International
Union for Conservation of Nature (IUCN). It is compiled and managed by the UNEP World
Conservation Monitoring Centre (UNEP-WCMC), in collaboration with governments, non-
governmental organisations, academia and industry. See Figure 11.
8 See: protectedplanet.net/
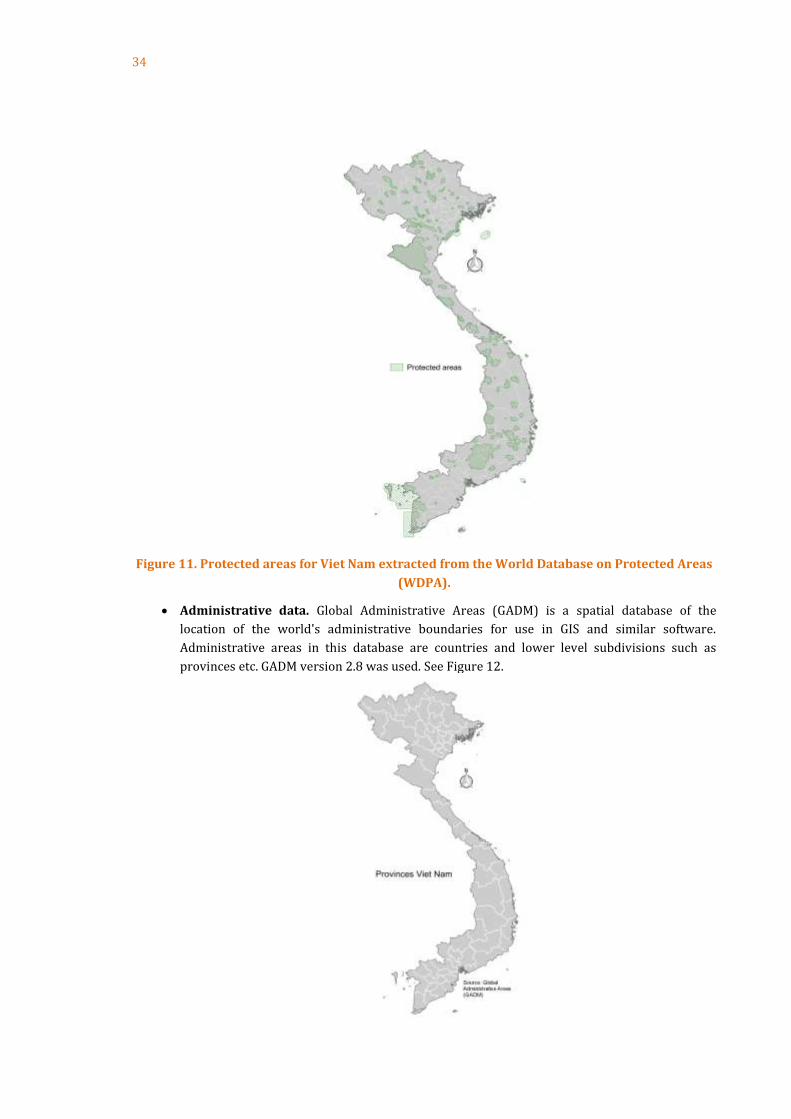
34
Figure 11. Protected areas for Viet Nam extracted from the World Database on Protected Areas
(WDPA).
Administrative data. Global Administrative Areas (GADM) is a spatial database of the
location of the world's administrative boundaries for use in GIS and similar software.
Administrative areas in this database are countries and lower level subdivisions such as
provinces etc. GADM version 2.8 was used. See Figure 12.
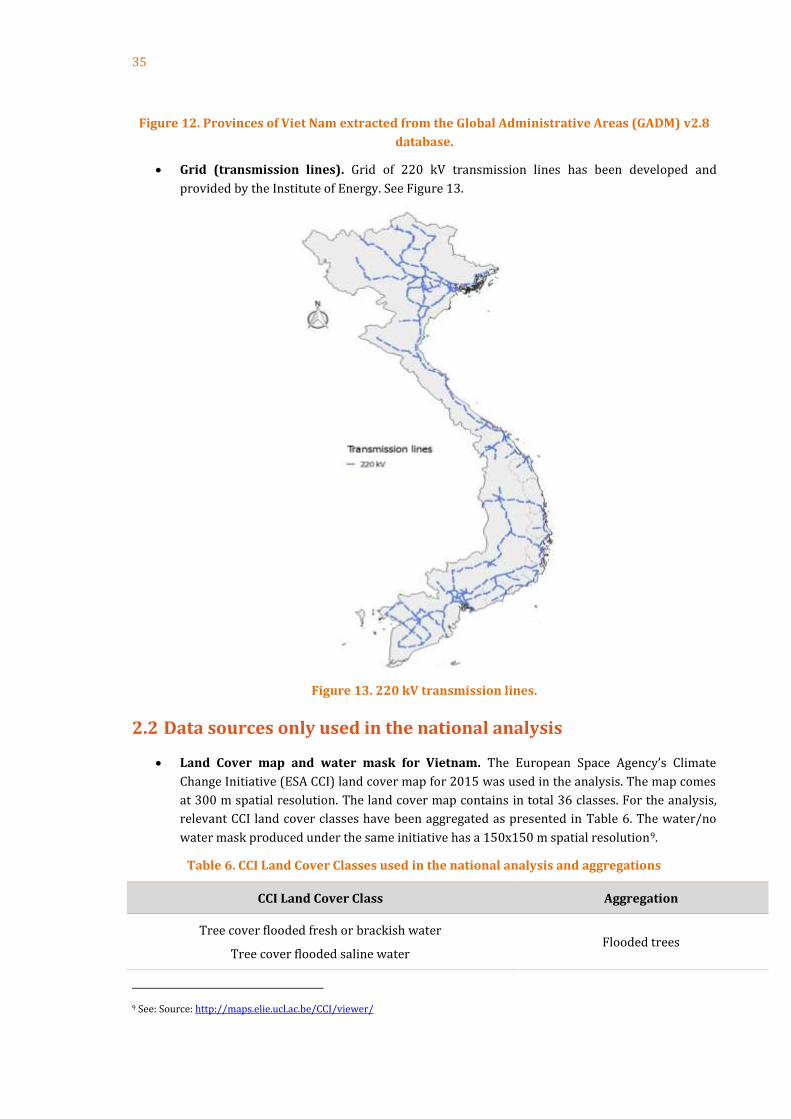
35
Figure 12. Provinces of Viet Nam extracted from the Global Administrative Areas (GADM) v2.8
database.
Grid (transmission lines). Grid of 220 kV transmission lines has been developed and
provided by the Institute of Energy. See Figure 13.
Figure 13. 220 kV transmission lines.
2.2 Data sources only used in the national analysis
Land Cover map and water mask for Vietnam. The European Space Agency’s Climate
Change Initiative (ESA CCI) land cover map for 2015 was used in the analysis. The map comes
at 300 m spatial resolution. The land cover map contains in total 36 classes. For the analysis,
relevant CCI land cover classes have been aggregated as presented in Table 6. The water/no
water mask produced under the same initiative has a 150x150 m spatial resolution9.
Table 6. CCI Land Cover Classes used in the national analysis and aggregations
CCI Land Cover Class Aggregation
Tree cover flooded fresh or brackish water
Tree cover flooded saline water Flooded trees
9 See: Source: http://maps.elie.ucl.ac.be/CCI/viewer/

36
Tree cover broadleaved evergreen closed to open (>15%)
Tree cover broadleaved deciduous closed (>40%)
Tree cover needle leaved evergreen closed (>40%)
Tree cover needle leaved deciduous closed (>40%)
Forest
Urban areas Urban areas
Cropland rainfed
Cropland rainfed - Herbaceous cover
Cropland rainfed - Tree or shrub cover
Cropland irrigated or post-flooding
Agricultural land
Figure 14 illustrates the ESA CCI land cover map and the water bodies mask.
Figure 14. ESA CCI Land cover map (left) and water bodies mask (right).
Roads and railways. The OpenStreetMap (OSM) project (www.openstreetmap.org) has
collected an enormous amount of free spatial data and the database is growing every day10.
For the national analysis primary roads, motorways and railways were used (Figure 15).
10 See: www.openstreetmap.org
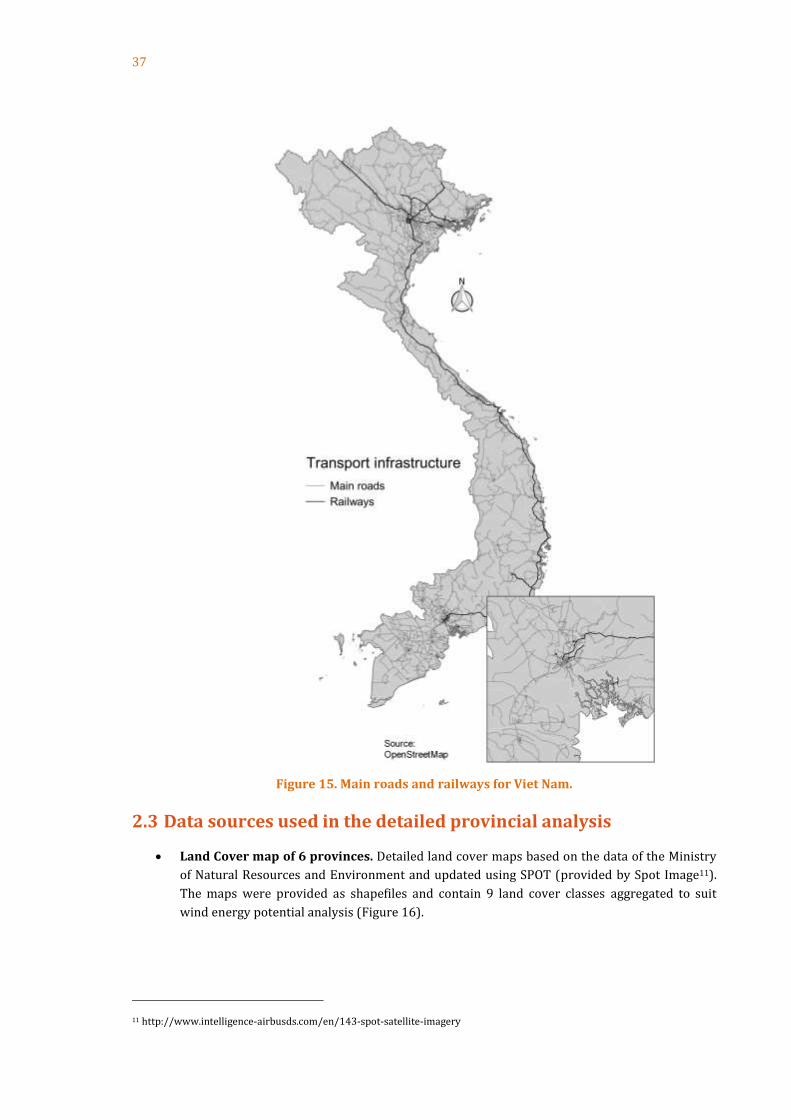
37
Figure 15. Main roads and railways for Viet Nam.
2.3 Data sources used in the detailed provincial analysis
Land Cover map of 6 provinces. Detailed land cover maps based on the data of the Ministry
of Natural Resources and Environment and updated using SPOT (provided by Spot Image11).
The maps were provided as shapefiles and contain 9 land cover classes aggregated to suit
wind energy potential analysis (Figure 16).
11 http://www.intelligence-airbusds.com/en/143-spot-satellite-imagery

38
Figure 16. Land cover data used for specialised analysis of 6 provinces provided by local
consultant. As an example, the land cover map of Quang Ngai is presented.
Grid (transmission lines). Grid of 110 KV transmission lines has been developed and
provided by the Institute of Energy, based on data and information collected and provided by
the respective provincial high voltage (110KV) companies (Figure 17).
Figure 17. 110 KV transmission lines for six provinces in Viet Nam.

39
03
LCOE Analysis data sources and inputs

40
3. LCOE analysis data sources and inputs
This section describes and presents the data sources, assumptions and inputs used in the LCOE
analysis.
3.1 Wind power project costs and characteristics
Table 7 provides an overview of the key land-based wind power project cost and characteristic
parameters used in the LCOE analysis. Two LCOE cases are developed: LCOE Base Case and LCOE Low.
LCOE Base Case is based on assumptions deemed to be representative of the situation in Vietnam
currently. LCOE Low, in turn, can be interpreted as the assumptions projected to be representative of
the near- to mid-term future as the wind power industry in Vietnam would mature, economies of scale
would develop, and the cost levels would increasingly converge with the international averages.
Table 7: Overview of key wind power project cost and characteristic parameters used in the
cluster LCOE analysis
LCOE Base Case LCOE Low
Plant CapEx (excl. infrastructure)
(USD/kW)
1,870 1,500
O&M costs (USD/kW/year) 50 45
Project lifetime (Years) 20 22
WACC (%) 10.8% 7%
Plant CapEx estimate for LCOE Base Case has been based on the average across feasibility studies for
23 projects in Vietnam – adjusted for cost reduction reported on the purchase price for wind turbine
(data provided by GIZ). The LCOE Low case CapEx value represents an estimate of the average global
investment cost in the medium term based on IEA World Energy Outlook investment cost projections
for onshore wind in 2030 (IEA, 2016). Average of the investment costs for Europe, US, China and India
has been used.
O&M costs corresponding to 45 EUR/kW/year (ca 50 USD/kW/year at exchange rate of June 2017)
have been selected to represent the LCOE Base Case (IEA Wind Task 26, 2016). Projected cost
reductions in the O&M costs in the medium term have been represented in the LCOE Low case, in line
with (IEA Wind Task 26, 2016).
Standard 20 years project lifetime assumption has been made for LCOE Base Case, whereas the
projected project lifetime improvements in the medium term have been represented in the LCOE Low
case, reaching 22 years (IEA Wind Task 26, 2016).
A high Weighted Average Cost of Capital (WACC) value of 10.8% has been selected for the LCOE Base
Case to represent the present high financing costs for wind power projects in Vietnam. The estimate
has been based on data provided by GIZ, presented in Table 8.

41
Table 8: Assumptions used in the estimation of WACC for the LCOE Base Case. Data source: GIZ.
WACC component Value
Return on Debt (%) 10%
Return on Equity (%) 15%
Debt-Equity ratio 75 / 25
Effective corporate tax rate
(accounting for tax exemptions applicable)
5%
For the LCOE Low case, WACC of 7% has been selected to represent the global trends of decreasing
cost of financing of renewable power projects. As the wind industry develops in Vietnam, it is also to be
expected that the WACC rates would decrease and increasingly converge with the levels observed
internationally (e.g. roughly in line with the baseline values for global average cost of financing
reported in (IEA Wind Task 26, 2016)).
3.2 Infrastructure costs
Infrastructure cost will be applied in the LCOE analysis in combination with the infrastructure
proximity (closest point from the cluster centroid to the transmission grid and to main roads,
respectively) information per cluster obtained in the GIS analysis. Table 9 presents the infrastructure
element cost assumptions used in the analysis, based on data from Ministry of Construction of Vietnam
Decision No. 1161/QĐ-BXD, dated 15/10/2015.
Table 9: Infrastructure cost components used in the analysis. Data provided by GIZ
ID Infrastructure element Price range:
Average Price range:
Low Price range:
High Unit
110kVsc 110 kV line, single circuit 50,000 45,000 55,000 USD/km
110kVdc 110 kV line, double circuit 87,500 75,000 100,000 USD/km
220kVdc 220 kV line, double circuit 385,000 360,000 410,000 USD/km
ss110kV Substation 110 kV 2,100,000 1,700,000 2,500,000 USD
ss220kV Substation 220 kV 8,000,000 7,000,000 9,000,000 USD
RGpt Road, gravel, plain terrain 185,000 170,000 200,000 USD/km
RGmt Road, gravel, mountains 220,000 210,000 230,000 USD/km
RPpt Road, paved, plain terrain 370,000 350,000 390,000 USD/km

42
RPmt Road, paved, mountains 445,000 430,000 460,000 USD/km
Table 10 provides an overview of the approach used in allocating the different infrastructure elements
and their associated costs to the wind power clusters depending on the size of the cluster (expressed in
capacity in MW).
Table 10: Infrastructure element and cost range assumptions used based on project size ranges
Size range (MW)
From To Connection type Substation Road type Price range
0 10 110kVsc ss110kV RGpt Low
11 50 110kVsc ss110kV RGpt Low
51 100 110kVsc ss110kV RPpt Average
101 150 110kVdc ss110kV RPpt High
151 300 220kVdc ss220kV RPpt Low
(Road High)
301 450 220kVdc ss220kV RPpt Average
(Road High)
451 600 220kVdc ss220kV RPpt High
Based on the data and cost assignment approach illustrated above, a parameter variation has been
carried out to assess the infrastructure cost impact on the project costs (as an on-cost to the plant
CapEx), depending on the project size and infrastructure proximity. Table 11 provides examples of the
parameter variation analysis (please see a more comprehensive overview in Appendix II -
Infrastructure cost variation depending on project size and infrastructure proximity).
Table 11: Infrastructure cost variation (as an on-cost to plant CapEx) depending on project size and infrastructure proximity
Project size (MW)
Distance to road
(km)
Distance to grid (km)
Road on-cost (on plant
CapEx)
Grid on-cost
(on plant CapEx)
Combined infrastructure on-
cost (on plant CapEx)
10 10 10 9% 11% 21%
30 10 10 3% 4% 7%
100 10 10 2% 1% 3%
300 10 10 1% 2% 3%
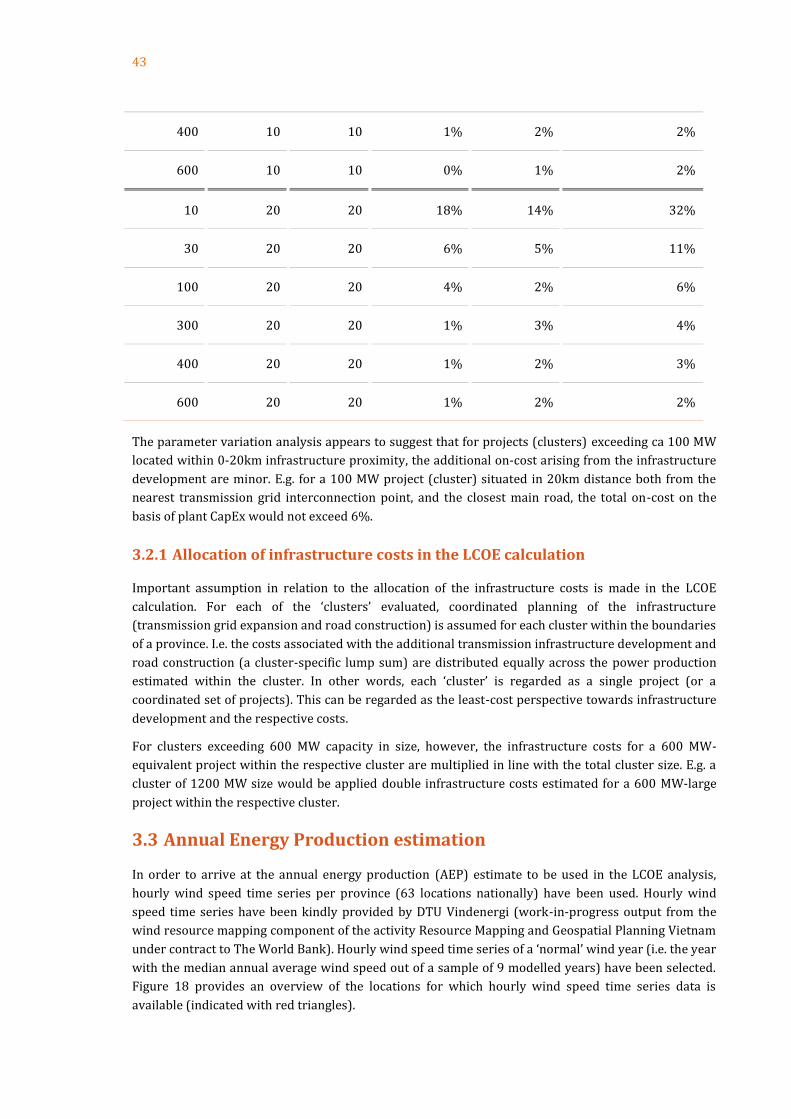
43
400 10 10 1% 2% 2%
600 10 10 0% 1% 2%
10 20 20 18% 14% 32%
30 20 20 6% 5% 11%
100 20 20 4% 2% 6%
300 20 20 1% 3% 4%
400 20 20 1% 2% 3%
600 20 20 1% 2% 2%
The parameter variation analysis appears to suggest that for projects (clusters) exceeding ca 100 MW
located within 0-20km infrastructure proximity, the additional on-cost arising from the infrastructure
development are minor. E.g. for a 100 MW project (cluster) situated in 20km distance both from the
nearest transmission grid interconnection point, and the closest main road, the total on-cost on the
basis of plant CapEx would not exceed 6%.
3.2.1 Allocation of infrastructure costs in the LCOE calculation
Important assumption in relation to the allocation of the infrastructure costs is made in the LCOE
calculation. For each of the ‘clusters’ evaluated, coordinated planning of the infrastructure
(transmission grid expansion and road construction) is assumed for each cluster within the boundaries
of a province. I.e. the costs associated with the additional transmission infrastructure development and
road construction (a cluster-specific lump sum) are distributed equally across the power production
estimated within the cluster. In other words, each ‘cluster’ is regarded as a single project (or a
coordinated set of projects). This can be regarded as the least-cost perspective towards infrastructure
development and the respective costs.
For clusters exceeding 600 MW capacity in size, however, the infrastructure costs for a 600 MW-
equivalent project within the respective cluster are multiplied in line with the total cluster size. E.g. a
cluster of 1200 MW size would be applied double infrastructure costs estimated for a 600 MW-large
project within the respective cluster.
3.3 Annual Energy Production estimation
In order to arrive at the annual energy production (AEP) estimate to be used in the LCOE analysis,
hourly wind speed time series per province (63 locations nationally) have been used. Hourly wind
speed time series have been kindly provided by DTU Vindenergi (work-in-progress output from the
wind resource mapping component of the activity Resource Mapping and Geospatial Planning Vietnam
under contract to The World Bank). Hourly wind speed time series of a ‘normal’ wind year (i.e. the year
with the median annual average wind speed out of a sample of 9 modelled years) have been selected.
Figure 18 provides an overview of the locations for which hourly wind speed time series data is
available (indicated with red triangles).

44
Figure 18: Modelled hourly wind speed time series locations nationally (indicated with red triangles). The underlying resource map is consistent with the ‘NTP 20km infrastructure
proximity’ scenario (used for illustration).
Figure 19 provides an illustrative example of the hourly wind speed time series per province used in
the analysis.
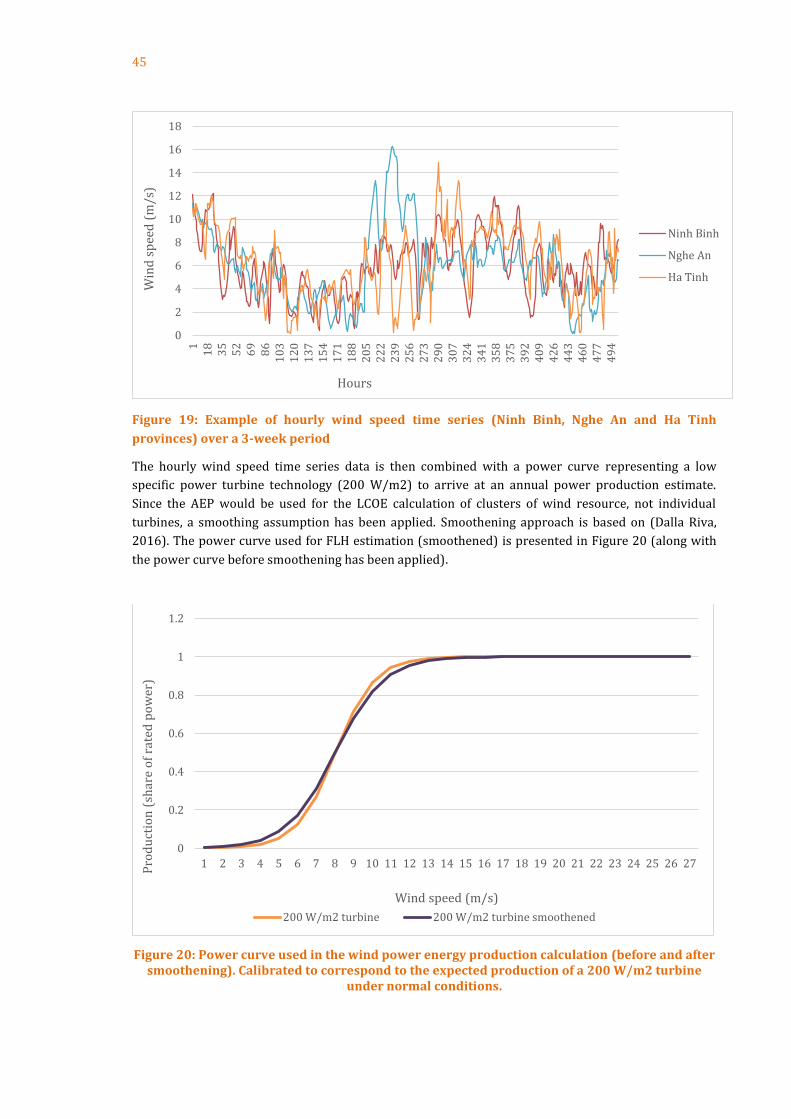
45
Figure 19: Example of hourly wind speed time series (Ninh Binh, Nghe An and Ha Tinh
provinces) over a 3-week period
The hourly wind speed time series data is then combined with a power curve representing a low
specific power turbine technology (200 W/m2) to arrive at an annual power production estimate.
Since the AEP would be used for the LCOE calculation of clusters of wind resource, not individual
turbines, a smoothing assumption has been applied. Smoothening approach is based on (Dalla Riva,
2016). The power curve used for FLH estimation (smoothened) is presented in Figure 20 (along with
the power curve before smoothening has been applied).
Figure 20: Power curve used in the wind power energy production calculation (before and after smoothening). Calibrated to correspond to the expected production of a 200 W/m2 turbine
under normal conditions.
0
2
4
6
8
10
12
14
16
18
11
83
55
26
98
61
03
12
01
37
15
41
71
18
82
05
22
22
39
25
62
73
29
03
07
32
43
41
35
83
75
39
24
09
42
64
43
46
04
77
49
4
Win
d s
pee
d (
m/s
)
Hours
Ninh Binh
Nghe An
Ha Tinh
0
0.2
0.4
0.6
0.8
1
1.2
1 2 3 4 5 6 7 8 9 10 11 12 13 14 15 16 17 18 19 20 21 22 23 24 25 26 27Pro
du
ctio
n (
shar
e o
f ra
ted
po
wer
)
Wind speed (m/s)
200 W/m2 turbine 200 W/m2 turbine smoothened
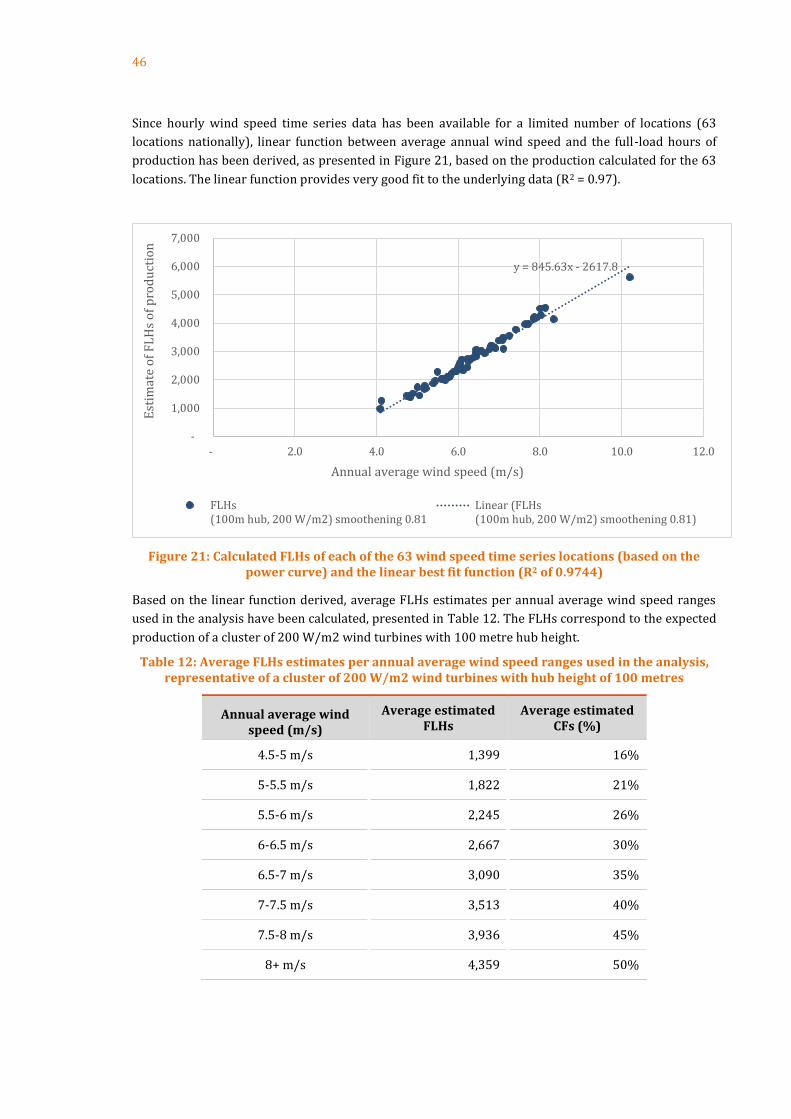
46
Since hourly wind speed time series data has been available for a limited number of locations (63
locations nationally), linear function between average annual wind speed and the full-load hours of
production has been derived, as presented in Figure 21, based on the production calculated for the 63
locations. The linear function provides very good fit to the underlying data (R2 = 0.97).
Figure 21: Calculated FLHs of each of the 63 wind speed time series locations (based on the power curve) and the linear best fit function (R2 of 0.9744)
Based on the linear function derived, average FLHs estimates per annual average wind speed ranges
used in the analysis have been calculated, presented in Table 12. The FLHs correspond to the expected
production of a cluster of 200 W/m2 wind turbines with 100 metre hub height.
Table 12: Average FLHs estimates per annual average wind speed ranges used in the analysis, representative of a cluster of 200 W/m2 wind turbines with hub height of 100 metres
Annual average wind speed (m/s)
Average estimated FLHs
Average estimated CFs (%)
4.5-5 m/s 1,399 16%
5-5.5 m/s 1,822 21%
5.5-6 m/s 2,245 26%
6-6.5 m/s 2,667 30%
6.5-7 m/s 3,090 35%
7-7.5 m/s 3,513 40%
7.5-8 m/s 3,936 45%
8+ m/s 4,359 50%
y = 845.63x - 2617.8
-
1,000
2,000
3,000
4,000
5,000
6,000
7,000
- 2.0 4.0 6.0 8.0 10.0 12.0
Est
imat
e o
f F
LH
s o
f p
rod
uct
ion
Annual average wind speed (m/s)
FLHs(100m hub, 200 W/m2) smoothening 0.81
Linear (FLHs(100m hub, 200 W/m2) smoothening 0.81)

47
04
Limitations
48
4. Limitations
The results of the present study are meant for top-level power system development planning purposes
on a regional level, and are not to be used for individual RE project site selection. The analysis results
are subject to the accuracy of input data sources available.
4.1 Wind energy resources
Wind energy resource potential data used in the present study is based on meteorological modelling,
and not on-site measurements. The limitations stated for the DTU Global Wind Atlas wind resource
maps (used as input in the current study) include the following12:
No mesoscale modelling in Global Wind Atlas
o Mesoscale modelling captures variance both in space and time, missing from the
reanalyses
o Mesoscale modelling will increase accuracy of the atlas, by capturing features such as
gap flow, barrier jets, low level jets, and sea breezes better
o Mesoscale modelling set-up can be tailored to the country meteorological and
geographical settings
No verification of numerical wind atlas outputs
For the national analysis, proximity to transmission lines has only been based on the 220kV grid
because 110kV data was not available for the entire country and the cluster will connect to the
transmission lines. In addition, only the existing transmission grid and road network infrastructure has
been considered and represented.
For the provincial analysis land use maps were provided by the local consultant and were used as such.
No information was provided regarding classification quality and mapping accuracy.
All areas listed under the World Database on Protected Areas (WDPA) for Viet Nam were excluded as
potential suitable land not considering the wide range of protected areas, including national protected
areas recognised by the government, areas designated under regional and international conventions,
privately protected areas and indigenous peoples’ and community conserved territories and areas.
Only primary roads were extracted from OpenStreetMap (OSM) and used in the national analysis,
because transportation of wind turbines requires large enough infrastructure. Moreover, the positional
accuracy of major roads is likely to be higher than of smaller transport infrastructure features. OSM is a
community mapping effort with varying data quality.
The LCOE analysis is only indicative of overall project costs, and does not reflect the specific conditions
of the individual cluster beyond the inputs used in the calculation. Similarly, LCOE Low case illustrates
one potential technology and cost development projection, and is subject to high degree of uncertainty.
E.g. further wind turbine technology cost reductions beyond the current projections would lower the
LCOE. Conversely, failure of the wind industry to develop in line with the projections might limit the
extent of capital cost and financing reductions, thereby increasing the LCOE Low case.
12 Full limitations description: http://globalwindatlas.com/index.html
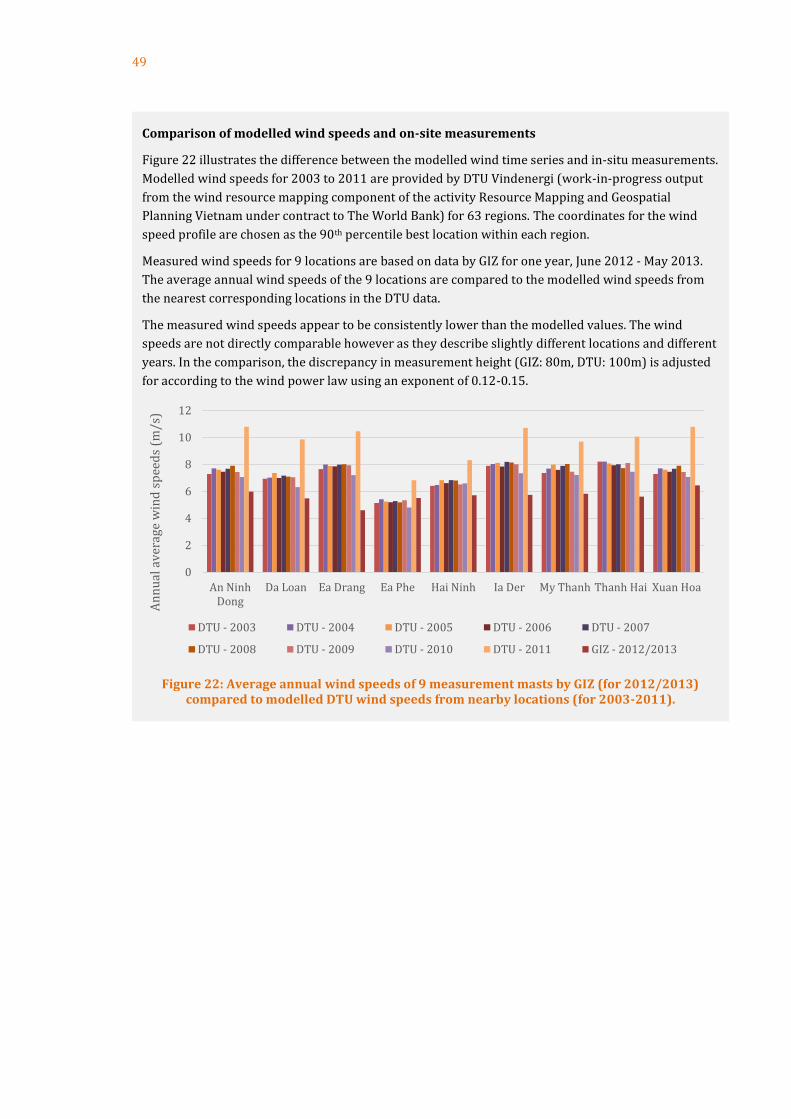
49
Comparison of modelled wind speeds and on-site measurements
Figure 22 illustrates the difference between the modelled wind time series and in-situ measurements.
Modelled wind speeds for 2003 to 2011 are provided by DTU Vindenergi (work-in-progress output
from the wind resource mapping component of the activity Resource Mapping and Geospatial
Planning Vietnam under contract to The World Bank) for 63 regions. The coordinates for the wind
speed profile are chosen as the 90th percentile best location within each region.
Measured wind speeds for 9 locations are based on data by GIZ for one year, June 2012 - May 2013.
The average annual wind speeds of the 9 locations are compared to the modelled wind speeds from
the nearest corresponding locations in the DTU data.
The measured wind speeds appear to be consistently lower than the modelled values. The wind
speeds are not directly comparable however as they describe slightly different locations and different
years. In the comparison, the discrepancy in measurement height (GIZ: 80m, DTU: 100m) is adjusted
for according to the wind power law using an exponent of 0.12-0.15.
Figure 22: Average annual wind speeds of 9 measurement masts by GIZ (for 2012/2013) compared to modelled DTU wind speeds from nearby locations (for 2003-2011).
0
2
4
6
8
10
12
An NinhDong
Da Loan Ea Drang Ea Phe Hai Ninh Ia Der My Thanh Thanh Hai Xuan Hoa
An
nu
al a
ver
age
win
d s
pee
ds
(m/s
)
DTU - 2003 DTU - 2004 DTU - 2005 DTU - 2006 DTU - 2007
DTU - 2008 DTU - 2009 DTU - 2010 DTU - 2011 GIZ - 2012/2013

50
05
Results
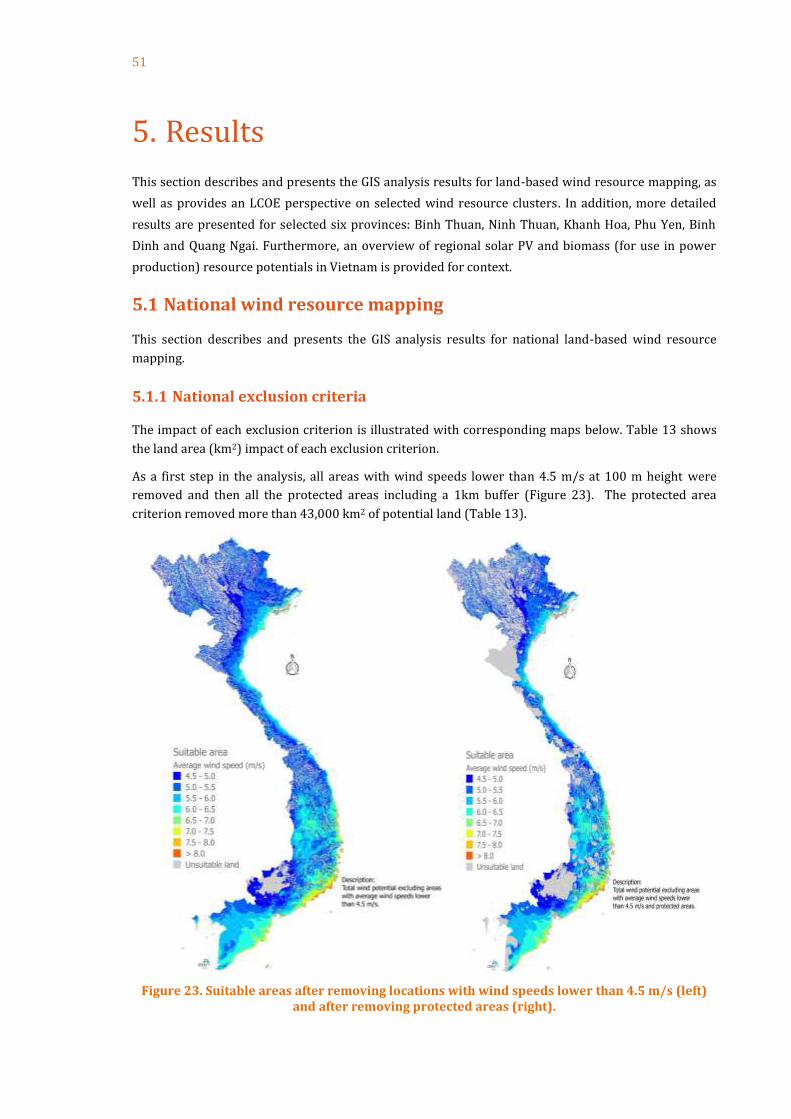
51
5. Results
This section describes and presents the GIS analysis results for land-based wind resource mapping, as
well as provides an LCOE perspective on selected wind resource clusters. In addition, more detailed
results are presented for selected six provinces: Binh Thuan, Ninh Thuan, Khanh Hoa, Phu Yen, Binh
Dinh and Quang Ngai. Furthermore, an overview of regional solar PV and biomass (for use in power
production) resource potentials in Vietnam is provided for context.
5.1 National wind resource mapping
This section describes and presents the GIS analysis results for national land-based wind resource
mapping.
5.1.1 National exclusion criteria
The impact of each exclusion criterion is illustrated with corresponding maps below. Table 13 shows
the land area (km2) impact of each exclusion criterion.
As a first step in the analysis, all areas with wind speeds lower than 4.5 m/s at 100 m height were
removed and then all the protected areas including a 1km buffer (Figure 23). The protected area
criterion removed more than 43,000 km2 of potential land (Table 13).
Figure 23. Suitable areas after removing locations with wind speeds lower than 4.5 m/s (left) and after removing protected areas (right).
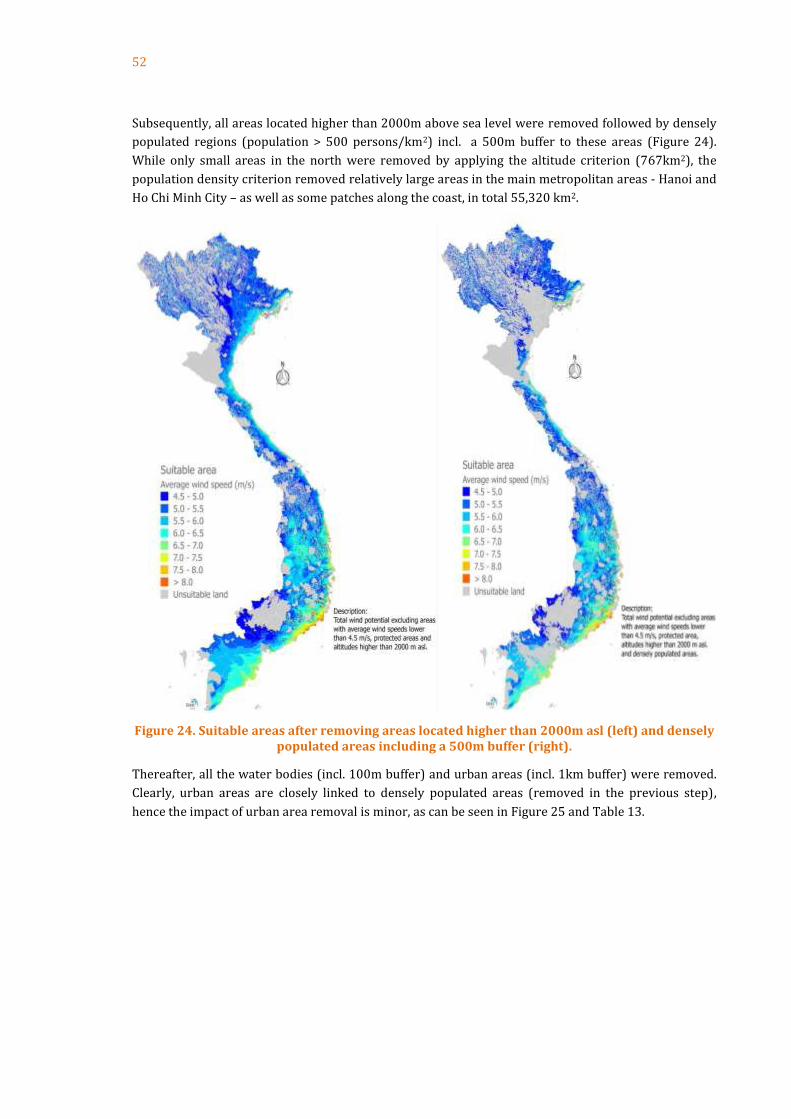
52
Subsequently, all areas located higher than 2000m above sea level were removed followed by densely
populated regions (population > 500 persons/km2) incl. a 500m buffer to these areas (Figure 24).
While only small areas in the north were removed by applying the altitude criterion (767km2), the
population density criterion removed relatively large areas in the main metropolitan areas - Hanoi and
Ho Chi Minh City – as well as some patches along the coast, in total 55,320 km2.
Figure 24. Suitable areas after removing areas located higher than 2000m asl (left) and densely populated areas including a 500m buffer (right).
Thereafter, all the water bodies (incl. 100m buffer) and urban areas (incl. 1km buffer) were removed.
Clearly, urban areas are closely linked to densely populated areas (removed in the previous step),
hence the impact of urban area removal is minor, as can be seen in Figure 25 and Table 13.

53
Figure 25. Suitable areas after removing water bodies including a 100m buffer (left) and urban
areas including a 1km buffer (right).
Then the land cover classes flooded trees (usually mangroves) and forests were removed from the
suitable area, both with an additional 100m buffer around all the forested polygons (Figure 26).
Especially in central Viet Nam the removal of forest areas had a significant impact. While the land cover
class flooded trees excluded 904km2, the forest areas removed 48,604km2 of potentially suitable land.

54
Figure 26. Suitable areas after removing flooded trees (left) and forests (right), both with a 100m buffer to the excluded area.
Then all areas with slopes > 30% and roads and railroads including 250m buffers were removed
(Figure 27).
Figure 27. Suitable areas after removing slopes > 30% (left) and roads and railroads including a 250 m buffer (right).

55
Finally, all areas within 100m distance to the coast were removed and the data layer was cleaned for
areas smaller than 1km2 to obtain the national technical potential Figure 28. (The NTP without
croplands is shown in Figure 29.)
Figure 28. National Technical Potential (NTP) for Viet Nam.
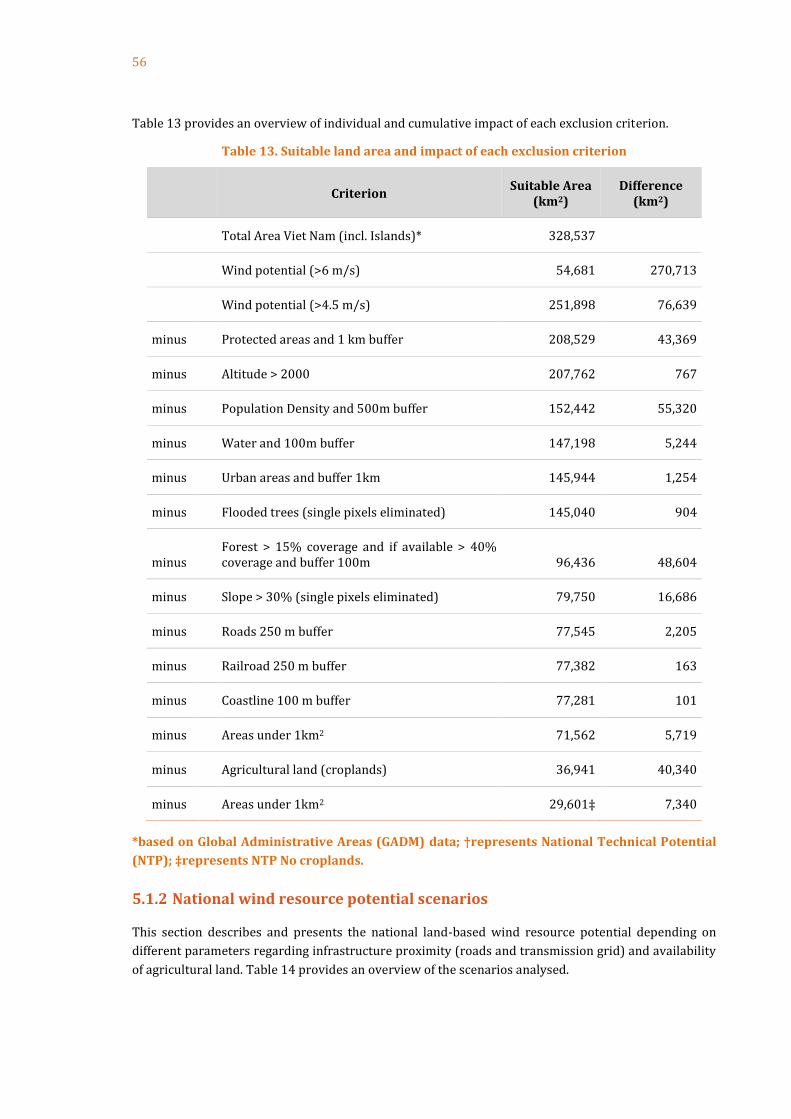
56
Table 13 provides an overview of individual and cumulative impact of each exclusion criterion.
Table 13. Suitable land area and impact of each exclusion criterion
Criterion
Suitable Area (km2)
Difference (km2)
Total Area Viet Nam (incl. Islands)* 328,537
Wind potential (>6 m/s) 54,681 270,713
Wind potential (>4.5 m/s) 251,898 76,639
minus Protected areas and 1 km buffer 208,529 43,369
minus Altitude > 2000 207,762 767
minus Population Density and 500m buffer 152,442 55,320
minus Water and 100m buffer 147,198 5,244
minus Urban areas and buffer 1km 145,944 1,254
minus Flooded trees (single pixels eliminated) 145,040 904
minus Forest > 15% coverage and if available > 40%
coverage and buffer 100m 96,436 48,604
minus Slope > 30% (single pixels eliminated) 79,750 16,686
minus Roads 250 m buffer 77,545 2,205
minus Railroad 250 m buffer 77,382 163
minus Coastline 100 m buffer 77,281 101
minus Areas under 1km2 71,562 5,719
minus Agricultural land (croplands) 36,941 40,340
minus Areas under 1km2 29,601‡ 7,340
*based on Global Administrative Areas (GADM) data; †represents National Technical Potential
(NTP); ‡represents NTP No croplands.
5.1.2 National wind resource potential scenarios
This section describes and presents the national land-based wind resource potential depending on
different parameters regarding infrastructure proximity (roads and transmission grid) and availability
of agricultural land. Table 14 provides an overview of the scenarios analysed.
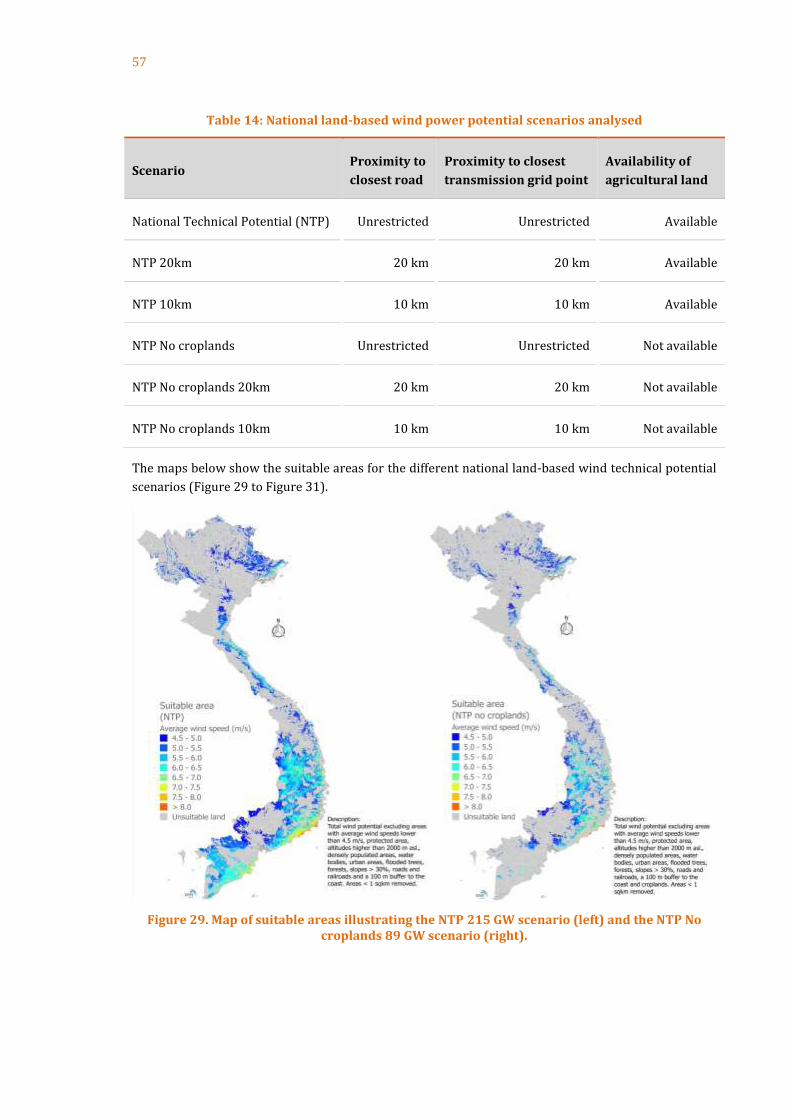
57
Table 14: National land-based wind power potential scenarios analysed
Scenario Proximity to
closest road
Proximity to closest
transmission grid point
Availability of
agricultural land
National Technical Potential (NTP) Unrestricted Unrestricted Available
NTP 20km 20 km 20 km Available
NTP 10km 10 km 10 km Available
NTP No croplands Unrestricted Unrestricted Not available
NTP No croplands 20km 20 km 20 km Not available
NTP No croplands 10km 10 km 10 km Not available
The maps below show the suitable areas for the different national land-based wind technical potential
scenarios (Figure 29 to Figure 31).
Figure 29. Map of suitable areas illustrating the NTP 215 GW scenario (left) and the NTP No croplands 89 GW scenario (right).
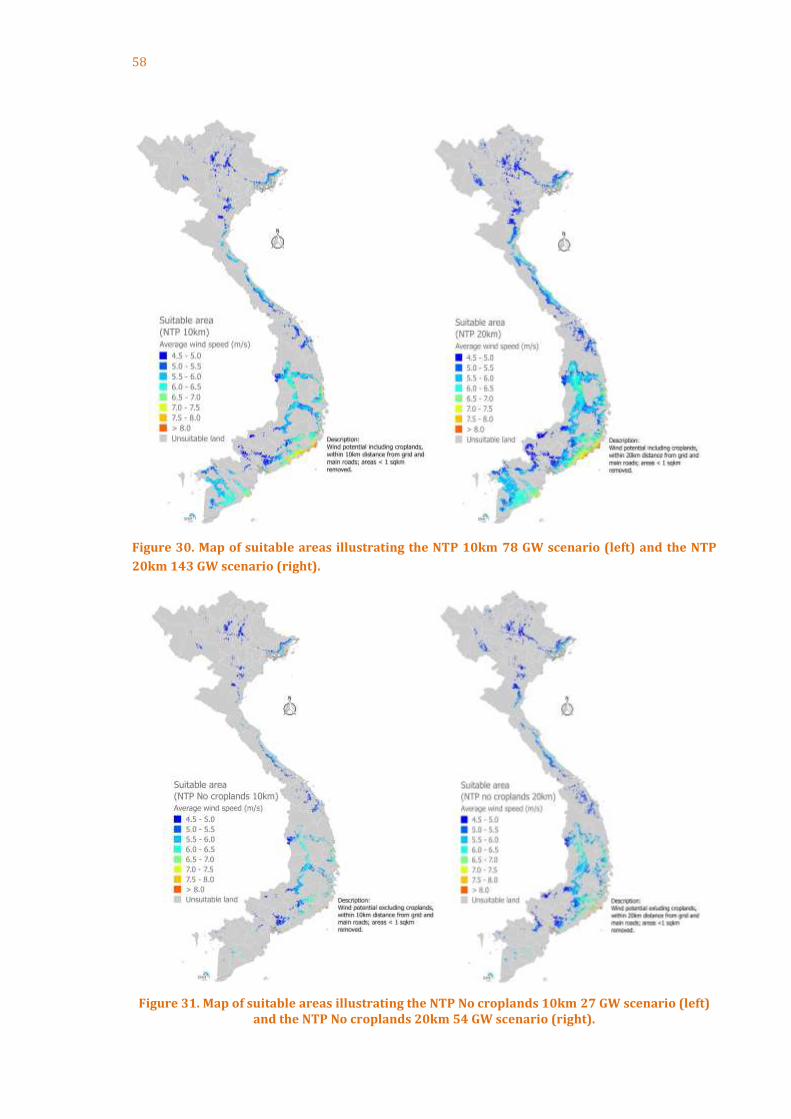
58
Figure 30. Map of suitable areas illustrating the NTP 10km 78 GW scenario (left) and the NTP
20km 143 GW scenario (right).
Figure 31. Map of suitable areas illustrating the NTP No croplands 10km 27 GW scenario (left) and the NTP No croplands 20km 54 GW scenario (right).

59
Table 15 provides an overview of the different national land-based wind technical potential scenarios
across regions and wind speed ranges, expressed in the available land area and the corresponding
wind power capacity in GW (obtained using wind power project footprint assumption of 3 MW/km2).
More detailed wind speed range overview is presented in the cluster analysis.
Table 15: National technical potential scenarios across regions and wind speed ranges (expressed in km2 and MW)
Technical potential land area (km2) Technical potential wind capacity (MW)
Wind speed range North Central South TOTAL North Central South TOTAL
National technical potential (NTP)
4.5 - 5.0 m/s 5,167 4,720 3,945 13,832 15,501 14,160 11,835 41,496
5.0 - 5.5 m/s 3,086 10,150 5,400 18,636 9,258 30,450 16,200 55,908
5.5 - 6.0 m/s 954 14,600 6,127 21,681 2,862 43,800 18,381 65,043
6.0 - 6.5 m/s 281 7,866 3,345 11,492 843 23,598 10,035 34,476
6.5 - 7.0 m/s 104 2,487 949 3,540 312 7,461 2,847 10,620
7.0 - 7.5 m/s 11 1,323 217 1,551 33 3,969 651 4,653
7.5 - 8.0 m/s 2 543 19 564 6 1,629 57 1,692
Over 8.0 m/s 1 264 0 265 3 792 - 795
TOTAL 9,606 41,953 20,002 71,561 28,818 125,859 60,006 214,683
TOTAL (6+ m/s) 399 12,483 4,530 17,412 1,197 37,449 13,590 52,236
NTP 20km infrastructure proximity
4.5 - 5.0 m/s 2,407 3,032 2,348 7,787 7,221 9,096 7,044 23,361
5.0 - 5.5 m/s 944 6,567 2,715 10,226 2,832 19,701 8,145 30,678
5.5 - 6.0 m/s 391 10,266 5,195 15,852 1,173 30,798 15,585 47,556
6.0 - 6.5 m/s 147 5,766 3,013 8,926 441 17,298 9,039 26,778
6.5 - 7.0 m/s 44 2,225 582 2,851 132 6,675 1,746 8,553
7.0 - 7.5 m/s 5 1,225 135 1,365 15 3,675 405 4,095
7.5 - 8.0 m/s 0 526 18 544 - 1,578 54 1,632
Over 8.0 m/s 0 255 0 255 - 765 - 765
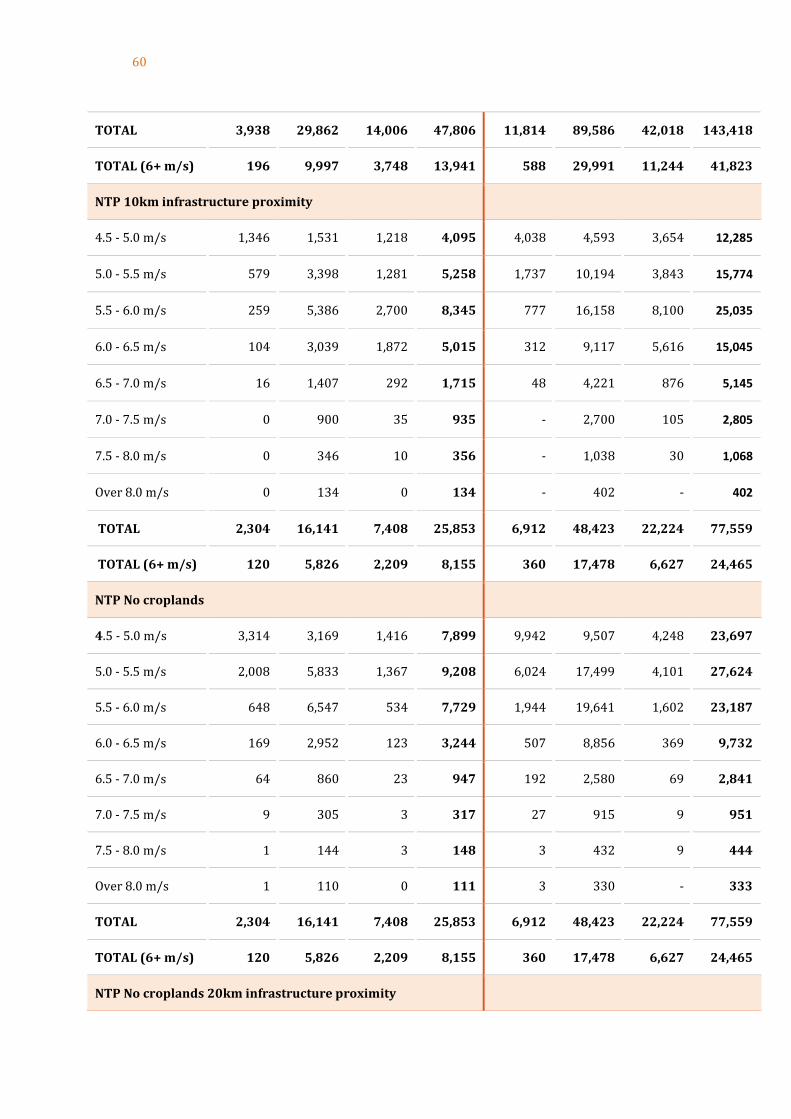
60
TOTAL 3,938 29,862 14,006 47,806 11,814 89,586 42,018 143,418
TOTAL (6+ m/s) 196 9,997 3,748 13,941 588 29,991 11,244 41,823
NTP 10km infrastructure proximity
4.5 - 5.0 m/s 1,346 1,531 1,218 4,095 4,038 4,593 3,654 12,285
5.0 - 5.5 m/s 579 3,398 1,281 5,258 1,737 10,194 3,843 15,774
5.5 - 6.0 m/s 259 5,386 2,700 8,345 777 16,158 8,100 25,035
6.0 - 6.5 m/s 104 3,039 1,872 5,015 312 9,117 5,616 15,045
6.5 - 7.0 m/s 16 1,407 292 1,715 48 4,221 876 5,145
7.0 - 7.5 m/s 0 900 35 935 - 2,700 105 2,805
7.5 - 8.0 m/s 0 346 10 356 - 1,038 30 1,068
Over 8.0 m/s 0 134 0 134 - 402 - 402
TOTAL 2,304 16,141 7,408 25,853 6,912 48,423 22,224 77,559
TOTAL (6+ m/s) 120 5,826 2,209 8,155 360 17,478 6,627 24,465
NTP No croplands
4.5 - 5.0 m/s 3,314 3,169 1,416 7,899 9,942 9,507 4,248 23,697
5.0 - 5.5 m/s 2,008 5,833 1,367 9,208 6,024 17,499 4,101 27,624
5.5 - 6.0 m/s 648 6,547 534 7,729 1,944 19,641 1,602 23,187
6.0 - 6.5 m/s 169 2,952 123 3,244 507 8,856 369 9,732
6.5 - 7.0 m/s 64 860 23 947 192 2,580 69 2,841
7.0 - 7.5 m/s 9 305 3 317 27 915 9 951
7.5 - 8.0 m/s 1 144 3 148 3 432 9 444
Over 8.0 m/s 1 110 0 111 3 330 - 333
TOTAL 2,304 16,141 7,408 25,853 6,912 48,423 22,224 77,559
TOTAL (6+ m/s) 120 5,826 2,209 8,155 360 17,478 6,627 24,465
NTP No croplands 20km infrastructure proximity
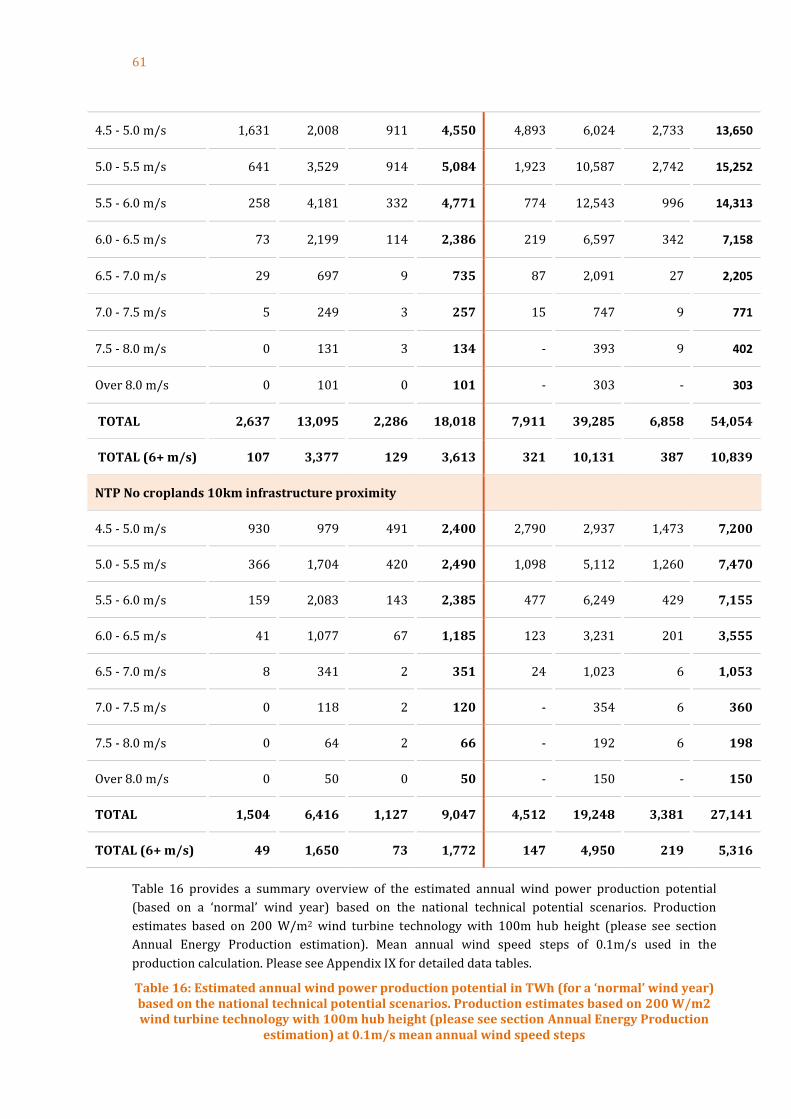
61
4.5 - 5.0 m/s 1,631 2,008 911 4,550 4,893 6,024 2,733 13,650
5.0 - 5.5 m/s 641 3,529 914 5,084 1,923 10,587 2,742 15,252
5.5 - 6.0 m/s 258 4,181 332 4,771 774 12,543 996 14,313
6.0 - 6.5 m/s 73 2,199 114 2,386 219 6,597 342 7,158
6.5 - 7.0 m/s 29 697 9 735 87 2,091 27 2,205
7.0 - 7.5 m/s 5 249 3 257 15 747 9 771
7.5 - 8.0 m/s 0 131 3 134 - 393 9 402
Over 8.0 m/s 0 101 0 101 - 303 - 303
TOTAL 2,637 13,095 2,286 18,018 7,911 39,285 6,858 54,054
TOTAL (6+ m/s) 107 3,377 129 3,613 321 10,131 387 10,839
NTP No croplands 10km infrastructure proximity
4.5 - 5.0 m/s 930 979 491 2,400 2,790 2,937 1,473 7,200
5.0 - 5.5 m/s 366 1,704 420 2,490 1,098 5,112 1,260 7,470
5.5 - 6.0 m/s 159 2,083 143 2,385 477 6,249 429 7,155
6.0 - 6.5 m/s 41 1,077 67 1,185 123 3,231 201 3,555
6.5 - 7.0 m/s 8 341 2 351 24 1,023 6 1,053
7.0 - 7.5 m/s 0 118 2 120 - 354 6 360
7.5 - 8.0 m/s 0 64 2 66 - 192 6 198
Over 8.0 m/s 0 50 0 50 - 150 - 150
TOTAL 1,504 6,416 1,127 9,047 4,512 19,248 3,381 27,141
TOTAL (6+ m/s) 49 1,650 73 1,772 147 4,950 219 5,316
Table 16 provides a summary overview of the estimated annual wind power production potential
(based on a ‘normal’ wind year) based on the national technical potential scenarios. Production
estimates based on 200 W/m2 wind turbine technology with 100m hub height (please see section
Annual Energy Production estimation). Mean annual wind speed steps of 0.1m/s used in the
production calculation. Please see Appendix IX for detailed data tables.
Table 16: Estimated annual wind power production potential in TWh (for a ‘normal’ wind year) based on the national technical potential scenarios. Production estimates based on 200 W/m2 wind turbine technology with 100m hub height (please see section Annual Energy Production
estimation) at 0.1m/s mean annual wind speed steps
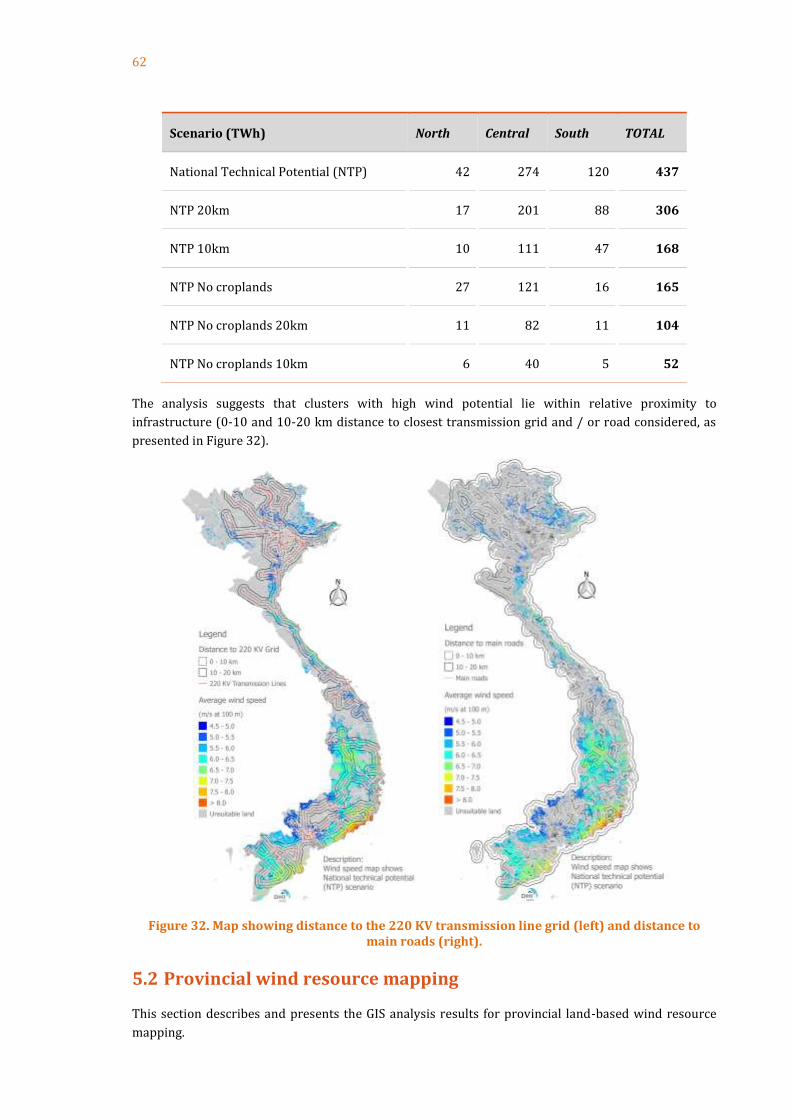
62
Scenario (TWh) North Central South TOTAL
National Technical Potential (NTP) 42 274 120 437
NTP 20km 17 201 88 306
NTP 10km 10 111 47 168
NTP No croplands 27 121 16 165
NTP No croplands 20km 11 82 11 104
NTP No croplands 10km 6 40 5 52
The analysis suggests that clusters with high wind potential lie within relative proximity to
infrastructure (0-10 and 10-20 km distance to closest transmission grid and / or road considered, as
presented in Figure 32).
Figure 32. Map showing distance to the 220 KV transmission line grid (left) and distance to main roads (right).
5.2 Provincial wind resource mapping
This section describes and presents the GIS analysis results for provincial land-based wind resource
mapping.

63
5.2.1 Provincial exclusion criteria
The impact of each exclusion criterion is illustrated with corresponding maps below.
Basis for the provincial wind resource mapping was the wind potential from the national wind
resource mapping with the following exclusion criteria removed:
Wind speeds lower than 4.5m/s
Altitude higher than 2000m
Densely populated areas (> 500 persons/km2) including a 500m buffer
Protected areas including a 1km buffer
Areas within a 100m distance to the coast
The remaining areas are shown in Figure 33 – left. In Figure 33 – right, additional exclusion criteria
were applied:
Steep areas with slopes > 30% were removed
All the areas covering relevant land use classes (commercial, industrial and non-agricultural
land; national defense and religious land; residential and public land; special forest land;
transportation as well as water bodies) incl. buffers as described in Table 4.
Figure 33. Wind potential after removing areas with wind speeds lower than 4.5m/s, altitudes higher than 2000m, high population density, protected areas and areas close to the coast
(100m) (left), and finally after removing areas covering relevant land use classes as well as slope > 30% as defined in Table 4 (right).
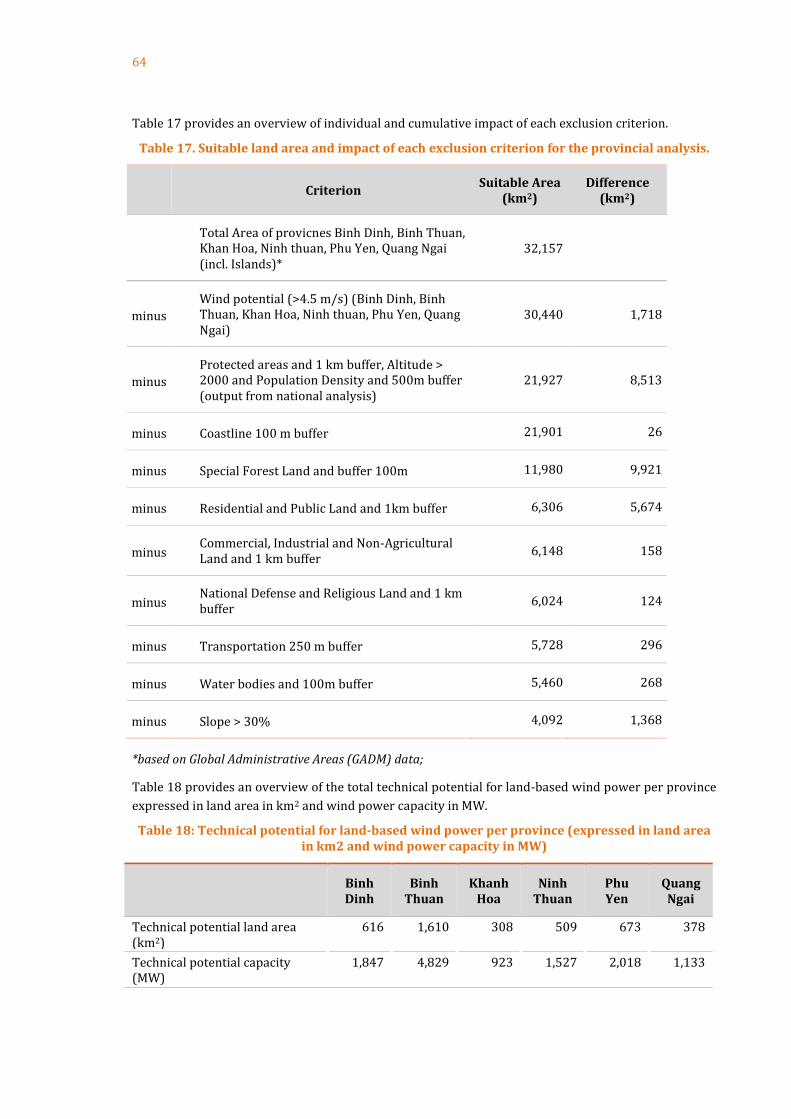
64
Table 17 provides an overview of individual and cumulative impact of each exclusion criterion.
Table 17. Suitable land area and impact of each exclusion criterion for the provincial analysis.
Criterion
Suitable Area (km2)
Difference (km2)
Total Area of provicnes Binh Dinh, Binh Thuan, Khan Hoa, Ninh thuan, Phu Yen, Quang Ngai (incl. Islands)*
32,157
minus Wind potential (>4.5 m/s) (Binh Dinh, Binh Thuan, Khan Hoa, Ninh thuan, Phu Yen, Quang Ngai)
30,440 1,718
minus Protected areas and 1 km buffer, Altitude > 2000 and Population Density and 500m buffer (output from national analysis)
21,927 8,513
minus Coastline 100 m buffer 21,901 26
minus Special Forest Land and buffer 100m 11,980 9,921
minus Residential and Public Land and 1km buffer 6,306 5,674
minus Commercial, Industrial and Non-Agricultural Land and 1 km buffer
6,148 158
minus National Defense and Religious Land and 1 km buffer
6,024 124
minus Transportation 250 m buffer 5,728 296
minus Water bodies and 100m buffer 5,460 268
minus Slope > 30% 4,092 1,368
*based on Global Administrative Areas (GADM) data;
Table 18 provides an overview of the total technical potential for land-based wind power per province
expressed in land area in km2 and wind power capacity in MW.
Table 18: Technical potential for land-based wind power per province (expressed in land area in km2 and wind power capacity in MW)
Binh Dinh
Binh Thuan
Khanh Hoa
Ninh Thuan
Phu Yen
Quang Ngai
Technical potential land area (km2)
616 1,610 308 509 673 378
Technical potential capacity (MW)
1,847 4,829 923 1,527 2,018 1,133

65
Figure 34 and Figure 35 present the distribution of the wind resource (expressed as average annual
wind speed ranges) within the technical potential land area and capacity. (Please see Appendix VII for
the data tables.)
Figure 34: Wind technical potential overview per province (land area in km2), across average annual wind speed ranges.
Figure 35: Wind technical potential overview per province (wind power capacity in MW), across average annual wind speed ranges.
In absolute terms, Ninh Thuan and Binh Thuan provinces appear to be endowed with the largest areas
/ highest capacity potential of wind sites reaching 7 and 8 m/s annual average wind speeds at 100m
height.
5.3 LCOE perspective
This section presents an LCOE perspective of selected clusters of wind resource in Vietnam nationally,
and within selected provinces.
0
50
100
150
200
250
300
350
400
450
500
Binh Dinh Binh Thuan Khanh Hoa Ninh Thuan Phu Yen Quang Ngai
Lan
d a
re (
km
2)
Sum of 4.5-5 m/s
Sum of 5-5.5 m/s
Sum of 5.5-6 m/s
Sum of 6-6.5 m/s
Sum of 6.5-7 m/s
Sum of 7-7.5 m/s
Sum of 7.5-8 m/s
Sum of 8+ m/s
0
200
400
600
800
1000
1200
1400
1600
Binh Dinh Binh Thuan Khanh Hoa Ninh Thuan Phu Yen Quang Ngai
Cap
acit
y (
MW
)
Sum of 4.5-5 m/s
Sum of 5-5.5 m/s
Sum of 5.5-6 m/s
Sum of 6-6.5 m/s
Sum of 6.5-7 m/s
Sum of 7-7.5 m/s
Sum of 7.5-8 m/s
Sum of 8+ m/s

66
5.3.1 Cluster analysis – national level
Areas characterised by significant proportion of adjacent above-average wind resource cells have been
selected and grouped into ‘clusters’. The largest areas matching the characteristics that were spanning
across several provinces have though been split into clusters such that each cluster belongs to a single
province. Figure 36 provides an overview of the clusters selected, as well as the average annual wind
speeds for each cluster.
Figure 36. Location, size and wind potential of selected clusters. Selection was based on wind speeds and cluster size.

67
Table 19 provides an overview of the individual clusters and the total area of each cluster.
Table 19: Overview of the clusters selected and their total area in km2 and capacity (MW)
Cluster ID Province Total area
(km2) Capacity
(MW)
CL9 Bac Lieu 1,097 3,292
CL10 Ben Tre 211 632
CL5 Dak Lak 1,667 5,001
CL6 Dak Lak 2,356 7,069
CL5 Gia Lai 5,814 17,442
CL7 Gia Lai 1,029 3,086
CL2 Ha Tinh 256 767
CL9 Hau Giang 760 2,281
CL4 Kon Tum 1,000 3,001
CL8 Lam Dong 2,203 6,608
CL3 Quang Binh 192 575
CL1 Quang Ninh 556 1,668
CL3 Quang Tri 299 898
CL9 Soc Trang 1,918 5,754
CL3 Thua Thien - Hue 19 58
CL10 Tien Giang 23 68
CL9 Tra Vinh 941 2,823
TOTAL 20,341 61,023
Figure 37 and Figure 38 present the distribution of the wind resource (expressed as average annual
wind speed ranges) within the technical potential capacity in each cluster. (Large and smaller clusters
are presented separately for ease of overview.) (Please see Appendix III for the data tables detailing
the capacity and land area.)
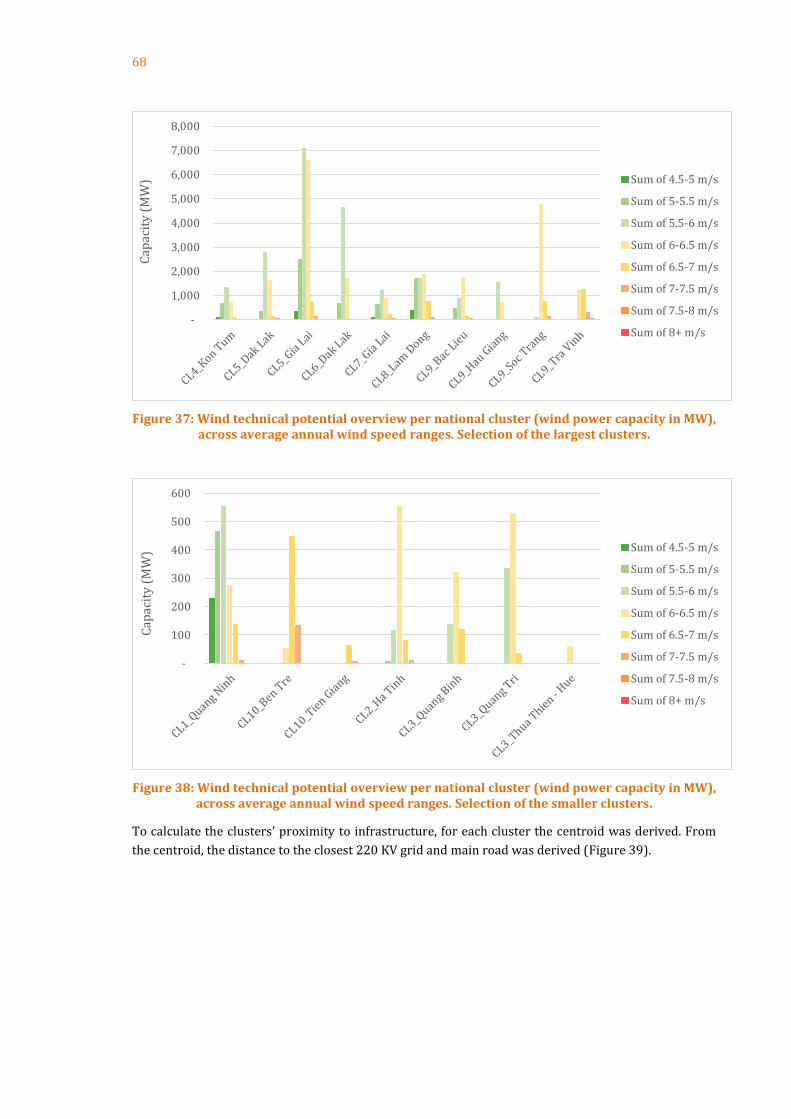
68
Figure 37: Wind technical potential overview per national cluster (wind power capacity in MW), across average annual wind speed ranges. Selection of the largest clusters.
Figure 38: Wind technical potential overview per national cluster (wind power capacity in MW), across average annual wind speed ranges. Selection of the smaller clusters.
To calculate the clusters’ proximity to infrastructure, for each cluster the centroid was derived. From
the centroid, the distance to the closest 220 KV grid and main road was derived (Figure 39).
-
1,000
2,000
3,000
4,000
5,000
6,000
7,000
8,000
Cap
acit
y (
MW
) Sum of 4.5-5 m/s
Sum of 5-5.5 m/s
Sum of 5.5-6 m/s
Sum of 6-6.5 m/s
Sum of 6.5-7 m/s
Sum of 7-7.5 m/s
Sum of 7.5-8 m/s
Sum of 8+ m/s
-
100
200
300
400
500
600
Cap
acit
y (
MW
) Sum of 4.5-5 m/s
Sum of 5-5.5 m/s
Sum of 5.5-6 m/s
Sum of 6-6.5 m/s
Sum of 6.5-7 m/s
Sum of 7-7.5 m/s
Sum of 7.5-8 m/s
Sum of 8+ m/s
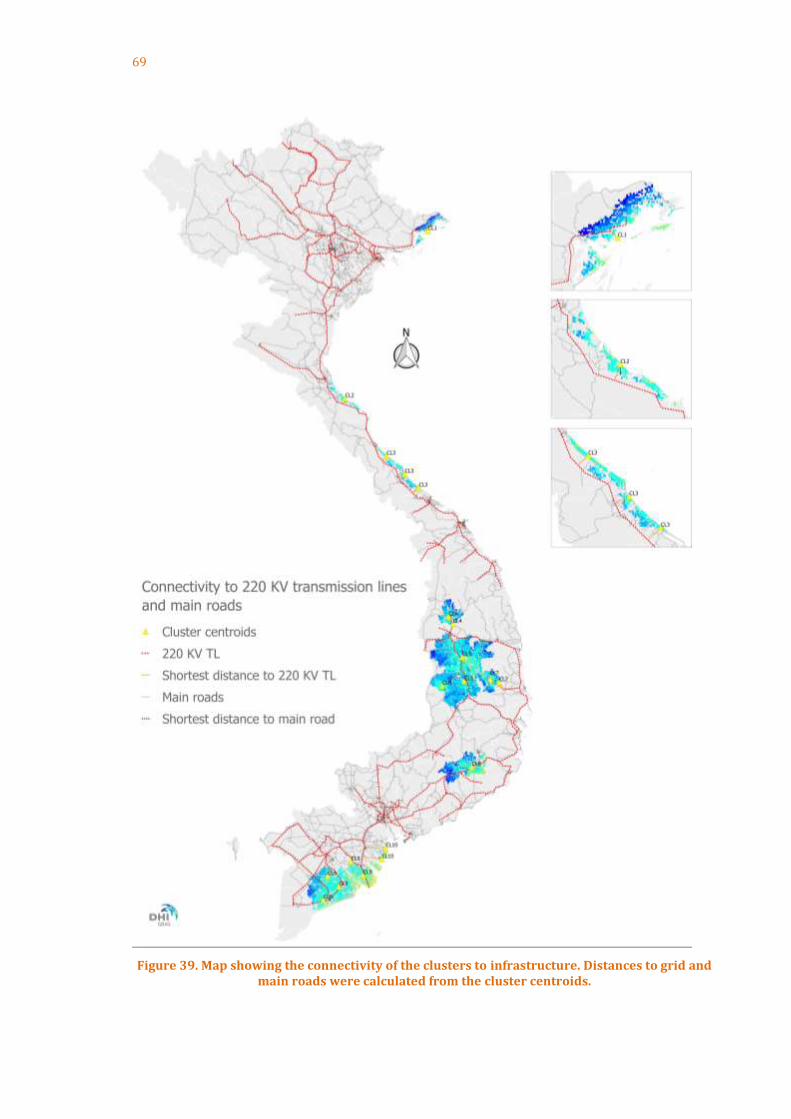
69
Figure 39. Map showing the connectivity of the clusters to infrastructure. Distances to grid and main roads were calculated from the cluster centroids.

70
Table 20 provides an overview of infrastructure proximity (220 kV grid and road) to the centroid of
each cluster.
Table 20: Overview of infrastructure proximity (220 kV grid and road) to the centroid of each cluster.
* Distance calculated based on the centroid of core cluster with highest wind speeds.
Cluster ID Province Distance to closest 220 kV grid point (km)*
Distance to closest road (km)*
CL9 Bac Lieu 3.0 4.0
CL10 Ben Tre 38.5 5.8
CL5 Dak Lak 5.1 2.4
CL6 Dak Lak 47.6 12.7
CL5 Gia Lai 3.5 2.9
CL7 Gia Lai 33.2 3.5
CL2 Ha Tinh 11.2 6.7
CL9 Hau Giang 17.4 2.4
CL4 Kon Tum 4.5 1.1
CL8 Lam Dong 1.5 5.5
CL3 Quang Binh 12.2 1.3
CL1 Quang Ninh 6.8 5.9
CL3 Quang Tri 13.8 0.4
CL9 Soc Trang 3.2 3.0
CL3 Thua Thien - Hue 15.7 0.4
CL10 Tien Giang 41.3 0.0
CL9 Tra Vinh 2.8 1.4
The infrastructure proximity data obtained from the GIS analysis suggests that the average distance
from the cluster centroid to the closest major road is ca 3km (longest distance being 12.7km for CL5 in
Dak Lak province). The average corresponding distance to the closest 220kV grid point is 15km
(longest distance being 47 km for CL6 in Dak Lak province). Overall, the infrastructure proximity for
the selected clusters can be assessed as non-prohibitive. For context, the threshold for grid connection
proximity used in IRENA analysis in relation to wind power projects in Latin America has been set at
75 km (IRENA, 2016).

71
Appendix V provides detailed LCOE Base Case and LCOE Low values calculations based on the
inputs described in section LCOE analysis data sources and inputs (including the full-load hours
of productions estimates as a function of average annual wind speed ranges in each cluster), as
well as the infrastructure proximity estimates derived as per above.
The LCOE Base Case and LCOE Low values are presented in Figure 40 and Figure 41.
Figure 40: LCOE overview per cluster (LCOE Base Case and LCOE Low) across average annual wind speed ranges. Selection of the largest clusters.
Figure 41: LCOE overview per cluster (LCOE Base Case and LCOE Low) across average annual wind speed ranges. Selection of the smaller clusters.
-
5
10
15
20
25
LC
OE
Bas
e ca
se
LC
OE
Lo
w
LC
OE
Bas
e ca
se
LC
OE
Lo
w
LC
OE
Bas
e ca
se
LC
OE
Lo
w
LC
OE
Bas
e ca
se
LC
OE
Lo
w
LC
OE
Bas
e ca
se
LC
OE
Lo
w
LC
OE
Bas
e ca
se
LC
OE
Lo
w
LC
OE
Bas
e ca
se
LC
OE
Lo
w
LC
OE
Bas
e ca
se
LC
OE
Lo
w
LC
OE
Bas
e ca
se
LC
OE
Lo
w
LC
OE
Bas
e ca
se
LC
OE
Lo
w
CL4_KonTum
CL5_DakLak
CL5_GiaLai
CL6_DakLak
CL7_GiaLai
CL8_LamDong
CL9_BacLieu
CL9_HauGiang
CL9_SocTrang
CL9_TraVinh
LC
OE
(U
SD c
ents
/ k
Wh
)
Sum of 4.5-5 m/s Sum of 5-5.5 m/s Sum of 5.5-6 m/s Sum of 6-6.5 m/s
Sum of 6.5-7 m/s Sum of 7-7.5 m/s Sum of 7.5-8 m/s Sum of 8+ m/s
-
5
10
15
20
25
LCOEBasecase
LCOELow
LCOEBasecase
LCOELow
LCOEBasecase
LCOELow
LCOEBasecase
LCOELow
LCOEBasecase
LCOELow
LCOEBasecase
LCOELow
LCOEBasecase
LCOELow
CL1_QuangNinh
CL10_BenTre
CL10_TienGiang
CL2_Ha Tinh CL3_QuangBinh
CL3_QuangTri
CL3_ThuaThien - Hue
LC
OE
(U
SD c
ents
/ k
Wh
)
Sum of 4.5-5 m/s Sum of 5-5.5 m/s Sum of 5.5-6 m/s Sum of 6-6.5 m/s
Sum of 6.5-7 m/s Sum of 7-7.5 m/s Sum of 7.5-8 m/s Sum of 8+ m/s

72
The LCOE Base Case analysis suggests good locations could be developed at LCOE range of ca 8.1 – 10.7
$ct/kWh (mean annual wind speeds of 6 - 7.5m/s at 100m height). In addition, limited ‘best’ locations
could be developed down to under 7 $ct/kWh (mean annual wind speed over 7.5 m/s). The LCOE
increases progressively along with decreasing wind resource quality, the 4.5-5 m/s mean annual wind
speed locations reaching 20.4 $ct/kWh. (The LCOE levels have though been estimated assuming
infrastructure cost sharing across the entire cluster, please see Allocation of infrastructure costs in the
LCOE calculation section for a description of the approach used).
The results also indicate that the impact of the infrastructure on-costs is minimal, at least on the entire
cluster level (it should be noted that some of the clusters are very considerable in capacity size; please
see Allocation of infrastructure costs in the LCOE calculation section for a description of the approach
used). The highest CapEx on-cost related to additional infrastructure development (yet only reaching
3.3%) has been estimated for the relatively smaller CL10 cluster of 68 MW in Tien Giang province.
The LCOE Low case analysis suggests that more favourable project development and technology
conditions (e.g. in the medium term) could yield significant LCOE reductions, and the absolute
reductions are most prominent for lower wind resource locations. LCOE Low is in the range of 4.2 – 6.9
$ct/kWh for locations with mean annual wind speed over 6 m/s, whereas locations with 4.5-5 m/s
mean annual wind speed yield an average of 13.1 $ct/kWh, a significant reduction from the 20.4
$ct/kWh in the LCOE Base Case.
Of course, it should be noted that the LCOE Base Case analysis is only indicative of overall project costs,
and does not reflect the specific conditions of the individual project (e.g. differences in
administrative/permitting and financing conditions of larger versus smaller projects). Similarly, LCOE
Low case illustrates one potential technology and cost development projection, and is subject to high
degree of uncertainty.
5.3.2 Cluster analysis – provincial level
Within the provincial analysis, areas characterised by significant proportion of adjacent above-average
wind resource cells have been similarly selected and grouped into ‘clusters’. Figure 42 provides an
overview of the first sample of clusters selected, as well as the average annual wind speeds within the
clusters.
Figure 42. Clusters close to 110 and 220 KV transmission lines and proximity to grid.
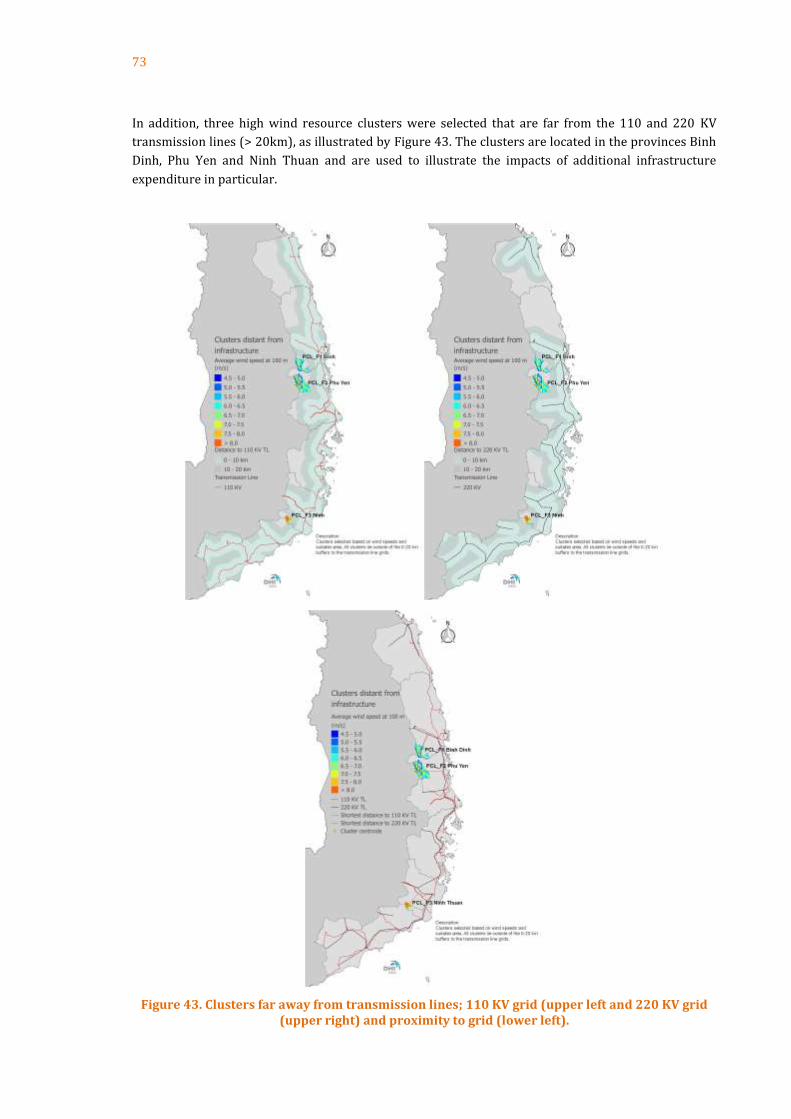
73
In addition, three high wind resource clusters were selected that are far from the 110 and 220 KV
transmission lines (> 20km), as illustrated by Figure 43. The clusters are located in the provinces Binh
Dinh, Phu Yen and Ninh Thuan and are used to illustrate the impacts of additional infrastructure
expenditure in particular.
Figure 43. Clusters far away from transmission lines; 110 KV grid (upper left and 220 KV grid (upper right) and proximity to grid (lower left).

74
For each cluster, the centroid was calculated from which the distance to the closest transmission line
was derived. Table 21 provides an overview of the individual clusters, the total area and capacity of
each cluster, as well as the infrastructure proximity.
Table 21: Overview of the clusters selected: their total area in km2, capacity (MW), and infrastructure proximity (220 kV / 110 kV grid and road) to the centroid of each cluster.
* Distance calculated based on the centroid of core cluster with highest wind speeds. ** Distance to 110kV grid point used (due to the size of the project suitable for the connection)
Cluster ID
Province Total area
(km2)
Capacity (MW)
Distance to closest 220 kV
grid point (km)*
Distance to closest 110 kV
grid point (km)*
Distance to closest
road (km)*
PCL1 Binh Thuan 339 1,017 10.8 9.3 3.6
PCL2 Ninh Thuan 285 855 17.5 13.7 7.3
PCL3 Khanh Hoa 56 168 7.7 7.3 0.3
PCL4 Khanh Hoa** 18 54 1.8 4.1 4.4
PCL5 Phu Yen 105 315 20.6 15.4 5.9
PCL6 Binh Dinh** 27 81 15.4 14.6 0.6
PCL7 Quang Ngai** 25 75 27.8 3.6 4.0
PCL_F1 Binh Dinh 138 414 25.9 29.7 9.8
PCL_F2 Phu Yen 220 660 32.1 32.1 6.7
PCL_F3 Ninh Thuan** 40 120 28.2 22.6 9.1
The infrastructure proximity data obtained from the GIS analysis suggests that the average distance
from the cluster centroid to the closest major road is ca 5.2km (average of 3.7km for the less remote
clusters, i.e. clusters denoted with ID of PCL). The longest distance from road for any cluster is 9.8km
for PCL_F1 in Binh Dinh province. The average corresponding distance to the closest 220kV grid point
is 18.8km (average of 14.5km for the less remote clusters). The longest distance to 220kV transmission
grid point is 32.1km for PCL_F2 cluster in Phu Yen province. The proximity to 110kV infrastructure is
close to that of 220kV (with the exception of e.g. PCL7 cluster in Quang Ngai province).
Overall, the infrastructure proximity for the selected provincial clusters can also be assessed as non-
prohibitive. For context, the threshold for grid connection proximity used in IRENA analysis in relation
to wind power projects in Latin America has been set at 75 km (IRENA, 2016).
Figure 44 presents the distribution of the wind resource (expressed as average annual wind speed
ranges) within the technical potential capacity in each provincial cluster. Please see Appendix IV for
the data tables detailing the capacity and land area.)
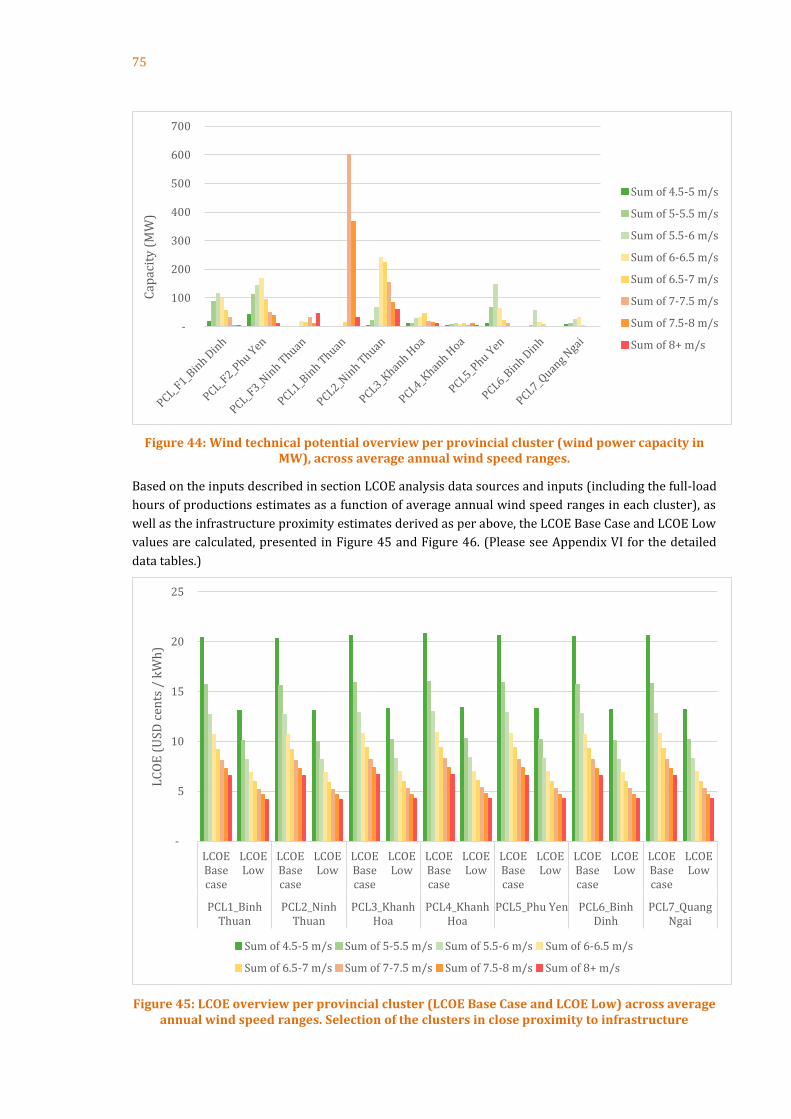
75
Figure 44: Wind technical potential overview per provincial cluster (wind power capacity in MW), across average annual wind speed ranges.
Based on the inputs described in section LCOE analysis data sources and inputs (including the full-load
hours of productions estimates as a function of average annual wind speed ranges in each cluster), as
well as the infrastructure proximity estimates derived as per above, the LCOE Base Case and LCOE Low
values are calculated, presented in Figure 45 and Figure 46. (Please see Appendix VI for the detailed
data tables.)
Figure 45: LCOE overview per provincial cluster (LCOE Base Case and LCOE Low) across average annual wind speed ranges. Selection of the clusters in close proximity to infrastructure
-
100
200
300
400
500
600
700
Cap
acit
y (
MW
)
Sum of 4.5-5 m/s
Sum of 5-5.5 m/s
Sum of 5.5-6 m/s
Sum of 6-6.5 m/s
Sum of 6.5-7 m/s
Sum of 7-7.5 m/s
Sum of 7.5-8 m/s
Sum of 8+ m/s
-
5
10
15
20
25
LCOEBasecase
LCOELow
LCOEBasecase
LCOELow
LCOEBasecase
LCOELow
LCOEBasecase
LCOELow
LCOEBasecase
LCOELow
LCOEBasecase
LCOELow
LCOEBasecase
LCOELow
PCL1_BinhThuan
PCL2_NinhThuan
PCL3_KhanhHoa
PCL4_KhanhHoa
PCL5_Phu Yen PCL6_BinhDinh
PCL7_QuangNgai
LC
OE
(U
SD c
ents
/ k
Wh
)
Sum of 4.5-5 m/s Sum of 5-5.5 m/s Sum of 5.5-6 m/s Sum of 6-6.5 m/s
Sum of 6.5-7 m/s Sum of 7-7.5 m/s Sum of 7.5-8 m/s Sum of 8+ m/s

76
Figure 46: LCOE overview per provincial cluster (LCOE Base Case and LCOE Low) across average
annual wind speed ranges. Selection of the clusters more remote from the infrastructure
The LCOE Base Case analysis suggests good locations could be developed at LCOE range of ca 8.2 – 10.8
$ct/kWh (mean annual wind speeds of 6 - 7.5m/s at 100m height). In addition, limited ‘best’ locations
could be developed down to under 7 $ct/kWh (mean annual wind speed over 7.5 m/s). The LCOE
increases progressively along with decreasing wind resource quality, the 4.5-5 m/s mean annual wind
speed locations reaching 20.6 $ct/kWh, also consistent with the findings for the national clusters. (The
LCOE levels have though been estimated assuming infrastructure cost sharing across the entire cluster,
please see Allocation of infrastructure costs in the LCOE calculation section for a description of the
approach used). The results also indicate that the impact of the infrastructure on-costs is minimal, at
least on the entire cluster level. This holds true even among the sub-sample of the three clusters more
remote from roads and transmission grid (denoted with PCL_F). The highest CapEx on-cost related to
additional infrastructure development, reaching 3.9% has been estimated for the smallest of the
clusters, namely PCL4 cluster of 54 MW in Khanh Hoa province. The results (based on the given sample
of clusters) also indicate that the size of the cluster exhibits higher impact on the infrastructure costs
than the infrastructure proximity per se.
The LCOE Low case analysis suggests that more favourable project development and technology
conditions (e.g. in the medium term) could yield significant LCOE reductions, and the absolute
reductions are most prominent for lower wind resource locations – perfectly in line with the findings
from the national clusters. LCOE Low is in the range of 4.2 – 6.9 $ct/kWh for locations with mean
annual wind speed over 6 m/s, whereas locations with 4.5-5 m/s mean annual wind speed yield an
average of 13.2 $ct/kWh, a significant reduction from the 20.6 $ct/kWh in the LCOE Base Case; also,
well in line with the national cluster analysis.
Of course, also in the provincial cluster analysis, it should be noted that the LCOE Base Case analysis is
only indicative of overall project costs, and does not reflect the specific conditions of the individual
project. Similarly, LCOE Low case illustrates one potential technology and cost development projection,
and is subject to high degree of uncertainty.
5.3.3 Cluster analysis – overall comparison
Figure 47 provides an overview of the compound LCOE values per cluster (the LCOE per wind speed
ranges of each cluster has been capacity-weighted).
-
5
10
15
20
25
LCOE Basecase
LCOE Low LCOE Basecase
LCOE Low LCOE Basecase
LCOE Low
PCL_F1_Binh Dinh PCL_F2_Phu Yen PCL_F3_Ninh Thuan
LC
OE
(U
SD c
ents
/ k
Wh
)
Sum of 4.5-5 m/s
Sum of 5-5.5 m/s
Sum of 5.5-6 m/s
Sum of 6-6.5 m/s
Sum of 6.5-7 m/s
Sum of 7-7.5 m/s
Sum of 7.5-8 m/s
Sum of 8+ m/s
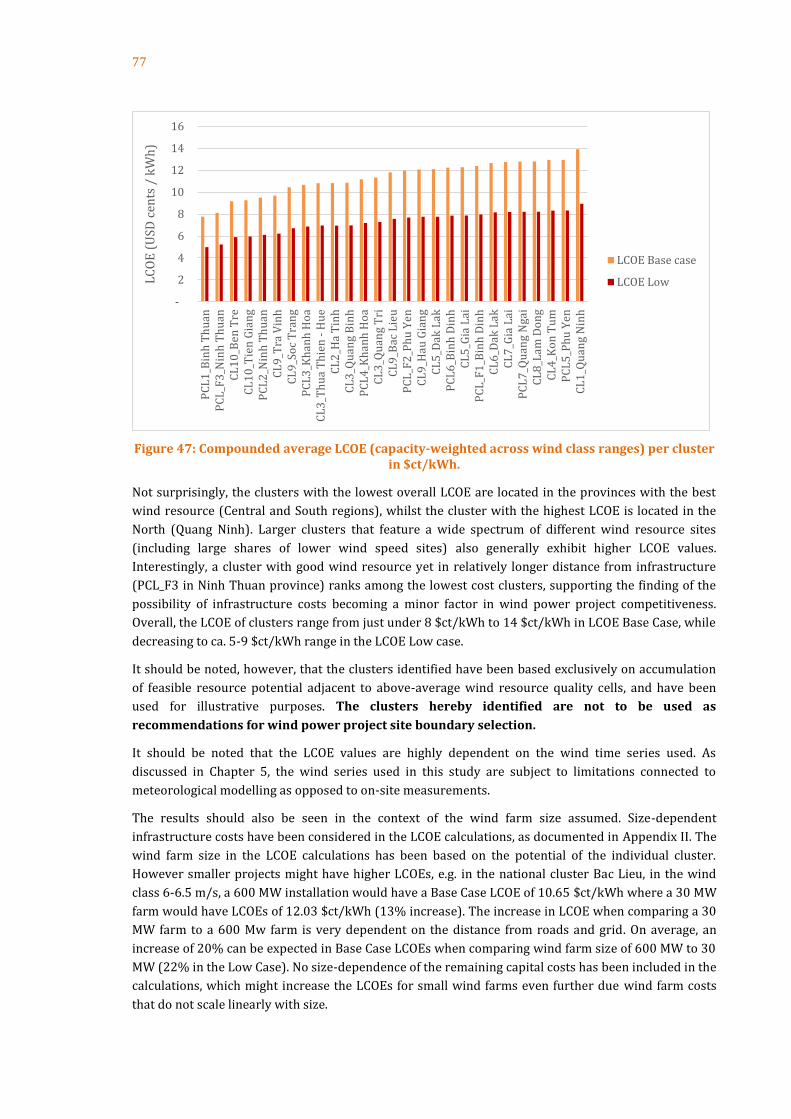
77
Figure 47: Compounded average LCOE (capacity-weighted across wind class ranges) per cluster in $ct/kWh.
Not surprisingly, the clusters with the lowest overall LCOE are located in the provinces with the best
wind resource (Central and South regions), whilst the cluster with the highest LCOE is located in the
North (Quang Ninh). Larger clusters that feature a wide spectrum of different wind resource sites
(including large shares of lower wind speed sites) also generally exhibit higher LCOE values.
Interestingly, a cluster with good wind resource yet in relatively longer distance from infrastructure
(PCL_F3 in Ninh Thuan province) ranks among the lowest cost clusters, supporting the finding of the
possibility of infrastructure costs becoming a minor factor in wind power project competitiveness.
Overall, the LCOE of clusters range from just under 8 $ct/kWh to 14 $ct/kWh in LCOE Base Case, while
decreasing to ca. 5-9 $ct/kWh range in the LCOE Low case.
It should be noted, however, that the clusters identified have been based exclusively on accumulation
of feasible resource potential adjacent to above-average wind resource quality cells, and have been
used for illustrative purposes. The clusters hereby identified are not to be used as
recommendations for wind power project site boundary selection.
It should be noted that the LCOE values are highly dependent on the wind time series used. As
discussed in Chapter 5, the wind series used in this study are subject to limitations connected to
meteorological modelling as opposed to on-site measurements.
The results should also be seen in the context of the wind farm size assumed. Size-dependent
infrastructure costs have been considered in the LCOE calculations, as documented in Appendix II. The
wind farm size in the LCOE calculations has been based on the potential of the individual cluster.
However smaller projects might have higher LCOEs, e.g. in the national cluster Bac Lieu, in the wind
class 6-6.5 m/s, a 600 MW installation would have a Base Case LCOE of 10.65 $ct/kWh where a 30 MW
farm would have LCOEs of 12.03 $ct/kWh (13% increase). The increase in LCOE when comparing a 30
MW farm to a 600 Mw farm is very dependent on the distance from roads and grid. On average, an
increase of 20% can be expected in Base Case LCOEs when comparing wind farm size of 600 MW to 30
MW (22% in the Low Case). No size-dependence of the remaining capital costs has been included in the
calculations, which might increase the LCOEs for small wind farms even further due wind farm costs
that do not scale linearly with size.
-
2
4
6
8
10
12
14
16
PC
L1
_Bin
h T
hu
anP
CL
_F3
_Nin
h T
hu
anC
L1
0_B
en T
reC
L1
0_T
ien
Gia
ng
PC
L2
_Nin
h T
hu
anC
L9
_Tra
Vin
hC
L9
_So
c T
ran
gP
CL
3_K
han
h H
oa
CL
3_T
hu
a T
hie
n -
Hu
eC
L2
_Ha
Tin
hC
L3
_Qu
ang
Bin
hP
CL
4_K
han
h H
oa
CL
3_Q
uan
g T
riC
L9
_Bac
Lie
uP
CL
_F2
_Ph
u Y
enC
L9
_Hau
Gia
ng
CL
5_D
ak L
akP
CL
6_B
inh
Din
hC
L5
_Gia
Lai
PC
L_F
1_B
inh
Din
hC
L6
_Dak
Lak
CL
7_G
ia L
aiP
CL
7_Q
uan
g N
gai
CL
8_L
am D
on
gC
L4
_Ko
n T
um
PC
L5
_Ph
u Y
enC
L1
_Qu
ang
Nin
h
LC
OE
(U
SD c
ents
/ k
Wh
)
LCOE Base case
LCOE Low

78
5.4 Solar PV and biomass
This section briefly summarizes the national resource potential estimates for solar PV and biomass for
context.
5.4.1 Solar PV resource potential
Table 22 provides an overview of the national theoretical and technical potential estimate for Vietnam
elaborated by the Institute of Energy. The national technical potential has been estimated at 339 GW. It
should be noted that the solar PV hereby presented is not coordinated with the land-based wind
resource mapping analysis in the current study - each resource assessment assumes full land
availability subject to the specific exclusion criteria applied (i.e. competing uses of land between wind
and solar PV projects have not been considered).
Table 22: National solar PV resource potential (theoretical and technical) in Vietnam. Source: Institute of Energy.
Area Theoretical
potential (MWp)
Technical Potential
(MWp)
Red River Delta 613,906 30,695
Northern midlands and mountainous 2,033,466 101,673
North and South-Central Coast 2,132,840 106,642
Central Highlands 808,973 40,449
South-East 397,493 19,875
Mekong River Delta 805,880 40,294
TOTAL 6,792,560 339,628
The resource potential has been estimated based on total arable land data per province for 2015 from
the General Statistics Office of Vietnam, applied the following area subtraction coefficients (Table 23):
Table 23: Area exclusion criteria applied in the solar PV national resource mapping analysis. Source: Institute of Energy
Land type Reduction share
Transport -10%
Water surface -15%
Slopes and mountains -35%
Defense land -10%
Cultural and religious land -2%
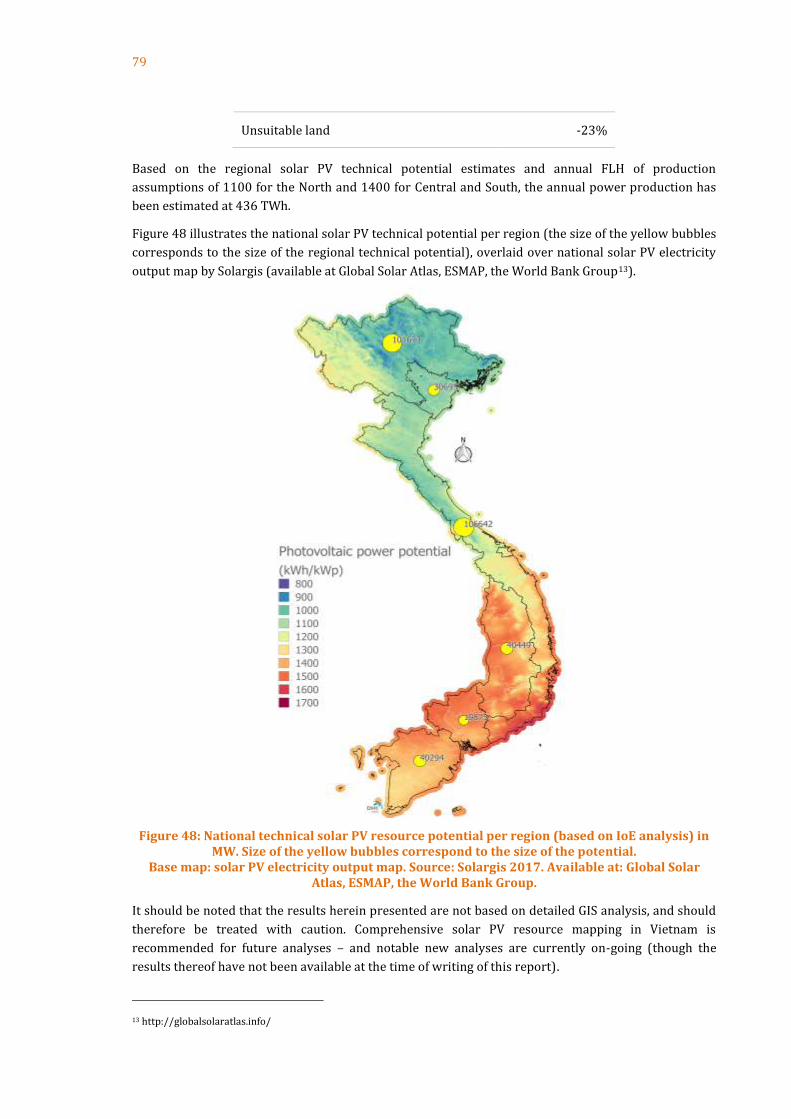
79
Unsuitable land -23%
Based on the regional solar PV technical potential estimates and annual FLH of production
assumptions of 1100 for the North and 1400 for Central and South, the annual power production has
been estimated at 436 TWh.
Figure 48 illustrates the national solar PV technical potential per region (the size of the yellow bubbles
corresponds to the size of the regional technical potential), overlaid over national solar PV electricity
output map by Solargis (available at Global Solar Atlas, ESMAP, the World Bank Group13).
Figure 48: National technical solar PV resource potential per region (based on IoE analysis) in MW. Size of the yellow bubbles correspond to the size of the potential.
Base map: solar PV electricity output map. Source: Solargis 2017. Available at: Global Solar Atlas, ESMAP, the World Bank Group.
It should be noted that the results herein presented are not based on detailed GIS analysis, and should
therefore be treated with caution. Comprehensive solar PV resource mapping in Vietnam is
recommended for future analyses – and notable new analyses are currently on-going (though the
results thereof have not been available at the time of writing of this report).
13 http://globalsolaratlas.info/
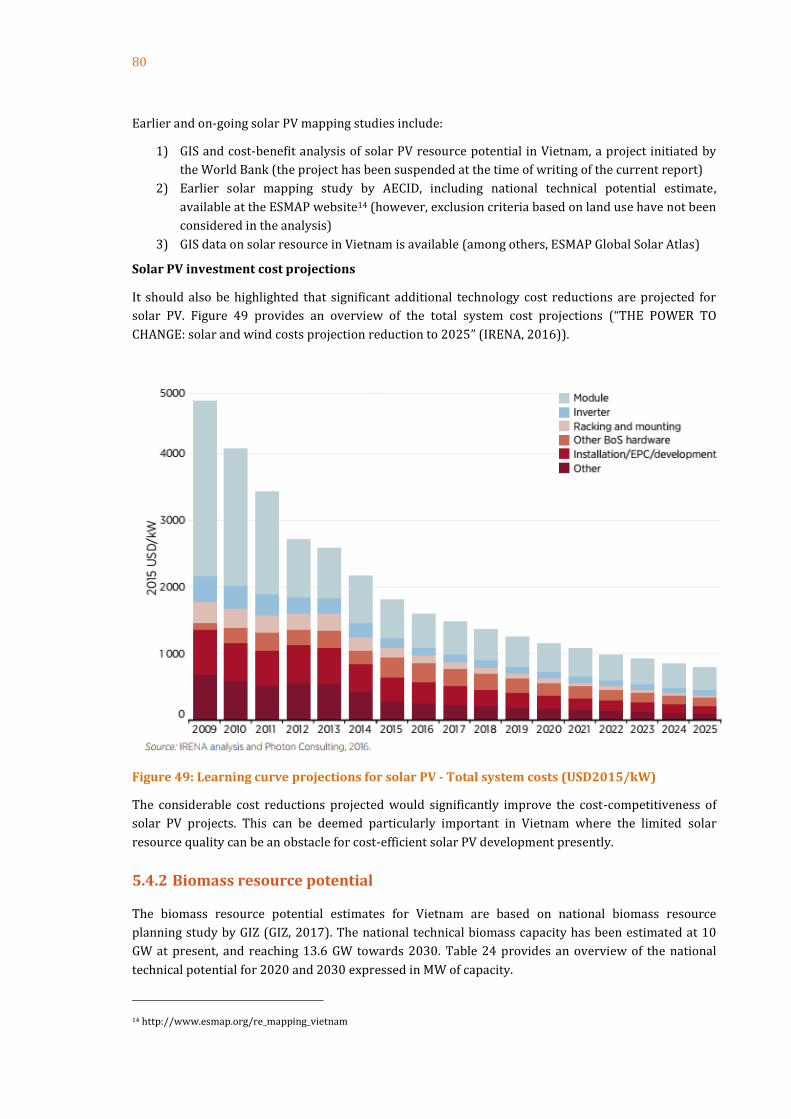
80
Earlier and on-going solar PV mapping studies include:
1) GIS and cost-benefit analysis of solar PV resource potential in Vietnam, a project initiated by
the World Bank (the project has been suspended at the time of writing of the current report)
2) Earlier solar mapping study by AECID, including national technical potential estimate,
available at the ESMAP website14 (however, exclusion criteria based on land use have not been
considered in the analysis)
3) GIS data on solar resource in Vietnam is available (among others, ESMAP Global Solar Atlas)
Solar PV investment cost projections
It should also be highlighted that significant additional technology cost reductions are projected for
solar PV. Figure 49 provides an overview of the total system cost projections (“THE POWER TO
CHANGE: solar and wind costs projection reduction to 2025” (IRENA, 2016)).
Figure 49: Learning curve projections for solar PV - Total system costs (USD2015/kW)
The considerable cost reductions projected would significantly improve the cost-competitiveness of
solar PV projects. This can be deemed particularly important in Vietnam where the limited solar
resource quality can be an obstacle for cost-efficient solar PV development presently.
5.4.2 Biomass resource potential
The biomass resource potential estimates for Vietnam are based on national biomass resource
planning study by GIZ (GIZ, 2017). The national technical biomass capacity has been estimated at 10
GW at present, and reaching 13.6 GW towards 2030. Table 24 provides an overview of the national
technical potential for 2020 and 2030 expressed in MW of capacity.
14 http://www.esmap.org/re_mapping_vietnam
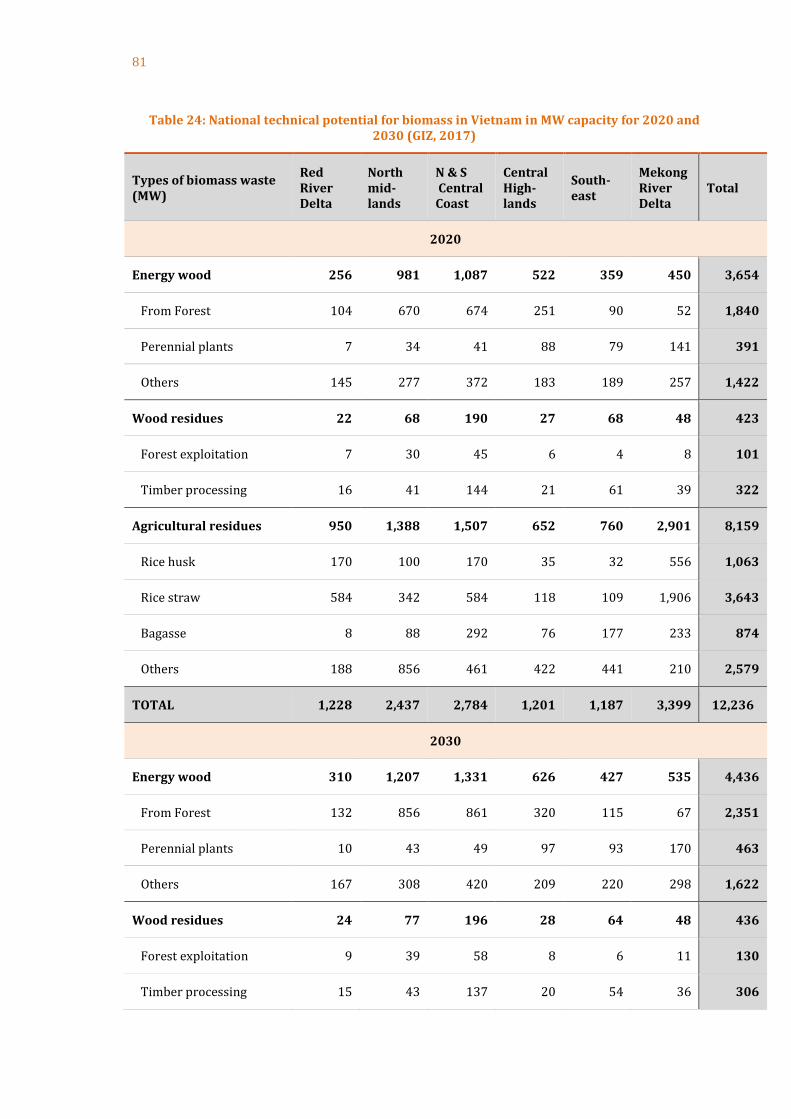
81
Table 24: National technical potential for biomass in Vietnam in MW capacity for 2020 and 2030 (GIZ, 2017)
Types of biomass waste (MW)
Red River Delta
North mid-lands
N & S Central Coast
Central High-lands
South-east
Mekong River Delta
Total
2020
Energy wood 256 981 1,087 522 359 450 3,654
From Forest 104 670 674 251 90 52 1,840
Perennial plants 7 34 41 88 79 141 391
Others 145 277 372 183 189 257 1,422
Wood residues 22 68 190 27 68 48 423
Forest exploitation 7 30 45 6 4 8 101
Timber processing 16 41 144 21 61 39 322
Agricultural residues 950 1,388 1,507 652 760 2,901 8,159
Rice husk 170 100 170 35 32 556 1,063
Rice straw 584 342 584 118 109 1,906 3,643
Bagasse 8 88 292 76 177 233 874
Others 188 856 461 422 441 210 2,579
TOTAL 1,228 2,437 2,784 1,201 1,187 3,399 12,236
2030
Energy wood 310 1,207 1,331 626 427 535 4,436
From Forest 132 856 861 320 115 67 2,351
Perennial plants 10 43 49 97 93 170 463
Others 167 308 420 209 220 298 1,622
Wood residues 24 77 196 28 64 48 436
Forest exploitation 9 39 58 8 6 11 130
Timber processing 15 43 137 20 54 36 306
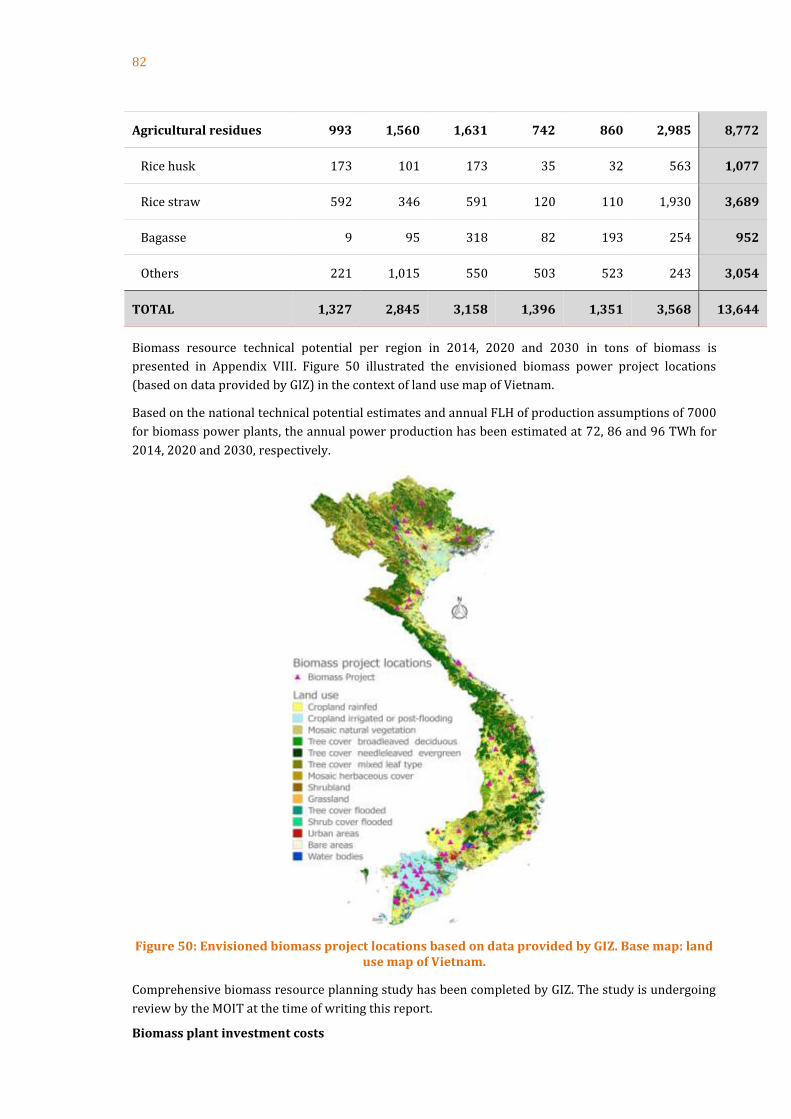
82
Agricultural residues 993 1,560 1,631 742 860 2,985 8,772
Rice husk 173 101 173 35 32 563 1,077
Rice straw 592 346 591 120 110 1,930 3,689
Bagasse 9 95 318 82 193 254 952
Others 221 1,015 550 503 523 243 3,054
TOTAL 1,327 2,845 3,158 1,396 1,351 3,568 13,644
Biomass resource technical potential per region in 2014, 2020 and 2030 in tons of biomass is
presented in Appendix VIII. Figure 50 illustrated the envisioned biomass power project locations
(based on data provided by GIZ) in the context of land use map of Vietnam.
Based on the national technical potential estimates and annual FLH of production assumptions of 7000
for biomass power plants, the annual power production has been estimated at 72, 86 and 96 TWh for
2014, 2020 and 2030, respectively.
Figure 50: Envisioned biomass project locations based on data provided by GIZ. Base map: land use map of Vietnam.
Comprehensive biomass resource planning study has been completed by GIZ. The study is undergoing
review by the MOIT at the time of writing this report.
Biomass plant investment costs

83
Table 25 presents illustrative biomass power plant investment costs estimated for Vietnam based on
existing projects in Vietnam, as well as reference projects from neighboring countries (GIZ, 2017).
Table 25: Indicative biomass power plant investment cost estimated for Vietnam. Data source: (GIZ, 2017)
Biomass Investment Cost (USD/kW)
Rice husk 1,900
Woody biomass 2,000
CHP Bagasse 1,000
Rice straw 2,200

84
06
Discussion and Conclusion
85
6. Discussion and conclusion
The land-based wind resource GIS mapping analysis suggests that Vietnam is endowed with significant
wind power potential. Starting from the entire Vietnamese area, several exclusion criteria were used to
arrive at an estimate for the national technical potential (NTP). The GIS analysis steps highlight the
relative share of importance of the different criteria towards the NTP. Almost a quarter of the total
land area in Vietnam has been excluded based on mean annual wind speed threshold criterion, i.e.
areas with mean annual wind speed not reaching 4.5m/s at 100m height. Further significant land
exclusion criteria (i.e. resulting in large land exclusion areas) have been based on populated areas /
population density, protected areas, forests, as well as areas characterized by high terrain steepness.
Based on these exclusion criteria and assuming a 3MW/ km2 turbine footprint, The National Technical
Potential (NTP) has been estimated at 214 GW. This is equivalent to nearly 437 TWh of annual wind
power production (with a 200 W/m2 wind turbine technology at 100m hub height). The largest share
of this potential is in the Central region of Vietnam, exceeding 125 GW, followed by the South region at
60 GW. North is characterized by the lowest wind resource potential with technical potential at 29 GW.
The vast majority of the Vietnamese NTP is consists of areas with relatively low wind resource quality
(mean annual wind speed of 4.5 – 6m/s at 100m height). However, ca 25% of the national NTP (52
GW) is located in areas with mean annual wind speed of 6m/s and higher. When only considering the
higher quality wind resource, Central region still has the largest share with 37 GW where the South
region has 14 GW. Only 1.2 GW of the higher quality wind resource is located in the North.
NTP scenarios
The alternative scenarios based on infrastructure proximity and availability of agricultural land
provide further insights. It should though be noted that only existing infrastructure of transmission
grid and roads has been included in the analysis (i.e. no envisioned development of the infrastructure
network has been considered due to data availability). Hence, the infrastructure proximity of the wind
resource areas could improve over time as infrastructure development continues.
Within 20km distance: Over two thirds of the NTP (or 143 GW) are identified in the regions
within 20 km distance, both from the closest 220kV transmission infrastructure point, and the
closest major road
Within 10km distance: Approximately one third (77GW) of the NTP is identified in the
regions within 10 km distance, both from the closest 220kV transmission infrastructure point,
and the closest major road. The analysis also suggests that clusters with high wind potential
generally lie within relative proximity to infrastructure (i.e. within 0-10 and 10-20 km
distance to closest transmission grid and / or road considered).
Within 20 km distance, no agricultural land: An NTP of 54 GW is identified in the regions
within 20 km distance, both from the closest 220kV transmission infrastructure point, and the
closest major road, but excluding agricultural land.
Within 10 km distance, no agricultural land: An NTP of 27 GW is identified in the regions
within 10 km distance, both from the closest 220kV transmission infrastructure point, and the
closest major road, but excluding agricultural land.
A significant share of the NTP lies on agricultural land (croplands), comprising 40 340 km2 of the total
NTP area. This corresponds to 126 GW of the NTP, and includes a high share of high wind resource
potential of 6m/s and higher mean annual wind speed, especially in South (13.1 GW out of 13.6 GW in
the NTP) and Central (24 GW out of 37 GW in the NTP). More than 80% of all NTP in the South is
located on agricultural land (and over 95% of all high wind resource areas). The Central region still
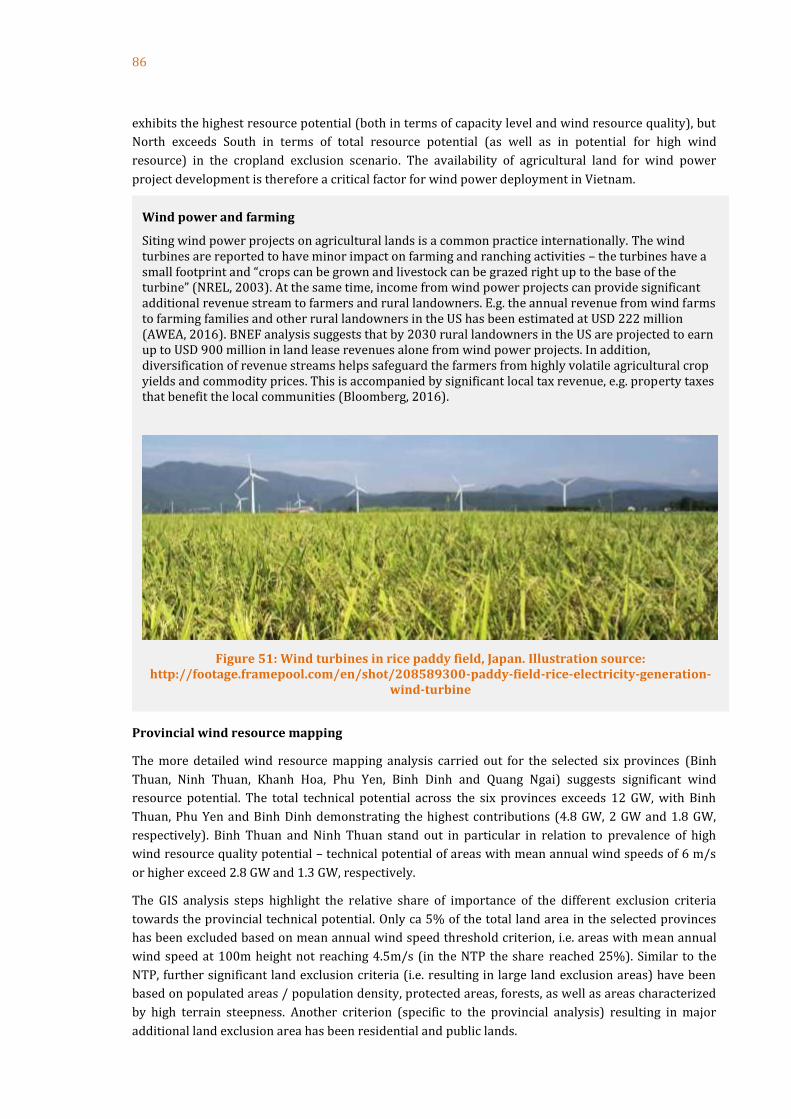
86
exhibits the highest resource potential (both in terms of capacity level and wind resource quality), but
North exceeds South in terms of total resource potential (as well as in potential for high wind
resource) in the cropland exclusion scenario. The availability of agricultural land for wind power
project development is therefore a critical factor for wind power deployment in Vietnam.
Provincial wind resource mapping
The more detailed wind resource mapping analysis carried out for the selected six provinces (Binh
Thuan, Ninh Thuan, Khanh Hoa, Phu Yen, Binh Dinh and Quang Ngai) suggests significant wind
resource potential. The total technical potential across the six provinces exceeds 12 GW, with Binh
Thuan, Phu Yen and Binh Dinh demonstrating the highest contributions (4.8 GW, 2 GW and 1.8 GW,
respectively). Binh Thuan and Ninh Thuan stand out in particular in relation to prevalence of high
wind resource quality potential – technical potential of areas with mean annual wind speeds of 6 m/s
or higher exceed 2.8 GW and 1.3 GW, respectively.
The GIS analysis steps highlight the relative share of importance of the different exclusion criteria
towards the provincial technical potential. Only ca 5% of the total land area in the selected provinces
has been excluded based on mean annual wind speed threshold criterion, i.e. areas with mean annual
wind speed at 100m height not reaching 4.5m/s (in the NTP the share reached 25%). Similar to the
NTP, further significant land exclusion criteria (i.e. resulting in large land exclusion areas) have been
based on populated areas / population density, protected areas, forests, as well as areas characterized
by high terrain steepness. Another criterion (specific to the provincial analysis) resulting in major
additional land exclusion area has been residential and public lands.
Wind power and farming
Siting wind power projects on agricultural lands is a common practice internationally. The wind turbines are reported to have minor impact on farming and ranching activities – the turbines have a small footprint and “crops can be grown and livestock can be grazed right up to the base of the turbine” (NREL, 2003). At the same time, income from wind power projects can provide significant additional revenue stream to farmers and rural landowners. E.g. the annual revenue from wind farms to farming families and other rural landowners in the US has been estimated at USD 222 million (AWEA, 2016). BNEF analysis suggests that by 2030 rural landowners in the US are projected to earn up to USD 900 million in land lease revenues alone from wind power projects. In addition, diversification of revenue streams helps safeguard the farmers from highly volatile agricultural crop yields and commodity prices. This is accompanied by significant local tax revenue, e.g. property taxes that benefit the local communities (Bloomberg, 2016).
Figure 51: Wind turbines in rice paddy field, Japan. Illustration source: http://footage.framepool.com/en/shot/208589300-paddy-field-rice-electricity-generation-
wind-turbine

87
The analysis also suggests that, akin to the findings of the NTP analysis, clusters with high wind
potential in the selected provinces generally lie within relative proximity to infrastructure (i.e. within
0-10 and 10-20 km distance to closest transmission grid and / or road considered). Overall, the
infrastructure proximity for the selected clusters can be assessed as non-prohibitive. For context, the
threshold for grid connection proximity used in IRENA analysis in relation to wind power projects in
Latin America has been set at 75 km (IRENA, 2016).
LCOE analysis
The LCOE analysis explored ‘clusters’, i.e. areas characterised by significant proportion of adjacent
above-average wind resource cells, both nationally, and within the six selected provinces. The clusters
identified have been based exclusively on accumulation of feasible resource potential adjacent to
above-average wind resource quality cells, and have been used for illustrative purposes. The clusters
hereby identified are not to be used as recommendations for wind power project site boundary
selection.
It should be noted that the LCOE values are highly dependent on the wind time series used. As
discussed in Chapter 5, the wind series used in this study are subject to limitations connected to
meteorological modelling as opposed to on-site measurements.
The results should also be seen in the context of the wind farm size assumed. Size-dependent
infrastructure costs have been considered in the LCOE calculations, as documented in Appendix II. The
wind farm size in the LCOE calculations has been based on the potential of the individual cluster.
However smaller projects might have higher LCOEs, e.g. in the national cluster Bac Lieu, in the wind
class 6-6.5 m/s, a 600 MW installation would have a Base Case LCOE of 10.65 $ct/kWh where a 30 MW
farm would have LCOEs of 12.03 $ct/kWh (13% increase). The increase in LCOE when comparing a 30
MW farm to a 600 Mw farm is very dependent on the distance from roads and grid. On average, an
increase of 20% can be expected in Base Case LCOEs when comparing wind farm size of 600 MW to 30
MW (22% in the Low Case). No size-dependence of the remaining capital costs has been included in the
calculations, which might increase the LCOEs for small wind farms even further due to wind farm costs
that do not scale linearly with size.
Two LCOE cases were developed: LCOE Base Case and LCOE Low. LCOE Base Case is based on
assumptions deemed to be representative of the situation in Vietnam currently. LCOE Low, in turn, can
be interpreted as the assumptions projected to be representative of the near- to mid-term future as the
wind power industry in Vietnam would mature, economies of scale would develop, and the cost levels
would increasingly converge with the international averages.
Of course, it should be noted that the LCOE Base Case analysis is only indicative of overall project costs,
and does not reflect the specific conditions of the individual project. Similarly, LCOE Low case
illustrates one potential technology and cost development projection, and is subject to high degree of
uncertainty. The LCOE levels have been estimated assuming infrastructure cost sharing across the
entire cluster, please see Allocation of infrastructure costs in the LCOE calculation section for a
description of the approach used.
LCOE Base Case: Overall, the LCOE of clusters range from just under 8 $ct/kWh to 14
$ct/kWh in the LCOE Base Case. However, most of the clusters are within the 9.5-12.5
$ct/kWh range.
o Good locations (6 - 7.5m/s): The LCOE Base Case analysis suggests good locations
could be developed in an LCOE range of ca 8 – 11 $ct/kWh
o Best locations (+ 7.5m/s): In addition, limited ‘best’ locations could be developed
down to under 7 $ct/kWh

88
o Worst locations (4.5 - 5m/s): The LCOE increases progressively along with
decreasing wind resource quality, the 4.5-5 m/s mean annual wind speed locations
reaching ca. 20 $ct/kWh.
LCOE Low Case: The LCOE Low case analysis suggests that more favourable project
development and technology conditions could yield significant LCOE reductions (e.g. in the
medium term), and the absolute reductions are most prominent for lower wind resource
locations – both nationally, and within the selected provinces. Overall, the LCOE of clusters
range from just 5 $ct/kWh to 9 $ct/kWh in the in the LCOE Low Case. However, most of the
clusters are within the 6-8 $ct/kWh range.
o Good locations (6 - 7.5m/s): The LCOE Low Case analysis suggests good locations
could be developed in an LCOE range of 5.2 – 6.9 $ct/kWh.
o Best locations (+ 7.5m/s): Limited ‘best’ locations could be developed in the range of
4.2 – 4.7 $ct/kWh.
o Worst locations (4.5 - 5m/s): Locations with 4.5-5 m/s mean annual wind speed
yield an average of ca. 13 $ct/kWh, which is a significant reduction from the 20
$ct/kWh in the LCOE Base Case.
The compound LCOE values per cluster (the capacity-weighted LCOE values per wind speed ranges of
each cluster) indicate that the clusters’ lowest overall LCOE are located in the provinces with the best
wind resource (Central and South regions), whilst the cluster with the highest LCOE is located in the
North (Quang Ninh). Larger clusters that feature a wide spectrum of different wind resource sites
(including large shares of lower wind speed sites) also generally exhibit higher LCOE values.
Interestingly, a cluster with good wind resource yet in relatively longer distance from infrastructure
(PCL_F3 in Ninh Thuan province) ranks among the lowest cost clusters, supporting the finding of the
possibility of infrastructure costs becoming a minor factor in wind power project competitiveness.
The results of the cluster analysis also indicate that the impact of the infrastructure on-costs is
minimal, at least on the entire cluster level (it should be noted that some of the national clusters are
very considerable in capacity size). The highest CapEx on-costs related to additional infrastructure
development (yet not exceeding 4%) have been estimated for the relatively smaller clusters both
nationally and within the selected provinces (size range of 50-70 MW). The results (based on the given
sample of clusters) also indicate that the size of the cluster exhibits higher impact on the infrastructure
costs than the infrastructure proximity per se. Furthermore, the LCOE analysis highlights the
importance of wind resource quality (and the corresponding full-load hours of production) as a critical
determinant of cost competitiveness of a wind power project.
Implications for RE development planning
Alongside solar PV (national technical potential estimated at 339 GW) and biomass for power
production (current national technical potential estimated at 10 GW; increasing to over 13 GW
towards 2030), wind presents a very significant potential (NTP estimated at 214 GW) for RE
development in Vietnam.
Whilst the overall wind resource quality in Vietnam is relatively low, large potential also for wind
resource areas exceeding 6 m/s of mean annual wind speed have been identified nationally, reaching
52 GW. Based on the LCOE Base Case assumptions representative of the current situation in Vietnam,
these areas could be developed at a cost range of 6-10 $ct/kWh. Provided increasing maturation of the
wind power industry in Vietnam and further improvements and cost reductions in wind power
technology globally, the LCOE for areas with lower wind resource quality in the medium term could
decrease to a cost range of 8-13 $ct/kWh, making them more cost competitive. Prerequisites for a
mature market development have been listed in the paragraph below.
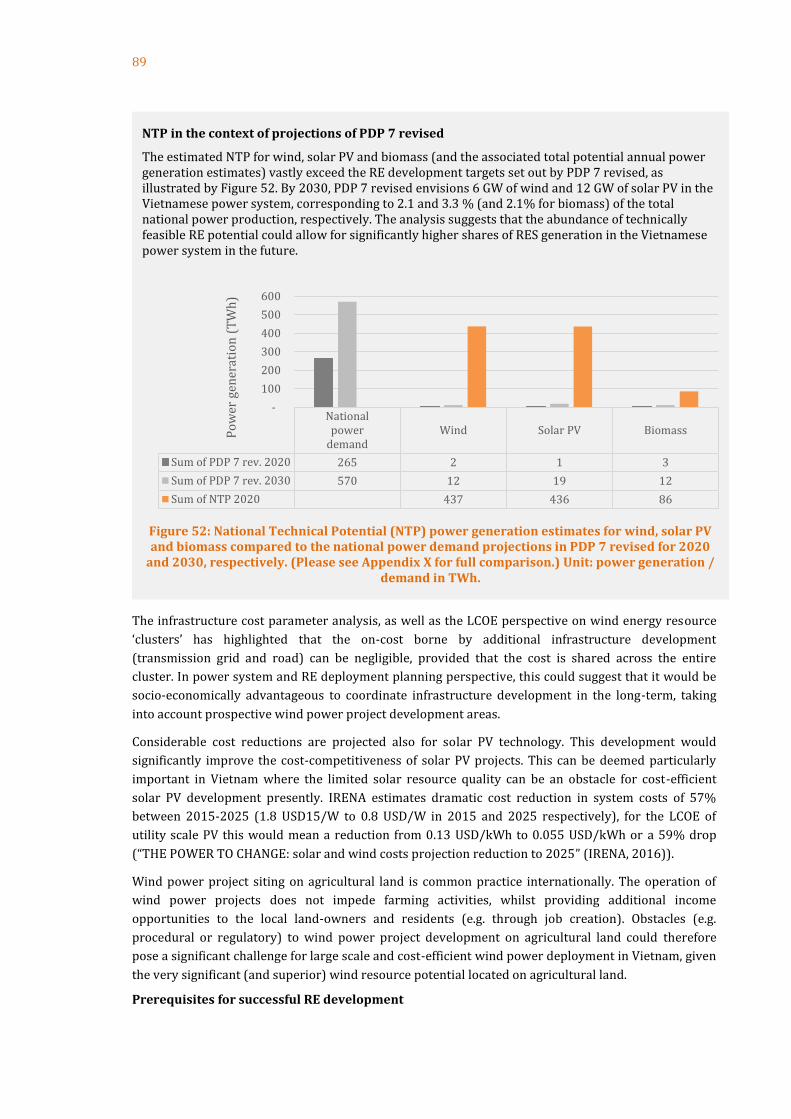
89
The infrastructure cost parameter analysis, as well as the LCOE perspective on wind energy resource
‘clusters’ has highlighted that the on-cost borne by additional infrastructure development
(transmission grid and road) can be negligible, provided that the cost is shared across the entire
cluster. In power system and RE deployment planning perspective, this could suggest that it would be
socio-economically advantageous to coordinate infrastructure development in the long-term, taking
into account prospective wind power project development areas.
Considerable cost reductions are projected also for solar PV technology. This development would
significantly improve the cost-competitiveness of solar PV projects. This can be deemed particularly
important in Vietnam where the limited solar resource quality can be an obstacle for cost-efficient
solar PV development presently. IRENA estimates dramatic cost reduction in system costs of 57%
between 2015-2025 (1.8 USD15/W to 0.8 USD/W in 2015 and 2025 respectively), for the LCOE of
utility scale PV this would mean a reduction from 0.13 USD/kWh to 0.055 USD/kWh or a 59% drop
(“THE POWER TO CHANGE: solar and wind costs projection reduction to 2025” (IRENA, 2016)).
Wind power project siting on agricultural land is common practice internationally. The operation of
wind power projects does not impede farming activities, whilst providing additional income
opportunities to the local land-owners and residents (e.g. through job creation). Obstacles (e.g.
procedural or regulatory) to wind power project development on agricultural land could therefore
pose a significant challenge for large scale and cost-efficient wind power deployment in Vietnam, given
the very significant (and superior) wind resource potential located on agricultural land.
Prerequisites for successful RE development
NTP in the context of projections of PDP 7 revised
The estimated NTP for wind, solar PV and biomass (and the associated total potential annual power generation estimates) vastly exceed the RE development targets set out by PDP 7 revised, as illustrated by Figure 52. By 2030, PDP 7 revised envisions 6 GW of wind and 12 GW of solar PV in the Vietnamese power system, corresponding to 2.1 and 3.3 % (and 2.1% for biomass) of the total national power production, respectively. The analysis suggests that the abundance of technically feasible RE potential could allow for significantly higher shares of RES generation in the Vietnamese power system in the future.
Figure 52: National Technical Potential (NTP) power generation estimates for wind, solar PV and biomass compared to the national power demand projections in PDP 7 revised for 2020
and 2030, respectively. (Please see Appendix X for full comparison.) Unit: power generation / demand in TWh.
Nationalpower
demandWind Solar PV Biomass
Sum of PDP 7 rev. 2020 265 2 1 3
Sum of PDP 7 rev. 2030 570 12 19 12
Sum of NTP 2020 437 436 86
-
100
200
300
400
500
600
Po
wer
gen
erat
ion
(T
Wh
)

90
Significant RE resource potential does not guarantee successful RE project development per se. A
number of important preconditions are required in order to enable and encourage the development of
a viable RE industry (based on “Up-Scaling of Wind Power in Viet Nam - Capacity Needs Assessment for
Wind Power” (GIZ, 2016) and “LCOE of current wind projects in Viet Nam and recommendations for an
improved support mechanism” (GIZ, 2017)):
Adequate legal and regulatory framework;
o Streamlined procedures to mitigate lengthy permitting process;
Adequate support level for RE development:
o More support needed in nascent markets, to compensate the high risk and enable
service and human capital development;
o Support can be gradually reduced once the market matures;
Opportunities for RE-focused education;
RE-focused engineering disciplines at universities and vocational education and training
possibilities to be encouraged.

91
07
Recommendations For Future Analysis
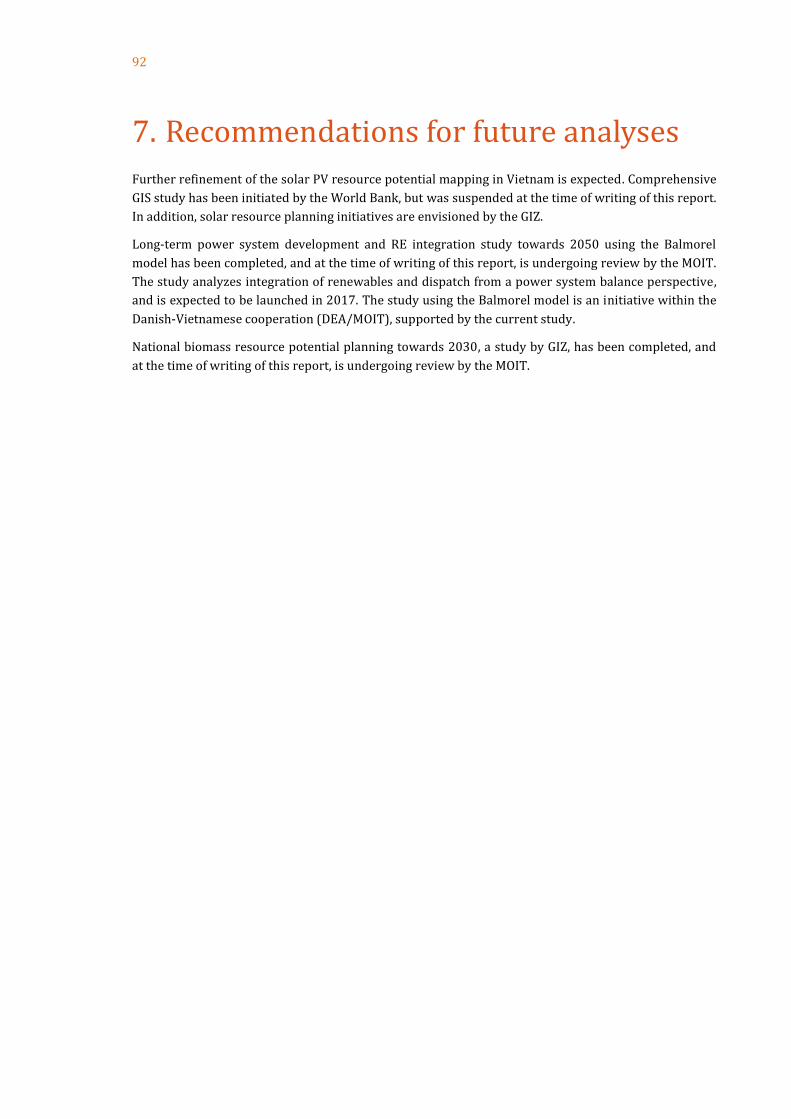
92
7. Recommendations for future analyses
Further refinement of the solar PV resource potential mapping in Vietnam is expected. Comprehensive
GIS study has been initiated by the World Bank, but was suspended at the time of writing of this report.
In addition, solar resource planning initiatives are envisioned by the GIZ.
Long-term power system development and RE integration study towards 2050 using the Balmorel
model has been completed, and at the time of writing of this report, is undergoing review by the MOIT.
The study analyzes integration of renewables and dispatch from a power system balance perspective,
and is expected to be launched in 2017. The study using the Balmorel model is an initiative within the
Danish-Vietnamese cooperation (DEA/MOIT), supported by the current study.
National biomass resource potential planning towards 2030, a study by GIZ, has been completed, and
at the time of writing of this report, is undergoing review by the MOIT.

93
8. References Agora Energiewende. (2014). Calculator of Levelized Cost of Electricity for Power Generation
Technologies. Agora Energiewende.
AWEA. (2016, March 22). American Wind Energy Association. Retrieved from Wind power
pays $222 million a year to rural landowners:
http://www.awea.org/MediaCenter/pressrelease.aspx?ItemNumber=8609
Bloomberg. (2016, October 6). Bloomberg Businessweek. Retrieved from Wind Is the New
Corn for Struggling Farmers: https://www.bloomberg.com/news/articles/2016-10-
06/wind-is-the-new-corn-for-struggling-farmers
Dalla Riva, A. (2016). System Value of Wind Power - An Analysis of the Effects of Wind Turbine
Design (Economic dispatch modelling of medium-term system implications of advanced
wind power technologies). Copenhagen: DTU.
GIZ. (2014). Proposal of an Appropriate Support Mechanism for Wind Power in Viet Nam.
GIZ. (2016). Up-Scaling of Wind Power in Viet Nam - Capacity Needs Assessment for Wind
Power. HaNoi: GIZ.
GIZ. (2017). Draft National Biomass Energy Planning Period until 2020, with a Vision to 2030.
Hanoi: GIZ.
GIZ. (2017). LCOE of current wind projects in Viet Nam and recommendations for an improved
support mechanism. HaNoi: GIZ.
HGC Engineering. (2007). Wind Turbines and Sound: Review and Best Practice Guidelines.
Howe Gastmeier Chapnik Limited.
Hungerford, L., Luna, J., & Sennott, T. (n.d.). Wind Farm Locational Analysis. Portland State
University.
IEA. (2016). Next Generation Wind and Solar Power - from Cost to Value. Paris: OECD / IEA.
IEA. (2016). World Energy Outlook 2016. Paris: OECD/IEA.
IEA Wind Task 26. (2016). Wiser, R., Jenni, K., Seel, J., Hand, M., Lantz, E., Smith, A. Forecasting
Wind Energy Costs & Cost Drivers - The Views of the World's Leading Experts. IEA Wind
Task 26.
IRENA. (2016). INVESTMENT OPPORTUNITIES IN LATIN AMERICA - SUITABILITY MAPS FOR
GRID-CONNECTED AND OFF-GRID SOLAR AND WIND PROJECTS. Abu Dhabi: IRENA.
Retrieved from
http://www.irena.org/DocumentDownloads/Publications/IRENA_Atlas_investment_
Latin_America_2016.pdf
IRENA. (2016). THE POWER TO CHANGE: solar and wind costs projection reduction to 2025.
NREL. (2003). Wind Energy for Rural Economic Development. US Department of Energy.
NREL. (2009). Land-Use Requirements of Modern Wind Power Plants in the United States.
Golden: NREL. Retrieved from http://www.nrel.gov/docs/fy09osti/45834.pdf
NREL. (2012). U.S. Renewable Energy Technical Potentials: A GIS-Based Analysis. Golden:
NREL. Retrieved from http://www.nrel.gov/docs/fy12osti/51946.pdf
Rodman, L. C., & Meentemeyer, R. K. (2006). A geographic analysis of wind turbine placement
in Northern California. Energy Policy, 2137-2149.
Stenz, T., Malaney, J., Gillman, W., & Crill, C. (2010). A GIS-Driven Approach to Siting a
Prospective Wind Farm in South Central Wisconsin. University of Wisconsin–Madison.

94
Yang, Z. (2013). Using GIS to Determine Wind Energy Potential in Minnesota, USA. Winona:
Saint Mary’s University of Minnesota University Central Services Press.

95
Appendix I
Data requirements for power system modelling using the Balmorel model
The Balmorel model has two main tasks:
Find optimal dispatch in an existing electricity system, e.g. the current Vietnamese system.
Based on description of all individual power plants the model finds the hourly generation per
plant that corresponds to the minimum total costs.
Optimal investment in new generation and transmission. As with optimal dispatch the model
find the solution that gives the minimum total costs for a specific year.
Generation from wind turbines are very specific to the location. It can therefore be relevant to describe
a number of sites for location of potential wind farms. A wind area can be defined as an area with:
Similar wind resource (where the same hourly wind profile can be used)
Where the investment and connection costs are of similar size, i.e. same distance to the
electricity transmission grid, same distance to good quality roads (for large and heavy
transport).
The model can be exposed to restriction, e.g. about the share of renewable energy of about maximum
CO2 emission. The model will then find the path with minimum total costs to fulfil these restrictions.
When investing in wind and solar three main parameters are in play:
The local wind and solar resource
The investment costs (where connection and transport cost are specific to the individual site)
The value of electricity. Each transmission region has an individual electricity price for each
hour.
o The price (or the value of electricity) is the marginal cost for the hour for that
location. If e.g. a wind turbine supply an extra MWh, some other power plant will
reduce the generation. The reduction will per definition take place on the most
expensive power plant.
o If significant wind capacity exists in a region, the marginal value of more wind-based
generation tends to be low (because the most expensive generation has already been
removed)
The extra investment in transmission capacity.
o Regions with a lot of wind and solar capacity will typically also need extra
transmission capacity.
With full foresight (one of the major assumption in the model) there is only one solution. This solution
will distribute the new renewable energy between solar and wind, and will distribute in on areas based
on the above aspects. All wind will not be located at the best wind resource – because the value of
electricity is better in other regions, or because the integration costs are lower.
Using the results of the GIS analysis, relevant wind and solar resource potential areas will be identified,
e.g. defined as the best resource areas available for wind, with similar wind profiles (e.g. +/- 5% of full
load hours) and with similar connection and transport costs. The procedure to find the areas could
start with a target number of areas, e.g. 20 areas (with at least five in each of the three transmission
regions). Then the best similar areas can be found.

96
Appendix II
Infrastructure cost variation depending on project size and infrastructure proximity
Table 26: Overview of infrastructure cost variation depending on project size and infrastructure proximity
Project size
(MW)
Distance to road
(km)
Distance to grid (km)
Plant CapEx
(excl. Infrastructure)
CapEx roads
CapEx grid connection
CapEx TOTAL
Road on-cost
(on plant CapEx)
Grid on-cost (on
plant CapEx)
Combined infrastructure on-
cost (on plant CapEx)
10 10 10 18,700,000 1,700,000 2,150,000 22,550,000 9% 11% 21%
30 10 10 56,100,000 1,700,000 2,150,000 59,950,000 3% 4% 7%
100 10 10 187,000,000 3,700,000 2,600,000 193,300,000 2% 1% 3%
300 10 10 561,000,000 3,900,000 10,600,000 575,500,000 1% 2% 3%
400 10 10 748,000,000 3,900,000 11,850,000 763,750,000 1% 2% 2%
600 10 10 1,122,000,000 3,900,000 13,100,000 1,139,000,000 0% 1% 2%
10 20 20 18,700,000 3,400,000 2,600,000 24,700,000 18% 14% 32%
30 20 20 56,100,000 3,400,000 2,600,000 62,100,000 6% 5% 11%
100 20 20 187,000,000 7,400,000 3,100,000 197,500,000 4% 2% 6%
300 20 20 561,000,000 7,800,000 14,200,000 583,000,000 1% 3% 4%
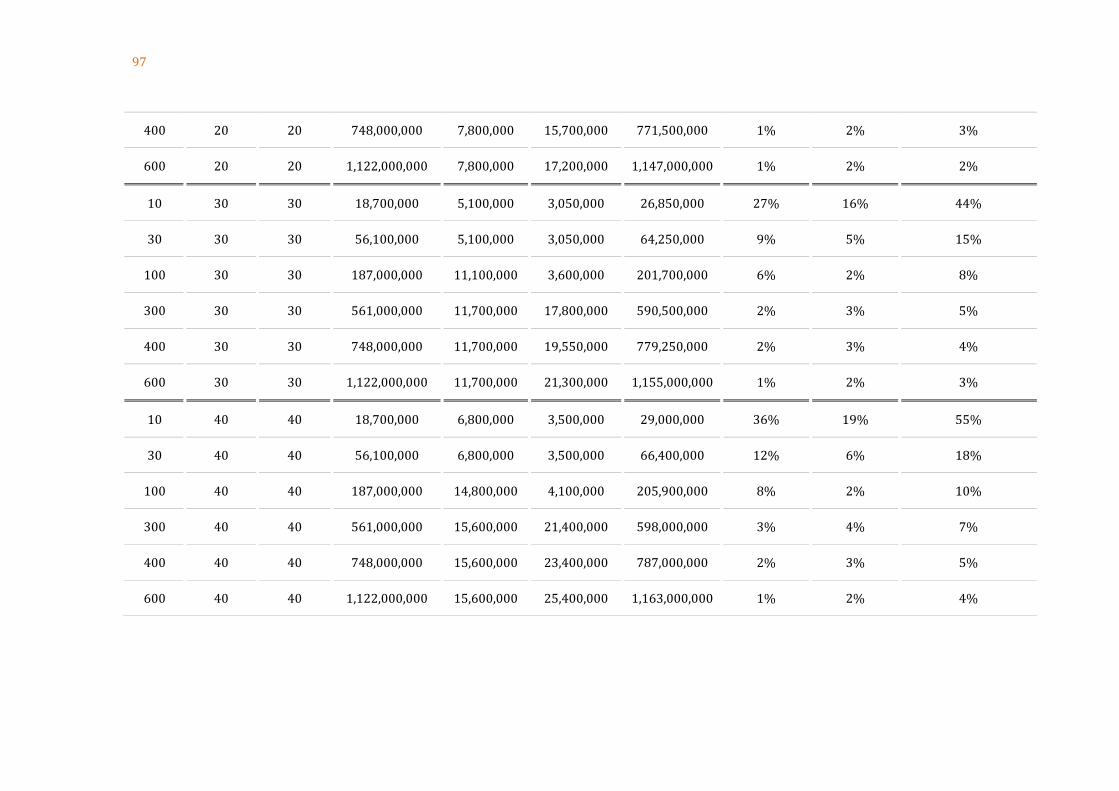
97
400 20 20 748,000,000 7,800,000 15,700,000 771,500,000 1% 2% 3%
600 20 20 1,122,000,000 7,800,000 17,200,000 1,147,000,000 1% 2% 2%
10 30 30 18,700,000 5,100,000 3,050,000 26,850,000 27% 16% 44%
30 30 30 56,100,000 5,100,000 3,050,000 64,250,000 9% 5% 15%
100 30 30 187,000,000 11,100,000 3,600,000 201,700,000 6% 2% 8%
300 30 30 561,000,000 11,700,000 17,800,000 590,500,000 2% 3% 5%
400 30 30 748,000,000 11,700,000 19,550,000 779,250,000 2% 3% 4%
600 30 30 1,122,000,000 11,700,000 21,300,000 1,155,000,000 1% 2% 3%
10 40 40 18,700,000 6,800,000 3,500,000 29,000,000 36% 19% 55%
30 40 40 56,100,000 6,800,000 3,500,000 66,400,000 12% 6% 18%
100 40 40 187,000,000 14,800,000 4,100,000 205,900,000 8% 2% 10%
300 40 40 561,000,000 15,600,000 21,400,000 598,000,000 3% 4% 7%
400 40 40 748,000,000 15,600,000 23,400,000 787,000,000 2% 3% 5%
600 40 40 1,122,000,000 15,600,000 25,400,000 1,163,000,000 1% 2% 4%
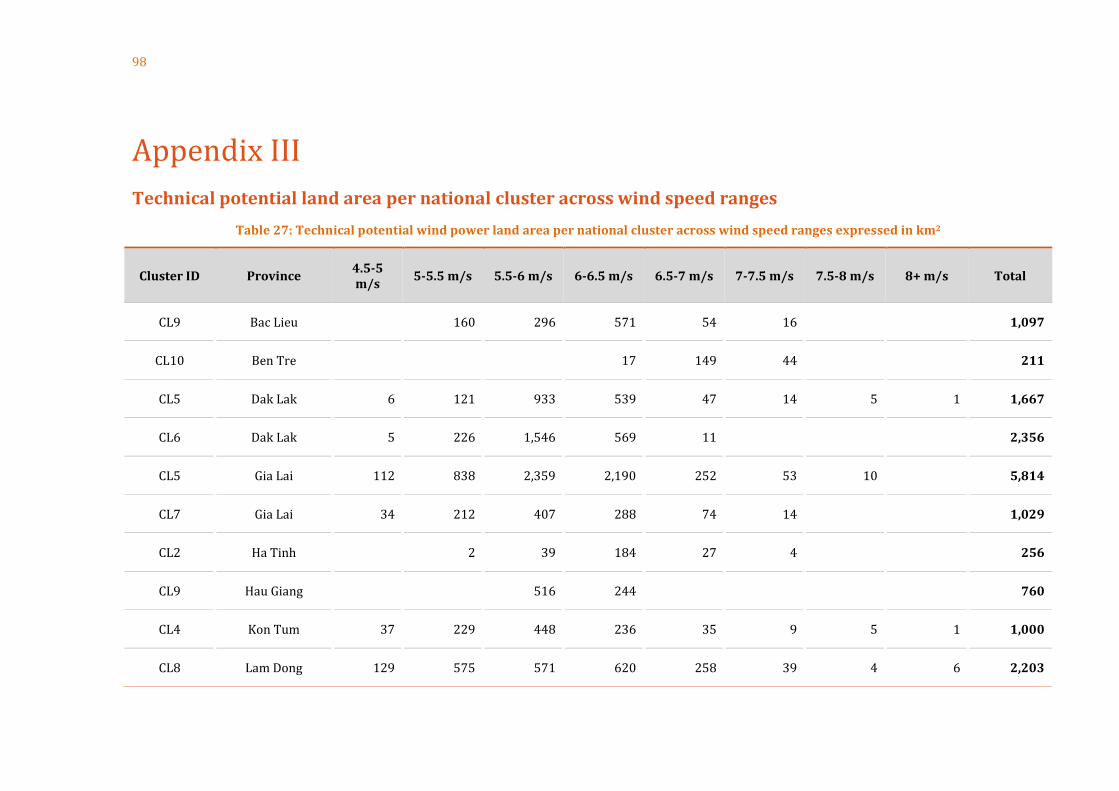
98
Appendix III
Technical potential land area per national cluster across wind speed ranges
Table 27: Technical potential wind power land area per national cluster across wind speed ranges expressed in km2
Cluster ID Province 4.5-5 m/s
5-5.5 m/s 5.5-6 m/s 6-6.5 m/s 6.5-7 m/s 7-7.5 m/s 7.5-8 m/s 8+ m/s Total
CL9 Bac Lieu
160 296 571 54 16
1,097
CL10 Ben Tre
17 149 44
211
CL5 Dak Lak 6 121 933 539 47 14 5 1 1,667
CL6 Dak Lak 5 226 1,546 569 11
2,356
CL5 Gia Lai 112 838 2,359 2,190 252 53 10
5,814
CL7 Gia Lai 34 212 407 288 74 14
1,029
CL2 Ha Tinh
2 39 184 27 4
256
CL9 Hau Giang
516 244
760
CL4 Kon Tum 37 229 448 236 35 9 5 1 1,000
CL8 Lam Dong 129 575 571 620 258 39 4 6 2,203

99
CL3 Quang Binh
45 106 40
192
CL1 Quang Ninh 76 155 185 92 45 4
556
CL3 Quang Tri
111 177 12
299
CL9 Soc Trang
34 1,592 251 41
1,918
CL3 Thua Thien - Hue
19
19
CL10 Tien Giang
21 2
23
CL9 Tra Vinh
407 424 96 15
941
TOTAL 399 2,518 7,490 7,851 1,700 336 39 8 20,341
100
Technical potential capacity per national cluster across wind speed ranges
Table 28: Technical potential wind power capacity per national cluster across wind speed ranges expressed in MW
Cluster ID Province 4.5-5 m/s
5-5.5 m/s 5.5-6 m/s 6-6.5 m/s 6.5-7 m/s 7-7.5 m/s 7.5-8 m/s 8+ m/s Total
CL9 Bac Lieu - 481 887 1,714 161 49 - - 3,292
CL10 Ben Tre - - - 51 448 133 - - 632
CL5 Dak Lak 18 362 2,800 1,617 142 43 15 4 5,001
CL6 Dak Lak 14 679 4,638 1,706 32 - - - 7,069
CL5 Gia Lai 337 2,514 7,078 6,569 757 159 29 - 17,442
CL7 Gia Lai 101 636 1,220 865 221 43 - - 3,086
CL2 Ha Tinh - 7 116 552 81 11 - - 767
CL9 Hau Giang - - 1,548 733 - - - - 2,281
CL4 Kon Tum 112 687 1,344 707 105 28 14 4 3,001
CL8 Lam Dong 388 1,725 1,714 1,859 775 116 13 18 6,608
CL3 Quang Binh - - 136 319 119 - - - 575
CL1 Quang Ninh 228 464 554 276 135 11 - - 1,668
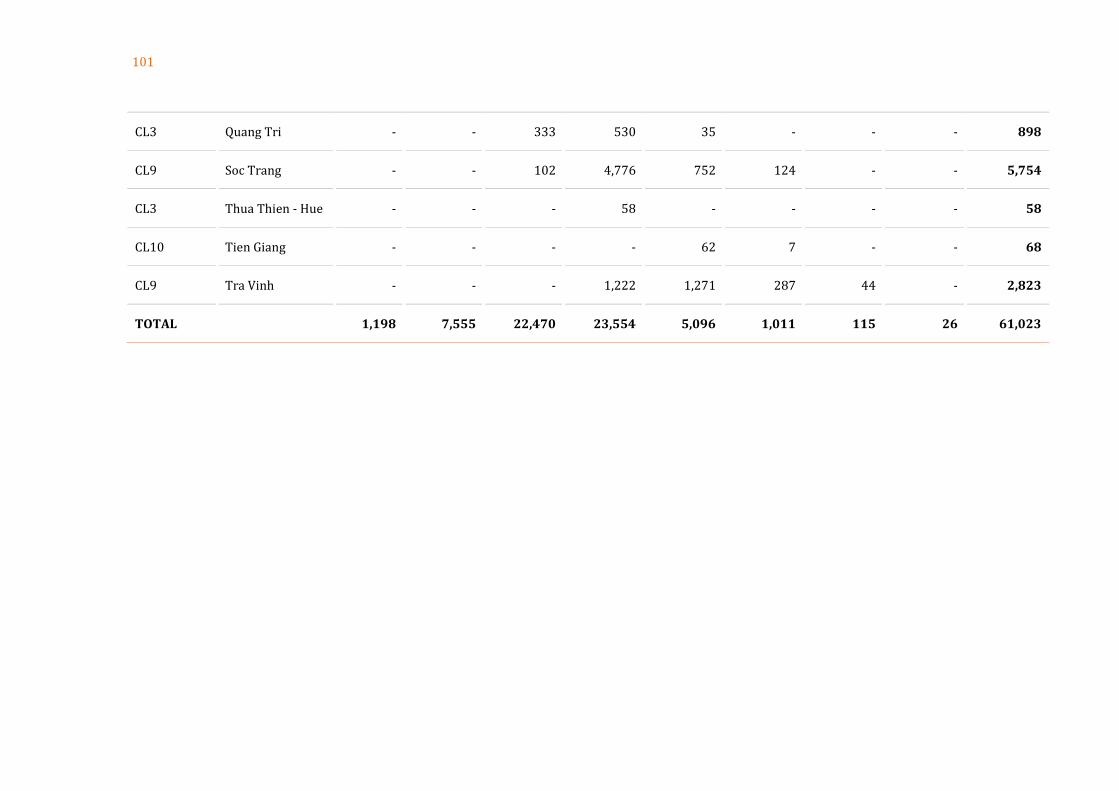
101
CL3 Quang Tri - - 333 530 35 - - - 898
CL9 Soc Trang - - 102 4,776 752 124 - - 5,754
CL3 Thua Thien - Hue - - - 58 - - - - 58
CL10 Tien Giang - - - - 62 7 - - 68
CL9 Tra Vinh - - - 1,222 1,271 287 44 - 2,823
TOTAL 1,198 7,555 22,470 23,554 5,096 1,011 115 26 61,023

102
Appendix IV
Technical potential land area per provincial cluster across wind speed ranges
Table 29: Technical potential wind power land area per national cluster across wind speed ranges expressed in km2
Cluster ID Province 4.5-5 m/s 5-5.5 m/s 5.5-6 m/s 6-6.5 m/s 6.5-7 m/s 7-7.5 m/s 7.5-8 m/s 8+ m/s Total
PCL1 Binh Thuan 5 200 123 11 339
PCL2 Ninh Thuan 1 7 22 81 75 51 28 20 285
PCL3 Khanh Hoa 3 3 9 11 15 6 5 4 56
PCL4 Khanh Hoa 1 2 4 2 4 1 3 1 18
PCL5 Phu Yen 3 22 49 21 7 3 105
PCL6 Binh Dinh 1 19 5 2 27
PCL7 Quang Ngai 2 3 8 11 1 25
PCL_F1 Binh Dinh 6 29 38 33 19 11 1 1 138
PCL_F2 Phu Yen 14 37 48 56 32 17 13 3 220
PCL_F3 Ninh Thuan 0 0 0 6 5 10 4 15 40
TOTAL 30 104 197 226 165 299 177 55 1253

103
Technical potential capacity per provincial cluster across wind speed ranges
Table 30: Technical potential wind power capacity per national cluster across wind speed ranges expressed in MW
Cluster ID Province 4.5-5 m/s 5-5.5 m/s 5.5-6 m/s 6-6.5 m/s 6.5-7 m/s 7-7.5 m/s 7.5-8 m/s 8+ m/s Total
PCL1 Binh Thuan - - - - 15 600 369 33 1,017
PCL2 Ninh Thuan 3 21 66 243 225 153 84 60 855
PCL3 Khanh Hoa 9 9 27 33 45 18 15 12 168
PCL4 Khanh Hoa 3 6 12 6 12 3 9 3 54
PCL5 Phu Yen 9 66 147 63 21 9 - - 315
PCL6 Binh Dinh - 3 57 15 6 - - - 81
PCL7 Quang Ngai 6 9 24 33 3 - - - 75
PCL_F1 Binh Dinh 18 87 114 99 57 33 3 3 414
PCL_F2 Phu Yen 42 111 144 168 96 51 39 9 660
PCL_F3 Ninh Thuan - - - 18 15 30 12 45 120
TOTAL 90 312 591 678 495 897 531 165 3759

104
Appendix V
LCOE Base Case calculation for the national cluster
Table 31: LCOE Base Case calculation for the national clusters (USD cents / kWh). Plant CapEx = 1870 USD/kW; WAC C= 10.8%; O&M costs = 50 USD/kW/year; Plant lifetime = 20 years.
* Based on centroid of core cluster with high wind speeds.
Cluster ID
Province
LCOE
4,5-5 m/s area
s
LCOE 5-5,5
m/s area
s
LCOE
5,5-6
m/s area
s
LCOE 6-6,5
m/s area
s
LCOE
6,5-7
m/s area
s
LCOE 7-7,5
m/s area
s
LCOE
7,5-8
m/s area
s
LCOE 8 m/s
and highe
r areas
Total cluster capacity (MW)
Distance to
closest road* (km)
Distance to
closest 220kV grid* (km)
Infrastr. on-cost (USD)
CapEx
Total (USD
)
Infrastr. cost -
size range
(MW)
Infrastr.
cost - size
range multipl
e
Infrastr. on-
cost on CapEx
(%)
FLH 1,399
1,822
2,245
2,667
3,090
3,513
3,936
4,359
CL9 Bac Lieu 20.3 15.6 12.7 10.6 9.2 8.1 7.2 6.5 3,292 4 3 58,887,500 1,888 600 5 1.0%
CL10 Ben Tre 20.5 15.8 12.8 10.8 9.3 8.2 7.3 6.6 632 6 39 27,054,800 1,913 600 1 2.3%
CL5 Dak Lak 20.3 15.6 12.7 10.7 9.2 8.1 7.2 6.5 5,001 2 5 96,088,000 1,889 600 8 1.0%
CL6 Dak Lak 20.6 15.9 12.9 10.8 9.3 8.2 7.3 6.6 7,069 13 48 401,569,200
1,927 600 12 3.0%
CL5 Gia Lai 20.3 15.6 12.7 10.7 9.2 8.1 7.2 6.5 17,442 3 4 336,115,800
1,889 600 29 1.0%
CL7 Gia Lai 20.5 15.7 12.8 10.7 9.3 8.2 7.3 6.6 3,086 3 33 119,784,500
1,909 600 5 2.1%
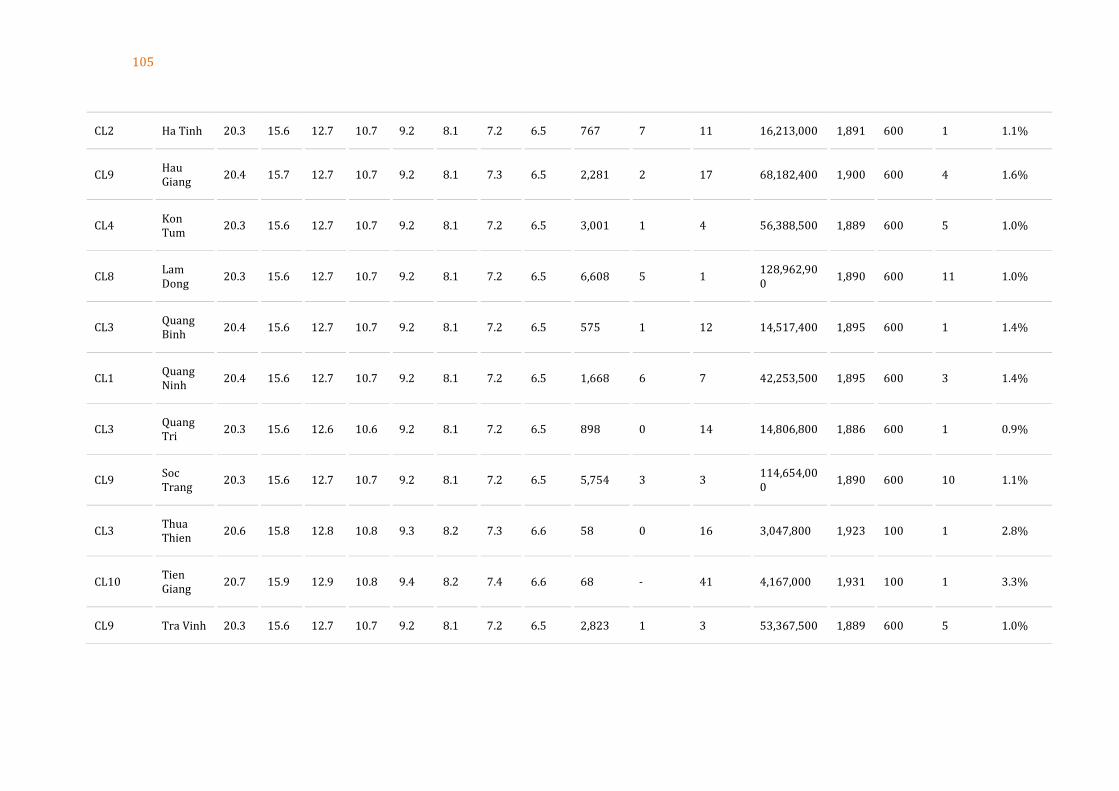
105
CL2 Ha Tinh 20.3 15.6 12.7 10.7 9.2 8.1 7.2 6.5 767 7 11 16,213,000 1,891 600 1 1.1%
CL9 Hau Giang
20.4 15.7 12.7 10.7 9.2 8.1 7.3 6.5 2,281 2 17 68,182,400 1,900 600 4 1.6%
CL4 Kon Tum
20.3 15.6 12.7 10.7 9.2 8.1 7.2 6.5 3,001 1 4 56,388,500 1,889 600 5 1.0%
CL8 Lam Dong
20.3 15.6 12.7 10.7 9.2 8.1 7.2 6.5 6,608 5 1 128,962,900
1,890 600 11 1.0%
CL3 Quang Binh
20.4 15.6 12.7 10.7 9.2 8.1 7.2 6.5 575 1 12 14,517,400 1,895 600 1 1.4%
CL1 Quang Ninh
20.4 15.6 12.7 10.7 9.2 8.1 7.2 6.5 1,668 6 7 42,253,500 1,895 600 3 1.4%
CL3 Quang Tri
20.3 15.6 12.6 10.6 9.2 8.1 7.2 6.5 898 0 14 14,806,800 1,886 600 1 0.9%
CL9 Soc Trang
20.3 15.6 12.7 10.7 9.2 8.1 7.2 6.5 5,754 3 3 114,654,000
1,890 600 10 1.1%
CL3 Thua Thien
20.6 15.8 12.8 10.8 9.3 8.2 7.3 6.6 58 0 16 3,047,800 1,923 100 1 2.8%
CL10 Tien Giang
20.7 15.9 12.9 10.8 9.4 8.2 7.4 6.6 68 - 41 4,167,000 1,931 100 1 3.3%
CL9 Tra Vinh 20.3 15.6 12.7 10.7 9.2 8.1 7.2 6.5 2,823 1 3 53,367,500 1,889 600 5 1.0%
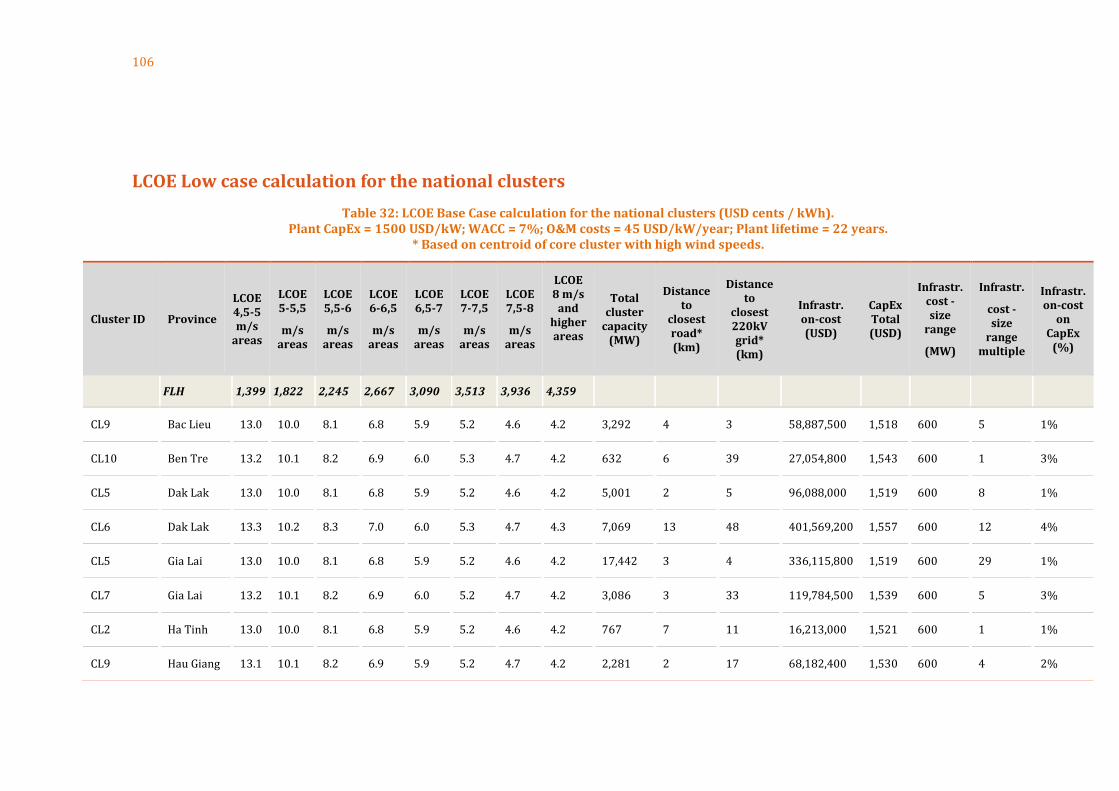
106
LCOE Low case calculation for the national clusters
Table 32: LCOE Base Case calculation for the national clusters (USD cents / kWh). Plant CapEx = 1500 USD/kW; WACC = 7%; O&M costs = 45 USD/kW/year; Plant lifetime = 22 years.
* Based on centroid of core cluster with high wind speeds.
Cluster ID Province
LCOE 4,5-5 m/s
areas
LCOE 5-5,5
m/s areas
LCOE 5,5-6
m/s areas
LCOE 6-6,5
m/s areas
LCOE 6,5-7
m/s areas
LCOE 7-7,5
m/s areas
LCOE 7,5-8
m/s areas
LCOE 8 m/s
and higher areas
Total cluster
capacity (MW)
Distance to
closest road* (km)
Distance to
closest 220kV grid* (km)
Infrastr. on-cost (USD)
CapEx Total (USD)
Infrastr. cost - size
range
(MW)
Infrastr.
cost - size
range multiple
Infrastr. on-cost
on CapEx
(%)
FLH 1,399 1,822 2,245 2,667 3,090 3,513 3,936 4,359
CL9 Bac Lieu 13.0 10.0 8.1 6.8 5.9 5.2 4.6 4.2 3,292 4 3 58,887,500 1,518 600 5 1%
CL10 Ben Tre 13.2 10.1 8.2 6.9 6.0 5.3 4.7 4.2 632 6 39 27,054,800 1,543 600 1 3%
CL5 Dak Lak 13.0 10.0 8.1 6.8 5.9 5.2 4.6 4.2 5,001 2 5 96,088,000 1,519 600 8 1%
CL6 Dak Lak 13.3 10.2 8.3 7.0 6.0 5.3 4.7 4.3 7,069 13 48 401,569,200 1,557 600 12 4%
CL5 Gia Lai 13.0 10.0 8.1 6.8 5.9 5.2 4.6 4.2 17,442 3 4 336,115,800 1,519 600 29 1%
CL7 Gia Lai 13.2 10.1 8.2 6.9 6.0 5.2 4.7 4.2 3,086 3 33 119,784,500 1,539 600 5 3%
CL2 Ha Tinh 13.0 10.0 8.1 6.8 5.9 5.2 4.6 4.2 767 7 11 16,213,000 1,521 600 1 1%
CL9 Hau Giang 13.1 10.1 8.2 6.9 5.9 5.2 4.7 4.2 2,281 2 17 68,182,400 1,530 600 4 2%

107
CL4 Kon Tum 13.0 10.0 8.1 6.8 5.9 5.2 4.6 4.2 3,001 1 4 56,388,500 1,519 600 5 1%
CL8 Lam Dong 13.0 10.0 8.1 6.8 5.9 5.2 4.6 4.2 6,608 5 1 128,962,900 1,520 600 11 1%
CL3 Quang Binh
13.1 10.0 8.1 6.9 5.9 5.2 4.6 4.2 575 1 12 14,517,400 1,525 600 1 2%
CL1 Quang Ninh
13.1 10.0 8.1 6.9 5.9 5.2 4.6 4.2 1,668 6 7 42,253,500 1,525 600 3 2%
CL3 Quang Tri 13.0 10.0 8.1 6.8 5.9 5.2 4.6 4.2 898 0 14 14,806,800 1,516 600 1 1%
CL9 Soc Trang 13.0 10.0 8.1 6.8 5.9 5.2 4.6 4.2 5,754 3 3 114,654,000 1,520 600 10 1%
CL3 Thua Thien
13.3 10.2 8.3 6.9 6.0 5.3 4.7 4.3 58 0 16 3,047,800 1,553 100 1 4%
CL10 Tien Giang 13.3 10.2 8.3 7.0 6.0 5.3 4.7 4.3 68 - 41 4,167,000 1,561 100 1 4%
CL9 Tra Vinh 13.0 10.0 8.1 6.8 5.9 5.2 4.6 4.2 2,823 1 3 53,367,500 1,519 600 5 1%

108
Appendix VI
LCOE Base Case calculation for the provincial clusters
Table 33: LCOE Base Case calculation for the provincial clusters (USD cents / kWh). Plant CapEx = 1870 USD/kW; WACC= 10.8%; O&M costs = 50 USD/kW/year; Plant lifetime = 20 years.
* Based on centroid of core cluster with high wind speeds. ** Distance to 110kV grid point used (due to the size of the project suitable for the connection)
Cluster ID
Province
LCOE 4,5-5 m/s
areas
LCOE 5-5,5
m/s areas
LCOE 5,5-6
m/s areas
LCOE 6-6,5
m/s areas
LCOE 6,5-7
m/s areas
LCOE 7-7,5
m/s areas
LCOE 7,5-8
m/s areas
LCOE 8 m/s
and higher areas
Total cluster
capacity (MW)
Distance to
closest road* (km)
Distance to
closest 220kV grid* (km)
Infrastr. on-cost (USD)
CapEx Total (USD/ kW)
Infrastr. cost - size
range
(MW)
Infrastr.
cost - size
range multiple
Infrastr. on-cost
on CapEx
(%)
FLH 1,399 1,822 2,245 2,667 3,090 3,513 3,936 4,359
PCL_F1 Binh Dinh
20.61 15.82 12.84 10.81 9.33 8.21 7.32 6.61 414 10 26 21,805,200 1,923 450 1 2.8%
PCL_F2 Phu Yen 20.47 15.72 12.76 10.74 9.27 8.15 7.28 6.57 660 7 32 24,774,200 1,908 600 1 2.0%
PCL_F3 Ninh
Thuan 20.75 15.94 12.94 10.88 9.40 8.26 7.38 6.66 120 9 23 8,304,100 1,939 150 1 3.7%
PCL1 Binh
Thuan 20.40 15.66 12.71 10.70 9.23 8.12 7.25 6.55 1,017 4 11 29,633,200 1,899 600 2 1.6%
PCL2 Ninh
Thuan 20.34 15.62 12.68 10.67 9.21 8.10 7.23 6.53 855 7 18 19,026,100 1,892 600 1 1.2%
PCL3 Khanh 20.66 15.87 12.88 10.84 9.35 8.23 7.34 6.63 168 0 8 9,893,800 1,929 300 1 3.1%

109
Hoa
PCL4 Khanh
Hoa 20.78 15.96 12.95 10.90 9.41 8.28 7.39 6.67 54 4 4 3,921,900 1,943 100 1 3.9%
PCL5 Phu Yen 20.65 15.86 12.87 10.83 9.35 8.22 7.34 6.63 315 6 21 18,224,450 1,928 450 1 3.1%
PCL6 Binh Dinh
20.47 15.72 12.76 10.74 9.27 8.15 7.28 6.57 81 1 15 3,044,600 1,908 100 1 2.0%
PCL7 Quang Ngai
20.59 15.81 12.83 10.80 9.32 8.20 7.32 6.61 75 4 4 3,760,000 1,920 100 1 2.7%

110
LCOE Low case calculation for the provincial clusters
Table 34: LCOE Base Case calculation for the provincial clusters (USD cents / kWh). Plant CapEx = 1500 USD/kW; WACC = 7%; O&M costs = 45 USD/kW/year; Plant lifetime = 22 years.
* Based on centroid of core cluster with high wind speeds. ** Distance to 110kV grid point used (due to the size of the project suitable for the connection)
Cluster ID
Province
LCOE 4,5-5 m/s
areas
LCOE 5-5,5
m/s areas
LCOE 5,5-6
m/s areas
LCOE 6-6,5
m/s areas
LCOE 6,5-7
m/s areas
LCOE 7-7,5
m/s areas
LCOE 7,5-8
m/s areas
LCOE 8 m/s
and higher areas
Total cluster
capacity (MW)
Distance to
closest road* (km)
Distance to
closest 220kV grid* (km)
Infrastr. on-cost (USD)
CapEx Total (USD/ kW)
Infrastr. cost - size
range
(MW)
Infrastr.
cost - size
range multiple
Infrastr. on-cost
on CapEx
(%)
FLH 1,399 1,822 2,245 2,667 3,090 3,513 3,936 4,359
PCL_F1 Binh Dinh
13.25 10.18 8.26 6.95 6.00 5.28 4.71 4.25 414 10 26 21,805,200 1,553 450 1 3.5%
PCL_F2 Phu Yen 13.15 10.10 8.20 6.90 5.95 5.24 4.68 4.22 660 7 32 24,774,200 1,538 600 1 2.5%
PCL_F3 Ninh
Thuan 13.36 10.26 8.33 7.01 6.05 5.32 4.75 4.29 120 9 23** 8,304,100 1,569 150 1 4.6%
PCL1 Binh
Thuan 13.10 10.06 8.16 6.87 5.93 5.22 4.66 4.20 1,017 4 11 29,633,200 1,529 600 2 1.9%
PCL2 Ninh
Thuan 13.05 10.02 8.14 6.85 5.91 5.20 4.64 4.19 855 7 18 19,026,100 1,522 600 1 1.5%
PCL3 Khanh
Hoa 13.29 10.21 8.28 6.97 6.02 5.29 4.72 4.27 168 0 8 9,893,800 1,559 300 1 3.9%
PCL4 Khanh
Hoa 13.38 10.27 8.34 7.02 6.06 5.33 4.76 4.29 54 4 4** 3,921,900 1,573 100 1 4.8%

111
PCL5 Phu Yen 13.28 10.20 8.28 6.97 6.01 5.29 4.72 4.26 315 6 21 18,224,450 1,558 450 1 3.9%
PCL6 Binh Dinh
13.15 10.10 8.20 6.90 5.95 5.24 4.68 4.22 81 1 15** 3,044,600 1,538 100 1 2.5%
PCL7 Quang Ngai
13.23 10.16 8.25 6.94 5.99 5.27 4.70 4.25 75 4 4** 3,760,000 1,550 100 1 3.3%
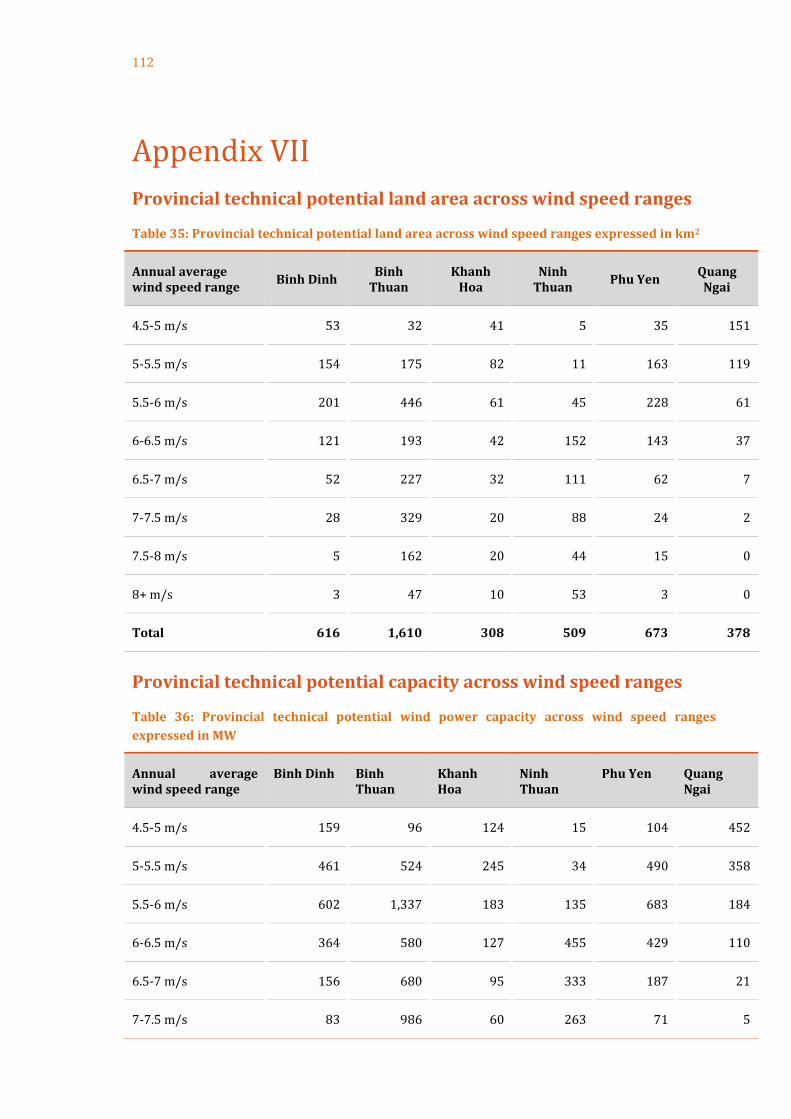
112
Appendix VII
Provincial technical potential land area across wind speed ranges
Table 35: Provincial technical potential land area across wind speed ranges expressed in km2
Annual average wind speed range
Binh Dinh Binh
Thuan Khanh
Hoa Ninh
Thuan Phu Yen
Quang Ngai
4.5-5 m/s 53 32 41 5 35 151
5-5.5 m/s 154 175 82 11 163 119
5.5-6 m/s 201 446 61 45 228 61
6-6.5 m/s 121 193 42 152 143 37
6.5-7 m/s 52 227 32 111 62 7
7-7.5 m/s 28 329 20 88 24 2
7.5-8 m/s 5 162 20 44 15 0
8+ m/s 3 47 10 53 3 0
Total 616 1,610 308 509 673 378
Provincial technical potential capacity across wind speed ranges
Table 36: Provincial technical potential wind power capacity across wind speed ranges
expressed in MW
Annual average wind speed range
Binh Dinh Binh Thuan
Khanh Hoa
Ninh Thuan
Phu Yen Quang Ngai
4.5-5 m/s 159 96 124 15 104 452
5-5.5 m/s 461 524 245 34 490 358
5.5-6 m/s 602 1,337 183 135 683 184
6-6.5 m/s 364 580 127 455 429 110
6.5-7 m/s 156 680 95 333 187 21
7-7.5 m/s 83 986 60 263 71 5

113
7.5-8 m/s 14 487 60 131 45 0
8+ m/s 8 140 29 160 10 1
Total 1,847 4,829 923 1,527 2,018 1,133
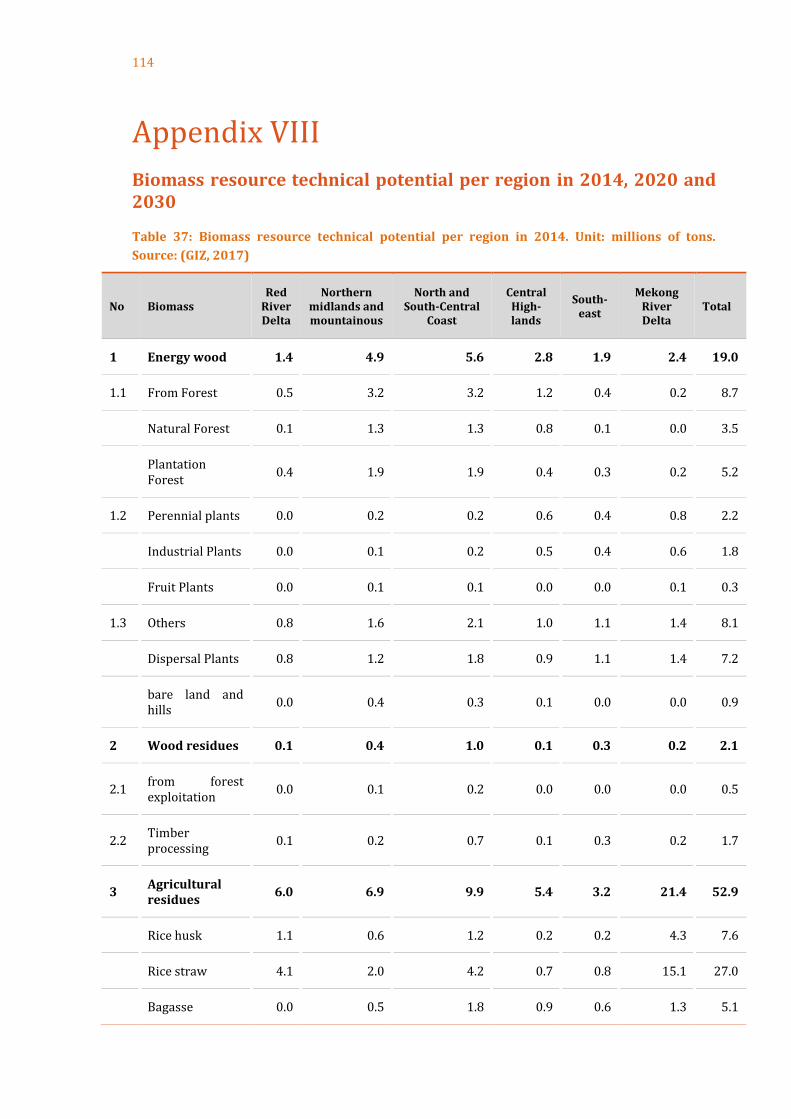
114
Appendix VIII
Biomass resource technical potential per region in 2014, 2020 and 2030
Table 37: Biomass resource technical potential per region in 2014. Unit: millions of tons.
Source: (GIZ, 2017)
No Biomass Red
River Delta
Northern midlands and mountainous
North and South-Central
Coast
Central High-lands
South-east
Mekong River Delta
Total
1 Energy wood 1.4 4.9 5.6 2.8 1.9 2.4 19.0
1.1 From Forest 0.5 3.2 3.2 1.2 0.4 0.2 8.7
Natural Forest 0.1 1.3 1.3 0.8 0.1 0.0 3.5
Plantation Forest
0.4 1.9 1.9 0.4 0.3 0.2 5.2
1.2 Perennial plants 0.0 0.2 0.2 0.6 0.4 0.8 2.2
Industrial Plants 0.0 0.1 0.2 0.5 0.4 0.6 1.8
Fruit Plants 0.0 0.1 0.1 0.0 0.0 0.1 0.3
1.3 Others 0.8 1.6 2.1 1.0 1.1 1.4 8.1
Dispersal Plants 0.8 1.2 1.8 0.9 1.1 1.4 7.2
bare land and hills
0.0 0.4 0.3 0.1 0.0 0.0 0.9
2 Wood residues 0.1 0.4 1.0 0.1 0.3 0.2 2.1
2.1 from forest exploitation
0.0 0.1 0.2 0.0 0.0 0.0 0.5
2.2 Timber processing
0.1 0.2 0.7 0.1 0.3 0.2 1.7
3 Agricultural residues
6.0 6.9 9.9 5.4 3.2 21.4 52.9
Rice husk 1.1 0.6 1.2 0.2 0.2 4.3 7.6
Rice straw 4.1 2.0 4.2 0.7 0.8 15.1 27.0
Bagasse 0.0 0.5 1.8 0.9 0.6 1.3 5.1

115
Others 0.8 3.8 2.7 3.6 1.6 0.7 13.2
Total 7.5 12.2 16.5 8.3 5.4 24.1 74.1

116
Table 38: Biomass resource technical potential per region in 2020. Unit: millions of tons. Source: (GIZ, 2017)
No Biomass Red
River Delta
Northern midlands and mountainous
North and South-Central Coast
Central High-lands
South-east
Mekong River Delta
Total
1 Energy wood 1.6 6.0 6.7 3.2 2.2 2.8 22.4
1.1 From Forest 0.6 4.1 4.1 1.5 0.6 0.3 11.3
Natural Forest 0.1 1.7 1.7 1.0 0.1 0.0 4.6
Plantation Forest
0.5 2.4 2.5 0.5 0.4 0.3 6.7
1.2 Perennial plants
0.0 0.2 0.3 0.5 0.5 0.9 2.4
Industrial Plants
0.0 0.1 0.2 0.5 0.4 0.7 2.0
Fruit Plants 0.0 0.1 0.1 0.0 0.1 0.2 0.4
1.3 Others 0.9 1.7 2.3 1.1 1.2 1.6 8.7
Dispersal Plants
0.9 1.3 2.0 1.0 1.2 1.6 7.9
bare land and hills
0.0 0.4 0.3 0.1 0.0 0.0 0.9
2 Wood residues
0.2 0.5 1.4 0.2 0.5 0.4 3.2
2.1 from forest exploitation
0.0 0.2 0.3 0.0 0.0 0.1 0.6
2.2 Timber processing
0.1 0.3 1.2 0.2 0.5 0.3 2.6
3 Agricultural residues
7.3 10.6 11.5 5.0 5.8 22.2 62.3
Rice husk 1.3 0.7 1.3 0.3 0.2 4.1 7.9
Rice straw 4.5 2.6 4.5 0.9 0.8 14.6 28.0
Bagasse 0.1 0.7 2.2 0.6 1.3 1.8 6.6
Others 1.4 6.6 3.5 3.2 3.4 1.6 19.8
Total 9.0 17.1 19.6 8.4 8.5 25.3 88.0

117
Table 39: Biomass resource technical potential per region in 2030. Unit: millions of tons. Source: (GIZ, 2017)
No Biomass Red
River Delta
Northern midlands and mountainous
North and South-Central
Coast
Central High-lands
South-east
Mekong River Delta
Total
1 Energy wood 1.9 7.4 8.2 3.8 2.6 3.3 27.2
1.1 From Forest 0.8 5.3 5.3 2.0 0.7 0.4 14.4
Natural Forest 0.1 2.2 2.1 1.3 0.1 0.0 5.9
Plantation Forest
0.7 3.1 3.2 0.6 0.6 0.4 8.5
1.2 Perennial plants 0.1 0.3 0.3 0.6 0.6 1.0 2.8
Industrial Plants 0.0 0.1 0.2 0.6 0.5 0.8 2.2
Fruit Plants 0.1 0.1 0.1 0.0 0.1 0.2 0.6
1.3 Others 1.0 1.9 2.6 1.3 1.3 1.8 10.0
Dispersal Plants 1.0 1.5 2.3 1.2 1.3 1.8 9.1
bare land and hills
0.0 0.4 0.3 0.1 0.0 0.0 0.8
2 Wood residues 0.2 0.6 1.6 0.2 0.5 0.4 3.5
2.1 from forest exploitation
0.1 0.2 0.4 0.0 0.0 0.1 0.8
2.2 Timber processing
0.1 0.4 1.2 0.2 0.5 0.3 2.7
3 Agricultural residues
7.6 11.9 12.5 5.7 6.6 22.8 67.0
Rice husk 1.3 0.8 1.3 0.3 0.2 4.2 8.0
Rice straw 4.5 2.7 4.5 0.9 0.8 14.8 28.3
Bagasse 0.1 0.7 2.4 0.6 1.5 1.9 7.2
Others 1.7 7.8 4.2 3.9 4.0 1.9 23.4
Total 9.7 20.0 22.2 9.7 9.7 26.5 97.7
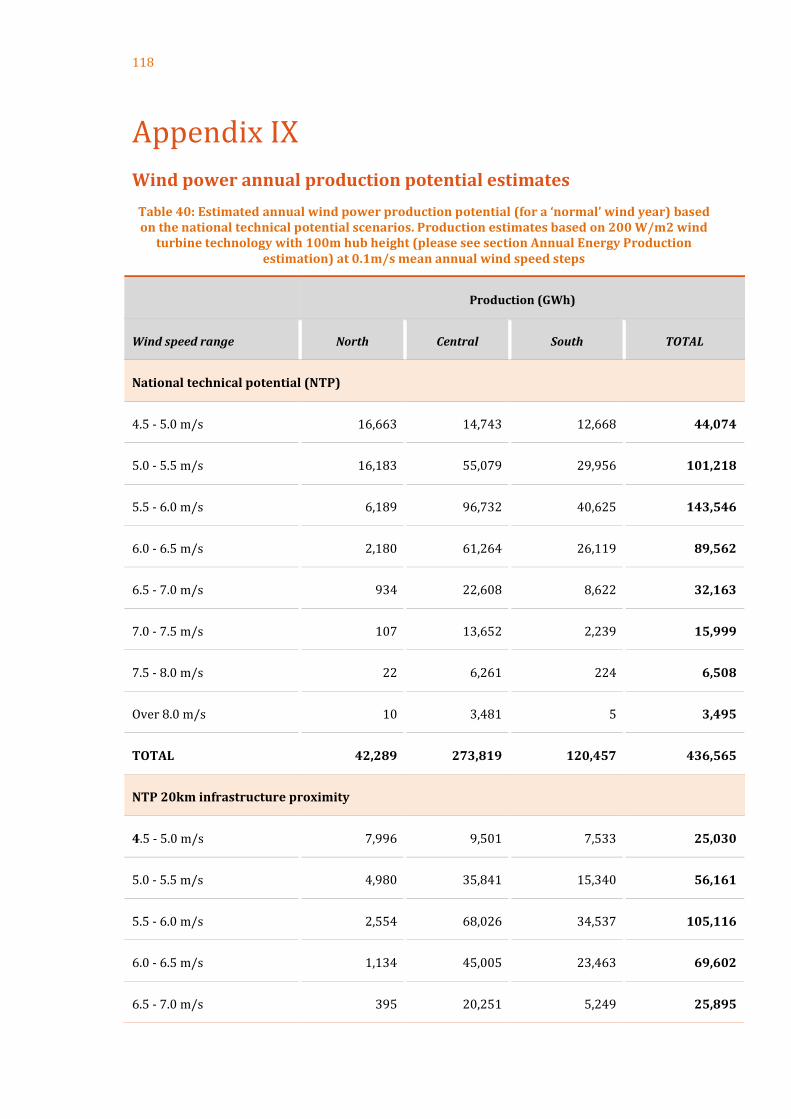
118
Appendix IX
Wind power annual production potential estimates
Table 40: Estimated annual wind power production potential (for a ‘normal’ wind year) based on the national technical potential scenarios. Production estimates based on 200 W/m2 wind
turbine technology with 100m hub height (please see section Annual Energy Production estimation) at 0.1m/s mean annual wind speed steps
Production (GWh)
Wind speed range North Central South TOTAL
National technical potential (NTP)
4.5 - 5.0 m/s 16,663 14,743 12,668 44,074
5.0 - 5.5 m/s 16,183 55,079 29,956 101,218
5.5 - 6.0 m/s 6,189 96,732 40,625 143,546
6.0 - 6.5 m/s 2,180 61,264 26,119 89,562
6.5 - 7.0 m/s 934 22,608 8,622 32,163
7.0 - 7.5 m/s 107 13,652 2,239 15,999
7.5 - 8.0 m/s 22 6,261 224 6,508
Over 8.0 m/s 10 3,481 5 3,495
TOTAL 42,289 273,819 120,457 436,565
NTP 20km infrastructure proximity
4.5 - 5.0 m/s 7,996 9,501 7,533 25,030
5.0 - 5.5 m/s 4,980 35,841 15,340 56,161
5.5 - 6.0 m/s 2,554 68,026 34,537 105,116
6.0 - 6.5 m/s 1,134 45,005 23,463 69,602
6.5 - 7.0 m/s 395 20,251 5,249 25,895

119
7.0 - 7.5 m/s 55 12,645 1,398 14,098
7.5 - 8.0 m/s 4 6,066 208 6,279
Over 8.0 m/s 2 3,361 5 3,367
TOTAL 17,120 200,696 87,733 305,549
NTP 10km infrastructure proximity
4.5 - 5.0 m/s 4,510 4,841 4,034 13,384
5.0 - 5.5 m/s 3,077 18,694 7,163 28,934
5.5 - 6.0 m/s 1,691 35,557 18,178 55,426
6.0 - 6.5 m/s 804 23,641 14,427 38,873
6.5 - 7.0 m/s 142 12,845 2,632 15,619
7.0 - 7.5 m/s 1 9,281 362 9,644
7.5 - 8.0 m/s 3 3,988 119 4,110
Over 8.0 m/s 0 1,774 5 1,779
TOTAL 10,228 110,622 46,918 167,768
NTP No croplands
4.5 - 5.0 m/s 10,706 9,910 4,213 24,829
5.0 - 5.5 m/s 10,568 31,473 7,448 49,489
5.5 - 6.0 m/s 4,198 42,960 3,497 50,655
6.0 - 6.5 m/s 1,306 22,997 949 25,252
6.5 - 7.0 m/s 575 7,738 208 8,521
7.0 - 7.5 m/s 89 3,151 35 3,275
7.5 - 8.0 m/s 14 1,670 35 1,718
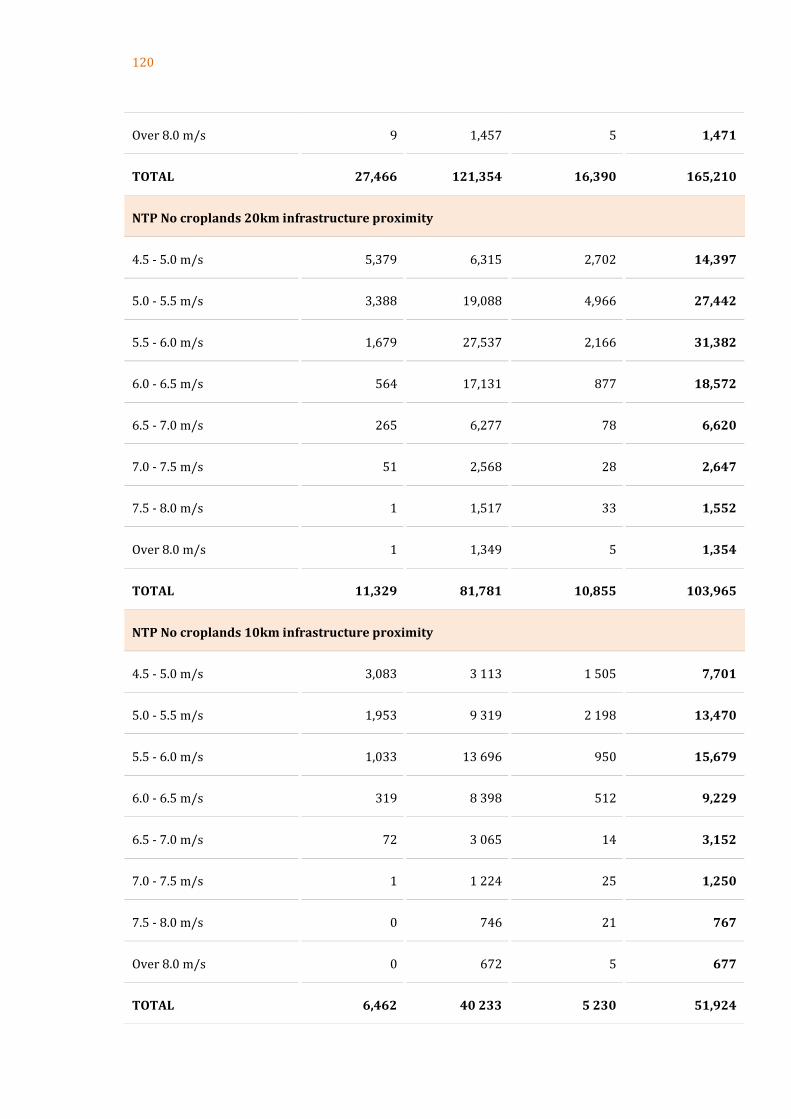
120
Over 8.0 m/s 9 1,457 5 1,471
TOTAL 27,466 121,354 16,390 165,210
NTP No croplands 20km infrastructure proximity
4.5 - 5.0 m/s 5,379 6,315 2,702 14,397
5.0 - 5.5 m/s 3,388 19,088 4,966 27,442
5.5 - 6.0 m/s 1,679 27,537 2,166 31,382
6.0 - 6.5 m/s 564 17,131 877 18,572
6.5 - 7.0 m/s 265 6,277 78 6,620
7.0 - 7.5 m/s 51 2,568 28 2,647
7.5 - 8.0 m/s 1 1,517 33 1,552
Over 8.0 m/s 1 1,349 5 1,354
TOTAL 11,329 81,781 10,855 103,965
NTP No croplands 10km infrastructure proximity
4.5 - 5.0 m/s 3,083 3 113 1 505 7,701
5.0 - 5.5 m/s 1,953 9 319 2 198 13,470
5.5 - 6.0 m/s 1,033 13 696 950 15,679
6.0 - 6.5 m/s 319 8 398 512 9,229
6.5 - 7.0 m/s 72 3 065 14 3,152
7.0 - 7.5 m/s 1 1 224 25 1,250
7.5 - 8.0 m/s 0 746 21 767
Over 8.0 m/s 0 672 5 677
TOTAL 6,462 40 233 5 230 51,924
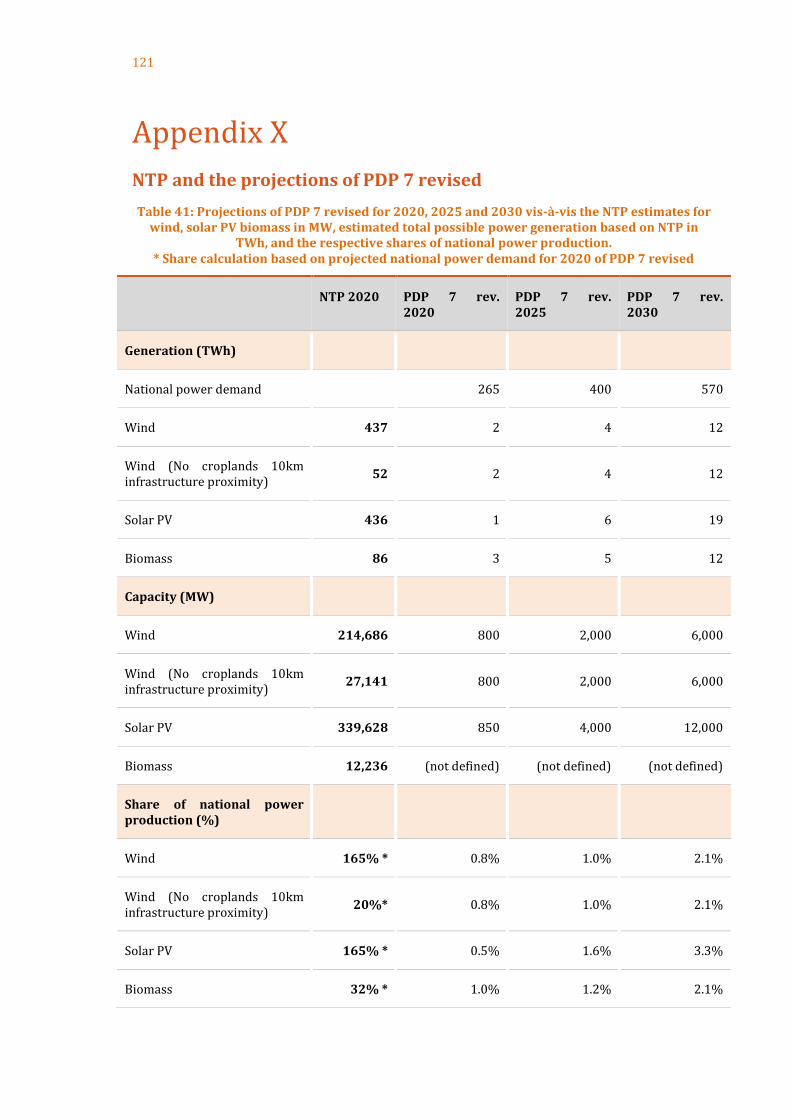
121
Appendix X
NTP and the projections of PDP 7 revised
Table 41: Projections of PDP 7 revised for 2020, 2025 and 2030 vis-à-vis the NTP estimates for wind, solar PV biomass in MW, estimated total possible power generation based on NTP in
TWh, and the respective shares of national power production. * Share calculation based on projected national power demand for 2020 of PDP 7 revised
NTP 2020 PDP 7 rev. 2020
PDP 7 rev. 2025
PDP 7 rev. 2030
Generation (TWh)
National power demand 265 400 570
Wind 437 2 4 12
Wind (No croplands 10km infrastructure proximity)
52 2 4 12
Solar PV 436 1 6 19
Biomass 86 3 5 12
Capacity (MW)
Wind 214,686 800 2,000 6,000
Wind (No croplands 10km infrastructure proximity)
27,141 800 2,000 6,000
Solar PV 339,628 850 4,000 12,000
Biomass 12,236 (not defined) (not defined) (not defined)
Share of national power production (%)
Wind 165% * 0.8% 1.0% 2.1%
Wind (No croplands 10km infrastructure proximity)
20%* 0.8% 1.0% 2.1%
Solar PV 165% * 0.5% 1.6% 3.3%
Biomass 32% * 1.0% 1.2% 2.1%

122
MoIT/GIZ Energy Support Progamme
Unit 042A, 4th Floor, Coco Building, T +84 (0)4 3941 2605 E [email protected]
14 Thuy Khue, Tay Ho District, Hanoi, Vietnam F +84 (0)4 3941 2606 W www.giz.de