macroeconomic consequences of the infrastructure
TRANSCRIPT

MOODY’S ANALYTICS MacroeconoMic consequences of the infrastructure investMent and Jobs act & build back better fraMework 1
Macroeconomic Consequences of the Infrastructure Investment and Jobs Act & Build Back Better FrameworkINTRODUCTION
Lawmakers in Washington DC continue to work feverishly on another massive fiscal plan, including a more than $1 trillion bipartisan infrastructure deal and a $1.75 trillion package of social spending and tax breaks to lower- and middle-income households that the Biden administration and congressional Democrats hope to pass into law via the budget reconciliation process. While the legislation remains in flux, it is similar in spirit to the Build Back Better agenda President Biden proposed earlier this year. If this is close to what becomes law, it will strengthen long-term economic growth, the benefits of which would mostly accrue to lower- and middle-income Americans. The legislation is more-or-less paid for on a static basis and more than paid for on a dynamic basis through higher taxes on multinational corporations and the well-to-do and a range of several other pay-fors. Concerns that the plan will ignite undesirably high inflation and an overheating economy are overdone, as the fiscal support it provides will ensure the economy only returns to full employment from the recession caused by the COVID-19 pandemic. Because the package includes a myriad of spending and tax initiatives, some of which are new and uncertain, implementing this legislation as intended and in a timely way will take deft governance. In this white paper, we assess the macroeconomic impact of both the bipartisan infrastructure deal legislation and the reconciliation package of social spending and tax changes.
ANALYSIS04 NOVEMBER, 2021
Prepared by
Mark [email protected] Economist
Bernard [email protected] Director
Contact Us
U.S./Canada+1.866.275.3266
EMEA+44.20.7772.5454 (London)+420.224.222.929 (Prague)
Asia/Pacific +852.3551.3077
All Others+1.610.235.5299
Webwww.economy.comwww.moodysanalytics.com

MOODY’S ANALYTICS MacroeconoMic consequences of the infrastructure investMent and Jobs act & build back better fraMework 2
Macroeconomic consequences of the infrastructure investment and Jobs act & build back better frameworkBY MARK ZANDI AND BERNARD YAROS
Lawmakers in Washington DC continue to work feverishly on another massive fiscal plan,1 including a more than $1 trillion bipartisan infrastructure deal and a $1.75 trillion package of social spending and tax breaks to lower- and middle-income households that the Biden administration and congressional Democrats hope
to pass into law via the budget reconciliation process. While the legislation remains in flux, it is similar in spirit to the Build Back Better agenda President Biden proposed earlier this year. If this is close to what becomes law, it will strengthen long-term economic growth, the benefits of which would mostly accrue to lower- and middle-income Americans. The legislation is more-or-less paid for on a static basis and more than paid for on a dynamic basis through higher taxes on multinational corporations and the well-to-do and several other pay-fors (see Chart 1). Concerns that the plan will ignite undesirably high inflation and an overheating economy are overdone, as the fiscal support it provides will ensure the economy only returns to full employment from the recession caused by the COVID-19 pandemic. Because the package includes a myriad of spending and tax initiatives, some of which are new and uncertain, implementing this legislation as intended and in a timely way will take deft governance. In this white paper, we assess the macroeconomic impact of both the bipartisan infrastructure legislation and the reconciliation package of social spending and tax changes.
Infrastructure Investment and Jobs ActThe Infrastructure Investment and Jobs
Act, which has bipartisan support, includes more than $1 trillion in transportation and other physical infrastructure spending over the decade 2022 to 2031, of which close to $600 billion is additional funding (see Table 1). Spending on roads and bridges, power systems, rail, broadband, water systems, and public transit gets the largest boost.2
To help pay for the legislation, lawmak-ers have pieced together several pay-fors, ranging from a delay in a rule affecting the treatment of drug rebates to an extension of the higher mortgage guarantee fees charged by Fannie Mae and Freddie Mac.
The legislation adds modestly to budget deficits over the 10-year budget horizon on a static basis, but meaningfully less so on a dynamic basis, as the increased infrastruc-ture spending supports stronger economic growth, which in turn generates more tax revenues and reduces other government spending on income support programs such as unemployment insurance.
Increasing infrastructure investment has significant macroeconomic benefits. Near term it has a large so-called multiplier—the increase in GDP for a dollar increase in in-vestment. It is among the highest compared with other types of federal government spending and tax policy.3 Long term, eco-
nomic research is in strong agreement that public infrastructure provides a significantly positive contribution to GDP and employ-ment. It lowers business costs and thus improves competitiveness and productivity, allows workers to live closer to where they work, and thus reduces commute times, improves labor participation, and reduces carbon emissions.
There is more debate on whether public infrastructure spending boosts GDP by as much as private capital does. One reason for this is that, unlike private investment, federal investment is not driven solely by market forc-es or maximizing economic returns. Federal infrastructure also has the goal of improving

MOODY’S ANALYTICS MacroeconoMic consequences of the infrastructure investMent and Jobs act & build back better fraMework 3
quality of life, reducing inequities, supporting the work of the federal government itself, and addressing other objectives that policymakers may have. The federal government also impos-es various requirements that can increase the costs of the projects that it funds. We estimate the average return on private capital to be close to 10%—that is, a $1 increase in private investment, all else being equal, increases GDP by 10 cents over a year—while it is almost 7% for public infrastructure.4
Even so, this is an especially economically propitious time to increase public infrastruc-ture investment, since the return on that investment is substantially greater than the government’s cost of financing given the ex-traordinarily low interest rates. Thirty-year Treasury bond yields are close to 2%, while the return on almost any public infrastructure project is likely to be meaningfully greater than that.
Build Back Better frameworkThe $1.75 trillion reconciliation package
includes increased spending on various so-cial programs similar to those proposed in Biden’s American Family Plan (see Table 2). There are substantial funds in the package for early childhood and higher education, child- and eldercare, housing, healthcare, and climate change mitigation. There are also substantial tax breaks for lower-in-come households, including an expansion of the earned income tax credit and an extension of the expanded child tax credit that was included as part of the American Rescue Plan passed into law in March; fam-ilies will stop getting monthly checks at year’s end unless lawmakers extend them.
To help pay for the package, lawmakers are proposing higher taxes on multination-al corporations and well-to-do individu-als, and more reve-nues from closing the tax gap. There is also a new 1% excise tax on share repurchases or a stock buyback tax. Companies buy back their stock to re-turn profits to share-holders and support
their stock price. Repurchases have become increasingly popular among publicly traded companies and will total close to $800 billion this year. The package also raises meaning-fully savings from repealing the Trump ad-ministration’s prescription drug rebate rule, which would have raised Medicare Part D program costs.
While the particulars of the reconciliation package are still unsure, it is fair to say it is paid for, both on a static, and particularly on a dynamic basis.5 This conclusion abstracts from the considerable uncertainties over the actual revenues that will be generated from such policies as closing the tax gap or implementing the new share repurchase tax. There is also the possibility that policies in the package that are set to expire during the budget horizon (to ensure they do not add to deficits outside the horizon and violate budget reconciliation rules) would instead be extended given likely political pressure to continue funding. However, this does not necessarily mean that any future extension of these policies would not also be paid for.
The reconciliation package would provide a near-term boost to the economy given the tax cuts in the plan for lower-income indi-viduals and as spending on the various social programs gears up. It also would have several important long-term economic benefits. First, it would increase the labor force partic-ipation and hours worked of mostly lower-in-come women. It would do this by making childcare more affordable, and expanding the earned income tax credit that encourages low-income households to work. The package makes it more cost effective for more parents to work, and the extra time and scheduling
flexibility created by childcare allows them to work more hours.
Research on the labor supply impact of lower childcare costs shows there are mean-ingful advantages, and our own research is consistent with this.6 Accessible childcare facilitated by federal support to childcare providers has especially strong employment effects for single mothers, mothers with young children, and lower-income moms. Moreover, the personal financial costs to parents who leave the workforce to care for a young child because of the high cost of child-care are high. They accumulate fewer skills, and their productivity is diminished, resulting in lower wages when the parent eventually returns to the workforce. The effect tends to fade only after several decades. Further, a woman’s career progression is reduced even more if she has more than three children, and the penalty to wages is never made up. Even when women remain engaged through part-time work, their career progress is reduced.
A second important macroeconomic im-pact of the reconciliation package is that it would increase labor productivity by raising the educational attainment of the workforce via universal pre-K, expanded funding for higher education. Increased funding for work-force development would also lift the skill level of the workforce. The positive impact on educational attainment and productivity would of course play out over many years—well beyond the 10-year budget horizon con-sidered in this analysis.
Stronger and fairer growthWe use the Moody’s Analytics model of
the U.S. and global economies to quantify the impact of the bipartisan infrastructure deal and the reconciliation package on the econ-omy.7 We consider five scenarios. To provide context, the first scenario assumes that Biden was unable to enact any major fiscal policy changes, including the American Rescue Plan that was passed into law in March. The sec-ond scenario assumes that lawmakers fail to pass any additional fiscal policy legislation beyond the ARP. The third and fourth sce-narios assume the bipartisan infrastructure deal and the reconciliation package are each passed into law, respectively, but not the oth-er. And the final scenario assumes that both the bipartisan infrastructure deal and the rec-onciliation package become law.
July 2021 1
-1.0
-0.5
0.0
0.5
1.0
1.5
2.0
2.5
22 23 24 25 26 27 28 29 30 31
Other pay-fors Tax increasesChild & Earned Income Tax Credits HealthcareClean energy and climate InfrastructureChildcare, education, housing & equity Net deficit impact
Chart 1: Paying for BBBStatic federal budget impact, % of GDP
Sources: CBO, CRFB, JCT, White House, Moody’s Analytics

MOODY’S ANALYTICS MacroeconoMic consequences of the infrastructure investMent and Jobs act & build back better fraMework 4
The Moody’s Analytics model is simulated over the decade through 2031. This is consis-tent with the Congressional Budget Office’s horizon for the federal government’s budget and policy analysis. The assumption is that the fiscal policies considered will become law by the end of this year and be implemented beginning in 2022. We also assume there are no other significant fiscal policy changes. Monetary policy is determined in the model based on the Federal Reserve Board’s recent-ly implemented framework for conducting monetary policy in which the Fed has com-mitted not to begin normalizing interest rates until the economy is at full employment and inflation has been consistently above the Fed’s 2% inflation target. We assume that the worst of the COVID-19 crisis and its econom-ic fallout are over, and that the pandemic will continue to wind down.
The bipartisan infrastructure deal provides a modest increase in infrastructure spending and it thus supports only a modestly stronger economy (see Table 3). The most immediate impact in early 2022 is to reduce growth, since the pay-fors take effect right away while the increased infrastructure spending does not get going in earnest because of lags in starting infrastructure projects until late in the year. The apex in the boost to growth from the deal is expected in 2023, when real GDP increases 2.9%, compared with 2.3% when assuming only the ARP is passed into law. The deal creates more than 800,000 jobs at its peak impact in the middle of the decade, reducing the unemployment rate by a few tenths of a percentage point (see Chart 2). The unemployment rate never falls below 4% and the economy never
completely returns to the full-employment conditions experienced pre-pandemic (see Chart 3). Longer term, the economy receives a bump to productivity growth due to the increase in the stock of public infrastructure, but it is small given the modest increase in infrastructure spending.
The reconciliation package is much larger and thus meaningfully lifts economic growth and jobs and lowers unemployment. The boost to growth occurs quickly, with real GDP increasing 4.9% in 2022, a percentage more than if only the ARP is passed into law. The tax cuts for lower-income individuals in the package are mostly spent quickly, while the tax increases on corporations and high-in-come and wealthier households have a much smaller and slower impact on investment and consumer spending. The increased so-cial investments in the package, particularly related to child- and eldercare, healthcare and housing, also quickly support stronger GDP and jobs. There are 1.6 million more jobs by mid-decade at the peak of the boost to employment, and the unemployment rate is 0.75 percentage point lower. The unemploy-ment rate returns to its pre-pandemic lows in the mid-threes, although labor force partici-pation never fully recovers given longer-term fallout from the pandemic. Longer term, the economy’s growth enjoys a measurable increase due to stronger productivity growth given greater educational attainment and higher labor force participation.
The reconciliation package also helps address the wide and growing disparity in the nation’s income and wealth distribution. It targets most of the social investments to lower- and middle-income households and
taxes multinational corporations and the well-to-do to help pay for these benefits. Moreover, high-income and wealthier house-holds have arguably never been in a better financial position given the long-running skewing of the income and wealth distri-bution and surging stock values and house prices. As measured by the Gini index of in-come inequality, if the reconciliation package becomes law, the income distribution would not skew meaningfully further in the coming decade.8
The economy performs best in the final scenario, in which both the bipartisan infra-structure deal and the reconciliation package become law. Real GDP growth would average 3.2% per annum during Biden’s term and 2.2% over the next decade, compared with less than 2.8% and 2.1% per annum if the legislation fails to become law. In terms of employment, under the infrastructure deal and reconciliation package, there are 2.4 million more jobs at the peak of the employ-ment impact by mid-decade, and unemploy-ment is a full percentage point lower. Labor force participation is also higher, although the full boost to participation occurs after the 10-year budget horizon.
Inflation, higher taxes and execution risk
Concerns have been expressed regard-ing the substantial additional fiscal sup-port being considered by lawmakers. Some worry that the proposed fiscal policy is too expansive given support already pro-vided to the economy during the pandem-ic, and this will exacerbate the inflationary pressures that are evident as the economy
July 2021 3
Unemployment rate under different policy scenarios, %
3456789
1011121314
19 20 21 22 23 24
No additional supportAmerican Rescue PlanARP, IIJAARP, BBB frameworkARP, IIJA & BBB framework
Sources: BLS, Moody’s Analytics
Full employment
Chart 3:…And Unemployment Declines
July 2021 2
Nonfarm employment under different policy scenarios, mil
132
136
140
144
148
152
156
19 20 21 22 23 24
No additional supportAmerican Rescue PlanARP, IIJAARP, BBB frameworkARP, IIJA & BBB framework
Sources: BLS, Moody’s Analytics
Chart 2: Employment Gets a Boost...

MOODY’S ANALYTICS MacroeconoMic consequences of the infrastructure investMent and Jobs act & build back better fraMework 5
recovers from the pandemic. Inflation will remain uncomfortably high even after the current disruptions to the supply side of the economy caused by pandemic are ironed out, and the economy could poten-tially overheat as the Federal Reserve is forced to respond by tightening monetary policy quickly.
This concern cannot be dismissed, but it is likely overdone. With unemployment still near 5% and labor force participation well below where it was pre-pandemic, the economy still has considerable slack, equal to an estimated approximately 6 percent-age points of GDP. But the bipartisan infra-structure deal and reconciliation package will deliver only about a percentage point of additional GDP growth in 2022 and closer to 2 percentage points cumulatively of additional GDP growth through mid-de-cade. Given the fiscal support already provided, this would be just enough to provide the added GDP needed to get the economy fully back to full employment. Consumer price inflation is a few tenths of a percentage point higher next year and in 2023 because of the stronger growth and faster return to full employment, but quickly settles near the Federal Reserve’s inflation target of just over 2% per annum. Longer term, much of the additional fiscal support being considered is designed to lift the economy’s longer-term growth po-tential and ease inflationary pressures. For example, consider the additional spending on new rental housing supply for lower-in-come households, which is critical to rein in rent growth and housing costs, or the efforts to reduce prescription drug costs. The legislation is also specifically designed to ease the financial burden of inflation for lower- and middle-income Americans by helping with the cost of childcare, elder-care, education, healthcare and housing for these income groups.
Others have voiced concern that the tax increases included in the legislation to help pay for it will have serious negative econom-ic consequences. To be sure, all else being equal, higher taxes will weigh on economic growth, but the impact on the economy from the higher proposed taxes will be small. In part, the tax increases being considered on high-income and wealthy households would be the first meaningful tax hike on individuals since the early 1990s. And from a historical perspective they are, on net, mod-est.9 Effective tax rates will remain close to historical norms.
There should also be no concern that the tax increases on large multinational corpora-tions in the reconciliation package, including a 15% minimum tax on large corporations and a 15% country-by-country minimum tax on foreign profits of U.S. corporations, will meaningfully hurt economic growth. This is based on the experience to date with the large tax cuts corporations received under the Tax Cuts and Jobs Act in 2018, including the reduction in the top marginal corporate tax rate from 35% to 21%. There is little evidence that the TCJA led to a meaningful sustained increase in business investment, hiring or wages, or prompted businesses to shift production to the U.S. from overseas as in-tended. While it is difficult to disentangle all that is going on in the economy to isolate the impacts of the TCJA, it is difficult to conclude that the tax cuts in the TCJA have supported a stronger economy. Therefore, it is difficult to think that the increases in corporate taxes in the reconciliation package will meaningful-ly hurt the economy.
The most serious concern with the legis-lation is around execution risk. That is, the bi-partisan infrastructure deal and reconciliation package are complex, with lots of massive moving parts. Successfully organizing them would be difficult even among the best-man-aged private companies. Scaling up existing
programs as envisaged in the legislation is one thing, but standing up new programs and tax policy is another. In our analysis, we try to account for expected lags and delays in implementation, but this could be trickier than we are anticipating. This is especially the case for much of the new policy related to addressing climate change.
Moreover, while the legislation is paid for and does not add to the nation’s deficits and debt, there is a risk that future lawmakers will not allow the increased spending and tax credits in the plan to expire as legislated, and not pay for their extension. Heightened tax enforcement on wealthy taxpayers and the tax on stock repurchases also might not raise as much additional revenue as anticipated. Running large deficits is good economic pol-icy during the pandemic, so those hit hard can manage through. It also makes sense as the pandemic winds down, to get the econ-omy back to full employment. But, once the economy has returned to full employment, focusing on our long-term fiscal problems will become critical.
ConclusionsThe nation has long underinvested in its
infrastructure and social needs and has been slow to respond to the threat posed by climate change, with mounting economic consequenc-es. The bipartisan infrastructure deal and rec-onciliation package help address these issues. Greater investments in public infrastructure and social programs will lift productivity and labor force growth, and the attention on cli-mate change will help forestall its increasingly corrosive economic effects. Moreover, the poli-cies being considered would direct the benefits of the stronger growth to lower-income Amer-icans and address the long-running skewing of the income and wealth distribution. Passage of legislation remains uncertain, but failing to pass legislation would certainly diminish the economy’s prospects.

MOODY’S ANALYTICS MacroeconoMic consequences of the infrastructure investMent and Jobs act & build back better fraMework 6
Table 1: Infrastructure Investment and Jobs ActStatic budget cost, $ bil
2022 2023 2024 2025 2026 2027 2028 2029 2030 2031 2022-2026 2022-2031
Static budget deficit -5.3 24.8 44.2 65.3 78.6 70.7 52.9 38.0 23.6 6.1 207.7 398.9
Total infrastructure spending 27.2 50.5 68.0 81.9 89.0 81.4 64.2 47.6 35.4 26.8 316.7 572.0Transportation 8.2 17.8 27.0 36.1 45.6 47.4 42.1 34.2 26.5 20.4 134.6 305.2Environmental remediation and other authorizations 13.9 18.0 19.1 20.5 19.4 15.3 10.1 6.1 4.1 3.0 90.9 129.6Energy and water 3.6 9.1 12.9 14.1 13.6 11.8 9.1 6.4 4.5 3.1 53.4 88.4Broadband 1.5 5.7 8.9 11.1 10.3 6.7 2.7 0.6 0.1 0.0 37.5 47.6Bond provisions 0.0 0.0 0.1 0.1 0.1 0.1 0.2 0.2 0.2 0.2 0.3 1.2
Total pay-fors -32.5 -25.7 -23.8 -16.6 -10.4 -10.7 -11.3 -9.6 -11.8 -20.7 -109.0 -173.1Delaying rule affecting treatment of drug rebates -6.2 -14.6 -17.8 -10.3 -1.9 0.0 0.0 0.0 0.0 0.0 -50.8 -50.8Information reporting for brokers and digital assets 0.0 -0.9 -2.1 -2.9 -3.1 -3.3 -3.5 -3.8 -4.0 -4.3 -9.0 -28.0Extension of enterprise guarantee fees -3.3 -3.4 -2.9 -2.4 -2.0 -1.7 -1.5 -1.3 -1.3 -1.3 -14.0 -21.0Chemical superfund -0.8 -1.3 -1.4 -1.4 -1.5 -1.5 -1.6 -1.6 -1.7 -1.7 -6.4 -14.4Rescission of COVID-19 appropriations -14.0 -5.3 0.7 0.7 0.7 0.7 0.7 0.8 0.8 0.8 -17.3 -13.4Spectrum auctions 0.0 0.0 0.0 0.0 -2.1 -3.4 -3.4 -1.3 0.0 0.0 -2.1 -10.2Extension of direct spending deductions into fiscal 2031 0.0 0.0 0.0 0.0 0.0 0.0 0.0 -0.1 0.7 -9.4 0.0 -8.7
Termination of employee retention credit -8.2 0.0 0.0 0.0 0.0 0.0 0.0 0.0 0.0 0.0 -8.2 -8.2Customs user fees 0.0 0.0 0.0 0.0 0.0 0.0 0.0 0.0 -3.9 -2.3 0.0 -6.2Strategic petroleum reserve 0.0 0.0 0.0 0.0 0.0 -0.8 -1.3 -1.4 -1.3 -1.3 0.0 -6.1Manufacturer rebates for unused drugs in Medicare Part B -0.1 -0.2 -0.2 -0.3 -0.3 -0.3 -0.4 -0.4 -0.4 -0.5 -1.1 -3.2
Extension of interest rate stabilization 0.0 0.0 0.0 -0.0 -0.1 -0.3 -0.4 -0.6 -0.7 -0.8 -0.2 -2.9
Note: These budget cost estimates do not include any dynamic benefits.
Sources: CBO, CRFB, JCT, Moody's Analytics

MOODY’S ANALYTICS MacroeconoMic consequences of the infrastructure investMent and Jobs act & build back better fraMework 7
Table 2: President Biden's Build Back Better FrameworkStatic budget cost, $ bil
2022 2023 2024 2025 2026 2027 2028 2029 2030 2031 2022-2026 2021-2031
Static budget deficit 121.0 116.0 83.2 81.6 56.8 -49.7 -121.0 -146.7 -176.7 -209.4 458.5 -245.0
Total spending and tax cuts 218.2 237.5 235.3 237.7 234.0 158.1 110.1 107.8 105.8 105.6 1,162.8 1,750.0Childcare, education, housing and equity 47.0 82.2 109.7 128.2 142.2 72.4 27.4 27.1 23.8 20.0 509.3 680.0
Child care and preschool 33.0 55.1 73.4 89.1 106.8 42.7 0.0 0.0 0.0 0.0 357.3 400.0Higher ed and workforce 2.0 3.3 3.8 4.1 4.2 4.3 4.4 4.6 4.6 4.6 17.4 40.0Equity and other investments 4.8 8.1 9.8 9.7 9.4 9.6 9.6 9.6 9.7 9.6 41.9 90.0Affordable housing 7.2 15.7 22.7 25.3 21.8 15.7 13.3 12.9 9.6 5.8 92.7 150.0
Clean energy and combating climate change 36.4 57.1 65.3 68.1 64.3 57.4 53.2 49.9 50.2 53.0 291.3 555.0
Healthcare 27.7 47.2 56.1 36.9 22.9 23.3 24.2 25.1 25.7 25.9 190.7 315.0Medicare hearing benefits 0.0 0.0 0.4 1.1 2.7 4.5 5.5 6.5 7.0 7.3 4.2 35.0Home care 4.9 8.3 11.5 14.4 17.5 18.7 18.7 18.7 18.7 18.7 56.7 150.0ACA premium tax credits 22.8 38.8 44.1 21.4 2.7 0.2 0.0 0.0 0.0 0.0 129.8 130.0
Child Tax and Earned Income Tax Credits 107.0 51.0 4.3 4.4 4.7 4.9 5.3 5.7 6.1 6.6 171.5 200.0
Total pay-fors -97.2 -121.5 -152.1 -156.1 -177.2 -207.7 -231.1 -254.4 -282.5 -315.0 -704.3 -1,995.0Tax increases -84.8 -108.9 -139.6 -142.9 -154.4 -177.2 -196.3 -215.8 -239.0 -266.0 -630.7 -1,725.0
IRS investments to close the tax gap 0.1 -3.2 -8.1 -14.9 -24.4 -37.2 -51.9 -68.7 -86.0 -105.5 -50.7 -400.0
Corporate international reform -29.4 -47.1 -54.2 -47.1 -33.0 -26.6 -25.8 -26.4 -28.7 -31.6 -210.8 -350.0
15% corporate minimum tax on large corporations -27.9 -31.8 -30.3 -30.6 -32.1 -33.8 -34.6 -34.2 -34.4 -35.4 -152.7 -325.0
Close Medicare tax loophole for the wealthy -15.3 -19.9 -22.0 -23.9 -25.8 -27.2 -27.9 -28.6 -29.3 -30.0 -106.9 -250.0
AGI surcharge on the top 0.02% -10.0 -5.0 -23.1 -24.3 -25.5 -26.3 -27.2 -28.4 -29.5 -30.8 -87.8 -230.0
Limit business losses for the wealthy -2.3 -1.9 -2.0 -2.0 -13.6 -26.1 -28.8 -29.5 -31.1 -32.7 -21.8 -170.0
Other pay-fors -12.4 -12.7 -12.6 -13.2 -22.8 -30.5 -34.7 -38.7 -43.5 -49.0 -73.6 -270.0Prescription drugs: repeal rebate rule 0.0 0.0 0.0 -0.8 -10.6 -18.1 -22.2 -26.2 -30.9 -36.4 -11.3 -145.0
Stock buybacks tax -12.4 -12.7 -12.6 -12.4 -12.3 -12.4 -12.5 -12.5 -12.6 -12.6 -62.3 -125.0
Sources: White House, Moody's Analytics

MOODY’S ANALYTICS MacroeconoMic consequences of the infrastructure investMent and Jobs act & build back better fraMework 8
Table 3: Macroeconomic Impact of the Build Back Better Legislation
REAL GDP
No additional support
American Rescue Plan ARP & IIJA ARP & BBB
framework ARP, IIJA & BBB
framework
2012$ bil Ann. growth 2012$ bil Ann.
growth 2012$ bil Ann. growth 2012$ bil Ann.
growth 2012$ bil Ann. growth
2020Q1 18,952 (5.0) 18,952 (5.0) 18,952 (5.0) 18,952 (5.0) 18,952 (5.0)2020Q2 17,258 (31.4) 17,258 (31.4) 17,258 (31.4) 17,258 (31.4) 17,258 (31.4)2020Q3 18,561 33.4 18,561 33.4 18,561 33.4 18,561 33.4 18,561 33.4 2020Q4 18,768 4.5 18,768 4.5 18,768 4.5 18,768 4.5 18,768 4.5 2021Q1 18,853 1.8 19,056 6.3 19,056 6.3 19,056 6.3 19,056 6.3 2021Q2 18,932 1.7 19,368 6.7 19,368 6.7 19,368 6.7 19,368 6.7 2021Q3 18,866 (1.4) 19,465 2.0 19,465 2.0 19,465 2.0 19,465 2.0 2021Q4 19,046 3.9 19,822 7.5 19,822 7.5 19,822 7.5 19,822 7.5 2022Q1 19,355 6.7 20,012 3.9 19,968 3.0 20,089 5.5 20,046 4.6 2022Q2 19,630 5.8 20,137 2.5 20,098 2.6 20,300 4.3 20,261 4.4 2022Q3 19,881 5.2 20,252 2.3 20,234 2.7 20,490 3.8 20,472 4.2 2022Q4 20,091 4.3 20,366 2.3 20,381 2.9 20,616 2.5 20,631 3.1 2023Q1 20,240 3.0 20,479 2.2 20,534 3.0 20,731 2.2 20,786 3.0 2023Q2 20,381 2.8 20,595 2.3 20,685 3.0 20,849 2.3 20,939 3.0 2023Q3 20,522 2.8 20,717 2.4 20,836 2.9 20,970 2.3 21,089 2.9 2023Q4 20,648 2.5 20,843 2.5 20,973 2.7 21,092 2.4 21,222 2.6 2024Q1 20,760 2.2 20,962 2.3 21,098 2.4 21,205 2.2 21,341 2.3 2024Q2 20,871 2.2 21,058 1.8 21,210 2.1 21,298 1.7 21,450 2.0 2024Q3 20,981 2.1 21,156 1.9 21,309 1.9 21,394 1.8 21,547 1.8 2024Q4 21,098 2.2 21,261 2.0 21,405 1.8 21,497 1.9 21,641 1.8 2025Q1 21,209 2.1 21,357 1.8 21,496 1.7 21,594 1.8 21,733 1.7 2025Q2 21,311 1.9 21,447 1.7 21,581 1.6 21,685 1.7 21,819 1.6 2025Q3 21,411 1.9 21,540 1.7 21,667 1.6 21,778 1.7 21,906 1.6 2025Q4 21,513 1.9 21,633 1.7 21,759 1.7 21,873 1.7 21,998 1.7 2026Q1 21,614 1.9 21,728 1.8 21,847 1.6 21,969 1.8 22,088 1.6 2026Q2 21,718 1.9 21,828 1.8 21,942 1.7 22,069 1.8 22,183 1.7 2026Q3 21,821 1.9 21,928 1.9 22,038 1.8 22,168 1.8 22,277 1.7 2026Q4 21,928 2.0 22,033 1.9 22,143 1.9 22,268 1.8 22,378 1.8 2027Q1 22,038 2.0 22,142 2.0 22,249 1.9 22,367 1.8 22,474 1.7 2027Q2 22,157 2.2 22,257 2.1 22,356 1.9 22,478 2.0 22,577 1.8 2027Q3 22,279 2.2 22,378 2.2 22,468 2.0 22,588 2.0 22,678 1.8 2027Q4 22,400 2.2 22,498 2.2 22,580 2.0 22,698 2.0 22,781 1.8 2028Q1 22,520 2.2 22,618 2.2 22,694 2.0 22,811 2.0 22,887 1.9 2028Q2 22,640 2.1 22,737 2.1 22,808 2.0 22,923 2.0 22,994 1.9 2028Q3 22,760 2.1 22,858 2.1 22,923 2.0 23,038 2.0 23,104 1.9 2028Q4 22,877 2.1 22,974 2.1 23,037 2.0 23,153 2.0 23,216 2.0 2029Q1 22,995 2.1 23,092 2.1 23,149 2.0 23,272 2.1 23,329 2.0 2029Q2 23,113 2.1 23,211 2.1 23,262 2.0 23,391 2.1 23,442 2.0 2029Q3 23,228 2.0 23,328 2.0 23,380 2.0 23,513 2.1 23,564 2.1 2029Q4 23,345 2.0 23,447 2.1 23,496 2.0 23,638 2.2 23,688 2.1 2030Q1 23,464 2.1 23,568 2.1 23,614 2.0 23,766 2.2 23,811 2.1 2030Q2 23,584 2.1 23,688 2.1 23,731 2.0 23,893 2.2 23,936 2.1 2030Q3 23,705 2.1 23,809 2.1 23,851 2.0 24,021 2.2 24,062 2.1 2030Q4 23,827 2.1 23,933 2.1 23,971 2.0 24,149 2.2 24,188 2.1 2031Q1 23,950 2.1 24,056 2.1 24,093 2.0 24,277 2.1 24,314 2.1 2031Q2 24,073 2.1 24,180 2.1 24,213 2.0 24,405 2.1 24,438 2.1 2031Q3 24,198 2.1 24,305 2.1 24,335 2.0 24,535 2.1 24,564 2.1 2031Q4 24,322 2.1 24,431 2.1 24,458 2.0 24,664 2.1 24,691 2.1
2020 18,385 -3.7 18,385 -3.7 18,385 -3.7 18,385 -3.7 18,385 -3.72021 18,924 2.9 19,428 5.7 19,428 5.7 19,428 5.7 19,428 5.72022 19,739 4.3 20,192 3.9 20,170 3.8 20,374 4.9 20,352 4.82023 20,448 3.6 20,658 2.3 20,757 2.9 20,910 2.6 21,009 3.22024 20,927 2.3 21,109 2.2 21,256 2.4 21,348 2.1 21,495 2.32025 21,361 2.1 21,494 1.8 21,626 1.7 21,732 1.8 21,864 1.72026 21,770 1.9 21,880 1.8 21,993 1.7 22,119 1.8 22,232 1.72027 22,218 2.1 22,319 2.0 22,413 1.9 22,533 1.9 22,627 1.82028 22,699 2.2 22,797 2.1 22,866 2.0 22,981 2.0 23,050 1.92029 23,170 2.1 23,270 2.1 23,322 2.0 23,454 2.1 23,506 2.02030 23,645 2.1 23,750 2.1 23,792 2.0 23,957 2.1 24,000 2.12031 24,136 2.1 24,243 2.1 24,275 2.0 24,470 2.1 24,502 2.1
Note: IIJA is the Infrastructure Investment and Jobs Act
Sources: BEA, BLS, Moody’s Analytics

MOODY’S ANALYTICS MacroeconoMic consequences of the infrastructure investMent and Jobs act & build back better fraMework 9
Table 3: Macroeconomic Impact of the Build Back Better Legislation (Cont.)
NONFARM EMPLOYMENT No additional
support American
Rescue Plan ARP & IIJA ARP & BBB framework
ARP, IIJA & BBB framework
Mil Change, ths Mil Change,
ths Mil Change, ths Mil Change,
ths Mil Change, ths
2020Q1 151.9 132 151.9 132 151.9 132 151.9 132 151.9 132 2020Q2 133.7 (18,201) 133.7 (18,201) 133.7 (18,201) 133.7 (18,201) 133.7 (18,201)2020Q3 140.9 7,195 140.9 7,195 140.9 7,195 140.9 7,195 140.9 7,195 2020Q4 142.6 1,759 142.6 1,759 142.6 1,759 142.6 1,759 142.6 1,759 2021Q1 143.1 431 143.4 736 143.4 736 143.4 736 143.4 736 2021Q2 143.5 445 145.1 1,701 145.1 1,701 145.1 1,701 145.1 1,701 2021Q3 144.3 756 147.3 2,246 147.3 2,246 147.3 2,246 147.3 2,246 2021Q4 145.2 924 148.9 1,592 148.9 1,592 148.9 1,592 148.9 1,592 2022Q1 146.1 947 150.0 1,079 149.9 968 150.1 1,198 150.0 1,087 2022Q2 147.1 970 150.6 586 150.5 603 150.9 833 150.8 850 2022Q3 148.0 924 151.0 441 151.0 527 151.4 507 151.4 593 2022Q4 148.9 906 151.4 413 151.5 478 151.9 486 152.0 551 2023Q1 149.8 847 151.8 377 151.9 455 152.3 425 152.5 503 2023Q2 150.5 771 152.1 335 152.4 431 152.7 388 153.0 484 2023Q3 151.2 690 152.4 301 152.7 391 153.1 372 153.4 462 2023Q4 151.7 510 152.7 258 153.1 376 153.5 359 153.9 478 2024Q1 152.2 410 152.9 241 153.5 341 153.8 365 154.4 465 2024Q2 152.5 300 153.2 233 153.8 313 154.2 374 154.8 454 2024Q3 152.7 260 153.4 215 154.0 271 154.6 367 155.2 423 2024Q4 153.0 240 153.5 172 154.3 231 154.9 318 155.6 377 2025Q1 153.2 200 153.7 137 154.5 200 155.1 252 155.9 315 2025Q2 153.3 160 153.8 135 154.7 176 155.3 205 156.2 246 2025Q3 153.5 160 154.0 137 154.8 167 155.5 162 156.4 192 2025Q4 153.7 210 154.1 145 155.0 149 155.7 163 156.5 167 2026Q1 153.9 220 154.3 156 155.1 141 155.8 171 156.7 156 2026Q2 154.1 220 154.4 160 155.2 133 156.0 167 156.8 140 2026Q3 154.3 170 154.6 163 155.4 130 156.2 161 157.0 128 2026Q4 154.5 190 154.8 173 155.5 126 156.3 167 157.1 120 2027Q1 154.7 190 154.9 176 155.6 124 156.5 166 157.2 114 2027Q2 154.9 200 155.1 194 155.8 128 156.7 168 157.3 102 2027Q3 155.1 190 155.3 201 155.9 145 156.8 153 157.4 97 2027Q4 155.3 210 155.5 210 156.1 156 157.0 148 157.5 94 2028Q1 155.5 210 155.8 224 156.2 171 157.1 151 157.6 98 2028Q2 155.7 227 156.0 229 156.4 179 157.3 153 157.7 103 2028Q3 155.9 229 156.2 233 156.6 190 157.4 155 157.8 112 2028Q4 156.2 230 156.5 234 156.8 193 157.6 162 157.9 121 2029Q1 156.4 232 156.7 236 157.0 201 157.8 174 158.1 139 2029Q2 156.6 236 156.9 238 157.2 216 158.0 191 158.2 168 2029Q3 156.9 240 157.2 238 157.4 223 158.1 193 158.4 177 2029Q4 157.1 241 157.4 238 157.7 231 158.4 209 158.6 201 2030Q1 157.4 239 157.6 241 157.9 233 158.6 223 158.8 217 2030Q2 157.6 238 157.9 245 158.1 233 158.8 225 159.1 225 2030Q3 157.8 236 158.1 244 158.4 236 159.1 224 159.3 239 2030Q4 158.1 235 158.4 243 158.6 237 159.3 227 159.5 247 2031Q1 158.3 236 158.7 342 158.8 236 159.7 230 159.8 250 2031Q2 158.5 237 159.0 242 159.1 237 159.9 231 160.0 251 2031Q3 158.8 237 159.2 240 159.3 239 160.2 230 160.3 250 2031Q4 159.0 236 159.4 240 159.5 239 160.4 231 160.5 249
2020 142.3 (8,683) 142.3 (8,683) 142.3 (8,683) 142.3 (8,683) 142.3 (8,683)2021 144.0 1,740 146.2 3,899 146.2 3,899 146.2 3,899 146.2 3,899 2022 147.5 3,545 150.7 4,585 150.7 4,545 151.1 4,940 151.1 4,900 2023 150.8 3,282 152.3 1,521 152.5 1,840 152.9 1,819 153.2 2,139 2024 152.6 1,745 153.3 994 153.9 1,355 154.4 1,461 155.0 1,822 2025 153.4 838 153.9 638 154.7 840 155.4 1,043 156.3 1,245 2026 154.2 795 154.5 611 155.3 577 156.1 673 156.9 638 2027 155.0 770 155.2 726 155.8 524 156.7 653 157.3 452 2028 155.8 855 156.1 878 156.5 670 157.4 614 157.8 406 2029 156.8 933 157.0 943 157.3 816 158.1 703 158.3 576 2030 157.7 954 158.0 965 158.2 922 158.9 891 159.2 848 2031 158.7 945 159.1 1,069 159.2 946 160.1 1,110 160.2 987
Note: IIJA is the Infrastructure Investment and Jobs Act
Sources: BEA, BLS, Moody’s Analytics

MOODY’S ANALYTICS MacroeconoMic consequences of the infrastructure investMent and Jobs act & build back better fraMework 10
Table 3: Macroeconomic Impact of the Build Back Better Legislation (Cont.)
UNEMPLOYMENT RATE LABOR FORCE PARTICIPATION RATENo additional
supportAmerican
Rescue PlanARP &
IIJAARP & BBB framework
ARP, IIJA & BBB framework
No additional support
American Rescue Plan
ARP & IIJA
ARP & BBB framework
ARP, IIJA & BBB framework
2020Q1 3.8 3.8 3.8 3.8 3.8 63.1 63.1 63.1 63.1 63.1 2020Q2 13.1 13.1 13.1 13.1 13.1 60.8 60.8 62.9 62.9 62.9 2020Q3 8.8 8.8 8.8 8.8 8.8 61.5 61.5 63.1 63.1 63.1 2020Q4 6.8 6.8 6.8 6.8 6.8 61.5 61.5 63.2 63.2 63.2 2021Q1 6.5 6.2 6.2 6.2 6.2 61.4 61.4 63.1 63.1 63.1 2021Q2 6.6 5.9 5.9 5.9 5.9 61.5 61.6 60.8 60.8 60.8 2021Q3 6.7 5.1 5.1 5.1 5.1 61.6 61.7 61.5 61.5 61.5 2021Q4 6.6 4.6 4.6 4.6 4.6 61.7 61.9 61.5 61.5 61.5 2022Q1 6.3 4.5 4.6 4.4 4.5 61.8 62.5 61.4 61.4 61.4 2022Q2 5.9 4.4 4.5 4.2 4.2 62.0 62.6 61.6 61.6 61.6 2022Q3 5.6 4.4 4.4 3.8 3.9 62.1 62.6 61.7 61.7 61.7 2022Q4 5.3 4.3 4.4 3.6 3.6 62.1 62.6 61.9 61.9 61.9 2023Q1 4.9 4.3 4.3 3.6 3.5 62.1 62.7 62.5 62.5 62.5 2023Q2 4.7 4.3 4.2 3.6 3.5 62.1 62.7 62.6 62.6 62.6 2023Q3 4.6 4.3 4.2 3.6 3.5 62.1 62.7 62.6 62.6 62.6 2023Q4 4.5 4.3 4.2 3.5 3.4 62.2 62.7 62.6 62.7 62.7 2024Q1 4.4 4.3 4.2 3.6 3.4 62.2 62.7 62.7 62.7 62.7 2024Q2 4.4 4.3 4.2 3.5 3.4 62.3 62.7 62.7 62.7 62.7 2024Q3 4.4 4.3 4.2 3.5 3.4 62.3 62.7 62.7 62.7 62.7 2024Q4 4.4 4.3 4.2 3.5 3.4 62.3 62.7 62.7 62.7 62.8 2025Q1 4.4 4.3 4.2 3.5 3.4 62.4 62.7 62.7 62.8 62.8 2025Q2 4.4 4.3 4.2 3.6 3.5 62.4 62.7 62.7 62.8 62.8 2025Q3 4.4 4.4 4.2 3.7 3.5 62.4 62.7 62.8 62.8 62.8 2025Q4 4.5 4.4 4.2 3.7 3.5 62.4 62.7 62.8 62.8 62.8 2026Q1 4.5 4.5 4.3 3.8 3.6 62.5 62.7 62.8 62.8 62.8 2026Q2 4.5 4.5 4.3 3.8 3.6 62.5 62.7 62.7 62.8 62.8 2026Q3 4.6 4.5 4.3 3.9 3.6 62.5 62.7 62.7 62.8 62.8 2026Q4 4.6 4.5 4.2 3.9 3.6 62.5 62.7 62.7 62.8 62.8 2027Q1 4.6 4.5 4.2 4.0 3.7 62.5 62.7 62.7 62.8 62.8 2027Q2 4.6 4.5 4.2 4.1 3.8 62.4 62.6 62.7 62.8 62.8 2027Q3 4.6 4.5 4.2 4.2 3.8 62.4 62.6 62.7 62.8 62.8 2027Q4 4.5 4.5 4.3 4.1 3.9 62.4 62.6 62.7 62.8 62.8 2028Q1 4.5 4.5 4.3 4.1 3.9 62.4 62.6 62.7 62.8 62.8 2028Q2 4.5 4.5 4.3 4.1 3.9 62.4 62.6 62.7 62.8 62.8 2028Q3 4.5 4.5 4.3 4.1 3.9 62.4 62.6 62.6 62.8 62.8 2028Q4 4.5 4.5 4.3 4.1 3.9 62.3 62.5 62.6 62.8 62.8 2029Q1 4.5 4.5 4.3 4.1 3.9 62.3 62.5 62.6 62.7 62.8 2029Q2 4.5 4.4 4.4 4.0 3.9 62.3 62.5 62.6 62.7 62.8 2029Q3 4.5 4.4 4.4 3.9 3.9 62.3 62.5 62.6 62.7 62.8 2029Q4 4.5 4.4 4.4 3.9 3.9 62.3 62.5 62.6 62.7 62.7 2030Q1 4.5 4.4 4.4 4.0 4.0 62.3 62.5 62.5 62.7 62.7 2030Q2 4.5 4.4 4.4 4.0 4.0 62.2 62.4 62.5 62.7 62.7 2030Q3 4.5 4.4 4.4 4.0 4.0 62.2 62.4 62.5 62.7 62.7 2030Q4 4.5 4.4 4.4 4.0 4.0 62.2 62.4 62.5 62.7 62.7 2031Q1 4.5 4.4 4.4 4.0 4.0 62.2 62.4 62.5 62.7 62.7 2031Q2 4.5 4.4 4.4 4.0 4.0 62.2 62.4 62.5 62.7 62.7 2031Q3 4.5 4.4 4.4 4.0 4.0 62.2 62.4 62.5 62.7 62.7 2031Q4 4.5 4.4 4.4 4.0 4.0 62.2 62.4 62.4 62.6 62.7
2020 8.1 8.1 8.1 8.1 8.1 61.7 61.7 61.7 61.7 61.7 2021 6.6 5.5 5.5 5.5 5.5 61.6 61.7 61.7 61.7 61.7 2022 5.8 4.4 4.5 4.0 4.1 62.0 62.6 62.6 62.6 62.6 2023 4.6 4.3 4.2 3.6 3.5 62.1 62.7 62.7 62.7 62.7 2024 4.4 4.3 4.2 3.5 3.4 62.3 62.7 62.7 62.8 62.8 2025 4.4 4.4 4.2 3.7 3.5 62.4 62.7 62.7 62.8 62.8 2026 4.5 4.5 4.3 3.9 3.6 62.5 62.7 62.7 62.8 62.8 2027 4.6 4.5 4.2 4.1 3.8 62.4 62.6 62.6 62.8 62.8 2028 4.5 4.5 4.3 4.1 3.9 62.4 62.6 62.6 62.7 62.8 2029 4.5 4.4 4.4 4.0 3.9 62.3 62.5 62.5 62.7 62.7 2030 4.5 4.4 4.4 4.0 4.0 62.2 62.4 62.5 62.7 62.7 2031 4.5 4.4 4.4 4.0 4.0 62.2 62.4 62.4 62.7 62.7
Note: IIJA is the Infrastructure Investment and Jobs Act
Sources: BEA, BLS, Moody’s Analytics
MOODY’S ANALYTICS MacroeconoMic consequences of the infrastructure investMent and Jobs act & build back better fraMework 11
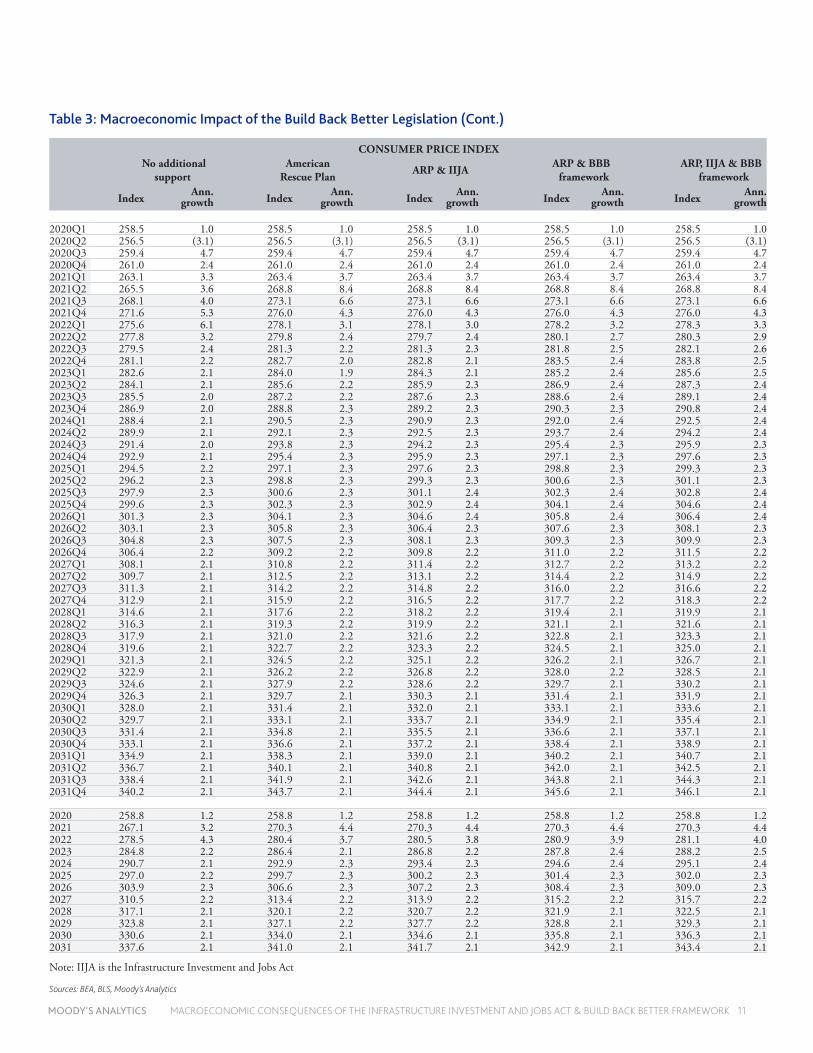
Table 3: Macroeconomic Impact of the Build Back Better Legislation (Cont.)
CONSUMER PRICE INDEX No additional
support American
Rescue Plan ARP & IIJA ARP & BBB framework
ARP, IIJA & BBB framework
Index Ann. growth Index Ann.
growth Index Ann. growth Index Ann.
growth Index Ann. growth
2020Q1 258.5 1.0 258.5 1.0 258.5 1.0 258.5 1.0 258.5 1.0 2020Q2 256.5 (3.1) 256.5 (3.1) 256.5 (3.1) 256.5 (3.1) 256.5 (3.1)2020Q3 259.4 4.7 259.4 4.7 259.4 4.7 259.4 4.7 259.4 4.7 2020Q4 261.0 2.4 261.0 2.4 261.0 2.4 261.0 2.4 261.0 2.4 2021Q1 263.1 3.3 263.4 3.7 263.4 3.7 263.4 3.7 263.4 3.7 2021Q2 265.5 3.6 268.8 8.4 268.8 8.4 268.8 8.4 268.8 8.4 2021Q3 268.1 4.0 273.1 6.6 273.1 6.6 273.1 6.6 273.1 6.6 2021Q4 271.6 5.3 276.0 4.3 276.0 4.3 276.0 4.3 276.0 4.3 2022Q1 275.6 6.1 278.1 3.1 278.1 3.0 278.2 3.2 278.3 3.3 2022Q2 277.8 3.2 279.8 2.4 279.7 2.4 280.1 2.7 280.3 2.9 2022Q3 279.5 2.4 281.3 2.2 281.3 2.3 281.8 2.5 282.1 2.6 2022Q4 281.1 2.2 282.7 2.0 282.8 2.1 283.5 2.4 283.8 2.5 2023Q1 282.6 2.1 284.0 1.9 284.3 2.1 285.2 2.4 285.6 2.5 2023Q2 284.1 2.1 285.6 2.2 285.9 2.3 286.9 2.4 287.3 2.4 2023Q3 285.5 2.0 287.2 2.2 287.6 2.3 288.6 2.4 289.1 2.4 2023Q4 286.9 2.0 288.8 2.3 289.2 2.3 290.3 2.3 290.8 2.4 2024Q1 288.4 2.1 290.5 2.3 290.9 2.3 292.0 2.4 292.5 2.4 2024Q2 289.9 2.1 292.1 2.3 292.5 2.3 293.7 2.4 294.2 2.4 2024Q3 291.4 2.0 293.8 2.3 294.2 2.3 295.4 2.3 295.9 2.3 2024Q4 292.9 2.1 295.4 2.3 295.9 2.3 297.1 2.3 297.6 2.3 2025Q1 294.5 2.2 297.1 2.3 297.6 2.3 298.8 2.3 299.3 2.3 2025Q2 296.2 2.3 298.8 2.3 299.3 2.3 300.6 2.3 301.1 2.3 2025Q3 297.9 2.3 300.6 2.3 301.1 2.4 302.3 2.4 302.8 2.4 2025Q4 299.6 2.3 302.3 2.3 302.9 2.4 304.1 2.4 304.6 2.4 2026Q1 301.3 2.3 304.1 2.3 304.6 2.4 305.8 2.4 306.4 2.4 2026Q2 303.1 2.3 305.8 2.3 306.4 2.3 307.6 2.3 308.1 2.3 2026Q3 304.8 2.3 307.5 2.3 308.1 2.3 309.3 2.3 309.9 2.3 2026Q4 306.4 2.2 309.2 2.2 309.8 2.2 311.0 2.2 311.5 2.2 2027Q1 308.1 2.1 310.8 2.2 311.4 2.2 312.7 2.2 313.2 2.2 2027Q2 309.7 2.1 312.5 2.2 313.1 2.2 314.4 2.2 314.9 2.2 2027Q3 311.3 2.1 314.2 2.2 314.8 2.2 316.0 2.2 316.6 2.2 2027Q4 312.9 2.1 315.9 2.2 316.5 2.2 317.7 2.2 318.3 2.2 2028Q1 314.6 2.1 317.6 2.2 318.2 2.2 319.4 2.1 319.9 2.1 2028Q2 316.3 2.1 319.3 2.2 319.9 2.2 321.1 2.1 321.6 2.1 2028Q3 317.9 2.1 321.0 2.2 321.6 2.2 322.8 2.1 323.3 2.1 2028Q4 319.6 2.1 322.7 2.2 323.3 2.2 324.5 2.1 325.0 2.1 2029Q1 321.3 2.1 324.5 2.2 325.1 2.2 326.2 2.1 326.7 2.1 2029Q2 322.9 2.1 326.2 2.2 326.8 2.2 328.0 2.2 328.5 2.1 2029Q3 324.6 2.1 327.9 2.2 328.6 2.2 329.7 2.1 330.2 2.1 2029Q4 326.3 2.1 329.7 2.1 330.3 2.1 331.4 2.1 331.9 2.1 2030Q1 328.0 2.1 331.4 2.1 332.0 2.1 333.1 2.1 333.6 2.1 2030Q2 329.7 2.1 333.1 2.1 333.7 2.1 334.9 2.1 335.4 2.1 2030Q3 331.4 2.1 334.8 2.1 335.5 2.1 336.6 2.1 337.1 2.1 2030Q4 333.1 2.1 336.6 2.1 337.2 2.1 338.4 2.1 338.9 2.1 2031Q1 334.9 2.1 338.3 2.1 339.0 2.1 340.2 2.1 340.7 2.1 2031Q2 336.7 2.1 340.1 2.1 340.8 2.1 342.0 2.1 342.5 2.1 2031Q3 338.4 2.1 341.9 2.1 342.6 2.1 343.8 2.1 344.3 2.1 2031Q4 340.2 2.1 343.7 2.1 344.4 2.1 345.6 2.1 346.1 2.1
2020 258.8 1.2 258.8 1.2 258.8 1.2 258.8 1.2 258.8 1.2 2021 267.1 3.2 270.3 4.4 270.3 4.4 270.3 4.4 270.3 4.4 2022 278.5 4.3 280.4 3.7 280.5 3.8 280.9 3.9 281.1 4.0 2023 284.8 2.2 286.4 2.1 286.8 2.2 287.8 2.4 288.2 2.5 2024 290.7 2.1 292.9 2.3 293.4 2.3 294.6 2.4 295.1 2.4 2025 297.0 2.2 299.7 2.3 300.2 2.3 301.4 2.3 302.0 2.3 2026 303.9 2.3 306.6 2.3 307.2 2.3 308.4 2.3 309.0 2.3 2027 310.5 2.2 313.4 2.2 313.9 2.2 315.2 2.2 315.7 2.2 2028 317.1 2.1 320.1 2.2 320.7 2.2 321.9 2.1 322.5 2.1 2029 323.8 2.1 327.1 2.2 327.7 2.2 328.8 2.1 329.3 2.1 2030 330.6 2.1 334.0 2.1 334.6 2.1 335.8 2.1 336.3 2.1 2031 337.6 2.1 341.0 2.1 341.7 2.1 342.9 2.1 343.4 2.1
Note: IIJA is the Infrastructure Investment and Jobs Act
Sources: BEA, BLS, Moody’s Analytics

MOODY’S ANALYTICS MacroeconoMic consequences of the infrastructure investMent and Jobs act & build back better fraMework 12
Endnotes
1 Since the COVID-19 pandemic struck the United States in March 2020, federal government fiscal support has totaled an estimated more than $5 trillion, equal to close to 25% of the nation’s GDP.
2 The IIJA is a scaled-down version of the American Jobs Plan proposed by President Biden in April as part of his Build Back Better agenda. Biden’s American Jobs Plan included more than $900 billion in more spending on these types of traditional infrastructure, and then an additional $1.7 trillion in other spending and tax credits. Much of this other proposed funding was for less traditional infrastructure such as housing, research and development, and manufacturing supply chains.
3 In a full-employment economy, the GDP multiplier on traditional infrastructure is estimated to be 1.23 one year after the investment, and 1.12 for nontraditional infra-structure. It is higher when the economy is operating below full employment.
4 This differs from the Congressional Budget Office’s estimate that the average rate of return on private-sector investment is about 10% and that the average return on federal investment is about half that. The difference is largely because the CBO assumes that a significant part of the increased federal spending on infrastructure will be offset by less infrastructure spending by state and local governments. We do not expect this offset to be nearly as large with this infrastructure deal.
5 A more detailed description of the programs and tax changes in the reconciliation package is available on request.
6 For more information on the labor force participation rate impacts, a literature review is available in L. J. Bettendorf, E. L. Jongen, and P. Muller, Child Care Subsidies and Labour Supply—Evidence From a Large Dutch Reform, Labour Economics (2015).
7 A description of the Moody’s Analytics model of the U.S. economy is available here. More detailed validation documentation is available on request. The Moody’s Analytics model is similar in theory and empirics to those used by the Federal Reserve Board and Congressional Budget Office for forecasting, budgeting and policy analysis. The model has been used to evaluate the plethora of fiscal and monetary policies implemented during the COVID-19 pandemic.
8 The Gini index is a statistical measure of economic inequality. A value of 0 represents perfect economic equality, and a value of 1 represents perfect economic inequality. The 2019 Gini index for income in the U.S. was 0.465 and has been steadily rising since the late 1970s, indicating that there has been steady skewing of the income distribution.
9 Of all the tax increases since World War II, this would rank 24th largest as a percent of GDP.

MOODY’S ANALYTICS MacroeconoMic consequences of the infrastructure investMent and Jobs act & build back better fraMework 13
About the Authors
Mark M. Zandi is chief economist of Moody’s Analytics, where he directs economic research. Moody’s Analytics, a subsidiary of Moody’s Corp., is a leading provider of economic research, data and analytical tools. Dr. Zandi is a cofounder of Economy.com, which Moody’s purchased in 2005.
Dr. Zandi is on the board of directors of MGIC, the nation’s largest private mortgage insurance company, and is the lead director of Reinvestment Fund, one of the nation’s largest community development financial institutions, which makes investments in underserved communities.
He is a trusted adviser to policymakers and an influential source of economic analysis for businesses, journalists and the public. Dr. Zandi frequently testifies before Con-gress and conducts regular briefings on the economy for corporate boards, trade associations, and policymakers at all levels.
Dr. Zandi is the author of Paying the Price: Ending the Great Recession and Beginning a New American Century, which provides an assessment of the monetary and fiscal policy response to the Great Recession. His other book, Financial Shock: A 360º Look at the Subprime Mortgage Implosion, and How to Avoid the Next Financial Crisis, is described by the New York Times as the “clearest guide” to the financial crisis. Dr. Zandi is host of the Inside Economics podcast.
Dr. Zandi earned his BS from the Wharton School at the University of Pennsylvania and his PhD at the University of Pennsylvania.
Bernard Yaros is an assistant director and economist at Moody’s Analytics focused primarily on federal fiscal policy. He is responsible for maintaining the Moody’s Analytics forecast models for federal government fiscal conditions and the 2020 presidential election, as well as providing real-time economic analysis on fiscal policy developments coming out of Capitol Hill. Besides fiscal policy, Bernard covers the District of Columbia and Puerto Rico and develops forecasts for Switzerland.
Bernard holds an MSc in international trade, finance and development from the Barcelona Graduate School of Economics and a BA in political economy from Williams College.

About Moody’s Analytics
Moody’s Analytics provides fi nancial intelligence and analytical tools supporting our clients’ growth, effi ciency
and risk management objectives. The combination of our unparalleled expertise in risk, expansive information
resources, and innovative application of technology helps today’s business leaders confi dently navigate an
evolving marketplace. We are recognized for our industry-leading solutions, comprising research, data, software
and professional services, assembled to deliver a seamless customer experience. Thousands of organizations
worldwide have made us their trusted partner because of our uncompromising commitment to quality, client
service, and integrity.
Concise and timely economic research by Moody’s Analytics supports fi rms and policymakers in strategic planning, product and sales forecasting, credit risk and sensitivity management, and investment research. Our economic research publications provide in-depth analysis of the global economy, including the U.S. and all of its state and metropolitan areas, all European countries and their subnational areas, Asia, and the Americas. We track and forecast economic growth and cover specialized topics such as labor markets, housing, consumer spending and credit, output and income, mortgage activity, demographics, central bank behavior, and prices. We also provide real-time monitoring of macroeconomic indicators and analysis on timely topics such as monetary policy and sovereign risk. Our clients include multinational corporations, governments at all levels, central banks, fi nancial regulators, retailers, mutual funds, fi nancial institutions, utilities, residential and commercial real estate fi rms, insurance companies, and professional investors.
Moody’s Analytics added the economic forecasting fi rm Economy.com to its portfolio in 2005. This unit is based in West Chester PA, a suburb of Philadelphia, with offi ces in London, Prague and Sydney. More information is available at www.economy.com.
Moody’s Analytics is a subsidiary of Moody’s Corporation (NYSE: MCO). Further information is available at www.moodysanalytics.com.
DISCLAIMER: Moody’s Analytics, a unit of Moody’s Corporation, provides economic analysis, credit risk data and insight, as well as risk management solutions. Research authored by Moody’s Analytics does not refl ect the opinions of Moody’s Investors Service, the credit rating agency. To avoid confusion, please use the full company name “Moody’s Analytics”, when citing views from Moody’s Analytics.
About Moody’s Corporation
Moody’s Analytics is a subsidiary of Moody’s Corporation (NYSE: MCO). MCO reported revenue of $5.4 billion in 2020, employs more than 11,400 people worldwide and maintains a presence in more than 40 countries. Further information about Moody’s Analytics is available at www.moodysanalytics.com.

© 2021 Moody’s Corporation, Moody’s Investors Service, Inc., Moody’s Analytics, Inc. and/or their licensors and affi liates (collectively, “MOODY’S”). All rights reserved.CREDIT RATINGS ISSUED BY MOODY’S CREDIT RATINGS AFFILIATES ARE THEIR CURRENT OPINIONS OF THE RELATIVE FUTURE CREDIT RISK OF ENTITIES, CREDIT COMMITMENTS, OR DEBT OR DEBT-LIKE SECURITIES, AND MATERIALS, PRODUCTS, SERVICES AND INFORMATION PUBLISHED BY MOODY’S (COLLECTIVELY, “PUBLICATIONS”) MAY INCLUDE SUCH CURRENT OPINIONS. MOODY’S DEFINES CREDIT RISK AS THE RISK THAT AN ENTITY MAY NOT MEET ITS CONTRACTUAL FINANCIAL OBLIGATIONS AS THEY COME DUE AND ANY ESTIMATED FINAN-CIAL LOSS IN THE EVENT OF DEFAULT OR IMPAIRMENT. SEE APPLICABLE MOODY’S RATING SYMBOLS AND DEFINITIONS PUBLICATION FOR INFORMATION ON THE TYPES OF CONTRACTUAL FINANCIAL OBLIGATIONS ADDRESSED BY MOODY’S CREDIT RATINGS. CREDIT RATINGS DO NOT ADDRESS ANY OTHER RISK, INCLUDING BUT NOT LIMITED TO: LIQUIDITY RISK, MARKET VALUE RISK, OR PRICE VOLATILITY. CREDIT RATINGS, NON-CREDIT ASSESSMENTS (“ASSESSMENTS”), AND OTHER OPINIONS INCLUDED IN MOODY’S PUBLICATIONS ARE NOT STATE-MENTS OF CURRENT OR HISTORICAL FACT. MOODY’S PUBLICATIONS MAY ALSO INCLUDE QUANTITATIVE MODEL-BASED ESTIMATES OF CREDIT RISK AND RELATED OPINIONS OR COMMENTARY PUBLISHED BY MOODY’S ANALYTICS, INC. AND/OR ITS AFFILIATES. MOODY’S CREDIT RATINGS, ASSESSMENTS, OTHER OPINIONS AND PUBLICATIONS DO NOT CONSTITUTE OR PROVIDE INVESTMENT OR FINANCIAL ADVICE, AND MOODY’S CREDIT RATINGS, ASSESSMENTS, OTHER OPINIONS AND PUBLICATIONS ARE NOT AND DO NOT PROVIDE REC-OMMENDATIONS TO PURCHASE, SELL, OR HOLD PARTICULAR SECURITIES. MOODY’S CREDIT RATINGS, ASSESSMENTS, OTHER OPINIONS AND PUBLICATIONS DO NOT COMMENT ON THE SUITABILITY OF AN INVESTMENT FOR ANY PARTICULAR INVESTOR. MOODY’S ISSUES ITS CREDIT RATINGS, ASSESSMENTS AND OTHER OPINIONS AND PUBLISHES ITS PUBLICATIONS WITH THE EXPECTATION AND UNDERSTAND-ING THAT EACH INVESTOR WILL, WITH DUE CARE, MAKE ITS OWN STUDY AND EVALUATION OF EACH SECURITY THAT IS UNDER CONSID-ERATION FOR PURCHASE, HOLDING, OR SALE. MOODY’S CREDIT RATINGS, ASSESSMENTS, OTHER OPINIONS, AND PUBLICATIONS ARE NOT INTENDED FOR USE BY RETAIL INVESTORS AND IT WOULD BE RECKLESS AND INAPPROPRIATE FOR RETAIL INVESTORS TO USE MOODY’S CREDIT RATINGS, ASSESSMENTS, OTHER OPINIONS OR PUBLICATIONS WHEN MAKING AN INVESTMENT DECISION. IF IN DOUBT YOU SHOULD CONTACT YOUR FINANCIAL OR OTHER PROFES-SIONAL ADVISER.ALL INFORMATION CONTAINED HEREIN IS PROTECTED BY LAW, INCLUDING BUT NOT LIMITED TO, COPYRIGHT LAW, AND NONE OF SUCH IN-FORMATION MAY BE COPIED OR OTHERWISE REPRODUCED, REPACKAGED, FURTHER TRANSMITTED, TRANSFERRED, DISSEMINATED, REDISTRIB-UTED OR RESOLD, OR STORED FOR SUBSEQUENT USE FOR ANY SUCH PURPOSE, IN WHOLE OR IN PART, IN ANY FORM OR MANNER OR BY ANY MEANS WHATSOEVER, BY ANY PERSON WITHOUT MOODY’S PRIOR WRITTEN CONSENT.MOODY’S CREDIT RATINGS, ASSESSMENTS, OTHER OPINIONS AND PUBLICATIONS ARE NOT INTENDED FOR USE BY ANY PERSON AS A BENCH-MARK AS THAT TERM IS DEFINED FOR REGULATORY PURPOSES AND MUST NOT BE USED IN ANY WAY THAT COULD RESULT IN THEM BEING CONSIDERED A BENCHMARK.All information contained herein is obtained by MOODY’S from sources believed by it to be accurate and reliable. Because of the possibility of human or mechanical error as well as other factors, however, all information contained herein is provided “AS IS” without warranty of any kind. MOODY’S adopts all necessary measures so that the information it uses in assigning a credit rating is of suffi cient quality and from sources MOODY’S considers to be reliable including, when appropriate, independent third-party sources. However, MOODY’S is not an auditor and cannot in every instance indepen-dently verify or validate information received in the rating process or in preparing its Publications.To the extent permitted by law, MOODY’S and its directors, offi cers, employees, agents, representatives, licensors and suppliers disclaim liability to any person or entity for any indirect, special, consequential, or incidental losses or damages whatsoever arising from or in connection with the information contained herein or the use of or inability to use any such information, even if MOODY’S or any of its directors, offi cers, employees, agents, representatives, licensors or suppliers is advised in advance of the possibility of such losses or damages, including but not limited to: (a) any loss of present or prospective profi ts or (b) any loss or damage arising where the relevant fi nancial instrument is not the subject of a particular credit rating assigned by MOODY’S.To the extent permitted by law, MOODY’S and its directors, offi cers, employees, agents, representatives, licensors and suppliers disclaim liability for any direct or compensatory losses or damages caused to any person or entity, including but not limited to by any negligence (but excluding fraud, will-ful misconduct or any other type of liability that, for the avoidance of doubt, by law cannot be excluded) on the part of, or any contingency within or beyond the control of, MOODY’S or any of its directors, offi cers, employees, agents, representatives, licensors or suppliers, arising from or in connection with the information contained herein or the use of or inability to use any such information.NO WARRANTY, EXPRESS OR IMPLIED, AS TO THE ACCURACY, TIMELINESS, COMPLETENESS, MERCHANTABILITY OR FITNESS FOR ANY PARTICULAR PURPOSE OF ANY CREDIT RATING, ASSESSMENT, OTHER OPINION OR INFORMATION IS GIVEN OR MADE BY MOODY’S IN ANY FORM OR MAN-NER WHATSOEVER.Moody’s Investors Service, Inc., a wholly-owned credit rating agency subsidiary of Moody’s Corporation (“MCO”), hereby discloses that most issuers of debt securities (including corporate and municipal bonds, debentures, notes and commercial paper) and preferred stock rated by Moody’s Investors Ser-vice, Inc. have, prior to assignment of any credit rating, agreed to pay to Moody’s Investors Service, Inc. for credit ratings opinions and services rendered by it fees ranging from $1,000 to approximately $5,000,000. MCO and Moody’s I nvestors Service also maintain policies and procedures to address the independence of Moody’s Investors Service credit ratings and credit rating processes. Information regarding certain affi liations that may exist between directors of MCO and rated entities, and between entities who hold credit ratings from Moody’s Investors Service and have also publicly reported to the SEC an ownership interest in MCO of more than 5%, is posted annually at www.moodys.com under the heading “Investor Relations — Corporate Governance — Director and Shareholder Affi liation Policy.” Additional terms for Australia only: Any publication into Australia of this document is pursuant to the Australian Financial Services License of MOODY’S affi liate, Moody’s Investors Service Pty Limited ABN 61 003 399 657AFSL 336969 and/or Moody’s Analytics Australia Pty Ltd ABN 94 105 136 972 AFSL 383569 (as applicable). This document is intended to be provided only to “wholesale clients” within the meaning of section 761G of the Corpora-tions Act 2001. By continuing to access this document from within Australia, you represent to MOODY’S that you are, or are accessing the document as a representative of, a “wholesale client” and that neither you nor the entity you represent will directly or indirectly disseminate this document or its contents to “retail clients” within the meaning of section 761G of the Corporations Act 2001. MOODY’S credit rating is an opinion as to the creditwor-thiness of a debt obligation of the issuer, not on the equity securities of the issuer or any form of security that is available to retail investors.Additional terms for Japan only: Moody’s Japan K.K. (“MJKK”) is a wholly-owned credit rating agency subsidiary of Moody’s Group Japan G.K., which is wholly-owned by Moody’s Overseas Holdings Inc., a wholly-owned subsidiary of MCO. Moody’s SF Japan K.K. (“MSFJ”) is a wholly-owned credit rating agency subsidiary of MJKK. MSFJ is not a Nationally Recognized Statistical Rating Organization (“NRSRO”). Therefore, credit ratings assigned by MSFJ are Non-NRSRO Credit Ratings. Non-NRSRO Credit Ratings are assigned by an entity that is not a NRSRO and, consequently, the rated obligation will not qualify for certain types of treatment under U.S. laws. MJKK and MSFJ are credit rating agencies registered with the Japan Financial Services Agency and their registration numbers are FSA Commissioner (Ratings) No. 2 and 3 respectively.MJKK or MSFJ (as applicable) hereby disclose that most issuers of debt securities (including corporate and municipal bonds, debentures, notes and com-mercial paper) and preferred stock rated by MJKK or MSFJ (as applicable) have, prior to assignment of any credit rating, agreed to pay to MJKK or MSFJ (as applicable) for credit ratings opinions and services rendered by it fees ranging from JPY125,000 to approximately JPY550,000,000.MJKK and MSFJ also maintain policies and procedures to address Japanese regulatory requirements.