macro inclusion research: detection and evaluation of macro
TRANSCRIPT
MACRO INCLUSION RESEARCH: DETECTION AND
EVALUATION OF MACRO INCLUSIONS IN SPECIAL STEELS
ASUMADU TABIRI KWAYIE
Master’s Thesis
SUPERVISORS: PROF. PÄR JÖNSSON (KTH)
ISMAIL KASIMAGWA (OVAKO)
Division of Applied Process Metallurgy
Department Of Materials Science and Engineering
Royal Institute of Technology
SE-100 44 Stockholm
Sweden
August, 2012.

I
Abstract
Quality has now become synonymous to clean steel grades used for the production of bearings.
Issues of macro and micro inclusions that reduce the mechanical properties of steel is no longer
tolerated by customers who place high demands on the performance of materials they use each
day in production. This project focuses on the detection and evaluation of macro inclusions in
bearing steels. The samples used were from Ovako Hofors and Hällefors. It was found out that
the macro inclusions from casting powder and runner/trumpet refractory constituted the highest
percentages among all the sources of macro inclusions in the casting system. This information
can therefore help the company to focus its resources on measures to eliminate this problem.

II
Dedication
TO MY VERY SPECIAL E.K.A.

III
Acknowledgement
I would like to thank the almighty God for His love and protection in the course of this project. I
also like to thank Ovako for their support and giving me the opportunity to be a part of their
family. My next appreciation goes to Patrick Ölund for giving me the chance to work in Ovako’s
materials technology laboratory in Hofors. My deepest appreciation also goes to my supervisors
Prof. Pär Jönsson at KTH and Ismail Kasimagwa at Ovako – Hofors for their dedicated time and
patience offered me in the course of this project. May the good Lord richly bless you all.
IV
TABLE OF CONTENT
1.0 Introduction ............................................................................................................................... 1
2.0 Literature Review ...................................................................................................................... 2
2.1 Production Line ..................................................................................................................... 2
2.2 Macro Inclusions ................................................................................................................... 3
2.2.1 Composition and Sources .............................................................................................. 4
2.2.1.1 Deoxidation products (Endogenous Inclusions) ..................................................... 4
2.2.1.1.1 Pure Alumina Lumps ....................................................................................... 4
2.2.1.1.2 Alumina or REM Clusters ............................................................................... 4
2.2.1.2 Exogenous Sources ..................................................................................................... 4
2.2.1.2.1 Al2O3-MgO Inclusions ......................................................................................... 4
2.2.1.2.2 Inclusions Associated with the Casting System ................................................... 5
2.2.1.2.2.1 Reoxidation ................................................................................................... 5
2.2.1.2.2.2 Casting powder ............................................................................................. 5
2.2.1.2.2.3 Runner/Trumpet Bricks ................................................................................ 7
2.2.1.2.2.4 Olivine Sand and Tap Hole Sand (Sliding Gate Sand) ................................. 7
2.2.2 Formation Mechanisms .................................................................................................. 8
2.2.2.1 Reoxidation Mechanism ......................................................................................... 8
2.2.2.2 Slag Entrapment/Entrainment Mechanism ............................................................. 9
2.2.2.3 Erosion and Corrosion Mechanism ......................................................................... 9
2.2.2.4 Chemical Reaction Mechanism ............................................................................ 10
2.2.3 Techniques of Evaluating Macro Inclusions................................................................ 10
2.2.3.1 Immersed Ultrasonic Technique ........................................................................... 11
2.2.3.1.1 Description ..................................................................................................... 11
2.2.3.1.1 Mode of Operation ......................................................................................... 11
2.2.3.1.2 Drawbacks of Ultrasonic Technique .............................................................. 12
2.2.3.2 SEM and Step – Down Tests ................................................................................ 13
2.2.4 Repercussions of Macro Inclusions in Steel ................................................................ 13
3.0 Experimental ........................................................................................................................... 15
3.1 Sample Information ............................................................................................................ 15
3.2 Sample Preparation ............................................................................................................. 16

V
3.3 LOM and SEM Investigations ............................................................................................ 17
3.4 Theories............................................................................................................................... 18
4.0 Results and Discursion ............................................................................................................ 19
4.1 Cleanliness Index ................................................................................................................ 19
4.2 Sources of the Macro Inclusions ......................................................................................... 20
4.3 Macro Inclusions Size Distribution .................................................................................... 21
4.4 Analysis for the Billets........................................................................................................ 22
4.5 Analysis for the Round Bars ............................................................................................... 23
4.6 Overview of the Types of Macro Inclusions....................................................................... 25
4.6.1 Olivine Sand................................................................................................................. 25
4.6.2 Reoxidation .................................................................................................................. 26
4.6.3 Casting Powder ............................................................................................................ 27
4.6.4 Runner/Trumpet Refractory ......................................................................................... 28
4.7 Thermocalc Simulations ..................................................................................................... 29
4.7.1 Casting Powder Modeling............................................................................................ 29
4.7.2 Refractory Modeling .................................................................................................... 30
4.8 Optimizing the Casting Process .......................................................................................... 33
4.8.1 Casting Powder Macro Inclusions ............................................................................... 33
4.8.2 Runner/Trumpet Refractory Macro Inclusions ............................................................ 34
4.8.3 Olivine Sand................................................................................................................. 34
4.8.4 Reoxidation .................................................................................................................. 34
5.0 Conclusion .............................................................................................................................. 35
6.0 Recommendation .................................................................................................................... 36
7.0 References ............................................................................................................................... 37
8.0 Appendix ................................................................................................................................. 39
9.0 MACRO INCLUSION ATLAS ............................................................................................. 46
VI
TABLE OF FIGURES
Figure 1, Production routine for billets, Hofors [2] ........................................................................ 2
Figure 2, Mechanism for dissolution and erosion of refractory into the liquid steel. [6] ............... 5
Figure 3, Schematic illustration of bottom teeming system. [3] ..................................................... 6
Figure 4, Main causes of defects in steel.[7] .................................................................................. 7
Figure 5, Modification of alumina clusters in a calcium treated steel grade. [14] ....................... 10
Figure 6, Schematics of the A) Ultrasonic system [20] and B) Signal detection. [21] ................. 11
Figure 7, Graphic presentation of an US-scanning performed with a 50 MHz transducer. Steel
grade: 100Cr6 (ball bearing steel)[17] .......................................................................................... 12
Figure 8, Relationship between heat treatment and echo amplitude index. [16] .......................... 12
Figure 9, Discriminating between inclusions and voids P: positive amplitude, N: negative echo
and A = [16] .................................................................................................................... 13
Figure 10, Schematic inclusion morphologies before and after rolling. A) Ductile sulphides, B)
Stringer formation from an inclusion cluster, C) Brittle stringer formation, D) Undeformed
inclusion. [19] .............................................................................................................................. 14
Figure 11, The part of the bars where the defects were detected. ................................................. 15
Figure 12, The parts of the ingot where the samples were taken, the BB samples were taken
10cm from the bottom, the B samples were also taken 34cm from the bottom, M samples were
taken 48cm from the bottom and finally the T samples were taken 83cm from the bottom. ....... 15
Figure 13, The different types of samples used for the investigations: A) a picture of the various
diameters of bars from Ovako Hällefors and B) a picture of the plates cut out from the billets
from Hofors. .................................................................................................................................. 16
Figure 14, Detected surface defects on the samples with the phase Array ultrasonic online
system. A) point defect on sample 3B3, and longitudinal defects on samples B) 1T3, C) 4T2 and
D) 4T3. .......................................................................................................................................... 17
Figure 15, The estimated size of the macro inclusions. ................................................................ 18
Figure 16, The cleanliness index calculated for the various types of materials. .......................... 19
Figure 17, The different kinds of macro inclusions that were detect in the steel. ........................ 20
Figure 18, The size distribution of the macro inclusions detected. .............................................. 21
Figure 19, Results from the analysis of the macro inclusions found in the billet, A) a bar chart
showing which part of the billet the macro inclusions were located and B) a pie chart showing
the positions the macro inclusions where located. ........................................................................ 22
Figure 20, A bar chart showing the different types of macro inclusions and the part of the billet
they were located. ......................................................................................................................... 23
Figure 21, The different types of macro inclusions found in the round bars and their frequencies.
....................................................................................................................................................... 24
Figure 22, A pie chart showing the percentages of the number of macro inclusions that were
detected at the different positions of the bar. ................................................................................ 24
VII
Figure 23, The results from the analysis of an olivine sand found in a sample using the
SEM/EDS, A) focus on the macro inclusion, B) a magnification of the site of interest for point
analysis, C) spectrum 7, indicating the composition of the macro inclusion. .............................. 25
Figure 24, The results from the analysis of a macro inclusion from reoxidation reactions using
the SEM/EDS, A) focus on the macro inclusion, B) a magnification of the site of interest for
point analysis, C) spectrum 2, indicating the composition of the macro inclusion. ..................... 26
Figure 25, Results for the analysis of a casting powder macro inclusion using the SEM/EDS, A)
focus on the macro inclusion, B) a magnification of the site of interest for point analysis, C)
spectrum 7, indicating the composition of the macro inclusion. .................................................. 27
Figure 26, Results from the analysis of a runner/trumpet refractory macro inclusion using the
SEM/EDS, A) focus on the macro inclusion B) spectrum 4, indicating the composition of the
macro inclusion. ............................................................................................................................ 28
Figure 27, A graph representing the stable phase in the casting powder from 1450K to 2300. ... 30
Figure 28, Simulation results from Thermocalc for stable phases in 56.7% Al2O3 -44.3% SiO2
systems from 600K to 2400K. ...................................................................................................... 31
Figure 29, Thermocalc simulation results for stable phases in A) the Aluminosilicate refractory
with all constituents and 0.5%Mn addition, B) a magnification of the weight percent(BP(*)) axis
from 0-10%, this is done to show clearly the light purple line representing the first liquid to
appear in the refractory at 1120K. ................................................................................................ 32

VIII
PROJECT PLAN
The project will include:
Literature and internal report review
Sectioning and assessment of samples from
In-line inspection technique
10MHz UST samples
Step-down test samples (if applicable)
Determining location in ingot
Analysing defects in SEM
Theoretical work including TC simulations
Reporting (Thesis)

1
1.0 Introduction
There has been great success in the quest to reduce the oxygen content of steel in recent
years. Due to the enhancement of ladle metallurgical processes, lower values of oxygen
concentration ranging from 4-5ppm are attainable by clean steel producers around the world.
Problems associated with nonmetallic inclusions in steel are gradually been solved, since
steel producers have invested much into this research area. This has helped improve the
mechanical and surface properties of bearing steels and steel products that demand higher
levels of purity in their applications.
With the current advancement in experimental techniques such as the Light Optical
Microscopy (LOM), Scanning Electron microscopy (SEM), extractive methods and the
recent immersed ultrasonic technique, the characteristics of nonmetallic inclusions are not
mysterious anymore. These techniques have provided metallurgist with much information
about the morphology, chemical composition, inclusion distribution in the liquid steel and
some knowledge about the formation mechanisms of the nonmetallic inclusions found in
steel. This information has been used to improve the steel making process so as to maximize
profit.
All that said, the clean steel industry still battles with the repercussions of Macro inclusions
(inclusions of sizes >100µm) in steel. These inclusions are rare to find, but it has been
reported that, they are more catastrophic to the fatigue performance of the material. [1] More
research work is needed in order to fully understand their formation mechanisms and
detection. The main sources of these inclusions have been reported to be associated with the
casting process, even though deoxidation products cannot be ruled out. What this means is
that, steel that has been treated well in the ladle might come in contact with processes in the
casting process that would introduce these inclusions into the steel. As at now, not much can
be done in removing them from the steel at this final step.
If these macro inclusions are not detected before the material is put in used, its mechanical
properties are greatly affected and this can lead to outrageous consequences in the
engineering application. It is therefore of great value for significant amount of data to be
collected on these macro inclusions in order to prevent their formation in steel. It is against
this background that this project is been done at Ovako Materials Technology Hofors, to
share more light on the detection and evaluation of macro inclusions in steel.

2
2.0 Literature Review
2.1 Production Line
Figure 1, Production routine for billets, Hofors [2]
The steel making process starts from the charging of properly selected and inspected scraps into
the Electric Arc Furnace (EAF). The quality of the scrap determines how difficult or easy the
ladle metallurgical process would be at a later step: so scraps with composition closer to that of
the final product are preferable. With the help of graphite electrodes, the scraps are melted down
into liquid steel. Slag formers that are added during the charging of the scraps and the highly
oxidizing conditions in the melt leads to some amount of refining of C, P, Si, Al, and Mn in the
EAF. Sulfur refinement is difficult at this stage due to the high activity of oxygen in the melt.
After melting, the steel is poured out into a ladle through the bottom plugs and deslagging takes
place as show in figure 1 (the third step). Deslagging is done to remove the oxidizing slag and
replace it with a reducing slag for sulfur refining in the ladle. It is also done in order to prevent
the top slag from consuming the additives that would be added in the subsequent ladle
metallurgical process.
The steel is then carried to the ladle station where the composition is adjusted to obtain the final
composition of the product. This is a very important part of the steel making process and the

3
quality of the steel mostly depends on this step. Depending on the type of steel been produced,
deoxidizers such as Al, Si or rare earth metals are used to reduce the oxygen content of the steel.
The products of deoxidation are removed to the top slag with the help of the induction stirring
and gas bubbling from the bottom. When the oxygen activity in the steel has gone down, the
thermodynamic conditions would be favorable for sulfur removal, so calculated amount of CaO
is added to reduce the sulfur content to the desirable amount. Alloying can be done at this stage
to obtain the right composition of the steel been produced. After this process the top slag is
removed and the temperature is adjusted to obtain the right temperature for casting. The ladle is
then sent to the casting station for the casting process to take place.
The ladle is positioned on top of the trumpet and the sliding gate is opened for the ingot casting
process to begin. The liquid metal flows through the trumpet to the runners and then fill up the
ingot molds as can be seen in figure 1 (step 6). The steel solidifies and the ingot is removed from
the mold after the solidification process. The ingots are then kept in an oven for about 24hrs to
enhance diffusion of atoms in the ingots: this is done to reduce segregation and optimize
chemical homogenization in the ingots.
The ingots are then rolled in several steps into billets and they are then inspected and processed
into the final products. Ultrasonic inspections are also done at this stage to check for defective
bars which are then sorted out and returned to the melting shop.
2.2 Macro Inclusions
Operations such as deoxidation and desulfurization are done in order to obtain the correct
amounts of oxygen and sulfur in the steel. These elements contribute to the formation of
nonmetallic inclusions in steel during solidification and the consequences of these inclusions are
catastrophic to the mechanical properties of the material during usage. Elements such as Al, Si,
Ca and the Rare Earth Metals (REM) are used to remove oxygen and sulfur from steel. Micro
inclusions (1-20µm) that may formed from the reactions of these elements often coagulate to
form clusters and inclusions of bigger sizes (>100µm) known as macro inclusions. Inclusions
formed through these principles are known as endogenous inclusions.
Another way macro inclusions may be introduced to into steel is through reoxidation: this is
when the liquid steel comes into contact with atmospheric oxygen and the elements in the steel
that have high affinity to oxygen react with it to form nonmetallic inclusions. Reoxidation can
also take place when the liquid metal reacts with top slag. Reaction of the liquid metal with
refractories in the ladle and casting systems are ways in which macro inclusions may be
introduce into the system. Sand that are used for the sliding gate and in the mold systems also
contribute to the sources of macro inclusions in steel. All macro inclusions produced out of these
mechanisms are known as exogenous inclusions.
Detection of macro inclusions in the bulk steel is very difficult and advance methods like the
immersed ultrasonic method is used to scan for these inclusions in the final product. Due to this,
4
establishing a credible statistical data on them is still a working progress for most companies.
The composition of the macro inclusions seem to modify and new sources are introduced over
time: this might be due to the introduction of new operations in plants.
2.2.1 Composition and Sources
The composition of macro inclusions are dependent on their sources and also the formation
mechanisms under which they are formed. Their compositions are not stationary and may change
as and when the thermodynamic conditions in the liquid metal changes to suit a particular phase
or chemical composition.
2.2.1.1 Deoxidation products (Endogenous Inclusions)
Deoxidation process produces products that have been known to cause clogging and reduction of
the steel’s quality. These products are mostly oxides that may form lumps or clusters depending
on the formation mechanisms and the thermodynamic conditions around. The products are
mostly removed from the system due to the recent advancement in the stirring processes: with
the combination of induction stirring and gas bubbling. [18] Some of these lumps and clusters
still find their way into the later stages of the production line.
2.2.1.1.1 Pure Alumina Lumps
The sources of alumina lumps have been attributed to different sources, this may include
reoxidation, where by dissolved aluminum in the liquid steel gets in contact with atmospheric
oxygen and forms these alumina lumps, the reduction of unstable oxides by aluminum and the
deoxidation process that takes place to reduce the oxygen content of the steel. [3]
2.2.1.1.2 Alumina or REM Clusters
As mentioned earlier, micro inclusions that are formed during deoxidation with either REM’s
(Ce, La, Nb etc) or alumina have the tendency to agglomerate together to form clusters.[4] The
composition of these clusters are either pure Alumina [3] or REM oxides (such as CeO,
LaO…etc) and so the source cannot be traced to the refractory brick or the like, since traces of
other elements would have been present in the clusters. When these clusters have been built up at
the bottom of the ladle or the tap holes as in the case of clogging, they may dislodge and float
freely in the melt as a macro inclusion.
2.2.1.2 Exogenous Sources
The macro inclusions that come from these sources mostly are associated with the materials that
come into direct contact with the liquid steel: both in the ladle and the casting systems.
2.2.1.2.1 Al2O3-MgO Inclusions
Resin bonded Al2O3/MgO/C refractories containing aggregates of different sizes are mostly used
for the lining of ladles.[5] Two different mechanisms that may be responsible for the removal of
the aggregates from the refractory are dissolution and erosion. When the resin and the carbon in
the refractory are attacked by a corrosive steel grade, they dissolve and the Al2O3-MgO
aggregates become susceptible to erosion. The aggregates are then removed and deposited in the

5
steel as inclusions; this phenomenon is shown in figure 2. Traces of SiO2 may also be detected in
these inclusions since most ladle refractories contain SiO2 to improve their strength.[5]
Figure 2, Mechanism for dissolution and erosion of refractory into the liquid steel. [6]
2.2.1.2.2 Inclusions Associated with the Casting System
With regards to the casting system, the liquid metal comes into direct contact with different
materials such as runner/trumpet bricks, tap hole sand, olivine sand, casting powder etc. all these
materials can introduce macro inclusions into the steel. In addition to this, the steel also comes
into contact with air in the system and macro inclusions are generated through reoxidation as
well. Figure 3 shows a vivid schematic illustration of the ingot casting system, indicating where
the various materials come into contact with the liquid steel.
2.2.1.2.2.1 Reoxidation
This is a phenomenon where by the liquid metal comes into contact with air and reactive slag
phases, iron and dissolved elements in the steel which have high affinity for oxygen react with
them to form oxides. The main parts of the casting system that the liquid steel comes into contact
with air are; the part in between the nozzle of the ladle and the trumpet, as well as air that may
have already filled the mold and the runners. This source has been predicted to be the most
vibrant source of macro inclusions in the casting system.[3][7] Figure 4 shows the results of a
survey conducted at Ovako to assess the major sources of macro inclusions in steel, this graph
clearly shows that reoxidation contributes immensely to macro inclusions in steel products. Since
deoxidation products are mostly removed during stirring in the ladle, most pure alumina lumps
and clusters trace their sources from this phenomenon.
2.2.1.2.2.2 Casting powder
The casting powder is used to cover the surface of the liquid steel in the mold during casting.
This is done to prevent reoxidation at the surface of the liquid steel inside the mold and also to
lubricate the mold surface in contact with the liquid steel. The powders are kept in paper sacks
and hanged in the mold. The hot liquid metal gets into contact with these paper sacks and burns
them in order to release the powder onto the surface of the molten metal. The turbulence from
the entering liquid metal mixes and traps the casting powder into the flow and as a result macro

6
inclusions are generated in the steel. Natural convection in the liquid flow may also trap the
inclusions at the top and circulate them in the solidifying melt.
The composition of casting powder mostly used is 25.0-32.0% SiO2, 15.0-21.0% Al2O3, 5.0-
11.0% Fe2O3, <2.0MgO, 1.0-5.0 CaO, 4.0-6.0 Na2O, <2.0K2O, 1.5TiO2, <1.0MnO, <0.5F, 23.0-
26.0C.[3][8] This composition may differ depending on the type of process being used and also
the steel being produced. Macro inclusions that may contain traces of these compounds are more
likely to come from this source. The most noticeable oxides are Na2O, K2O, TiO2 and sometimes
Li2O depending on the type of powder being used.[8] These oxides are rare in the steel making
process and the casting powder provides a potential avenue for them to enter the steel even
though traces of these oxides can sometimes be found in the refractories used.
Figure 3, Schematic illustration of bottom teeming system. [3]

7
2.2.1.2.2.3 Runner/Trumpet Bricks
The refractories used for the trumpet and runner systems are characterized by high Al2O3 (40-
60%) and SiO2 (20-50%) content depending on the type used. [3][9].These oxides improve the
stability of the refractories at higher temperatures in the steel making process. Small
concentrations of TiO2, FeO and other oxides may be present as well. Macro inclusions from
these refractories therefore have high concentrations of Al2O3 and SiO2 with little traces of the
other oxides.
The main purpose of the trumpet and runner is to direct the molten metal safely into the mold in
order to cast the ingots. The velocity of the hot liquid steel running through these refractories is
high and this is also accompanied by high turbulence in the flow. The surface of the refractories
in contact with the flow therefore becomes susceptible to various erosion mechanisms. Surface
imperfections such as pores, loose sand and cracks serve as catalyst to the removal of exogenous
materials into the main stream. This phenomenon is a major source of large macro inclusions in
steel. [3][7][9]
Figure 4, Main causes of defects in steel.[7]
2.2.1.2.2.4 Olivine Sand and Tap Hole Sand (Sliding Gate Sand)
The use of sand in casting processes can be traced back many centuries ago. It is outstand to note
that the modernized sophisticated systems for casting still makes use of different types of sand
for various applications.
8
Olivine sand with composition 45-49%MgO, 40-41%SiO2 and 7%Fe2O3 [10] are mostly poured
around the refractory bricks to help with the insulation and also to keep them in position. This
sand has fine particles and therefore is very loose in nature. The possibility of the sand to find its
way into the holes in between the runners and trumpet is very high. This means, if maximum
caution is not taken and good cleaning systems for the runners are not employed, there is a high
risk of introducing macro inclusions into the steel.
The sliding gate at the bottom of the ladle sometimes becomes difficult to open due to the
elevated temperatures in the ladle. The taping sand is therefore used to insulate the gate from the
metal bath. This sand mostly has high SiO2(>50%) and Cr2O3 (≈20%) with some Al2O3 and FeO.
Upon opening of the sliding gate this sand is blown away to prevent them from entering the
system. If this process is not accurately done, the sand might find its way into the liquid steel and
macro inclusions may be generated in the final product. Macro inclusions from this sand can be
differentiated from that of Olivine sand by its high Cr2O3 content. With better cleaning systems,
macro inclusions from these sources are preventable.
2.2.2 Formation Mechanisms
The different sources of macro inclusions in steel have different modes of formation and
mechanisms. A contribution of both chemical and mechanical reactions often leads to the
formation of these inclusions. Finding out the exact mechanisms behind macro inclusions of
specific compositions is still the subject of research for most steel plants. The most common
mechanisms as reported by Zhang et al are reoxidation, slag entrainment/entrapment, lining
refractory corrosion and erosion, and chemical reaction mechanisms. [11] The mechanisms may
combine at certain parts of the system to create macro inclusions. For instance dissolution and
reoxidation at the surface of the refractory by reactive products of deoxidation might lead to the
erosion of exogenous materials from the lining of the refractory into the steel.
2.2.2.1 Reoxidation Mechanism
When the bulk iron comes into contact with air, the iron oxidizes to form FeO. FeO can further
be reduced by dissolved elements like Mn, Si, Al etc. the oxides that are formed also combine to
form complex oxides in the steel.
One other source of reoxidation is when slag comes into contact with dissolved elements like Al,
Ca, Ce, La and other elements with much higher standard free energy of formation of oxide as
can be seen in equation 1 below. In this case the SiO2, FeO, MnO are reduced by these elements
and the oxides formed serve as the nucleation point for complex oxide formation. Refractory
materials also contain various combinations of these oxides and so they are also vulnerable to
this reoxidation mechanism.
[ ] [ ] [ ] [ ] (1) [12]
This mechanism is a major source of macro inclusions in steel and it is nevertheless obvious that
its prevention would be, protecting the liquid steel from getting into contact with atmospheric air
9
and top slag. This is very difficult and steel plants have been working at optimizing conditions in
order to achieve this.
2.2.2.2 Slag Entrapment/Entrainment Mechanism
The entrapment of slag into the liquid steel can happen through several ways, since the
interaction between the two phases (metal phase and slag phase) takes place throughout the steel
making process. During desulfurization a good contact between the steel phase and the slag
phase is needed for the dissolved sulfur to be transferred from the steel into the slag. This is
achieved by vigorously stirring the steel with the help of induction and gas bubbling stirring. An
emulsion is created at the slag – metal interface and droplets of the slag are picked up and
circulated in the melt. These droplets can then be trapped in the liquid steel and result in macro
inclusions during solidification.
Another way slag can be trapped into the steel is through pouring from the ladle into the tundish
or the trumpet. At the end of the tapping stream, the vortex created can suck the slag into the
liquid metal.[13] Clean steel producers these days solve this problem by leaving some amount of
steel at the bottom of the ladle in order to prevent the vortex formation. One other phenomenon
that makes slag enter the steel is slag lining of the well block in the ladle during pouring. In the
process of tapping, as the slag layer lowers down the ladle, the slag wets the refractory and
leaves a thin lining on its surface. The left over slag is then tapped away and the refractory is
cleaned for the next ladle treatment to begin. Small droplets of slag that might be left in the ladle
after the cleaning process has taken place might find their way in the next liquid steel poured into
that same ladle. It will then circulate in the steel due to the stirring process and end up as a macro
inclusion.
2.2.2.3 Erosion and Corrosion Mechanism
This mechanism happens as a result of both chemical and mechanical reactions between the
liquid steel and the refractory interface. It is also a common cause of exogenous inclusions in
most steel grades. Areas where the velocity of the liquid steel is high are more prone to this
mechanism. The high velocity creates turbulence in the flow and this makes it easy for loose
materials on the surface of the refractories to be carried away by the melt.
Corrosive oxides like FeO that are formed during reoxidation and deoxidation, attaches
themselves to the refractory walls and then attack the binders and the oxides in the refractory. By
so doing the aggregates in the refractory becomes loose and dislodge into the metal bath.
Another dissolution attack is also seen in figure 2, where the carbon and the binders are attacked
by corrosive steel grades which may contain high amounts of Manganese and other deoxidants.
Loose sand and particles on the surface of the refractories during their manufacturing can also be
easy sources of exogenous inclusions in steel. The runner and trumpet lining are two places
where erosion is most dominant in steel production due to the rushing molten metal through
these channels. The ladle wall linings are also liable to this phenomenon due to high stirring rate
10
in the ladle. The circulation of liquid creates turbulence in the flow which subsequently leads to
the erosion of the walls.
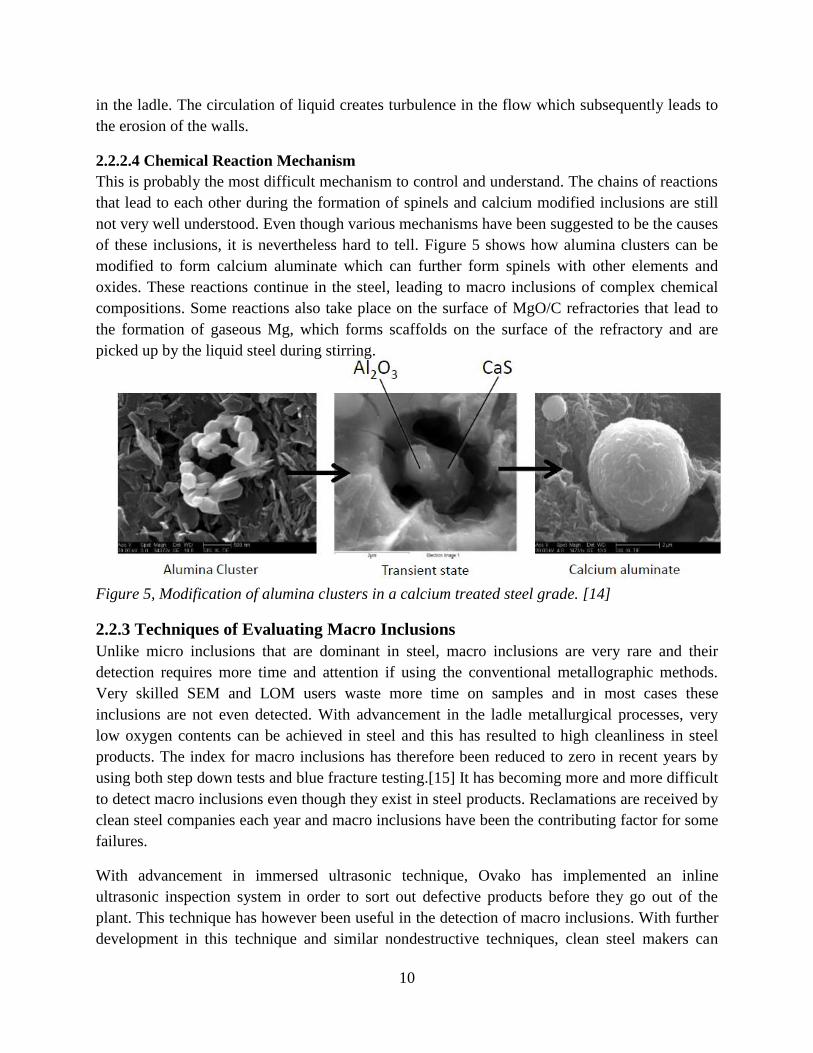
2.2.2.4 Chemical Reaction Mechanism
This is probably the most difficult mechanism to control and understand. The chains of reactions
that lead to each other during the formation of spinels and calcium modified inclusions are still
not very well understood. Even though various mechanisms have been suggested to be the causes
of these inclusions, it is nevertheless hard to tell. Figure 5 shows how alumina clusters can be
modified to form calcium aluminate which can further form spinels with other elements and
oxides. These reactions continue in the steel, leading to macro inclusions of complex chemical
compositions. Some reactions also take place on the surface of MgO/C refractories that lead to
the formation of gaseous Mg, which forms scaffolds on the surface of the refractory and are
picked up by the liquid steel during stirring.
Figure 5, Modification of alumina clusters in a calcium treated steel grade. [14]
2.2.3 Techniques of Evaluating Macro Inclusions
Unlike micro inclusions that are dominant in steel, macro inclusions are very rare and their
detection requires more time and attention if using the conventional metallographic methods.
Very skilled SEM and LOM users waste more time on samples and in most cases these
inclusions are not even detected. With advancement in the ladle metallurgical processes, very
low oxygen contents can be achieved in steel and this has resulted to high cleanliness in steel
products. The index for macro inclusions has therefore been reduced to zero in recent years by
using both step down tests and blue fracture testing.[15] It has becoming more and more difficult
to detect macro inclusions even though they exist in steel products. Reclamations are received by
clean steel companies each year and macro inclusions have been the contributing factor for some
failures.
With advancement in immersed ultrasonic technique, Ovako has implemented an inline
ultrasonic inspection system in order to sort out defective products before they go out of the
plant. This technique has however been useful in the detection of macro inclusions. With further
development in this technique and similar nondestructive techniques, clean steel makers can
11
improve upon their product’s quality by isolating defective materials before leaving the plant to
the customer.
2.2.3.1 Immersed Ultrasonic Technique
The ultrasonic technique has made it possible to detect macro inclusions of sizes greater than
100µm without wasting much time as in the case of metallographic methods. It has also made it
possible for inline inspections to be done to discover defects such as cracks, macro inclusions,
voids and segregated areas. Wider areas can also be scanned in a shorter period of time than
microscopic methods.[16] This method can also be used to detect inclusions of sizes smaller than
100µm with higher frequency focusing probe.
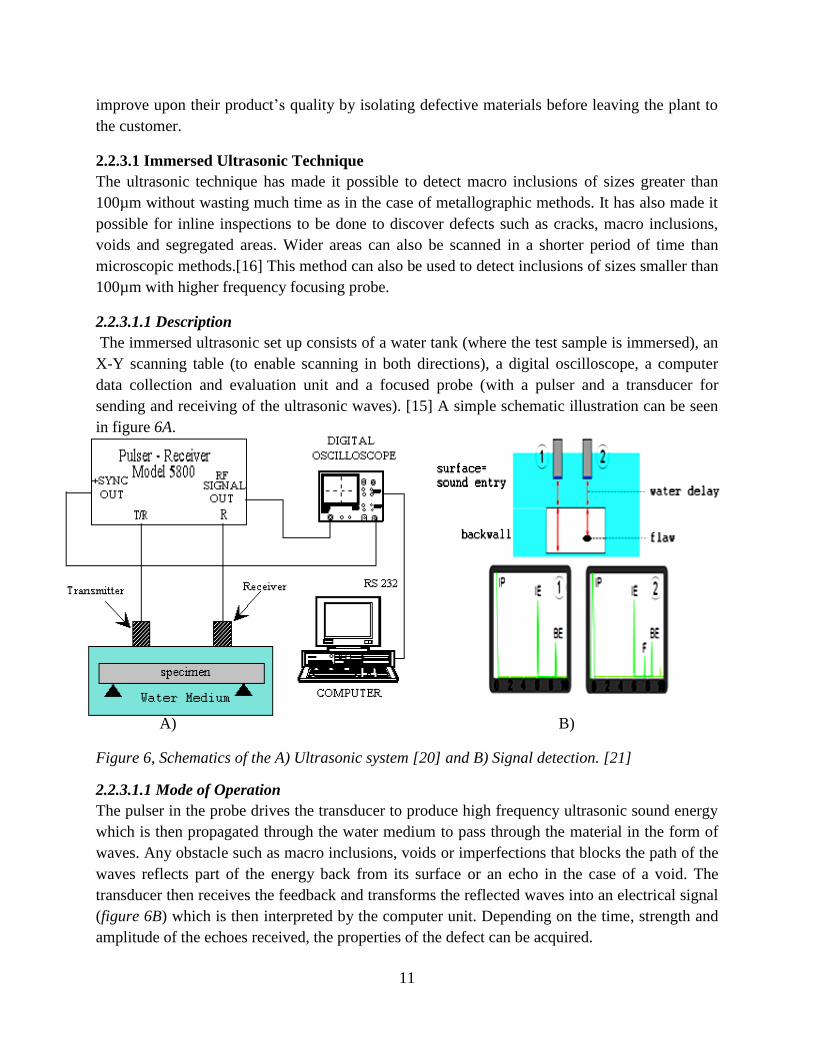
2.2.3.1.1 Description
The immersed ultrasonic set up consists of a water tank (where the test sample is immersed), an
X-Y scanning table (to enable scanning in both directions), a digital oscilloscope, a computer
data collection and evaluation unit and a focused probe (with a pulser and a transducer for
sending and receiving of the ultrasonic waves). [15] A simple schematic illustration can be seen
in figure 6A.
A) B)
Figure 6, Schematics of the A) Ultrasonic system [20] and B) Signal detection. [21]
2.2.3.1.1 Mode of Operation
The pulser in the probe drives the transducer to produce high frequency ultrasonic sound energy
which is then propagated through the water medium to pass through the material in the form of
waves. Any obstacle such as macro inclusions, voids or imperfections that blocks the path of the
waves reflects part of the energy back from its surface or an echo in the case of a void. The
transducer then receives the feedback and transforms the reflected waves into an electrical signal
(figure 6B) which is then interpreted by the computer unit. Depending on the time, strength and
amplitude of the echoes received, the properties of the defect can be acquired.
12
Figure 7 below shows a graphic representation of how the feedback from the ultrasonic signals
can be interpreted. The blue base colour represents the bulk material whilst the red spots
represent the imperfections that were detected by the ultrasonic technique.
Figure 7, Graphic presentation of an US-scanning performed with a 50 MHz transducer. Steel
grade: 100Cr6 (ball bearing steel)[17]
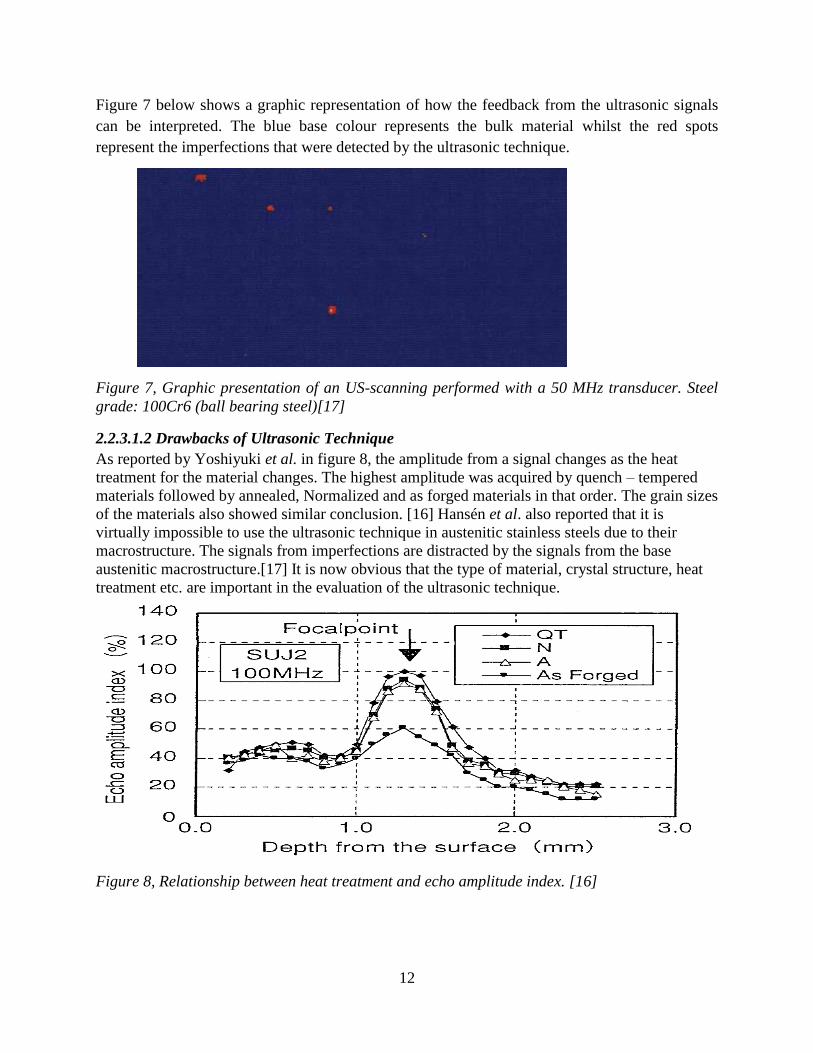
2.2.3.1.2 Drawbacks of Ultrasonic Technique
As reported by Yoshiyuki et al. in figure 8, the amplitude from a signal changes as the heat
treatment for the material changes. The highest amplitude was acquired by quench – tempered
materials followed by annealed, Normalized and as forged materials in that order. The grain sizes
of the materials also showed similar conclusion. [16] Hansén et al. also reported that it is
virtually impossible to use the ultrasonic technique in austenitic stainless steels due to their
macrostructure. The signals from imperfections are distracted by the signals from the base
austenitic macrostructure.[17] It is now obvious that the type of material, crystal structure, heat
treatment etc. are important in the evaluation of the ultrasonic technique.
Figure 8, Relationship between heat treatment and echo amplitude index. [16]
13
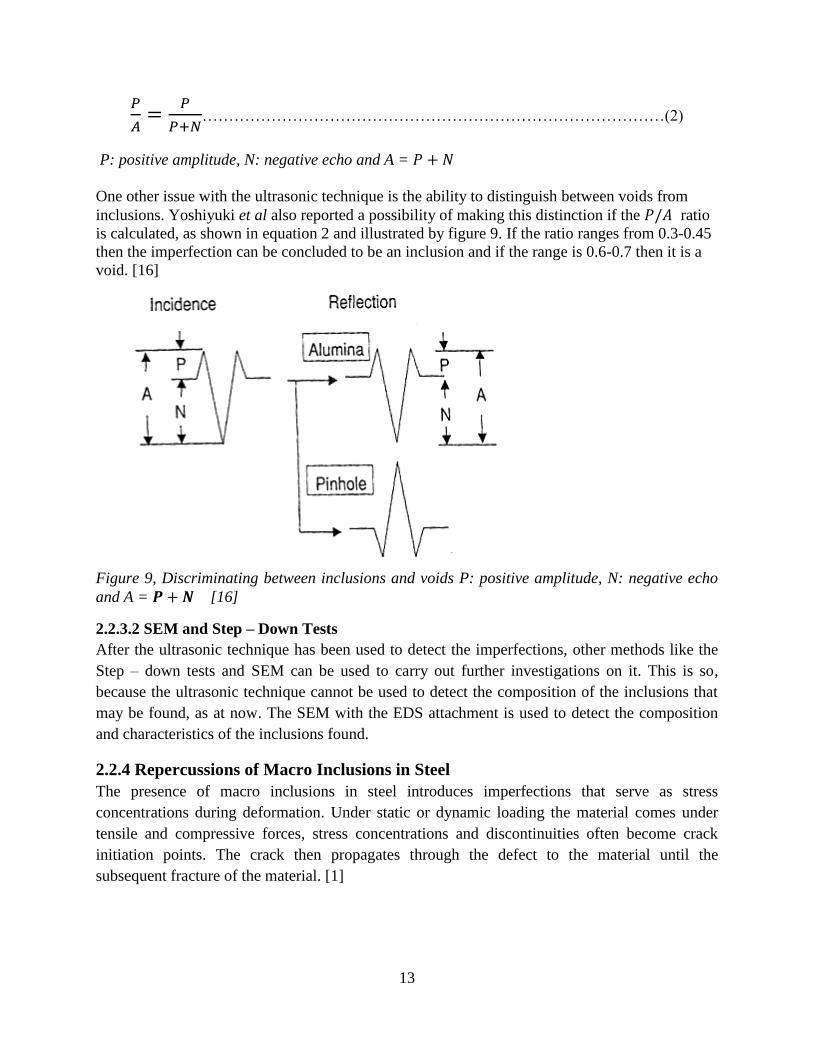
……………………………………………………………………………(2)
P: positive amplitude, N: negative echo and A =
One other issue with the ultrasonic technique is the ability to distinguish between voids from
inclusions. Yoshiyuki et al also reported a possibility of making this distinction if the ratio
is calculated, as shown in equation 2 and illustrated by figure 9. If the ratio ranges from 0.3-0.45
then the imperfection can be concluded to be an inclusion and if the range is 0.6-0.7 then it is a
void. [16]
Figure 9, Discriminating between inclusions and voids P: positive amplitude, N: negative echo
and A = [16]
2.2.3.2 SEM and Step – Down Tests
After the ultrasonic technique has been used to detect the imperfections, other methods like the
Step – down tests and SEM can be used to carry out further investigations on it. This is so,
because the ultrasonic technique cannot be used to detect the composition of the inclusions that
may be found, as at now. The SEM with the EDS attachment is used to detect the composition
and characteristics of the inclusions found.
2.2.4 Repercussions of Macro Inclusions in Steel
The presence of macro inclusions in steel introduces imperfections that serve as stress
concentrations during deformation. Under static or dynamic loading the material comes under
tensile and compressive forces, stress concentrations and discontinuities often become crack
initiation points. The crack then propagates through the defect to the material until the
subsequent fracture of the material. [1]

14
Figure 10 illustrates the four main forms (from A to D) that inclusions take after rolling. All these
forms introduce discontinuities in the material and its tensile and fatigue strength are affected
during serves.
Figure 10, Schematic inclusion morphologies before and after rolling. A) Ductile sulphides, B)
Stringer formation from an inclusion cluster, C) Brittle stringer formation, D) Undeformed
inclusion. [19]

15
3.0 Experimental
3.1 Sample Information
There were two groups of samples that were investigated, the first group came from Ovako
Hällefors and the other group was from Ovako Hofors. The samples from Hällefors were round
bars with three different set of diameters: 30mm, 50mm and 60mm. In all there were five 30mm
diameter bars, two 50mm diameter bars and one 60mm diameter bar. These samples had been
inspected with the ultrasonic method used in Ovako Hällefors and some defects had been
detected. The samples were then sent to the materials technology lab at Ovako Hofors for some
investigations to be carried out on them, in order to identify the defects that had been detected.
The first four samples from Hällefors were labeled 1T3, 4T2, 4T3 and 3B3; they were taken
from the top and bottom parts of the ingot as indicated by figure 11 below.
Figure 11, The part of the bars where the defects were detected.
The next group of samples from Hofors was 147mm X 147mm bars that were taken 730mm
away from the bottom of the ingot. The samples were labeled BB (Bottom – Bottom), B
(Bottom), M (Middle) and T (Top); according to the part of the ingot they were taken from.
Figure 12 shows which part of the ingot that the various samples were taken.
Figure 12, The parts of the ingot where the samples were taken, the BB samples were taken
10cm from the bottom, the B samples were also taken 34cm from the bottom, M samples were
taken 48cm from the bottom and finally the T samples were taken 83cm from the bottom.

16
3.2 Sample Preparation
The samples that were sent from Hällefors had the places where the defects were located marked
out. Each bar was therefore cut into two parts; they were cut some distance away from the defect
and then the cross sections were polished up to the marked areas where the defect was located.
The samples that had surface defects were easy to work with since it was somewhat easy to find
the defects, but it became more challenging when the defects were some distance away from the
surface. Absolute caution was therefore needed during the sample preparation in order not to
wash out the macro inclusion. Figure 13 shows the various types of samples that were prepared
for this project. After cutting of the samples, the surfaces of interest were then polished in three
stages and made ready for microscopic analysis. For samples BB, B, M and T, a thickness of
14.5mm was taken from each part of the billets for the investigation. The 147 X 147 X 14.5mm
plates were then cut into four parts making it sixteen samples in all. After the investigation of the
upper surface, the lower surfaces were also polished for further investigations; this was done to
increase the evaluated surface area which intends increases the probability of finding a macro
inclusion.
A) B)
Figure 13, The different types of samples used for the investigations: A) a picture of the various
diameters of bars from Ovako Hällefors and B) a picture of the plates cut out from the billets
from Hofors.
17
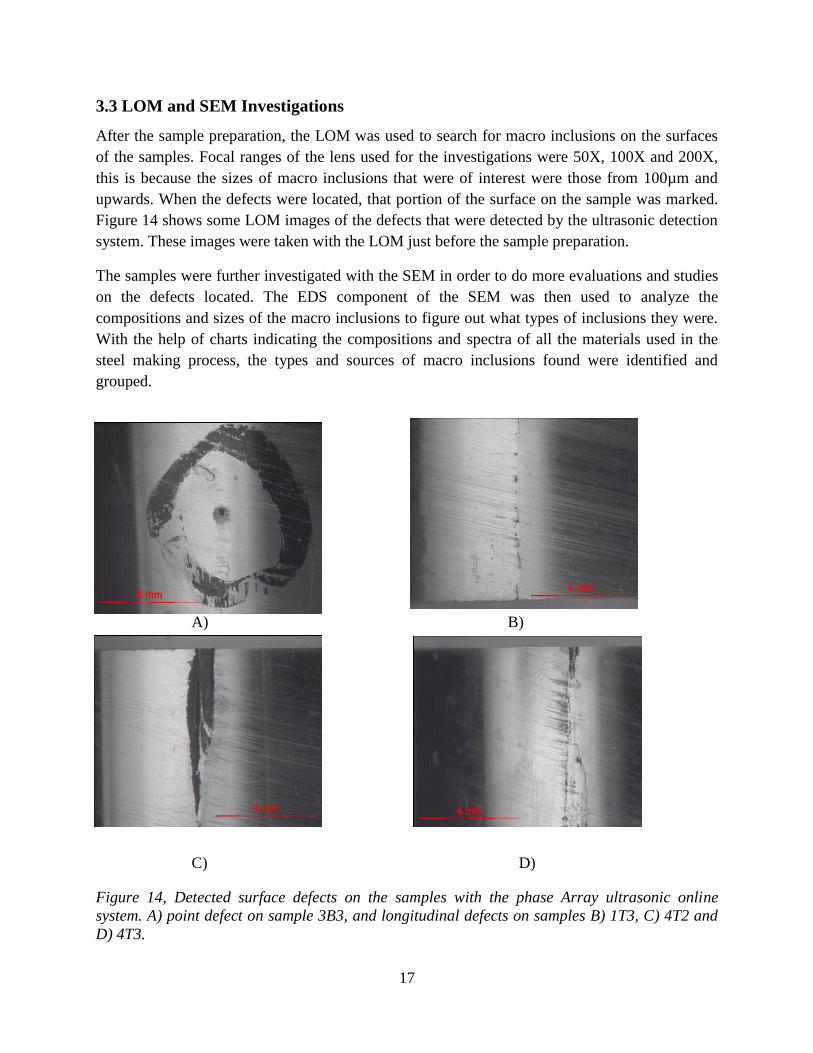
3.3 LOM and SEM Investigations
After the sample preparation, the LOM was used to search for macro inclusions on the surfaces
of the samples. Focal ranges of the lens used for the investigations were 50X, 100X and 200X,
this is because the sizes of macro inclusions that were of interest were those from 100µm and
upwards. When the defects were located, that portion of the surface on the sample was marked.
Figure 14 shows some LOM images of the defects that were detected by the ultrasonic detection
system. These images were taken with the LOM just before the sample preparation.
The samples were further investigated with the SEM in order to do more evaluations and studies
on the defects located. The EDS component of the SEM was then used to analyze the
compositions and sizes of the macro inclusions to figure out what types of inclusions they were.
With the help of charts indicating the compositions and spectra of all the materials used in the
steel making process, the types and sources of macro inclusions found were identified and
grouped.
A) B)
C) D)
Figure 14, Detected surface defects on the samples with the phase Array ultrasonic online
system. A) point defect on sample 3B3, and longitudinal defects on samples B) 1T3, C) 4T2 and
D) 4T3.
18
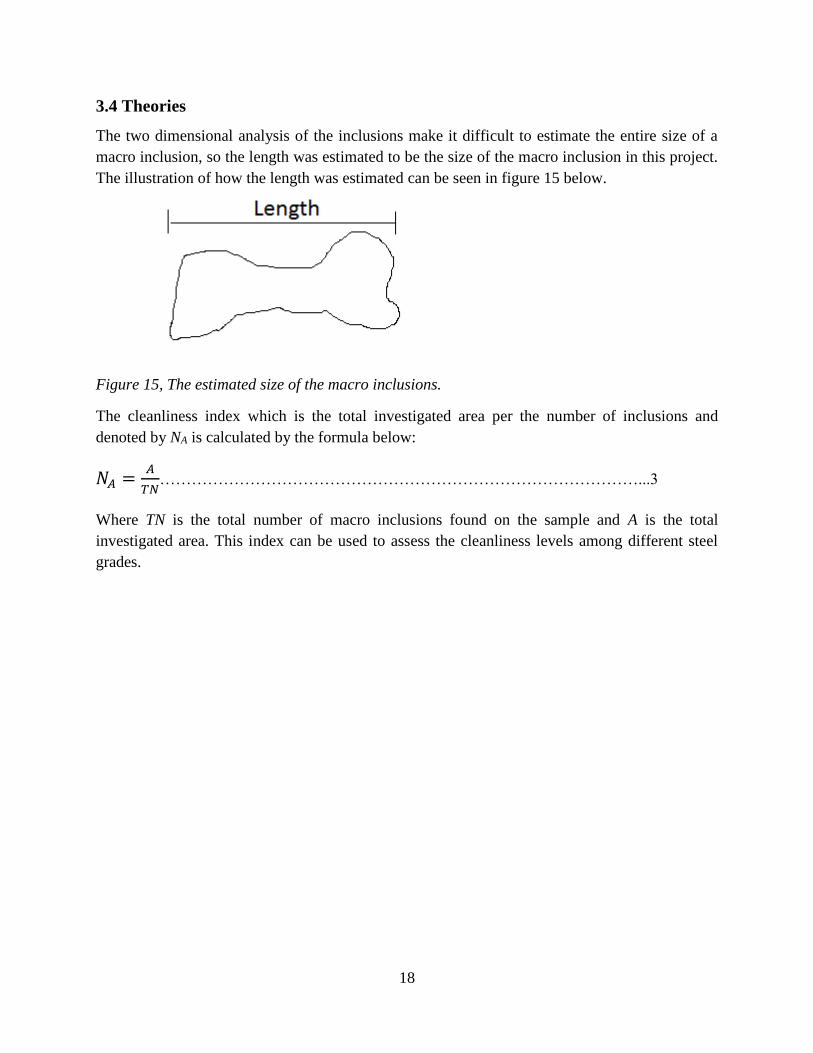
3.4 Theories
The two dimensional analysis of the inclusions make it difficult to estimate the entire size of a
macro inclusion, so the length was estimated to be the size of the macro inclusion in this project.
The illustration of how the length was estimated can be seen in figure 15 below.
Figure 15, The estimated size of the macro inclusions.
The cleanliness index which is the total investigated area per the number of inclusions and
denoted by NA is calculated by the formula below:
………………………………………………………………………………...3
Where TN is the total number of macro inclusions found on the sample and A is the total
investigated area. This index can be used to assess the cleanliness levels among different steel
grades.

19
4.0 Results and Discursion
4.1 Cleanliness Index
The total surface area covered during this project is 190621.99mm2; this is made up of
172872mm2 from both sides of the plates and 17749.99mm2 from the round bars. The number of
inclusions that were found during the investigations was fourteen; five were located in the bars
and the remaining nine were in the billet. Therefore by using equation 3 the cleanliness index NA
for the plates is 19208mm2 per unit number of macro inclusions whiles that for the bars is
3549.998mm2 per unit number of macro inclusion, this data is represented in figure 16. The
overall index for the project is 13615.86mm2 per unit number of macro inclusions. This means
that an area of 13615.86mm2 would have to be covered before one macro inclusion can be
detected. This shows how difficult it is to detect macro inclusions in clean steals using the
microscopic methods. The areas where the samples were taken are areas that macro inclusions
are expected to be according to experience and by using the ultrasonic method to inspect the
samples. This type of analysis can be used to asses and compare the cleanliness levels of
different steel grades and materials but the investigated area would have to be the same to make
the results comparable.
Figure 16, The cleanliness index calculated for the various types of materials.
0
2000
4000
6000
8000
10000
12000
14000
16000
18000
20000
Overall Plates Bars
Cleanliness index (NA) 13615.86 19208 3549.998
NA(
mm
2/n
um
ber
of
ma
cro
in
clu
sio
ns)
Cleanliness Index (NA)

20
0
5
10
15
20
25
30
35
40
45
CASTING POWDER RUNNERREFRACTORY
REOXIDATION OLIVINE SAND UNKNOWN
FREQ
UEN
CY
TYPES OF MACRO INCLUSIONS
TYPES OF MACRO INCLUSIONS AND THEIR
FREQUENCIES
4.2 Sources of the Macro Inclusions
From the SEM/EDS analysis, the compositions of the macro inclusions were detected and the
results were cross referenced with that of the materials used in the steel making process. In this
way the exogenous macro inclusions were detected since they had compositions that were closer
to the composition of their parent sources. For inclusions that were washed out in the cause of
the sample preparation, traces of the materials that already existed in the steel as a macro
inclusion was detected in the holes left; this approach maybe inconclusive sometimes.
Figure 17 shows a plot of the different kinds of macro inclusions detected in the steel and their
respective frequencies. From the graph it can be denoted that the inclusions from the casting
powder used in the mold is the major source of macro inclusions in the steel, followed by the
refractory used in making the trumpet and runner systems. Macro inclusions from the Olivine
sand (used in the casting system) and those that were considered to be products from reoxidation
reactions were also present in small quantities.
In the cause of the sample preparation some macro inclusions were washed out completely so
their compositions could not be identified and therefore they were labeled unknown on the graph
Products of reoxidation were difficult to analyze since the composition of the macro inclusions
had been modified in a complex nature probably due to the mode of formation; through chemical
reactions when the steel comes into contact with air.
Figure 17, The different kinds of macro inclusions that were detect in the steel.

21
0
5
10
15
20
25
30
35
40
45
50
80 - 99 100 - 199 200 - 299 300 - 399 400 - 1500
FR
EQ
UE
NC
Y
SIZE RANGES / µm
SIZE DISTRIBUTION OF THE DEFECTS
4.3 Macro Inclusions Size Distribution
The size determination of macro inclusions is a bit tricky since different companies use different
standards for the analysis. In this project nevertheless the sizes of the macro inclusions were
determined as shown in figure 15. In the rolled samples the size of the deformable macro
inclusions could not be differentiated from the size of the cracks formed during the rolling
process. This is mainly due to the inconclusive nature of the results, the entire length of the
defect was therefore considered since the crack might have been due to the stretching of the
deformable macro inclusion.
The results of this observation is shown in figure 18, according to this figure the macro
inclusions within the ranges of 100 – 199µm had the highest number (45%) followed by those
just below 100 µm. No macro inclusions were recorded within the ranges of 200 – 299µm,
however some inclusions of sizes in the 300 - 399µm ranges were recorded. The large inclusions
within the range of 400 - 1500µm had those sizes partly because of their extensions during the
rolling process.
In clean steels where high demands are placed on the performance of the material, these sizes of
macro inclusions are catastrophic to the mechanical properties of the material if they are not
detect during inspections.
Figure 18, The size distribution of the macro inclusions detected.

22
0
20
40
60
80
100
T M B BB
FR
EQ
UE
NC
Y
POSITION
INCLUSIONS
DISTRIBUTION IN THE
SAMPLES
31%
69%
POSITIONS OF
MACRO INCLUSIONS
IN THE BILLET
Surface
Inner
4.4 Analysis for the Billets
The billet as indicated in chapter 3 was taken 730mm way from the bottom of the ingot, therefore
the types of inclusions found and their distribution is of prime importance since this information
can be used to determine how much material can be saved for real production. After various
analysis were carried out it was found out that 93% of the inclusions were located at the BB part
of the billet and only 7% at the M part. No macro inclusions were detected in the parts labeled T
and B as can be seen in figure 19A). Remember that just a thickness of 14.5mm was taken from
each part of the billet so further experimental work can be done to make these results more
accurate. If these results are verified with the investigations on the other samples left, then it
means that 350mm more materials can be taken as part of normal production material. If this
figure is multiplied by the number of ingots produced each year then the company would be
saving tons of steel as part of production annually.
The position where the macro inclusions are located in the billet is very important to know.
During the rolling and drawing parts of the manufacturing process, some material is taken off
from the surface, mainly due to surface defects that may exist on the surface after the casting and
forming processes. If the macro inclusions are mostly located at the surface of the billet then the
steel will be cleaner after the rolling process because that part will be taken off. From figure 19B)
it can be seen that 31% of the macro inclusions were located on the surface and 69% were
located inside the material. This means that only about 31% of the macro inclusions could have
been taken off during production.
A) B)
Figure 19, Results from the analysis of the macro inclusions found in the billet, A) a bar chart
showing which part of the billet the macro inclusions were located and B) a pie chart showing
the positions the macro inclusions where located.

23
0
10
20
30
40
50
CASTINGPOWDER
RUNNERREFRACTORY
REOXIDATIONOLIVINE SAND UNKNOWN
FR
EQ
UE
NC
Y
SOURCE OF MACRO INCLUSION
DISTRIBUTION OF THE VARIOUS TYPES OF
MACRO INCLUSIONS IN THE SAMPLES
BB
B
M
T
Figure 20, A bar chart showing the different types of macro inclusions and the part of the billet
they were located.
In-depth investigations were carried out to identify the types of macro inclusions that existed in
the two parts of the billet. From the bar chart in figure 20, it can be seen that the casting powder
found at the BB part of the billet amounts to 45% and that found at the M part is 11% of the
number of macro inclusions found in the billet. This adds up to 56% of the total number of
macro inclusions found in the billet. This can be attributed to the high turbulence at the
beginning of the casting process when the first liquid steel enters the mold and the paper bag
containing the casing powder is opened. The casting powder then melts into mold flux and
moves freely in the steel; in some cases they get stuck in solidifying steel at the walls and corners
of the mold. In other cases the droplets of mold flux also circulates in the bulk liquid steel
leading to the formation of macro inclusions in the steel after solidification.
About 22% of the inclusions in the billet that were located at the BB part were also exogenous
materials from the runner/trumpet refractories. This may result from erosion and dissolution
mechanisms which lead to the removal of pieces of the refractory into the liquid steel during
casting. The remaining 22% of the inclusions were washed away and therefore their sources
were not identified.
4.5 Analysis for the Round Bars
The round bars from Hällefors had already been inspected with the online ultrasonic system, so
the defects detected were to be investigated to find their causes. The samples were rolled so the
deformable macro inclusions had been crashed in the process leading to a propagated crack in
the material.

24
60%
40%
Position of Macro Inclusions in the Bars
Surface
Inner
Figure 21, The different types of macro inclusions found in the round bars and their frequencies.
From figure 21 we can deduce that 40% of the macro inclusions found in the samples came from
the trumpet/runner refractories, whereas casting powder, olivine sand and reoxidation
contributed 20% each. The surface defects detected in these samples constitutes 60% whiles the
inner defects represented 40% of the number of macro inclusions found (as can be seen in figure
22 below). There were only 5 macro inclusions found in the bars so this graph is not conclusive
enough but it is an indication as to what to expect.
The defects found on the surfaces of the samples were all linked up with cracks that had
propagated from the inclusions towards the surface of the bar. The openings of the cracks
showed some amount of oxidation due to the subsequent heat treatments of the bars. These
oxides introduce secondary phases around the defects and this reduces the mechanical properties
of the material. If these defects are not detected by the inspection systems then the material is
liable to fail under conditions lower than they were designed for.
Figure 22, A pie chart showing the percentages of the number of macro inclusions that were
detected at the different positions of the bar.
0
5
10
15
20
25
30
35
40
45
CASTING POWDER RUNNER REFRACTORY REOXIDATION OLIVINE SAND
Fre
qu
ency
Sources of Macro Inclusion
Sources of Macro Inclusions in the Bars

25
4.6 Overview of the Types of Macro Inclusions
The composition of exogenous macro inclusions can be traced back to their sources if they have
not been modified to the extent of becoming untraceable or completely washed out during
sample preparation. There isn’t enough time for the modification of exogenous macro inclusions
from the casting system since the kinetic and thermodynamic conditions in the mold are uneven
due to lack of stirring in the mold and the rapid solidification of the steel.
The detailed analysis of some examples of the types of macro inclusions found in the steel are
treated in the topics below:
4.6.1 Olivine Sand
A) B)
C)
Figure 23, The results from the analysis of an olivine sand found in a sample using the
SEM/EDS, A) focus on the macro inclusion, B) a magnification of the site of interest for point
analysis, C) spectrum 7, indicating the composition of the macro inclusion.

26
From the SEM/EDS results, it could be seen that the macro inclusion was from an exogenous
source. The quantitative analysis from spectrum 7 showed 36.53% MgO, 37.29% SiO2 and
24.15% FeO with small traces of Cr2O3 and MnO (which might come from the matrix). This
composition is very close to that of the olivine sand which is mainly 47.9%MgO, 44.4%SiO2 and
7%FeO. It is therefore quite conclusive to attribute the source of the macro inclusion to the
Olivine sand used in the casting system. The composition of the sand has been modified in the
cause of the steel making process and this is understandable since the thermodynamic and kinetic
conditions in the liquid steel favors to some extent both oxidation and reduction reactions at
different parts of the melt. Table 1 in the appendix shows the full results for the other spectra.
4.6.2 Reoxidation
A) B)
C)
Figure 24, The results from the analysis of a macro inclusion from reoxidation reactions using
the SEM/EDS, A) focus on the macro inclusion, B) a magnification of the site of interest for point
analysis, C) spectrum 2, indicating the composition of the macro inclusion.

27
The SEM/EDS results in figure 24 and table 2(appendix) show that the macro inclusion mainly
consists of O, Al, Cr and Fe. The quantitative analysis of spectrum two also gave the
composition as 19.04%Cr2O3, 12.81%Al2O3, and 66.22%FeO stoichiometric to oxygen. These
oxides are located in the grain boundaries of particles at the deformed part of the matrix located
close to the sample’s surface. The deformation might have happened during the rolling and
scarfing process of the bar. In this phenomenon, the deformation at the surface of the bar allows
easy passage of atmospheric oxygen into the steel during heat treatments and other operations.
The penetrated oxygen then reacts with Al, Cr and Fe in the steel to form the oxides found in the
inclusion.
In most instances macro inclusions are sources of cracks at the surface but this phenomenon
predicts the formations of the deformation first and then the subsequent oxidation processes.
4.6.3 Casting Powder
A) B)
C)
Figure 25, Results for the analysis of a casting powder macro inclusion using the SEM/EDS, A)
focus on the macro inclusion, B) a magnification of the site of interest for point analysis, C)
spectrum 7, indicating the composition of the macro inclusion.

28
According to the results in figure 25 above and table 3 in the appendix, it can be noticed that the
macro inclusion is of exogenous source and it might have caused the crack that propagated to the
surface. It might even be the elongation of the same inclusion but the test to prove this was
inconclusive. The quantitative analysis of spectrum 7 shows that the composition of the macro
inclusion is 41.72% SiO2, 24.87%Al2O3, 13.5%FeO, 11.56%Na2O, 1.33%K2O, 2.89% CaO and
small amounts of other oxides. This composition is synonymous to that of the casting powder
(appendix table 5), so the source of this macro inclusion was attributed to the casting powder
used to prevent oxidation of the liquid steel’s surface during casting.
4.6.4 Runner/Trumpet Refractory
A)
B)
Figure 26, Results from the analysis of a runner/trumpet refractory macro inclusion using the
SEM/EDS, A) focus on the macro inclusion B) spectrum 4, indicating the composition of the
macro inclusion.

29
The results in figure 26 and table 4 in the appendix show that the macro inclusion found is from
an exogenous source. The quantitative analysis of the composition was 55.28%SiO2,
22.21%Al2O3 19.78% MnO, 1.57% FeO and small amounts of other oxides. This composition
can be traced back to that for the runner/trumpet refractory as can be seen in table 5 in the
appendix. The source of this macro inclusion was therefore accessed to be from this refractory.
The existence of small quantities of TiO2 and CaO also laid much emphasis on this conclusion.
The dark part showed a higher amount of SiO2 with little amount of Al2O3.
4.7 Thermocalc Simulations
The thermodynamic conditions surrounding the formation, modification as well as the sources of
macro inclusions cannot be ignored at this point of the project. So it was imperative to dive
deeper into the thermodynamics of these fields in order to model the problem with the
Thermocalc software version 5. According to figure 17 the most problematic macro inclusions
are those from casting powder and the runner/trumpet refractories. So the simulations will
pertain to these two sources of macro inclusions.
4.7.1 Casting Powder Modeling
This modeling work focused on studying and tracking the various modifications that the macro
inclusions from this source undergo in the liquid steel before solidification. In this way we will
be able to know the kind of phases to expect in the macro inclusion at lower temperatures when
the steel has solidified. This information can lead to easy identification of the macro inclusions
from this source and the kind of features to expect.
The slag 3 database was used and this was because the casting powder had to be modeled under
steel making conditions. The main assumption made here was that, a droplet of liquid casting
powder representing the macro inclusion is in equilibrium on its surface with liquid iron at a
temperature of 1873K and 101325pa pressure. 1mole of the liquid casting powder was therefore
entered in equilibrium with 1mole of liquid iron phase. The entered parameters can be found in
appendix figure 31.
The results of the simulation has been displayed in figure 27, due to the complexity of the
calculations, the results for temperatures lower than 1450K had to computed temperature by
temperature. The temperatures that were of interest after the simulations at different temperatures
where 1150K and 1000K (the full results and compositional analysis can be found in the
appendix, results 1). At 1150K all the liquid phases disappeared from the system and formed
solid phases with mass fractions of 13 AL6O9-SI2O4, 6.71CAO-SIO2, 9.44 FEO-AL2O3,
3.64MGO-SIO2, 25.3 NA2O-SI2O4 and 8.06SIO2-Beta-Quartz. There were no major changes in
the phases at 1000K so these phases were assumed to be the stable phases at lower temperatures
since Thermocalc is known to do well at higher temperatures.
From the composition above the major phases were known, this results were therefore compared
to the analysis of the macro inclusion in figure 25 and the composition was consistent with our

30
results. Potassium was absent from the analysis because Thermocalc did not accept its entry so
its amount was added to that of sodium and treated as alkalis.
Figure 27, A graph representing the stable phase in the casting powder from 1450K to 2300.
4.7.2 Refractory Modeling
The main mechanisms behind the removal of the runner/trumpet refractory into the steel are
dissolution and erosion. At higher temperatures the breakdown rate of the refractories are
enhanced due to the introduction of liquid phases at the refractory steel interface. This modeling
work was to focus on the various phases that are more likely to appear and the temperatures that
they occur. The temperature at which the first slag phase appears in the refractory was of prime
importance as this will indicate the temperature at which the refractory will start breaking down.
More macro inclusions could be dislodged into the high speed liquid steel running through the
runner and trumpet systems into the mold at this breakdown point.
The slag 3 database was also used for this simulation since the simulations had to be done under
steel making conditions. The pure state of the aluminosilicate refractory containing 56.7%Al2O3
and 44.3%SiO2 was first simulated at a temperature of 1873K and pressure of 101325pa. This
was to compare the result with the actual phase diagram of Al2O3 - SiO2 from FactSage using the
oxide database. From figure 30 in the appendix, it can be seen on the phase diagram that the first
liquid in the mullite phase at the composition mentioned above is 1594οC (1867K). But from the
simulation result of the same system using the slag 3 database in figure 28, the first liquid phase
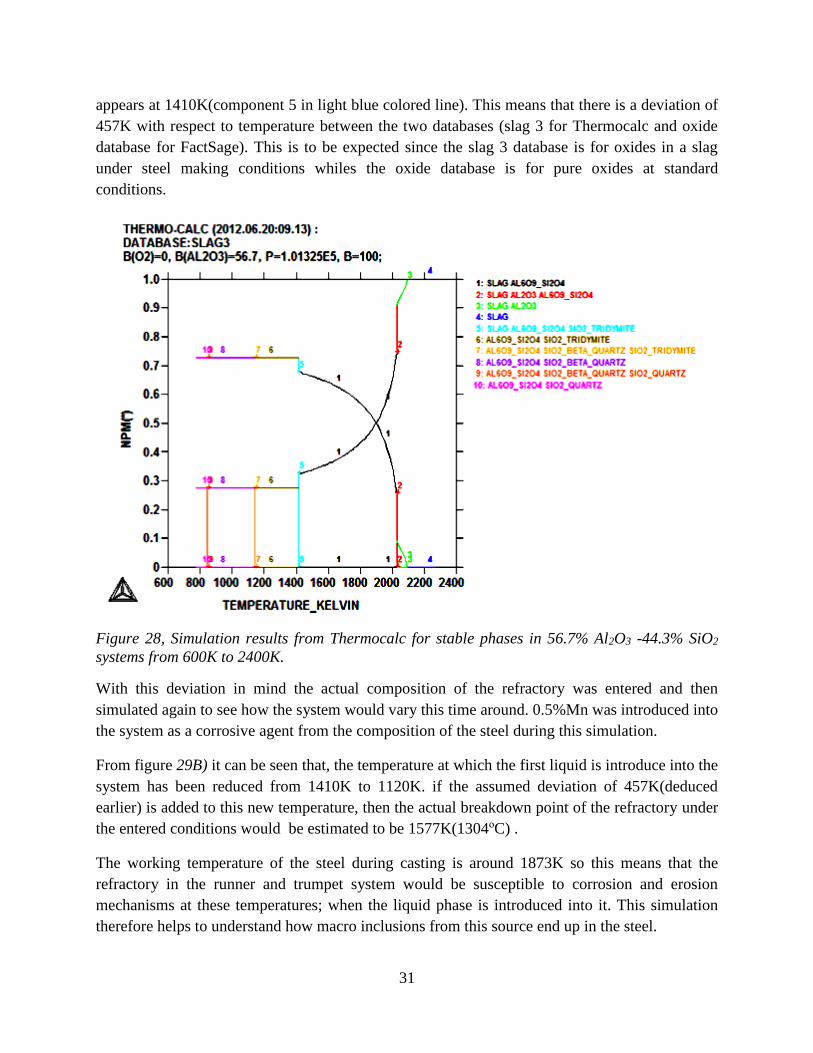
31
appears at 1410K(component 5 in light blue colored line). This means that there is a deviation of
457K with respect to temperature between the two databases (slag 3 for Thermocalc and oxide
database for FactSage). This is to be expected since the slag 3 database is for oxides in a slag
under steel making conditions whiles the oxide database is for pure oxides at standard
conditions.
Figure 28, Simulation results from Thermocalc for stable phases in 56.7% Al2O3 -44.3% SiO2
systems from 600K to 2400K.
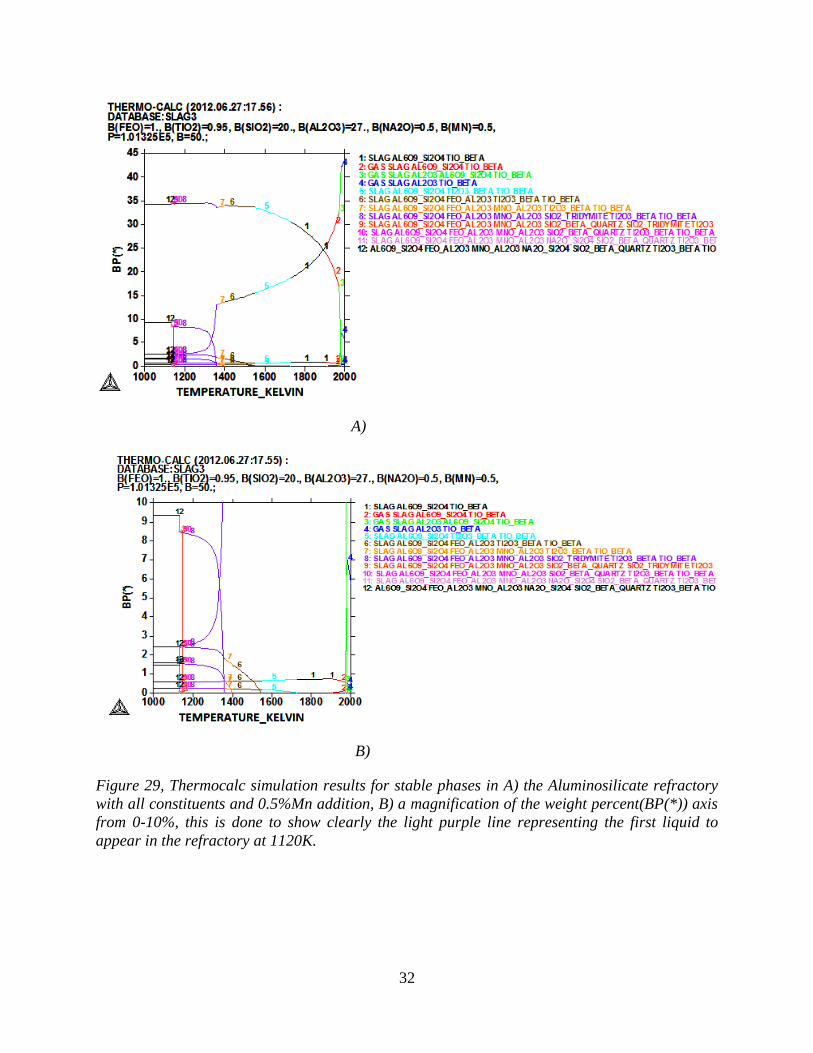
With this deviation in mind the actual composition of the refractory was entered and then
simulated again to see how the system would vary this time around. 0.5%Mn was introduced into
the system as a corrosive agent from the composition of the steel during this simulation.
From figure 29B) it can be seen that, the temperature at which the first liquid is introduce into the
system has been reduced from 1410K to 1120K. if the assumed deviation of 457K(deduced
earlier) is added to this new temperature, then the actual breakdown point of the refractory under
the entered conditions would be estimated to be 1577K(1304οC) .
The working temperature of the steel during casting is around 1873K so this means that the
refractory in the runner and trumpet system would be susceptible to corrosion and erosion
mechanisms at these temperatures; when the liquid phase is introduced into it. This simulation
therefore helps to understand how macro inclusions from this source end up in the steel.
32
A)
B)
Figure 29, Thermocalc simulation results for stable phases in A) the Aluminosilicate refractory
with all constituents and 0.5%Mn addition, B) a magnification of the weight percent(BP(*)) axis
from 0-10%, this is done to show clearly the light purple line representing the first liquid to
appear in the refractory at 1120K.

33
4.8 Optimizing the Casting Process
Almost all the macro inclusions that were found in the cause of this project came from the
casting system. This means that the casting system needs to be optimized further if macro
inclusions are to be eliminated completely from the steel. During the casting process the liquid
steel comes into contact with different kinds of exogenous materials and all these materials are
potential sources of macro inclusions. Below are some suggestions as to how the system can be
further optimized with respect to the various types of macro inclusions in the steel:
4.8.1 Casting Powder Macro Inclusions
Casting powder is a very important part of the casting process as it prevents direct contact of the
liquid steel’s surface with atmospheric air in the mold. Upon the entry of the liquid metal into the
mold, the hanged paper sack that contains the casting powder burns to release it onto the surface
of the liquid steel. The powder melts into mold flux and the turbulence in the flow then picks
droplets of it and circulates them in the entire bulk steel in the mold. Some of the droplets are
trapped in the first solidifying melts at the bottom of the mold and that may be responsible for
the casting powder accounted for at BB part of the ingot.
From the results in figure 20, we realize that casting powder appears at the BB and M part of the
billet, this might be because of the circulation of the droplets in the steel. Natural convection also
plays a role in this circulation mechanism, in this phenomenon the molecules in the liquid steel
circulates in the mold due to uneven temperature and density distributions. Since the droplets of
casting powder have lower densities, they may be forced to ride along during these circulations.
The droplets may then be trapped in between the dendrites of solidifying steel and results in a
macro inclusion after solidification.
The suggested principle here to optimize this part of the casting process is to minimize the
magnitude or if possible stop the natural convection in order to mitigate the circulation. This can
be done by supplying enough energy to the system to rapidly solidify the steel after filling the
mold. In order to do this, steam can be blown around the mold just for a little while to speed up
the solidification process.
This suggested principle needs to be investigated and evaluated to identify the underling
variables related to the temperature distribution in and around the mold, the continuous cooling
carve of the liquid steel, natural convection in the steel, the movement of droplet liquid casting
powder in the steel etc. A good understanding of the system together with the identified variables
can then be used to model and optimize the system.
The turbulence in the system during the filling process in the mold can also be modeled and
studied to reduce the circulation.
Trial positioning of the paper bag containing the casting powder and the modification of mold
geometry can also reduce the entrapment of mold flux.[22]

34
4.8.2 Runner/Trumpet Refractory Macro Inclusions
During casting the liquid steel is poured at a temperature of 1873K through the trumpet to the
center stone which then distributes it to the runners and then ends up in the mold.
From the Thermocalc simulations discussed early it was established that temperature plays an
important role in the early breakdown of the refractories used for these systems. According to
Zhe et al, the turbulence in the flow at the center stone of the gating system is higher than that for
the other parts (runner and trumpet).[22] The shear stress between the liquid steel and the
refractory walls in the center stone was also estimated to be appreciably higher than in the
runners and trumpets. This is so because, the center stone collects liquid steel poured from the
ladle through the trumpet and then distribute it to the runners. The temperature at this part of the
gating system may also be slightly higher. A temperature modeling of the flow in the gating
system during the casting process is therefore needed to identify all the hot spots that may be
susceptible to the breakdown.
The aluminosilicate refractory used for the trumpet and runner systems is the same as that used
for the center stone. It has been reported in this project that, macro inclusions from this
refractory constitutes 28.6% of the total number of macro inclusions found. Most of these macro
inclusions are suspected to have come from the center stone refractory due to the high
turbulence, shear stress and expected temperatures associated with the flow at this part. To
reduce this problem, the refractory used for the center stone could be changed so that a refractory
with higher alumina content is used. This can improve the stability of the refractory during the
initial pouring process.
The geometry at the bottom of the center stone can also be modified to reduce the impact of the
free falling liquid steel with the refractory floor in the center stone. This will reduce thermal
shock and turbulence associated with the initial pouring process.
4.8.3 Olivine Sand
The cleaning system installed by the company some few years ago has reduced the number of
macro inclusions from the olivine sand; this was evident in the survey carried out to investigate
into the reclaims from 1999 to 2010.[7] To totally eliminate this problem, the cleaning process
should be done thoroughly and the sand filling process around the runners and trumpets should
be done with extreme caution. Carelessness would lead to the introduction of macro inclusions
from this source.
4.8.4 Reoxidation
The only reoxidation macro inclusion recorded by this project was suspected to have come from
oxidation of the steel during the heat treatment process. An imperfection on the surface of the bar
led to the formation of the oxidation products found as a macro inclusion. This situation can be
mitigated with the removal of a thin layer of steel from the surface during machining. This
process is being performed in production already so the process should be thorough.
35
5.0 Conclusion
This project focused on the detection and evaluation of macro inclusions in bearing steels at
Ovako Hofors and Hällefors. The samples were in two groups; round bars from Hällefors and a
billet from Hofors.
After the LOM and SEM/EDS analysis, fourteen macro inclusions were detected, out of which
five were in the bars and nine were in the billet. From the statistical analysis done, it was found
out that the mold flux was the main source of macro inclusions in the casting system, followed
by the refractory in the runner/trumpet systems (according to figure 17). The other sources that
were also identified were the olivine sand (used to hold the gating systems in position) and
reoxidation. The macro inclusions identified in the billet were located mostly at the BB part of
the ingot and only 7% of the number of macro inclusions was located at the M part. No macro
inclusions were located in the T and B part of the ingot. If these results are verified to be valid
then 35cm more of material can be removed as part of production from the billet at the T part of
the ingot.
The identification of the sources of macro inclusions were done by using the compositions of all
the materials used in the casting system and the ladle as references. The macro inclusions from
exogenous sources had compositions that were close to that of the parent materials that they
came from. There were specific oxides that were peculiar to certain materials and that were the
bases of the identification.
The modeling of the casting powder with Thermocalc gave an idea of the kind of phases to
expect at lower temperatures and the characteristics of the inclusions could be studied from these
results. By using the slage3 database of Thermocalc, the composition of the refractory used for
the runner/trumpet systems was also modeled. From the modeling it was found out that the first
slag phase appears at a temperature of 1577K which is lower than the operation temperature
during casting which is about 1873K. This means that the refractory would start breaking down
at hot spots of the casting system and macro inclusions from the refractory could be dislodged
into the steel.
For the optimization of the casting process, various suggestions were made depending on which
part of the process was in focus. To optimize the casting system with respect to the mold flux,
the main suggestion made was to speed up the solidification process in order to reduce the
turbulence and natural convection in the mold after filling it with molten metal. This will prevent
the movement of droplets of mold flux in the liquid metal bath resulting in cleaner steels. With
respect to the refractory for the runner/trumpet system, the center stone was suspected to be the
main source of macro inclusions and therefore the material used for making this part of the
system should be modified. The geometry at the bottom of the center stone could also be
modified to reduce the impact and turbulence in the flow at the initial stages of casting.

36
6.0 Recommendation
This investigation should be done for other steel grades in order to confirm the results in
this project.
The cleanliness index should also be done for all steel grades.
Further experimental work needs to be done to confirm the actual cut off point for the
billets.
The mold flux circulation needs to be modeled in order to identify and optimize the
variables that prevent it.
Temperature modeling of the flow is needed to identify the hot spots in the refractories;
this will help identify the vulnerable parts of the gating system with respect to
temperature.

37
7.0 References
1. Scott MacKenzie, Overview of the Mechanisms of Failure in Heat Treated Steel
Components,( #05113G) ASM International, 2008
2. Ovako external presentation 2008, www.ovako.com
3. Zhang, L., B. Rietow, B.G. Thomas, and K. Eakin, “Large Inclusions in Plain-Carbon
Steel Ingots Cast by Bottom Teeming” ISIJ International, Vol. 46, No. 5, 2006; pp.670-
679.
4. A. K. Vaish, M. M. Humane, R. K. Minz, A. K. Chakravarti` And P .RamachandraRao,
Rare Earth Metals Addition To Low Carbon Steel –Thermodynamic Aspects, Process
Considerations And Effect On Mechanical Properties, National Metallurgical Laboratory,
Jamshedpur - 83 1007, India
5. W.S. Resende, R.M. Stoll, S.M. Justus, R.M. Andrade, E. Longo, J.B. Baldo E.R.
Leite, C.A. Paskocimas , L.E.B. Soledade , J.E. Gomes, J.A. Varela, Key Features
of Alumina/Magnesia/Graphite Refractories for Steel Ladle Lining, Journal of the
European Ceramic Society 20 (2000) 1419-1427 6. Yuan, Z.F., W.L. Huang, and K.Mukai, Local Corrosion of Magnesia-Chrome Refractories
Driven by Marangoni Convection at the Slag-Metal Interface.Journal of Colloid and Interface
Science, 2002. 253: p. 211-216.
7. Ismail Kasimagwa, Review of Macro Inclusions in Steel Products from Customer Claims,
Ovako Internal Report Document no: TBL001-2012
8. J.A. Kromhout, A.A. Kamperman, M. Kick, And J. Trouw, Mould Powder Selection For
Thin Slab Casting, VII International Conference on Molten Slags Fluxes and Salts, The
South African Institute of Mining and Metallurgy, 2004.
9. G. Cornacchia, M. Gelfi, C. Mapelli, A. Paderni, S. Panza, R. Roberti, The Role of
Mullite-based Refractory Chemical Interactions on the Formation of Exogenous Non-
metallic Inclusions, La Metallurgia Italiana, Giugno 2008.
10. www.rumler-hilden.de/en/was-schneidemittel/docs/olivinsand-data.pdf (OLIVINSAND
Technical Data
11. Lifeng Zhang and Brian G. Thomas, State of the Art in the Control of Inclusions during
Steel Ingot Casting, Metallurgical and Materials Transactions B, Volume 37b, October
2006—733
12. Steel Statistical Yearbook 2002, International Iron and Steel Institute, Brussels, 2002, pp.
13-16.
13. R. Sankaranarayanan, R. Guthrie, "Slag Entrainment through A 'Funnel' Vortex During
Ladle Teeming Operations". Proceedings International Symposium on Developments in
Ladle Steelmaking and Continuous Casting, Cim, Aug. 26-29, 1990, Hamilton, Ontario,
P 66 - 87. 14. Chris Pistorius, Neerav Verma and Richard Fruehan, Calcium modification of alumina
and spinel inclusions in aluminum-killed steel, Center for Iron and Steel making
Research, Carnegie Mellon University, Pittsburgh, July 2011.
15. Lund, T. B and Törresvoll, K., Quantification of large inclusions in bearing steels,
Bearing Steels: into the 21st Century, ASM STP 1327, 1998
38
16. Yoshiyuki Kato, Shoichi Takemoto, Kaiko Sato and Yoshio Nuri, development of
Ultrasonic evaluation Technique of Non-metallic inclusions in steel, Sanyo Technical
Report vol. 7 (2000) No. 1.
17. T. Hansén1, G. Runnsjö2, K. Törresvoll3, P. G. Jönsson4, On the Assessment of Macro
Inclusions in Stainless Steels using Ultrasonic Technique, MEFOS Metallurgical
Research Institute AB, Luleå, Sweden, 2Outokumpu Stainless AB, Avesta, Sweden, 3Ovako Steel AB, Hofors, Sweden, 4Royal Institute Of Technology, Stockholm, Sweden.
18. Pär G. Jönnson, Linda Karlsson, and Fredrik Reinholdsson, the effect of final induction
stirring practice on inclusion characteristics in bearing steel production, HT97MO27,
1997.
19. D. C. Hilty and D. A. R. Kay: Electric Furnace Steelmaking Conference Proceedings,
(1985), 43, 237
20. J. B. Santos, Dry Coupling Ultrasonic Characterisation of Flooring Tiles and Pavement
ICEMS - DEEF.C.T. - Universidade de Coimbra, Portugal.
21. Krautkramer NDT Ultrasonic Systems, power point presentation on Basic Principles of
Ultrasonic Testing Theory and Practice, last assesed 2012.
22. Zhe Tan, Mikael Ersson and Pär Jönsson, Mathematical Modeling Of Initial Filling
Moment Of Uphill Teeming Process Considering a Trumpet, ISIJ International, Vol. 51
(2011) No. 9, PP 1461-1467.
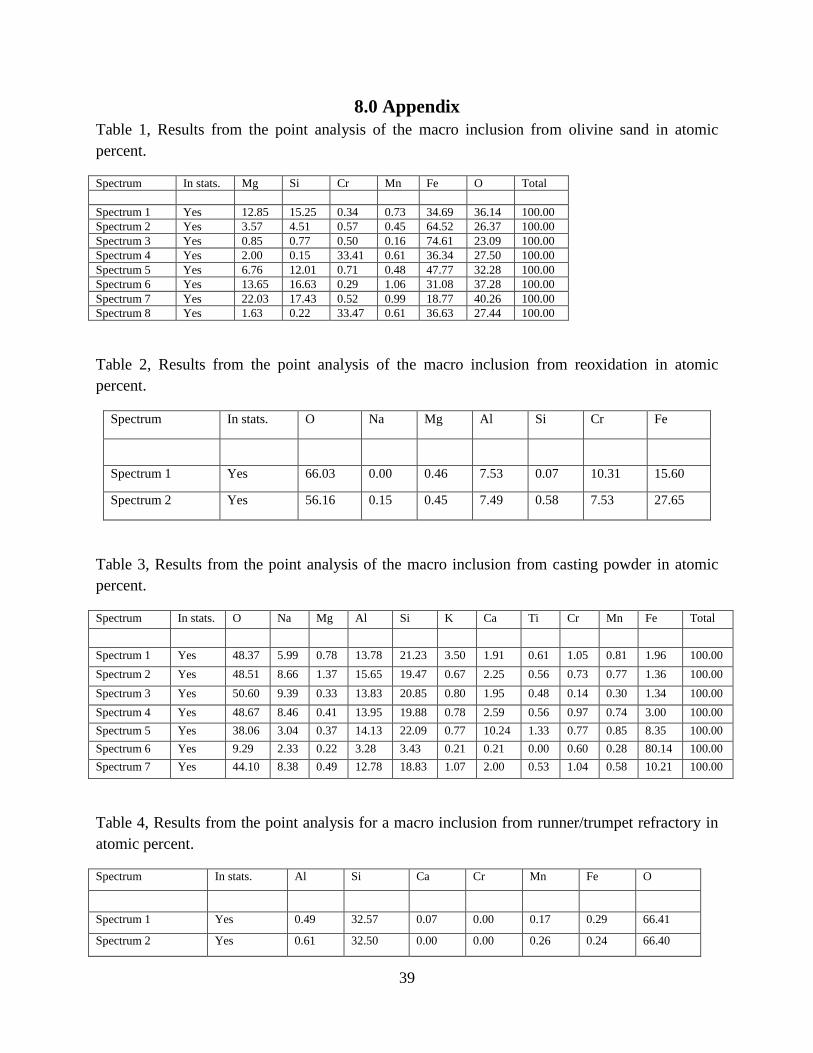
39
8.0 Appendix
Table 1, Results from the point analysis of the macro inclusion from olivine sand in atomic
percent.
Spectrum In stats. Mg Si Cr Mn Fe O Total
Spectrum 1 Yes 12.85 15.25 0.34 0.73 34.69 36.14 100.00
Spectrum 2 Yes 3.57 4.51 0.57 0.45 64.52 26.37 100.00
Spectrum 3 Yes 0.85 0.77 0.50 0.16 74.61 23.09 100.00
Spectrum 4 Yes 2.00 0.15 33.41 0.61 36.34 27.50 100.00
Spectrum 5 Yes 6.76 12.01 0.71 0.48 47.77 32.28 100.00
Spectrum 6 Yes 13.65 16.63 0.29 1.06 31.08 37.28 100.00
Spectrum 7 Yes 22.03 17.43 0.52 0.99 18.77 40.26 100.00
Spectrum 8 Yes 1.63 0.22 33.47 0.61 36.63 27.44 100.00
Table 2, Results from the point analysis of the macro inclusion from reoxidation in atomic
percent.
Spectrum In stats. O Na Mg Al Si Cr Fe
Spectrum 1 Yes 66.03 0.00 0.46 7.53 0.07 10.31 15.60
Spectrum 2 Yes 56.16 0.15 0.45 7.49 0.58 7.53 27.65
Table 3, Results from the point analysis of the macro inclusion from casting powder in atomic
percent.
Spectrum In stats. O Na Mg Al Si K Ca Ti Cr Mn Fe Total
Spectrum 1 Yes 48.37 5.99 0.78 13.78 21.23 3.50 1.91 0.61 1.05 0.81 1.96 100.00
Spectrum 2 Yes 48.51 8.66 1.37 15.65 19.47 0.67 2.25 0.56 0.73 0.77 1.36 100.00
Spectrum 3 Yes 50.60 9.39 0.33 13.83 20.85 0.80 1.95 0.48 0.14 0.30 1.34 100.00
Spectrum 4 Yes 48.67 8.46 0.41 13.95 19.88 0.78 2.59 0.56 0.97 0.74 3.00 100.00
Spectrum 5 Yes 38.06 3.04 0.37 14.13 22.09 0.77 10.24 1.33 0.77 0.85 8.35 100.00
Spectrum 6 Yes 9.29 2.33 0.22 3.28 3.43 0.21 0.21 0.00 0.60 0.28 80.14 100.00
Spectrum 7 Yes 44.10 8.38 0.49 12.78 18.83 1.07 2.00 0.53 1.04 0.58 10.21 100.00
Table 4, Results from the point analysis for a macro inclusion from runner/trumpet refractory in
atomic percent.
Spectrum In stats. Al Si Ca Cr Mn Fe O
Spectrum 1 Yes 0.49 32.57 0.07 0.00 0.17 0.29 66.41
Spectrum 2 Yes 0.61 32.50 0.00 0.00 0.26 0.24 66.40

40
Spectrum 3 Yes 9.99 20.14 0.34 0.14 6.39 0.41 62.60
Spectrum 4 Yes 9.70 20.49 0.31 0.12 6.21 0.49 62.70
Mean 5.20 26.42 0.18 0.06 3.26 0.35 64.53
Std. deviation 5.37 7.06 0.17 0.08 3.51 0.11 2.17
Figure 30, The phase diagram for an Al2O3 – SiO2 system from FactSage

41
Figure 31, Input data for the casting powder simulation using the slag3 database in Thermocalc.
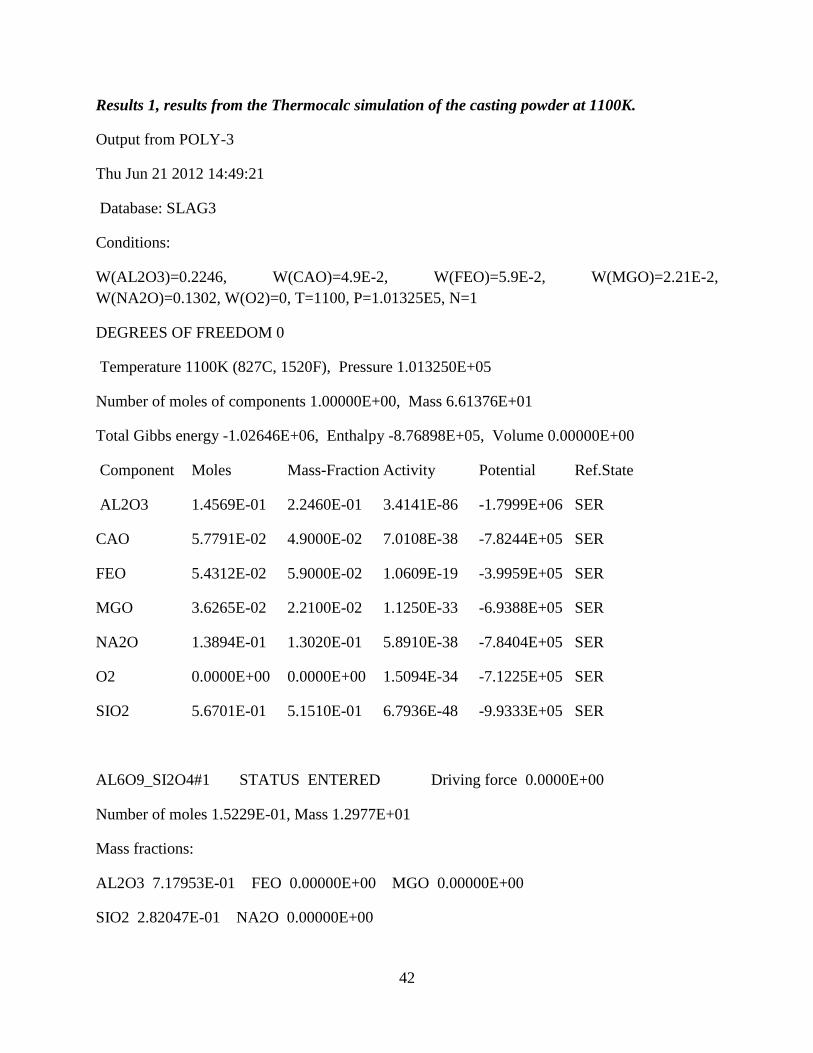
42
Results 1, results from the Thermocalc simulation of the casting powder at 1100K.
Output from POLY-3
Thu Jun 21 2012 14:49:21
Database: SLAG3
Conditions:
W(AL2O3)=0.2246, W(CAO)=4.9E-2, W(FEO)=5.9E-2, W(MGO)=2.21E-2,
W(NA2O)=0.1302, W(O2)=0, T=1100, P=1.01325E5, N=1
DEGREES OF FREEDOM 0
Temperature 1100K (827C, 1520F), Pressure 1.013250E+05
Number of moles of components 1.00000E+00, Mass 6.61376E+01
Total Gibbs energy -1.02646E+06, Enthalpy -8.76898E+05, Volume 0.00000E+00
Component Moles Mass-Fraction Activity Potential Ref.State
AL2O3 1.4569E-01 2.2460E-01 3.4141E-86 -1.7999E+06 SER
CAO 5.7791E-02 4.9000E-02 7.0108E-38 -7.8244E+05 SER
FEO 5.4312E-02 5.9000E-02 1.0609E-19 -3.9959E+05 SER
MGO 3.6265E-02 2.2100E-02 1.1250E-33 -6.9388E+05 SER
NA2O 1.3894E-01 1.3020E-01 5.8910E-38 -7.8404E+05 SER
O2 0.0000E+00 0.0000E+00 1.5094E-34 -7.1225E+05 SER
SIO2 5.6701E-01 5.1510E-01 6.7936E-48 -9.9333E+05 SER
AL6O9_SI2O4#1 STATUS ENTERED Driving force 0.0000E+00
Number of moles 1.5229E-01, Mass 1.2977E+01
Mass fractions:
AL2O3 7.17953E-01 FEO 0.00000E+00 MGO 0.00000E+00
SIO2 2.82047E-01 NA2O 0.00000E+00

43
CAO 0.00000E+00 O2 0.00000E+00
CAO_SIO2#1 STATUS ENTERED Driving force 0.0000E+00
Number of moles 1.1558E-01, Mass 6.7130E+00
Mass fractions:
SIO2 5.17243E-01 FEO 0.00000E+00 MGO 0.00000E+00
CAO 4.82757E-01 NA2O 0.00000E+00
AL2O3 0.00000E+00 O2 0.00000E+00
FEO_AL2O3#1 STATUS ENTERED Driving force 0.0000E+00
Number of moles 1.0862E-01, Mass 9.4399E+00
Mass fractions:
AL2O3 5.86633E-01 SIO2 0.00000E+00 MGO 0.00000E+00
FEO 4.13367E-01 NA2O 0.00000E+00
CAO 0.00000E+00 O2 0.00000E+00
MGO_SIO2#1 STATUS ENTERED Driving force 0.0000E+00
Number of moles 7.2531E-02, Mass 3.6406E+00
Mass fractions:
SIO2 5.98514E-01 CAO 0.00000E+00 AL2O3 0.00000E+00
MGO 4.01486E-01 NA2O 0.00000E+00
FEO 0.00000E+00 O2 0.00000E+00
NA2O_SI2O4#1 STATUS ENTERED Driving force 0.0000E+00
Number of moles 4.1681E-01, Mass 2.5307E+01

44
Mass fractions:
SIO2 6.59727E-01 CAO 0.00000E+00 AL2O3 0.00000E+00
NA2O 3.40273E-01 MGO 0.00000E+00
FEO 0.00000E+00 O2 0.00000E+00
SIO2_BETA_QUARTZ#1 STATUS ENTERED Driving force 0.0000E+00
Number of moles 1.3416E-01, Mass 8.0608E+00
Mass fractions:
SIO2 1.00000E+00 CAO 0.00000E+00 AL2O3 0.00000E+00
NA2O 0.00000E+00 MGO 0.00000E+00
FEO 0.00000E+00 O2 0.00000E+00
Thermocalc Code to Modelling of the Refractory
go d
sw slag3
def-sys al si Na Ti mn
rej ph Fe_liquid
l-sy const
get
go p-3
def-comp sio2 al2o3 na2o Tio2 FeO Mn
S-i-a b(feo)=1
s-i-a b(Tio2)=0.95
s-i-a b(sio2)=20
s-i-a b(al2o3)=27
s-i-a b(Na2o)=0.5
s-i-a b(Mn)=0.5
s-c t=1873 p=101325 B=50
l-c
set-inter

45
Table 5, The composition of some materials used in the casting system.
Runner / Trumpet
Refractory
Casting Powder Olivine Sand
54% Al2O3 22.14% Al2O3 47.9% MgO,
41% SiO2 45.73% SiO2 44.4% SiO2
0.2% CaO 4.9% CaO 7% FeO
1.9% TiO2 1.25% TiO2
1.4% Fe2O3 8.54% FeO
1% K2O 2% K2O
0.2 % Na2O 10% Na2O
0.3% MgO 2.21% MgO
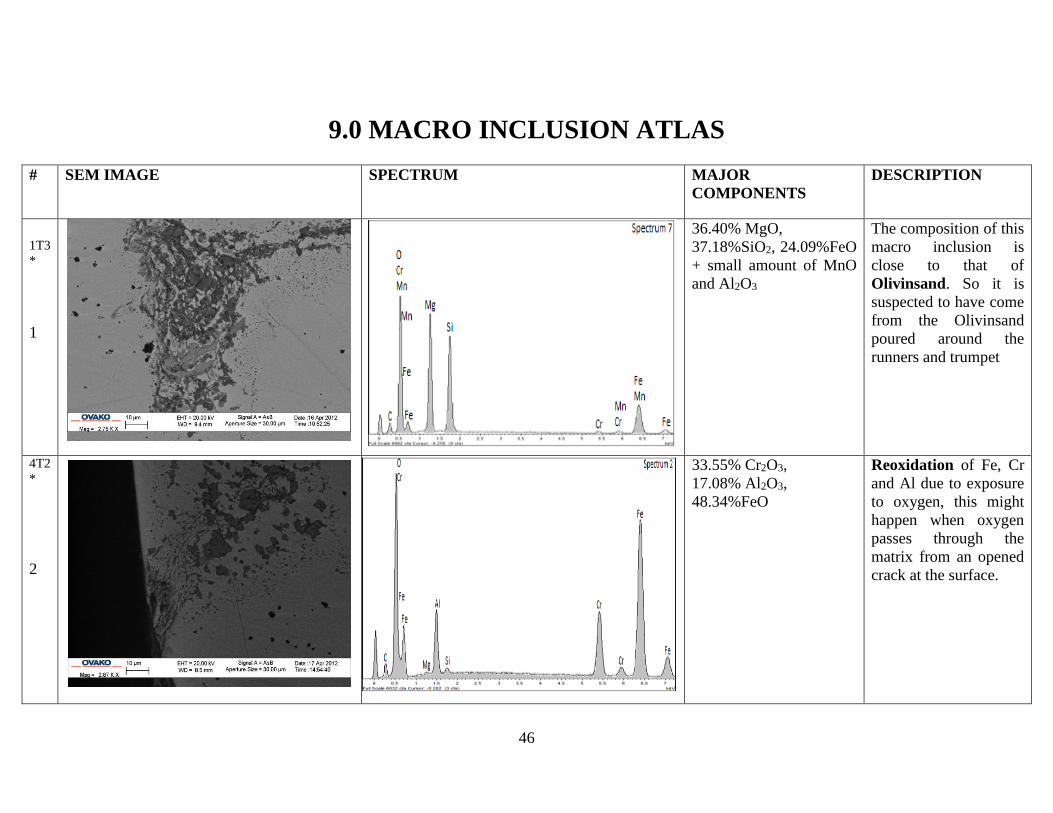
46
9.0 MACRO INCLUSION ATLAS
# SEM IMAGE SPECTRUM MAJOR
COMPONENTS
DESCRIPTION
1T3
*
1
36.40% MgO,
37.18%SiO2, 24.09%FeO
+ small amount of MnO
and Al2O3
The composition of this
macro inclusion is
close to that of
Olivinsand. So it is
suspected to have come
from the Olivinsand
poured around the
runners and trumpet
4T2
*
2
33.55% Cr2O3,
17.08% Al2O3,
48.34%FeO
Reoxidation of Fe, Cr
and Al due to exposure
to oxygen, this might
happen when oxygen
passes through the
matrix from an opened
crack at the surface.
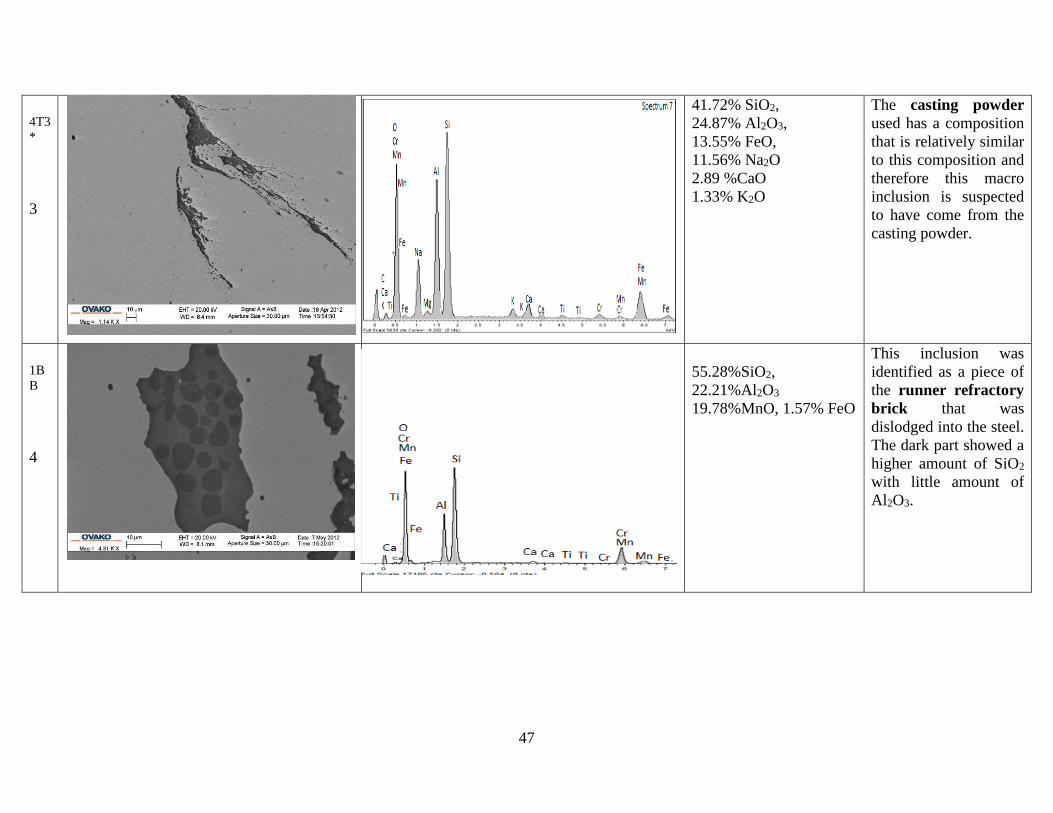
47
4T3
*
3
41.72% SiO2,
24.87% Al2O3,
13.55% FeO,
11.56% Na2O
2.89 %CaO
1.33% K2O
The casting powder
used has a composition
that is relatively similar
to this composition and
therefore this macro
inclusion is suspected
to have come from the
casting powder.
1B
B
4
55.28%SiO2,
22.21%Al2O3
19.78%MnO, 1.57% FeO
This inclusion was
identified as a piece of
the runner refractory
brick that was
dislodged into the steel.
The dark part showed a
higher amount of SiO2
with little amount of
Al2O3.

48
1B
B
5
47.63%Al2O3
41.78%SiO2,
0.93% MnO, 8.74% FeO,
0.72%Cr2O3.
This inclusion has a
composition that is
closer to that of the
trumpet and runner
refractory, so it is
suspected to have
emanated from those
refractories.
1B
B
6
97.08%SiO2,
0.99% Al2O3, 1.49%FeO,
0.44%MnO
This inclusion is mostly
made up of SiO2, the
source of it is hard to
predict since the known
source of SiO2 mainly
is the deoxidation
products from the
initial deoxidation
process in the ladle but
that operation is far
from the casting
process and the
inclusions should have
been removed by now.

49
E2*
7
29.09%Al2O3 ,
36.83%SiO2,
31.67%FeO, 1.54%Cr2O3
, 0.87MnO
The inclusion there had
washed out but traces
of an alumino silicate
refractory was detected
in the channel created
by the macro inclusion.
The refractory is there
suspected to be from
the Runner
Refractory since there
were no MgO present
in the composition.
E1*
8
If the Fe, Mn and Cr
background is eliminated
the composition of the
washed out macro
inclusion is estimated to
be: 30.42% Al2O3,
69.58%SiO2
A washed out alumino
silicate refractory,
suspected to have come
from the
Trumpet/Runner
Refractories.

50
2B
B
9
23.26% SiO2,
30.75% Al2O3,
37.98% FeO,
6.39% Na2O
0.69% K2O
0.81%Cr2O3
Partly washed out
macro inclusion with
traces of a composition
closer to that of the
Casting Powder.
3B
B
10
48.74% SiO2,
24.19% Al2O3,
13.86% FeO,
10.00% Na2O
0.52 %CaO
0.17% K2O
This inclusion has a
composition closer to
that of the Casting
Powder. Therefore it is
predicted to be the
source.

51
3B
B
11
17.10% SiO2,
73.01% Al2O3,
6.91% FeO,
2.31% Na2O
0.67% K2O
Partly washed out
macro inclusion with a
composition closer to
that of the Casting
Powder.
3M
12
28.92% SiO2,
24.97% Al2O3,
35.09% FeO,
8.44% Na2O
0.30 %CaO
1.24% K2O
1.03%Cr2O3
Partly washed out
macro inclusion with
traces of a composition
closer to that of the
Casting Powder.

52
4B
B
13
If the Fe and Cr
background is eliminated
the composition of the
washed out macro
inclusion is estimated to
be: 60.24% SiO2,
26.57% Al2O3,
11.42% Na2O
1.78 %CaO
Partly washed out
macro inclusion with
traces of a composition
closer to that of the
Casting Powder.
4B
B
14
SiC The origin of this
defect was not detected
since what was already
there seems to have
been completely
washed away. The
traces of Silicon
carbide detected might
come from the
smoothing papers used
during the sample
preparation.