macro china economics - scoopimg.scoop.co.nz/media/pdfs/1412/hsbc_research_china_inside_out... · 2...
TRANSCRIPT

With disinflationary pressure rising, we
lower our GDP and inflation forecasts for 2015 and 2016
Beijing will likely step up policy easing to stabilise the economy
We also expect the pace of key reforms to accelerate
Both economic activity and inflation data have been weaker
than we anticipated in recent months, suggesting rising
disinflationary pressures. We lower our GDP growth forecast to
7.3% for 2015 (from 7.7%) and to 7.4% for 2016 (from 7.6%).
We have also cut our CPI forecasts to 1.8% and 1.9%
(from 2.9% and 2.7%). Despite these revisions, we remain more
constructive than consensus GDP growth of 7% for 2015 and
6.7% for 2016 and consensus CPI of 2.3% and 2.5%. In this
report, we identify five key macro themes for 2015.
Disinflationary pressures are likely to prompt more
aggressive easing. Inflation is likely to stay below 2% in
2015, due to weak demand, spare capacity, and falling
commodity prices. We expect more aggressive monetary and
fiscal easing and forecast another two 25bps of symmetric
rate cuts and three 50bps of reserve ratio cuts in 2015 versus
our previous expectation of no change.
Infrastructure investment should remain strong. A long
project pipeline is likely to sustain infrastructure investment
in 2015, offsetting the slowdown in property investment.
We expect further progress in the New Silk Road plan.
The economic impact of a cooling property market.
The property slowdown will likely continue in 2015,
but recent easing measures provide some support, and the
economic impact remains manageable.
Faster reforms. We expect Beijing to accelerate fiscal,
state-owned enterprise (SOE) and price reforms.
No big devaluation, but further measures to increase
RMB capital account convertibility. We expect further
steps to deregulate cross-border portfolio investment and
promote RMB internationalisation.
Macro China Economics
China Inside Out
Five macro themes for 2015
16 December 2014 Qu Hongbin Chief Economist, Greater China The Hongkong and Shanghai Banking Corporation Limited +852 2822 2025 [email protected]
Julia Wang Economist The Hongkong and Shanghai Banking Corporation Limited +852 3604 3663 [email protected]
Jing Li Economist The Hongkong and Shanghai Banking Corporation Limited +86 10 5999 8240 [email protected]
View HSBC Global Research at: http://www.research.hsbc.com
Issuer of report: The Hongkong and Shanghai Banking Corporation Limited
Disclaimer & Disclosures This report must be read with the disclosures and the analyst certifications in the Disclosure appendix, and with the Disclaimer, which forms part of it
2
Macro China Economics 16 December 2014
abc
Five macro trends 3
Charts 15 GDP 16
Industrial production 18
Private consumption 20
Fixed investment 22
Trade 24
Prices 26
Commodity prices 28
Money and credit growth 30
Interest and exchange rates 32
Employment and income 34
Asset markets 36
Data and forecasts 39
Disclosure appendix 42
Disclaimer 43
Contents
3
Macro China Economics 16 December 2014
abc
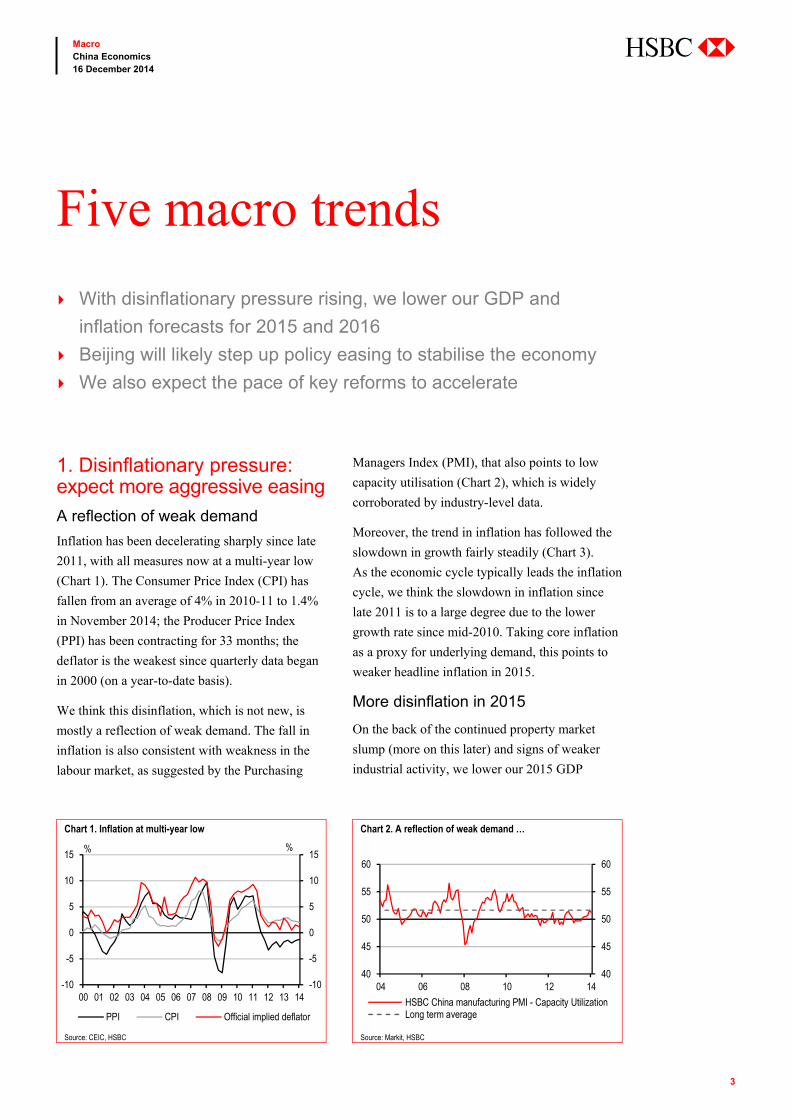
1. Disinflationary pressure: expect more aggressive easing
A reflection of weak demand
Inflation has been decelerating sharply since late
2011, with all measures now at a multi-year low
(Chart 1). The Consumer Price Index (CPI) has
fallen from an average of 4% in 2010-11 to 1.4%
in November 2014; the Producer Price Index
(PPI) has been contracting for 33 months; the
deflator is the weakest since quarterly data began
in 2000 (on a year-to-date basis).
We think this disinflation, which is not new, is
mostly a reflection of weak demand. The fall in
inflation is also consistent with weakness in the
labour market, as suggested by the Purchasing
Managers Index (PMI), that also points to low
capacity utilisation (Chart 2), which is widely
corroborated by industry-level data.
Moreover, the trend in inflation has followed the
slowdown in growth fairly steadily (Chart 3).
As the economic cycle typically leads the inflation
cycle, we think the slowdown in inflation since
late 2011 is to a large degree due to the lower
growth rate since mid-2010. Taking core inflation
as a proxy for underlying demand, this points to
weaker headline inflation in 2015.
More disinflation in 2015
On the back of the continued property market
slump (more on this later) and signs of weaker
industrial activity, we lower our 2015 GDP
Five macro trends
With disinflationary pressure rising, we lower our GDP and
inflation forecasts for 2015 and 2016
Beijing will likely step up policy easing to stabilise the economy
We also expect the pace of key reforms to accelerate
Chart 1. Inflation at multi-year low Chart 2. A reflection of weak demand …
Source: CEIC, HSBC Source: Markit, HSBC
00 01 02 03 04 05 06 07 08 09 10 11 12 13 14-10
-5
0
5
10
15
-10
-5
0
5
10
15%%
PPI CPI Official implied deflator
40
45
50
55
60
40
45
50
55
60
04 06 08 10 12 14
HSBC China manufacturing PMI - Capacity UtilizationLong term average

4
Macro China Economics 16 December 2014
abc
growth forecast to 7.3% from 7.7%. We also trim
our 2016 GDP number to 7.4% from 7.6%.
A slower growth trajectory leads us to lower our
inflation forecast to 1.8% and 1.9% for 2015 and
2016, from 2.9% and 2.7%, respectively (Table 1).
While weak demand is likely the primary driver
of disinflation, supply side shocks may have also
exacerbated the downward pressures on prices.
Commodity prices, and the oil in particular, have
fallen quite sharply in 2H 2014. The transmitted
impact to headline CPI is quite small, given that
fuel price is a very small portion of the CPI basket
and the onshore oil price is still regulated and
tends to fluctuate much less than the market price
(Chart 4). However, historical patterns suggest
lower oil prices will put some pressure on the
CPI. Meanwhile, import prices have fallen sharply
and will likely weigh on the PPI.
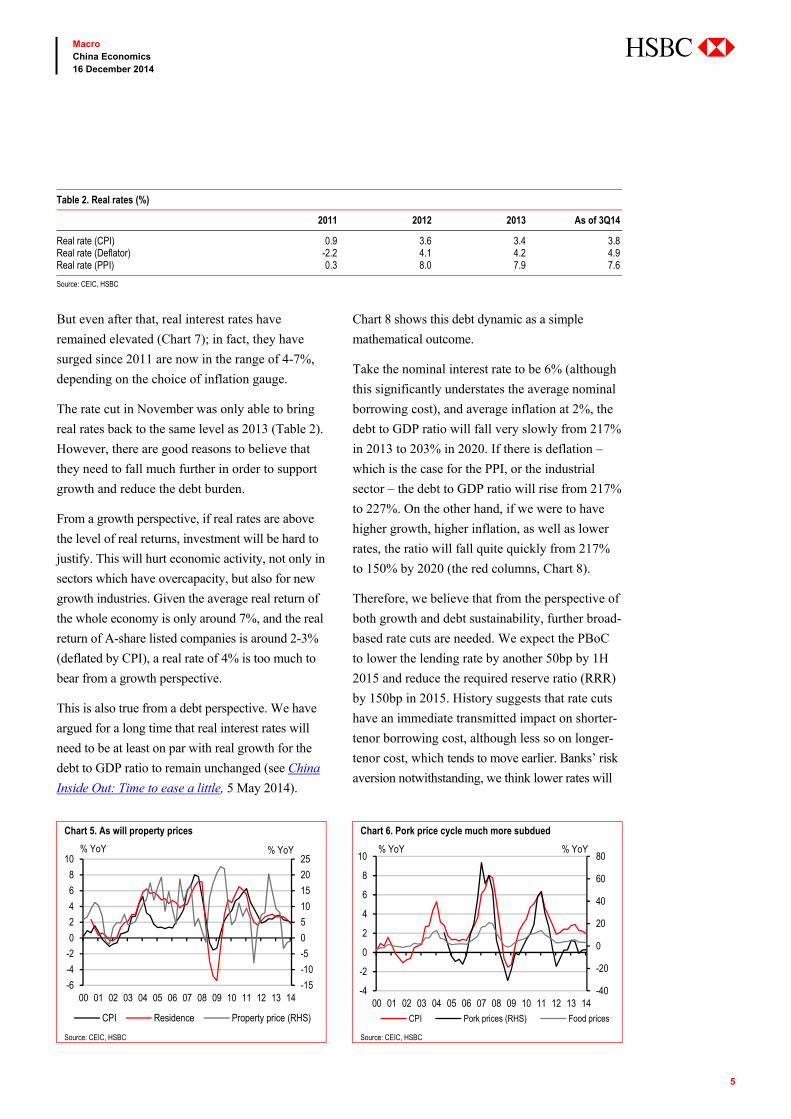
Apart from oil prices, slower property price
growth is another potential downside risk for the
CPI. As shown in Chart 5, historically the
residence component of the CPI basket (roughly
17%) is significantly less volatile than property
prices. However, given there is a rent component
in the residence index, it does tend to follow
house prices (sometimes with a lag). The
correction in property prices has not been
particularly severe this year. However, given
lacklustre sales, we do not expect much upside
pressures on prices in 2015.
A final factor which has historically been a driver
of the CPI is the price of pork. Food is roughly one
third of the CPI basket, and pork has in the past
been a driver of the food inflation cycle. However,
both pork and food inflation remain relatively
subdued (Chart 6). Barring unanticipated supply
side shocks, the pork price is unlikely to swing
headline CPI.
Selective as well as across-the-board easing
We think intensifying disinflationary pressures will
prompt more aggressive easing by policymakers
(see China: From selective to across-the-board
easing, 21 November 2014). The People’s Bank
of China (PBoC) delivered a bigger than expected
cut to the lending rate (40bp) on 21 November.
Chart 3. …and low capacity utilization Chart 4. Oil prices will weigh somewhat on inflation
Source: CEIC, HSBC Source: CEIC, HSBC
Table 1. Forecast revision
Q1 15 Q2 15 Q3 15 Q4 15 2014 2015 2016
GDP, %, y-o-y 7.4 (7.8) 7.2 (7.8) 7.3 (7.6) 7.3 (7.7) 7.5 7.3 (7.7) 7.4 (7.6) GDP, %, q-o-q 1.6 (1.8) 1.8 (1.8) 1.9 (1.9) 1.7 (1.9) CPI, %, y-o-y 1.5 (2.8) 1.7 (2.9) 1.8 (2.7) 2.1 (3.0) 2.4 1.8 (2.9) 1.9 (2.7)
Source: HSBC estimates
-2
0
2
4
6
-5
0
5
10
15
00 01 02 03 04 05 06 07 08 09 10 11 12 13 14
% YoY% YoY
GDP growth CPI core inflation
-100
-50
0
50
100
150
-10
-5
0
5
10
00 01 02 03 04 05 06 07 08 09 10 11 12 13 14
% YoY% YoY
PPI (LHS) Oil price (mkt)No.97 Oil import price
5
Macro China Economics 16 December 2014
abc
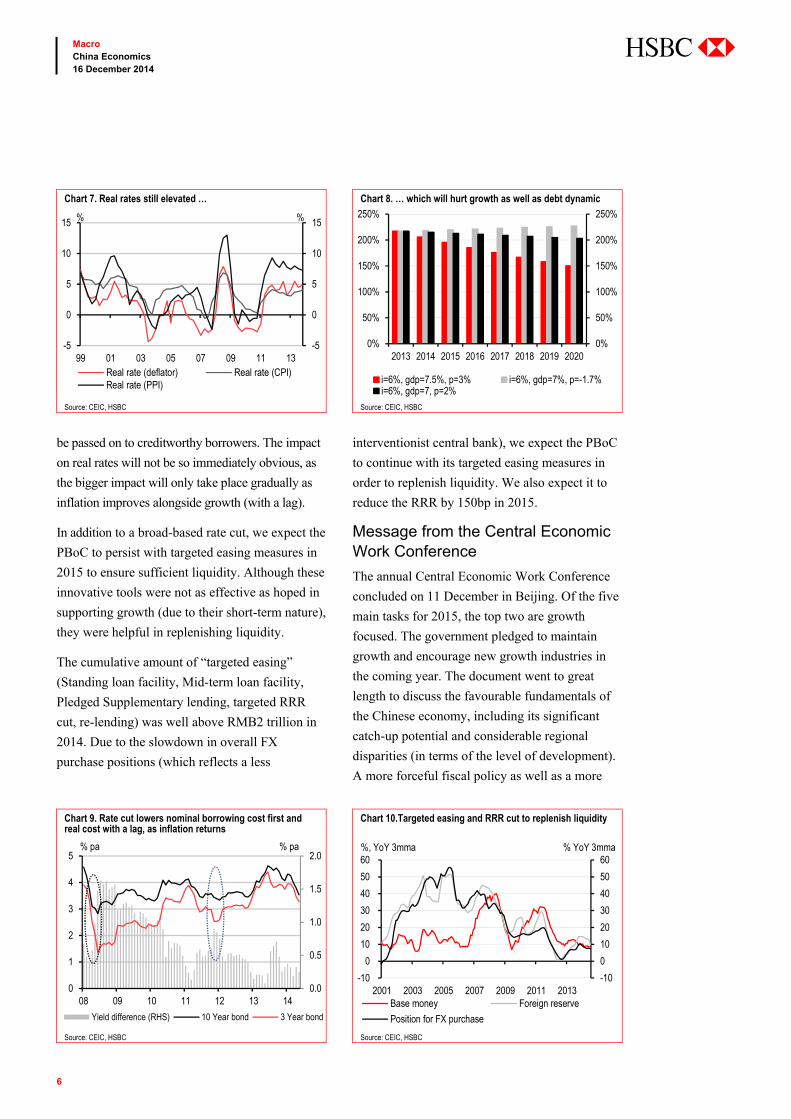
But even after that, real interest rates have
remained elevated (Chart 7); in fact, they have
surged since 2011 are now in the range of 4-7%,
depending on the choice of inflation gauge.
The rate cut in November was only able to bring
real rates back to the same level as 2013 (Table 2).
However, there are good reasons to believe that
they need to fall much further in order to support
growth and reduce the debt burden.
From a growth perspective, if real rates are above
the level of real returns, investment will be hard to
justify. This will hurt economic activity, not only in
sectors which have overcapacity, but also for new
growth industries. Given the average real return of
the whole economy is only around 7%, and the real
return of A-share listed companies is around 2-3%
(deflated by CPI), a real rate of 4% is too much to
bear from a growth perspective.
This is also true from a debt perspective. We have
argued for a long time that real interest rates will
need to be at least on par with real growth for the
debt to GDP ratio to remain unchanged (see China
Inside Out: Time to ease a little, 5 May 2014).
Chart 8 shows this debt dynamic as a simple
mathematical outcome.
Take the nominal interest rate to be 6% (although
this significantly understates the average nominal
borrowing cost), and average inflation at 2%, the
debt to GDP ratio will fall very slowly from 217%
in 2013 to 203% in 2020. If there is deflation –
which is the case for the PPI, or the industrial
sector – the debt to GDP ratio will rise from 217%
to 227%. On the other hand, if we were to have
higher growth, higher inflation, as well as lower
rates, the ratio will fall quite quickly from 217%
to 150% by 2020 (the red columns, Chart 8).
Therefore, we believe that from the perspective of
both growth and debt sustainability, further broad-
based rate cuts are needed. We expect the PBoC
to lower the lending rate by another 50bp by 1H
2015 and reduce the required reserve ratio (RRR)
by 150bp in 2015. History suggests that rate cuts
have an immediate transmitted impact on shorter-
tenor borrowing cost, although less so on longer-
tenor cost, which tends to move earlier. Banks’ risk
aversion notwithstanding, we think lower rates will
Chart 5. As will property prices Chart 6. Pork price cycle much more subdued
Source: CEIC, HSBC Source: CEIC, HSBC
Table 2. Real rates (%)
2011 2012 2013 As of 3Q14
Real rate (CPI) 0.9 3.6 3.4 3.8 Real rate (Deflator) -2.2 4.1 4.2 4.9 Real rate (PPI) 0.3 8.0 7.9 7.6
Source: CEIC, HSBC
-15
-10
-5
0
5
10
15
20
25
-6
-4
-2
0
2
4
6
8
10
00 01 02 03 04 05 06 07 08 09 10 11 12 13 14
% YoY% YoY
CPI Residence Property price (RHS)
-40
-20
0
20
40
60
80
-4
-2
0
2
4
6
8
10
00 01 02 03 04 05 06 07 08 09 10 11 12 13 14
% YoY% YoY
CPI Pork prices (RHS) Food prices
6
Macro China Economics 16 December 2014
abc
be passed on to creditworthy borrowers. The impact
on real rates will not be so immediately obvious, as
the bigger impact will only take place gradually as
inflation improves alongside growth (with a lag).
In addition to a broad-based rate cut, we expect the
PBoC to persist with targeted easing measures in
2015 to ensure sufficient liquidity. Although these
innovative tools were not as effective as hoped in
supporting growth (due to their short-term nature),
they were helpful in replenishing liquidity.
The cumulative amount of “targeted easing”
(Standing loan facility, Mid-term loan facility,
Pledged Supplementary lending, targeted RRR
cut, re-lending) was well above RMB2 trillion in
2014. Due to the slowdown in overall FX
purchase positions (which reflects a less
interventionist central bank), we expect the PBoC
to continue with its targeted easing measures in
order to replenish liquidity. We also expect it to
reduce the RRR by 150bp in 2015.
Message from the Central Economic Work Conference
The annual Central Economic Work Conference
concluded on 11 December in Beijing. Of the five
main tasks for 2015, the top two are growth
focused. The government pledged to maintain
growth and encourage new growth industries in
the coming year. The document went to great
length to discuss the favourable fundamentals of
the Chinese economy, including its significant
catch-up potential and considerable regional
disparities (in terms of the level of development).
A more forceful fiscal policy as well as a more
Chart 7. Real rates still elevated … Chart 8. … which will hurt growth as well as debt dynamic
Source: CEIC, HSBC Source: CEIC, HSBC
Chart 9. Rate cut lowers nominal borrowing cost first and real cost with a lag, as inflation returns
Chart 10.Targeted easing and RRR cut to replenish liquidity
Source: CEIC, HSBC Source: CEIC, HSBC
-5
0
5
10
15
-5
0
5
10
15
99 01 03 05 07 09 11 13
%%
Real rate (deflator) Real rate (CPI)Real rate (PPI)
0%
50%
100%
150%
200%
250%
0%
50%
100%
150%
200%
250%
2013 2014 2015 2016 2017 2018 2019 2020
i=6%, gdp=7.5%, p=3% i=6%, gdp=7%, p=-1.7%i=6%, gdp=7, p=2%
0.0
0.5
1.0
1.5
2.0
0
1
2
3
4
5
08 09 10 11 12 13 14
% pa% pa
Yield difference (RHS) 10 Year bond 3 Year bond
-10
0
10
20
30
40
50
60
-10
0
10
20
30
40
50
60
2001 2003 2005 2007 2009 2011 2013
% YoY 3mma%, YoY 3mma
Base money Foreign reserve
Position for FX purchase

7
Macro China Economics 16 December 2014
abc
flexible monetary policy will be deployed in
2015. We believe this likely means a bigger fiscal
deficit target (around -2.5% of GDP from -2.1%
GDP in 2014.
Even if the authorities set a more conservative
growth target for 2015, in the range of 7.0% to
7.5%, we believe they will do more to counter the
growth and inflation slowdown (see China:
Central Economic Work Conference: stabilising
growth, accelerating reforms, 11 December).
In addition, the authorities also pledged to
accelerate reforms in 2015. We can expect more
progress on cutting red tape, SOE reforms and
RMB convertibility.
2. Infrastructure investment to stay robust A long project pipeline in 2015
Apart from monetary easing, another key
growth driver in 2015 is likely to be
infrastructure investment.
Chart 11 shows a breakdown of fixed asset
investment (FAI) by type. Traditionally,
manufacturing investment is around 30% of all
FAI, property about 19% and infrastructure 22%.
Overall FAI has slowed from 20% in 2013 to
15%, as of October 2014. The sharpest slowdown
is in property investment, which fell from 19% to
12% over the same period. As the property market
started correcting this year, we calculated that a
10% correction in sales, if sustained for a period of
12 months, could shave 1ppt off GDP. Most of that
negative impact would come from the growth side.
Manufacturing investment also moderated from
18% to 13%. The heavy industrial sector is
struggling with overcapacity and the light
manufacturing sector is experiencing weaker
external demand as well as a tighter credit
environment. Only infrastructure investment
remained robust in 2014, growing 21% y-o-y,
and this will likely remain the case in 2015.
Since early 2014, the National Development and
Reform Commission (NDRC), the main planning
agency, has sped up project approvals and has
already approved nearly RMB1 trillion worth of
infrastructure investment. Although some work
has started in 2014, most will likely commence in
early 2015, supporting infrastructure investment
growth in 2015 and 2016 (see Table 3).
Another are where we can expect to see further
initiatives in 2015 is the New Silk Road plan.
China has pledged USD40bn to improve transport
connections in the New Silk Road economic zone,
which comprises the China-Mongolia-Russia
economic belt, China-South Asia-West Asia
economic belt, Europe China continental bridge
and a maritime route that links China with
counties through the Pacific and Indian Ocean
Chart 11. Infrastructure investment to remain strong Chart 12. Capital stock per worker
Source: CEIC, HSBC Source: Penn World tables, HSBC
-10
0
10
20
30
40
50
60
05 06 07 08 09 10 11 12 13 14-10
0
10
20
30
40
50
60% YoY, 3mma% YoY, 3mma
Total FAI PropertyManufacturing Infrastructure
0
50
100
150
200
250
300
350
0
50
100
150
200
250
300
350
China US Japan Korea Spain Malaysia
Capital stock per worker, USD thousand, 2005 price
1990 2011

8
Macro China Economics 16 December 2014
abc
(see Xi’s New Silk Road Plan: China further
increases funding for overseas infrastructure
investment, 18 November 2014). As a result of
this plan, we expect the nine provinces along the
new Silk Road to benefit from increased
infrastructure investment funding in 2015.
According to the preliminary blueprint,
the economic belt has three elements – the
transport system that links Asia and Europe,
natural gas pipelines connecting central Asia and
China and international highway projects.
As for the familiar question of whether China
needs these projects, let us turn to Chart 12, which
should be familiar to our regular readers. The chart
shows that the capital stock per worker is still only
20% of the level in the US and Japan, and 25% of
the level in Korea. On a fundamental basis,
China’s investment resource per worker is still very
much behind the developed economies. Based on a
national average, China is still in great need of urban
infrastructure, including public transport, 3G and 4G
networks, paved roads and social housing. Although
the east coast is already fairly affluent and built out,
the western part of the country is much less
developed. The west is where most of the approved
infrastructure projects (as well as those for the New
Silk Road) will be rolled out.
Transition to a more sustainable financing method
Despite favourable fundamentals, waste has
occurred, particularly in infrastructure investment.
This is a result of easy access to funding – partly
due to the prioritisation of production over returns –
and the perceived implicit central government
guarantee. Local government debt has expanded to
RMB20 trillion as of end 2013. Most of these
liabilities are short term with relatively higher
borrowing costs, whereas the underlying projects
will not be completed by the time the debt is due,
and profitability is likely to be low too. In addition,
a lot of debt has been raised on the bond market
through Local Government Financing Vehicles
(LGFVs) and this was not fully included in the
initial estimate.
The lack of transparency, the relatively high yield
and the duration mismatch have caused concerns
that this method of financing is unsustainable and
detrimental to financial stability (see China Inside
Out: Local debt: Three options, 1 August 2011).
In 2014, regulators have taken some significant steps
to resolve this issue. Both the NDRC and the State
Council have issued rules which restrict the ability of
highly leveraged local governments to raise
additional debt. More disclosure on fund usage and
payback calculations was also enforced. As a result,
local governments with poorer funding abilities have
had to reduce their borrowing.
In September, the State Council issued a directive
which we believe signals the end of LGFVs as a
source of funding (see China: State Council issues
directive on local debt, 3 October, 2014).
Specifically, although roll-overs are allowed,
LGFV bonds will no longer be recognised as
government liabilities from 2016 onwards.
At the same time, the central government has
ordered a fresh national audit (the last one was at
the end of 2013) which will recalculate and
classify the existing stock of local government
liabilities (including the previously off-balance
sheet LGFV debt) to determine the portion that
the government will be liable for. This has led to
wider credit spreads and greater risk
differentiation. Also, the onshore clearing house
has in recent days tightened the rules on repo
collateral, which effectively rules out most LGFV
bonds. This has led to a wave of unwinding as
banks will move to permanently reduce their
holdings for such bonds in 2015.

9
Macro China Economics 16 December 2014
abc
After the year-end national audit, the government
will move to consolidate the recognised liabilities in
the official fiscal budget. Expenditure is expected
to be tied to income streams according to the terms
of its payback period. From 2015 onwards,
incremental debt issuance will be subject to
stronger monitoring by the central government.
In 2015, we expect infrastructure financing to
come from two main channels, in addition existing
commitments made by banks:
We expect the fiscal deficit to rise from around -
2.1% of GDP to around -2.5%. This will help
accommodate the additional interest payments
as well as provide seed capital for new projects.
Second, we expect the quota for municipal
bonds to rise from RMB400bn this year.
The new figure will be set subject to the
repayment ability of each province after the
end-2014 national audit.
Table 3. Infrastructure investment pipeline in 2015
Date of approval Type of infrastructure Expected investment amount (RMBbn)
Years of construction needed (estimate)
Provinces involved Length, km
4/12/2014 Airport 1.4 Shandong 日照28/11/2014 Railway 12.1 Yunnan, Guizhou, Sichuan (叙永至毕节) 18128/11/2014 Railway 12.1 Heilongjiang (哈尔滨至牡丹江) 3628/11/2014 Railway (tunnel) 1.8 Beijing, Hebei (北京至张家口铁路) 1528/11/2014 Airport 1.5 Gansu (兰州中川机场)25/11/2014 Railway 19.6 3.5 Jilin(长春至白城) 33025/11/2014 Railway 19.1 5 Chongqing (涪陵至梅江) 33925/11/2014 Railway 8.8 3.5 Inner Mongolia, Hebei (正蓝旗至张家口) 19225/11/2014 Railway 18.8 4 Shaanxi(阳平关至安康铁路)20/11/2014 Harbour 12.1 Shanghai (国际航运中心洋山深水港区四期工程)15/11/2014 Railway 19.6 Guangxi, Guangdong (柳州至梧州) 23315/11/2014 Railway 6.5 3.5 Inner Mongolia, Hebei (多伦至丰宁) 14515/11/2014 Railway 45.3 6.5 Sichuan Yunnan (峨嵋至米易) 715/11/2014 Railway 10.5 4.5 Gansu (兰州至合作) 18315/11/2014 Railway 70.9 5 Ningxia, Shaanxi (银川至西安) 59805/11/2014 Railway 6.6 3.5 Shanxi, Hebei (和顺至邢台) 13505/11/2014 Railway 30.5 5 Zhejiang, Fujian(衢州至宁德) 38305/11/2014 Railway 37.6 5 Qinghai, Xinjiang (格尔木至库尔勒) 121505/11/2014 Railway 9.9 2.5 Guangxi (南昆铁路南宁至百色段) 20905/11/2014 Railway 46.5 4.5 Jiangsu (连云港至镇江) 30505/11/2014 Railway 15.5 Yunnan(祥云至临沧) 19905/11/2014 Railway 53.3 5 Jiangxi (南昌至赣州) 42030/10/2014 Railway 193.0 5 Inner Mongolia, Shaanxi, Shanxi, Henan, Hubei,
Hunan, Jiangxi (蒙华铁路,蒙西至华中)1807
30/10/2014 Railway 18.0 Shanxi, Hebei (大同至张家口) 13730/10/2014 Railway 36.6 7 Tibet (拉萨至林芝) 40222/10/2014 Railway 38.4 5.5 Chongqing, Hubei, Hunan (黔江至张家界至常德) 33922/10/2014 Railway bridge 8.6 4 Anuui (商合杭铁路芜湖长江公铁大桥)22/10/2014 Railway 97.4 Henan, Hubei, Chongqing (郑州至万州) 78522/10/2014 Airport 0.8 Jilin (松原)22/10/2014 Airport 1.1 Qinghai,(果洛)22/10/2014 Airport 0.5 Inner Mongolia (扎兰屯)22/10/2014 Airport 1.5 Yunnan(澜沧)22/10/2014 Airport 1.6 Guizhou(仁怀)16/10/2014 Railway 25.6 4 Liaoning, Inner Mongolia (锦州至白音华) 60116/10/2014 Railway 25.7 7 Yunnan(大理至瑞丽) 33016/10/2014 Railway 44.5 Yunnan(玉溪至磨憨) 504
Source: Various media sources, HSBC

10
Macro China Economics 16 December 2014
abc
3. Reforms gaining momentum The Third Plenum, an important policy meeting
held in late 2013, proposed a wide-ranging series
of reforms. We expect the pace of change to
accelerate in 2015. In Table 4 we list the main
reform objectives, progress made in 2014, and our
expectations for 2015.
Fiscal reform: Given the planned budget
consolidation in 2015, we expect fiscal reforms to
pick up pace in the coming months. Apart from
finishing the national audit, we expect progress to
be made on increasing direct transfers from Beijing
and taking stricter control of local government
budgets. At the same time, we expect more changes
to budget management in order to establish a
multi-year, counter-cyclical fiscal budget.
Financial reforms: These moved ahead quickly
in 2014 and we expect the launch of the deposit
insurance scheme to pave the way for greater
financial liberalisation in the next 1-2 years.
For more details see China: Macro implications of
the deposit insurance scheme, 1 December 2014
and China: New blueprint for financial market
reforms 2020, 12 May 2014).
In addition, this year has seen progress made on
outward direct investments, particularly through
the launch of the New Silk Road initiative and the
Asia Infrastructure Investment Bank. Both will
accelerate in 2015, helping China to achieve more
balanced flows and make the RMB a more
internationally used currency (see Xi’s New Silk
Road plan, 18 November 2014; and Building on
China’s overseas investment, 8 August 2014).
4. Property market: cooling, but not collapsing A major risk we flagged in 2014 was the correction
in the property market. As the year progressed,
the fall in property sales indeed deepened, from
around 0% to 10% y-o-y.
Table 4. Reforms are set to accelerate
Third Plenum objective in 2013 Progress in 2014 Expectation for 2015
SOE reform Develop mixed-ownership entities; improve management of state-owned assets; Convert some SOEs into state-owned capital investment firms; Revise senior executive compensation.
Revised senior SOE management compensation; set mandatory requirements to increase mixed-ownership ratio for local SEOs; Asset sales by Sinopec; trial programme for six central SOEs.
Central SOE reform plan; higher private capital share of local SOEs.
Factor price reform Relax government price controls; improve transparency of the pricing process; give market the determinant role in pricing.
Regulated bank service prices; published medical pricing reform draft for consultation; revised railway service prices from fixed price to upper bound (select lines).
Deregulation of utility prices, merge different gas pricing systems, adopt a staggered pricing system for residential gas price; medical pricing reform; railway pricing reform;
Hukou reform Equalise urban and rural hukou rights: increase urbanisation rate to 60% by 2020; remove hukou restrictions in small cities, simplify the process for medium-size cities; increase social benefit coverage for both local residents and migrants
Equal rural and urban status; settlement schemes for migrant workers; expansion of basic social services for all residents.
More cities to implement the hukou conversion and gradually make social services equal for all.
Land reform Build a unified national construction land market; complete the registration of land usage rights nationwide within five years; allow rural collective construction land to be sold in the commercial market (same as urban state-owned land).
Draft proposal submitted to State Council, which includes changes to land acquisition methods and the redevelopment of homestead system.
Final draft either at end-2014 or early 2015, trial programme in certain provinces, and further related legislation in 2015.
Fiscal reform Fiscal budgetary reform and tax reform: Establish multi-year fiscal budget with automatic balances; Increase the share of direct tax; accelerate property tax legislation.
Gave legal premise to the municipal bond market; Tightened rules on local government debts (stock and new issuance); Began a fresh national audit to incorporate all recognised liabilities into the 2015 budget.
Budget consolidation to link liabilities to income streams; Further disable LGFVs, Increase share of direct transfer.
Financial reform A more open financial sector (to foreign and private capital); accelerate equity and bond market reforms; encourage financial innovation; accelerate capital account convertibility and RMB internationalisation; establish deposit insurance system.
Draft regulation for the deposit insurance scheme; re-started the IPO process; raised the upper bound on deposit rates and simplified lending rates; Shanghai-Hongkong Stock Connect; Shanghai Free Trade Zone and negative list; tighter regulations to reduce financial sector risks.
Implement the deposit insurance scheme; establish more RMB offshore settlement centres; build on the New Silk Road initiative; further interest rate liberalisation.
Source: Various media sources, CEIC

11
Macro China Economics 16 December 2014
abc
We estimated in May 2014 that, if property sales
were to contract 10% every month for 12 months,
the cumulative impact on GDP would be roughly
-1ppt (see China’s property slowdown: How
worried should we be?, 29 May 2014).
What’s happened this year is quite close to our
base case. Both local governments as well as the
PBoC became more supportive of the market in
September. After local governments removed
home purchase restrictions in second and third tier
cities, the PBoC relaxed mortgage rules ahead of
the 1 October Golden Week holiday.
In recent months, signs of stabilisation have
emerged, at least on the sales side, but it is still
too early to predict a rebound. Even if the market
starts to improve slowly, the earliest we can expect
to see any positive impact on the economy would
be mid-2015 as sales usually lead investment by
six months. In fact, our base case is that sales will
probably continue to contract but at a more
moderate pace in the coming months. Investment
will likely remain depressed at least for the first
half of 2015. Our base case is that property
investment will stabilise at around 11% in 2015,
down from 12% in 2014 and 20% in 2013.
Continued softness in the property market means
related sectors will likely remain under pressure in
2015. Chart 14, taken from our report of 12 May
2014, China: New blueprint for financial market
reforms 2020, estimates how reliant each sector is
on property demand. Specifically, for every
RMB1 demand in materials, RMB0.25 is down to
the property sector.
Apart from the spill-over effect, both buyers and
sellers will likely increasingly differentiate on a
city basis. The new urbanisation plan will provide
some impetus but the supply and demand
dynamics will vary by region (see Table 4).
5. RMB: no big devaluation Slower inflation
The final theme for 2015 will be the RMB.
The currency’s volatility is rising and will continue
to do so in 2015. In view of expectations for a
stronger USD and further monetary easing, our FX
colleagues have changed their USDCNY forecast to
6.22 from 6.10 (see Asian FX Focus: 2015 Outlook:
The pressure cooker, 8 December 2014).
From a macro perspective, there are two main
implications. First, let’s examine the impact of
structurally slower FX inflows on monetary
conditions. Chart 15 shows the quarterly balance of
payment positions. Apart from a gradually
shrinking current account (due to a smaller trade
balance and increasing services outflow),
the financial account is also seeing more outflows.
As China pursues balanced capital flows, slower
FX inflows look likely to become a structural trend.
Chart 13. The correction in 2014 Chart 14. Closely intertwined
Source: CEIC, HSBC Source: CEIC, HSBC
-20-100102030405060
-40-20
020406080
100120
2005 2006 2007 2008 2009 2010 2011 2012 2013 2014
% YoY% YoY, Ytd
Property sales (LHS) Property price (RHS)0.00
0.05
0.10
0.15
0.20
0.25
0.30
0.35
0.40
0.45
2005 2010

12
Macro China Economics 16 December 2014
abc
Meanwhile, a reduction in routine FX intervention
means that the inflows into base money growth will
moderate. As mentioned earlier when discussing
inflation, lower inflows automatically translate into
tighter monetary conditions (Chart 10). We believe
targeted liquidity as well as RRR cuts will be
needed to keep base money growth stable in 2015.
Impact on exports
The second issue to consider is the impact on
exports. Our FX colleagues have trimmed their
RMB forecasts, looking for less than 1%
depreciation in 2015. However, the impact on the
currency’s exchange rate (real or nominal) with its
trade partners less clear. In fact, given
expectations for QE in the Eurozone, and further
monetary easing in Japan, our G10 colleagues
expect the EUR and JPY to depreciate more
versus than USD than the RMB (see Currency
Outlook: Global frailty favours the dollar,
13 November 2014). This means the RMB will
likely appreciate in nominal terms versus its trade
partners, as well as real appreciation (as inflation
will likely still be higher in China than in the
Eurozone or Japan). Although we have factored in
a gradual improvement in external demand, the
lift to exports is likely to be at least partly offset
by appreciation on a REER basis and growth will
remain domestically driven.
But devaluation is not an option
A question frequently asked by clients is whether
China will join the currency war. After all,
if growth is slowing and deflationary risks are
rising, why not pick the seemingly convenient
route of FX devaluation?
Our answer is that policymakers still have
sufficient monetary and fiscal policy ammunition
to boost growth via domestic demand. In fact,
we see them pulling these levers more forcefully
in 2015. As highlighted in the previous sections,
more aggressive monetary easing and a greater
fiscal deficit are ways to support domestic
demand in 2015.
And in view of the still sluggish external demand,
the benefits from depreciation may not be so
obvious. In addition, such a move from the PBoC
might trigger more competitive devaluation from
China’s trade partners. In that case, devaluation
would be counter-productive and might lead to
slower growth in the whole region.
Instead of devaluation, we think policymakers
will do more to increase the RMB’s capital
account convertibility in 2015. Many initiatives
were taken in 2014 to deregulate cross border
portfolio flows (e.g. Shanghai-Hong Kong Stock
Connect, the Shanghai Free Trade Zone) and we
expect more measures in 2015 to further increase
the openness of the onshore capital markets.
Chart 15. Structurally less inflow Chart 16. REER gains will offset some export gains
Source: CEIC, HSBC Source: CEIC, HSBC
-150
-100
-50
0
50
100
150
200
250
-150
-100
-50
0
50
100
150
200
250
00 01 02 03 04 05 06 07 08 09 10 11 12 13 14
USDbnUSDbn
Portfolio Inv Others Current Acc Direct Inv
-150
-100
-50
0
50
100
150
200
250
-150
-100
-50
0
50
100
150
200
250
06 07 08 09 10 11 12 13 14
USDbnUSDbn
FX purchase, USDbn FX reserves, USDbn

13
Macro China Economics 16 December 2014
abc
China is also looking for more ways to export its
excess saving, for example, through encouraging
outward direct investment (e.g. Asia Infrastructure
Investment Bank, New Silk Road). We expect
further outward infrastructure investment in 2015
which will lead to increasingly more balanced
investment flows. We believe this is a far more
sustainable way to relieve appreciation pressure
on the currency.

14
Macro China Economics 16 December 2014
abc
This page intentionally left blank.

15
Macro China Economics 16 December 2014
abc
Charts
16
Macro China Economics 16 December 2014
abc
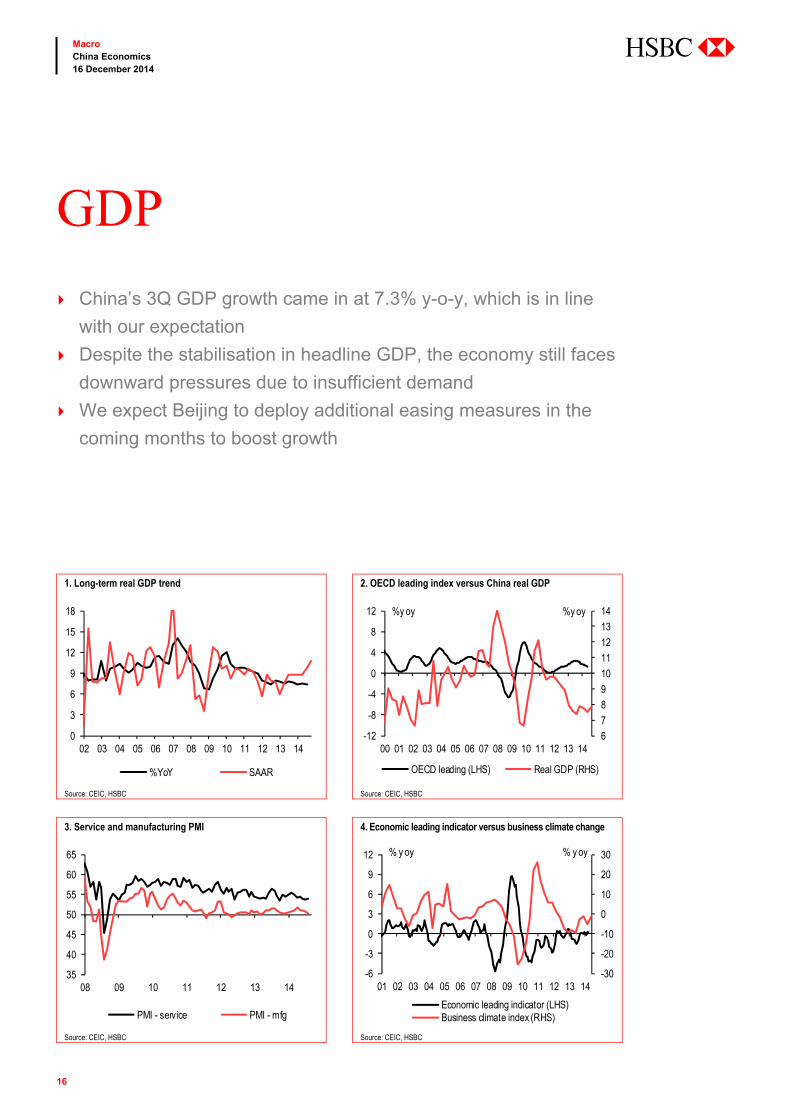
GDP
China’s 3Q GDP growth came in at 7.3% y-o-y, which is in line
with our expectation
Despite the stabilisation in headline GDP, the economy still faces
downward pressures due to insufficient demand
We expect Beijing to deploy additional easing measures in the
coming months to boost growth
1. Long-term real GDP trend 2. OECD leading index versus China real GDP
Source: CEIC, HSBC Source: CEIC, HSBC
3. Service and manufacturing PMI 4. Economic leading indicator versus business climate change
Source: CEIC, HSBC Source: CEIC, HSBC
0
3
6
9
12
15
18
02 03 04 05 06 07 08 09 10 11 12 13 14
%YoY SAAR
6
7
8
9
10
11
12
13
14
-12
-8
-4
0
4
8
12
00 01 02 03 04 05 06 07 08 09 10 11 12 13 14
OECD leading (LHS) Real GDP (RHS)
%y oy %y oy
35
40
45
50
55
60
65
08 09 10 11 12 13 14
PMI - service PMI - mfg
-30
-20
-10
0
10
20
30
-6
-3
0
3
6
9
12
01 02 03 04 05 06 07 08 09 10 11 12 13 14
Economic leading indicator (LHS)Business climate index (RHS)
% y oy % y oy

17
Macro China Economics 16 December 2014
abc
5. GDP, by region (nominal GDP, weighted) 6. GDP, by industry
Source: CEIC, HSBC Source: CEIC, HSBC
7. Industrial production 8. Commodity production
Source: CEIC, HSBC Source: CEIC, HSBC
9. Construction sector 10. Confidence indices
Source: CEIC, HSBC Source: CEIC, HSBC
5
7
9
11
13
15
17
Jun-
06
Mar
-07
Dec-
07
Sep-
08
Jun-
09
Mar
-10
Dec-
10
Sep-
11
Jun-
12
Mar
-13
Dec-
13
Sep-
14
Bohai YRD PRD
YTD, %y oy
0
3
6
9
12
15
18
21
96 98 00 02 04 06 08 10 12 14
Primary Secondary Tertiary
YTD, %y oy
5
8
11
14
17
20
23
01 02 03 04 05 06 07 08 09 10 11 12 13 14
VAI
% y oy , 3mma
-10-505
101520253035
01 02 03 04 05 06 07 08 09 10 11 12 13 14
Electricity production
% y oy , 3mma
10
15
20
25
30
0
1,000
2,000
3,000
4,000
5,000
6,000
7,000
07 08 09 10 11 12 13 14
Construction output value %yoy
RMB bn %y oy
50
55
60
65
85
90
95
100
105
110
02 03 04 05 06 07 08 09 10 11 12 13 14
Consumer confidence (LHS)Future income confidence (RHS)

18
Macro China Economics 16 December 2014
abc
Industrial production
October IP slowed to 7.7% y-o-y as the one-off boost from faster
electronic output in September faded
Slower manufacturing output growth was the main factor behind
the slowdown
The downward pressures on the industrial sector persisted, and
are likely to remain in the coming months
1. Industrial production vs GDP 2. Industrial production growth trend
Source: CEIC, HSBC Source: CEIC, HSBC
3. Industrial production vs manufacturing PMI 4. Electricity production changes together with IP
Source: CEIC, HSBC Source: CEIC, HSBC
6789101112131415
5
7
9
11
13
15
17
19
21
01 02 03 04 05 06 07 08 09 10 11 12 13 14
IP(LHS) GDP (RHS)
%y oy %y oy
-4-3-2-10123456
5
7
9
11
13
15
17
19
00 01 02 03 04 05 06 07 08 09 10 11 12 13 14
%YoY SA, %MoM
%y oy, 3mma %mom, 3mma
35
40
45
50
55
60
65
579
11131517192123
05 06 07 08 09 10 11 12 13 14
IP (LHS) Mfg PMI (RHS)
%y oy, 3mma %
-15-10-505101520253035
579
11131517192123
99 00 01 02 03 04 05 06 07 08 09 10 11 12 13 14
IP Electricity production
% y oy , 3mma % y oy , 3mma
19
Macro China Economics 16 December 2014
abc
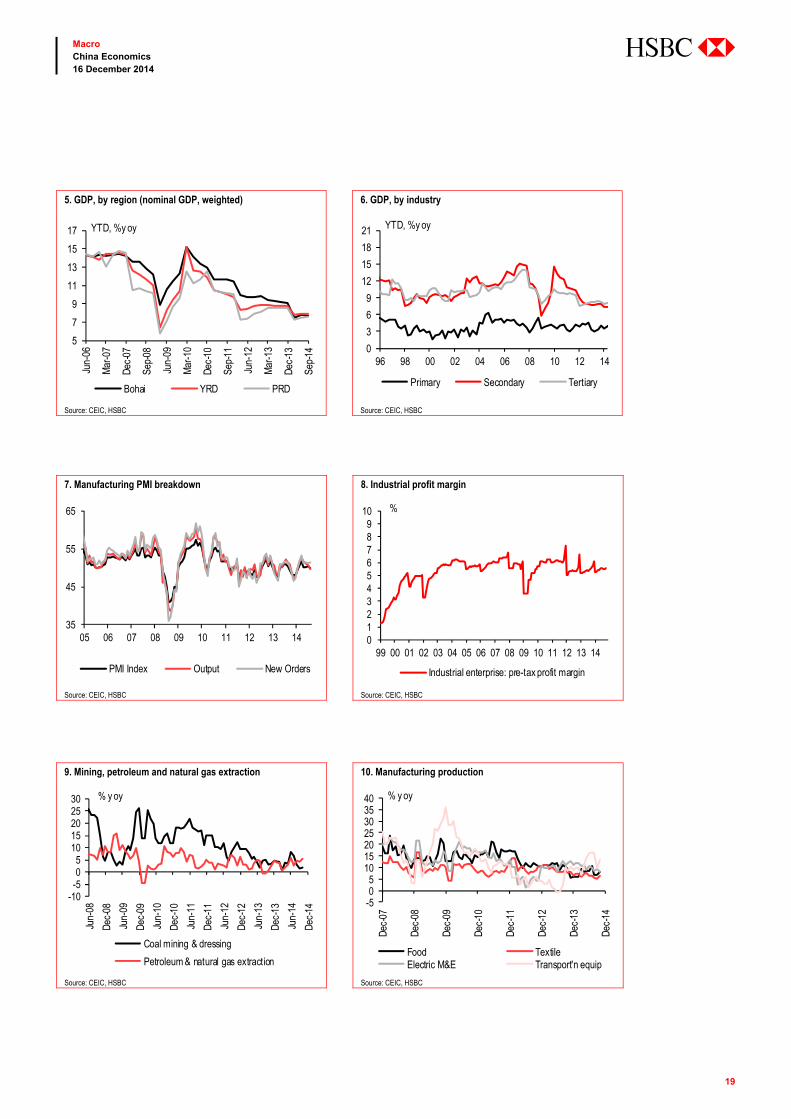
5. GDP, by region (nominal GDP, weighted) 6. GDP, by industry
Source: CEIC, HSBC Source: CEIC, HSBC
7. Manufacturing PMI breakdown 8. Industrial profit margin
Source: CEIC, HSBC Source: CEIC, HSBC
9. Mining, petroleum and natural gas extraction 10. Manufacturing production
Source: CEIC, HSBC Source: CEIC, HSBC
5
7
9
11
13
15
17
Jun-
06
Mar
-07
Dec-
07
Sep-
08
Jun-
09
Mar
-10
Dec-
10
Sep-
11
Jun-
12
Mar
-13
Dec-
13
Sep-
14
Bohai YRD PRD
YTD, %y oy
0
3
6
9
12
15
18
21
96 98 00 02 04 06 08 10 12 14
Primary Secondary Tertiary
YTD, %y oy
35
45
55
65
05 06 07 08 09 10 11 12 13 14
PMI Index Output New Orders
0123456789
10
99 00 01 02 03 04 05 06 07 08 09 10 11 12 13 14
Industrial enterprise: pre-tax profit margin
%
-10-505
1015202530
Jun-
08
Dec-
08
Jun-
09
Dec-
09
Jun-
10
Dec-
10
Jun-
11
Dec-
11
Jun-
12
Dec-
12
Jun-
13
Dec-
13
Jun-
14
Dec-
14
Coal mining & dressing
Petroleum & natural gas extraction
% y oy
-505
10152025303540
Dec-
07
Dec-
08
Dec-
09
Dec-
10
Dec-
11
Dec-
12
Dec-
13
Dec-
14
Food TextileElectric M&E Transport'n equip
% y oy

20
Macro China Economics 16 December 2014
abc
Private consumption
Retail sales grew 11.5% y-o-y in October, in line with
expectations, but slowing from earlier this year
Above-limit spending growth slowed further to 8.3% in October
from 8.5%. Auto sales growth slowed to 4.5% from 6.7%
Private consumption growth remains sluggish as slower growth
weighs on income growth and expectations remain subdued
1. Retail sales trend 2. Consumer confidence
Source: CEIC, HSBC Source: CEIC, HSBC
3. Confidence in income 4. Confidence in prices
Source: CEIC, HSBC Source: CEIC, HSBC
-10
0
10
20
30
40
50
60
5
10
15
20
25
00 01 02 03 04 05 06 07 08 09 10 11 12 13 14
%YoY (LHS) SAAR, 3mma (RHS)
80
90
100
110
120
00 01 02 03 04 05 06 07 08 09 10 11 12 13 14
Consumer confidence Satisfactory indexExpectation index
%
45
50
55
60
65
01 02 03 04 05 06 07 08 09 10 11 12 13
Current income sentimentFuture income confidence
Index
102030405060708090
01 02 03 04 05 06 07 08 09 10 11 12 13
Current price satisfactionFuture price expectation
%

21
Macro China Economics 16 December 2014
abc
5. Retail sales, by sector 6. Retail sales in urban vs rural areas
Source: CEIC, HSBC Source: CEIC, HSBC
7. Per-capita income vs expenditure – Urban households 8. Per-capita income vs expenditure – Rural households
Source: CEIC, HSBC Source: CEIC, HSBC
9. Expenditure, by product – Urban households 10. Expenditure, by product – Rural households
Source: CEIC, HSBC Source: CEIC, HSBC
6
12
18
24
30
06 07 08 09 10 11 12 13 14
Wholesale & Retail TradeAccommodation & Catering Trade
% y oy
9
12
15
18
21
24
27
06 07 08 09 10 11 12 13 14
Urban Rural
% y oy
0
5
10
15
20
25
06 07 08 09 10 11 12 13 14
IncomeDisposable incomeConsumption expenditure
per capita, % y oy
-5
0
5
10
15
20
25
30
02 03 04 05 06 07 08 09 10 11 12 13
Cash Income Cash consumption expenditure
per capita, % y oy
-5
0
5
10
15
20
25
30
03 04 05 06 07 08 09 10 11 12
Food & housing ClothingTransport & telecom Service & others
%y oy
-10
0
10
20
30
40
03 04 05 06 07 08 09 10 11 12
Food & housing ClothingTransport & telecom Service & others
%y oy
22
Macro China Economics 16 December 2014
abc
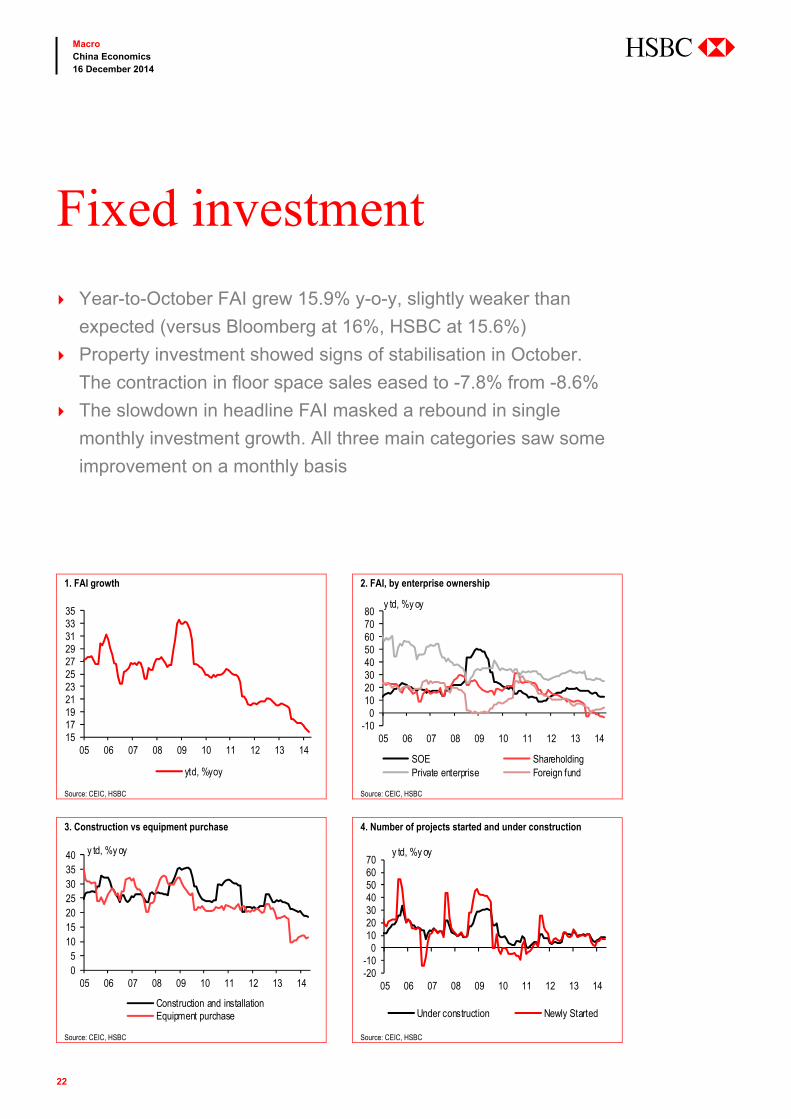
Fixed investment
Year-to-October FAI grew 15.9% y-o-y, slightly weaker than
expected (versus Bloomberg at 16%, HSBC at 15.6%)
Property investment showed signs of stabilisation in October.
The contraction in floor space sales eased to -7.8% from -8.6%
The slowdown in headline FAI masked a rebound in single
monthly investment growth. All three main categories saw some
improvement on a monthly basis
1. FAI growth 2. FAI, by enterprise ownership
Source: CEIC, HSBC Source: CEIC, HSBC
3. Construction vs equipment purchase 4. Number of projects started and under construction
Source: CEIC, HSBC Source: CEIC, HSBC
1517192123252729313335
05 06 07 08 09 10 11 12 13 14
ytd, %yoy
-100
1020304050607080
05 06 07 08 09 10 11 12 13 14
SOE ShareholdingPrivate enterprise Foreign fund
y td, %y oy
05
10152025303540
05 06 07 08 09 10 11 12 13 14
Construction and installationEquipment purchase
y td, %y oy
-20-10
010203040506070
05 06 07 08 09 10 11 12 13 14
Under construction Newly Started
y td, %y oy
23
Macro China Economics 16 December 2014
abc
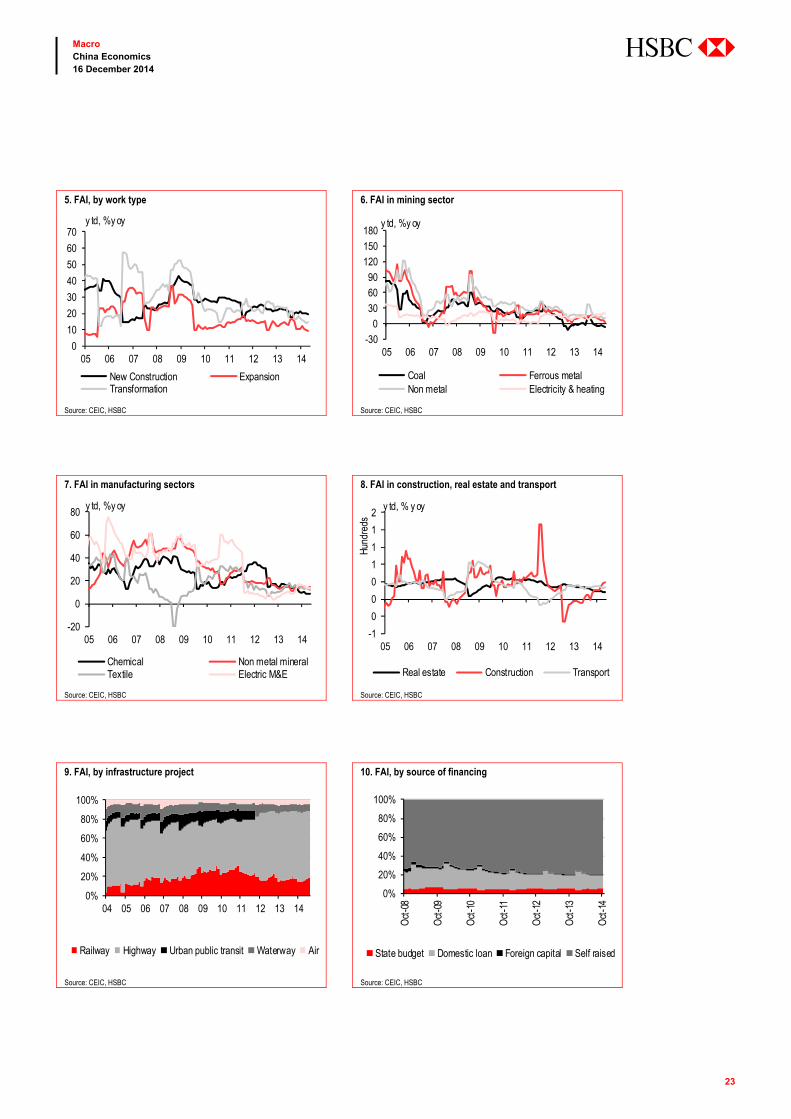
5. FAI, by work type 6. FAI in mining sector
Source: CEIC, HSBC Source: CEIC, HSBC
7. FAI in manufacturing sectors 8. FAI in construction, real estate and transport
Source: CEIC, HSBC Source: CEIC, HSBC
9. FAI, by infrastructure project 10. FAI, by source of financing
Source: CEIC, HSBC Source: CEIC, HSBC
0
10
20
30
40
50
60
70
05 06 07 08 09 10 11 12 13 14
New Construction ExpansionTransformation
y td, %y oy
-30
030
6090
120150
180
05 06 07 08 09 10 11 12 13 14
Coal Ferrous metalNon metal Electricity & heating
y td, %y oy
-20
0
20
40
60
80
05 06 07 08 09 10 11 12 13 14
Chemical Non metal mineralTextile Electric M&E
y td, %y oy
-1
0
0
0
1
1
1
2
05 06 07 08 09 10 11 12 13 14
Hund
reds
Real estate Construction Transport
y td, % y oy
0%
20%
40%
60%
80%
100%
04 05 06 07 08 09 10 11 12 13 14
Railway Highway Urban public transit Waterway Air
0%
20%
40%
60%
80%
100%
Oct
-08
Oct
-09
Oct
-10
Oct
-11
Oct
-12
Oct
-13
Oct
-14
State budget Domestic loan Foreign capital Self raised
24
Macro China Economics 16 December 2014
abc
Trade
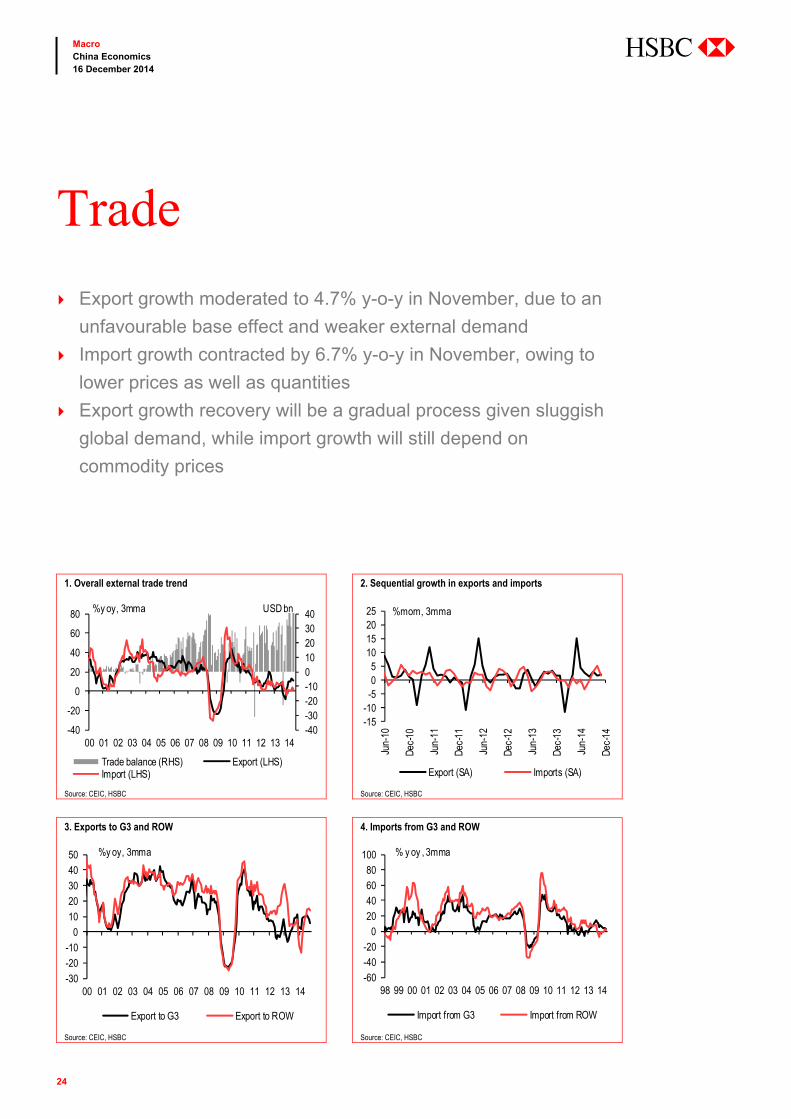
Export growth moderated to 4.7% y-o-y in November, due to an
unfavourable base effect and weaker external demand
Import growth contracted by 6.7% y-o-y in November, owing to
lower prices as well as quantities
Export growth recovery will be a gradual process given sluggish
global demand, while import growth will still depend on
commodity prices
1. Overall external trade trend 2. Sequential growth in exports and imports
Source: CEIC, HSBC Source: CEIC, HSBC
3. Exports to G3 and ROW 4. Imports from G3 and ROW
Source: CEIC, HSBC Source: CEIC, HSBC
-40-30-20-10010203040
-40
-20
0
20
40
60
80
00 01 02 03 04 05 06 07 08 09 10 11 12 13 14
Trade balance (RHS) Export (LHS)Import (LHS)
%y oy, 3mma USD bn
-15-10-505
10152025
Jun-
10
Dec-
10
Jun-
11
Dec-
11
Jun-
12
Dec-
12
Jun-
13
Dec-
13
Jun-
14
Dec-
14
Export (SA) Imports (SA)
%mom, 3mma
-30-20-10
01020304050
00 01 02 03 04 05 06 07 08 09 10 11 12 13 14
Export to G3 Export to ROW
%y oy, 3mma
-60-40-20
020406080
100
98 99 00 01 02 03 04 05 06 07 08 09 10 11 12 13 14
Import from G3 Import from ROW
% y oy , 3mma

25
Macro China Economics 16 December 2014
abc
5. Taiwan’s new export orders as a leading indicator 6. PMI new export orders vs exports
Source: CEIC, HSBC Source: CEIC, HSBC
7. Exports – ordinary vs processing trade 8. Trade price index
Source: CEIC, HSBC Source: CEIC, HSBC
9. Exports, by major commodity 10. Imports, by major commodity
Source: CEIC, HSBC Source: CEIC, HSBC
-40
-20
0
20
40
60
80
00 01 02 03 04 05 06 07 08 09 10 11 12 13 14
Export Taiwan's new export orders
% y oy , 3mma
44
46
48
50
52
54
56
58
-15
-10
-5
0
5
10
15
20
10 11 12 13 14
Export (SA, LHS) PMI new export orders (RHS)
%mom, 3mma Pts
-40
-20
0
20
40
60
80
100
06 07 08 09 10 11 12 13 14
Export - Ordinary trade Export - Processing
% y oy
-60-40-20
020406080
06 07 08 09 10 11 12 13 14
Export trade index value Import trade index value
% y oy
-60
-30
0
30
60
90
120
06 07 08 09 10 11 12 13 14
Mineral fuel, lubricants & materialManufactured goodsMachiery & transport equipmentMisc. mfg articles
% y oy
-25
0
25
50
75
06 07 08 09 10 11 12 13 14
Iron ore Crude petroleum oil
% y oy , 3mma

26
Macro China Economics 16 December 2014
abc
Prices
November CPI rose 1.4% y-o-y, the lowest reading since Jan
2010, reflecting the fall in oil prices as well as weak demand
Core inflation moderated again in November, suggesting demand
remained weak
Strong disinflationary pressures will likely prompt more monetary
easing in the coming months
1. Consumer price trend 2. CPI, by major segment
Source: CEIC, HSBC Source: CEIC, HSBC
3. Urban vs rural inflation 4. Producer price index
Source: CEIC, HSBC Source: CEIC, HSBC
-1.0
-0.5
0.0
0.5
1.0
1.5
2.0
-4
-2
0
2
4
6
8
10
01 02 03 04 05 06 07 08 09 10 11 12 13 14
YOY (LHS) MOM (RHS)
% y oy % mom, 3mma
-5
0
5
10
15
20
25
06 07 08 09 10 11 12 13 14
Overall Core Food
% y oy
-4
-2
0
2
4
6
8
10
01 02 03 04 05 06 07 08 09 10 11 12 13 14
Urban Rural
% y oy
-2.5
-1.5
-0.5
0.5
1.5
-10
-5
0
5
10
15
03 04 05 06 07 08 09 10 11 12 13 14
YOY (LHS) MOM (RHS)
% y oy % mom, 3mma

27
Macro China Economics 16 December 2014
abc
5. PPI, by industry (1) 6. PPI, by industry (2)
Source: CEIC, HSBC Source: CEIC, HSBC
7. Purchase and output prices 8. Fixed asset investment price index
Source: CEIC, HSBC Source: CEIC, HSBC
9. Petroleum prices 10. Property prices
Source: CEIC, HSBC Source: CEIC, HSBC
-15
-10
-5
0
5
10
15
01 02 03 04 05 06 07 08 09 10 11 12 13 14
Light industry Heavy industry
% y oy
-10
-5
0
5
10
15
01 02 03 04 05 06 07 08 09 10 11 12 13 14
Producer goods Consumer goods
% y oy
-15
-10
-5
0
5
10
15
20
01 02 03 04 05 06 07 08 09 10 11 12 13 14
PPICorporate goods price indexPurchasing price index - raw materials
% y oy
-10
-5
0
5
10
15
20
05 06 07 08 09 10 11 12 13
Overall index Equip, tool & instrum'tConstruct'n & install'n
% y oy
-60-30
0306090
120150180
05 06 07 08 09 10 11 12 13 14
PPI - petroleum and natural gasImport value index - petroleum
% y oy
-15-10-505
1015202530
01 02 03 04 05 06 07 08 09 10 11 12 13 14
Residential property price
% y oy
28
Macro China Economics 16 December 2014
abc
Commodity prices
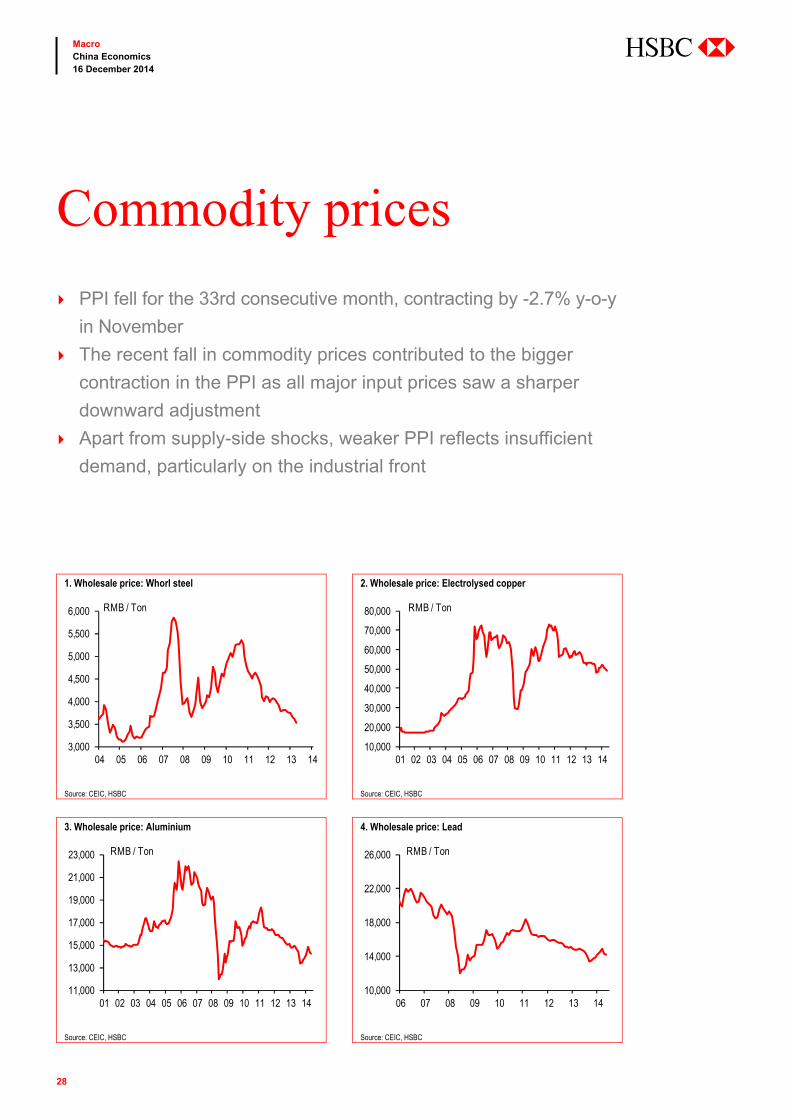
PPI fell for the 33rd consecutive month, contracting by -2.7% y-o-y
in November
The recent fall in commodity prices contributed to the bigger
contraction in the PPI as all major input prices saw a sharper
downward adjustment
Apart from supply-side shocks, weaker PPI reflects insufficient
demand, particularly on the industrial front
1. Wholesale price: Whorl steel 2. Wholesale price: Electrolysed copper
Source: CEIC, HSBC Source: CEIC, HSBC
3. Wholesale price: Aluminium 4. Wholesale price: Lead
Source: CEIC, HSBC Source: CEIC, HSBC
3,000
3,500
4,000
4,500
5,000
5,500
6,000
04 05 06 07 08 09 10 11 12 13 14
RMB / Ton
10,000
20,000
30,000
40,000
50,000
60,000
70,000
80,000
01 02 03 04 05 06 07 08 09 10 11 12 13 14
RMB / Ton
11,000
13,000
15,000
17,000
19,000
21,000
23,000
01 02 03 04 05 06 07 08 09 10 11 12 13 14
RMB / Ton
10,000
14,000
18,000
22,000
26,000
06 07 08 09 10 11 12 13 14
RMB / Ton

29
Macro China Economics 16 December 2014
abc
5. Wholesale price: Zinc 6. Wholesale price: Nickel
Source: CEIC, HSBC Source: CEIC, HSBC
7. Wholesale price: Diesel oil 8. Wholesale price: Gasoline
Source: CEIC, HSBC Source: CEIC, HSBC
9. Retail price: Rice 10. Retail price: Flour
Source: CEIC, HSBC Source: CEIC, HSBC
8,000
12,000
16,000
20,000
24,000
28,000
32,000
36,000
01 02 03 04 05 06 07 08 09 10 11 12 13 14
RMB / Ton
50,000
100,000
150,000
200,000
250,000
300,000
350,000
400,000
450,000
01 02 03 04 05 06 07 08 09 10 11 12 13 14
RMB / Ton
2,000
3,000
4,000
5,000
6,000
7,000
8,000
9,000
10,000
01 02 03 04 05 06 07 08 09 10 11 12 13 14
RMB / Ton
3,000
4,000
5,000
6,000
7,000
8,000
9,000
10,000
11,000
01 02 03 04 05 06 07 08 09 10 11 12 13 14
RMB / Ton
2.0
2.5
3.0
3.5
4.0
4.5
5.0
5.5
6.0
01 02 03 04 05 06 07 08 09 10 11 12 13 14
RMB / Kg
1.752.002.252.502.753.003.253.503.754.004.254.504.755.00
01 02 03 04 05 06 07 08 09 10 11 12 13 14
RMB / Kg

30
Macro China Economics 16 December 2014
abc
Money and credit growth
October new loans came in at RMB548bn, below expectations of
RMB626bn and down from RMB857bn in September
Total Social Financing grew by RMB663bn, lower than
expectation of RMB888bn. Apart from RMB loans, most other
categories contracted
October M2 moderated further 12.6% from 12.9% on the back of
reduced willingness to lend as well as the deposit deviation rule
1. Loans vs money supply 2. Deposits vs loan growth
Source: CEIC, HSBC Source: CEIC, HSBC
3. FAI vs loan growth 4. New renminbi loans
Source: CEIC, HSBC Source: CEIC, HSBC
0
5
10
15
20
25
30
35
40
98 99 00 01 02 03 04 05 06 07 08 09 10 11 12 13 14
M1 M2 Loan
%y oy
-505
10152025303540
01 02 03 04 05 06 07 08 09 10 11 12 13 14
Deposit Household deposit
%y oy
510152025303540455055
04 05 06 07 08 09 10 11 12 13 14
Loan FAI
%y oy
-3000
300600900
1200150018002100
Mar
-08
Sep-
08
Mar
-09
Sep-
09
Mar
-10
Sep-
10
Mar
-11
Sep-
11
Mar
-12
Sep-
12
Mar
-13
Sep-
13
Mar
-14
Sep-
14
Medium & long termShort term and bill financingNew loan
RMB bn
New RMB loan

31
Macro China Economics 16 December 2014
abc
5. PBoC open market operations 6. Consumer credit
Source: Wind, HSBC Source: CEIC, HSBC
7. Loan-to-deposit ratio 8. Money supply vs price level
Source: CEIC, HSBC Source: CEIC, HSBC
9. M1-M2 gap vs CPI 10. Foreign reserves
Source: CEIC, HSBC Source: CEIC, HSBC
-2,000
-1,000
0
1,000
2,000
09 10 11 12 13 14
RMBbn
Liquidity injection Liquidity withdrawalNet position
10
20
30
40
50
60
70
08 09 10 11 12 13 14Consumer loan Loan
%y oy
60
65
70
75
80
85
90
95
98 99 00 01 02 03 04 05 06 07 08 09 10 11 12 13 14
Loan-to-deposit ratio
%
-2
0
2
4
6
8
10
05
1015202530354045
98 99 00 01 02 03 04 05 06 07 08 09 10 11 12 13 14
M1 (LHS) CPI (Lag by 6 months, RHS)
% y oy % y oy
-2
0
2
4
6
8
10
-15
-10
-5
0
5
10
15
01 02 03 04 05 06 07 08 09 10 11 12 13 14
M1-M2 gap (LHS) CPI (RHS)
% y oy % y oy
0
10
20
30
40
50
60
0500
1,0001,5002,0002,5003,0003,5004,0004,500
00 01 02 03 04 05 06 07 08 09 10 11 12 13 14
USD bn (LHS) %YoY (RHS)

32
Macro China Economics 16 December 2014
abc
Interest and exchange rates
The PBoC cut policy rates on 21 November 2014. The one-year
deposit rate was lowered by 25bp to 2.75% while the one year
lending rate was lowered by 40bp to 5.6%
The State Council published its deposit insurance scheme draft
regulations in end November
Our HSBC FX Strategist forecasts USD-CNY at 6.22 by end 2015
and 6.30 by end 2016
1. Lending vs savings rates 2. Required reserve ratio
Source: CEIC, HSBC Source: CEIC, HSBC
3. PBoC bill issuance and reference yield 4. Interbank rate
Source: CEIC, HSBC Source: CEIC, HSBC
0
1
2
3
4
5
6
7
8
00 01 02 03 04 05 06 07 08 09 10 11 12 13 14
1Y lending rate 1Y deposit rate
% p.a.
79
11131517192123
06 07 08 09 10 11 12 13 14
RRRLarge depository institutionSmall and medium depository institution
%
00.511.522.533.54
0100200300400500600700800900
1,000
05 06 07 08 09 10 11 12 13 14
PBoC total bill issuance (LHS)3M PBoC bill issuance ref. yld
% p.a.RMB bn
0
1
2
3
4
5
6
7
8
06 07 08 09 10 11 12 13 14
3M SHIBOR 3M CHIBOR
% p.a.
33
Macro China Economics 16 December 2014
abc
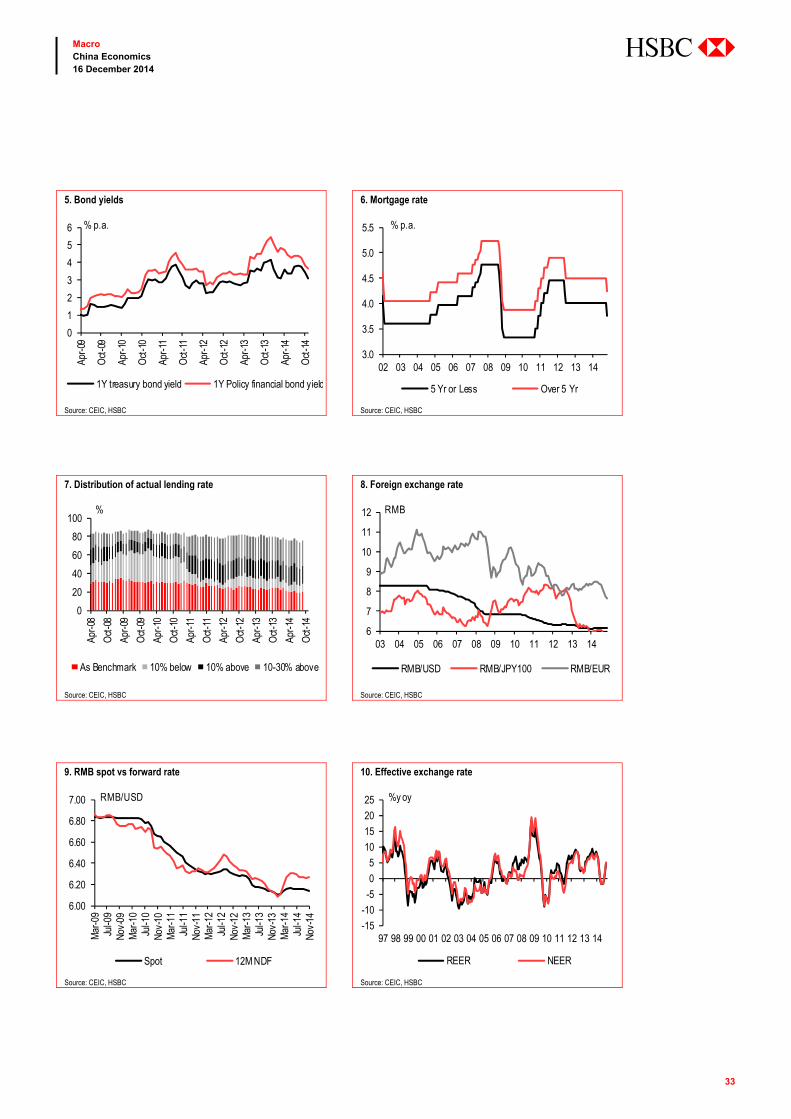
5. Bond yields 6. Mortgage rate
Source: CEIC, HSBC Source: CEIC, HSBC
7. Distribution of actual lending rate 8. Foreign exchange rate
Source: CEIC, HSBC Source: CEIC, HSBC
9. RMB spot vs forward rate 10. Effective exchange rate
Source: CEIC, HSBC Source: CEIC, HSBC
0
1
2
3
4
5
6
Apr-0
9
Oct
-09
Apr-1
0
Oct
-10
Apr-1
1
Oct
-11
Apr-1
2
Oct
-12
Apr-1
3
Oct
-13
Apr-1
4
Oct
-14
1Y treasury bond yield 1Y Policy financial bond yield
% p.a.
3.0
3.5
4.0
4.5
5.0
5.5
02 03 04 05 06 07 08 09 10 11 12 13 14
5 Yr or Less Over 5 Yr
% p.a.
0
20
40
60
80
100
Apr-0
8
Oct
-08
Apr-0
9
Oct
-09
Apr-1
0
Oct
-10
Apr-1
1
Oct
-11
Apr-1
2
Oct
-12
Apr-1
3
Oct
-13
Apr-1
4
Oct
-14
As Benchmark 10% below 10% above 10-30% above
%
6
7
8
9
10
11
12
03 04 05 06 07 08 09 10 11 12 13 14
RMB/USD RMB/JPY100 RMB/EUR
RMB
6.00
6.20
6.40
6.60
6.80
7.00
Mar
-09
Jul-0
9No
v-09
Mar
-10
Jul-1
0No
v-10
Mar
-11
Jul-1
1No
v-11
Mar
-12
Jul-1
2No
v-12
Mar
-13
Jul-1
3No
v-13
Mar
-14
Jul-1
4No
v-14
Spot 12M NDF
RMB/USD
-15
-10
-5
0
5
10
15
20
25
97 98 99 00 01 02 03 04 05 06 07 08 09 10 11 12 13 14
REER NEER
%y oy
34
Macro China Economics 16 December 2014
abc
Employment and income
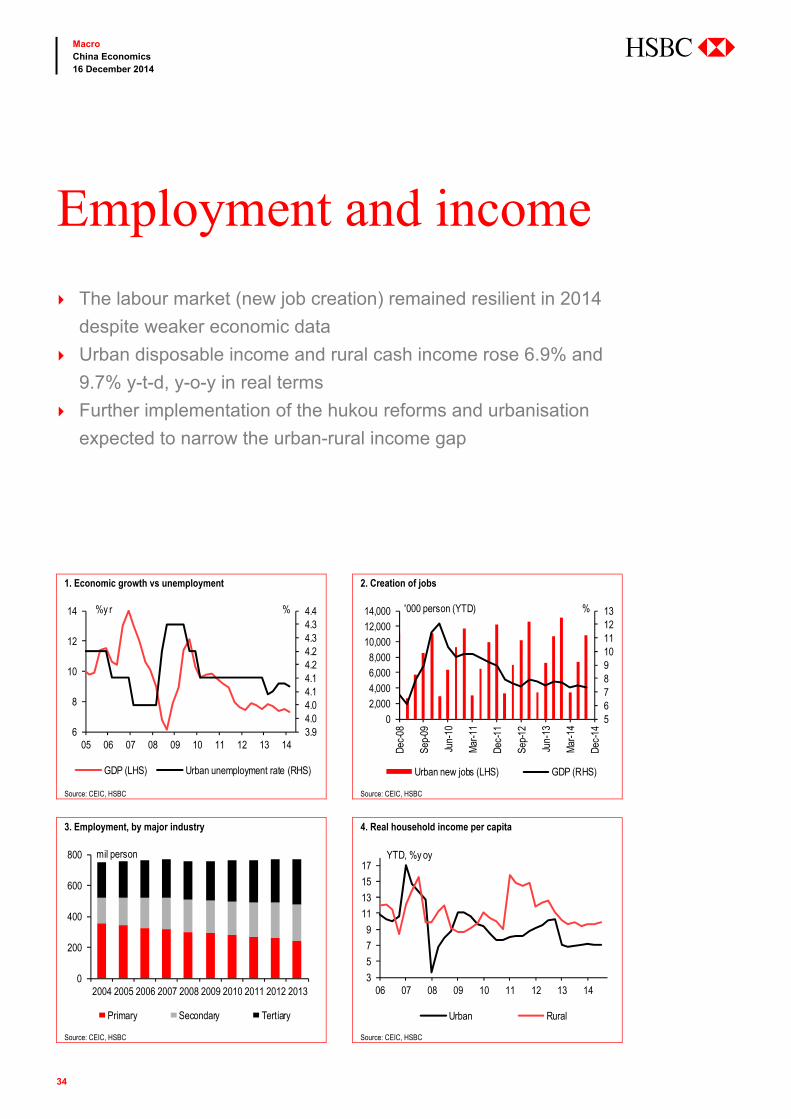
The labour market (new job creation) remained resilient in 2014
despite weaker economic data
Urban disposable income and rural cash income rose 6.9% and
9.7% y-t-d, y-o-y in real terms
Further implementation of the hukou reforms and urbanisation
expected to narrow the urban-rural income gap
1. Economic growth vs unemployment 2. Creation of jobs
Source: CEIC, HSBC Source: CEIC, HSBC
3. Employment, by major industry 4. Real household income per capita
Source: CEIC, HSBC Source: CEIC, HSBC
3.94.04.04.14.14.24.24.34.34.4
6
8
10
12
14
05 06 07 08 09 10 11 12 13 14
GDP (LHS) Urban unemployment rate (RHS)
%y r %
5678910111213
02,0004,0006,0008,000
10,00012,00014,000
Dec-
08
Sep-
09
Jun-
10
Mar
-11
Dec-
11
Sep-
12
Jun-
13
Mar
-14
Dec-
14
Urban new jobs (LHS) GDP (RHS)
'000 person (YTD) %
0
200
400
600
800
2004 2005 2006 2007 2008 2009 2010 2011 2012 2013
Primary Secondary Tertiary
mil person
3
5
7
9
11
13
15
17
06 07 08 09 10 11 12 13 14
Urban Rural
YTD, %y oy

35
Macro China Economics 16 December 2014
abc
5. Economic growth vs real wage growth 6. Average wage growth
Source: CEIC, HSBC Source: CEIC, HSBC
7. Wage growth, by enterprise 8. Wage growth, by region
Source: CEIC, HSBC Source: CEIC, HSBC
9. Household income distribution – Urban 10. Household income distribution – Rural
Source: CEIC, HSBC Source: CEIC, HSBC
579
111315171921
02 03 04 05 06 07 08 09 10 11 12 13 14
Real average wage growth (YTD) GDP
%y oy
8
12
16
20
02 03 04 05 06 07 08 09 10 11 12 13 14
Nominal Real
YTD, %y oy
5
10
15
20
25
07 08 09 10 11 12 13 14
SOE Collective owned units Others
YTD, %y oy
5
10
15
20
25
30
35
Sep-
02
Sep-
03
Sep-
04
Sep-
05
Sep-
06
Sep-
07
Sep-
08
Sep-
09
Sep-
10
Sep-
11
Sep-
12
Sep-
13
Sep-
14
Eastern Central Central
YTD, %y oy
0%
20%
40%
60%
80%
100%
2006 2007 2008 2009 2010 2011
<RMB25k RMB25-55K RMB55-85K >RMB85K
0%
20%
40%
60%
80%
100%
2009 2010 2011 2012
<RMB2K RMB2-10K RMB10-20K >RMB20K

36
Macro China Economics 16 December 2014
abc
Asset markets
The property market showed initial signs of stabilisation following
the relaxation of mortgage rules, but downside risks persist
The central government has published new land reform
procedures to pave the way for regulated rural land transaction
The stock market staged a sharp rally following the rate cuts from
the PBoC and further easing expectations
1. Stock indices 2. Stock index vs money supply
Source: CEIC, HSBC Source: CEIC, HSBC
3. Price-to-earnings ratio 4. Market capitalisation, by stock exchange
Source: CEIC, HSBC Source: CEIC, HSBC
0
1,000
2,000
3,000
4,000
5,000
6,000
98 99 00 01 02 03 04 05 06 07 08 09 10 11 12 13 14
Shanghai (SSE) Shenzhen (SZSE)
0
510
15
20
2530
35
40
-100
-50
0
50
100
150
200
250
98 99 00 01 02 03 04 05 06 07 08 09 10 11 12 13 14
SSE index (LHS) M1 (RHS)
%y oy %y oy
10
20
30
40
50
60
70
80
97 98 99 00 01 02 03 04 05 06 07 08 09 10 11 12 13 14
SSE SZSE
%
-
10,000
20,000
30,000
40,000
50,000
60,000
06 07 08 09 10 11 12 13 14
SSE SZSE
RMB bn
37
Macro China Economics 16 December 2014
abc
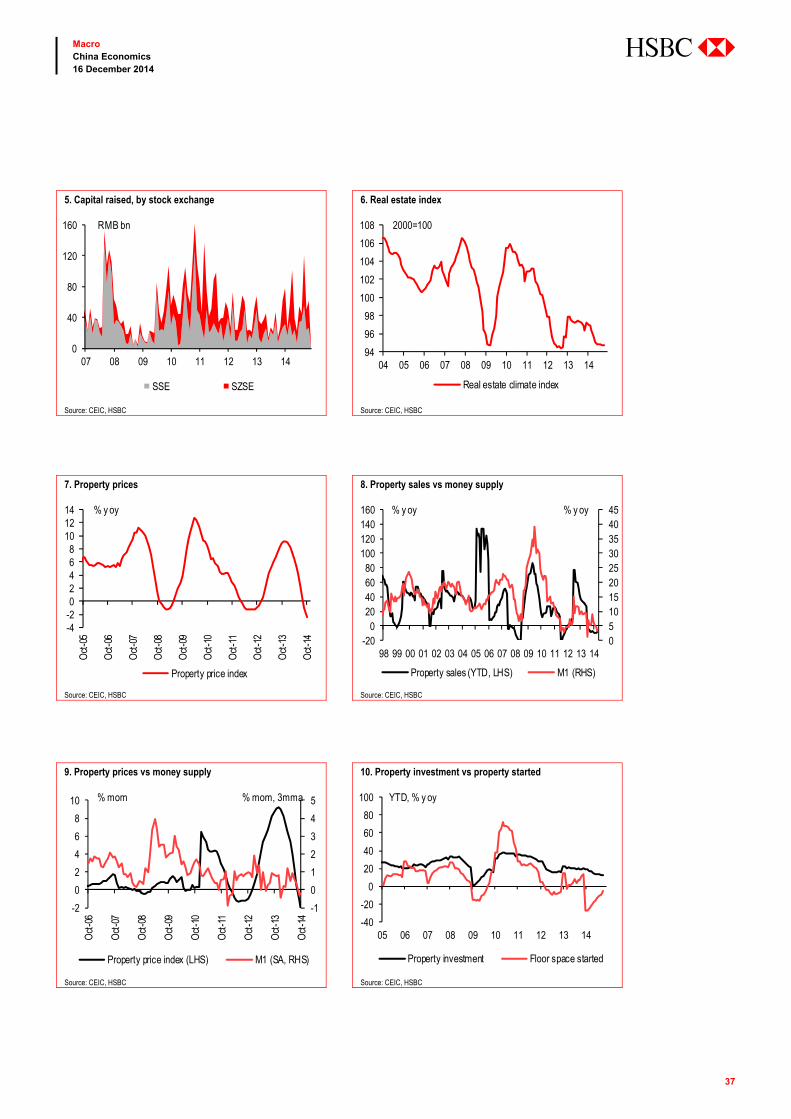
5. Capital raised, by stock exchange 6. Real estate index
Source: CEIC, HSBC Source: CEIC, HSBC
7. Property prices 8. Property sales vs money supply
Source: CEIC, HSBC Source: CEIC, HSBC
9. Property prices vs money supply 10. Property investment vs property started
Source: CEIC, HSBC Source: CEIC, HSBC
0
40
80
120
160
07 08 09 10 11 12 13 14
SSE SZSE
RMB bn
94
96
98
100
102
104
106
108
04 05 06 07 08 09 10 11 12 13 14
Real estate climate index
2000=100
-4-202468
101214
Oct
-05
Oct
-06
Oct
-07
Oct
-08
Oct
-09
Oct
-10
Oct
-11
Oct
-12
Oct
-13
Oct
-14
Property price index
% y oy
051015202530354045
-200
20406080
100120140160
98 99 00 01 02 03 04 05 06 07 08 09 10 11 12 13 14
Property sales (YTD, LHS) M1 (RHS)
% y oy % y oy
-1
0
1
2
3
4
5
-2
0
2
4
6
8
10
Oct
-06
Oct
-07
Oct
-08
Oct
-09
Oct
-10
Oct
-11
Oct
-12
Oct
-13
Oct
-14
Property price index (LHS) M1 (SA, RHS)
% mom % mom, 3mma
-40
-20
0
20
40
60
80
100
05 06 07 08 09 10 11 12 13 14
Property investment Floor space started
YTD, % y oy

38
Macro China Economics 16 December 2014
abc
This page intentionally left blank.

39
Macro China Economics 16 December 2014
abc
Data and forecasts

40
Macro China Economics 16 December 2014
abc
China Macro framework
2010 2011 2012 2013 2014f 2015f 2016f
Production, demand and employment GDP growth (% y-o-y) 10.4 9.3 7.7 7.7 7.5 7.3 7.4 Nominal GDP (USDbn) 5,938 7,323 8,283 9,265 10,232 11,012 11,901 GDP per capita (USD) 4,367 5,351 6,015 6,686 7,341 7,857 8,447 Nominal retail sales (% y-o-y) 18.5 17.1 14.3 13.1 12.8 13.2 13.2 Fixed asset investment (nominal, % y-o-y) 24.5 23.8 20.6 19.6 19.0 20.0 19.0 Industrial production (excl. small enterprises % y-o-y) -0.2 -0.4 1.0 0.3 0.5 0.6 0.6 Gross domestic saving (% GDP) 15.7 13.9 10.0 9.7 9.1 9.4 9.3 Unemployment rate, average (%) 51.8 50.9 50.5 50.2 49.6 49.0 48.4
Prices & wages CPI, average (% y-o-y) 3.3 5.4 2.7 2.6 2.4 1.8 1.9 CPI, end-year (% y-o-y) 4.6 4.1 2.5 2.9 2.7 2.1 2.2 PPI, end-year (% y-o-y) 5.9 1.7 1.9 -1.4 -1.0 -2.6 -1.8 Manufacturing wages, nominal (% y-o-y) 13.0 13.0 13.0 12.0 12.0 12.6 11.0
Money, FX & interest rates Central bank money M0, average (%) 12.1 16.0 9.6 9.4 6.0 7.0 6.0 Broad money supply M2, average (%) 23.7 16.4 13.4 14.8 13.5 12.0 12.0 Policy rate, end-year (%) 5.64 6.56 6.00 6.00 5.60 5.35 5.10 5yr yield, end-year (%) 6.16 6.90 6.40 6.40 3.58 3.20 4.00 RMB /USD, end-year 6.62 6.30 6.23 6.05 6.12 6.22 6.30 RMB /USD, average 6.76 6.46 6.27 6.14 6.12 6.21 6.29 RMB /EUR, end-year 8.87 8.17 8.22 8.34 7.65 7.15 7.06 RMB /EUR, average 8.92 8.93 8.10 8.12 8.19 7.41 7.12
External sector Merchandise exports (USDbn) 1,578 1,899 2,050 2,211 2,347 2,514 2,703 Merchandise imports (USDbn) 1,394 1,741 1,817 1,949 2,037 2,147 2,272 Trade balance (USDbn) 184.5 157.9 232.8 261.3 310.3 367.0 431.0 Current account balance (USDbn) 305 201 193 188 180 197 251 Current account balance (% GDP) 5.1 2.7 2.3 2.0 1.8 1.8 2.1 Net FDI (USDbn) 105.8 116.2 112.0 117.0 122.9 135.1 148.6 Net FDI (% GDP) 1.8 1.6 1.4 1.3 1.2 1.2 1.2 Current account balance plus FDI (% GDP) 6.9 4.3 3.7 3.3 3.0 3.0 3.4 Exports (% y-o-y) 31.4 20.3 7.9 7.8 6.2 7.1 7.5 Imports (% y-o-y) 38.6 24.9 4.4 7.3 4.5 5.4 5.8 International FX reserves (USDbn) 2,850 3,181 3,312 3,821 3,871 3,971 4,071 Import cover (months) 22.5 20.0 19.7 20.9 19.5 18.9 18.4
Public and external solvency indicators Commercial banks’ FX assets (USDbn) 128.1 147.5 167.3 187.7 N/A N/A N/A Gross external debt (USDbn) 548.9 695.0 737.0 830.9 950.9 1,070.9 1,190.9 Short-term external debt (% of int’l reserves) 13.2 15.7 16.3 16.8 18.9 20.4 21.9 Consolidated government balance (% GDP) -2.5 -1.1 -1.5 -1.9 -2.2 -2.5 -2.5
Source: HSBC

41
Macro China Economics 16 December 2014
abc
Notes

42
Macro China Economics 16 December 2014
abc
Disclosure appendix Analyst Certification The following analyst(s), economist(s), and/or strategist(s) who is(are) primarily responsible for this report, certifies(y) that the opinion(s) on the subject security(ies) or issuer(s) and/or any other views or forecasts expressed herein accurately reflect their personal view(s) and that no part of their compensation was, is or will be directly or indirectly related to the specific recommendation(s) or views contained in this research report: Hongbin Qu, Julia Wang and Jing Li
Important Disclosures This document has been prepared and is being distributed by the Research Department of HSBC and is intended solely for the clients of HSBC and is not for publication to other persons, whether through the press or by other means.
This document is for information purposes only and it should not be regarded as an offer to sell or as a solicitation of an offer to buy the securities or other investment products mentioned in it and/or to participate in any trading strategy. Advice in this document is general and should not be construed as personal advice, given it has been prepared without taking account of the objectives, financial situation or needs of any particular investor. Accordingly, investors should, before acting on the advice, consider the appropriateness of the advice, having regard to their objectives, financial situation and needs. If necessary, seek professional investment and tax advice.
Certain investment products mentioned in this document may not be eligible for sale in some states or countries, and they may not be suitable for all types of investors. Investors should consult with their HSBC representative regarding the suitability of the investment products mentioned in this document and take into account their specific investment objectives, financial situation or particular needs before making a commitment to purchase investment products.
The value of and the income produced by the investment products mentioned in this document may fluctuate, so that an investor may get back less than originally invested. Certain high-volatility investments can be subject to sudden and large falls in value that could equal or exceed the amount invested. Value and income from investment products may be adversely affected by exchange rates, interest rates, or other factors. Past performance of a particular investment product is not indicative of future results.
HSBC and its affiliates will from time to time sell to and buy from customers the securities/instruments (including derivatives) of companies covered in HSBC Research on a principal or agency basis.
Analysts, economists, and strategists are paid in part by reference to the profitability of HSBC which includes investment banking revenues.
Whether, or in what time frame, an update of this analysis will be published is not determined in advance.
For disclosures in respect of any company mentioned in this report, please see the most recently published report on that company available at www.hsbcnet.com/research.
Additional disclosures 1 This report is dated as at 16 December 2014. 2 All market data included in this report are dated as at close 12 December 2014, unless otherwise indicated in the report. 3 HSBC has procedures in place to identify and manage any potential conflicts of interest that arise in connection with its
Research business. HSBC’s analysts and its other staff who are involved in the preparation and dissemination of Research operate and have a management reporting line independent of HSBC’s Investment Banking business. Information Barrier procedures are in place between the Investment Banking and Research businesses to ensure that any confidential and/or price sensitive information is handled in an appropriate manner.

43
Macro China Economics 16 December 2014
abc
Disclaimer Legal entities as at 30 May 2014: ‘UAE’ HSBC Bank Middle East Limited, Dubai; ‘HK’ The Hongkong and Shanghai Banking Corporation Limited, Hong Kong; ‘TW’ HSBC Securities (Taiwan) Corporation Limited; ‘CA’ HSBC Bank Canada, Toronto; HSBC Bank, Paris Branch; HSBC France; ‘DE’ HSBC Trinkaus & Burkhardt AG, Düsseldorf; 000 HSBC Bank (RR), Moscow; ‘IN’ HSBC Securities and Capital Markets (India) Private Limited, Mumbai; ‘JP’ HSBC Securities (Japan) Limited, Tokyo; ‘EG’ HSBC Securities Egypt SAE, Cairo; ‘CN’ HSBC Investment Bank Asia Limited, Beijing Representative Office; The Hongkong and Shanghai Banking Corporation Limited, Singapore Branch; The Hongkong and Shanghai Banking Corporation Limited, Seoul Securities Branch; The Hongkong and Shanghai Banking Corporation Limited, Seoul Branch; HSBC Securities (South Africa) (Pty) Ltd, Johannesburg; HSBC Bank plc, London, Madrid, Milan, Stockholm, Tel Aviv; ‘US’ HSBC Securities (USA) Inc, New York; HSBC Yatirim Menkul Degerler AS, Istanbul; HSBC México, SA, Institución de Banca Múltiple, Grupo Financiero HSBC; HSBC Bank Brasil SA – Banco Múltiplo; HSBC Bank Australia Limited; HSBC Bank Argentina SA; HSBC Saudi Arabia Limited; The Hongkong and Shanghai Banking Corporation Limited, New Zealand Branch incorporated in Hong Kong SAR; The Hongkong and Shanghai Banking Corporation Limited, Bangkok Branch
Issuer of report
The Hongkong and Shanghai Banking Corporation Limited Level 19, 1 Queen’s Road Central
Hong Kong SAR
Telephone: +852 2843 9111
Telex: 75100 CAPEL HX
Fax: +852 2801 4138
Website: www.research.hsbc.com
The Hongkong and Shanghai Banking Corporation Limited (“HSBC”) has issued this research material. The Hongkong and Shanghai Banking Corporation Limited is regulated by the Hong Kong Monetary Authority. This material is distributed in the United Kingdom by HSBC Bank plc. In Australia, this publication has been distributed by The Hongkong and Shanghai Banking Corporation Limited (ABN 65 117 925 970, AFSL 301737) for the general information of its “wholesale” customers (as defined in the Corporations Act 2001). Where distributed to retail customers, this research is distributed by HSBC Bank Australia Limited (AFSL No. 232595). These respective entities make no representations that the products or services mentioned in this document are available to persons in Australia or are necessarily suitable for any particular person or appropriate in accordance with local law. No consideration has been given to the particular investment objectives, financial situation or particular needs of any recipient. This publication is distributed in New Zealand by The Hongkong and Shanghai Banking Corporation Limited, New Zealand Branch incorporated in Hong Kong SAR. This material is distributed in Japan by HSBC Securities (Japan) Limited. HSBC Securities (USA) Inc. accepts responsibility for the content of this research report prepared by its non-US foreign affiliate. All US persons receiving and/or accessing this report and intending to effect transactions in any security discussed herein should do so with HSBC Securities (USA) Inc. in the United States and not with its non-US foreign affiliate, the issuer of this report. In Korea, this publication is distributed by either The Hongkong and Shanghai Banking Corporation Limited, Seoul Securities Branch (“HBAP SLS”) or The Hongkong and Shanghai Banking Corporation Limited, Seoul Branch (“HBAP SEL”) for the general information of professional investors specified in Article 9 of the Financial Investment Services and Capital Markets Act (“FSCMA”). This publication is not a prospectus as defined in the FSCMA. It may not be further distributed in whole or in part for any purpose. Both HBAP SLS and HBAP SEL are regulated by the Financial Services Commission and the Financial Supervisory Service of Korea. In Singapore, this publication is distributed by The Hongkong and Shanghai Banking Corporation Limited, Singapore Branch for the general information of institutional investors or other persons specified in Sections 274 and 304 of the Securities and Futures Act (Chapter 289) (“SFA”) and accredited investors and other persons in accordance with the conditions specified in Sections 275 and 305 of the SFA. This publication is not a prospectus as defined in the SFA. It may not be further distributed in whole or in part for any purpose. The Hongkong and Shanghai Banking Corporation Limited Singapore Branch is regulated by the Monetary Authority of Singapore. Recipients in Singapore should contact a “Hongkong and Shanghai Banking Corporation Limited, Singapore Branch” representative in respect of any matters arising from, or in connection with this report. In the UK this material may only be distributed to institutional and professional customers and is not intended for private customers. It is not to be distributed or passed on, directly or indirectly, to any other person. HSBC México, S.A., Institución de Banca Múltiple, Grupo Financiero HSBC is authorized and regulated by Secretaría de Hacienda y Crédito Público and Comisión Nacional Bancaria y de Valores (CNBV). HSBC Bank (Panama) S.A. is regulated by Superintendencia de Bancos de Panama. Banco HSBC Honduras S.A. is regulated by Comisión Nacional de Bancos y Seguros (CNBS). Banco HSBC Salvadoreño, S.A. is regulated by Superintendencia del Sistema Financiero (SSF). HSBC Colombia S.A. is regulated by Superintendencia Financiera de Colombia. Banco HSBC Costa Rica S.A. is supervised by Superintendencia General de Entidades Financieras (SUGEF). Banistmo Nicaragua, S.A. is authorized and regulated by Superintendencia de Bancos y de Otras Instituciones Financieras (SIBOIF). Any recommendations contained in it are intended for the professional investors to whom it is distributed. This material is not and should not be construed as an offer to sell or the solicitation of an offer to purchase or subscribe for any investment. HSBC has based this document on information obtained from sources it believes to be reliable but which it has not independently verified; HSBC makes no guarantee, representation or warranty and accepts no responsibility or liability as to its accuracy or completeness. Expressions of opinion are those of HSBC only and are subject to change without notice. The decision and responsibility on whether or not to invest must be taken by the reader. HSBC and its affiliates and/or their officers, directors and employees may have positions in any securities mentioned in this document (or in any related investment) and may from time to time add to or dispose of any such securities (or investment). HSBC and its affiliates may act as market maker or have assumed an underwriting commitment in the securities of any companies discussed in this document (or in related investments), may sell them to or buy them from customers on a principal basis and may also perform or seek to perform banking or underwriting services for or relating to those companies. This material may not be further distributed in whole or in part for any purpose. No consideration has been given to the particular investment objectives, financial situation or particular needs of any recipient. (070905) In Canada, this document has been distributed by HSBC Bank Canada and/or its affiliates. Where this document contains market updates/overviews, or similar materials (collectively deemed “Commentary” in Canada although other affiliate jurisdictions may term “Commentary” as either “macro-research” or “research”), the Commentary is not an offer to sell, or a solicitation of an offer to sell or subscribe for, any financial product or instrument (including, without limitation, any currencies, securities, commodities or other financial instruments). © Copyright 2014, The Hongkong and Shanghai Banking Corporation Limited, ALL RIGHTS RESERVED. No part of this publication may be reproduced, stored in a retrieval system, or transmitted, on any form or by any means, electronic, mechanical, photocopying, recording, or otherwise, without the prior written permission of The Hongkong and Shanghai Banking Corporation Limited. MICA (P) 157/06/2014, MICA (P) 171/04/2014 and MICA (P) 077/01/2014
[441447]

abc
Global Stephen King Global Head of Economics +44 20 7991 6700 [email protected]
Karen Ward Senior Global Economist +44 20 7991 3692 [email protected]
James Pomeroy +44 20 7991 6714 [email protected]
Europe & United Kingdom Janet Henry Chief European Economist +44 20 7991 6711 [email protected]
Fabio Balboni European Economist +44 20 7992 0374 [email protected]
Simon Wells Chief UK Economist +44 20 7991 6718 [email protected]
Elizabeth Martins Economist +44 20 7991 2170 [email protected]
Germany Stefan Schilbe +49 211910 3137 [email protected]
Rainer Sartoris +49 211910 2470 [email protected]
France Mathilde Lemoine +33 1 4070 3266 [email protected]
Francois Letondu +33 1 4070 3933 [email protected]
North America Kevin Logan Chief US Economist +1 212 525 3195 [email protected]
Ryan Wang +1 212 525 3181 [email protected]
David G Watt +1 416 868 8130 [email protected]
Asia Pacific Qu Hongbin Managing Director, Co-head Asian Economics Research and Chief Economist Greater China +852 2822 2025 [email protected]
Frederic Neumann Managing Director, Co-head Asian Economics Research +852 2822 4556 [email protected]
Paul Bloxham Chief Economist, Australia and New Zealand +612 9255 2635 [email protected]
Pranjul Bhandari Chief Economist, India +91 22 2268 1841 [email protected]
Izumi Devalier +852 2822 1647 [email protected]
Su Sian Lim +65 6658 8783 [email protected]
Sophia Ma +86 10 5999 8232 [email protected]
Ronald Man +852 2996 6743 [email protected]
Trinh Nguyen +852 2996 6975 [email protected]
John Zhu +852 2996 6621 [email protected]
Joseph Incalcaterra +852 2822 4687 [email protected]
Julia Wang +852 3604 3663 [email protected]
Nalin Chutchotitham +662 614 4887 [email protected]
Daniel John Smith +612 9006 5729 [email protected]
Li Jing +86 10 5999 8240 [email protected]
Prithviraj Srinivas +91 22 2268 1076 [email protected]
Global Emerging Markets Murat Ulgen Global Head of Emerging Markets Research +44 20 7991 6782 [email protected]
Bertrand Delgado EM Strategist +1 212 525 0745 [email protected]
CEEMEA Simon Williams Chief Economist, CEEMEA +44 20 7718 9563 [email protected]
Alexander Morozov Chief Economist, Russia and CIS +7 495 783 8855 [email protected]
Artem Biryukov Economist, Russia and CIS +7 495 721 1515 [email protected]
Agata Urbanska-Giner Economist, CEE +44 20 7992 2774 [email protected]
Melis Metiner Chief Economist, Turkey +90 212 376 4618 [email protected]
David Faulkner Economist, South Africa +27 11 676 4569 [email protected]
Razan Nasser Economist, Middle East and North Africa +971 4 423 6928 [email protected]
Latin America Andre Loes Chief Economist, Latin America +55 11 3371 8184 [email protected]
Argentina Javier Finkman Chief Economist, South America ex-Brazil +54 11 4344 8144 [email protected]
Ramiro D Blazquez Senior Economist +54 11 4348 2616 [email protected]
Jorge Morgenstern Senior Economist +54 11 4130 9229 [email protected]
Brazil Constantin Jancso Senior Economist +55 11 3371 8183 [email protected]
Priscila Godoy Economist +55 11 3847 5190 [email protected]
Central America Lorena Dominguez Economist +52 55 5721 2172 [email protected]
Global Economics Research Team