macmahon holdings limited for personal use only
TRANSCRIPT

Macmahon Holdings Limited Full Year Results 2013
20 August 2013
For
per
sona
l use
onl
y

Mining focused strategy implemented with sale of construction business
effected in February
Consolidated net loss of $29.5 million greater than anticipated due to
provisions taken for disputed claims, doubtful debts and fixed asset
impairment
Net profit after tax of $43.6 million from continuing operations
Loss after tax of $73.1 million from discontinued construction business
Record mining revenue of ~$1.2 billion, profit before tax of $69.5 million
Strong cash flow from mining operations
Company’s largest ever contract award – 5 year, $1.8 billion Christmas
Creek Mine expansion
Order book of $3.2 billion, quality contracts with long-term blue-chip clients
Healthy balance sheet following $80.7 million equity raise – gearing at 15.4%
Business downsized – offices consolidated, support functions centralised,
cost savings achieved
Board renewal process commenced
2013 - Year in Review
2
645
466
674
880
1,173
2009 2010 2011 2012 2013
Mining revenue
Profit after tax from
continuing operations
528
1,530
1,079
1,968
3,167
2009 2010 2011 2012 2013
Mining order book
(4) 14
26
37
44
2009 2010 2011 2012 2013
For
per
sona
l use
onl
y

Awarded Macmahon’s largest mining contract in January 2013
• 5 year, $1.8 billion Christmas Creek Mine expansion
• Rapid ramp-up complete – 669 people on site, over 100 major items of
equipment commissioned
• Majority of equipment is client-owned – including the Komatsu 930E ultra-class
trucks. Macmahon capex ~$40 million
• Project remains LTI free
10 year, $900 million Tropicana Gold Project fully ramped up with third fleet
• 264 people on site
• Major equipment – 15 x 793 haul trucks, 4 x excavators, 3 x drill rigs
• Project remains LTI free
Record production at Orebody 18/Wheelara – extension discussions in advanced
stages
Operations at Eaglefield extended to Lenton pit following completion of Eaglefield
pit works – recorded six years LTI free
Completed works at Boddington Gold Mine, Orebody 24 and Area C
Operational Update – Surface Mining
3
For
per
sona
l use
onl
y

Operational Update – Underground Mining
Three year contract extension awarded at
Olympic Dam - 6th extension since first
contract award in 2004
Ranger 3 Deeps ramp-up complete, mine
decline progressing well – reaching 1,000
metres in July 2013
Argyle progressing on a reduced scope of
works
CSA Mine – settlement negotiations expected
to occur in early September
Completed development and production
works at Renison Tin Mine and raise drilling
works at Leinster and Ernest Henry
Shotcreting recorded six years LTI free
4
For
per
sona
l use
onl
y

Operational Update – International Ramp-up at Calabar, Nigeria progressing well
10 years of operation in South East Asia – one year extension awarded at Lhok Nga, Indonesia
Expansion opportunities with Lafarge being tendered in both Nigeria and Malaysia
Presence established in Ghana to pursue opportunities in Africa
Operations at Kanthan recorded 3,000 days LTI free, Ewekoro, Lhok Nga and Rawang recorded 1,000 days
LTI free, Calabar recorded one year LTI free
5
For
per
sona
l use
onl
y

Operational Update – Mongolia Mongolian coal industry stagnant due to lower coal prices being received from Chinese customers.
Production not at projected levels
Production at Tavan Tolgoi scaled back to match demand
ROM and border stockpiles full, with approximately 1.2 Mt of coal exposed in pit
Project remains LTI free
6
For
per
sona
l use
onl
y

Map of Operations
7
For
per
sona
l use
onl
y

People
679 employees transferred or made redundant
in sale of construction projects to Leighton
Group
Successful ramp-up for Christmas Creek and
Tropicana Gold Project complete – currently
933 people on site
Focus on right-sizing of organisation structure
– 65 corporate and mining overhead positions
made redundant
Centralised structure for functional services
adopted to increase efficiencies and reduce
duplication
Operator development program introduced at
Christmas Creek
Broad range of training opportunities provided
to staff
3,098 3,021
3,536
4,791
3,495
2009 2010 2011 2012 2013
Group employee numbers
Employee numbers by division
8
For
per
sona
l use
onl
y

• greater accountability at Executive level
• simplifying systems and processes
• bolstering education and training
• reaffirming safety focus
• striving for continuous improvement
Safety
Fatality recorded at CSA Mine Shaft in New South Wales
Kanthan, Malaysia recorded nine years LTI free
Eaglefield/Lenton and underground shotcreting operations recorded six years LTI free
3 day MacStart program launched – incorporates safety into all aspects of induction process
Safety improvement plan launched. Key initiatives include:
9
Safety performance
9
7.4
4.6 3.5
7.7 7.7
0.8 0.4 0.2 1.4 0.9
2009 2010 2011 2012 2013
Freq
uen
cy r
ate
(p
er m
illio
n h
ou
rs w
ork
ed)
TRIFR (Total Recordable Injury Frequency Rate)
LTIFR (Lost Time Injury Frequency Rate)
For
per
sona
l use
onl
y

Financials
For
per
sona
l use
onl
y

Income Statement
11
Note: Numbers in the table may not add due to rounding
$ millions 2013 2012 Change
Total revenue from continuing operations 1,173.4 880.1 33%
Earnings before interest and tax (EBIT) from continuing operations 84.5 62.6 35%
Interest (18.3) (13.3) 38%
Profit before tax from continuing operations 66.3 49.3 34%
Tax expense (22.7) (12.6) 80%
Profit after tax from continuing operations 43.6 36.7 19%
(Loss) / profit from discontinued operations (net of tax) (73.1) 19.3 (479%)
(Loss) / profit for the period attributable to equity holders of the Company (29.5) 56.1 (153%)
Profit after tax margin from continuing operations 3.7% 4.2%
Earnings per share – continuing operations (cents) 4.37 5.04 (13%)
(Loss)/earnings per share – consolidated (cents) (2.96) 7.68 (139%)
Dividends declared per share (cents) nil 4.0
For
per
sona
l use
onl
y

Profit Waterfall
12
$ million
12
56.1 36.7
(19.3) 24.1 19.8
(7.2) (19.7) (10.1)
(73.1)
43.6
(29.5)
-30.0-20.0-10.0
0.010.020.030.040.050.060.070.0
20
12
NP
AT
20
12
NP
AT
fro
md
isco
nti
nu
ed
op
erat
ion
s
20
12
NP
AT
fro
mco
nti
nu
ing
op
era
tio
ns
Min
ing
- V
olu
me
Min
ing
- M
argi
n
Pro
visi
on
s an
dim
pai
rme
nt
Co
rpo
rate
co
sts
Tax
20
13
NP
AT
fro
mco
nti
nu
ing
op
era
tio
ns
20
13
NP
AT
fro
md
isco
nti
nu
ed
op
erat
ion
s
20
13
NP
AT
Note: Numbers may not add due to rounding
For
per
sona
l use
onl
y

Mining Performance
13
Record revenue of $1.2 billion (up 33% on pcp)
following the commencement of mining operations
at Tropicana Gold Project and Christmas Creek
Mine expansion
Profit before tax of $69.5 million (down 4% on pcp)
Profit before tax margin lower due to provisions for
disputed claims recognised in 2013
Record order book of $3.2 billion following award of
$1.8 billion Christmas Creek contract
Capex increased to $197 million including ~$80
million for Tropicana and Christmas Creek
$ millions 2013 2012 Change
Segment revenue 1,173.4 880.1 33%
Profit before tax 69.5 72.3 (4%)
Profit before tax margin % 5.9 8.2
Order book 3,167 1,968 61%
Capex 197 134 47%
Revenue ($ million) and PBT margin
645
466
674
880
1,173
1.8%
7.5%
6.3%
8.2% 5.9%
0.0%
1.0%
2.0%
3.0%
4.0%
5.0%
6.0%
7.0%
8.0%
9.0%
-
200
400
600
800
1,000
1,200
1,400
2009 2010 2011 2012 2013
For
per
sona
l use
onl
y

Full year loss before tax of $126.0 million mainly attributable to Hope Downs 4, Solomon Rail Spur and
Urban Superway
Project completion and closure costs provisioned for in 2013 – no material impacts expected in 2014
Sale of majority of construction projects to Leighton Group approved by shareholders at EGM in
February 2013
Sale of Macmahon Rail assets to McConnell Dowell completed in May 2013
Sale proceeds of $33.6 million received, after tax profit on sale of $15.5 million
Majority of projects completed or novated
Construction fleet – $31.7 million transferred to mining, $22.4 million sold, $6.3 million remains held for
sale (net of impairment provision)
Exit from Construction – Discontinued Operations
$ millions 2013 2012
Segment revenue 581.7 990.7
(Loss) / profit before tax (126.0) 25.9
(Loss) / profit after tax (73.1) 19.3
Order book 63 1,171
14
For
per
sona
l use
onl
y

1. Includes $22.4 million for sale of construction assets and $36.8 million for sale and lease back of equipment
2. Excludes $9.3 million of plant and equipment acquired under finance leases and hire purchase (2012:$1.1 million)
Cash Flow
15
Operating cash flow increased due to approximately $60 million of debtors due in June 2012 paid in
early July 2012
Strong underlying cash flow from continuing mining operations of $117.9 million
Capital expenditure increased to $201.7 million in line with scheduled ramp-up at Tropicana and
Christmas Creek
$ millions 2013 2012 Change
EBITDA 67.5 167.8 (60%)
Net interest paid (18.8) (9.2) 104%
Income tax (paid) / refund (9.6) (4.8) 100%
Working capital and provisions 69.5 (67.0) 204%
Operating cash flow 108.6 86.8 25%
Proceeds from sale of assets 59.11 7.2 721%
Capital expenditure2 201.7 186.4 8%
Equity raising and DRP 83.4 -
Dividend paid (18.3) (10.9)
Cash on hand 153.5 134.9 14%
For
per
sona
l use
onl
y

Balance sheet strengthened following $80.7 million equity raising
Gearing 15.4% - expected to modestly increase in the short-term due mainly to final equipment purchases
for Tropicana
Capital investment programme will be managed tightly in market with ample equipment available
Bank guarantee lines reduced by $40.5 million with further reductions expected as construction projects are
completed or transferred. Syndicated bank facility now $434.5 million
Substantial facilities headroom available
Balance Sheet and Gearing
16
$ millions 2013 2012 Change
Current assets 435.3 528.9 (18%)
Non-current assets 509.2 460.1 11%
Total assets 944.5 989.0 (4%)
Net assets 401.2 356.8 12%
Net debt/(cash) 61.7 82.6 (25%)
Gearing (%) 15.4 23.1
0.6%
-12.9% -12.2%
23.1%
15.4%
Jun-09 Jun-10 Jun-11 Jun-12 Jun-13
Gearing
For
per
sona
l use
onl
y

Outlook F
or p
erso
nal u
se o
nly

Strategy
Refine core competencies
18
Strengthening our position as a leading provider of end-to-end mining services
Mining focused strategy (exit
construction sector)
End-to-end service model
– Surface Mining
– Underground Mining
– Engineering
– Infrastructure Services
– Plant and Maintenance
Diversification through geography,
commodity and service delivery
Focus on business fundamentals
Achieve sustainable growth
Extend existing mining contracts
Maximise asset utilisation
Deliver productivity and efficiency
gains through business
improvement
Strengthen business development
capability
Drive safety improvements
through education and training
Lift Indigenous participation
Maintain strong, long-term
relationships with blue-chip
clients
Pursue offshore opportunities
focusing on West Africa and Asia
Pursue growth in a controlled
and sustainable manner within
gearing limits
Deliver consistent and
sustainable returns for
Shareholders
18
For
per
sona
l use
onl
y

Ross Carroll
Chief Executive Officer and
Managing Director
Theresa Mlikota
Chief Financial Officer
Fraser Ramsay
Chief Operating Officer
Surface Mining and Infrastructure
Nick Cernotta
Chief Operating Officer
Underground Mining International and
Engineering
Robert Barker
Group General Manager
Market Development
David Todd
General Manager
HSEQ
Roger Hughes
Acting General Manager
Human Resources
New Management Team
19 19
Greg Miller Executive General
Manager
Underground Mining
For
per
sona
l use
onl
y

Market Conditions
20
Production of major commodities expected to
increase despite expected reduction in short-term
investment
Declining market conditions and downward
pressure on commodity prices have resulted in a
reduced domestic tendering pipeline and greater
competition for work
Offshore growth opportunities remain – regional
hubs established in Africa, South East Asia and
Central Asia to pursue new work
Increased availability of gear, tyres and people
Tendering pipeline of $3.9 billion (75% domestic,
25% international) Gold Production and Investment, Australia
Iron Ore Production and Investment, Australia
Coal Production and Investment, Australia
Source: BREE, BIS Shrapnel
For
per
sona
l use
onl
y
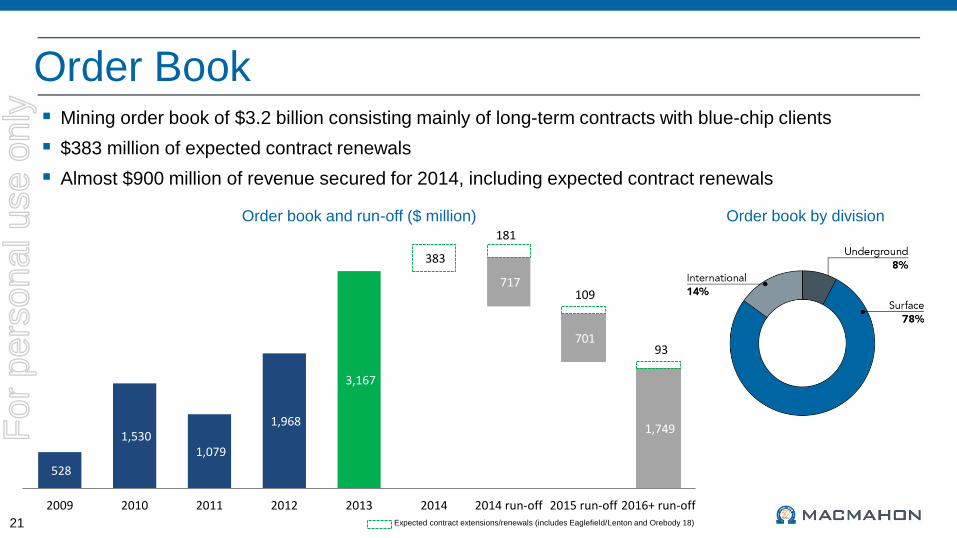
Expected contract extensions/renewals (includes Eaglefield/Lenton and Orebody 18)
Order Book
21
Mining order book of $3.2 billion consisting mainly of long-term contracts with blue-chip clients
$383 million of expected contract renewals
Almost $900 million of revenue secured for 2014, including expected contract renewals
Order book by division Order book and run-off ($ million)
528
1,530 1,079
1,968
3,167 2,683
2,651
1,749 1,749
383
701 93
717 109
181
2009 2010 2011 2012 2013 2014 2014 run-off 2015 run-off 2016+ run-off
For
per
sona
l use
onl
y

Business Outlook
22
Revenue outlook for 2014 expected to be in the range of $0.9 – 1.2 billion,
but remains at risk:
• Fewer new work opportunities
• Scope reductions and contract deferrals by customers
• Significant increase in competition
Margin pressure expected to continue
Focus on business improvement program including:
• Right-sizing the business
• Asset utilisation
• Cost reduction
• Supply contract renewal
Balance sheet and covenant management also a key focus:
• Capex will be managed downwards through utilisation of existing
capacity and low cost rental/lease options to $100 – 150 million
For
per
sona
l use
onl
y

Summary
For
per
sona
l use
onl
y

Summary 50 years of operation
Consolidated net loss of $29.5 million resulting from major construction losses
Record mining revenue and strong historical financial performance
Strong operating cash flow from mining operations - $117.9 million
Solid order book of $3.2 billion, backed by quality contracts with long-term blue-chip clients
Forecast $0.9 – 1.2 billion for 2014 revenue, but remains at risk
Sale of construction effected, removing significant uncertainty, risk and volatility
Healthy balance sheet and gearing (15.4% net debt to equity) following completion of $80.7 million
equity raising. Balance sheet management a priority
Significant cost savings achieved and continued focus on further reductions
Business development and margin improvement a priority to deliver consistent quality earnings and
increased returns to shareholders
24 24
For
per
sona
l use
onl
y

Macmahon Holdings Limited Full Year Results 2013
20 August 2013
For
per
sona
l use
onl
y

Construction Sale
26
$ millions Construction sale Rail assets sale Total
Contract consideration 22.2 - 22.2
Sale of assets 15.6 4.5 20.1
Employee entitlements transferred (4.8) (0.1) (4.9)
Working capital adjustments (4.0) 0.2 (3.8)
Total consideration 29.0 4.6 33.6
For
per
sona
l use
onl
y

Normalisation of 2013 Operating Cash Flow
27
$ millions Discontinued
operations
Continuing
operations Total
Operating cash flow (9.3) 117.9 108.6
Delayed 2012 debtors collected in 2013 (57.0) (7.0) (64.0)
Delayed 2013 debtors - 12.0 12.0
Other (5.4) - (5.4)
Normalised 2013 operating cash flow (71.7) 122.9 51.2
For
per
sona
l use
onl
y

Major Projects
28
Project Value Started
Christmas Creek (WA) $1.8 billion 2012
Orebody 18 / Wheelara (WA) $975 million 2006
Tropicana Project (WA) $900 million 2012
Eaglefield / Lenton (QLD) $550 million 2003
Olympic Dam (SA) $687 million 2004
Argyle Mine (WA) $376 million 2006
Tavan Tolgoi (Mongolia) US$250 million 2012
Calabar Quarry (Nigeria) US$126 million 2012 For
per
sona
l use
onl
y

Revenue and Order Book Diversity
29
2013 revenue by client 2013 revenue by commodity 2013 revenue by location
Order book by location Order book by client Order book by commodity
Note: Revenue and order book information presented on this page relates to mining activities only and excludes construction revenue and order book
For
per
sona
l use
onl
y

Disclaimer and Important Notice
30
This presentation contains forward looking statements that are subject to risk factors associated with the
mining and construction businesses. While Macmahon considers the assumptions on which these statements
are based to be reasonable, whether circumstances actually occur in accordance with these statements may
be affected by a variety of factors. These include, but are not limited to, levels of actual demand, currency
fluctuations, loss of market, industry competition, environmental risks, physical risks, legislative, fiscal and
regulatory developments, economic and financial market conditions in various countries and regions, political
risks, project delay or advancement, approvals and cost estimates. These could cause actual trends or results
to differ from the forward looking statements in this presentation.
All references to dollars, cents or $ in this presentation are to Australian currency, unless otherwise stated.
References to “Macmahon”, “the Company”, “the Group” or “the Macmahon Group” may be references to
Macmahon Holdings Ltd or its subsidiaries.
For
per
sona
l use
onl
y

Macmahon Holdings Limited Full Year Results 2013
20 August 2013
For
per
sona
l use
onl
y