mackay area transport modelling report july 2017
TRANSCRIPT

Mackay Regional Council
Mackay Area Transport
Modelling
Supporting the proposed Local Government Infrastructure Plan
v02
Final | 27 July 2017

v02 | Final | 27 July 2017| Arup
J:\251000\251706-00 MACKAY AREA TRANSPORT\WORK\INTERNAL\REPORTING\FINAL REPORTS\MACKAY LGIP SUPPORTING REPORT.DOCX
Document Verification
Job title Mackay Area Transport Modelling Job number
251709
Document title Supporting the proposed Local Government
Infrastructure Plan
File reference
Document ref v02
Revision Date Filename Mackay LGIP Report_v01.docx
Draft 1 19 May
2017
Description First draft
Prepared by Checked by Approved by
Name Wentworth Yao Roland Cathcart Roland Cathcart
Signature
Final 27 July
2017
Filename Mackay LGIP Supporting Report.docx Description Final report issue to MRC with addressed MRC comments
Prepared by Checked by Approved by
Name Wentworth Yao Roland Cathcart Roland Cathcart
Signature
Issue Document Verification with Document �
This report takes into account the particular
instructions and requirements of our client.
It is not intended for and should not be relied
upon by any third party and no responsibility
is undertaken to any third party.
Job number251709
Arup
Arup Pty Ltd ABN 18 000 966 165
Arup
Level 4, 108 Wickham Street
Fortitude Valley
QLD 4006
GPO Box 685 Brisbane QLD 4001
Australia
www.arup.com
Mackay Regional Council Mackay Area Transport ModellingSupporting the proposed Local Government Infrastructure Plan
v02 | Final | 27 July 2017| Arup
J:\251000\251706-00 MACKAY AREA TRANSPORT\WORK\INTERNAL\REPORTING\FINAL REPORTS\MACKAY LGIP SUPPORTING REPORT.DOCX
Contents
GLOSSARY 2
1 Introduction 3
1.1 Background 3
1.2 Purpose of this document 3
2 MATM Overview 4
2.1 Model development background 4
2.2 Model scope and key features 4
2.3 Model structure 5
2.4 Inputs from MGAM to MATM 5
2.5 Demand estimation 6
2.6 Model network 7
2.7 Model outputs 7
3 MATM Application 8
3.1 Methodology 8
3.2 Scenario network development 9
4 Result Discussion 10
5 Conclusion 14
5.1 Summary 14
5.2 Limitations of the study 15
Mackay Regional Council Mackay Area Transport ModellingSupporting the proposed Local Government Infrastructure Plan
v02 | Final | 27 July 2017| Arup
J:\251000\251706-00 MACKAY AREA TRANSPORT\WORK\INTERNAL\REPORTING\FINAL REPORTS\MACKAY LGIP SUPPORTING REPORT.DOCX
Page2
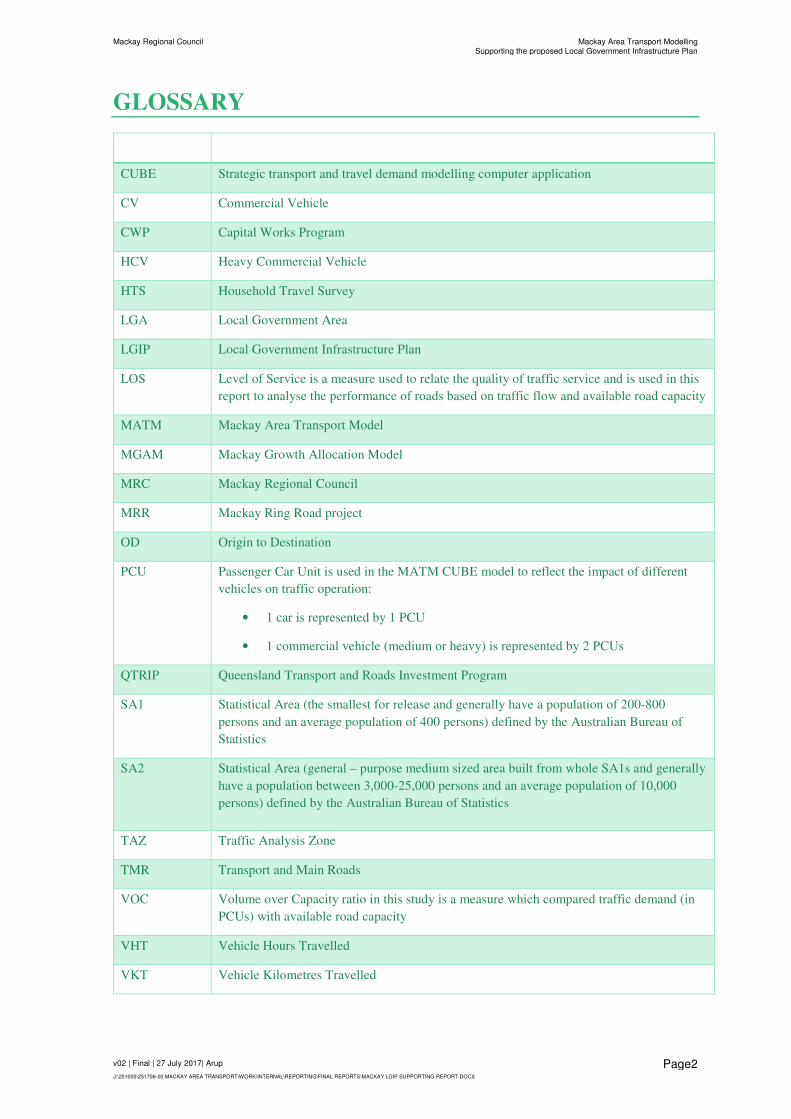
GLOSSARY
CUBE Strategic transport and travel demand modelling computer application
CV Commercial Vehicle
CWP Capital Works Program
HCV Heavy Commercial Vehicle
HTS Household Travel Survey
LGA Local Government Area
LGIP Local Government Infrastructure Plan
LOS Level of Service is a measure used to relate the quality of traffic service and is used in this
report to analyse the performance of roads based on traffic flow and available road capacity
MATM Mackay Area Transport Model
MGAM Mackay Growth Allocation Model
MRC Mackay Regional Council
MRR Mackay Ring Road project
OD Origin to Destination
PCU Passenger Car Unit is used in the MATM CUBE model to reflect the impact of different
vehicles on traffic operation:
• 1 car is represented by 1 PCU
• 1 commercial vehicle (medium or heavy) is represented by 2 PCUs
QTRIP Queensland Transport and Roads Investment Program
SA1 Statistical Area (the smallest for release and generally have a population of 200-800
persons and an average population of 400 persons) defined by the Australian Bureau of
Statistics
SA2 Statistical Area (general – purpose medium sized area built from whole SA1s and generally
have a population between 3,000-25,000 persons and an average population of 10,000
persons) defined by the Australian Bureau of Statistics
TAZ Traffic Analysis Zone
TMR Transport and Main Roads
VOC Volume over Capacity ratio in this study is a measure which compared traffic demand (in
PCUs) with available road capacity
VHT Vehicle Hours Travelled
VKT Vehicle Kilometres Travelled

Mackay Regional Council Mackay Area Transport ModellingSupporting the proposed Local Government Infrastructure Plan
v02 | Final | 27 July 2017| Arup
J:\251000\251706-00 MACKAY AREA TRANSPORT\WORK\INTERNAL\REPORTING\FINAL REPORTS\MACKAY LGIP SUPPORTING REPORT.DOCX
Page3
1 Introduction
1.1 Background
Arup has been engaged by Mackay Regional Council (MRC) to undertake future year road
network scenario tests using the Mackay Area Transport Model (MATM). The MATM has
been developed jointly by Transport and Main Roads (TMR) and MRC and used for their
individual planning purposes and future road network scenario development.
To inform land use inputs in the MATM, Council utilised the Mackay Growth Allocation
Model (MGAM). The MGAM details Mackay demographic information at the lot level
and the latest version of MGAM is based on Queensland Government Statistician’s Office
(QGSO) 2015 edition population forecasts. Figure 1-1 shows the QGSO’s 2015 edition
population forecast of the 'Low', 'Medium', and 'High' growth series up to 2036.
Figure 1-1 – QGSO 2015 edition population forecast
The road network scenarios that were tested using MATM were generally developed based
on planned infrastructure projects from the State government’s Queensland Transport and
Roads Investment Program (QTRIP), MRC’s Capital Works Program (CWP) and a
preliminary project list for consideration for the Local Government Infrastructure Plan
(LGIP) with the addition of longer term planning projects as advised by TMR.
The transport modelling work has been carried out for 2021, 2026, 2031 and 2036 to assist
in understanding future year road network requirements.
1.2 Purpose of this document
The purpose of this project was to identify priority projects for each modelled future year
to support Council’s future year network planning and the development of the LGIP. This
report documents an overview of MATM, the methodology in MATM implementation,
and the findings and conclusions based on model results. This report is intended to be used
by Mackay Regional Council to inform future road network planning and investment
decisions.
115,960 155,467
171,313
187,783
2011 2016 2021 2026 2031 2036
At 30 June
Low Medium High
Mackay (R) is projected to have a population
between 155,467 and 187,783 by 2036
Mackay Regional Council Mackay Area Transport ModellingSupporting the proposed Local Government Infrastructure Plan
v02 | Final | 27 July 2017| Arup
J:\251000\251706-00 MACKAY AREA TRANSPORT\WORK\INTERNAL\REPORTING\FINAL REPORTS\MACKAY LGIP SUPPORTING REPORT.DOCX
Page4
2 MATM Overview
2.1 Model development background
The MATM model is a strategic transport model developed using CUBE Voyager
software. It follows a typical four-step strategic transport modelling structure with fixed
mode choice assumptions. The four steps include Trip Generation, Trip Distribution, Mode
and Time Period Split and Traffic Assignment.
The model was originally developed in 2011 to support the development of the Mackay
Ring Road project (MRR) for TMR. Since then, it has been progressively updated
including the inclusion of junction delay modelling and recalibration to the 2011 census
population. TMR and MRC have continued to use the MATM for their individual planning
purposes with different model versions and scenarios developed.
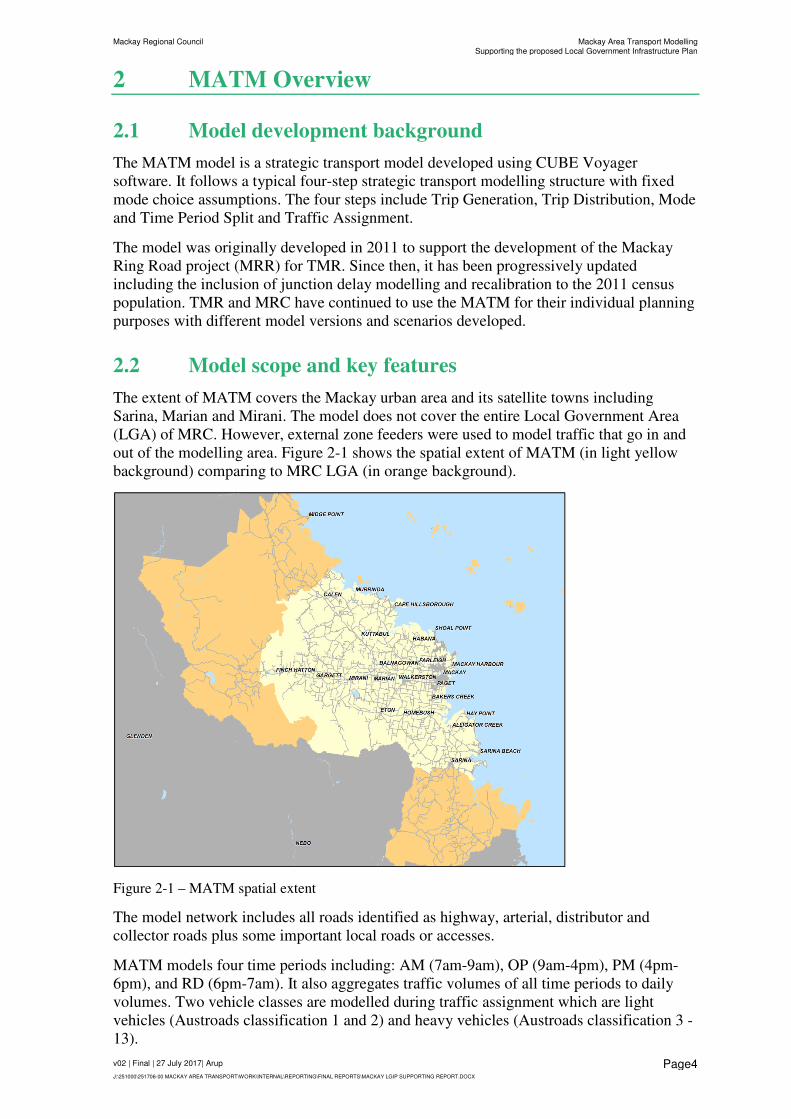
2.2 Model scope and key features
The extent of MATM covers the Mackay urban area and its satellite towns including
Sarina, Marian and Mirani. The model does not cover the entire Local Government Area
(LGA) of MRC. However, external zone feeders were used to model traffic that go in and
out of the modelling area. Figure 2-1 shows the spatial extent of MATM (in light yellow
background) comparing to MRC LGA (in orange background).
Figure 2-1 – MATM spatial extent
The model network includes all roads identified as highway, arterial, distributor and
collector roads plus some important local roads or accesses.
MATM models four time periods including: AM (7am-9am), OP (9am-4pm), PM (4pm-
6pm), and RD (6pm-7am). It also aggregates traffic volumes of all time periods to daily
volumes. Two vehicle classes are modelled during traffic assignment which are light
vehicles (Austroads classification 1 and 2) and heavy vehicles (Austroads classification 3 -
13).

Mackay Regional Council Mackay Area Transport ModellingSupporting the proposed Local Government Infrastructure Plan
v02 | Final | 27 July 2017| Arup
J:\251000\251706-00 MACKAY AREA TRANSPORT\WORK\INTERNAL\REPORTING\FINAL REPORTS\MACKAY LGIP SUPPORTING REPORT.DOCX
Page5
2.3 Model structure
The flowchart in Figure 2-2 summarises the modelling process in MATM. The
demographic and land use inputs are required for trip generation process, and the network
inputs with specifications of link attributes are required for the time period traffic
assignment process.
TMR undertook a Household Travel Survey (HTS) in 2010 and the survey data was used
to estimate demand relationships for MATM including trip generation, distribution, mode
shares, time period factors and vehicle occupancy for personal travel.
Figure 2-2 – MATM model convolution flowchart
2.4 Inputs from MGAM to MATM
The demographic and land use data from MGAM are one of the key inputs for MATM.
MGAM provides information at the lot level, so the data was firstly aggregated to the
traffic analysis zone (TAZ) according to the geographical boundaries in MTAM. The data
was then formatted to meet the MATM requirements with additional details in
demographic categorisation.
MATM requires more detail information than is available from MGAM, including
information about the population’s age profile and employment by job type. MGAM
population and jobs data are the used, augmented with additional detail using proportions
from the TMR MATM demography dataset (TMR MATM, 2012). As enrolment data and
visitor data is also not available from MGAM, TMR MATM input files are used, adjusted

Mackay Regional Council Mackay Area Transport ModellingSupporting the proposed Local Government Infrastructure Plan
v02 | Final | 27 July 2017| Arup
J:\251000\251706-00 MACKAY AREA TRANSPORT\WORK\INTERNAL\REPORTING\FINAL REPORTS\MACKAY LGIP SUPPORTING REPORT.DOCX
Page6
in line with MGAM population. A number of schools were identified as not following a
normal growth pattern, as such the relevant zones were adjusted specifically with revised
target enrolment values for relevant years.
On the other hand, MGAM provides more detailed employment categorisation information
than the MATM’s requirement. A correlation defined by Council was used to cluster the
detailed MGAM employment types into five main categories used in MATM. In addition,
a 'mining' job type has been subtracted from the 'industry' job type based on the
proportions informed in TMR MATM dataset. MATM requires jobs in blue and white
collar split for each job type. In this case, the same split proportions of blue and white
collar jobs have been adopted from TMR MATM. MGAM population and employment
forecast have been summarised in tables in Appendix A.
2.5 Demand estimation
Trip generation
Demand for some travel purposes is better correlated to the characteristics of households
rather than population characteristics. The segmentation sub-model converts the forecast
planning data zonal estimates into households by type, where type refers to the number of
workers and the age of dependents in each household category. During the model
development, the household category relationships were not available for Mackay, so the
relationships used in other QLD models (i.e. Brisbane Strategic Transport Model - BSTM)
were adopt to estimate the number of households in each category. The resulting
proportions were compared with the proportions observed in the HTS which showed a
reasonable match.
Tip production coefficients were estimated separately for residents living in the urban areas
and residents living in the rural areas. Analysis of the HTS datasets showed that trip rates
from rural households were around 10% lower than household in urban area. Unlike trip
productions, coefficients for trip attractions were not separable by region, as statistically
sensible and robust relationships could not be estimated. The trip production and attraction
rates are presented in Appendix B.
The trip generation rates were calibrated using Mackay 2010 HTS and TMR 2011
demography datasets for the model base year 2011. Travel demand relationships for
private vehicle travel are developed from this data. Other sources of observed data used in
model development (calibration and validation) include:
- Special generator traffic count surveys – Port, Airport, Paget Industrial Area, major
shopping centres and hospital.
- Camera O-D survey in Mackay, providing direct observation of external to external
movements in MATM, as well as partial origin – destination data with MATM.
- Screenline link volumes and travel times.
Relationships for heavy commercial vehicles (HCV) were developed from local data
sources for the key heavy vehicle generators in Mackay (Port and Paget) and then
elsewhere in the model area, travel demand relationships were adapted from relationships
used in the BSTM. The relationships were then calibrated to match observed heavy vehicle
movements, including the camera origin-destination data.
Trip distribution
The trip distribution was calibrated to match the observed and modelled trip length
distribution curve as well as the average trip length by each travel purpose. Further

Mackay Regional Council Mackay Area Transport ModellingSupporting the proposed Local Government Infrastructure Plan
v02 | Final | 27 July 2017| Arup
J:\251000\251706-00 MACKAY AREA TRANSPORT\WORK\INTERNAL\REPORTING\FINAL REPORTS\MACKAY LGIP SUPPORTING REPORT.DOCX
Page7
calibration check was undertaken to compare HTS observed movements and modelled
sector to sector movements to ensure movement pattern matching well.
Mode Share
MATM does not predict mode share; instead the person trips estimated from trip
generation step are firstly proportioned to motorised (car and bus) and non-motorised
(walk or cycle modes), using proportions input to the model by the model user. The base
year mode share inputs are based on the HTS 2011 survey proportions. These proportions
can be varied to test future alternative mode share scenarios, which affect the overall
proportion of trip by mode (motorised or non-motorised).
Time Period
Daily trip tables are proportioned to modelled time period using time period factors which
vary by trip purpose. Factors are based on observed proportions in the HTS 2011.
Vehicle Occupancy
Person trips made by light vehicles are converted to vehicle trips using vehicle occupancy
rates based on observed values in HTS 2011 for each trip purpose.
External Traffic
There are six external zones defined in MATM. Those include Bruce Highway north &
Bruce Highway south, Peak Downs Highway, Mackay-Eungella Road, West Plane Creek
Road and Sarina-Marlborough Road. Inputs to the model are the base year 2011 traffic
count at these external stations and then assumptions about future growth.
2.6 Model network
The road network, as the supply input to cater for the estimated demand, was implemented
at the last step / assignment step of the modelling process. The base year network was
established and calibrated to reflect the 2011 base year travel condition. Calibration checks
were undertaken to compare modelled traffic volumes to the counts along 10 screenlines
and modelled peak travel time to the observed for 9 travel routes in both directions.
MATM network includes all road links identified as highway, arterial, distributor and
collectors inside the model area, as well as some important local roads. MATM also takes
account of intersection delays within the urban area, at a strategic level, i.e. intersection
control type with simplified intersection layout and geometry.
As a part of this project, MATM was used to test the future year network scenarios. The
details of MATM implementation is discussed in Section 3 of this document.
2.7 Model outputs
The model contains a range of standardised report forms including maps, tables and charts.
Maps are produced in ArcGIS, using the model output data. Table and chart measures are
calculated and reported in an Excel workbook linked to the model output data.
The travel demand measures include modelled total demand, total number of trips by broad
geographic sectors, VKT VHT totals, average trip length by purpose, aggregated LOS
measures. The road network performance measures include screenline volume growth,
modelled AM, PM and daily link volumes, proportion of HV, modelled volume over
capacity ratios (VOC), average intersection delays, difference between modelled and
designate road hierarchy, travel time and travel speed.

Mackay Regional Council Mackay Area Transport ModellingSupporting the proposed Local Government Infrastructure Plan
v02 | Final | 27 July 2017| Arup
J:\251000\251706-00 MACKAY AREA TRANSPORT\WORK\INTERNAL\REPORTING\FINAL REPORTS\MACKAY LGIP SUPPORTING REPORT.DOCX
Page8
3 MATM Application
During this project, MGAM demographic and land use data has been firstly reviewed to
ensure it was in line with QGSO’s latest projection, and the input format met with
MATM's requirements.
The other model input parameters and factors were maintained as the base year 2011
calibration, i.e. trip generation factors, and trip distribution parameters of the gravity
model. The mode choice and time period factors were assumed to remain the same as the
base year 2011 into the future years.
3.1 Methodology
The methodology for developing MATM future year option scenarios was developed as
illustrated in the flow chart in Figure 3-1.
Figure 3-1 – Network scenario development flowchart
The methodology is summarised as follows:
• The initial 2021 base case scenario was developed utilising the 2021 demographic
and land use inputs from MGAM, and with a ‘do minimum’ network comprising of
completed and committed projects based on QTRIP and CWP.
• The model run result for the 2021 base case was analysed to understand network
deficiencies that indicated the improvements required to resolve network level of
service (LOS) deficiencies for relevant links. The 2021 network with improvements
was then tested and a final set of improvements became the 2021 do something
scenario. This was then used as the base case network for 2026, 2031 and 2036
testing.
• The future year base case scenario model runs were undertaken with the MGAM
demographic and land use inputs of each relevant year. Model run results were
2021 base case
scenario MGAM land use
‘medium growth
QTRIP, CWP &
LGIP committed
projects by 2021
2021 do something
scenario Projects indicated by
LOS criteria
2026-2036 base case
scenario
2026-2036 do
something scenarios Projects indicated by
LOS criteria
Prioritised project list
2026-2036
2026-2036
land use
2021
land use Model runs
Model runs
Model runs
Mackay Regional Council Mackay Area Transport ModellingSupporting the proposed Local Government Infrastructure Plan
v02 | Final | 27 July 2017| Arup
J:\251000\251706-00 MACKAY AREA TRANSPORT\WORK\INTERNAL\REPORTING\FINAL REPORTS\MACKAY LGIP SUPPORTING REPORT.DOCX
Page9
analysed to understand locations with LOS deficiencies to identify potential
upgrades and the likely timing of each.
• Key projects either from the identified project list or indicated by MRC / TMR as
additional strategic network improvements were tested individually under the 2036
base case model to understand the individual impact of each project.
• Scenario networks were with combinations of different individual projects. Model
runs results of each scenario were analysed to understand the network benefit and
comparisons were carried out to evaluate the scenarios.
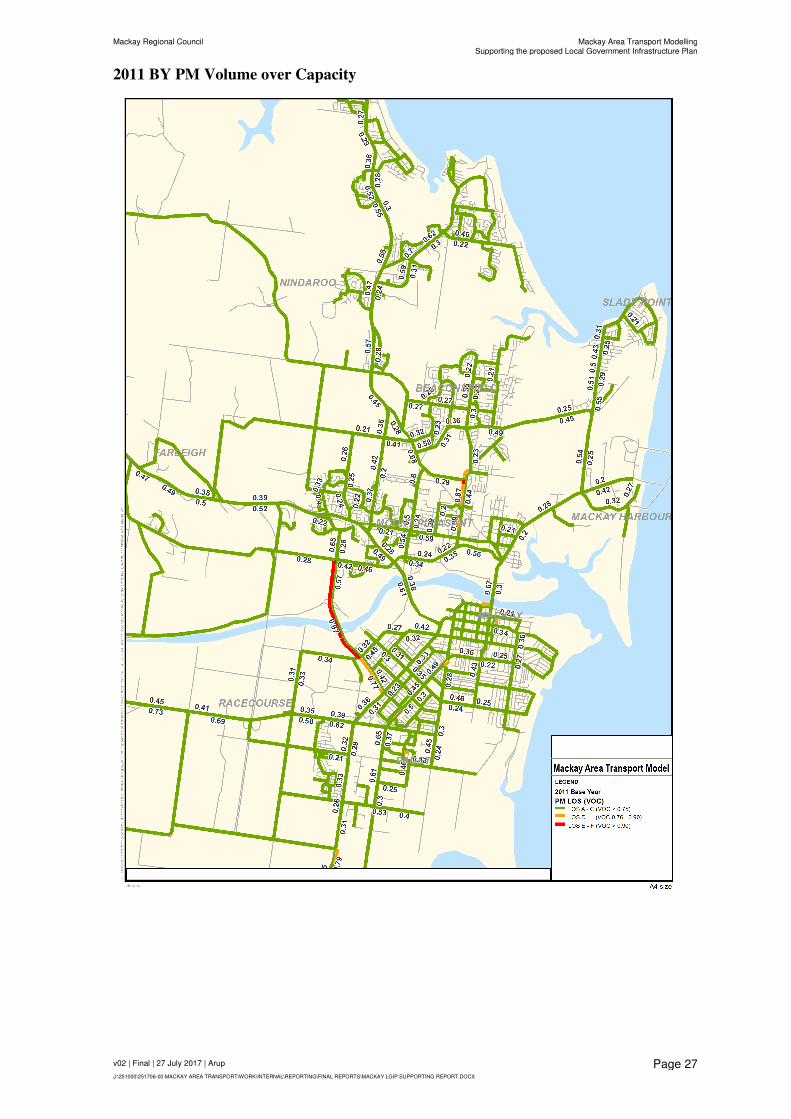
Level of service (LOS) criteria based on volume over capacity ratio (VOC) is commonly
used to define link performance using assigned vehicle volumes. LOS of D and E were
applied during the study to indicate potential traffic congestion issues in the Mackay future
year network, and hence to inform locations which would require network or intersection
upgrades. The VOC criteria and its relationship to LOS is presented in Appendix C.
3.2 Scenario network development
The 2021 Base Case network was developed from 2011 base year calibrated network with
inclusion of committed projects by 2021, as well as those projects already been constructed
to date. The project list for the 2021 Base Case network upgrades is presented in
Appendix D.
The 2021 Base Case scenario was tested to understand how the Mackay Road network
would perform in the short term future under the currently planned network schemes
(projects with committed funding), and further to identify any residual deficiency in the
network requiring additional upgrades. The additional network upgrades were then added
to the 2021 Base Case network to develop the 2021 Do Something network.
The final 2021 DS network was then used as the base case network for 2026, 2031 and
2036. This provided an understanding of network deficiency ultimately in 2036 and when
and where the network would start underperforming in earlier years. The approach also
provided an indicative timing understanding for the network upgrade requirements.
Different combinations of alternative improvements were tested respectively in order to
achieve more desirable network outcomes. This process resulted in a preferred project list
that would be further analysed to understand implementation timing. The project list is
discussed in Section 4 of this document.
These findings were used to support the development of Local Government Infrastructure
Plan. For the purpose of this project, the QTRIP, CWP and the preliminary project list
were used as the basis to develop the future year network options in Mackay.

Mackay Regional Council Mackay Area Transport ModellingSupporting the proposed Local Government Infrastructure Plan
v02 | Final | 27 July 2017| Arup
J:\251000\251706-00 MACKAY AREA TRANSPORT\WORK\INTERNAL\REPORTING\FINAL REPORTS\MACKAY LGIP SUPPORTING REPORT.DOCX
Page10
4 Result Discussion
4.1.1 Traffic demand
Based on the methodology described in Section 3, scenario model runs were carried out for
2021 first to understand the network performance in the base case and where additional
network upgrades are required.
The model results indicate the 2021 Base Case network will generally perform
satisfactorily with LOS A to D. The only location with LOS issue in the 2021 BC is Bruce
Highway South section between Homebush Road and Temples Lane with VOC ratio
between 0.82 – 0.91 and LOS E. An upgrade of this Bruce Highway section was tested in
the 2021 Do Something scenario showed that the network would perform with all roads
operating below or at LOS D in 2021.
Since the networks are the same in the future year base case scenarios, the demand will
drive the model outcomes in determining the deficiencies in the network and locations
where require improvements to accommodate the demand growth.
Table 4-1 shows the 2021 to 2036 estimated daily total vehicle demand (lights and heavies)
by report sectors as trip origins. The overall modelled vehicle demand has a compounding
growth of 0.4% per annum from 2011 to 2021. This is in line with the combined effect of
0.9% annum population growth with -0.5% annum job growth between 2011 and 2021
(refer to Appendix A). The demand growth will increase in later years with 1.0% per
annum growth from 2026 to 2031, and then 1.1% per annum onwards to 2036. This is due
to the both population and jobs growth that are forecast to have higher growth from 2026
onwards.
Table 4-1 – 2011 – 2036 daily total vehicle demand by report sector
Sector
ID
Report Sector 2011 2021 2026 2031 2036
Origins Origins Origins Origins Origins
2 Regional – North West 12,943 12,594 12,926 13,335 13,661
1 Rural View (include Shoal Point Bucasia) 20,463 32,639 38,710 44,650 51,702
3 North Mackay 91,821 93,571 99,424 105,348 110,010
5 Port 7,077 7,169 7,319 7,803 8,635
10 Mackay CBD 101,955 89,298 94,153 101,023 109,515
9 Ooralea 5,297 9,658 13,168 18,564 21,160
6 Paget 24,424 26,181 26,678 28,244 32,604
4 Rosella 3,469 2,794 3,117 3,245 3,379
7 Regional – South West 18,253 22,464 23,661 25,126 26,511
8 Regional – South Mackay 23,614 24,951 26,111 28,817 31,069
11-16 Externals 8,948 9,881 10,667 11,709 12,759
Total 318,265 331,200 335,936 387,862 421,006
Growth (from 2011 per annum) 0.4% 0.7% 1.0% 1.1%
At the detailed sector level, from 2011 to 2021, the model indicates a reduction of traffic in
the Mackay CBD as a result of jobs reduction in this area. On the other hand, the increase
of traffic in Rural View and Ooralea is because of the increase of population or jobs or
both in these areas. Between 2011 and 2036, the model indicates significant traffic growth
will take place in Rural View and Ooralea sectors which results in an overall 150% daily
traffic increase in Rural View, and 300% increase in Ooralea. The majority of the growth
in Ooralea will take place between 2021 and 2031 with ~9,000 daily vehicle increase. The

Mackay Regional Council Mackay Area Transport ModellingSupporting the proposed Local Government Infrastructure Plan
v02 | Final | 27 July 2017| Arup
J:\251000\251706-00 MACKAY AREA TRANSPORT\WORK\INTERNAL\REPORTING\FINAL REPORTS\MACKAY LGIP SUPPORTING REPORT.DOCX
Page11
growth in Rural View will be more evenly distributed across the years with a total of
~19,000 daily vehicle increase from 2021 to 2036.
North Mackay will also have significant growth in absolute numbers with a total increase
of ~18,000 daily vehicle demand. However, given it has a large demand to begin with in
base year 2011, the growth is relatively small percentage wise with 20% from 2011 to
2036.
Figure 4-1 shows the geographical boundaries of the above report sectors.
Figure 4-1 – Report sector boundary
4.1.2 Network results
The model network results for the 2021 to 2036 Base Case scenarios are presented in
Appendix E. It reports the daily link volumes, PM peak VOC and average intersection
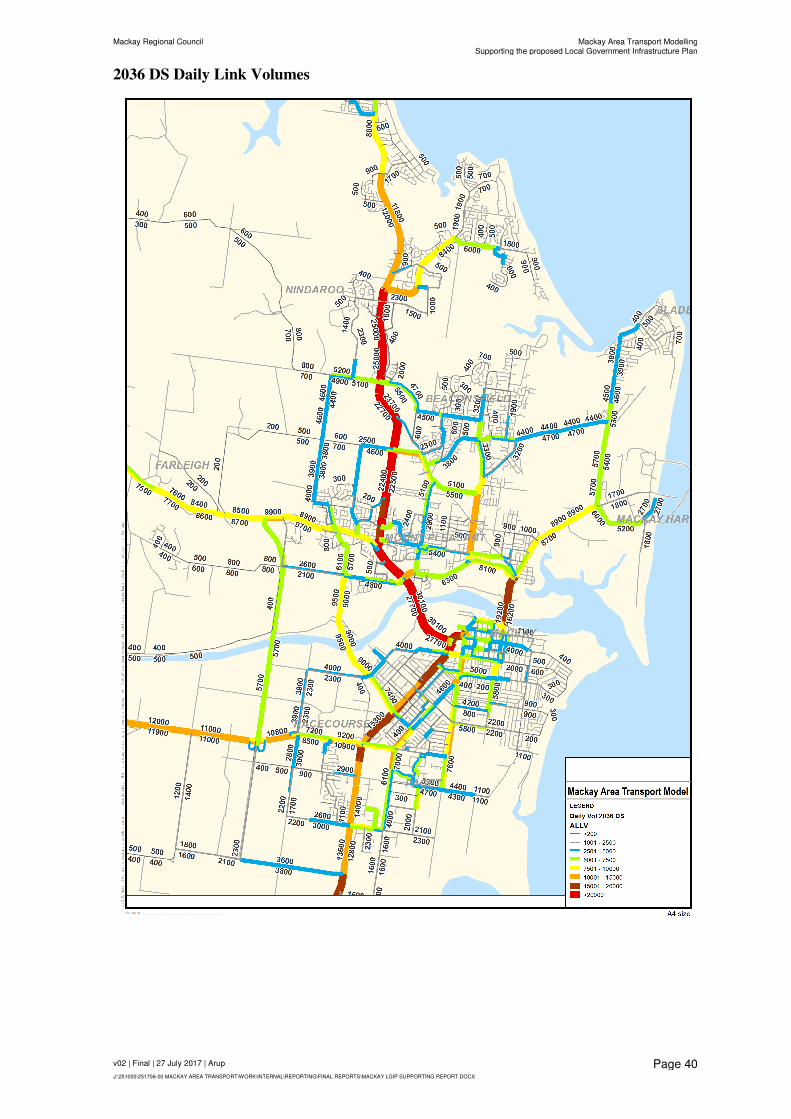
delays with focus in the Mackay urban area. By comparing the daily volume plots, it shows
a strong and steady growth in traffic originated from the Rural View and Ooralea areas.
The traffic growth from Rural View area will be loaded onto Mackay-Bucasia Road, with
an overall increase of 23,500 daily vehicle trips (in both directions) from 2011 to 2036.
The increased traffic will also distribute to the other parallel routes to access Mackay CBD
and other destinations.
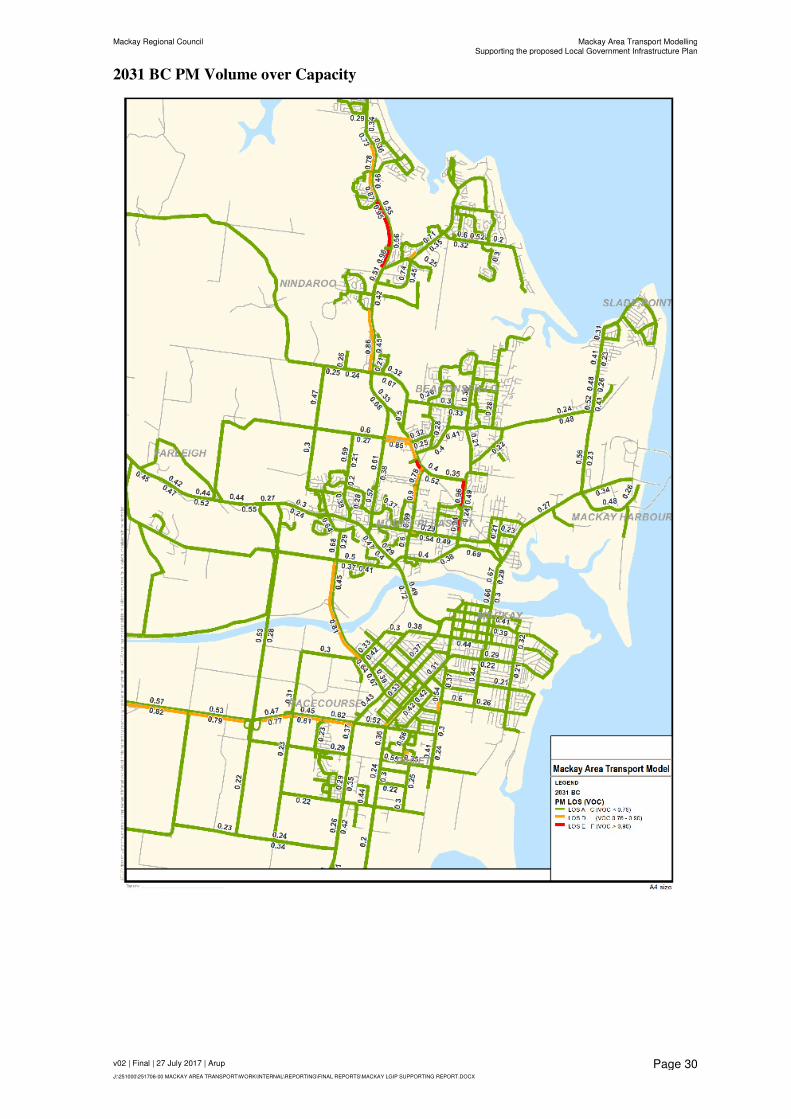
In terms of the PM peak VOC ratios of each modelled future years, it shows the links in
Mackay north area will progressively have congestion issues with traffic growth, especially
on those links carrying traffic from Rural View such as Mackay Bucasia Road, Glenpark
Street, Norris Road and Beaconsfield Road. In the 2031 Base Case, certain sections on
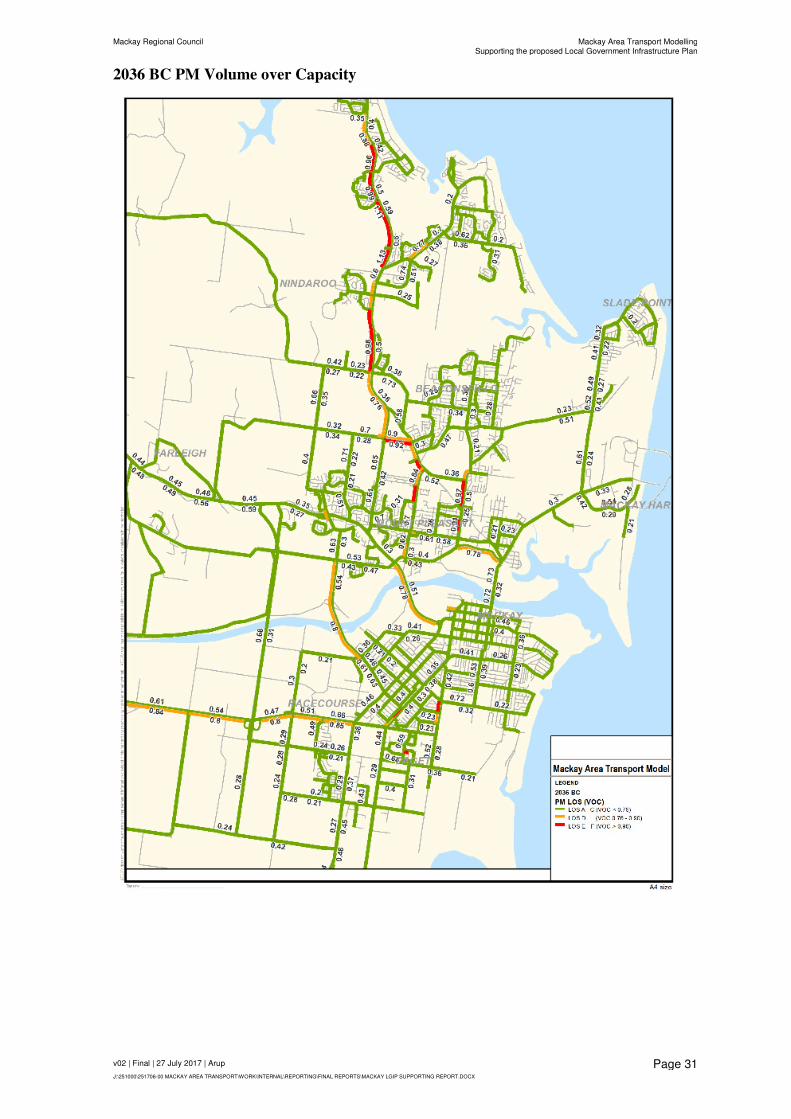
these links are highlighted with LOS E/F. Short sections of Paradise St north of Archibald
and Milton St south of Bridge Road are also highlighted with LOS E/F in the 2036 Base
Case.
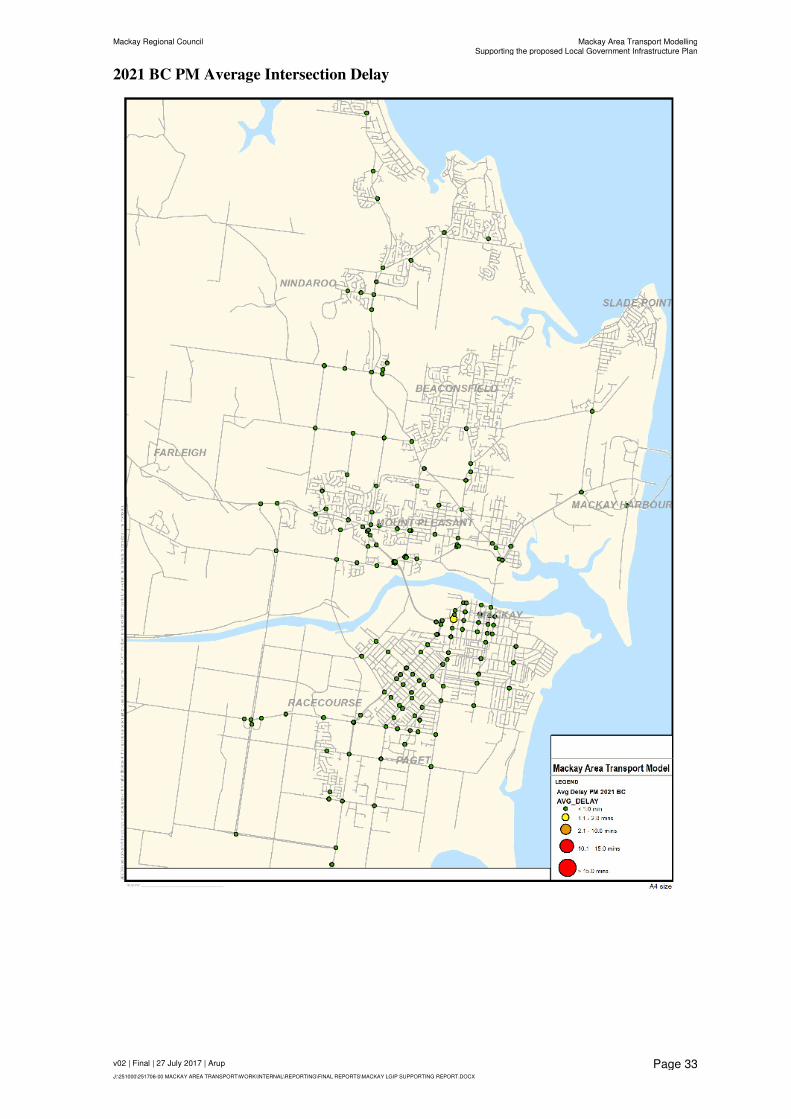
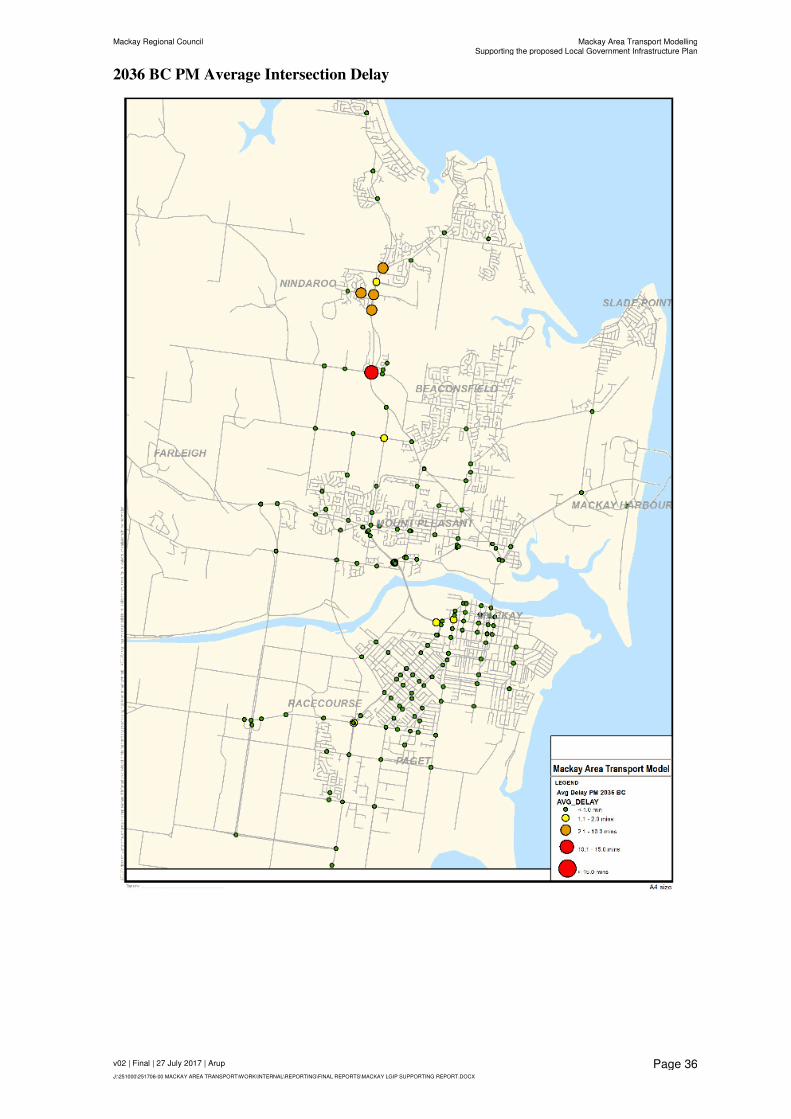
The PM peak average intersection delay plots indicate major average intersection delays
will occur in 2031 and 2036 Base Case at Mackay Bucasia Road intersections. The delays
will become excessive at Mackay Bucasia / Mackay Habana Road intersection indicating
upgrade work will be required.
Based on the above findings, a list of projects has been considered and tested in the future
year do something scenarios to resolve the traffic growth related issues. Table 4-1
summaries the model result findings at the problematic locations by comparing the PM
VOC ratios between Base Case and Do Something scenarios.

Mackay Regional Council Mackay Area Transport ModellingSupporting the proposed Local Government Infrastructure Plan
v02 | Final | 27 July 2017 | Arup
J:\251000\251706-00 MACKAY AREA TRANSPORT\WORK\INTERNAL\REPORTING\FINAL REPORTS\MACKAY LGIP SUPPORTING REPORT.DOCX
Page 12
Table 4-1 – Links and intersections performance before and after project schemes (2026 – 2036 Base Case vs Do Something)
Congested Road
Name
Congested Road
Section
Base Case without projects Indicative
Timing
Improvement Projects
(ID reference to project list)
Do Something with projects
2026 BC
PM VOC
2031 BC
PM VOC
2036 BC
PM VOC
2026 DS
PM VOC
2031 DS
PM VOC
2036 DS
PM VOC
Shoal Point Road Kemp St north to Royal
Sands Blvd 0.55 0.78 0.96
2036 Kemp St north to Royal Sands Blvd 2 lane duplication to 4
(2012) 0.55 0.73 0.41
Mackay-Bucasia Rd Old Eimeo Rd to James
Cook Drive 0.77 0.98 1.13
2031 Additional lanes from old Eimeo Rd to north of James Cook
Drive (1012) 0.77 0.42 0.49
Mackay-Bucasia Rd James Cook Drive to
Downie Avenue 0.75 0.95 1.11
2031 Additional lanes from James Cook Drive to north of Downie
Avenue (1014) 0.75 0.41 0.48
Mackay-Bucasia Rd Habana Rd/Golflinks
Rd intersection
Avg INT
delay < 1
mins
Avg INT
delay > 2
mins
Avg INT
delay > 10
mins
2031 Intersection upgrade at Habana Rd/Golflinks Rd – increase
roundabout capacity (1009)
Avg INT
delay < 1
mins
Avg INT
delay <1
mins
Avg INT
delay <1
mins
Mackay-Bucasia Rd Golflinks Rd to George
Fordyce Dr
0.74 0.86 0.98
2036 Reed Street extension and upgrade minor collector to sub-
arterial (71, 83)
Dawson Blvd N bdry Richmond Hills Stg 1 + S bdry
Premier Vista Stg 1 – upgrade minor collector to subarterial
(72, 73, 97) 0.74 0.86 0.77
Mackay-Bucasia Rd Intersections at George
Fordyce Dr, Rosewood
Dr, Eimeo Rd
Avg INT
delay < 1
mins
Avg INT
delay 1-2
mins
Avg INT
delay > 2
mins
2036 Above +
Eimeo Rd to E bdry Plantation Palms – upgrade minor
collector to subarterial (67)
Avg INT
delay < 1
mins
Avg INT
delay 1-2
mins
Avg INT
delay <1
mins
Mackay-Habana Rd Mackay-Habana Rd /
Glenella-Richmond Rd
intersection
Avg INT
delay < 1
mins
Avg INT
delay < 1
mins
Avg INT
delay < 1
mins
2036 Roundabout upgrade at Mackay-Habana Road – Richmond
Rd intersection (76)
Avg INT
delay < 1
mins
Avg INT
delay < 1
mins
Avg INT
delay < 1
mins
Holts Rd Mackay-Bucasia to
Beaconsfield Rd
0.59 0.85 0.92
2036 Dawson Blvd N bdry Richmond Hills Stg 1 + S bdry
Premier Vista Stg 1 – upgrade minor collector to subarterial
(72,73, 97) 0.65 0.78 0.82
Glenpark Street At Railway Overpass 0.87 0.96 0.97
2031 Duplication of railway overpass and lane extensions (29) 0.9 0.47 0.51
Glenpark Street Maplethorpe Bridge 0.83 0.94 0.91
2031 Duplication of Bridge lanes and lane extensions (30) 0.87 0.46 0.5
Glenpark Street Beaconsfield Rd to
Bedford Rd 0.68 0.74 0.75
2031 Beaconsfield Rd to Bedford Rd2 lane duplication to 4
(2024) 0.7 0.72 0.34
Beaconsfield Rd Norris Rd to Holts Rd 0.85 0.91 0.95
2031 Norris Rd to Holts Rd assumed 2 lane duplication to 4
(4013) 0.79 0.38 0.46
Milton Street Bridge Rd to
Graffunder St 0.76 0.83 0.9
2036 4 lane divided signalised intersection (20)
0.8 0.85 0.33
Paradise Road Archibald St to
Webberley St 0.91 0.87 0.95
2026 Signalised intersection upgrade at Webberley St – 2 through
lanes on Paradise Rd approaches (14) 0.3 0.31 0.37

Mackay Regional Council Mackay Area Transport ModellingSupporting the proposed Local Government Infrastructure Plan
v02 | Final | 27 July 2017 | Arup
J:\251000\251706-00 MACKAY AREA TRANSPORT\WORK\INTERNAL\REPORTING\FINAL REPORTS\MACKAY LGIP SUPPORTING REPORT.DOCX
Page 13
In the 2026:
• The section of Paradise Road between Archibald Street and Webberley Street was
predicted to exceed the desired LOS. With an upgrade of 2 through lanes on Paradise
Road approach at the Paradise Road / Webberley Street intersection, the PM VOC ratio
will be improved from 0.91 in the base case to 0.3 in the do something scenario. The
same upgraded section will continue to operate under LOS B in the following modelled
years of 2031 and 2036.
In 2031:
• Mackay-Bucasia Road between Old Eimeo Road and Downie Avenue was predicted to
have a capacity issue with the PM VOC above 0.95 in the base case. This was due to
the increase of development traffic in Shoal Point and Bucasia. The duplication of the
road sections were predicted to improve the traffic condition with the PM VOC under
0.5.
• Similarly, sections of Glenpark Street at the existing 2 lane bridges will operate close
to capacity with VOC around 0.95 in the base case. With duplication, both sections
were found to operate satisfactorily with VOC around 0.5.
• A short section of Beaconsfield Road between Norris Road and Holts Road was
predicted to operate with LOS just above E due to the combination of through traffic
from Norris Road and Beaconsfield Road East that will merge at this point before the
next diverge point. With duplication, this road section was found to operate under LOS
B.
In 2036:
• Mackay-Bucasia Road between Golflinks Road and George Fordyce Drive was
predicted to operate with PM VOC at 0.98 due to the continuous traffic growth in the
Rural View and Northern Beaches area, indicating a network upgrade would be
required. An upgrade of this road section would improve the traffic condition, but such
an upgrade was not proposed in the updated project scheme list. As an alternative the
Dawson Boulevard and Reed Street Extension project were selected for scenario
testing purposes, as both projects were considered to support the local developments in
Rural View by providing better accessibility to the local area. It was found both
projects would also help to mitigate the capacity issue on Mackay-Bucasia Road as a
result of traffic diversion. In the 2036 DS scenario, the problematic road section will
have improved PM VOC from 0.98 to 0.77 with both projects included. It should be
noted the driver of both projects is not directly related to Mackay-Bucasia Road but to
cater for local developments.
• Short sections of Glenpark Street between Beaconsfield Road and Bedford Road and
Milton Street between Bridge Road and Graffunder Street were predicted to have PM
VOC at 0.95 in the 2036 BC. With duplications tested, both links were found to operate
satisfactorily with PM VOC below 0.35.
With network improvement schemes in the Do Something scenarios of each year, the
relevant road sections were predicted to perform under capacity with LOS D / VOC under
0.9. The model network results of 2021 to 2036 Do Something scenarios are presented in
Appendix F.

Mackay Regional Council Mackay Area Transport ModellingSupporting the proposed Local Government Infrastructure Plan
v02 | Final | 27 July 2017 | Arup
J:\251000\251706-00 MACKAY AREA TRANSPORT\WORK\INTERNAL\REPORTING\FINAL REPORTS\MACKAY LGIP SUPPORTING REPORT.DOCX
Page 14
5 Conclusion
5.1 Summary
The latest demographic and land use forecast produced for Mackay indicated that the
overall forecast population growth is predicted to be 1.4% per annum from 2011 to 2036,
and employment growth of 0.7% per annum from 2011 to 2036. As the growth is unevenly
allocated, Eimeo-Rural View have the largest share of population growth with 10,700 total
increase or a 2.9% per annum growth rate. Ooralea-Bakers Creek have the largest share of
employment growth with 11,000 total increase or a 3.5% growth rate per annum.
In general, the modelled network in Mackay was predicted to perform satisfactorily in the
base case scenarios up to 2026. In the 2031 and 2036 base case scenarios, certain roads in
the northern Mackay area were predicted to experience congestion issues, including
Mackay-Bucasia Road, Glenpark Street, Norris Road, Beaconsfield Road and Holts Road.
The predicted areas of congestion were found to generally be caused by traffic demand
growth in Rural View and the Northern Beaches areas. Network performance was found to
be relatively better in south Mackay with only a few short sections highlighted on Milton
Street and Paradise Road.
The model results in the future year base case scenarios indicated the following
recommended upgrades for consideration.
2026
- Scheme 14 – Paradise Road signalised intersection upgrade at Webberley Street
with 2 through lanes on Paradise Road approach
2031
- Scheme 1012, 1014 – Mackay Bucasia Road duplication between Old Eimeo Road
and Downie Avenue
- Scheme 1009 – Mackay Bucasia / Habana Road / Golflinks Road intersection
upgrade with increase roundabout capacity
- Scheme 29, 30 – Glenpark Street duplication at railway overpass and Maplethorpe
Bridge crossings
- Scheme 2024 – Glenpark Street section between Beaconsfield Road and Bedford
Road
- Scheme 4013 – Beaconsfield Road section between Norris Road and Holts Road
2036
- Scheme 2012 – Shoal Point Road between Kemp Street north and Royal Sands
Blvd
- Scheme 20 – Milton Street between Bridge Road and Graffunder Street, 4 lane
divided signalised intersection upgrade
- Scheme 71, 83 – Reed Street extension and Rosewood Drive to McCreadys Creek,
upgrade minor collector to subarterial
- Scheme 72, 73, 97 – Dawson Blvd extension to north boundary of Richmond Hills
and south boundary of Premier Vista stage 1, upgrade minor collector to subarterial

Mackay Regional Council Mackay Area Transport ModellingSupporting the proposed Local Government Infrastructure Plan
v02 | Final | 27 July 2017 | Arup
J:\251000\251706-00 MACKAY AREA TRANSPORT\WORK\INTERNAL\REPORTING\FINAL REPORTS\MACKAY LGIP SUPPORTING REPORT.DOCX
Page 15
- Scheme 67 – Eimeo Road to east boundary of Plantation Palms, upgrade minor
collector to subarterial
- Scheme 76 – roundabout upgrade at Mackay Habana Road / Richmond Road
intersection
It should be noted that the schemes of Reed Street extension and Dawson Boulevard
extension would be driven by local residential development in the Rural View area. These
projects will provide greater accessibility to the developments, resulting in improvements
to the overall network performance in the area. Such improvements include helping to
mitigate the predicted capacity issue on Mackay-Bucasia Road through traffic diversion.
The actual timing of both projects will be determined by the development stages in this
area. The modelling results help understand the benefit of the projects based on the current
assumed development plans in accordance with the population and land use forecast.
With the inclusion of project upgrades in the do something scenarios, the Mackay network
was found to operate satisfactory in the modelled future years.
5.2 Limitations of the study
MATM is a transport modelling tool to undertake high level transport planning and
analysis to support feasibility assessments and to provide demand inputs to the next level
of more detailed transport modelling and analysis.
The projects identified in this modelling exercise provide a strategic assessment of the
future network upgrade requirements in Mackay. The project recommendations were made
to address growth related issues, but did not include other important considerations that
would inform investment decisions, such as safety improvements, cost benefit analysis,
environmental impact etc.
As such, it is recommended to carry out detailed analysis and / or multi criteria analysis for
proposed projects when it comes to the actual planning stage. The interventions in the
network would be subject to detailed project planning and investment decision-making.

Mackay Regional Council Mackay Area Transport ModellingSupporting the proposed Local Government Infrastructure Plan
v02 | Final | 27 July 2017 | Arup
J:\251000\251706-00 MACKAY AREA TRANSPORT\WORK\INTERNAL\REPORTING\FINAL REPORTS\MACKAY LGIP SUPPORTING REPORT.DOCX
Page 16
Appendix A MGAM Population and Employment
Forecast
MGAM population forecast by SA2 sector
Total population by SA2
sector
2011 2016 2021 2026 2031 2036
Mackay 4,272 4,257 4,504 4,929 6,118 9,703
East Mackay 4,076 3,840 3,990 4,244 4,442 4,558
West Mackay 6,843 6,397 6,535 6,617 6,731 6,825
South Mackay 7,671 7,645 7,719 7,719 7,662 7,605
Ooralea - Bakers Creek 4,326 4,761 5,286 6,850 8,533 10,698
Walkerston - Eton 8,986 9,345 9,864 10,043 10,363 10,500
Mackay Harbour 611 486 832 929 965 1,105
North Mackay 7,390 6,902 7,091 7,269 7,393 7,741
Mount Pleasant - Glenella 11,554 11,401 13,344 14,026 15,487 16,916
Andergrove - Beaconsfield 16,312 16,194 17,437 19,114 20,117 20,876
Slade Point 4,338 3,990 4,151 4,159 4,184 4,186
Eimeo - Rural View 10,462 12,043 14,522 17,173 18,651 21,163
Shoal Point - Bucasia 5,685 6,064 6,678 8,138 10,530 12,458
Pioneer Valley 6,842 7,380 8,211 8,800 9,365 9,956
Sarina 10,209 10,475 10,763 11,507 12,850 13,490
Seaforth - Calen 7,574 7,115 7,099 7,254 7,319 7,347
Total Resident Population 117,151 118,294 128,023 138,769 150,709 165,127
Growth (from the previous
model year)
0.2% 1.6% 1.6% 1.7% 1.8%
MGAM employment forecast by SA2 sector
Total employment by SA2
sector
2011 2016 2021 2026 2031 2036
Mackay 17,018 12,330 14,057 14,549 15,348 15,731
East Mackay 828 254 266 291 306 310
West Mackay 4,051 2,805 2,906 2,942 3,166 3,241
South Mackay 1,839 2,754 2,791 2,824 2,864 2,873
Ooralea - Bakers Creek 7,985 11,256 12,007 13,223 14,392 18,966
Walkerston - Eton 1,879 1,590 1,624 1,640 1,680 1,722
Mackay Harbour 1,419 1,624 1,627 1,628 1,638 1,715
North Mackay 3,824 2,288 2,430 2,653 2,716 2,749
Mount Pleasant - Glenella 4,804 4,406 5,436 5,835 6,109 6,238
Andergrove - Beaconsfield 2,574 1,366 1,495 1,586 1,690 1,761
Slade Point 1,111 780 815 821 828 841
Eimeo - Rural View 1,064 720 884 1,302 1,400 1,639
Shoal Point - Bucasia 509 750 764 727 709 661
Pioneer Valley 1,196 1,510 1,555 1,641 1,938 2,300
Sarina 4,282 3,440 3,528 3,562 4,095 4,774
Seaforth - Calen 909 597 606 610 611 603
Total Jobs 55,292 48,471 52,793 55,836 59,489 66,123
Growth (from the previous
model year)
-2.6% 1.7% 1.1% 1.3% 2.1%

Mackay Regional Council Mackay Area Transport ModellingSupporting the proposed Local Government Infrastructure Plan
v02 | Final | 27 July 2017 | Arup
J:\251000\251706-00 MACKAY AREA TRANSPORT\WORK\INTERNAL\REPORTING\FINAL REPORTS\MACKAY LGIP SUPPORTING REPORT.DOCX
Page 17
Appendix B MATM Trip Generation & Attraction
Rates
MATM trip generation rates (Urban)
Households with.. HBW - Blue
HBW - White
HBE HBS HBO
0 Blue Collar workers
1 Blue Collar workers 1.486 0.716 0.299
2 Blue Collar workers 3.010 1.140 0.299
3 Blue Collar workers+ 6.149 1.987 0.299
0 White Collar workers
1 White Collar workers 1.324 0.592 0.745
2 White Collar workers 2.774 1.442 1.153
3 +White Collar workers+ 4.437 2.026 1.617
0 Dependant (0-17 years)
1 Dependant (0-17 years) 2.496 0.676 1.152
2 Dependant (0-17 years) 5.071 0.893 2.694
3 +Dependant (0-17 years) 8.399 1.519 3.810
0 Dependant (18-64years)
1 Dependant (18-64years) 0.306 1.414 0.698
2 Dependant (18-64years) 0.427 2.465 1.180
3 +Dependant (18-64years) 0.427 2.465 1.180
0 Dependant (65+ years)
1 Dependant (65+ years) 1.271 0.482
2 Dependant (65+ years) 3.119 1.804
3 +Dependant (65+ years) 3.119 1.804
R squared (adjusted) 0.599 0.576 0.622 0.397 0.315
Standard error 1.054 1.523 2.230 2.648 3.214
MATM trip generation rates (Rural)
Households with.. HBW - Blue
HBW - White
HBE HBS HBO
0 Blue Collar workers
1 Blue Collar workers 1.404 0.366 0.490
2 Blue Collar workers 2.593 0.809 1.203
3 Blue Collar workers+ 3.641 0.809 1.203
0 White Collar workers
1 White Collar workers 1.169 0.393 0.686
2 White Collar workers 2.791 0.478 0.917
3 White Collar workers+ 3.920 0.478 0.917
0 Dependant (0-17 years)
1 Dependant (0-17 years) 2.448 0.262 2.966
2 Dependant (0-17 years) 5.084 0.262 3.699
3 +Dependant (0-17 years) 8.378 0.262 6.655
0 Dependant (18-64years)
1 Dependant (18-64years) 0.084 0.450 1.274
2 Dependant (18-64years) 0.084 1.318 1.365
3 +Dependant (18-64years) 0.084 1.318 1.365
0 Dependant (65+ years)
1 Dependant (65+ years) 0.505 0.617
2 Dependant (65+ years) 0.892 1.035
3 +Dependant (65+ years) 0.892 1.035
R squared (adjusted)
Standard error

Mackay Regional Council Mackay Area Transport ModellingSupporting the proposed Local Government Infrastructure Plan
v02 | Final | 27 July 2017 | Arup
J:\251000\251706-00 MACKAY AREA TRANSPORT\WORK\INTERNAL\REPORTING\FINAL REPORTS\MACKAY LGIP SUPPORTING REPORT.DOCX
Page 18
Trip Attraction Coefficients (All sectors)
HBW-B HBW-W HBE HBS HBO NHB
Private households
Resident Population 0.337 0.265
Preschool and Primary School
Enrolments
2.917
Secondary School Enrolments 2.841
Tertiary Education Enrolments 0.379
Retail Jobs 0.1079 2.381 3.07 0.376 3.945
Service Jobs 0.698 1.327 1.552 1.950
Professional Jobs 0.014 0.865
Industry Jobs 2.187 0.326
Mining Jobs 0.514
Other Jobs 1.388 0.514

Mackay Regional Council Mackay Area Transport ModellingSupporting the proposed Local Government Infrastructure Plan
v02 | Final | 27 July 2017 | Arup
J:\251000\251706-00 MACKAY AREA TRANSPORT\WORK\INTERNAL\REPORTING\FINAL REPORTS\MACKAY LGIP SUPPORTING REPORT.DOCX
Page 19
Appendix C Link VOC and LOS Description
Volume /
Capacity Criteria
Indicative level
of service
Description
<35% A Generally free flow conditions. Vehicles are unhindered in
manoeuvring in the traffic stream and stopped delay at
junctions is minimal
35% - 50% B Generally free flow conditions. Vehicles are unhindered in
manoeuvring in the traffic stream and stopped delay at
junctions is minimal
50% - 75% C Relatively unimpeded operation. Manoeuvring in traffic
stream is only slighted restricted and stopping delays are low
75% - 90% D Stable operating conditions with manoeuvring becoming more
restricted
90% - 100% E Conditions border on a range in which small increases in flow
may significantly reduce travel speed
>100% F Conditions characterised by significant junction delays and
extensive queuing. Speeds are very low

Mackay Regional Council Mackay Area Transport ModellingSupporting the proposed Local Government Infrastructure Plan
v02 | Final | 27 July 2017 | Arup
J:\251000\251706-00 MACKAY AREA TRANSPORT\WORK\INTERNAL\REPORTING\FINAL REPORTS\MACKAY LGIP SUPPORTING REPORT.DOCX
Page 20
Appendix D 2021 Base Case Project List
Scheme
ID
Road Name Section Work Description
TMR Project
1001 Mackay-Bucasia Rd Bruce Highway -
Malcolmson St
Six lanes Bruce Highway - Malcomson
Street
1002 Mackay-Bucasia Rd Bruce Highway -
Malcolmson St
Retain as Rbt but increase capacity to match
3 lane approaches
1003 Mackay-Bucasia Rd Malcomson St –
Phillips St
Six lanes from Malcomson Street – Phillip
Street
1004 Mackay-Bucasia Rd Phillips St
downstream
Six Lanes downstream of Phillip Street
Intersection
242 Mackay-Bucasia Rd Phillips St
Intersection
Signalised. Review layout with 3 lane
approaches
1016 Mackay-Slade Point
Rd
Bruce Highway -
River St
Additional lanes from Bruce Highway -
Milton St (inbound only)
1017 Mackay-Slade Point
Rd
Bruce Highway -
River St
Additional stand up lanes on each leg
Gordon St/Milton Nth & Sth. Completed
and coded as latest intersection layout
1023 Rockleigh-North
Mackay Rd
I/S Evans Ave &
Palmer St - Harbour
Rd
Capacity Downgrade and signal remains
1024 Rockleigh-North
Mackay Rd
Malcomson St -
Intersection Evans
Ave & Palmer St
Capacity Downgrade and signal remains
1026 Maraju-Yakapari Rd Bruce Hwy -
Glennella Connection
Rd
Intersection upgrade at Windmill Crossing -
roundabout
1045 Bruce Highway
South
Homebush Rd - City
Gates
Duplication from Temples Lane to Farrellys
Road
1046 Bruce Highway
South
Homebush Rd - City
Gates
Intersection Upgrade at Temples Lane –
signals
1047 Bruce Highway
South
Homebush Rd - City
Gates
Intersection upgrade at Stockroute Road -
roundabout
1048 Bruce Highway
South
Homebush Rd - City
Gates
Intersection upgrade at Boundary Road -
signals
1049 Bruce Highway
South
Homebush Rd - City
Gates
Additional lanes at City Gates intersection
1054 Bruce Highway
South
City Gates -
Showgrounds
Additional left turn lanes onto Bruce
Highway at Showgrounds
1055 Bruce Highway
South
City Gates -
Showgrounds
Additional lanes at Shakespeare Street
intersection
1059 Bruce Highway
North
Heaths Road/Sams
Road - Bucasia
Turnoff
Intersection upgrade at Sams Road -
additional stand up lanes (3 each way no
change)
1060 Bruce Highway
North
Heaths Road/Sams
Road - Bucasia
Turnoff
Additional lanes from Sams Rd to Bucasia
Rd
1062 Bruce Highway
North
Heaths Road/Sams
Road - Bucasia
Turnoff
Intersection upgrade at Bucasia Rd -
additional stand up lanes
1063 Bruce Highway
North
Bucasia Turnoff –
Phillips St
Duplication from Bucasia Rd to Phillip
Street
1064 Bruce Highway
North
Phillips St – Barnes
Rd
Duplication from Phillip Street to Barnes
Road (changed to Bald Hill Rd)
3004 Mackay Ring Road
Stage 1
Stockroute Road -
Bruce Highway
North
new 2 lane undivided highway with 100
km/h posted speed
3009 Bruce Highway
South
Hay Point Rd -
Homebush Rd
Intersection upgrade at Hay Point Rd -
roundabout
MRC Project

Mackay Regional Council Mackay Area Transport ModellingSupporting the proposed Local Government Infrastructure Plan
v02 | Final | 27 July 2017 | Arup
J:\251000\251706-00 MACKAY AREA TRANSPORT\WORK\INTERNAL\REPORTING\FINAL REPORTS\MACKAY LGIP SUPPORTING REPORT.DOCX
Page 21
1 Connors Road
Upgrade
Farrellys Lane to East
Boundary Street
Upgrade to two through and median turn
lane. Services to ultimate alignment
2 Connors Road
Upgrade - Incl
Intersection
East Boundary Road
to Archibald Street
Signalised int E Boundary and 4 lane to
Archibald
7 Farrellys Lane
Construction
Connors Road to
Michelmore Street
4 lane divided
8 Farrellys Lane
Construction - Incl
Michel Inter
Michelmore Street to
Milton Street
two through and median turn lane divided
9 Archibald / Paradise
Intersection
(242/LGSR/8)
Dual Lane
Roundabout
Dual lane roundabout
12 Paradise Street
Upgrade
(120/LGSA/10)
Stage 1 (Henman),
Stage 2 (George),
George Street to
Henman Street
4 lane construction divided and roundabout,
completed interim upgrade as 2 lanes
13 Bridge/Paradise
Intersection
Signalised
intersection
Signalised intersection 4 lane
22 Milton/Boundary
Intersection (DTMR
No. yet to be
assigned)
Intersection
signalisation and four
laning
4 lane divided signalised intersection,
interim upgrade as 2 lanes signals
26 Bedford Rd Coles Rd to
Andergrove Rd
4 lane divided construction, signalised
intersection and dual lane roundabout
construction
31 Glenpark/Evans/Shor
t Street
(242/LGSR/5)
Intersection
improvements
Linked signalised intersections
32 Malcomson
Street/Charles Hodge
Dan Murphy
Intersection
4 lane signalised intersection, interim
upgrade as 2 lanes signals
41 Boundary Road West Hwy/Rainlover Roundabout construction and two through
and median lane construction
95 Pioneer/ Gingham
Roundabout
Developer
contribution
Roundabout construction
101 Juliet / Penn
Intersection
Intersection
signalisation
Intersection signalisation
105 Rosewood Road Collector Roads for
Rosewood
Developments
Connectivity for Rosewood
106 River Street Gregory St to Sydney
St Eastbound Only
Left turn lane duplication
2007 Shakespeare Street
downgrade to 2
btw Milton St and
Sydney St
downgrade to 2 lanes
4012 Malcomson St Greenfields Blvd to
Norris Rd
Convert 2 lane to 4 lane construction
ultimately, interim completed between
Greenfield Blvd and Charles Hodge Ave
Network Correction
n/a Bruce Highway
South
City Gates -
Showgrounds
Changed Shakespeare St intersection to
match existing 2016 layout
n/a Bruce Highway
South
City Gates -
Showgrounds
Added link for left turn slip lanes from
Bruce Hwy to Gordon St
n/a Bruce Highway
South
Homebush Rd - City
Gates
Changed Temple Ln intersection to match
existing 2016 layout
n/a Eimeo Road Mackay-Bucasia Rd -
Blacks Beach Rd
Increased North-East approach minimum
capacity to match 2 lane approach

Mackay Regional Council Mackay Area Transport ModellingSupporting the proposed Local Government Infrastructure Plan
v02 | Final | 27 July 2017 | Arup
J:\251000\251706-00 MACKAY AREA TRANSPORT\WORK\INTERNAL\REPORTING\FINAL REPORTS\MACKAY LGIP SUPPORTING REPORT.DOCX
Page 22
Appendix E 2011 – 2036 Base Case Network Result
Plots
2011 BY Daily link volumes

Mackay Regional Council Mackay Area Transport ModellingSupporting the proposed Local Government Infrastructure Plan
v02 | Final | 27 July 2017 | Arup
J:\251000\251706-00 MACKAY AREA TRANSPORT\WORK\INTERNAL\REPORTING\FINAL REPORTS\MACKAY LGIP SUPPORTING REPORT.DOCX
Page 23
2021 BC Daily Link Volumes

Mackay Regional Council Mackay Area Transport ModellingSupporting the proposed Local Government Infrastructure Plan
v02 | Final | 27 July 2017 | Arup
J:\251000\251706-00 MACKAY AREA TRANSPORT\WORK\INTERNAL\REPORTING\FINAL REPORTS\MACKAY LGIP SUPPORTING REPORT.DOCX
Page 24
2026 BC Daily Link Volumes

Mackay Regional Council Mackay Area Transport ModellingSupporting the proposed Local Government Infrastructure Plan
v02 | Final | 27 July 2017 | Arup
J:\251000\251706-00 MACKAY AREA TRANSPORT\WORK\INTERNAL\REPORTING\FINAL REPORTS\MACKAY LGIP SUPPORTING REPORT.DOCX
Page 25
2031 BC Daily Link Volumes

Mackay Regional Council Mackay Area Transport ModellingSupporting the proposed Local Government Infrastructure Plan
v02 | Final | 27 July 2017 | Arup
J:\251000\251706-00 MACKAY AREA TRANSPORT\WORK\INTERNAL\REPORTING\FINAL REPORTS\MACKAY LGIP SUPPORTING REPORT.DOCX
Page 26
2036 BC Daily Link Volumes
Mackay Regional Council Mackay Area Transport ModellingSupporting the proposed Local Government Infrastructure Plan
v02 | Final | 27 July 2017 | Arup
J:\251000\251706-00 MACKAY AREA TRANSPORT\WORK\INTERNAL\REPORTING\FINAL REPORTS\MACKAY LGIP SUPPORTING REPORT.DOCX
Page 27
2011 BY PM Volume over Capacity

Mackay Regional Council Mackay Area Transport ModellingSupporting the proposed Local Government Infrastructure Plan
v02 | Final | 27 July 2017 | Arup
J:\251000\251706-00 MACKAY AREA TRANSPORT\WORK\INTERNAL\REPORTING\FINAL REPORTS\MACKAY LGIP SUPPORTING REPORT.DOCX
Page 28
2021 BC PM Volume over Capacity

Mackay Regional Council Mackay Area Transport ModellingSupporting the proposed Local Government Infrastructure Plan
v02 | Final | 27 July 2017 | Arup
J:\251000\251706-00 MACKAY AREA TRANSPORT\WORK\INTERNAL\REPORTING\FINAL REPORTS\MACKAY LGIP SUPPORTING REPORT.DOCX
Page 29
2026 BC PM Volume over Capacity
Mackay Regional Council Mackay Area Transport ModellingSupporting the proposed Local Government Infrastructure Plan
v02 | Final | 27 July 2017 | Arup
J:\251000\251706-00 MACKAY AREA TRANSPORT\WORK\INTERNAL\REPORTING\FINAL REPORTS\MACKAY LGIP SUPPORTING REPORT.DOCX
Page 30
2031 BC PM Volume over Capacity
Mackay Regional Council Mackay Area Transport ModellingSupporting the proposed Local Government Infrastructure Plan
v02 | Final | 27 July 2017 | Arup
J:\251000\251706-00 MACKAY AREA TRANSPORT\WORK\INTERNAL\REPORTING\FINAL REPORTS\MACKAY LGIP SUPPORTING REPORT.DOCX
Page 31
2036 BC PM Volume over Capacity

Mackay Regional Council Mackay Area Transport ModellingSupporting the proposed Local Government Infrastructure Plan
v02 | Final | 27 July 2017 | Arup
J:\251000\251706-00 MACKAY AREA TRANSPORT\WORK\INTERNAL\REPORTING\FINAL REPORTS\MACKAY LGIP SUPPORTING REPORT.DOCX
Page 32
2011 BY PM Average Intersection Delay
Mackay Regional Council Mackay Area Transport ModellingSupporting the proposed Local Government Infrastructure Plan
v02 | Final | 27 July 2017 | Arup
J:\251000\251706-00 MACKAY AREA TRANSPORT\WORK\INTERNAL\REPORTING\FINAL REPORTS\MACKAY LGIP SUPPORTING REPORT.DOCX
Page 33
2021 BC PM Average Intersection Delay

Mackay Regional Council Mackay Area Transport ModellingSupporting the proposed Local Government Infrastructure Plan
v02 | Final | 27 July 2017 | Arup
J:\251000\251706-00 MACKAY AREA TRANSPORT\WORK\INTERNAL\REPORTING\FINAL REPORTS\MACKAY LGIP SUPPORTING REPORT.DOCX
Page 34
2026 BC PM Average Intersection Delay

Mackay Regional Council Mackay Area Transport ModellingSupporting the proposed Local Government Infrastructure Plan
v02 | Final | 27 July 2017 | Arup
J:\251000\251706-00 MACKAY AREA TRANSPORT\WORK\INTERNAL\REPORTING\FINAL REPORTS\MACKAY LGIP SUPPORTING REPORT.DOCX
Page 35
2031 BC PM Average Intersection Delay
Mackay Regional Council Mackay Area Transport ModellingSupporting the proposed Local Government Infrastructure Plan
v02 | Final | 27 July 2017 | Arup
J:\251000\251706-00 MACKAY AREA TRANSPORT\WORK\INTERNAL\REPORTING\FINAL REPORTS\MACKAY LGIP SUPPORTING REPORT.DOCX
Page 36
2036 BC PM Average Intersection Delay

Mackay Regional Council Mackay Area Transport ModellingSupporting the proposed Local Government Infrastructure Plan
v02 | Final | 27 July 2017 | Arup
J:\251000\251706-00 MACKAY AREA TRANSPORT\WORK\INTERNAL\REPORTING\FINAL REPORTS\MACKAY LGIP SUPPORTING REPORT.DOCX
Page 37
Appendix F 2021 – 2036 Do Something Network Result
Plots
2021 DS Daily Link Volumes

Mackay Regional Council Mackay Area Transport ModellingSupporting the proposed Local Government Infrastructure Plan
v02 | Final | 27 July 2017 | Arup
J:\251000\251706-00 MACKAY AREA TRANSPORT\WORK\INTERNAL\REPORTING\FINAL REPORTS\MACKAY LGIP SUPPORTING REPORT.DOCX
Page 38
2026 DS Daily Link Volumes

Mackay Regional Council Mackay Area Transport ModellingSupporting the proposed Local Government Infrastructure Plan
v02 | Final | 27 July 2017 | Arup
J:\251000\251706-00 MACKAY AREA TRANSPORT\WORK\INTERNAL\REPORTING\FINAL REPORTS\MACKAY LGIP SUPPORTING REPORT.DOCX
Page 39
2031 DS Daily Link Volumes
Mackay Regional Council Mackay Area Transport ModellingSupporting the proposed Local Government Infrastructure Plan
v02 | Final | 27 July 2017 | Arup
J:\251000\251706-00 MACKAY AREA TRANSPORT\WORK\INTERNAL\REPORTING\FINAL REPORTS\MACKAY LGIP SUPPORTING REPORT.DOCX
Page 40
2036 DS Daily Link Volumes

Mackay Regional Council Mackay Area Transport ModellingSupporting the proposed Local Government Infrastructure Plan
v02 | Final | 27 July 2017 | Arup
J:\251000\251706-00 MACKAY AREA TRANSPORT\WORK\INTERNAL\REPORTING\FINAL REPORTS\MACKAY LGIP SUPPORTING REPORT.DOCX
Page 41
2021 DS PM Volume over Capacity

Mackay Regional Council Mackay Area Transport ModellingSupporting the proposed Local Government Infrastructure Plan
v02 | Final | 27 July 2017 | Arup
J:\251000\251706-00 MACKAY AREA TRANSPORT\WORK\INTERNAL\REPORTING\FINAL REPORTS\MACKAY LGIP SUPPORTING REPORT.DOCX
Page 42
2026 DS PM Volume over Capacity

Mackay Regional Council Mackay Area Transport ModellingSupporting the proposed Local Government Infrastructure Plan
v02 | Final | 27 July 2017 | Arup
J:\251000\251706-00 MACKAY AREA TRANSPORT\WORK\INTERNAL\REPORTING\FINAL REPORTS\MACKAY LGIP SUPPORTING REPORT.DOCX
Page 43
2031 DS PM Volume over Capacity

Mackay Regional Council Mackay Area Transport ModellingSupporting the proposed Local Government Infrastructure Plan
v02 | Final | 27 July 2017 | Arup
J:\251000\251706-00 MACKAY AREA TRANSPORT\WORK\INTERNAL\REPORTING\FINAL REPORTS\MACKAY LGIP SUPPORTING REPORT.DOCX
Page 44
2036 DS PM Volume over Capacity

Mackay Regional Council Mackay Area Transport ModellingSupporting the proposed Local Government Infrastructure Plan
v02 | Final | 27 July 2017 | Arup
J:\251000\251706-00 MACKAY AREA TRANSPORT\WORK\INTERNAL\REPORTING\FINAL REPORTS\MACKAY LGIP SUPPORTING REPORT.DOCX
Page 45
2021 DS PM Average Intersection Delay

Mackay Regional Council Mackay Area Transport ModellingSupporting the proposed Local Government Infrastructure Plan
v02 | Final | 27 July 2017 | Arup
J:\251000\251706-00 MACKAY AREA TRANSPORT\WORK\INTERNAL\REPORTING\FINAL REPORTS\MACKAY LGIP SUPPORTING REPORT.DOCX
Page 46
2026 DS PM Average Intersection Delay

Mackay Regional Council Mackay Area Transport ModellingSupporting the proposed Local Government Infrastructure Plan
v02 | Final | 27 July 2017 | Arup
J:\251000\251706-00 MACKAY AREA TRANSPORT\WORK\INTERNAL\REPORTING\FINAL REPORTS\MACKAY LGIP SUPPORTING REPORT.DOCX
Page 47
2031 DS PM Average Intersection Delay

Mackay Regional Council Mackay Area Transport ModellingSupporting the proposed Local Government Infrastructure Plan
v02 | Final | 27 July 2017 | Arup
J:\251000\251706-00 MACKAY AREA TRANSPORT\WORK\INTERNAL\REPORTING\FINAL REPORTS\MACKAY LGIP SUPPORTING REPORT.DOCX
Page 48
2036 DS PM Average Intersection Delay