machine learning with r
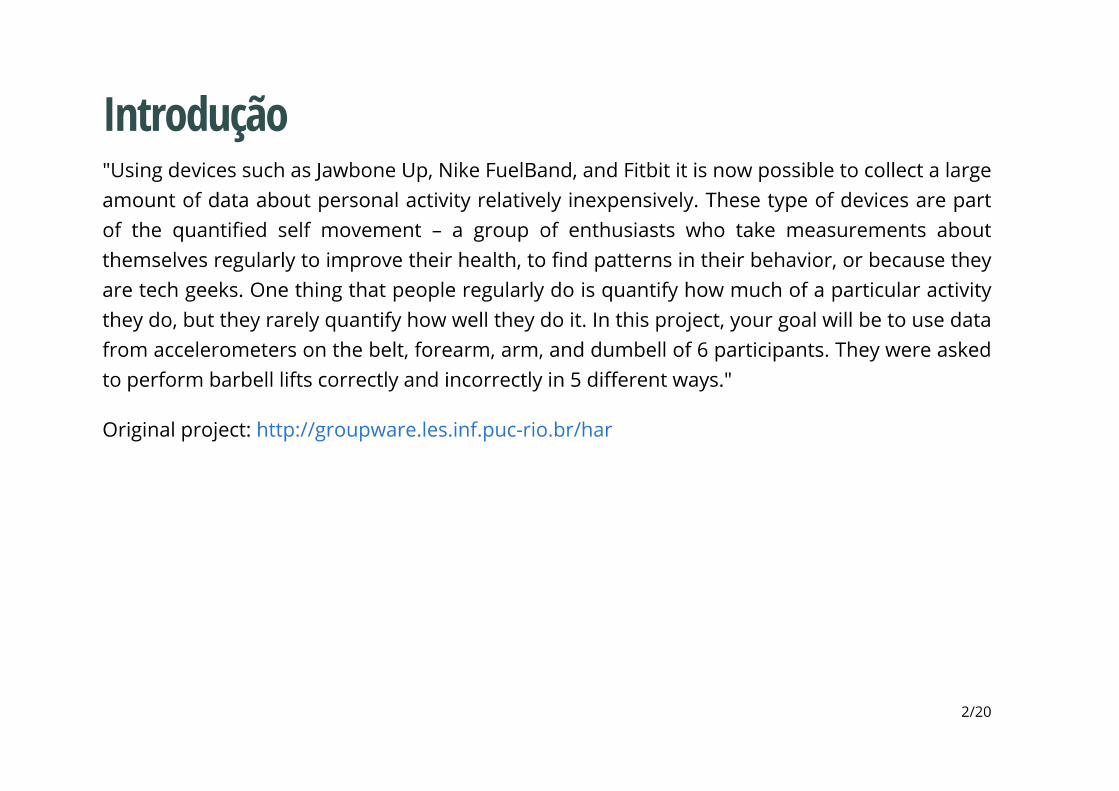
DESCRIPTION
Human Activity Recognition: a simple example of Machine Learning with R.TRANSCRIPT


download.file(url = "https://d396qusza40orc.cloudfront.net/predmachlearn/pml-training.csv",
destfile = "pml-training.csv")
download.file(url = "https://d396qusza40orc.cloudfront.net/predmachlearn/pml-testing.csv",
destfile = "pml-testing.csv")
pmlTraining <- read.csv("pml-training.csv")
pmlTesting <- read.csv("pml-testing.csv")
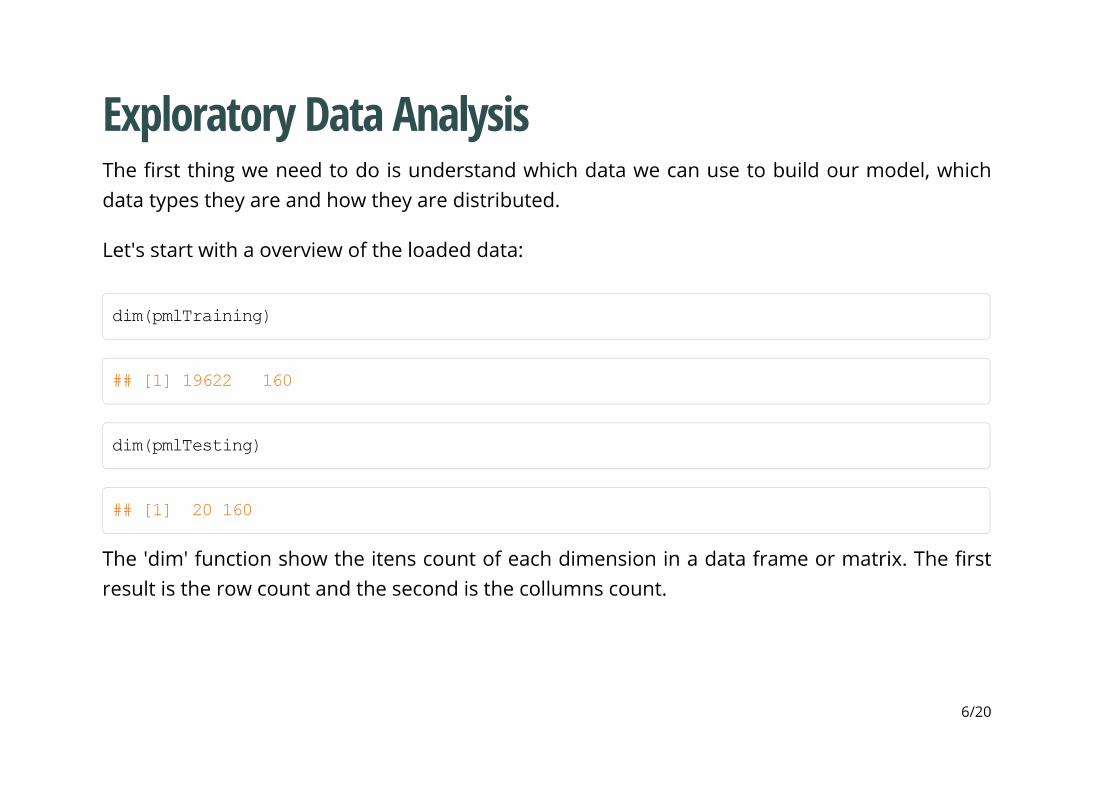
dim(pmlTraining)
## [1] 19622 160
dim(pmlTesting)
## [1] 20 160
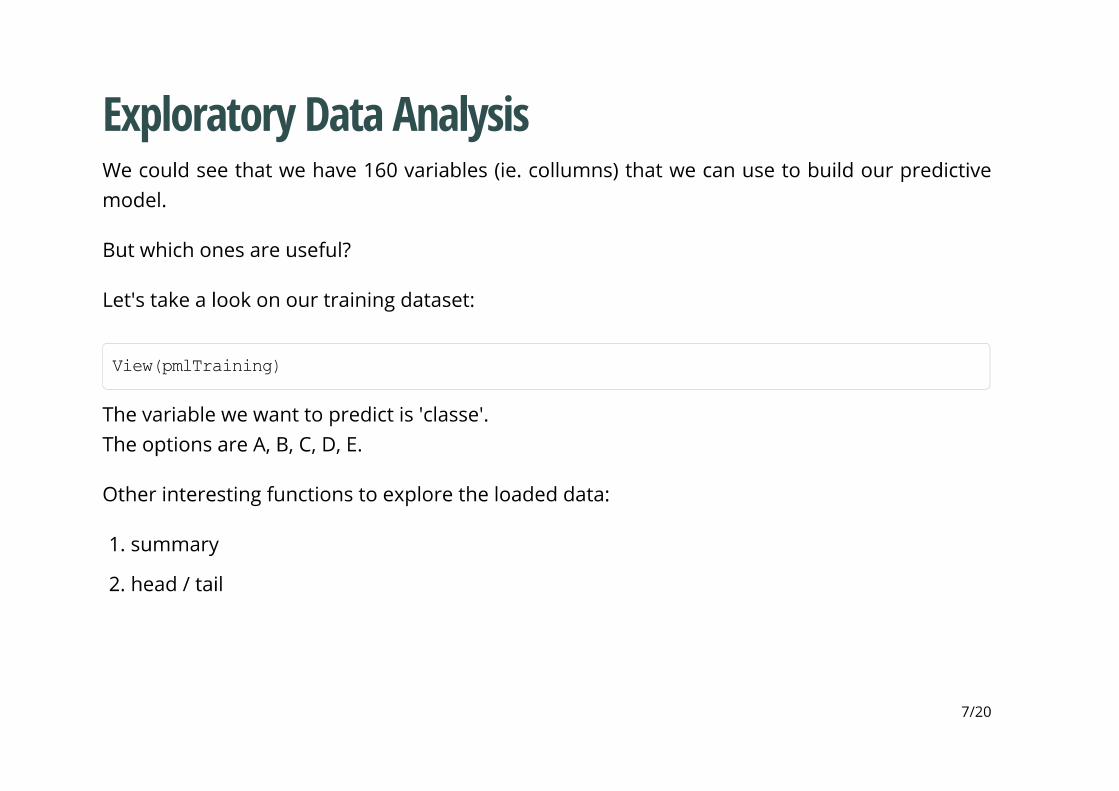
View(pmlTraining)


ProcessData <- function (dataframe){
col <- vector(mode = "numeric")
for(i in 1:ncol(dataframe))
{
if(colnames(dataframe)[i]=='classe'){next;}
total <- length(dataframe[,i]);
NAs <- length(dataframe[is.na(dataframe[,i]),i]);
empty <- length(dataframe[dataframe[,i]=='',i])
notNumber <- length(dataframe[!is.numeric(dataframe[,i]),i]);
if(round(NAs/total)==1 | round(empty/total)==1 | round(notNumber/total)==1){
col <- rbind(col, i)
}
}
process <- dataframe[,as.numeric(col)*(-1)]
for(i in 1:(ncol(process)-1)){ process[,i] <- as.numeric(process[,i]); }
process[,c(1,2,3,4)*(-1)]
}
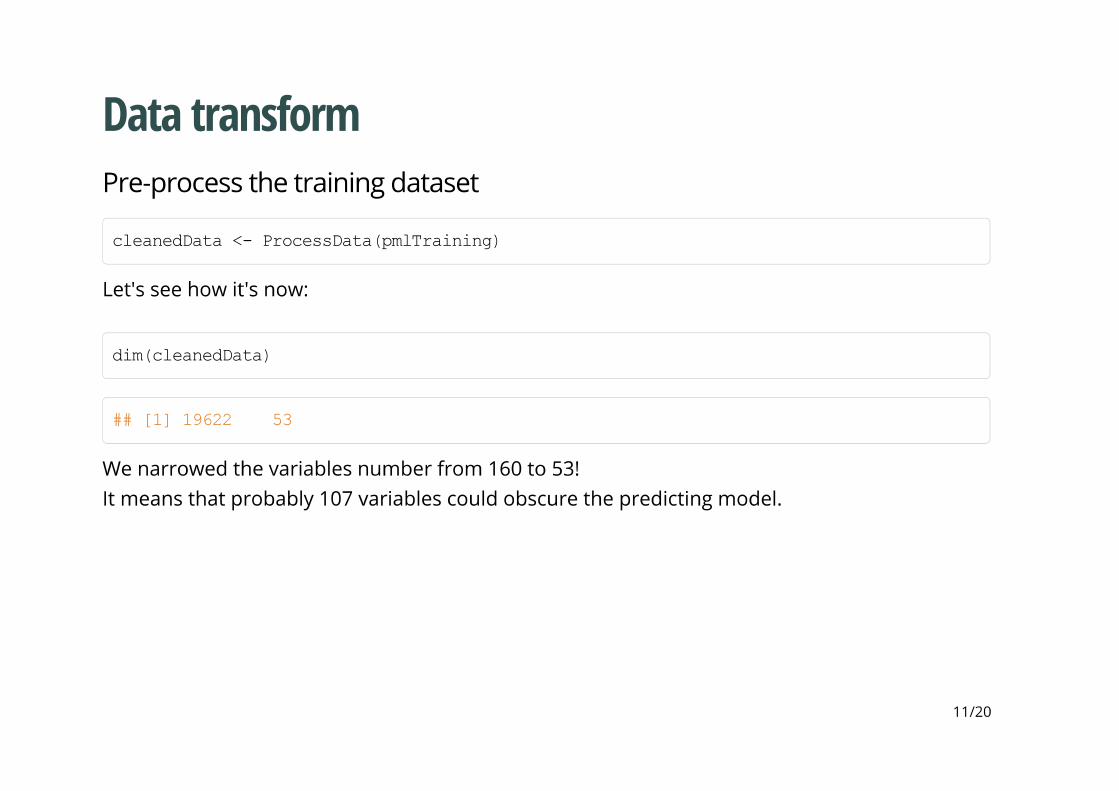
cleanedData <- ProcessData(pmlTraining)
dim(cleanedData)
## [1] 19622 53


library(caret)
inTrain <- createDataPartition(y = cleanedData$classe, p = 0.7, list = FALSE)
trainSet <- cleanedData[inTrain,]
validationSet <- cleanedData[-inTrain,]
dim(trainSet); dim(validationSet)
## [1] 13737 53
## [1] 5885 53


library(caret)
fit <- train(classe ~ ., data = trainSet, method = 'rf')
library(randomForest)
fit <- randomForest(classe ~ ., data = trainSet)

predictResult <- predict(fit, validationSet[,-53])
confusionMatrix(validationSet[,53], predictResult)
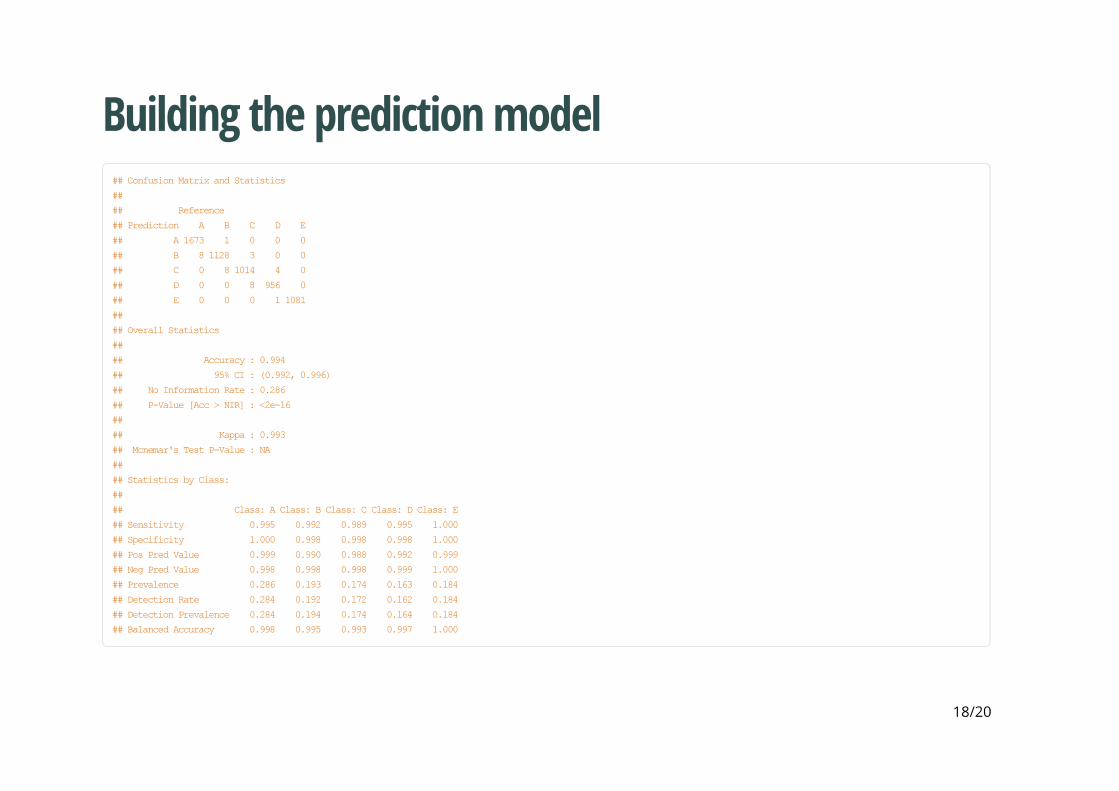
## Confusion Matrix and Statistics
##
## Reference
## Prediction A B C D E
## A 1673 1 0 0 0
## B 8 1128 3 0 0
## C 0 8 1014 4 0
## D 0 0 8 956 0
## E 0 0 0 1 1081
##
## Overall Statistics
##
## Accuracy : 0.994
## 95% CI : (0.992, 0.996)
## No Information Rate : 0.286
## P-Value [Acc > NIR] : <2e-16
##
## Kappa : 0.993
## Mcnemar's Test P-Value : NA
##
## Statistics by Class:
##
## Class: A Class: B Class: C Class: D Class: E
## Sensitivity 0.995 0.992 0.989 0.995 1.000
## Specificity 1.000 0.998 0.998 0.998 1.000
## Pos Pred Value 0.999 0.990 0.988 0.992 0.999
## Neg Pred Value 0.998 0.998 0.998 0.999 1.000
## Prevalence 0.286 0.193 0.174 0.163 0.184
## Detection Rate 0.284 0.192 0.172 0.162 0.184
## Detection Prevalence 0.284 0.194 0.174 0.164 0.184
## Balanced Accuracy 0.998 0.995 0.993 0.997 1.000

cleanedTest <- ProcessData(pmlTesting)
predict(fit, cleanedTest)
## 1 2 3 4 5 6 7 8 9 10 11 12 13 14 15 16 17 18 19 20
## B A B A A E D B A A B C B A E E A B B B
## Levels: A B C D E
