machine learning : foundations course number 0368403401
DESCRIPTION
Machine Learning : Foundations Course Number 0368403401. Prof. Nathan Intrator TA: Daniel Gill, Guy Amit. Course structure. There will be 4 homework exercises They will be theoretical as well as programming All programming will be done in Matlab - PowerPoint PPT PresentationTRANSCRIPT
Machine Learning: Foundations
Course Number 0368403401
Prof. Nathan Intrator
TA: Daniel Gill, Guy Amit
Course structure
• There will be 4 homework exercises
• They will be theoretical as well as programming
• All programming will be done in Matlab
• Course info accessed from
www.cs.tau.ac.il/~nin
• Final has not been decided yet
• Office hours Wednesday 4-5 (Contact via email)

Class Notes
• Groups of 2-3 students will be responsible
for a scribing class notes
• Submission of class notes by next Monday
(1 week) and then corrections and
additions from Thursday to the following
Monday
• 30% contribution to the grade
Class Notes (cont’d)
• Notes will be done in LaTeX to be
compiled into PDF via miktex.
(Download from School site)
• Style file to be found on course web site
• Figures in GIF
Basic Machine Learning idea
• Receive a collection of observations associated
with some action label
• Perform some kind of “Machine Learning”
to be able to:
– Receive a new observation
– “Process” it and generate an action label that
is based on previous observations
• Main Requirement: Good generalization
Learning Approaches
• Store observations in memory and retrieve
– Simple, little generalization (Distance measure?)
• Learn a set of rules and apply to new data
– Sometimes difficult to find a good model
– Good generalization
• Estimate a “flexible model” from the data
– Generalization issues, data size issues
Storage & Retrieval
• Simple, computationally intensive
– little generalization
• How can retrieval be performed?
– Requires a “distance measure” between
stored observations and new observation
• Distance measure can be given or
“learned”
(Clustering)
Learning Set of Rules
• How to create “reliable” set of rules from
the observed data
– Tree structures
– Graphical models
• Complexity of the set of rules vs.
generalization
Estimation of a flexible model
• What is a “flexible” model
– Universal approximator
– Reliability and generalization, Data size
issues
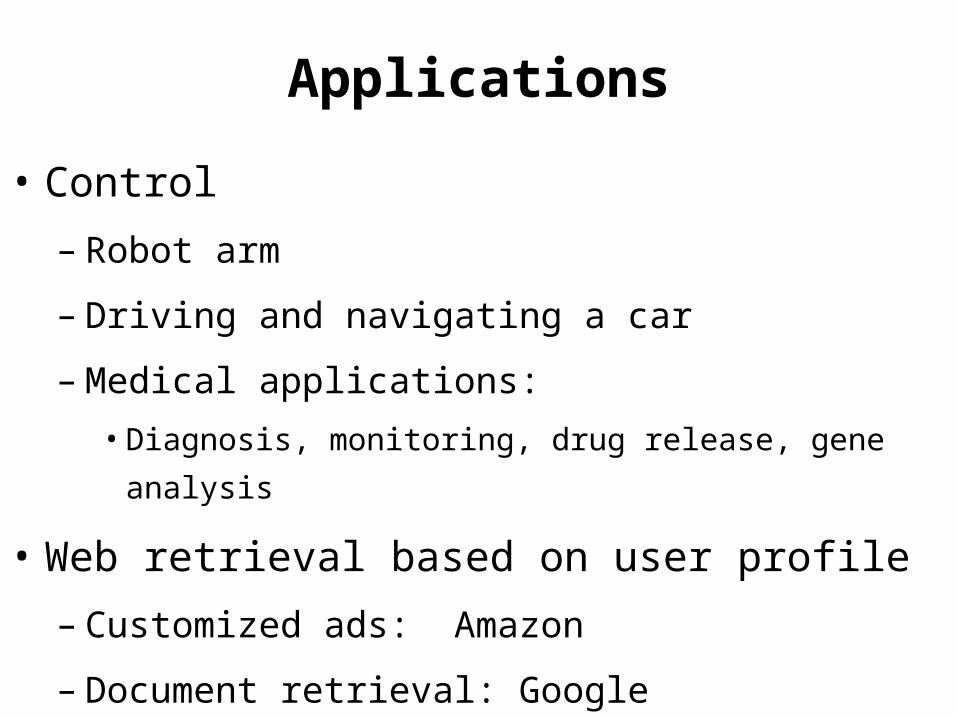
Applications
• Control
– Robot arm
– Driving and navigating a car
– Medical applications:
• Diagnosis, monitoring, drug release, gene analysis
• Web retrieval based on user profile
– Customized ads: Amazon
– Document retrieval: Google
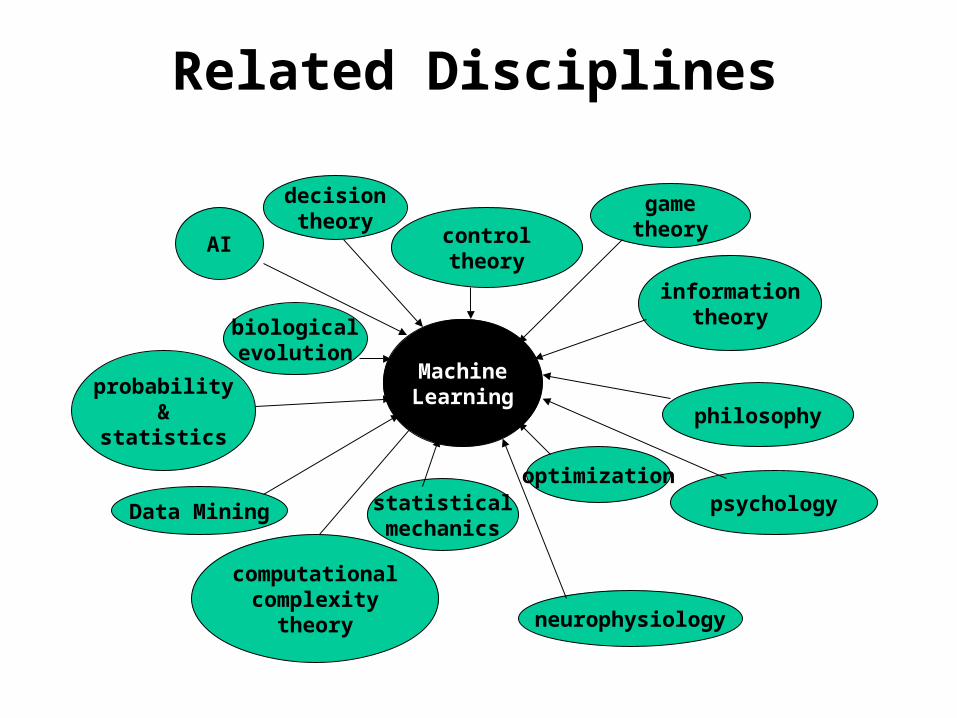
Related Disciplines
MachineLearning
AI
probability&
statistics
computationalcomplexity
theory
controltheory
informationtheory
philosophy
psychology
neurophysiology
Data Mining
decisiontheory
gametheory
optimization
biologicalevolution
statisticalmechanics
Example 1: Credit Risk Analysis
• Typical customer: bank.
• Database:
– Current clients data, including:
– basic profile (income, house ownership,
delinquent account, etc.)
– Basic classification.
• Goal: predict/decide whether to
grant credit.
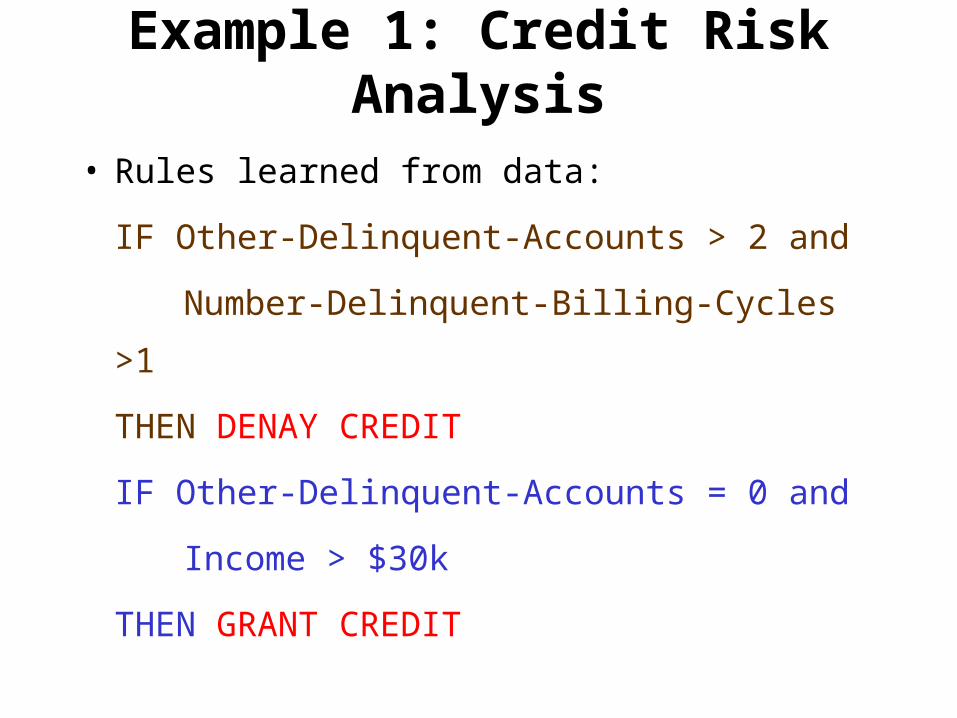
Example 1: Credit Risk Analysis
• Rules learned from data:
IF Other-Delinquent-Accounts > 2 and
Number-Delinquent-Billing-Cycles >1
THEN DENAY CREDIT
IF Other-Delinquent-Accounts = 0 and
Income > $30k
THEN GRANT CREDIT
Example 2: Clustering news
• Data: Reuters news / Web data
• Goal: Basic category classification:
– Business, sports, politics, etc.
– classify to subcategories (unspecified)
• Methodology:
– consider “typical words” for each
category.
– Classify using a “distance “ measure.
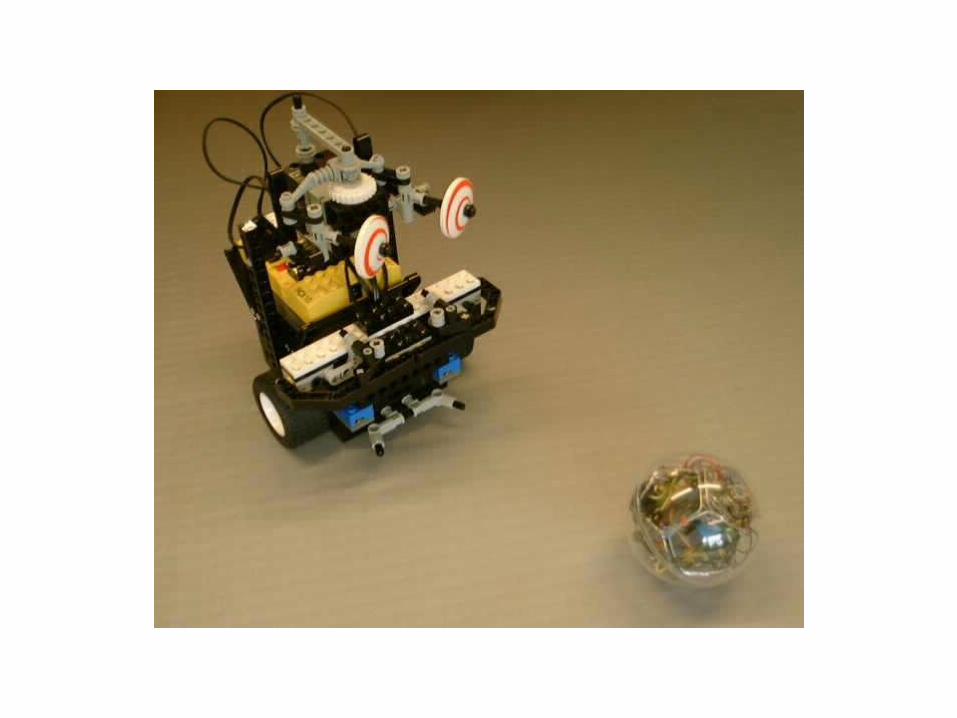
Example 3: Robot control
• Goal: Control a robot in an unknown environment.
• Needs both – to explore (new places and action)
– to use acquired knowledge to gain benefits.
• Learning task “control” what is observes!
Example 4: Medical Application
• Goal: Monitor multiple physiological parameters.– Control a robot in an unknown
environment.
• Needs both – to explore (new places and action)
– to use acquired knowledge to gain benefits.
• Learning task “control” what is observes!
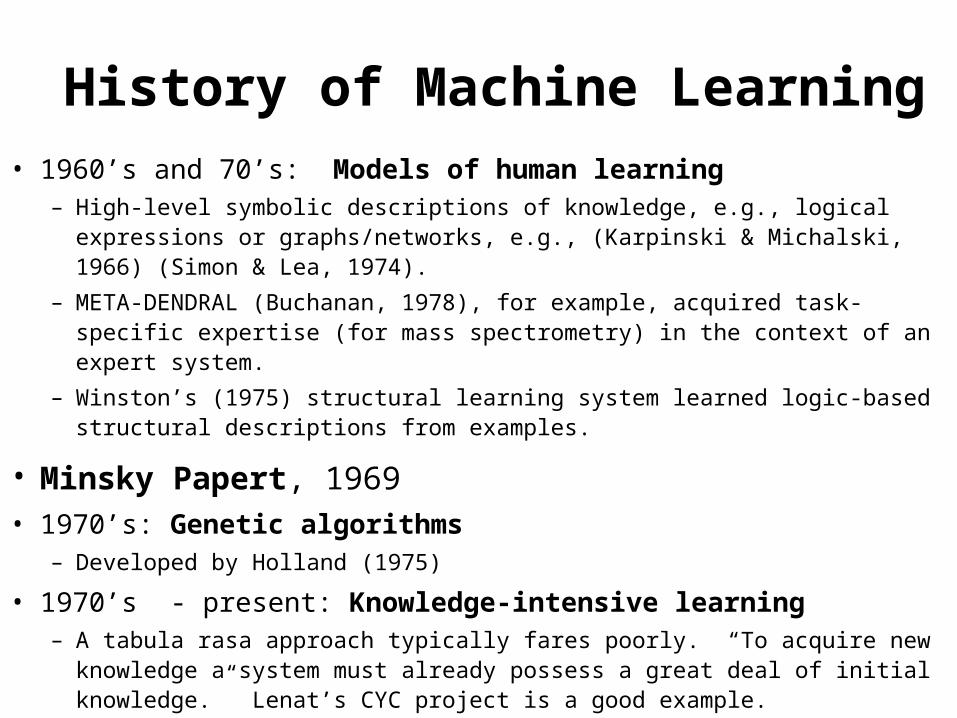
History of Machine Learning• 1960’s and 70’s: Models of human learning
– High-level symbolic descriptions of knowledge, e.g., logical expressions or graphs/networks, e.g., (Karpinski & Michalski, 1966) (Simon & Lea, 1974).
– META-DENDRAL (Buchanan, 1978), for example, acquired task-specific expertise (for mass spectrometry) in the context of an expert system.
– Winston’s (1975) structural learning system learned logic-based structural descriptions from examples.
• Minsky Papert, 1969 • 1970’s: Genetic algorithms
– Developed by Holland (1975)
• 1970’s - present: Knowledge-intensive learning– A tabula rasa approach typically fares poorly. “To acquire new
knowledge a system must already possess a great deal of initial knowledge.” Lenat’s CYC project is a good example.
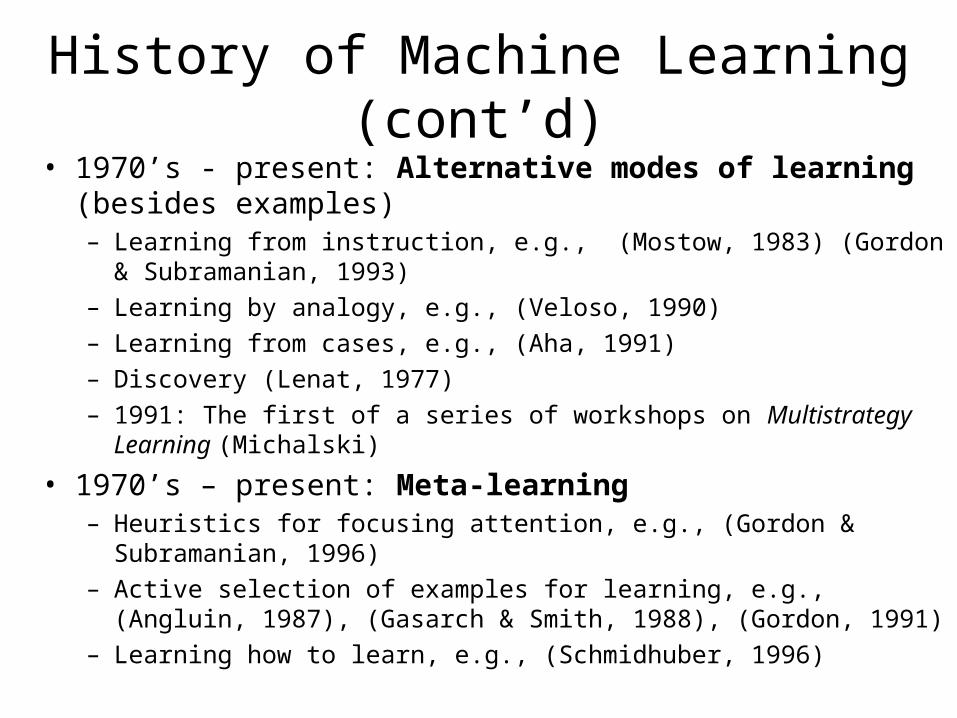
History of Machine Learning (cont’d)
• 1970’s - present: Alternative modes of learning (besides examples)– Learning from instruction, e.g., (Mostow, 1983) (Gordon &
Subramanian, 1993)– Learning by analogy, e.g., (Veloso, 1990)– Learning from cases, e.g., (Aha, 1991)– Discovery (Lenat, 1977)– 1991: The first of a series of workshops on Multistrategy
Learning (Michalski)
• 1970’s – present: Meta-learning– Heuristics for focusing attention, e.g., (Gordon &
Subramanian, 1996)– Active selection of examples for learning, e.g., (Angluin,
1987), (Gasarch & Smith, 1988), (Gordon, 1991)– Learning how to learn, e.g., (Schmidhuber, 1996)
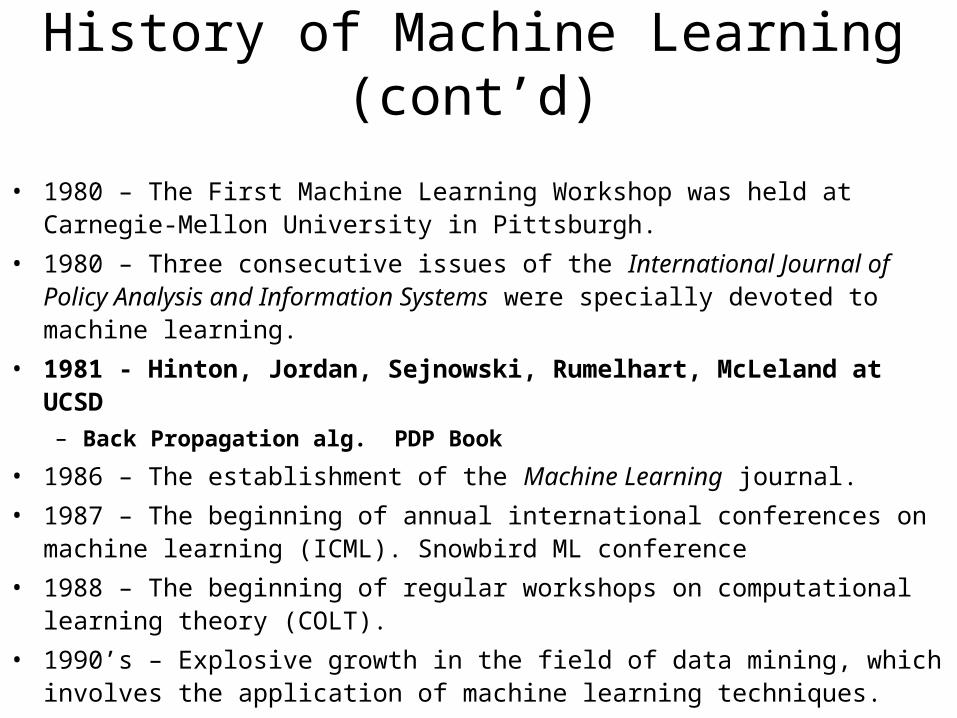
History of Machine Learning (cont’d)
• 1980 – The First Machine Learning Workshop was held at Carnegie-Mellon University in Pittsburgh.
• 1980 – Three consecutive issues of the International Journal of Policy Analysis and Information Systems were specially devoted to machine learning.
• 1981 - Hinton, Jordan, Sejnowski, Rumelhart, McLeland at UCSD – Back Propagation alg. PDP Book
• 1986 – The establishment of the Machine Learning journal.
• 1987 – The beginning of annual international conferences on machine learning (ICML). Snowbird ML conference
• 1988 – The beginning of regular workshops on computational learning theory (COLT).
• 1990’s – Explosive growth in the field of data mining, which involves the application of machine learning techniques.
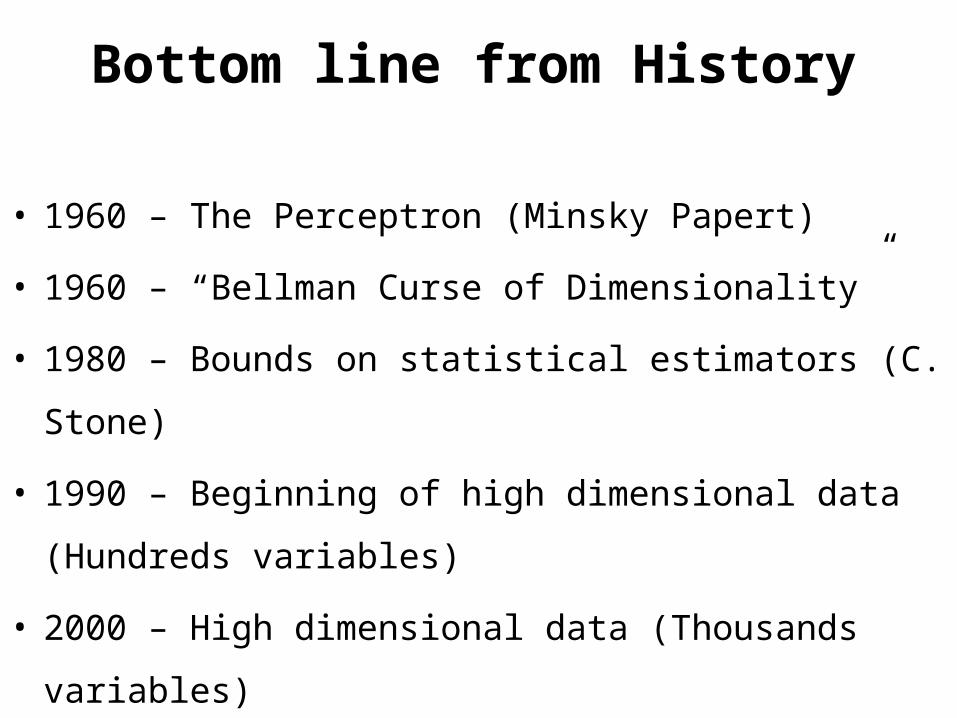
Bottom line from History
• 1960 – The Perceptron (Minsky Papert)
• 1960 – “Bellman Curse of Dimensionality”
• 1980 – Bounds on statistical estimators (C.
Stone)
• 1990 – Beginning of high dimensional data
(Hundreds variables)
• 2000 – High dimensional data (Thousands
variables)
A Glimpse in to the future
• Today status:– First-generation algorithms:– Neural nets, decision trees, etc.
• Future:– Smart remote controls, phones, cars – Data and communication networks,
software
Type of models
• Supervised learning– Given access to classified data
• Unsupervised learning– Given access to data, but no
classification– Important for data reduction
• Control learning– Selects actions and observes
consequences.– Maximizes long-term cumulative
return.
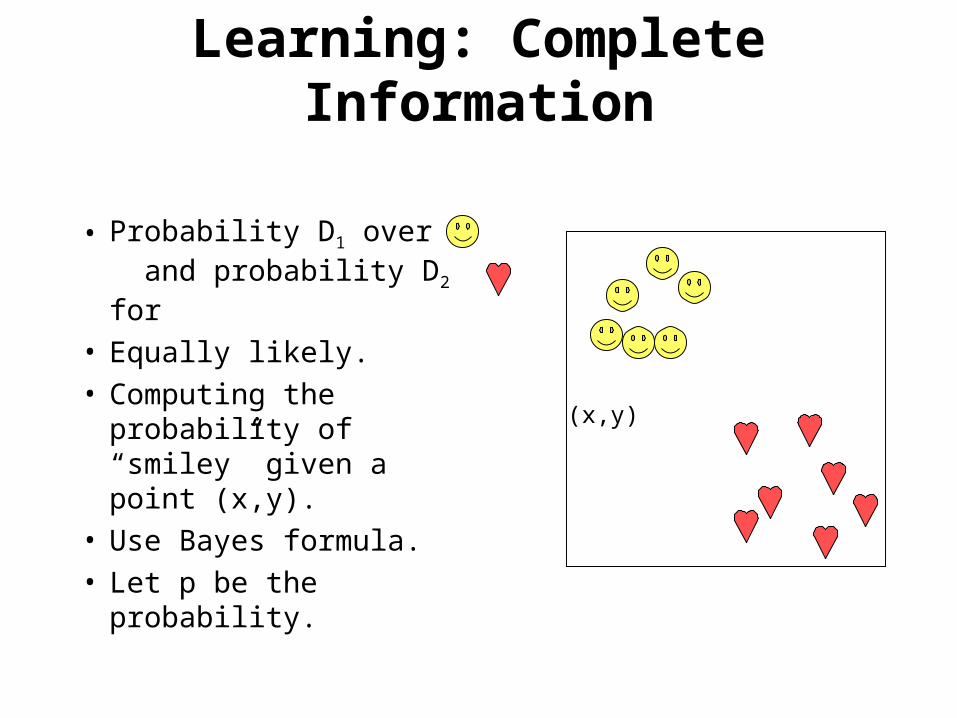
• Probability D1 over and probability D2 for
• Equally likely.• Computing the
probability of “smiley” given a point (x,y).
• Use Bayes formula.• Let p be the
probability.
Learning: Complete Information
(x,y)
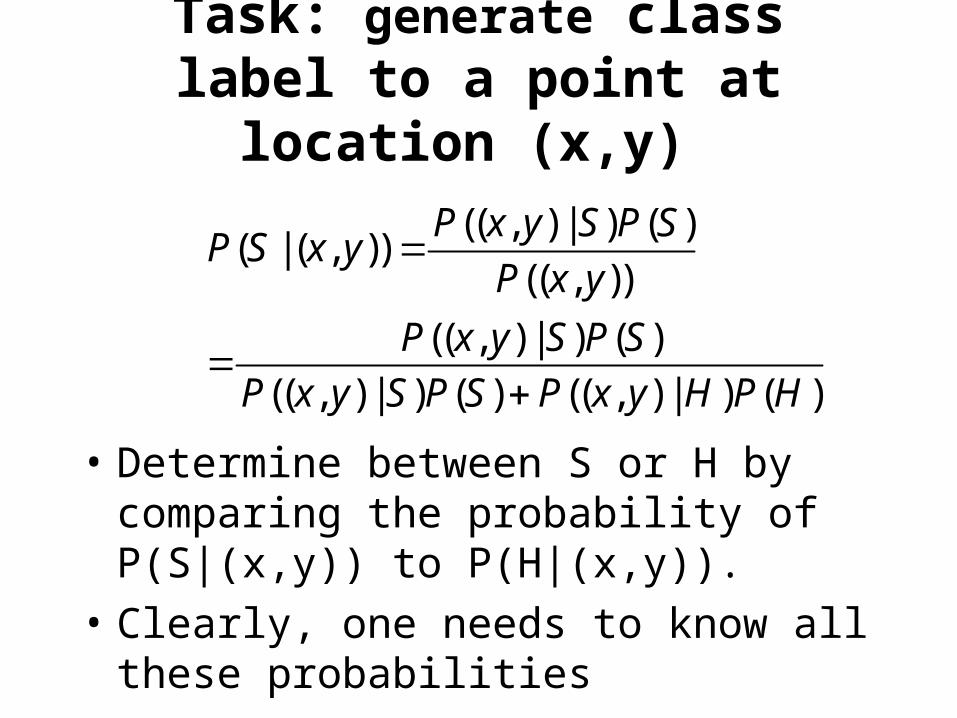
Task: generate class label to a point at location (x,y)
• Determine between S or H by comparing the probability of P(S|(x,y)) to P(H|(x,y)).
• Clearly, one needs to know all these probabilities
(( , ) | ) ( )( | ( , ))
(( , ))
(( , ) | ) ( )
(( , ) | ) ( ) (( , ) | ) ( )
P x y S P SP S x y
P x y
P x y S P S
P x y S P S P x y H P H
Predictions and Loss Model
• How do we determine the optimality of the prediction
• We define a loss for every prediction• Try to minimize the loss
– Predict a Boolean value.– each error we lose 1 (no error no loss.)– Compare the probability p to 1/2.– Predict deterministically with the higher
value.– Optimal prediction (for zero-one loss)
• Can not recover probabilities!
Bayes Estimator
• A Bayes estimator associated with a prior
distribution p and a loss function L is an
estimator d which minimizes r(p,d). For
every x, it is given by d(x), argument of
min on estimators d of p(p,d|x). The value
r(p) = r(p,dap) is then called the Bayes
risk.
Other Loss Models
• Quadratic loss– Predict a “real number” q for outcome
1.
– Loss (q-p)2 for outcome 1
– Loss ([1-q]-[1-p])2 for outcome 0
– Expected loss: (p-q)2
– Minimized for p=q (Optimal prediction)
• Recovers the probabilities
• Needs to know p to compute loss!
The basic PAC Model
•A batch learning model, i.e., the algorithm is
trained over some fixed data set
•Assumption: Fixed (Unknown distribution D of x in a domain X)
•The error of a hypothesis h w.r.t. a target concept f is
e(h)= PrD[h(x)≠f(x)]
•Goal: Given a collection of hypotheses H, find h in H that minimizes e(h).
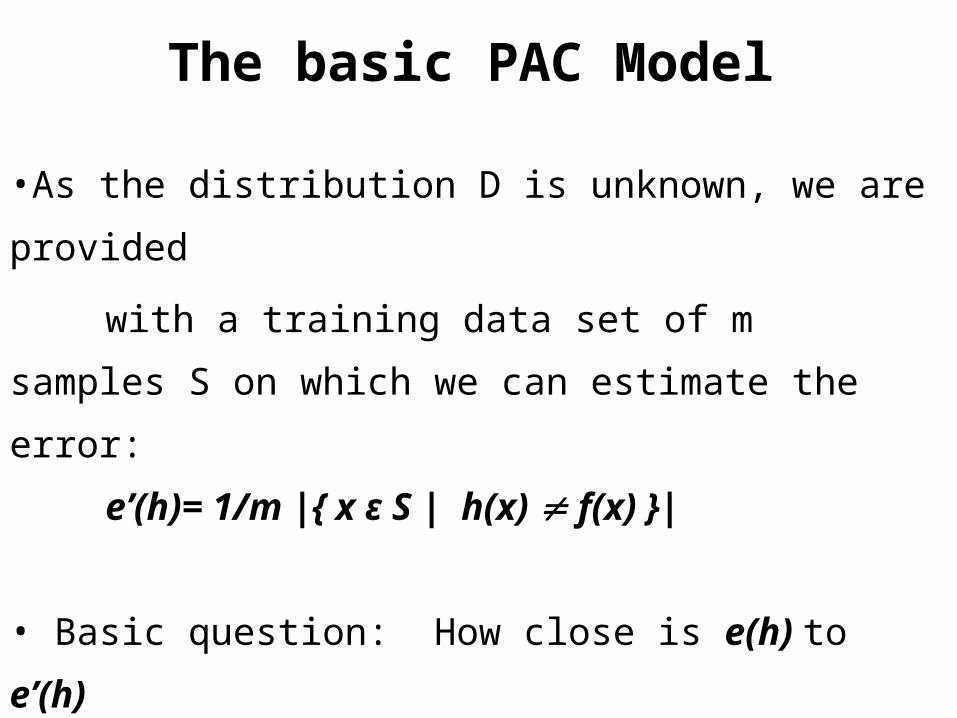
The basic PAC Model
•As the distribution D is unknown, we are
provided
with a training data set of m samples S on
which we can estimate the error:
e’(h)= 1/m |{ x ε S | h(x) f(x) }|
• Basic question: How close is e(h) to e’(h)
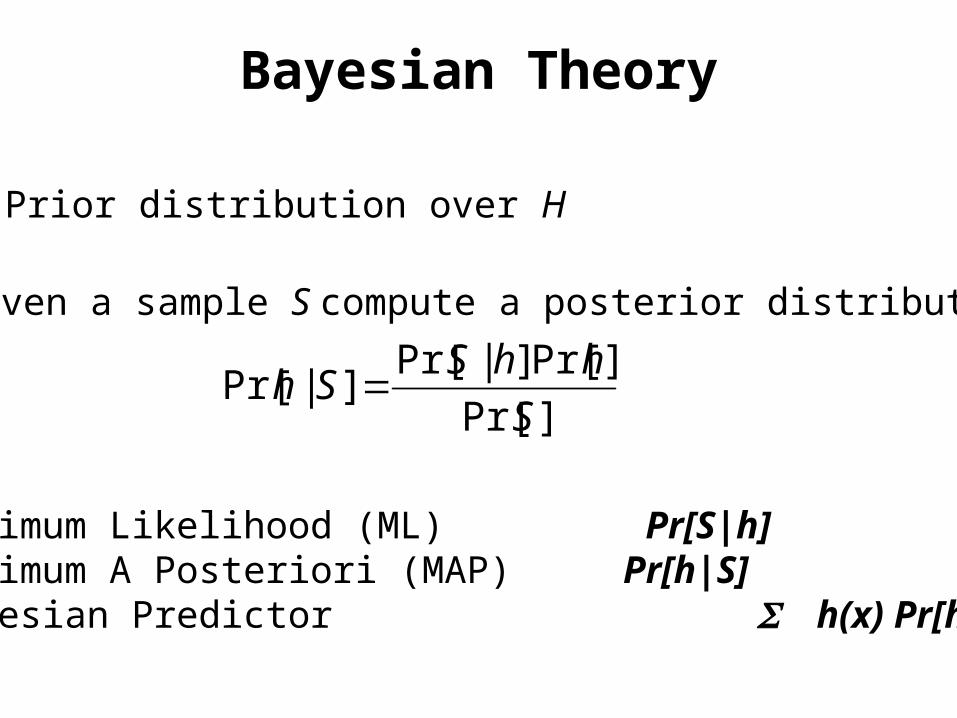
Bayesian Theory
Prior distribution over H
Given a sample S compute a posterior distribution:
Maximum Likelihood (ML) Pr[S|h]Maximum A Posteriori (MAP) Pr[h|S]Bayesian Predictor h(x) Pr[h|S].
]Pr[
]Pr[]|Pr[]|Pr[
S
hhSSh
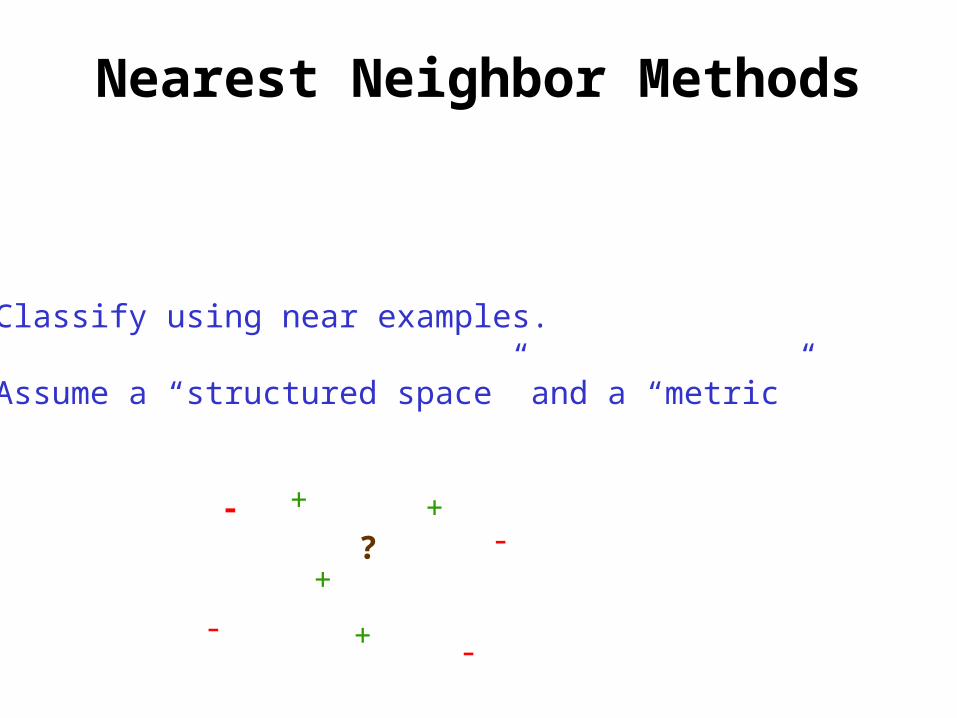
Nearest Neighbor Methods
Classify using near examples.
Assume a “structured space” and a “metric”
+
+
+
+
-
-
-
-?
Computational Methods
•How to find a hypothesis h from a collection Hwith low observed error.
•Most cases computational tasks are provably hard.
• Some methods are only for binary h and others for both.
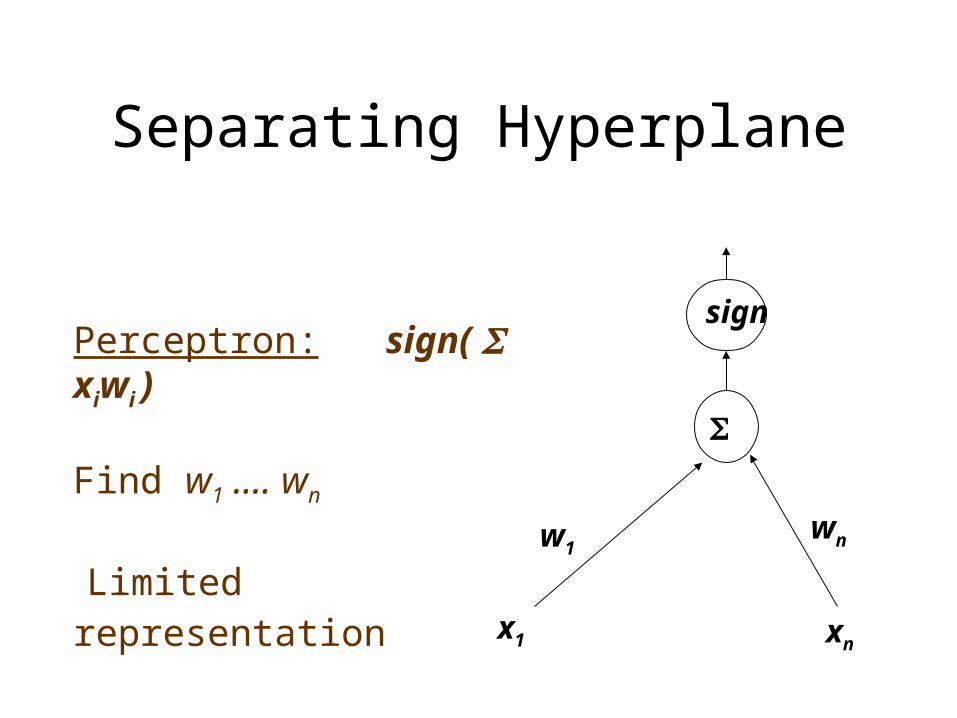
Separating Hyperplane
Perceptron: sign( xiwi ) Find w1 .... wn
Limited representationx1 xn
w1wn
sign
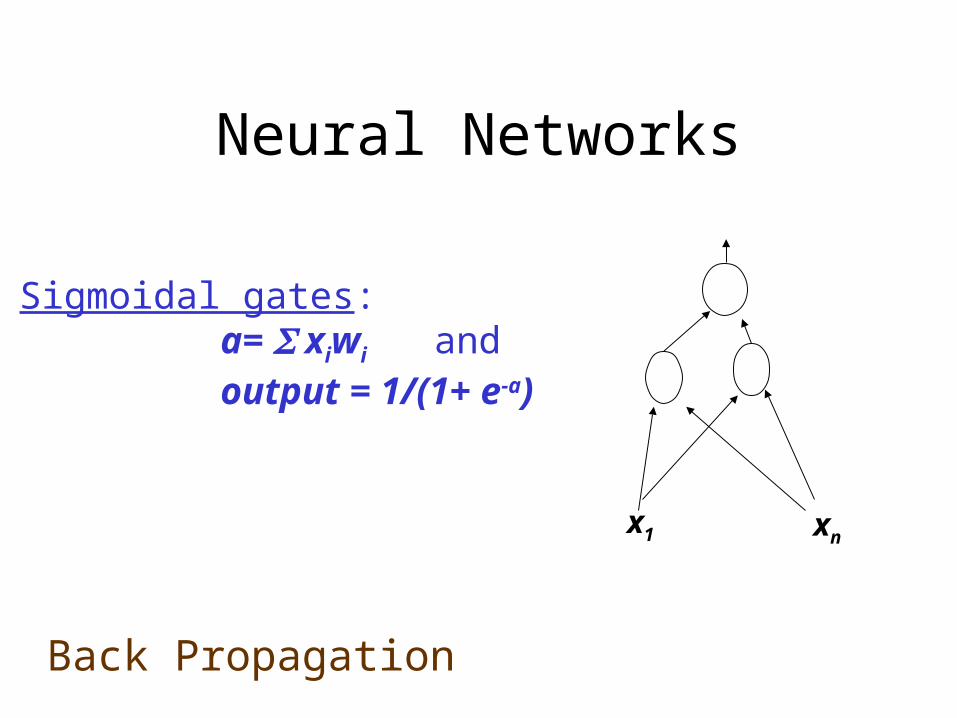
Neural Networks
Sigmoidal gates: a= xiwi and output = 1/(1+ e-a)
Back Propagation
x1 xn
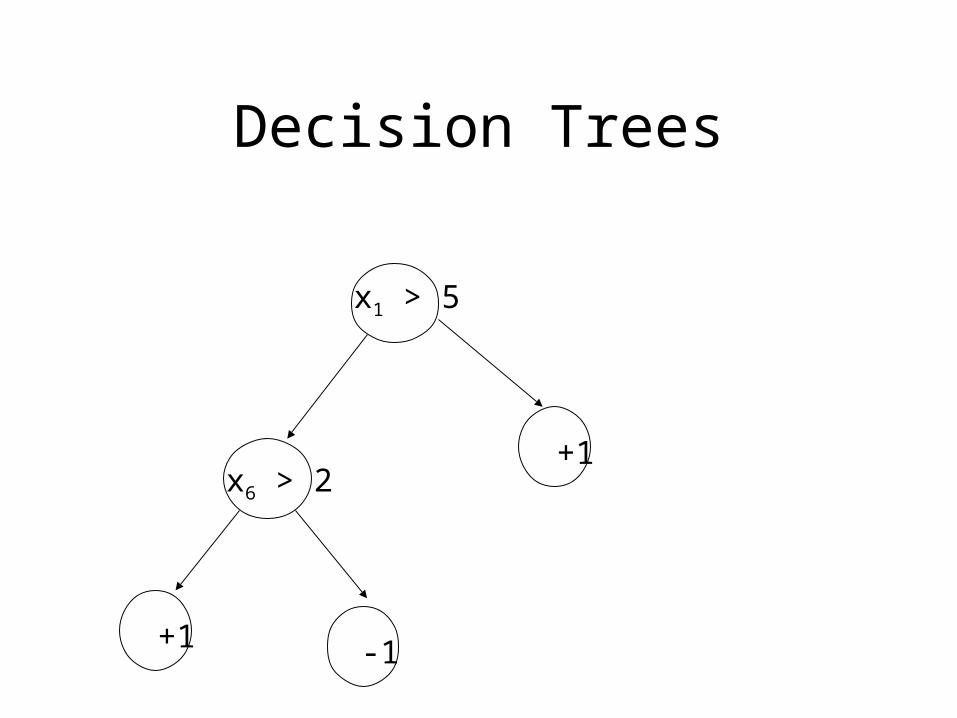
Decision Trees
x1 > 5
x6 > 2
+1 -1
+1
Decision Trees
Limited Representation
Efficient Algorithms.
Aim: Find a small decision tree with low observed error.
Decision Trees
PHASE I:Construct the tree greedy, using a local index function.Ginni Index : G(x) = x(1-x), Entropy H(x) ...
PHASE II:Prune the decision Tree while maintaining low observed error.
Good experimental results
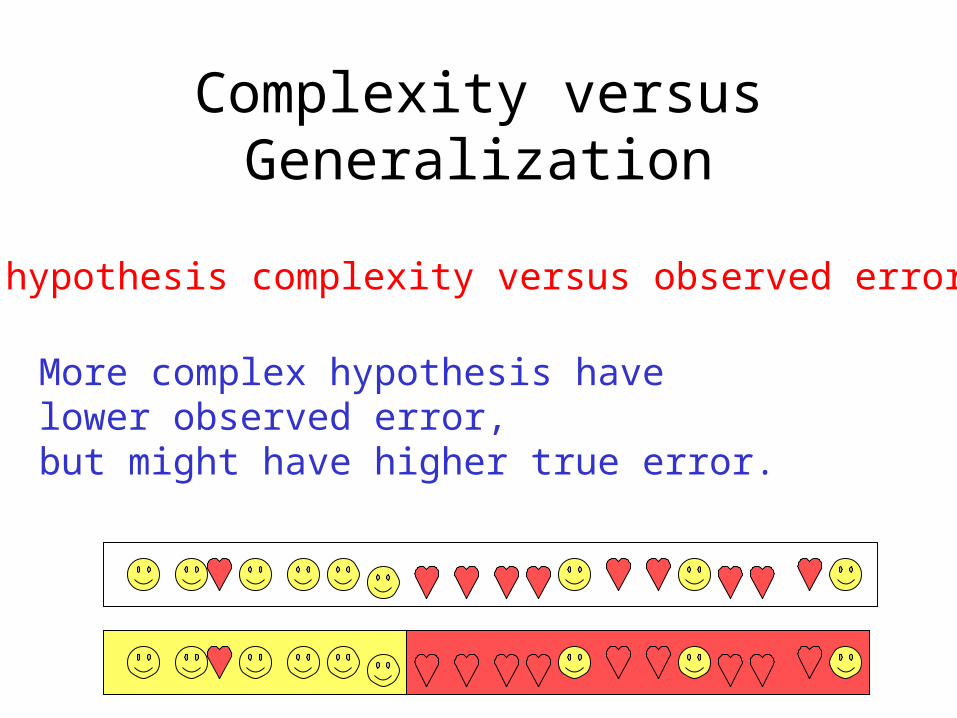
Complexity versus Generalization
hypothesis complexity versus observed error.
More complex hypothesis have lower observed error, but might have higher true error.
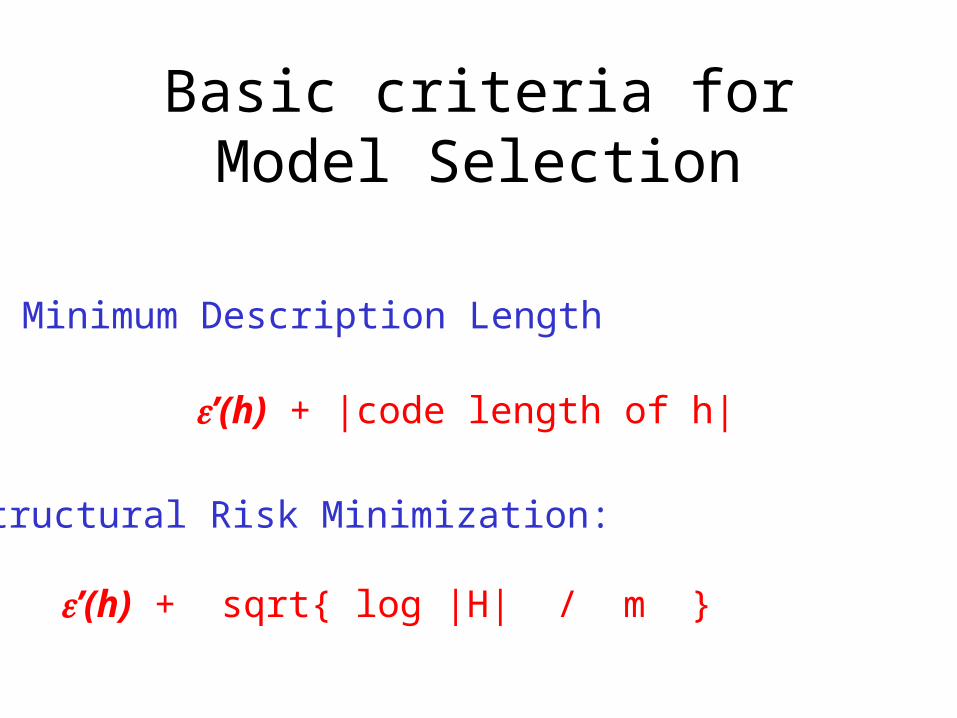
Basic criteria for Model Selection
Minimum Description Length
’(h) + |code length of h|
Structural Risk Minimization:
’(h) + sqrt{ log |H| / m }
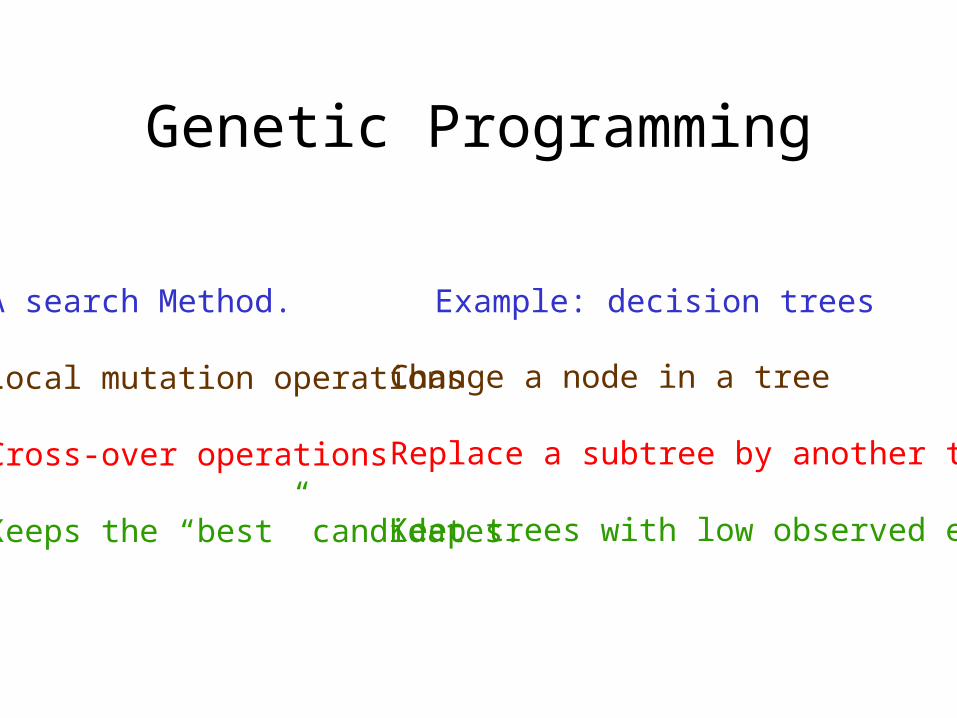
Genetic Programming
A search Method.
Local mutation operations
Cross-over operations
Keeps the “best” candidates.
Change a node in a tree
Replace a subtree by another tree
Keep trees with low observed error
Example: decision trees
General PAC Methodology
Minimize the observed error.
Search for a small size classifier
Hand-tailored search method for specific classes.
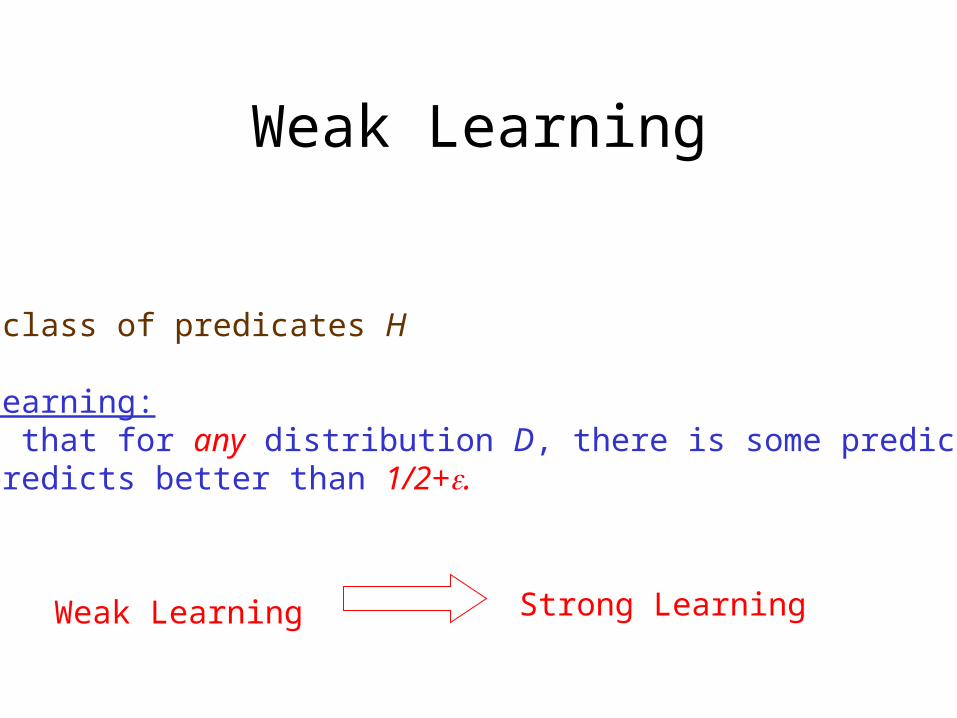
Weak Learning
Small class of predicates H
Weak Learning:Assume that for any distribution D, there is some predicate hHthat predicts better than 1/2+.
Weak Learning Strong Learning
Boosting Algorithms
Functions: Weighted majority of the predicates.
Methodology: Change the distribution to target “hard” examples.
Weight of an example is exponential in the number of incorrect classifications.
Extremely good experimental results and efficient algorithms.
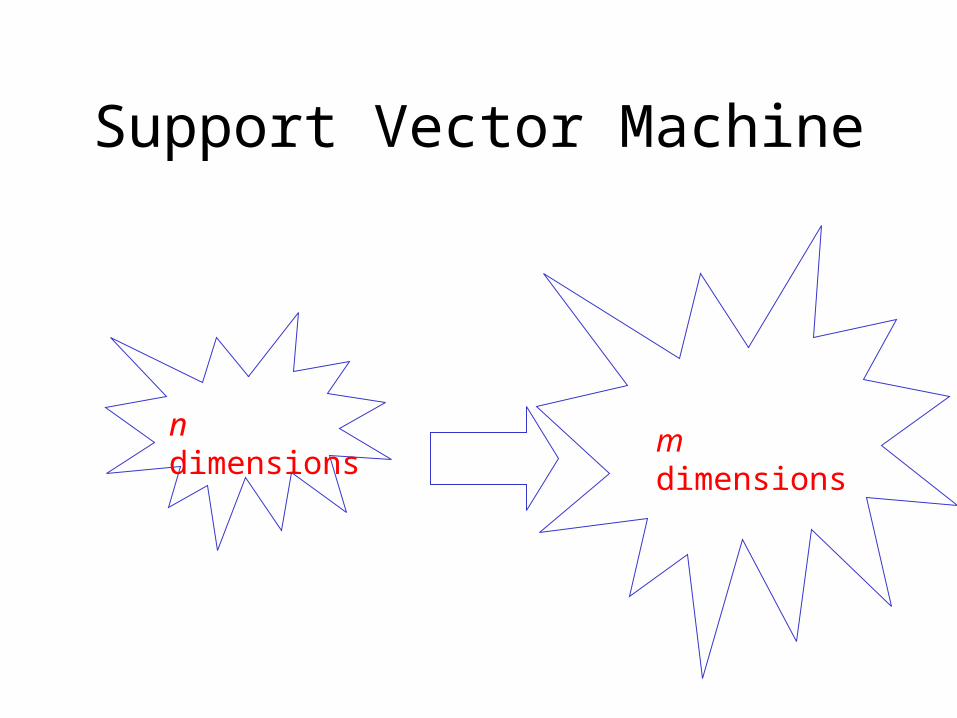
Support Vector Machine
n dimensions m dimensions
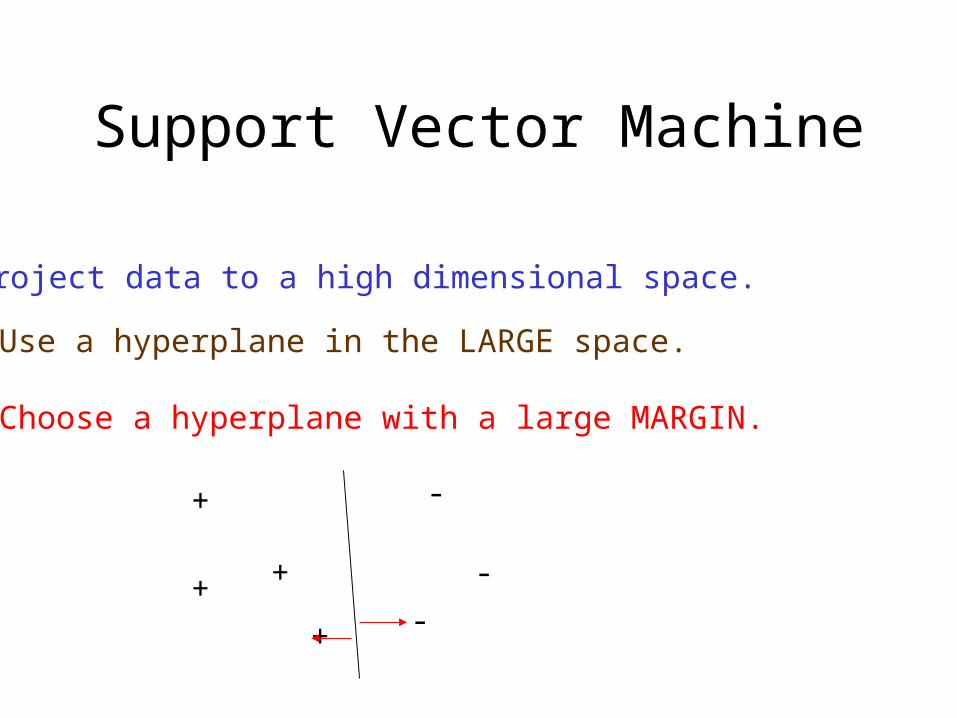
Support Vector Machine
Use a hyperplane in the LARGE space.
Choose a hyperplane with a large MARGIN.
+
+
+
+
-
-
-
Project data to a high dimensional space.
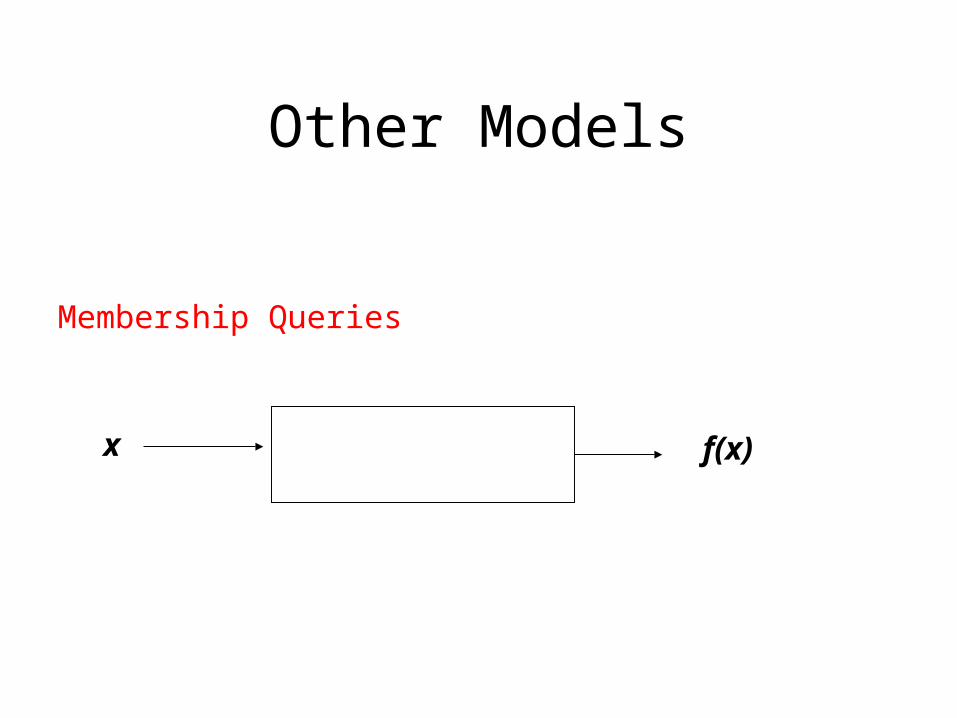
Other Models
Membership Queries
x f(x)
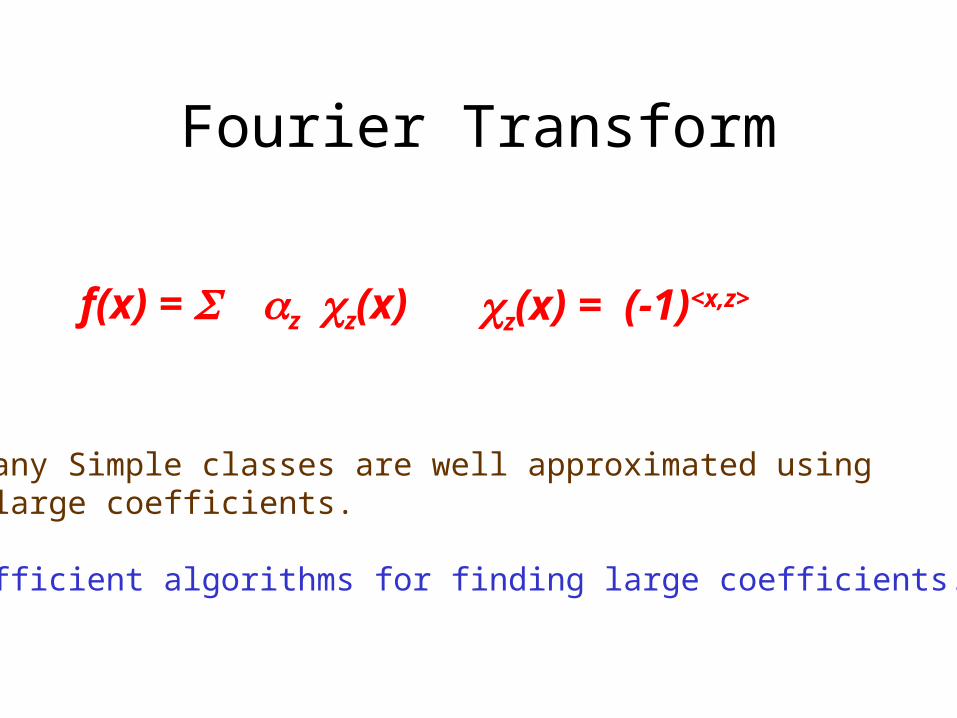
Fourier Transform
f(x) = zz(x) z(x) = (-1)<x,z>
Many Simple classes are well approximated using large coefficients.
Efficient algorithms for finding large coefficients.
Reinforcement Learning
Control Problems.
Changing the parameters changes the behavior.
Search for optimal policies.
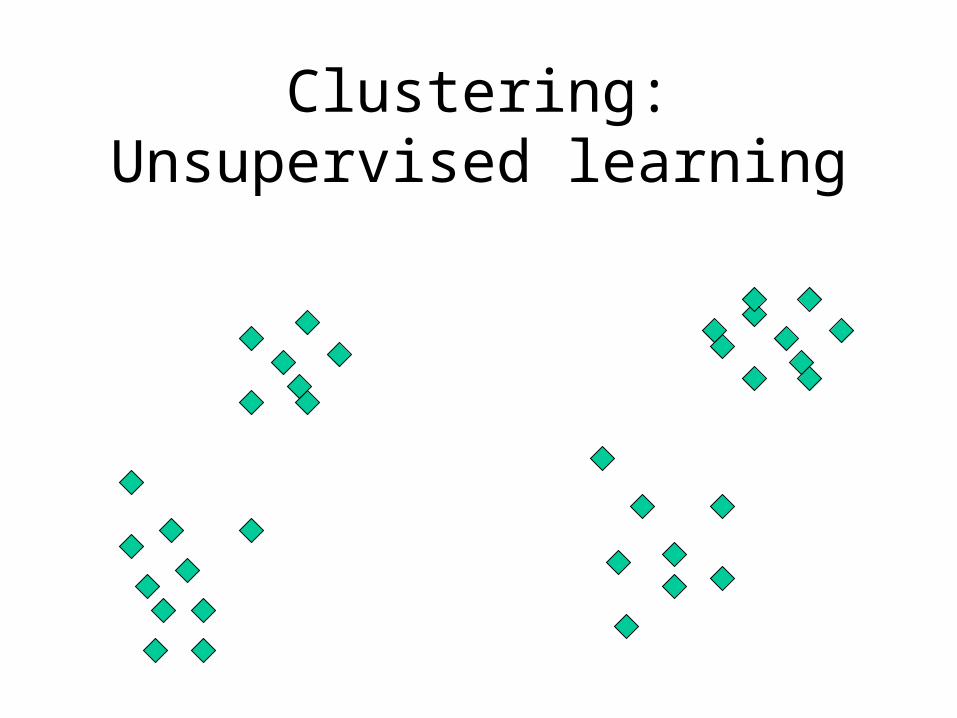
Clustering: Unsupervised learning
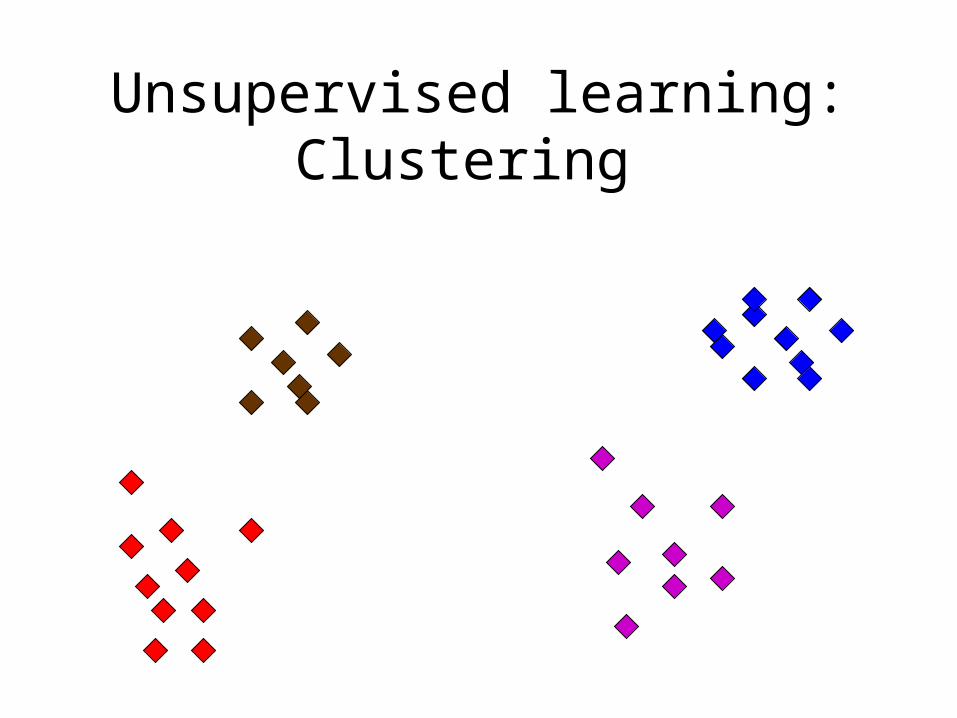
Unsupervised learning: Clustering
Basic Concepts in Probability
• For a single hypothesis h:– Given an observed error– Bound the true error
• Markov Inequality• Chebyshev Inequality• Chernoff Inequality
Basic Concepts in Probability
• Switching from h1 to h2:– Given the observed errors
– Predict if h2 is better.
• Total error rate
• Cases where h1(x) h2(x)– More refine
Course structure
• Store observations in memory and retrieve
– Simple, little generalization (Distance measure?)
• Learn a set of rules and apply to new data
– Sometimes difficult to find a good model
– Good generalization
• Estimate a “flexible model” from the data
– Generalization issues, data size issues