machine and plant diagnostics with prodiag - siemens ag · pdf file1 introduction machine and...
TRANSCRIPT

Machine and Plant Diagnostics with ProDiag
TIA Portal, S7-1500 CPU
https://support.industry.siemens.com/cs/ww/en/view/109740151
Siemens Industry Online Support

Warranty and Liability
Machine and Plant Diagnostics with ProDiag Entry ID: 109740151, V3.0, 09/2017 2
S
iem
en
s A
G C
op
yri
gh
t-2
01
7 A
ll ri
gh
ts r
eserv
ed
Warranty and Liability
Note The Application Examples are not binding and do not claim to be complete regarding the circuits shown, equipping and any eventuality. The Application Examples do not represent customer-specific solutions. They are only intended to provide support for typical applications. You are responsible for ensuring that the described products are correctly used. These Application Examples do not relieve you of the responsibility of safely and professionally using, installing, operating and servicing equipment. When using these Application Examples, you recognize that Siemens cannot be made liable for any damage/claims beyond the liability clause described. We reserve the right to make changes to these Application Examples at any time without prior notice. If there are any deviations between the recommendations provided in this Application Example and other Siemens publications – e.g. Catalogs – the contents of the other documents have priority.
We do not accept any liability for the information contained in this document. Any claims against us – based on whatever legal reason – resulting from the use of the examples, information, programs, engineering and performance data etc., described in this Application Example shall be excluded. Such an exclusion shall not apply in the case of mandatory liability, e.g. under the German Product Liability Act (“Produkthaftungsgesetz”), in case of intent, gross negligence, or injury of life, body or health, guarantee for the quality of a product, fraudulent concealment of a deficiency or breach of a condition which goes to the root of the contract (“wesentliche Vertragspflichten”). However, claims arising from a breach of a condition which goes to the root of the contract shall be limited to the foreseeable damage which is intrinsic to the contract, unless caused by intent or gross negligence or based on mandatory liability for injury of life, body or health. The above provisions do not imply a change of the burden of proof to your detriment.
It is not permissible to transfer or copy these Application Examples or excerpts of them without first having prior authorization from Siemens AG in writing.
Security informa-
tion
Siemens provides products and solutions with industrial security functions that support the secure operation of plants, systems, machines and networks.
To protect plants, systems, machines and networks against cyber threats, it is necessary to implement (and continuously maintain) a holistic, state-of-the-art industrial security concept. Products and solutions from Siemens are only one part of such a concept.
The customer is responsible for preventing unauthorized access to the customer’s plants, systems, machines and networks. Systems, machines and components should be connected to the company network or the Internet only if and to the extent necessary and if appropriate protective action (e.g., use of firewalls and network segmentation) was taken.
In addition, Siemens’ recommendations regarding appropriate protective action should be followed. For more information about industrial security, visit http://www.siemens.com/industrialsecurity.
Siemens’ products and solutions undergo continuous development to make them even more secure. Siemens strongly recommends to perform updates as they become available and use only the latest product versions. Using versions that are out of date or no longer supported can increase the risk of cyber threats.
To stay informed about product updates as they occur, subscribe to the Siemens Industrial Security RSS feed at http://www.siemens.com/industrialsecurity.

Table of Contents
Machine and Plant Diagnostics with ProDiag Entry ID: 109740151, V3.0, 09/2017 3
S
iem
en
s A
G C
op
yri
gh
t-2
01
7 A
ll ri
gh
ts r
eserv
ed
Table of Contents Warranty and Liability ................................................................................................. 2
1 Introduction ........................................................................................................ 4
1.1 Overview............................................................................................... 4 1.2 Principle of operation ............................................................................ 5 1.3 Components used ................................................................................ 7
2 Engineering ........................................................................................................ 8
2.1 Hardware configuration ........................................................................ 8 2.2 Configuration ........................................................................................ 8 2.2.1 Creating ProDiag function blocks ......................................................... 8 2.2.2 Defining supervision settings at the ProDiag FB ................................ 10 2.2.3 Creating global supervisions .............................................................. 11 2.2.4 Creating local supervisions ................................................................ 13 2.2.5 Assigning the ProDiag FB to the instance data block of an FB ......... 16 2.2.6 Querying error bits in the program ..................................................... 17 2.2.7 Creating supervisions in the GRAPH sequencer ............................... 19 2.2.8 Setting the parameters of the GRAPH sequencer ............................. 21 2.2.9 Activating initial value acquisition of the GRAPH sequencer ............. 22 2.2.10 Defining the ProDiag supervision settings ......................................... 22 2.2.11 Visualizing supervisions on the HMI .................................................. 25 2.2.12 Downloading the project ..................................................................... 31 2.3 Control and diagnostics wit WinCC Runtime Advanced .................... 32 2.3.1 Overview............................................................................................. 32 2.3.2 Controlling the conveyor system ........................................................ 33 2.3.3 Simulation and diagnostics of ProDiag supervisions ......................... 33 2.3.4 Simulation and diagnostics of GRAPH supervisions ......................... 38 2.4 Control and Diagnostics with WinCC Runtime Professional .............. 42 2.4.1 Overview............................................................................................. 42 2.4.2 Controlling the conveyor system ........................................................ 43 2.4.3 Simulation and diagnostics of ProDiag supervisions ......................... 43 2.4.4 Simulation and diagnostics of GRAPH supervisions ......................... 48
3 Appendix .......................................................................................................... 54
3.1 Service and Support ........................................................................... 54 3.2 Links and literature ............................................................................. 55 3.3 Change documentation ...................................................................... 55

1 Introduction
Machine and Plant Diagnostics with ProDiag Entry ID: 109740151, V3.0, 09/2017 4
S
iem
en
s A
G C
op
yri
gh
t-2
01
7 A
ll ri
gh
ts r
eserv
ed
1 Introduction Monitoring machines and plants plays an increasingly important role in automation technology. The ProDiag functionality integrated in TIA Portal allows you to configure custom monitoring for your machine or plant. This also allows you to diagnose faults in the process.
1.1 Overview
This application example shows a virtual conveyor system with two lifts. On the belt, cases are alternately transported to one of the lifts and then destacked upwards. The conveyor system is controlled using an operator panel (HMI) and monitored with ProDiag. The different supervisions can be simulated and displayed on the operator panel.
Figure 1-1: Plant Overview
This application example describes the following aspects:
Configuration of machine and plant monitoring with ProDiag.
The different types of supervision.
Diagnostics of supervision errors on the operator panel.
Advantage
With ProDiag, the supervisions are not programmed, but configured. This allows you to monitor your machine and plant without modifying the user program code.
Without a programmer, you diagnose the machine and plant directly on the operator panel.
Automatic synchronization ensures that all operator panel displays are always up to date.
1 Introduction
Machine and Plant Diagnostics with ProDiag Entry ID: 109740151, V3.0, 09/2017 5
S
iem
en
s A
G C
op
yri
gh
t-2
01
7 A
ll ri
gh
ts r
eserv
ed
1.2 Principle of operation
User program
The sequence of the virtual conveyor system and its simulation are programmed in the user program. The program was created using the criteria that a maximum number of machine and plant diagnostics properties can be displayed. The user program is regarded as given in this example and therefore not described in greater detail.
Supervision with ProDiag
With ProDiag, you create global and local supervisions. You can configure global supervisions to Boolean tags within a tag table or global data block. Local supervisions are configured to Boolean parameters of a function block. In this way, the user program is not modified.
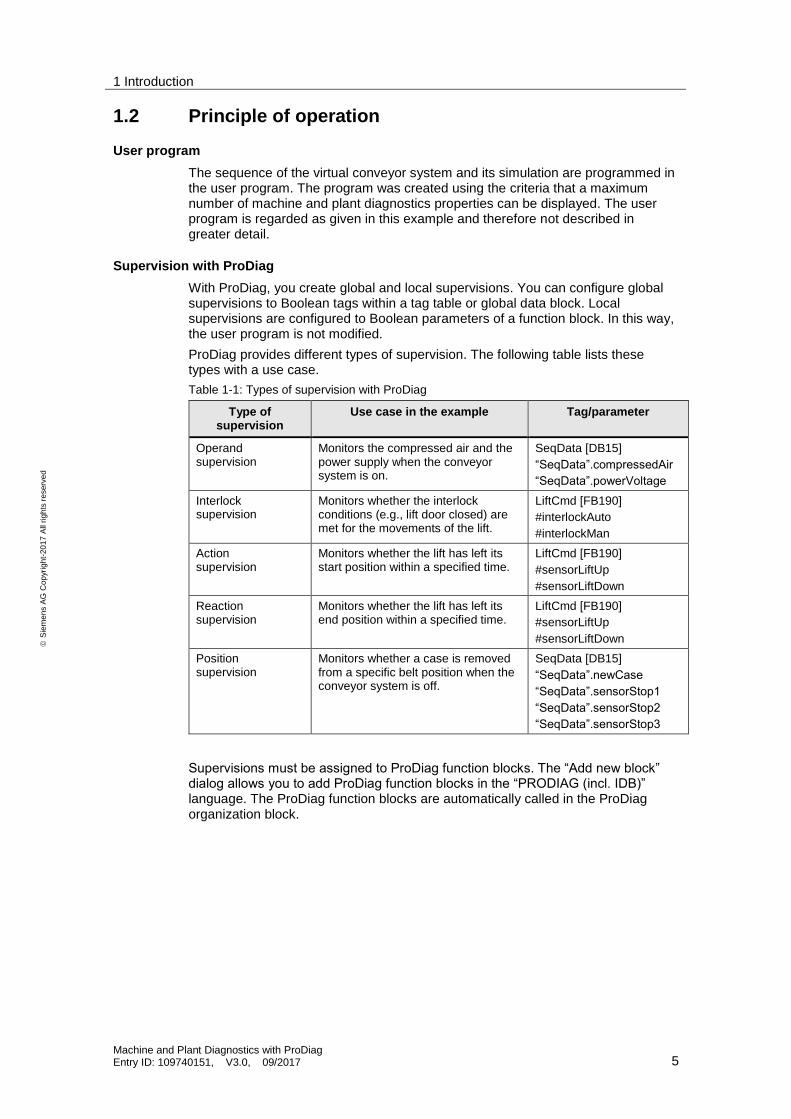
ProDiag provides different types of supervision. The following table lists these types with a use case.
Table 1-1: Types of supervision with ProDiag
Type of supervision
Use case in the example Tag/parameter
Operand supervision
Monitors the compressed air and the power supply when the conveyor system is on.
SeqData [DB15]
“SeqData”.compressedAir
“SeqData”.powerVoltage
Interlock supervision
Monitors whether the interlock conditions (e.g., lift door closed) are met for the movements of the lift.
LiftCmd [FB190]
#interlockAuto
#interlockMan
Action supervision
Monitors whether the lift has left its start position within a specified time.
LiftCmd [FB190]
#sensorLiftUp
#sensorLiftDown
Reaction supervision
Monitors whether the lift has left its end position within a specified time.
LiftCmd [FB190]
#sensorLiftUp
#sensorLiftDown
Position supervision
Monitors whether a case is removed from a specific belt position when the conveyor system is off.
SeqData [DB15]
“SeqData”.newCase
“SeqData”.sensorStop1
“SeqData”.sensorStop2
“SeqData”.sensorStop3
Supervisions must be assigned to ProDiag function blocks. The “Add new block” dialog allows you to add ProDiag function blocks in the “PRODIAG (incl. IDB)” language. The ProDiag function blocks are automatically called in the ProDiag organization block.

1 Introduction
Machine and Plant Diagnostics with ProDiag Entry ID: 109740151, V3.0, 09/2017 6
S
iem
en
s A
G C
op
yri
gh
t-2
01
7 A
ll ri
gh
ts r
eserv
ed
Supervision with GRAPH
For the GRAPH programming language, the supervisions have already been integrated into each single step. GRAPH provides two different types of supervision. The following table lists these types with a use case.
Table 1-2: Types of supervision with GRAPH
Type of supervision
Use case in the example
Interlock Via an interlock, you program conditions on which the execution of the single actions depends. Actions of a step that are linked to the interlock are executed only when the interlock condition is met. If the interlock condition is not met, a fault has occurred. For this case, you can define alarms that will then be displayed. However, the fault has no influence on the transition to the next step.
This example monitors whether the lift door is closed and the lift is free.
Supervision Via a supervision, you program conditions that allow you to monitor an entire step. If the condition is met, a fault has occurred and the step remains active. This means that the sequencer does not transition to the next step.
This example monitors only steps where lifts are moved. If the movement is not processed within a specified time (step duration exceeded), an alarm is output and the step remains active.
Display on the operator panel
The occurring errors of the virtual conveyor system are displayed and diagnosed with the aid of the operator panel. For this purpose, WinCC Advanced provides different objects. The following table lists the objects:
Table 1-3: WinCC objects for displaying supervision errors
WinCC object Use case in the example
ProDiag overview The “ProDiag overview” object shows the current state of the configured supervisions. If an error occurs, the error type and category will be displayed. The integrated button allows you to open the “Alarm view”.
GRAPH overview The “GRAPH overview” object shows the following:
The current state.
The current step number.
The name of the step of the “LiftSeq” GRAPH sequencer.
If an error occurs in the sequence, the respective step will be displayed. The buttons allow you to open the “Alarm view”/“PLC code view”.
Alarm view The ProDiag alarms are displayed in the “Alarm view”. The “enablePLCCode” control tag is set for alarms that support the “PLC code view”. This enables the “PLC code” button. The button allows you to open the “PLC code view” of the selected alarm.
PLC code view The “PLC code view” object shows the current program status of the selected ProDiag alarm or “LiftSeq” GRAPH sequencer. The object supports the LAD, FBD and GRAPH programming languages. The PLC code view is possible for the following supervision alarms:
Global supervisions: interlocks only.
Local supervisions: all basic supervisions at input parameters.
Program modifications are automatically detected and updated.
Note The PLC code view cannot display F_FBD and F_LAD.
1 Introduction
Machine and Plant Diagnostics with ProDiag Entry ID: 109740151, V3.0, 09/2017 7
S
iem
en
s A
G C
op
yri
gh
t-2
01
7 A
ll ri
gh
ts r
eserv
ed
1.3 Components used
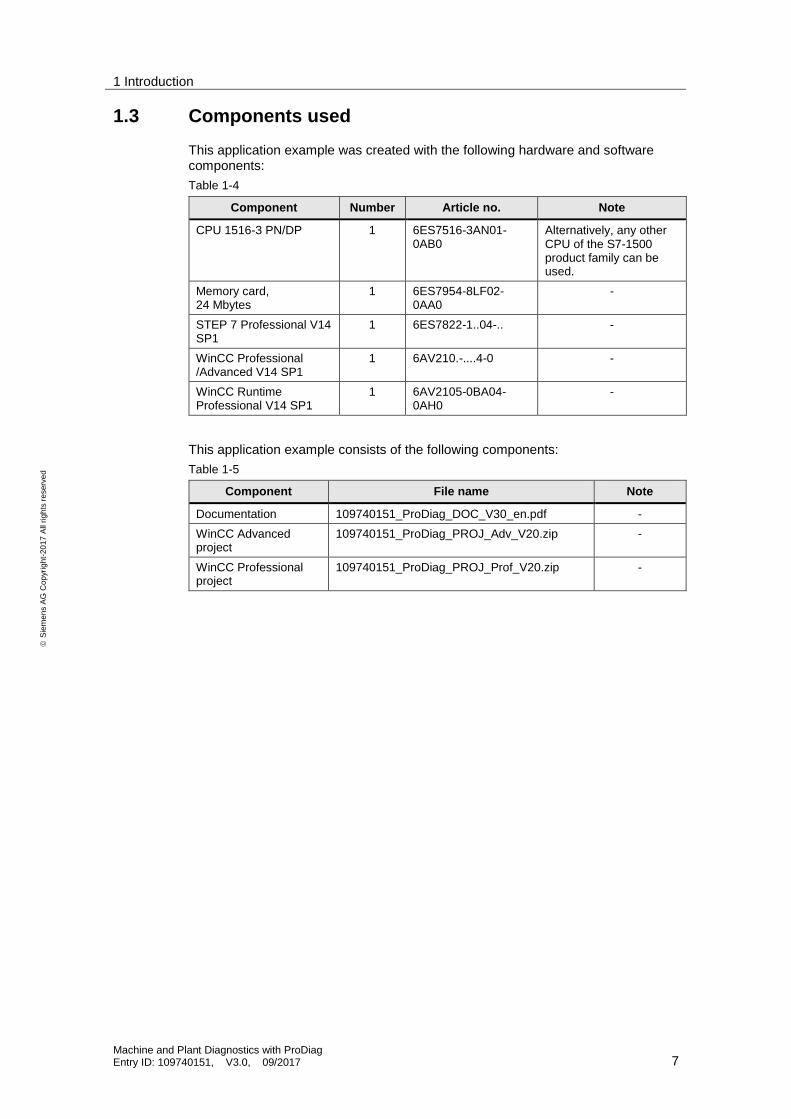
This application example was created with the following hardware and software components:
Table 1-4
Component Number Article no. Note
CPU 1516-3 PN/DP 1 6ES7516-3AN01-0AB0
Alternatively, any other CPU of the S7-1500 product family can be used.
Memory card, 24 Mbytes
1 6ES7954-8LF02-0AA0
-
STEP 7 Professional V14 SP1
1 6ES7822-1..04-.. -
WinCC Professional /Advanced V14 SP1
1 6AV210.-....4-0 -
WinCC Runtime Professional V14 SP1
1 6AV2105-0BA04-0AH0
-
This application example consists of the following components:
Table 1-5
Component File name Note
Documentation 109740151_ProDiag_DOC_V30_en.pdf -
WinCC Advanced project
109740151_ProDiag_PROJ_Adv_V20.zip -
WinCC Professional project
109740151_ProDiag_PROJ_Prof_V20.zip -

2 Engineering
Machine and Plant Diagnostics with ProDiag Entry ID: 109740151, V3.0, 09/2017 8
S
iem
en
s A
G C
op
yri
gh
t-2
01
7 A
ll ri
gh
ts r
eserv
ed
2 Engineering
2.1 Hardware configuration
The following figure shows the hardware configuration of the application.
Figure 2-1: Hardware configuration
SIMATIC HMI
TP1200
Comfort
PN PN
L+ M
SIMATIC
CPU 1516
PN DPPN
L+ M
PROFINET IE
Note Follow the installation guidelines of the devices.
2.2 Configuration
2.2.1 Creating ProDiag function blocks
A ProDiag FB is created in the PRODIAG programming language, e.g., using the “Add new block” dialog.
To do this, proceed as follows:
1. In the “Program blocks” folder, double-click the “Add new block” command. The “Add new block” dialog opens.
2. Click the “Function block” button.
3. Enter the name “LiftProDiagFB” for the new ProDiag FB.
4. In “Language”, select “PRODIAG (incl. IDB)”.
5. To add more properties of the new ProDiag function block, click “Additional information”. An area with more input fields is displayed.
6. Enter the desired properties.
7. Check the “Add new and open” check box if you want to open the ProDiag function block right away.
8. Confirm your entries with “OK”.

2 Engineering
Machine and Plant Diagnostics with ProDiag Entry ID: 109740151, V3.0, 09/2017 9
S
iem
en
s A
G C
op
yri
gh
t-2
01
7 A
ll ri
gh
ts r
eserv
ed
Figure 2-2: “Add new block” dialog
Alternatively, you can create ProDiag FBs as follows:
When creating global supervisions
When calling an FB with local supervision
At the instance data block of an FB
In the ProDiag overview table
Note By creating one ProDiag FB per unit, you can structure your supervision according to the machine and plant units.

2 Engineering
Machine and Plant Diagnostics with ProDiag Entry ID: 109740151, V3.0, 09/2017 10
S
iem
en
s A
G C
op
yri
gh
t-2
01
7 A
ll ri
gh
ts r
eserv
ed
2.2.2 Defining supervision settings at the ProDiag FB
Global enable criterion
The global enable criterion allows you to control the call of the ProDiag FB in the ProDiag OB. The global enable criterion must be a global Boolean tag. The ProDiag FB is called only when the signal state of this tag is “TRUE”. It allows you to specifically disable, for example, all supervisions of the ProDiag FB.
To define a global enable criterion, proceed as follows:
1. Right-click the “LiftProDiagFB” ProDiag FB and from the context menu, select “Properties...”. The ProDiag FB’s properties dialog opens.
2. In the “General” tab, click “Supervision settings”.
3. Select the global Boolean tag “SeqData”.globalEnabler as the global enable criterion.
Figure 2-3: “Global enabler” dialog
Note You can also use the global enable criterion to prevent, for example, a flood of alarms.
Category enable criterion
The category enable criterion allows you to enable and disable the supervisions for each single category of the ProDiag FB.
A category enable criterion is configured in the same way as the global enable criterion.
2 Engineering
Machine and Plant Diagnostics with ProDiag Entry ID: 109740151, V3.0, 09/2017 11
S
iem
en
s A
G C
op
yri
gh
t-2
01
7 A
ll ri
gh
ts r
eserv
ed
2.2.3 Creating global supervisions
In the application example, global supervisions are created at Boolean tags in the global data block “SeqData”.
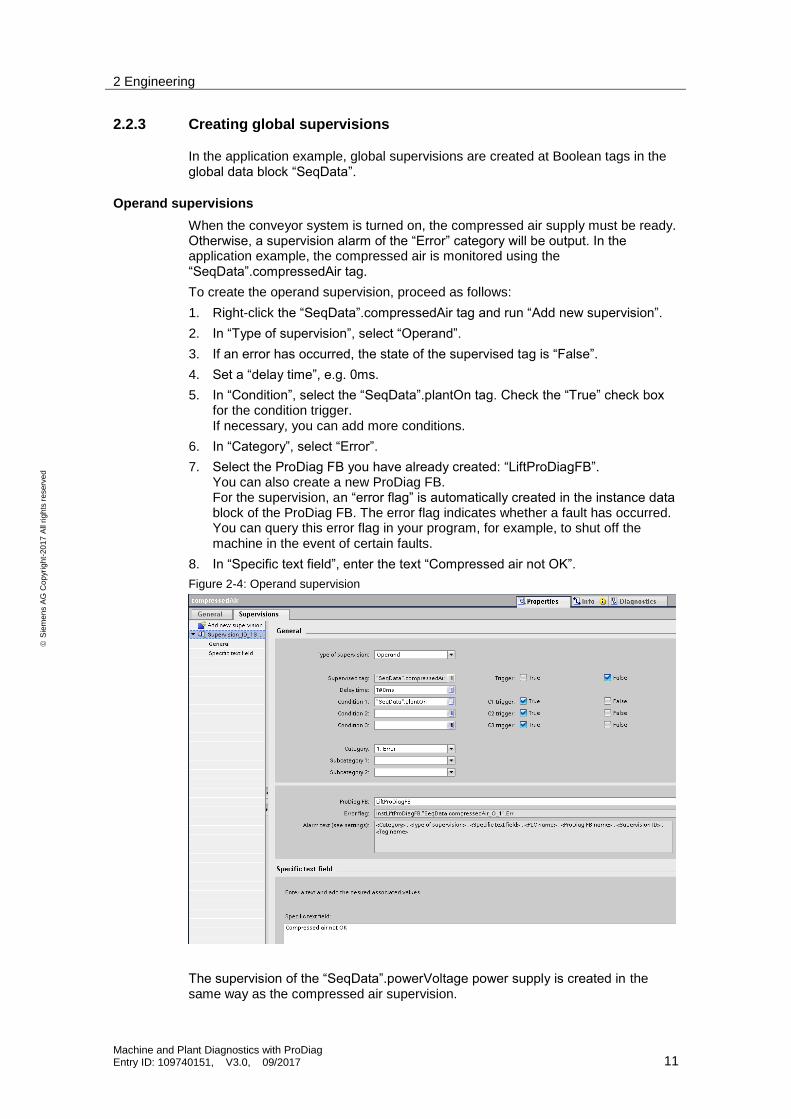
Operand supervisions
When the conveyor system is turned on, the compressed air supply must be ready. Otherwise, a supervision alarm of the “Error” category will be output. In the application example, the compressed air is monitored using the “SeqData”.compressedAir tag.
To create the operand supervision, proceed as follows:
1. Right-click the “SeqData”.compressedAir tag and run “Add new supervision”.
2. In “Type of supervision”, select “Operand”.
3. If an error has occurred, the state of the supervised tag is “False”.
4. Set a “delay time”, e.g. 0ms.
5. In “Condition”, select the “SeqData”.plantOn tag. Check the “True” check box for the condition trigger. If necessary, you can add more conditions.
6. In “Category”, select “Error”.
7. Select the ProDiag FB you have already created: “LiftProDiagFB”. You can also create a new ProDiag FB. For the supervision, an “error flag” is automatically created in the instance data block of the ProDiag FB. The error flag indicates whether a fault has occurred. You can query this error flag in your program, for example, to shut off the machine in the event of certain faults.
8. In “Specific text field”, enter the text “Compressed air not OK”.
Figure 2-4: Operand supervision
The supervision of the “SeqData”.powerVoltage power supply is created in the same way as the compressed air supervision.

2 Engineering
Machine and Plant Diagnostics with ProDiag Entry ID: 109740151, V3.0, 09/2017 12
S
iem
en
s A
G C
op
yri
gh
t-2
01
7 A
ll ri
gh
ts r
eserv
ed
Position supervisions
When the conveyor system is at a standstill, the supervision monitors whether a case is removed from the first position. If a case is missing, a supervision alarm of the “Warning” category will be output. In the application example, the “SeqData”.newCase tag (case exists sensor) is supervised for this purpose.
To create the position supervisions, proceed as follows:
1. Right-click the “SeqData”.newCase tag and run “Add new supervision”.
2. In “Type of supervision”, select “Position”.
3. If an error has occurred, the state of the supervised tag is “False”.
4. Set a “delay time”, e.g. 0ms.
5. The conveyor system must be in stop. In “Condition”, select the “SeqData”.autoStarted tag (automatic started) and “SeqData”.autoStopped tag (automatic stopped). For both tags, check the “False” check box for the condition trigger. In addition, the “SeqData”.stateCase[0] tag (case exists state) must be set. Check the “True” check box for the condition trigger.
6. In “Category”, select “Warning”.
7. Select the ProDiag FB you have already created: “LiftProDiagFB”. You can also create a new ProDiag FB. For the supervision, an “error flag” is automatically created in the instance data block of the ProDiag FB. The error flag indicates whether a fault has occurred. You can query this error flag in your program, for example, to shut off the machine in the event of certain faults.
8. In “Specific text field”, enter the text “Case at entrance missing”.
Figure 2-5: Position supervision
According to the position supervision at “SeqData”.newCase, the position supervision is implemented at the following stoppers:
“SeqData”.sensorStop1
“SeqData”.sensorStop2
“SeqData”.sensorStop3

2 Engineering
Machine and Plant Diagnostics with ProDiag Entry ID: 109740151, V3.0, 09/2017 13
S
iem
en
s A
G C
op
yri
gh
t-2
01
7 A
ll ri
gh
ts r
eserv
ed
2.2.4 Creating local supervisions
The local supervisions are created at the Boolean input parameters of the “LiftCmd” function block. The FB controls the outputs of a lift and is called twice in the program. Therefore, you have to configure the supervisions only once and can use them for both lifts.
Interlock supervisions
The lift outputs may be set only when the lift door is closed. The interlock supervision monitors whether the enables necessary for the “lift up” movement exist or whether the door is closed. The enables are transferred to the #interLockAuto FB parameter (automatic interlock) when the “LiftCmd” FB is called. If the enables are not provided, a supervision alarm of the “Error” category will be output. In the application example, the #interLockAuto FB parameter is supervised for this purpose.
To create the interlock supervision, proceed as follows:
1. Right-click the #interLockAuto parameter and run “Add new supervision”.
2. In “Type of supervision”, select “Interlock”.
3. If an error has occurred, the state of the supervised parameter is “False”.
4. Set a “delay time”, e.g. 0ms.
5. The #startLiftUp “actuator” and the #autoStarted “condition” (automatic started) must be set. For both, check the “True” check box for the condition trigger.
6. In “Category”, select “Error”.
7. In “Specific text field”, enter the text “Door at lift not closed”.
Figure 2-6: Interlock supervision
The interlock supervision for the “lift down” movement and using the #interLockMan parameter are created in the same way as this interlock supervision.

2 Engineering
Machine and Plant Diagnostics with ProDiag Entry ID: 109740151, V3.0, 09/2017 14
S
iem
en
s A
G C
op
yri
gh
t-2
01
7 A
ll ri
gh
ts r
eserv
ed
Note For local supervisions, the “LiftProDiagFB” ProDiag FB is not assigned to the individual parameters but to the “InstMainFB” instance data block of the calling “MainFB”.
See Chapter 2.2.5.
Action supervisions
The action supervision monitors whether the “lift up” movement has left the start position within a specified time. If the lift stops, a supervision alarm of the “Error” category will be output. In the application example, the #sensorLiftDown FB parameter is supervised for this purpose.
To create the action supervision, proceed as follows:
1. Right-click the #sensorLiftDown parameter and run “Add new supervision”.
2. In “Type of supervision”, select “Action”.
3. If an error has occurred, the state of the supervised parameter is “True”.
4. Set a “delay time”, e.g. 200ms.
5. The #outLiftUp “action” (lift up output) must be set. Check the “True” check box for the condition trigger.
6. In “Category”, select “Error”.
7. In “Specific text field”, enter the text “Lift has not left lower start position”.
Figure 2-7: Action monitoring
The action supervision for the “lift down” movement is created in the same way as this action supervision.

2 Engineering
Machine and Plant Diagnostics with ProDiag Entry ID: 109740151, V3.0, 09/2017 15
S
iem
en
s A
G C
op
yri
gh
t-2
01
7 A
ll ri
gh
ts r
eserv
ed
Reaction supervisions
The reaction supervision monitors whether the “lift up” movement has reached the end position within a specified time. If the lift stops before reaching this position, a supervision alarm of the “Error” category will be output. In the application example, the #sensorLiftUp FB parameter is supervised for this purpose.
To create the reaction supervision, proceed as follows:
1. Right-click the #sensorLiftUp parameter and run “Add new supervision”.
2. In “Type of supervision”, select “Reaction”.
3. If an error has occurred, the state of the supervised parameter is “False”.
4. Set a “delay time”, e.g. 5000ms.
5. The #outLiftUp “action” (lift up output) must be set. Check the “True” check box for the condition trigger.
6. In “Category”, select “Error”.
7. In “Specific text field”, enter the text “Lift has not reached upper end position”.
Figure 2-8: Reaction supervision
The reaction supervision for the “lift down” movement is created in the same way as this reaction supervision.
2 Engineering
Machine and Plant Diagnostics with ProDiag Entry ID: 109740151, V3.0, 09/2017 16
S
iem
en
s A
G C
op
yri
gh
t-2
01
7 A
ll ri
gh
ts r
eserv
ed
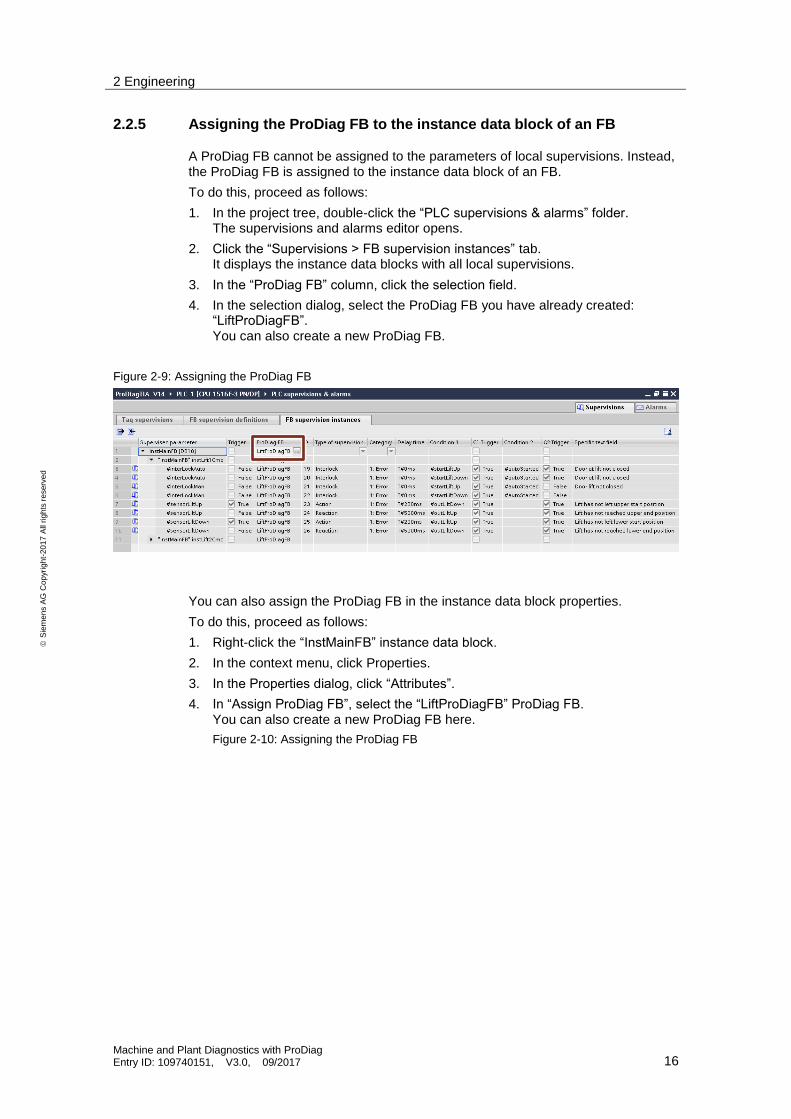
2.2.5 Assigning the ProDiag FB to the instance data block of an FB
A ProDiag FB cannot be assigned to the parameters of local supervisions. Instead, the ProDiag FB is assigned to the instance data block of an FB.
To do this, proceed as follows:
1. In the project tree, double-click the “PLC supervisions & alarms” folder. The supervisions and alarms editor opens.
2. Click the “Supervisions > FB supervision instances” tab. It displays the instance data blocks with all local supervisions.
3. In the “ProDiag FB” column, click the selection field.
4. In the selection dialog, select the ProDiag FB you have already created: “LiftProDiagFB”. You can also create a new ProDiag FB.
Figure 2-9: Assigning the ProDiag FB
You can also assign the ProDiag FB in the instance data block properties.
To do this, proceed as follows:
1. Right-click the “InstMainFB” instance data block.
2. In the context menu, click Properties.
3. In the Properties dialog, click “Attributes”.
4. In “Assign ProDiag FB”, select the “LiftProDiagFB” ProDiag FB. You can also create a new ProDiag FB here.
Figure 2-10: Assigning the ProDiag FB

2 Engineering
Machine and Plant Diagnostics with ProDiag Entry ID: 109740151, V3.0, 09/2017 17
S
iem
en
s A
G C
op
yri
gh
t-2
01
7 A
ll ri
gh
ts r
eserv
ed
2.2.6 Querying error bits in the program
Querying the group error bit of a ProDiag FB
For each ProDiag FB, different types of group error bits can be queried in the user program, for example, to stop the machine in the event of certain faults. The group error bits can also be accessed via the “InstLiftProDiagFB” instance data block of the ProDiag FB.
There are two different types of group error bits:
Group error bit for types of supervision (All, O, I, R, A, P, Merr and Mtxt)
Group error bit for categories (C1, C2, C3, C4, C5, C6, C7 and C8)
The following figure shows the “All” group error bit in the data structure of the status tags in the ProDiag IDB and its use in the user program.
Figure 2-11: Querying the group error bit in the program
2 Engineering
Machine and Plant Diagnostics with ProDiag Entry ID: 109740151, V3.0, 09/2017 18
S
iem
en
s A
G C
op
yri
gh
t-2
01
7 A
ll ri
gh
ts r
eserv
ed
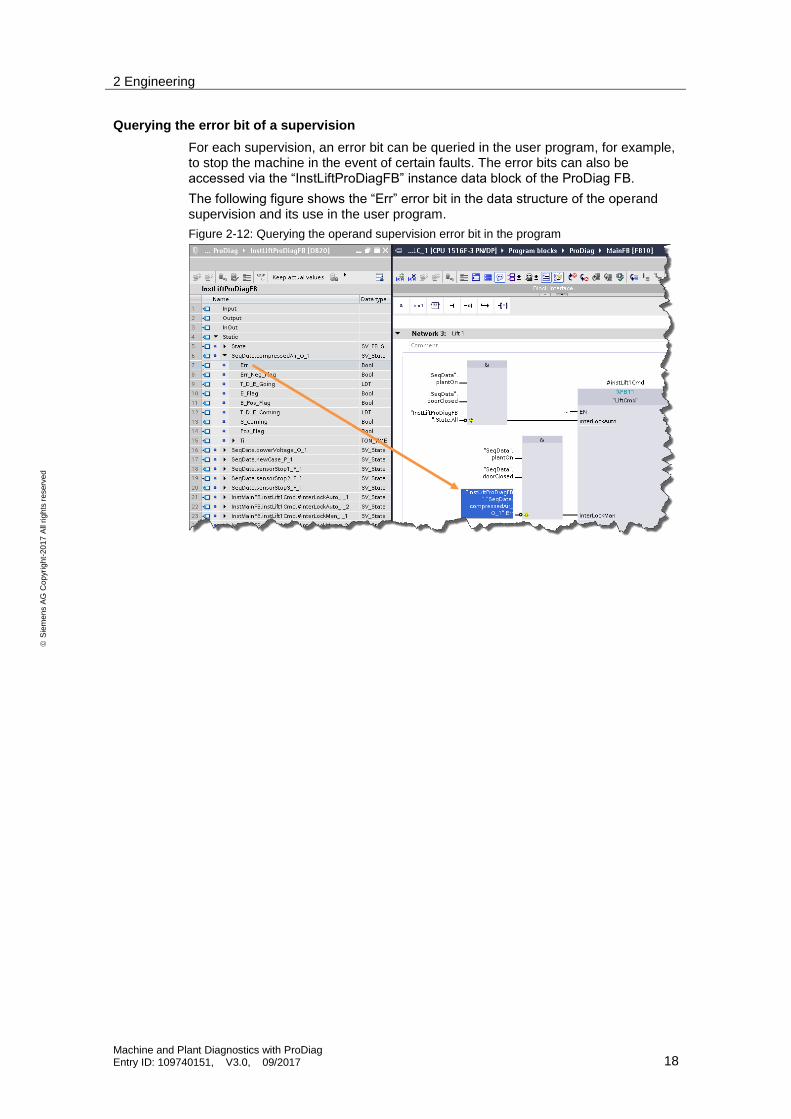
Querying the error bit of a supervision
For each supervision, an error bit can be queried in the user program, for example, to stop the machine in the event of certain faults. The error bits can also be accessed via the “InstLiftProDiagFB” instance data block of the ProDiag FB.
The following figure shows the “Err” error bit in the data structure of the operand supervision and its use in the user program.
Figure 2-12: Querying the operand supervision error bit in the program

2 Engineering
Machine and Plant Diagnostics with ProDiag Entry ID: 109740151, V3.0, 09/2017 19
S
iem
en
s A
G C
op
yri
gh
t-2
01
7 A
ll ri
gh
ts r
eserv
ed
2.2.7 Creating supervisions in the GRAPH sequencer
For the GRAPH programming language, the supervisions have already been integrated into each single step. Alarms are generated automatically.
Interlock
With an interlock, you monitor whether an action can be executed. This example monitors whether the door at the lift’s entrance is closed and the lift is not blocked. If the interlock condition is not met, an alarm will be output.
To enter a specific alarm text, proceed as follows:
1. Open the step in the single step view.
2. Select “Interlock -(C)-”.
3. Open the Inspector window and select the “Properties” tab.
4. In the “Alarm text” text field, enter the desired alarm text. This text is inserted into the interlock alarm with the “<step-specific text field” alarm text field.
Figure 2-13: GRAPH interlock

2 Engineering
Machine and Plant Diagnostics with ProDiag Entry ID: 109740151, V3.0, 09/2017 20
S
iem
en
s A
G C
op
yri
gh
t-2
01
7 A
ll ri
gh
ts r
eserv
ed
Supervision
With a supervision, you monitor an entire step. This example monitors the step duration. If the specified step duration is exceeded, an alarm will be output and the sequencer will not be transitioned to the next step.
To enter a specific alarm text, proceed as follows:
1. Open the step in the single step view.
2. Select “Supervision -(v)-”.
3. Open the Inspector window and select the “Properties” tab.
4. In the “Alarm text” text field, enter the desired alarm text. This text is inserted into the supervision alarm with the “<step-specific text field” alarm text field.
Figure 2-14: GRAPH supervision

2 Engineering
Machine and Plant Diagnostics with ProDiag Entry ID: 109740151, V3.0, 09/2017 21
S
iem
en
s A
G C
op
yri
gh
t-2
01
7 A
ll ri
gh
ts r
eserv
ed
2.2.8 Setting the parameters of the GRAPH sequencer
For the program status of the GRAPH sequencer to be displayed on the “GRAPH overview” HMI object, the parameters of the GRAPH sequencer must be visible in the HMI and accessible from the HMI.
To set this, proceed as follows:
1. Open the “LiftSeq” GRAPH sequencer.
2. Open the “Edit” menu.
3. Check “Internal parameters visible/accessible from HMI”. This selection can only be made if the GRAPH sequencer is open in the editor and the focus is on it.
Figure 2-15: Parameter settings of the GRAPH sequencer

2 Engineering
Machine and Plant Diagnostics with ProDiag Entry ID: 109740151, V3.0, 09/2017 22
S
iem
en
s A
G C
op
yri
gh
t-2
01
7 A
ll ri
gh
ts r
eserv
ed
2.2.9 Activating initial value acquisition of the GRAPH sequencer
Proceed as follows to activate initial value acquisition:
1. Open the “LiftSeq” GRAPH sequencer".
2. Select version V4.0 in the "General > Block" tab.
3. Click on the "Attributes" tab.
4. Activate "Initial value acquisition".
Figure 2-16: Attributes of the GRAPH sequencer
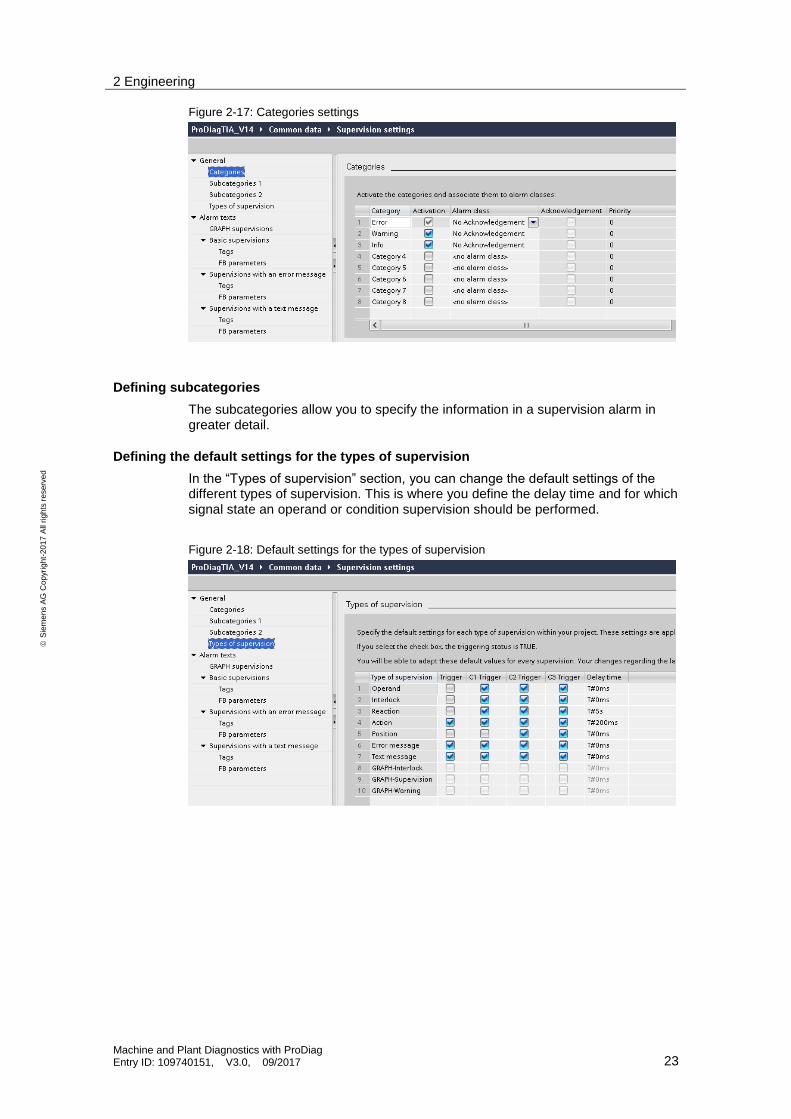
2.2.10 Defining the ProDiag supervision settings
In the ProDiag supervision settings, you define the settings that apply to all supervisions in the entire TIA Portal project. You can find the ProDiag supervision settings in the project tree in “Common data”.
Defining categories
The “categories” allow you to divide occurring faults into different priorities.
The categories can either be output as part of a supervision alarm or displayed as a group error bit in the “ProDiag overview” object on an HMI device.
You can customize the categories to your requirements. For example, you can assign a separate alarm class to each category.
2 Engineering
Machine and Plant Diagnostics with ProDiag Entry ID: 109740151, V3.0, 09/2017 23
S
iem
en
s A
G C
op
yri
gh
t-2
01
7 A
ll ri
gh
ts r
eserv
ed
Figure 2-17: Categories settings
Defining subcategories
The subcategories allow you to specify the information in a supervision alarm in greater detail.
Defining the default settings for the types of supervision
In the “Types of supervision” section, you can change the default settings of the different types of supervision. This is where you define the delay time and for which signal state an operand or condition supervision should be performed.
Figure 2-18: Default settings for the types of supervision

2 Engineering
Machine and Plant Diagnostics with ProDiag Entry ID: 109740151, V3.0, 09/2017 24
S
iem
en
s A
G C
op
yri
gh
t-2
01
7 A
ll ri
gh
ts r
eserv
ed
Defining the ProDiag alarm texts
In the “Alarm texts” section, you can define the structure of the supervision alarms.
To create an alarm text, proceed as follows:
1. In the “Alarm texts” tab, select the desired area for which you want to create an alarm text, for example Basic supervisions > Tags.
2. Use drag and drop to move the desired alarm text fields from the “Supported alarm text fields” field to the “Alarm text” text frame. You can change the order of the individual text fields at any time.
3. If you want to delete a text field, right-click the appropriate text field and from the context menu, select “Delete”.
4. Select a desired delimiter for the text fields.
Figure 2-19: Alarm text structure
Define the alarm text structures of the different supervisions based on the basic supervisions. For local supervisions, insert the “Instance name” and “Parameter Name” alarm text fields instead of “Tag name”.
2 Engineering
Machine and Plant Diagnostics with ProDiag Entry ID: 109740151, V3.0, 09/2017 25
S
iem
en
s A
G C
op
yri
gh
t-2
01
7 A
ll ri
gh
ts r
eserv
ed
2.2.11 Visualizing supervisions on the HMI
To display the current supervision state, TIA Portal provides different objects that you can integrate into an HMI screen.
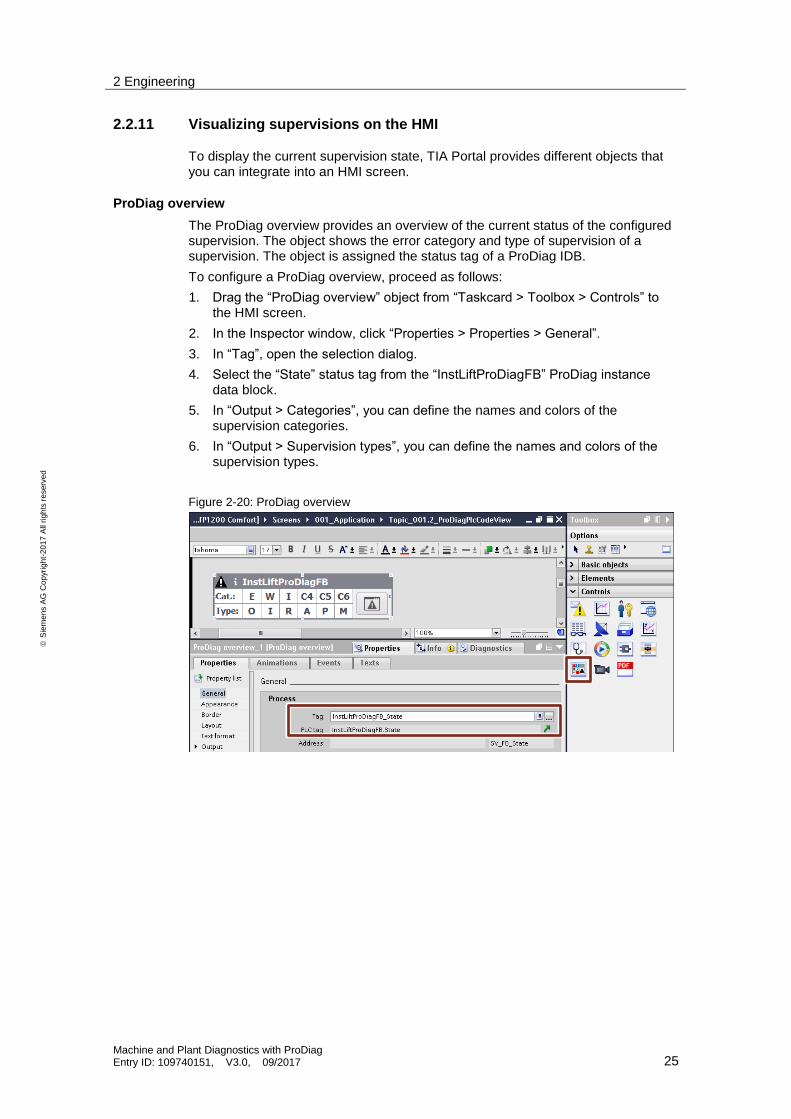
ProDiag overview
The ProDiag overview provides an overview of the current status of the configured supervision. The object shows the error category and type of supervision of a supervision. The object is assigned the status tag of a ProDiag IDB.
To configure a ProDiag overview, proceed as follows:
1. Drag the “ProDiag overview” object from “Taskcard > Toolbox > Controls” to the HMI screen.
2. In the Inspector window, click “Properties > Properties > General”.
3. In “Tag”, open the selection dialog.
4. Select the “State” status tag from the “InstLiftProDiagFB” ProDiag instance data block.
5. In “Output > Categories”, you can define the names and colors of the supervision categories.
6. In “Output > Supervision types”, you can define the names and colors of the supervision types.
Figure 2-20: ProDiag overview

2 Engineering
Machine and Plant Diagnostics with ProDiag Entry ID: 109740151, V3.0, 09/2017 26
S
iem
en
s A
G C
op
yri
gh
t-2
01
7 A
ll ri
gh
ts r
eserv
ed
GRAPH overview
The GRAPH overview provides an overview of the current status of a GRAPH sequencer. The object is assigned the first PLC tag of the GRAPH instance data block.
To configure a GRAPH overview, proceed as follows:
1. Drag the “GRAPH overview” object from “Taskcard > Toolbox > Controls” to the HMI screen.
2. In the Inspector window, click “Properties > Properties > General”.
3. In “Tag”, open the selection dialog.
4. Select the first PLC tag, “OFF_SQ”, from the “InstLiftSeq” GRAPH instance data block.
5. In “Properties” of the Inspector window, you can change the visual display of the object.
Figure 2-21: GRAPH overview

2 Engineering
Machine and Plant Diagnostics with ProDiag Entry ID: 109740151, V3.0, 09/2017 27
S
iem
en
s A
G C
op
yri
gh
t-2
01
7 A
ll ri
gh
ts r
eserv
ed
PLC code view
The PLC code view is used to display PLC program parts of your LAD, FBD and GRAPH programs. The PLC code view is activated using a button. The PLC code view does not need a connection to a PLC tag.
To configure a PLC code view, proceed as follows:
1. Drag the “PLC code view” object from “Taskcard > Toolbox > Controls” to the HMI screen.
2. In “Properties” of the Inspector window, you can change the visual display of the object.
Figure 2-22: PLC code view
Note You can open the PLC code view using the “PLC code” button or the “PLC code” button of the Graph overview.
Note The PLC code view cannot display F_FBD and F_LAD.
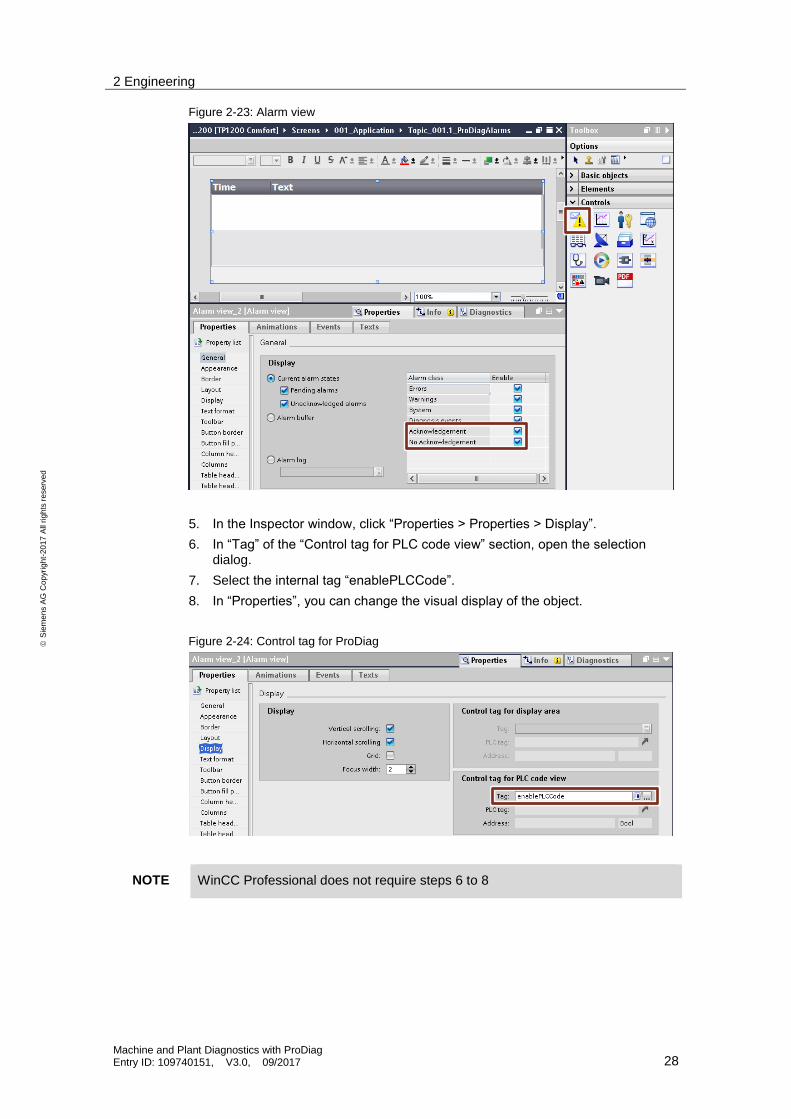
Alarm view
The alarm view displays the supervision alarms. The alarm view is assigned a control tag for the PLC code view. The control tag enables the “PLC code” button for the PLC code view.
To configure an alarm view, proceed as follows:
1. Drag the “Alarm view” object from “Taskcard > Toolbox > Controls” to the HMI screen.
2. In the Inspector window, click “Properties > Properties > General”.
3. Select “Current alarm states”.
4. Check the “Acknowledgement” and “No Acknowledgement” alarm classes.
2 Engineering
Machine and Plant Diagnostics with ProDiag Entry ID: 109740151, V3.0, 09/2017 28
S
iem
en
s A
G C
op
yri
gh
t-2
01
7 A
ll ri
gh
ts r
eserv
ed
Figure 2-23: Alarm view
5. In the Inspector window, click “Properties > Properties > Display”.
6. In “Tag” of the “Control tag for PLC code view” section, open the selection dialog.
7. Select the internal tag “enablePLCCode”.
8. In “Properties”, you can change the visual display of the object.
Figure 2-24: Control tag for ProDiag
NOTE WinCC Professional does not require steps 6 to 8

2 Engineering
Machine and Plant Diagnostics with ProDiag Entry ID: 109740151, V3.0, 09/2017 29
S
iem
en
s A
G C
op
yri
gh
t-2
01
7 A
ll ri
gh
ts r
eserv
ed
“PLC code” button
The button enables the PLC code view.
To configure a PLC code view, proceed as follows:
1. Drag the “Button” object from “Taskcard > Toolbox > Elements” to the HMI screen.
2. In “Properties” of the Inspector window, you can change the visual display of the object, for example the label.
3. In the Inspector window, select “Properties > Animations” and open the “Display” section.
4. Use “Add new animation” to add the “Control enable” animation.
5. In “Tag” of the “Process” section, open the selection dialog.
6. Select the internal tag “enablePLCCode”.
Figure 2-25: Control enable of the “PLC code” button
7. Use “Add new animation” to add the “Appearance” animation.
8. In “Name” of the “Tag” section, open the selection dialog.
9. Select the internal tag “enablePLCCode”.
10. In the “Range” column, enter the ranges “0” and “1”.
11. Select the “foreground” and “background color” for the ranges “0” and “1”.

2 Engineering
Machine and Plant Diagnostics with ProDiag Entry ID: 109740151, V3.0, 09/2017 30
S
iem
en
s A
G C
op
yri
gh
t-2
01
7 A
ll ri
gh
ts r
eserv
ed
Figure 2-26: Appearance of the “PLC code” button
12. In the Inspector window, click “Properties > Events”.
13. Select the “Click” event.
14. Insert the appropriate system function.
a. RT Advanced: "ActivatePLCCodeView" with following parameters:
– Screen name: "Topic_001.2_ProDiagPLCCodeView"
– Screen object: "PLC code view_1"
b. RT Professional: "ShowPLCCodeViewFromAlarm":
– Alarm screen name:"ProDiag"
– Alarm view name: "PLC code view_1"
– Basic screen name: "ProDiag"
– Screen Window Name: "Bildfenster_1"
– Screen name of the PLC code view: "ProDiag_001_Graph"
– Name of the PLC code view: "PLC code view_1"
2 Engineering
Machine and Plant Diagnostics with ProDiag Entry ID: 109740151, V3.0, 09/2017 31
S
iem
en
s A
G C
op
yri
gh
t-2
01
7 A
ll ri
gh
ts r
eserv
ed
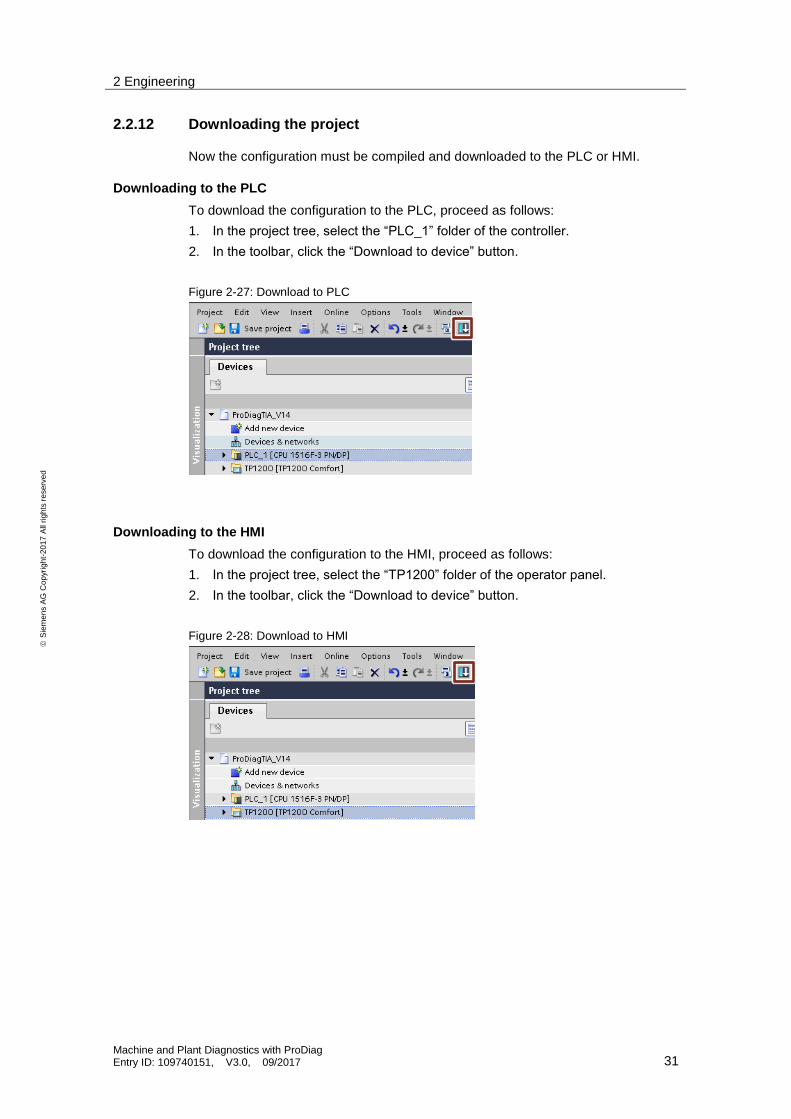
2.2.12 Downloading the project
Now the configuration must be compiled and downloaded to the PLC or HMI.
Downloading to the PLC
To download the configuration to the PLC, proceed as follows:
1. In the project tree, select the “PLC_1” folder of the controller.
2. In the toolbar, click the “Download to device” button.
Figure 2-27: Download to PLC
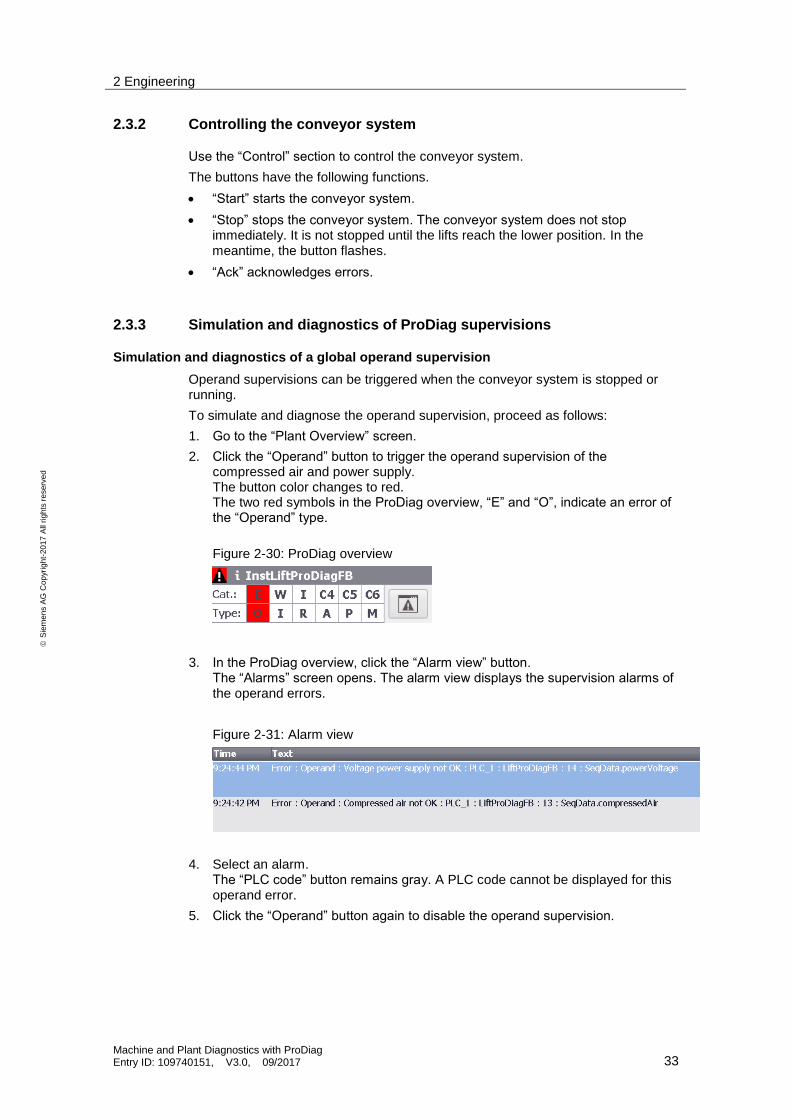
Downloading to the HMI
To download the configuration to the HMI, proceed as follows:
1. In the project tree, select the “TP1200” folder of the operator panel.
2. In the toolbar, click the “Download to device” button.
Figure 2-28: Download to HMI

2 Engineering
Machine and Plant Diagnostics with ProDiag Entry ID: 109740151, V3.0, 09/2017 32
S
iem
en
s A
G C
op
yri
gh
t-2
01
7 A
ll ri
gh
ts r
eserv
ed
2.3 Control and diagnostics wit WinCC Runtime Advanced
The virtual conveyor system is controlled and diagnosed directly on the operator panel. A programmer is not required.
2.3.1 Overview
The following figure shows the user interface of the operator panel.
Figure 2-29: User interface overview
The “Plant Overview” screen shows the conveyor belt with the two lifts and the buttons for controlling the plant and simulating errors. The ProDiag overview displays the current state of the configured supervisions and the GRAPH overview shows the current state of the GRAPH sequencer.
The “Alarms” screen shows the alarm view with the supervision alarms and the “PLC code” button with which the PLC code view is activated.
The “HMI PLC code view” screen shows the following HMI diagnostic objects: PLC overview, GRAPH overview and PLC code view. The objects allow you to diagnose the supervision alarms.
2 Engineering
Machine and Plant Diagnostics with ProDiag Entry ID: 109740151, V3.0, 09/2017 33
S
iem
en
s A
G C
op
yri
gh
t-2
01
7 A
ll ri
gh
ts r
eserv
ed
2.3.2 Controlling the conveyor system
Use the “Control” section to control the conveyor system.
The buttons have the following functions.
“Start” starts the conveyor system.
“Stop” stops the conveyor system. The conveyor system does not stop immediately. It is not stopped until the lifts reach the lower position. In the meantime, the button flashes.
“Ack” acknowledges errors.
2.3.3 Simulation and diagnostics of ProDiag supervisions
Simulation and diagnostics of a global operand supervision
Operand supervisions can be triggered when the conveyor system is stopped or running.
To simulate and diagnose the operand supervision, proceed as follows:
1. Go to the “Plant Overview” screen.
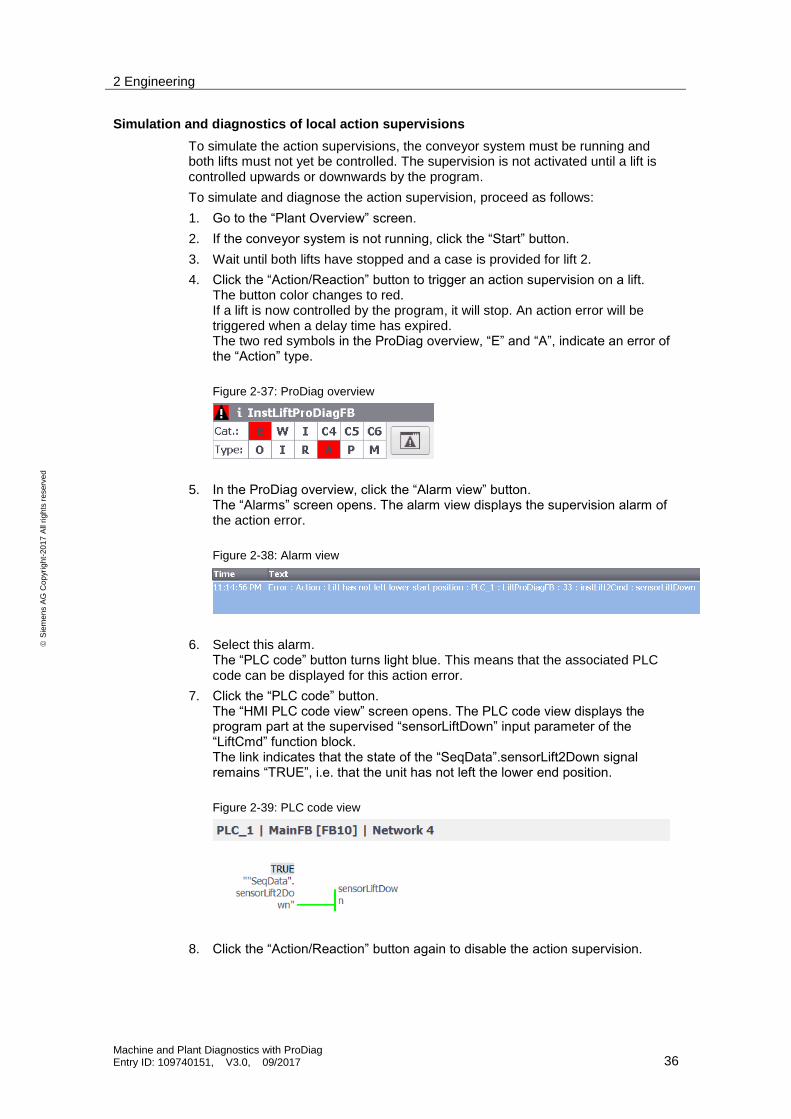
2. Click the “Operand” button to trigger the operand supervision of the compressed air and power supply. The button color changes to red. The two red symbols in the ProDiag overview, “E” and “O”, indicate an error of the “Operand” type.
Figure 2-30: ProDiag overview
3. In the ProDiag overview, click the “Alarm view” button. The “Alarms” screen opens. The alarm view displays the supervision alarms of the operand errors.
Figure 2-31: Alarm view
4. Select an alarm. The “PLC code” button remains gray. A PLC code cannot be displayed for this operand error.
5. Click the “Operand” button again to disable the operand supervision.

2 Engineering
Machine and Plant Diagnostics with ProDiag Entry ID: 109740151, V3.0, 09/2017 34
S
iem
en
s A
G C
op
yri
gh
t-2
01
7 A
ll ri
gh
ts r
eserv
ed
Simulation and diagnostics of a global position supervision
To simulate a position supervision, the conveyor system must be stopped. The position is supervised where a case is on the belt.
To simulate and diagnose the position supervision, proceed as follows:
1. Go to the “Plant Overview” screen.
2. If the conveyor system is running, click the “Stop” button and wait until the conveyor system has stopped.
3. To trigger a position supervision, click the “Position” button. The button color changes to red. The sensor display behind the case changes its color from green to red. The orange symbol, “W”, and the red symbol, “P”, in the ProDiag overview indicate a warning of the “Position” type.
Figure 2-32: ProDiag overview
4. In the ProDiag overview, click the “Alarm view” button. The “Alarms” screen opens. The alarm view displays the supervision alarms of the position error.
Figure 2-33: Alarm view
5. Select the alarm. The “PLC code” button remains gray. A PLC code cannot be displayed for this position error.
6. Click the “Position” button again to disable the position supervision.
Simulation and diagnostics of local interlock supervisions
To simulate the interlock supervisions, the conveyor system must be running. The supervision is not activated until a lift is started upwards or downwards.
To simulate and diagnose an interlock supervision, proceed as follows:
1. Go to the “Plant Overview” screen.
2. If the conveyor system is not running, click the “Start” button.
3. To trigger an interlock supervision on the lifts, click the “Interlock” button. The button color changes to red. The door on the lift opens and the lift stops. The two red symbols in the ProDiag overview, “E” and “I”, indicate an error of the “Interlock” type.
Figure 2-34: ProDiag overview

2 Engineering
Machine and Plant Diagnostics with ProDiag Entry ID: 109740151, V3.0, 09/2017 35
S
iem
en
s A
G C
op
yri
gh
t-2
01
7 A
ll ri
gh
ts r
eserv
ed
4. In the ProDiag overview, click the “Alarm view” button. The “Alarms” screen opens. The alarm view displays the supervision alarm of the interlock error.
Figure 2-35: Alarm view
5. Select this alarm. The “PLC code” button turns light blue. This means that the associated PLC code can be displayed for this interlock error.
6. Click the “PLC code” button. The “HMI PLC code view” screen opens. The PLC code view displays the program part at the supervised “interLockAuto” input parameter of the “LiftCmd” function block. The link indicates that the “SeqData”.doorClosed signal (lift door closed) is not “TRUE”.
Figure 2-36: PLC code view
7. Click the “Interlock” button again to disable the interlock supervision.
2 Engineering
Machine and Plant Diagnostics with ProDiag Entry ID: 109740151, V3.0, 09/2017 36
S
iem
en
s A
G C
op
yri
gh
t-2
01
7 A
ll ri
gh
ts r
eserv
ed
Simulation and diagnostics of local action supervisions
To simulate the action supervisions, the conveyor system must be running and both lifts must not yet be controlled. The supervision is not activated until a lift is controlled upwards or downwards by the program.
To simulate and diagnose the action supervision, proceed as follows:
1. Go to the “Plant Overview” screen.
2. If the conveyor system is not running, click the “Start” button.
3. Wait until both lifts have stopped and a case is provided for lift 2.
4. Click the “Action/Reaction” button to trigger an action supervision on a lift. The button color changes to red. If a lift is now controlled by the program, it will stop. An action error will be triggered when a delay time has expired. The two red symbols in the ProDiag overview, “E” and “A”, indicate an error of the “Action” type.
Figure 2-37: ProDiag overview
5. In the ProDiag overview, click the “Alarm view” button. The “Alarms” screen opens. The alarm view displays the supervision alarm of the action error.
Figure 2-38: Alarm view
6. Select this alarm. The “PLC code” button turns light blue. This means that the associated PLC code can be displayed for this action error.
7. Click the “PLC code” button. The “HMI PLC code view” screen opens. The PLC code view displays the program part at the supervised “sensorLiftDown” input parameter of the “LiftCmd” function block. The link indicates that the state of the “SeqData”.sensorLift2Down signal remains “TRUE”, i.e. that the unit has not left the lower end position.
Figure 2-39: PLC code view
8. Click the “Action/Reaction” button again to disable the action supervision.

2 Engineering
Machine and Plant Diagnostics with ProDiag Entry ID: 109740151, V3.0, 09/2017 37
S
iem
en
s A
G C
op
yri
gh
t-2
01
7 A
ll ri
gh
ts r
eserv
ed
Note In this application example, an action error, once a delay time has elapsed, always results in a reaction error.
Simulation and diagnostics of local reaction supervisions
To simulate the reaction supervisions, the conveyor system must be running. The supervision is not activated until a lift is controlled upwards or downwards by the program. If you activate the simulation before a lift is controlled, an action error will be triggered first, later followed by a reaction error. If you activate the simulation during the movement, only a reaction error will be triggered.
To simulate and diagnose the reaction supervision, proceed as follows:
1. Go to the “Plant Overview” screen.
2. If the conveyor system is not running, click the “Start” button.
3. Wait until a case is lifted by lift 2.
4. Click the “Action/Reaction” button to trigger a reaction supervision on the lifts. The button color changes to red. If a lift is now controlled, it will stop. A lift that has already been controlled will be stopped. A reaction error will not be triggered until a delay time has expired. The two red symbols in the ProDiag overview, “E” and “R”, indicate an error of the “Reaction” type.
Figure 2-40: ProDiag overview
5. In the ProDiag overview, click the “Alarm view” button. The “Alarms” screen opens. The alarm view displays the supervision alarm of the reaction error.
Figure 2-41: Alarm view
6. Select this alarm. The “PLC code” button turns light blue. This means that the associated PLC code can be displayed for this reaction error.
7. Click the “PLC code” button. The “HMI PLC code view” screen opens. The PLC code view displays the program part at the supervised “sensorLiftUp” input parameter of the “LiftCmd” function block. The link indicates that the state of the “SeqData”.sensorLift2Up signal remains “FALSE”, i.e. that the unit has not reached the upper end position. Figure 2-42: PLC code view
8. Click the “Action/Reaction” button again to disable the reaction supervision.

2 Engineering
Machine and Plant Diagnostics with ProDiag Entry ID: 109740151, V3.0, 09/2017 38
S
iem
en
s A
G C
op
yri
gh
t-2
01
7 A
ll ri
gh
ts r
eserv
ed
2.3.4 Simulation and diagnostics of GRAPH supervisions
Simulation and diagnostics of a supervision (step supervision)
Technologically, the GRAPH supervision can be compared to a reaction supervision.
To simulate a supervision of the “LiftSeq” GRAPH sequencer, the conveyor system must be running. The supervision is only configured in those steps where a lift is controlled upwards or downwards. The respective end position of the movement is defined as a transition (step enabling condition for the next step). The specified step duration of a step is supervised in the supervision. If the movement within a step takes too long, the supervision will be activated and an alarm will be output. The supervision is triggered by simulating an interlock error or an action/reaction error.
To simulate and diagnose the supervision, proceed as follows:
1. Go to the “Plant Overview” screen.
2. If the conveyor system is not running, click the “Start” button.
3. Wait until a case is lifted by lift 2.
4. Click the “Interlock” or “Action/Reaction” button to trigger a supervision in a step. The color of the respective button changes to red. If a lift is now controlled, it will stop. A lift that has already been controlled will be stopped. When the specified step duration has expired, an alarm will be output. The red step number in the GRAPH overview indicates an error in the GRAPH sequencer.
Figure 2-43: GRAPH overview
5. In the GRAPH overview, click the “Alarm view” button. The “Alarms” screen opens. The alarm view displays the error alarm of the supervision.
Figure 2-44: Alarm view
6. Click the right arrow at the bottom edge of the screen. The “HMI PLC code view” screen opens.

2 Engineering
Machine and Plant Diagnostics with ProDiag Entry ID: 109740151, V3.0, 09/2017 39
S
iem
en
s A
G C
op
yri
gh
t-2
01
7 A
ll ri
gh
ts r
eserv
ed
7. Click the “PLC code” button of the GRAPH overview. The PLC code view shows a part of the “LiftSeq” GRAPH sequencer. The interrupted step is displayed in blue red. The below transition network shows that the state of the “SeqData”.sensorLift2Up signal remains “FALSE”, i.e. that the unit has not reached the upper end position.
Figure 2-45: PLC code view
8. Click the “Interlock” or “Action/Reaction” button again to disable the supervision. The error that the GRAPH sequencer displays is automatically acknowledged in the program.
2 Engineering
Machine and Plant Diagnostics with ProDiag Entry ID: 109740151, V3.0, 09/2017 40
S
iem
en
s A
G C
op
yri
gh
t-2
01
7 A
ll ri
gh
ts r
eserv
ed
Simulation and diagnostics of an interlock with Initial value acquisition (criteria analysis)
To simulate an interlock of the “LiftSeq” GRAPH sequencer, the conveyor system must be running. The interlock is only configured in those steps where a lift is controlled upwards or downwards. The “SeqData”.doorClosed signal (lift door closed) with an AND link with the signal "SeqData" .liftFree (lifting unit is not blocked). The action in the step will be executed only if the interlock condition is met. If the interlock condition is not met, an alarm will be output. The interlock is triggered by simulating an interlock error.
To simulate and diagnose an interlock, proceed as follows:
1. Go to the “Plant Overview” screen.
2. If the conveyor system is not running, click the “Start” button.
3. Wait until a case is lifted by lift 1.
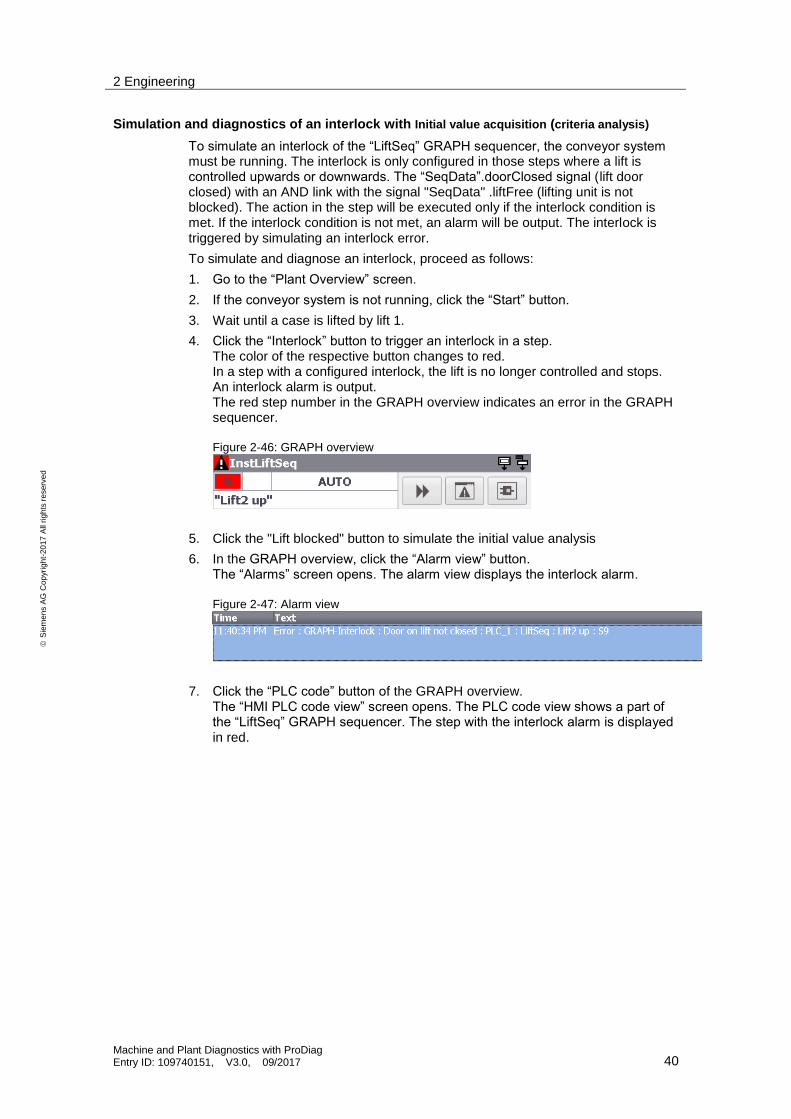
4. Click the “Interlock” button to trigger an interlock in a step. The color of the respective button changes to red. In a step with a configured interlock, the lift is no longer controlled and stops. An interlock alarm is output. The red step number in the GRAPH overview indicates an error in the GRAPH sequencer. Figure 2-46: GRAPH overview
5. Click the "Lift blocked" button to simulate the initial value analysis
6. In the GRAPH overview, click the “Alarm view” button. The “Alarms” screen opens. The alarm view displays the interlock alarm. Figure 2-47: Alarm view
7. Click the “PLC code” button of the GRAPH overview. The “HMI PLC code view” screen opens. The PLC code view shows a part of the “LiftSeq” GRAPH sequencer. The step with the interlock alarm is displayed in red.

2 Engineering
Machine and Plant Diagnostics with ProDiag Entry ID: 109740151, V3.0, 09/2017 41
S
iem
en
s A
G C
op
yri
gh
t-2
01
7 A
ll ri
gh
ts r
eserv
ed
8. Click the "Transition/Interlock" button to move to the Interlocknetwork. In the "Initial value view" view of the interlock network, you can see that the "SeqData" .doorClosed condition is not met, that is, the door of the lift unit is not closed. The first error is highlighted in red. Figure 2-48: PLC-Code: Initial value view
9. Click on the "actual values/initial values" button to move to the actual value view. In the "Interval" view of the interlock network, you can see that the two conditions "SeqData" .doorClosed and "SeqData" .liftFree are not met, that is, the door of the lift unit is not closed and the lift unit is not free. Figure 2-49: PLC-Code: Actual value view
10. Click the button "Lift blocked" and the "Interlock" button to deactivate the interlock. The error in the GRAPH sequencer is acknowledged automatically in the program.
8 9

2 Engineering
Machine and Plant Diagnostics with ProDiag Entry ID: 109740151, V3.0, 09/2017 42
S
iem
en
s A
G C
op
yri
gh
t-2
01
7 A
ll ri
gh
ts r
eserv
ed
2.4 Control and Diagnostics with WinCC Runtime Professional
The application example was extended for WinCC Runtime Professional. The extension of this application example was implemented with the configuration from Chapter Configuration 2.2
Note For ProDiag with WinCC Runtime Professional, it is necessary that the GRAPH block has been configured in V4.
2.4.1 Overview
The figure shows the Runtime user interface.
Figure 2-50: User interface overview
The “ProDiag” screen shows the conveyor belt with the two lifts and the buttons for controlling the plant and simulating errors. In addition, the screen shows
the current state of the configured supervisions and the GRAPH overview displays the current state of the GRAPH sequencer.
the alarm view with the supervision alarms and the “PLC code” button with which the PLC code view is activated.
the following HMI diagnostic objects: PLC overview, GRAPH overview and PLC code view. The objects allow you to diagnose the supervision alarms.

2 Engineering
Machine and Plant Diagnostics with ProDiag Entry ID: 109740151, V3.0, 09/2017 43
S
iem
en
s A
G C
op
yri
gh
t-2
01
7 A
ll ri
gh
ts r
eserv
ed
2.4.2 Controlling the conveyor system
Use the “Control” section to control the conveyor system.
The buttons have the following functions.
“Start” starts the conveyor system.
“Stop” stops the conveyor system. The conveyor system does not stop immediately. It is not stopped until the lifts reach the lower position. In the meantime, the button flashes.
2.4.3 Simulation and diagnostics of ProDiag supervisions
Simulation and diagnostics of a global operand supervision
Operand supervisions can be triggered when the conveyor system is stopped or running.
To simulate and diagnose the operand supervision, proceed as follows:
1. Open the “ProDiag” screen.
2. Click the “Operand” button to trigger the operand supervision of the compressed air and power supply. The button color changes to red. The two red symbols in the ProDiag overview, “E” and “O”, indicate an error of the “Operand” type. Figure 2-51: ProDiag overview
3. In the ProDiag overview, click the “Alarm view” button. The alarm view displays the supervision alarms of the operand errors. Figure 2-52: Alarm view
4. Click the “Operand” button again to disable the operand supervision.
2 Engineering
Machine and Plant Diagnostics with ProDiag Entry ID: 109740151, V3.0, 09/2017 44
S
iem
en
s A
G C
op
yri
gh
t-2
01
7 A
ll ri
gh
ts r
eserv
ed
Simulation and diagnostics of a global position supervision
To simulate a position supervision, the conveyor system must be stopped. The position is supervised where the case is on the belt.
To simulate and diagnose the position supervision, proceed as follows:
1. Open the “ProDiag” screen.
2. If the conveyor system is running, click the “Stop” button and wait until the conveyor system has stopped.
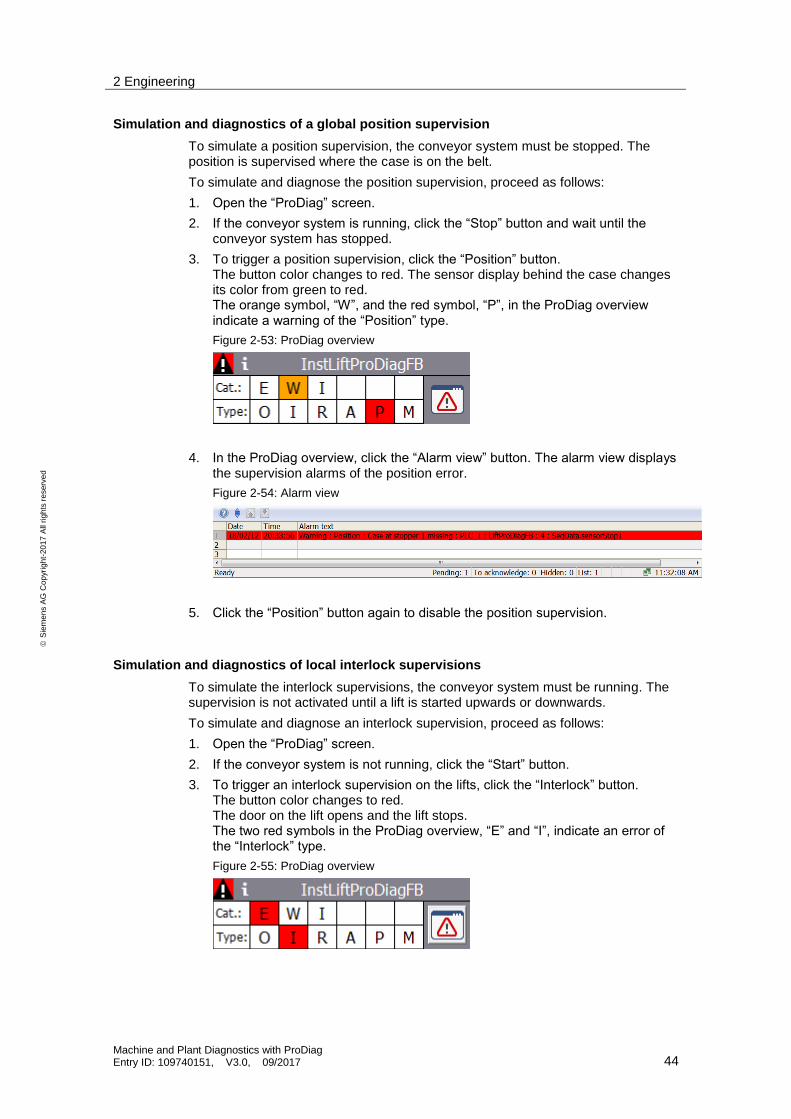
3. To trigger a position supervision, click the “Position” button. The button color changes to red. The sensor display behind the case changes its color from green to red. The orange symbol, “W”, and the red symbol, “P”, in the ProDiag overview indicate a warning of the “Position” type.
Figure 2-53: ProDiag overview
4. In the ProDiag overview, click the “Alarm view” button. The alarm view displays the supervision alarms of the position error.
Figure 2-54: Alarm view
5. Click the “Position” button again to disable the position supervision.
Simulation and diagnostics of local interlock supervisions
To simulate the interlock supervisions, the conveyor system must be running. The supervision is not activated until a lift is started upwards or downwards.
To simulate and diagnose an interlock supervision, proceed as follows:
1. Open the “ProDiag” screen.
2. If the conveyor system is not running, click the “Start” button.
3. To trigger an interlock supervision on the lifts, click the “Interlock” button. The button color changes to red. The door on the lift opens and the lift stops. The two red symbols in the ProDiag overview, “E” and “I”, indicate an error of the “Interlock” type.
Figure 2-55: ProDiag overview

2 Engineering
Machine and Plant Diagnostics with ProDiag Entry ID: 109740151, V3.0, 09/2017 45
S
iem
en
s A
G C
op
yri
gh
t-2
01
7 A
ll ri
gh
ts r
eserv
ed
4. In the ProDiag overview, click the “Alarm view” button. The alarm view displays the supervision alarm of the interlock error.
Figure 2-56: Alarm view
5. Disable “auto scroll” (1) and select the Interlock alarm (2).
Figure 2-57: Alarm view
6. Click the “PLC code” button. The PLC code view displays the block error.
Figure 2-58: PLC code view
7. Click the “Interlock” button again to disable the interlock supervision.
1 2

2 Engineering
Machine and Plant Diagnostics with ProDiag Entry ID: 109740151, V3.0, 09/2017 46
S
iem
en
s A
G C
op
yri
gh
t-2
01
7 A
ll ri
gh
ts r
eserv
ed
Simulation and diagnostics of local action supervisions
To simulate the action supervisions, the conveyor system must be running and both lifts must not yet be controlled. The supervision is not activated until a lift is controlled upwards or downwards by the program.
To simulate and diagnose the action supervision, proceed as follows:
1. Open the “ProDiag” screen.
2. If the conveyor system is not running, click the “Start” button.
3. Wait until both lifts have stopped and a case is provided for lift 2.
4. Click the “Action/Reaction” button to trigger an action supervision on a lift. The button color changes to red. If a lift is now controlled by the program, it will stop. An action error will be triggered when a delay time has expired. The two red symbols in the ProDiag overview, “E” and “A”, indicate an error of the “Action” type.
Figure 2-59: ProDiag overview
5. In the ProDiag overview, click the “Alarm view” button. The alarm view displays the supervision alarm of the action error.
Figure 2-60: Alarm view
6. Disable “auto scroll” (1) and select the alarm (2).
Figure 2-61: Alarm view
1 2

2 Engineering
Machine and Plant Diagnostics with ProDiag Entry ID: 109740151, V3.0, 09/2017 47
S
iem
en
s A
G C
op
yri
gh
t-2
01
7 A
ll ri
gh
ts r
eserv
ed
7. Click the “PLC code” button. The PLC code view displays the program part at the supervised “sensorLiftDown” input parameter of the “LiftCmd” function block. The link indicates that the state of the “SeqData”.sensorLift2Down signal remains “TRUE”, i.e. that the unit has not left the lower end position.
Figure 2-62: PLC code view
8. Click the “Action/Reaction” button again to disable the action supervision.
Note In this application example, an action error, once a delay time has expired, always results in a reaction error.
Simulation and diagnostics of local reaction supervisions
To simulate the reaction supervisions, the conveyor system must be running. The supervision is not activated until a lift is controlled upwards or downwards by the program. If you activate the simulation before a lift is controlled, an action error will be triggered first, later followed by a reaction error. If you activate the simulation during the movement, only a reaction error will be triggered.
To simulate and diagnose the reaction supervision, proceed as follows:
1. Open the “ProDiag” screen.
2. If the conveyor system is not running, click the “Start” button.
3. Wait until a case is lifted by lift 2.
4. Click the “Action/Reaction” button to trigger a reaction supervision on the lifts. The button color changes to red. If a lift is now controlled, it will stop. A lift that has already been controlled will be stopped. A reaction error will not be triggered until a delay time has expired. The two red symbols in the ProDiag overview, “E” and “R”, indicate an error of the “Reaction” type.
Figure 2-63: ProDiag overview
5. In the ProDiag overview, click the “Alarm view” button. The alarm view displays the supervision alarm of the reaction error.
Figure 2-64: Alarm view
2 Engineering
Machine and Plant Diagnostics with ProDiag Entry ID: 109740151, V3.0, 09/2017 48
S
iem
en
s A
G C
op
yri
gh
t-2
01
7 A
ll ri
gh
ts r
eserv
ed
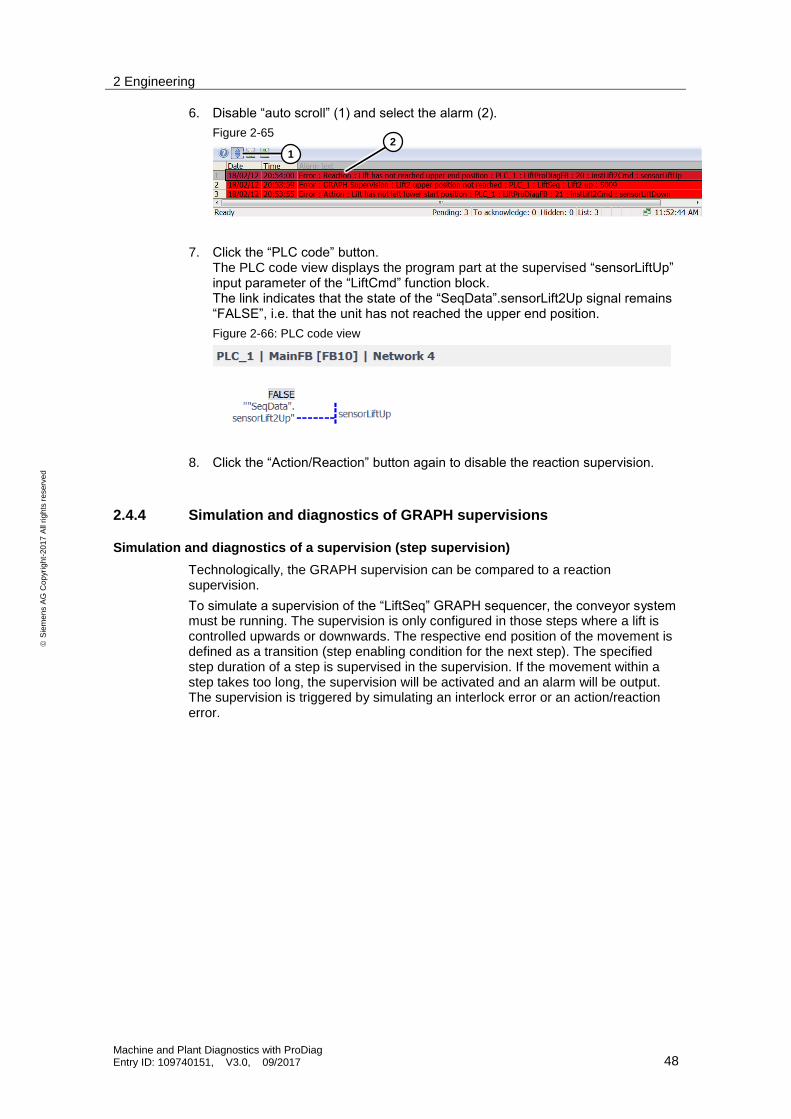
6. Disable “auto scroll” (1) and select the alarm (2).
Figure 2-65
7. Click the “PLC code” button. The PLC code view displays the program part at the supervised “sensorLiftUp” input parameter of the “LiftCmd” function block. The link indicates that the state of the “SeqData”.sensorLift2Up signal remains “FALSE”, i.e. that the unit has not reached the upper end position.
Figure 2-66: PLC code view
8. Click the “Action/Reaction” button again to disable the reaction supervision.
2.4.4 Simulation and diagnostics of GRAPH supervisions
Simulation and diagnostics of a supervision (step supervision)
Technologically, the GRAPH supervision can be compared to a reaction supervision.
To simulate a supervision of the “LiftSeq” GRAPH sequencer, the conveyor system must be running. The supervision is only configured in those steps where a lift is controlled upwards or downwards. The respective end position of the movement is defined as a transition (step enabling condition for the next step). The specified step duration of a step is supervised in the supervision. If the movement within a step takes too long, the supervision will be activated and an alarm will be output. The supervision is triggered by simulating an interlock error or an action/reaction error.
1 2
2 Engineering
Machine and Plant Diagnostics with ProDiag Entry ID: 109740151, V3.0, 09/2017 49
S
iem
en
s A
G C
op
yri
gh
t-2
01
7 A
ll ri
gh
ts r
eserv
ed
To simulate and diagnose the supervision, proceed as follows:
1. Open the “ProDiag” screen.
2. If the conveyor system is not running, click the “Start” button.
3. Wait until a case is lifted by lift 2.
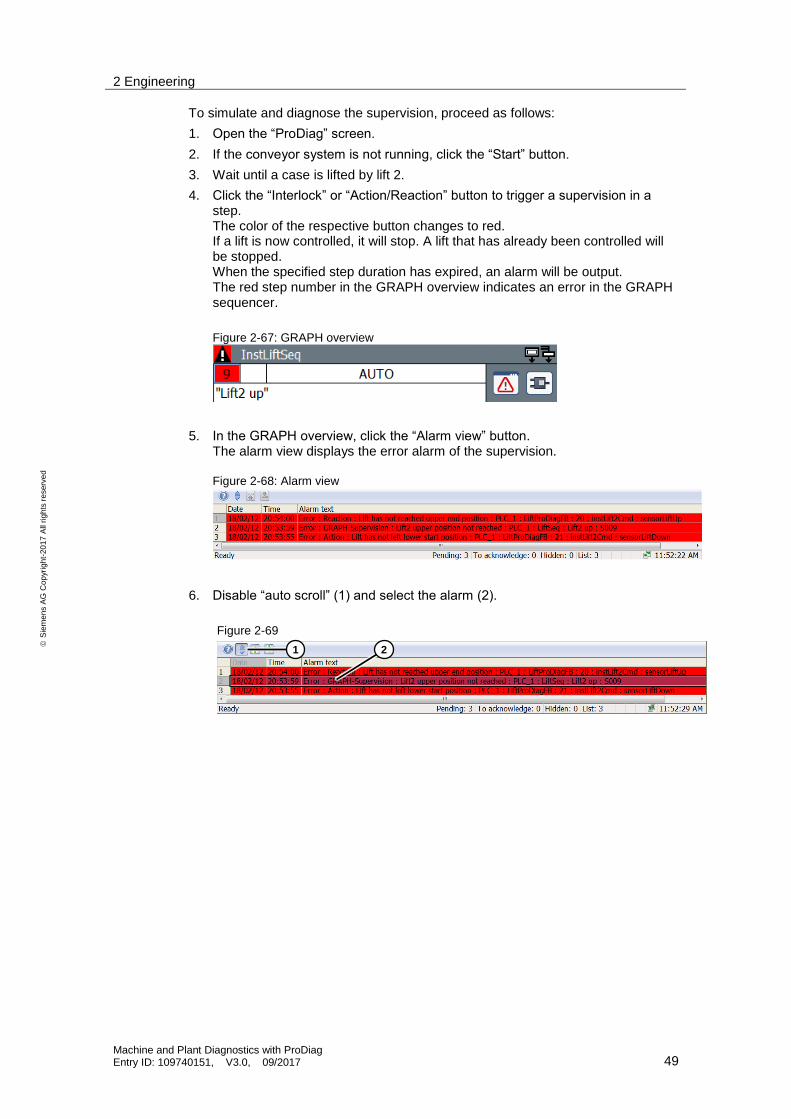
4. Click the “Interlock” or “Action/Reaction” button to trigger a supervision in a step. The color of the respective button changes to red. If a lift is now controlled, it will stop. A lift that has already been controlled will be stopped. When the specified step duration has expired, an alarm will be output. The red step number in the GRAPH overview indicates an error in the GRAPH sequencer.
Figure 2-67: GRAPH overview
5. In the GRAPH overview, click the “Alarm view” button. The alarm view displays the error alarm of the supervision. Figure 2-68: Alarm view
6. Disable “auto scroll” (1) and select the alarm (2).
Figure 2-69
1 2

2 Engineering
Machine and Plant Diagnostics with ProDiag Entry ID: 109740151, V3.0, 09/2017 50
S
iem
en
s A
G C
op
yri
gh
t-2
01
7 A
ll ri
gh
ts r
eserv
ed
7. Click the “PLC code” button of the GRAPH overview. The PLC code view shows a part of the “LiftSeq” GRAPH sequencer. The interrupted step is displayed in red. The below transition network shows that the state of the “SeqData”.sensorLift2Up signal remains “FALSE”, i.e. that the unit has not reached the upper end position.
Figure 2-70: PLC code view
8. Click the “Interlock” or “Action/Reaction” button again to disable the supervision. The error that the GRAPH sequencer displays is automatically acknowledged in the program.

2 Engineering
Machine and Plant Diagnostics with ProDiag Entry ID: 109740151, V3.0, 09/2017 51
S
iem
en
s A
G C
op
yri
gh
t-2
01
7 A
ll ri
gh
ts r
eserv
ed
Simulation and diagnostics of an interlock with Initial value acquisition (criteria analysis)
To simulate an interlock of the “LiftSeq” GRAPH sequencer, the conveyor system must be running. The interlock is only configured in those steps where a lift is controlled upwards or downwards. The “SeqData”.doorClosed signal (lift door closed) with an AND link with the signal "SeqData" .liftFree (lifting unit is not blocked) is programmed as a condition for the interlock. The action in the step will be executed only if the interlock condition is met. If the interlock condition is not met, an alarm will be output. The interlock is triggered by simulating an interlock error.
To simulate and diagnose an interlock, proceed as follows:
1. Open the “ProDiag” screen.
2. If the conveyor system is not running, click the “Start” button.
3. Wait until a case is lifted by lift 1.
4. Click the “Interlock” button to trigger an interlock in a step. The color of the respective button changes to red. In a step with a configured interlock, the lift is no longer controlled and stops. An interlock alarm is output. The red step number in the GRAPH overview indicates an error in the GRAPH sequencer. Figure 2-71: GRAPH overview
5. In the GRAPH overview, click the “Alarm view” button. The alarm view displays the interlock alarm.
Figure 2-72: Alarm view
6. Disable “auto scroll” (1) and select the alarm (2).
Figure 2-73: Alarm view
2 1
5 7
2 Engineering
Machine and Plant Diagnostics with ProDiag Entry ID: 109740151, V3.0, 09/2017 52
S
iem
en
s A
G C
op
yri
gh
t-2
01
7 A
ll ri
gh
ts r
eserv
ed
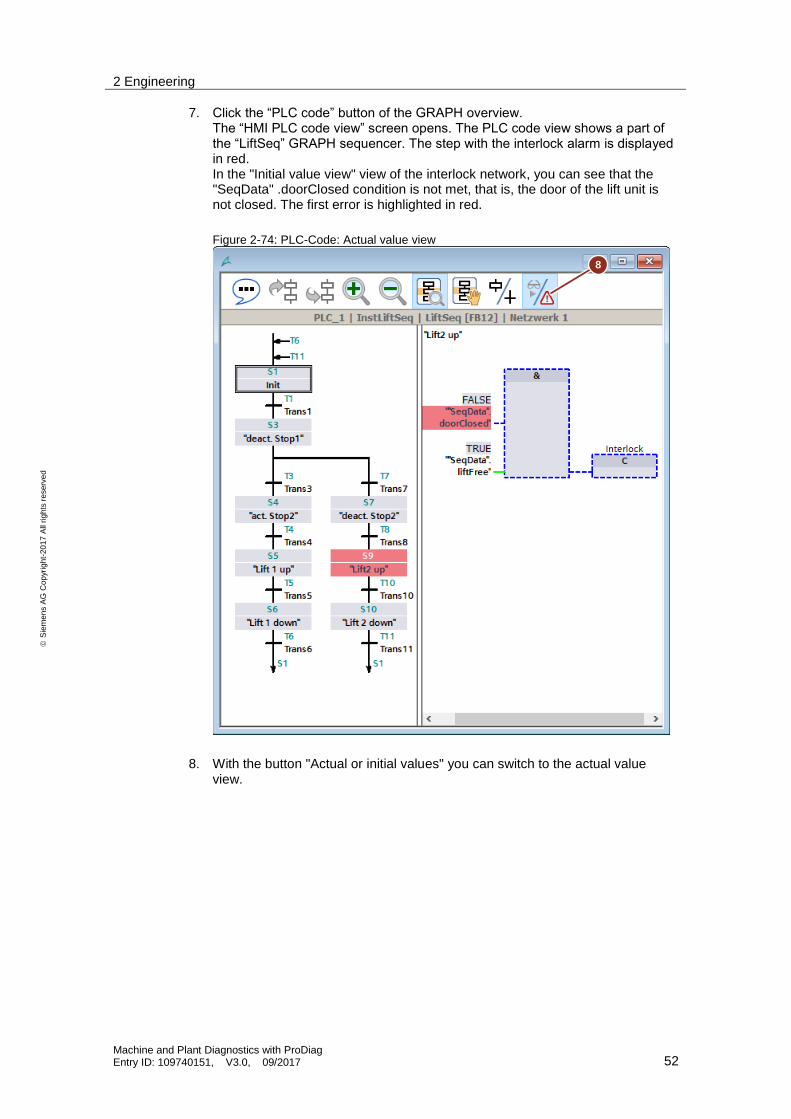
7. Click the “PLC code” button of the GRAPH overview. The “HMI PLC code view” screen opens. The PLC code view shows a part of the “LiftSeq” GRAPH sequencer. The step with the interlock alarm is displayed in red. In the "Initial value view" view of the interlock network, you can see that the "SeqData" .doorClosed condition is not met, that is, the door of the lift unit is not closed. The first error is highlighted in red.
Figure 2-74: PLC-Code: Actual value view
8. With the button "Actual or initial values" you can switch to the actual value view.
8
2 Engineering
Machine and Plant Diagnostics with ProDiag Entry ID: 109740151, V3.0, 09/2017 53
S
iem
en
s A
G C
op
yri
gh
t-2
01
7 A
ll ri
gh
ts r
eserv
ed
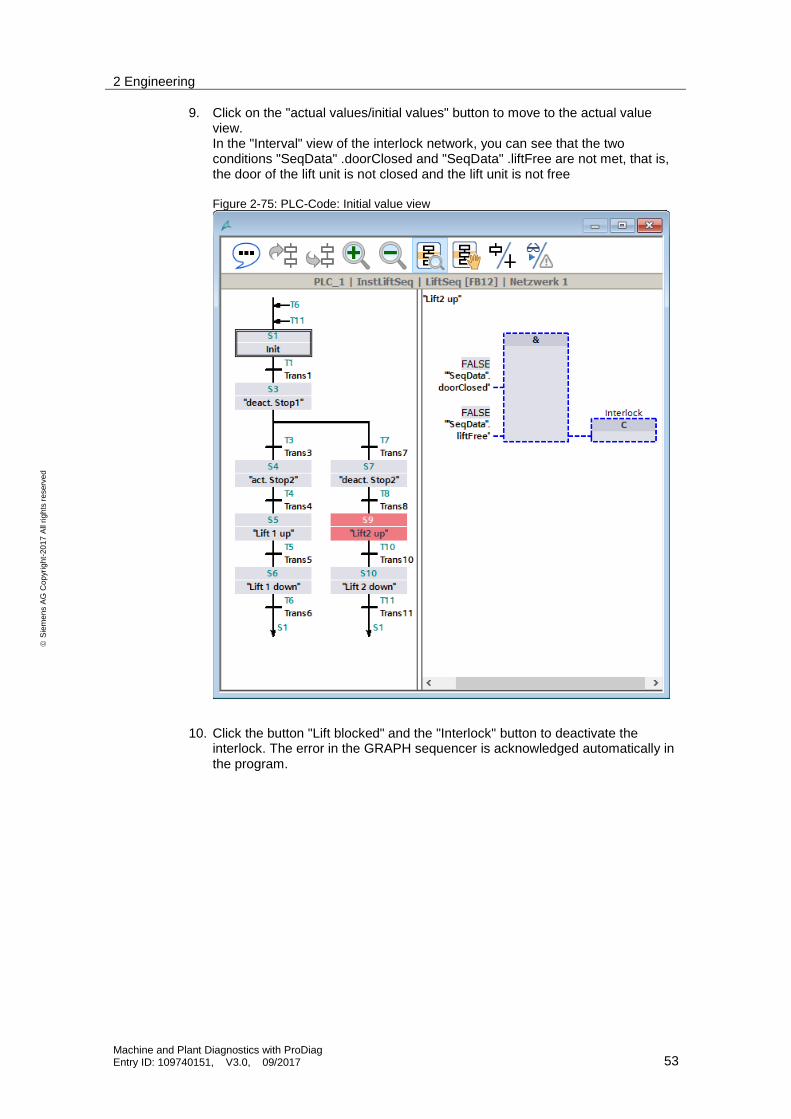
9. Click on the "actual values/initial values" button to move to the actual value view. In the "Interval" view of the interlock network, you can see that the two conditions "SeqData" .doorClosed and "SeqData" .liftFree are not met, that is, the door of the lift unit is not closed and the lift unit is not free Figure 2-75: PLC-Code: Initial value view
10. Click the button "Lift blocked" and the "Interlock" button to deactivate the interlock. The error in the GRAPH sequencer is acknowledged automatically in the program.
8 9
3 Appendix
Machine and Plant Diagnostics with ProDiag Entry ID: 109740151, V3.0, 09/2017 54
S
iem
en
s A
G C
op
yri
gh
t-2
01
7 A
ll ri
gh
ts r
eserv
ed
3 Appendix
3.1 Service and Support
Industry Online Support
Do you have any questions or do you need support?
With Industry Online Support, our complete service and support know-how and services are available to you 24/7.
Industry Online Support is the place to go to for information about our products, solutions and services.
Product Information, Manuals, Downloads, FAQs and Application Examples – all the information can be accessed with just a few clicks: https://support.industry.siemens.com/.
Technical Support
Siemens Industry’s Technical Support offers you fast and competent support for any technical queries you may have, including numerous tailor-made offerings ranging from basic support to custom support contracts.
You can use the web form below to send queries to Technical Support: www.siemens.com/industry/supportrequest.
Service offer
Our service offer includes the following services:
Product Training
Plant Data Services
Spare Part Services
Repair Services
Field & Maintenance Services
Retrofit & Modernization Services
Service Programs & Agreements
For detailed information about our service offer, please refer to the Service Catalog: https://support.industry.siemens.com/cs/sc
Industry Online Support app
The “Siemens Industry Online Support” app provides you with optimum support while on the go. The app is available for Apple iOS, Android and Windows Phone. https://support.industry.siemens.com/cs/en/en/2067

3 Appendix
Machine and Plant Diagnostics with ProDiag Entry ID: 109740151, V3.0, 09/2017 55
S
iem
en
s A
G C
op
yri
gh
t-2
01
7 A
ll ri
gh
ts r
eserv
ed
3.2 Links and literature
Table 3-1
No. Topic
\1\ Siemens Industry Online Support
https://support.industry.siemens.com
\2\ Link to this entry page of this application example
https://support.industry.siemens.com/cs/ww/en/view/109740151
\3\ STEP 7 Professional V14 SP1 System manual
https://support.industry.siemens.com/cs/ww/en/view/109747136
3.3 Change documentation
Table 3-2
Version Date Modifications
V1.0 10/2016 First version
V2.0 12/2016 Update WinCC Runtime Professional
V3.0 09/2017 Update Initial value acquisition (criteria analysis)