m68 math topics curriculum essentials document
TRANSCRIPT

M68
Math Topics
Curriculum Essentials
Document
Boulder Valley School District
Department of Curriculum and Instruction
March 2012
5/22/2012 BVSD Curriculum Essentials 2
Boulder Valley School District Mathematics – An Introduction to The Curriculum Essentials
Document Background
The 2009 Common Core State Standards (CCSS) have brought about a much needed move towards consistency in mathematics throughout the state and nation. In December 2010, the Colorado Academic Standards revisions for Mathematics were adopted by the State Board of Education. These standards aligned the previous state standards to the Common Core State Standards to form the Colorado Academic Standards (CAS). The CAS include additions or changes to the CCSS needed to meet state legislative requirements around Personal Financial Literacy.
The Colorado Academic Standards Grade Level Expectations (GLE) for math are being adopted in their entirety and without change in the PK-8 curriculum. This decision was made based on the thorough adherence by the state to the CCSS. These new standards are specific, robust and comprehensive. Additionally, the essential linkage between the standards and the proposed 2014 state assessment system, which may include interim, formative and summative assessments, is based specifically on these standards. The overwhelming opinion amongst the mathematics teachers, school and district level administration and district level mathematics coaches clearly indicated a desire to move to the CAS without creating a BVSD version through additions or changes.
The High School standards provided to us by the state did not delineate how courses should be created. Based on information regarding the upcoming assessment system, the expertise of our teachers and the writers of the CCSS, the decision was made to follow the recommendations in the Common Core State Standards for Mathematics- Appendix A: Designing High School Math Courses Based on the Common Core State Standards. The writing teams took the High School CAS and carefully and thoughtfully divided them into courses for the creation of the 2012 BVSD Curriculum Essentials Documents (CED).
The Critical Foundations of the 2011 Standards
The expectations in these documents are based on mastery of the topics at specific grade levels with the understanding that the standards, themes and big ideas reoccur throughout PK-12 at varying degrees of difficulty, requiring different levels of mastery. The Standards are: 1) Number Sense, Properties, and Operations; 2) Patterns, Functions, and Algebraic Structures; 3) Data Analysis, Statistics, and Probability; 4) Shape, Dimension, and Geometric Relationships. The information in the standards progresses from large to fine grain, detailing specific skills and outcomes students must master: Standards to Prepared Graduate Competencies to Grade Level/Course Expectation to Concepts and Skills Students Master to Evidence Outcomes. The specific indicators of these different levels of mastery are defined in the Evidence Outcomes. It is important not to think of these standards in terms of ―introduction, mastery, reinforcement.‖ All of the evidence outcomes in a certain grade level must be mastered in order for the next higher level of mastery to occur. Again, to maintain consistency and coherence throughout the district, across all levels, adherence to this idea of mastery is vital.
In creating the documents for the 2012 Boulder Valley Curriculum Essentials Documents in mathematics, the writing teams focused on clarity, focus and understanding essential changes from the BVSD 2009 standards to the new 2011 CAS. To maintain the integrity of these documents, it is important that teachers throughout the district follow the standards precisely so that each child in every classroom can be guaranteed a viable education, regardless of the school they attend or if they move from another school, another district or another state. Consistency, clarity and coherence are essential to excellence in mathematics instruction district wide.
Components of the Curriculum Essentials Document
The CED for each grade level and course include the following: An At-A-Glance page containing:
o approximately ten key skills or topics that students will master during the year o the general big ideas of the grade/course o the Standards of Mathematical Practices
o assessment tools allow teachers to continuously monitor student progress for planning and pacing needs o description of mathematics at that level
The Grade Level Expectations (GLE) pages. The advanced level courses for high school were based on the high school course with additional topics or more in-depth coverage of topics included in bold text.
The Grade Level Glossary of Academic Terms lists all of the terms with which teachers should be familiar and comfortable using during instruction. It is not a comprehensive list of vocabulary for student use.
PK-12 Prepared Graduate Competencies PK-12 At-A-Glance Guide from the CAS with notes from the CCSS CAS Vertical Articulation Guide PK-12
Explanation of Coding
In these documents you will find various abbreviations and coding used by the Colorado Department of Education. MP – Mathematical Practices Standard PFL – Personal Financial Literacy CCSS – Common Core State Standards
Example: (CCSS: 1.NBT.1) – taken directly from the Common Core State Standards with an reference to the specific CCSS domain, standard and cluster of evidence outcomes. NBT – Number Operations in Base Ten OA – Operations and Algebraic Thinking MD – Measurement and Data G – Geometry

5/22/2012 BVSD Curriculum Essentials 3
Standards for Mathematical Practice from
The Common Core State Standards for Mathematics
The Standards for Mathematical Practice have been included in the Nature of Mathematics section in
each Grade Level Expectation of the Colorado Academic Standards. The following definitions and
explanation of the Standards for Mathematical Practice from the Common Core State Standards can be
found on pages 6, 7, and 8 in the Common Core State Standards for Mathematics. Each Mathematical
Practices statement has been notated with (MP) at the end of the statement.
Mathematics | Standards for Mathematical Practice
The Standards for Mathematical Practice describe varieties of expertise that mathematics educators at
all levels should seek to develop in their students. These practices rest on important ―processes and
proficiencies‖ with longstanding importance in mathematics education. The first of these are the NCTM
process standards of problem solving, reasoning and proof, communication, representation, and
connections. The second are the strands of mathematical proficiency specified in the National Research
Council‘s report Adding It Up: adaptive reasoning, strategic competence, conceptual understanding
(comprehension of mathematical concepts, operations and relations), procedural fluency (skill in
carrying out procedures flexibly, accurately, efficiently and appropriately), and productive disposition
(habitual inclination to see mathematics as sensible, useful, and worthwhile, coupled with a belief in
diligence and one‘s own efficacy).
1. Make sense of problems and persevere in solving them.
Mathematically proficient students start by explaining to themselves the meaning of a problem and
looking for entry points to its solution. They analyze givens, constraints, relationships, and goals. They
make conjectures about the form and meaning of the solution and plan a solution pathway rather than
simply jumping into a solution attempt. They consider analogous problems, and try special cases and
simpler forms of the original problem in order to gain insight into its solution. They monitor and
evaluate their progress and change course if necessary. Older students might, depending on the
context of the problem, transform algebraic expressions or change the viewing window on their
graphing calculator to get the information they need. Mathematically proficient students can explain
correspondences between equations, verbal descriptions, tables, and graphs or draw diagrams of
important features and relationships, graph data, and search for regularity or trends. Younger students
might rely on using concrete objects or pictures to help conceptualize and solve a problem.
Mathematically proficient students check their answers to problems using a different method, and they
continually ask themselves, ―Does this make sense?‖ They can understand the approaches of others to
solving complex problems and identify correspondences between different approaches.
2. Reason abstractly and quantitatively.
Mathematically proficient students make sense of quantities and their relationships in problem
situations. They bring two complementary abilities to bear on problems involving quantitative
relationships: the ability to decontextualize—to abstract a given situation and represent it symbolically
and manipulate the representing symbols as if they have a life of their own, without necessarily
attending to their referents—and the ability to contextualize, to pause as needed during the
manipulation process in order to probe into the referents for the symbols involved. Quantitative
reasoning entails habits of creating a coherent representation of the problem at hand; considering the
units involved; attending to the meaning of quantities, not just how to compute them; and knowing
and flexibly using different properties of operations and objects.
3. Construct viable arguments and critique the reasoning of others.
Mathematically proficient students understand and use stated assumptions, definitions, and previously
established results in constructing arguments. They make conjectures and build a logical progression
of statements to explore the truth of their conjectures. They are able to analyze situations by breaking
them into cases, and can recognize and use counterexamples. They justify their conclusions,
communicate them to others, and respond to the arguments of others. They reason inductively about
data, making plausible arguments that take into account the context from which the data arose.
Mathematically proficient students are also able to compare the effectiveness of two plausible
arguments, distinguish correct logic or reasoning from that which is flawed, and—if there is a flaw in
an argument—explain what it is. Elementary students can construct arguments using concrete

5/22/2012 BVSD Curriculum Essentials 4
referents such as objects, drawings, diagrams, and actions. Such arguments can make sense and be
correct, even though they are not generalized or made formal until later grades. Later, students learn
to determine domains to which an argument applies. Students at all grades can listen or read the
arguments of others, decide whether they make sense, and ask useful questions to clarify or improve
the arguments.
4. Model with mathematics.
Mathematically proficient students can apply the mathematics they know to solve problems arising in
everyday life, society, and the workplace. In early grades, this might be as simple as writing an
addition equation to describe a situation. In middle grades, a student might apply proportional
reasoning to plan a school event or analyze a problem in the community. By high school, a student
might use geometry to solve a design problem or use a function to describe how one quantity of
interest depends on another. Mathematically proficient students who can apply what they know are
comfortable making assumptions and approximations to simplify a complicated situation, realizing that
these may need revision later. They are able to identify important quantities in a practical situation
and map their relationships using such tools as diagrams, two-way tables, graphs, flowcharts and
formulas. They can analyze those relationships mathematically to draw conclusions. They routinely
interpret their mathematical results in the context of the situation and reflect on whether the results
make sense, possibly improving the model if it has not served its purpose.
5. Use appropriate tools strategically.
Mathematically proficient students consider the available tools when solving a mathematical problem.
These tools might include pencil and paper, concrete models, a ruler, a protractor, a calculator, a
spreadsheet, a computer algebra system, a statistical package, or dynamic geometry software.
Proficient students are sufficiently familiar with tools appropriate for their grade or course to make
sound decisions about when each of these tools might be helpful, recognizing both the insight to be
gained and their limitations. For example, mathematically proficient high school students analyze
graphs of functions and solutions generated using a graphing calculator. They detect possible errors by
strategically using estimation and other mathematical knowledge. When making mathematical models,
they know that technology can enable them to visualize the results of varying assumptions,
explore consequences, and compare predictions with data. Mathematically proficient students at
various grade levels are able to identify relevant external mathematical resources, such as digital
content located on a website, and use them to pose or solve problems. They are able to use
technological tools to explore and deepen their understanding of concepts.
6. Attend to precision.
Mathematically proficient students try to communicate precisely to others. They try to use clear
definitions in discussion with others and in their own reasoning. They state the meaning of the symbols
they choose, including using the equal sign consistently and appropriately. They are careful about
specifying units of measure, and labeling axes to clarify the correspondence with quantities in a
problem. They calculate accurately and efficiently, express numerical answers with a degree of
precision appropriate for the problem context. In the elementary grades, students give carefully
formulated explanations to each other. By the time they reach high school they have learned to
examine claims and make explicit use of definitions.
7. Look for and make use of structure.
Mathematically proficient students look closely to discern a pattern or structure. Young students, for
example, might notice that three and seven more is the same amount as seven and three more, or
they may sort a collection of shapes according to how many sides the shapes have. Later, students will
see 7 × 8 equals the well remembered 7 × 5 + 7 × 3, in preparation for learning about the distributive
property. In the expression x2 + 9x + 14, older students can see the 14 as 2 × 7 and the 9 as 2 + 7.
They recognize the significance of an existing line in a geometric figure and can use the strategy of
drawing an auxiliary line for solving problems. They also can step back for an overview and shift
perspective. They can see complicated things, such as some algebraic expressions, as single objects or
as being composed of several objects. For example, they can see 5 – 3(x – y)2 as 5 minus a positive
number times a square and use that to realize that its value cannot be more than 5 for any real
numbers x and y.

5/22/2012 BVSD Curriculum Essentials 5
8. Look for and express regularity in repeated reasoning.
Mathematically proficient students notice if calculations are repeated, and look both for general
methods and for shortcuts. Upper elementary students might notice when dividing 25 by 11 that they
are repeating the same calculations over and over again, and conclude they have a repeating decimal.
By paying attention to the calculation of slope as they repeatedly check whether points are on the line
through (1, 2) with slope 3, middle school students might abstract the equation (y – 2)/(x – 1) = 3.
Noticing the regularity in the way terms cancel when expanding (x – 1)(x + 1), (x – 1)(x2 + x + 1),
and (x – 1)(x3 + x2 + x + 1) might lead them to the general formula for the sum of a geometric series.
As they work to solve a problem, mathematically proficient students maintain oversight of the process,
while attending to the details. They continually evaluate the reasonableness of their intermediate
results.
Connecting the Standards for Mathematical Practice to the Standards for Mathematical
Content
The Standards for Mathematical Practice describe ways in which developing student practitioners of the
discipline of mathematics increasingly ought to engage with the subject matter as they grow in
mathematical maturity and expertise throughout the elementary, middle and high school years.
Designers of curricula, assessments, and professional development should all attend to the need to
connect the mathematical practices to mathematical content in mathematics instruction. The
Standards for Mathematical Content are a balanced combination of procedure and understanding.
Expectations that begin with the word ―understand‖ are often especially good opportunities to connect
the practices to the content. Students who lack understanding of a topic may rely on procedures too
heavily. Without a flexible base from which to work, they may be less likely to consider analogous
problems, represent problems coherently, justify conclusions, apply the mathematics to practical
situations, use technology mindfully to work with the mathematics, explain the mathematics accurately
to other students, step back for an overview, or deviate from a known procedure to find a shortcut. In
short, a lack of understanding effectively prevents a student from engaging in the mathematical
practices. In this respect, those content standards which set an expectation of understanding are
potential ―points of intersection‖ between the Standards for Mathematical Content and the Standards
for Mathematical Practice. These points of intersection are intended to be weighted toward central and
generative concepts in the school mathematics curriculum that most merit the time, resources,
innovative energies, and focus necessary to qualitatively improve the curriculum, instruction,
assessment, professional development, and student achievement in mathematics.

5/22/2012 BVSD Curriculum Essentials 6
21st Century Skills and Readiness Competencies in Mathematics
Mathematics in Colorado‘s description of 21st century skills is a synthesis of the essential abilities
students must apply in our rapidly changing world. Today‘s mathematics students need a repertoire of
knowledge and skills that are more diverse, complex, and integrated than any previous generation.
Mathematics is inherently demonstrated in each of Colorado 21st century skills, as follows:
Critical Thinking and Reasoning
Mathematics is a discipline grounded in critical thinking and reasoning. Doing mathematics involves
recognizing problematic aspects of situations, devising and carrying out strategies, evaluating the
reasonableness of solutions, and justifying methods, strategies, and solutions. Mathematics provides
the grammar and structure that make it possible to describe patterns that exist in nature and society.
Information Literacy
The discipline of mathematics equips students with tools and habits of mind to organize and interpret
quantitative data. Informationally literate mathematics students effectively use learning tools,
including technology, and clearly communicate using mathematical language.
Collaboration
Mathematics is a social discipline involving the exchange of ideas. In the course of doing mathematics,
students offer ideas, strategies, solutions, justifications, and proofs for others to evaluate. In turn, the
mathematics student interprets and evaluates the ideas, strategies, solutions, justifications and proofs
of others.
Self-Direction
Doing mathematics requires a productive disposition and self-direction. It involves monitoring and
assessing one‘s mathematical thinking and persistence in searching for patterns, relationships, and
sensible solutions.
Invention
Mathematics is a dynamic discipline, ever expanding as new ideas are contributed. Invention is the key
element as students make and test conjectures, create mathematical models of real-world
phenomena, generalize results, and make connections among ideas, strategies and solutions.

5/22/2012 BVSD Curriculum Essentials 7
Colorado Academic Standards
Mathematics
The Colorado academic standards in mathematics are the topical organization of the concepts and
skills every Colorado student should know and be able to do throughout their preschool through
twelfth-grade experience.
1. Number Sense, Properties, and Operations
Number sense provides students with a firm foundation in mathematics. Students build a deep
understanding of quantity, ways of representing numbers, relationships among numbers, and
number systems. Students learn that numbers are governed by properties and understanding
these properties leads to fluency with operations.
2. Patterns, Functions, and Algebraic Structures
Pattern sense gives students a lens with which to understand trends and commonalities.
Students recognize and represent mathematical relationships and analyze change. Students
learn that the structures of algebra allow complex ideas to be expressed succinctly.
3. Data Analysis, Statistics, and Probability
Data and probability sense provides students with tools to understand information and
uncertainty. Students ask questions and gather and use data to answer them. Students use a
variety of data analysis and statistics strategies to analyze, develop and evaluate inferences
based on data. Probability provides the foundation for collecting, describing, and interpreting
data.
4. Shape, Dimension, and Geometric Relationships
Geometric sense allows students to comprehend space and shape. Students analyze the
characteristics and relationships of shapes and structures, engage in logical reasoning, and use
tools and techniques to determine measurement. Students learn that geometry and
measurement are useful in representing and solving problems in the real world as well as in
mathematics.
Modeling Across the Standards
Modeling links classroom mathematics and statistics to everyday life, work, and decision-making.
Modeling is the process of choosing and using appropriate mathematics and statistics to analyze
empirical situations, to understand them better, and to improve decisions. When making mathematical
models, technology is valuable for varying assumptions, exploring consequences, and comparing
predictions with data. Modeling is best interpreted not as a collection of isolated topics but rather in
relation to other standards, specific modeling standards appear throughout the high school standards
indicated by a star symbol (*).

5/22/2012 BVSD Curriculum Essentials 8
M68 Math Topics Course Overview
Course Description
This course is designed to prepare students for
college work that will not require extensive
Calculus. Major topics to be covered include, but
not limited to: comprehensive review of algebra
and geometry skills; quadratic, polynomial,
rational, exponential, logarithmic and
trigonometric functions; probability and
statistics; finance and business topics. As
appropriate, career options relevant to this level
of math will also be explored.
Topics at a Glance
Algebra I and Algebra II Review
Polynomial and Rational Functions
Exponential and Logarithmic Functions
Intro to Calculus (Optional)
Systems of Equations and Inequalities
Statistics
Probability
Trigonometric Functions
Matrices
Sequences
Business and Finance
Conic Sections (Optional)
Assessments
Teacher Created Assessments
Practice Placement Tests
Standards for Mathematical Practice
1. Make sense of problems and persevere
in solving them.
2. Reason abstractly and quantitatively.
3. Construct viable arguments and critique
the reasoning of others.
4. Model with mathematics.
5. Use appropriate tools strategically.
6. Attend to precision.
7. Look for and make use of structure.
8. Look for and express regularity in
repeated reasoning.
Grade Level Expectations
Standard Big Ideas for Advanced Math Topics
1. Number Sense, Properties, and Operations
1. The complex number system includes real numbers and imaginary numbers
2. Sequences Quantitative reasoning is used to make sense of quantities and their relationships in problem situations.
2. Patterns, Functions, & Algebraic Structures
1. Functions model situations where one quantity determines another and can be represented algebraically, graphically, and using tables
3. Data Analysis, Statistics, & Probability
1. To use probability as a tool for anticipating what a distribution of data should look like under a given model and how to use it to support informed decision- making.
2. Students should be able to create a plan for data collection interpreting the data and verifying the result.
4. Shape, Dimension, & Geometric Relationships
1. Fundamental understanding of circular trigonometry can be used in many applications.
2. Objects in the plane can be described and analyzed algebraically. (Extension)
5/22/2012 BVSD Curriculum Essentials 9
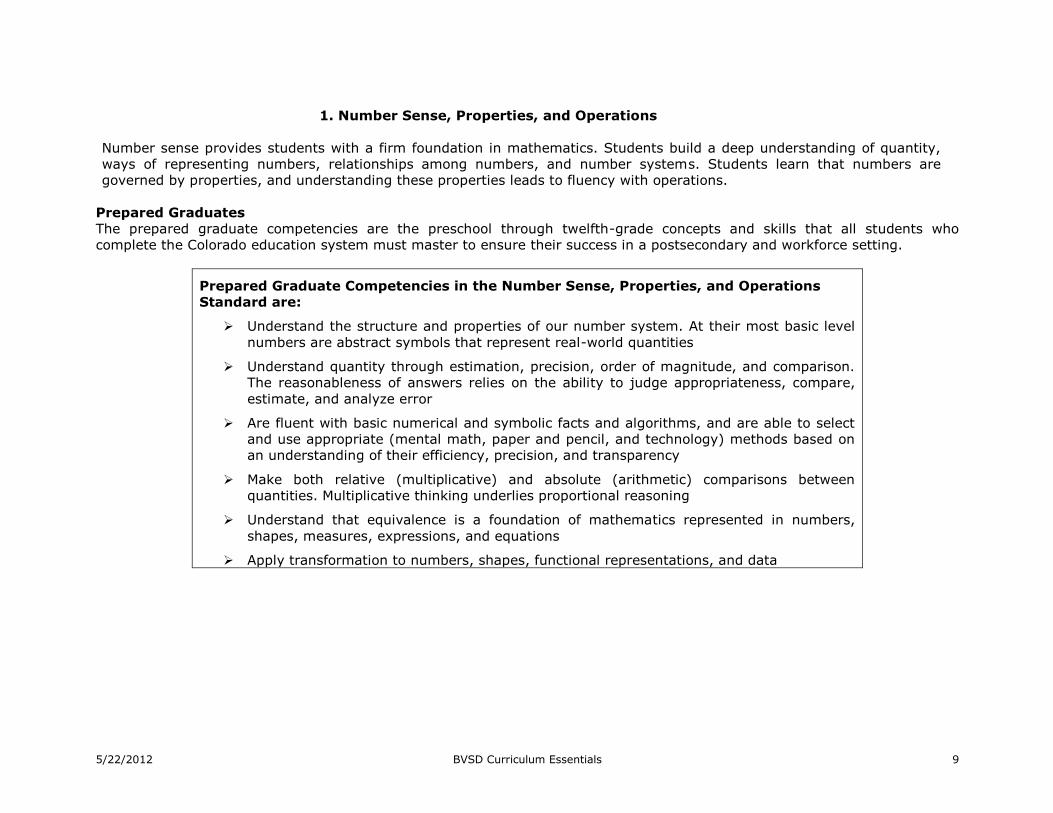
1. Number Sense, Properties, and Operations
Number sense provides students with a firm foundation in mathematics. Students build a deep understanding of quantity,
ways of representing numbers, relationships among numbers, and number systems. Students learn that numbers are
governed by properties, and understanding these properties leads to fluency with operations.
Prepared Graduates
The prepared graduate competencies are the preschool through twelfth-grade concepts and skills that all students who
complete the Colorado education system must master to ensure their success in a postsecondary and workforce setting.
Prepared Graduate Competencies in the Number Sense, Properties, and Operations
Standard are:
Understand the structure and properties of our number system. At their most basic level
numbers are abstract symbols that represent real-world quantities
Understand quantity through estimation, precision, order of magnitude, and comparison.
The reasonableness of answers relies on the ability to judge appropriateness, compare,
estimate, and analyze error
Are fluent with basic numerical and symbolic facts and algorithms, and are able to select
and use appropriate (mental math, paper and pencil, and technology) methods based on
an understanding of their efficiency, precision, and transparency
Make both relative (multiplicative) and absolute (arithmetic) comparisons between
quantities. Multiplicative thinking underlies proportional reasoning
Understand that equivalence is a foundation of mathematics represented in numbers,
shapes, measures, expressions, and equations
Apply transformation to numbers, shapes, functional representations, and data

5/22/2012 BVSD Curriculum Essentials 10
Content Area: Mathematics - High School – Math Topics
Standard: 1. Number Sense, Properties, and Operations
Prepared Graduates:
Understand the structure and properties of our number system. At their most basic level numbers are abstract symbols that
represent real-world quantities.
GRADE LEVEL EXPECTATION
Concepts and skills students master:
2. The complex number system includes real numbers and imaginary numbers.
Evidence Outcomes 21st Century Skills and Readiness Competencies
Students can:
1. Complex Numbers
a. Understand the imaginary unit ―i."
b. Add, subtract, multiply and divide complex numbers
c. Perform operations with the square roots of negative
numbers
d. Solve quadratic equations with complex imaginary
solutions
2. Business and Finance
a. Percent
i. Review the fundamental arithmetic properties used
when changing fractions and decimals to percent and
vice versa.
ii. Calculate percent of change using the formula
AMOUNT OF CHANGE X 100 ORIGINAL AMOUNT
iii. Calculate percent mark up or mark down.
b. Personal Loans and Simple Interest
i. Understand the terms principal, note, collateral and
interest.
ii. Understand ordinary interest and the simple interest
formula to calculate it.
iii. Know how to apply the ―United States Rule‖ and
the ―Banker‘s Rule‖ to calculate simple interest on a
loan.
3. Compound Interest
a. Know the definition of compound interest.
b. Compute compound interest using the formula
Inquiry Questions:
1. When you extend to a new number systems (e.g., from
integers to rational numbers and from rational numbers
to real numbers), what properties apply to the extended
number system?
2. Are there more complex numbers than real numbers?
3. What is a number system?
4. Why are complex numbers important?
Relevance and Application:
1. Complex numbers have applications in fields such as
chaos theory and fractals. The familiar image of the
Mandelbrot fractal is the Mandelbrot set graphed on the
complex plane.
2. The amount of change has many applications, such as
calculating the price of items that are on sale, analyzing
changes in the stock market, purchasing, daily personal
and corporate financing, economics, finding percent
solutions in chemistry and fluid dynamics in geometry,
physics and engineering.
Nature of the Discipline:
1. Mathematicians apply math concepts to real world
problem solving.
2. Mathematicians communicate their reasoning used to
solve problems.
3. Mathematicians are able to connect concept and process
to effectively solve problems.

5/22/2012 BVSD Curriculum Essentials 11
A = P (1 + r/n)nt
c. Know the meaning of annual percentage yield or ―API‖.
d. Understand how to use the compound interest formula to
determine ―present value‖ to obtain a certain amount
of money in the future.
4. Installment Buying
a. Know the difference between open-end and fixed
payment installment plans.
b. Understand annual percentage rate (APR) and finance
charges as it relates to loans.
c. Know the actuarial method versus the rule of 78‘s for
refunding interest on early pay offs of loans.
d. Know the ―unpaid balance method‖ and the ―average
daily balance‖ methods to calculate finance charges on
open-end installment loans.
e. Discuss the pros and cons of credit cards including
current legislation aimed at protecting consumers.
5. Mortgages and Home Buying
a. Understand the basics of a mortgage including qualifying,
down payments, points, and closing costs.
b. Discuss the nature of conventional loans as compared
with adjustable – rate loans.
c. Discuss other mortgage loans such as FHA, VA,
Graduated Payment, Balloon Payment and Home Equity
Loans.

5/22/2012 BVSD Curriculum Essentials 12
Content Area: Mathematics - High School – Math Topics
Standard: 1. Number Sense, Properties, and Operations
Prepared Graduates:
Make both relative (multiplicative) and absolute (arithmetic) comparisons between quantities. Multiplicative thinking
underlies proportional reasoning
GRADE LEVEL EXPECTATION
Concepts and skills students master:
2. Sequences Quantitative reasoning is used to make sense of quantities and their relationships in problem situations.
Evidence Outcomes 21st Century Skills and Readiness Competencies
Students can:
1. Arithmetic Sequences
a. Find the common difference of an arithmetic sequence.
b. Write terms of an arithmetic sequence.
c. Use the formula for the general term of an arithmetic
sequence.
d. Use the formula for the sum of the first in terms of an
arithmetic sequence.
e. Apply the sum formula to word problems.
2. Geometric Sequence
a. Find the common ratio of a geometric sequence.
b. Write terms of a geometric sequence.
c. Use the formula for the general term of a geometric
sequence.
d. Use the formula for the sum of the first in terms of a
geometric sequence.
e. Use the formula for the sum of an infinite geometric
series.
Inquiry Questions:
1. How can sequences be used to predict the nth term in a
pattern?
2. How does the nature of the compounding specifically
influence the growth factor?
Relevance and Application:
1. Understanding patterns and creating formulas to
replicate and extrapolate patterns allows us to predict
the nth term without having to find every term in the
pattern.
2. Models can help us identify patterns in nature,
mathematics, psychology and other sciences.
Nature of the Discipline:
1. Mathematicians apply math concepts to real world
problem solving.
2. Mathematicians communicate their reasoning used to
solve problems.
3. Mathematicians are able to connect concept and
process to effectively solve problems.

5/22/2012 BVSD Curriculum Essentials 13
2. Patterns, Functions, and Algebraic Structures
Pattern sense gives students a lens with which to understand trends and commonalities. Being a student of
mathematics involves recognizing and representing mathematical relationships and analyzing change.
Students learn that the structures of algebra allow complex ideas to be expressed succinctly.
Prepared Graduates
The prepared graduate competencies are the preschool through twelfth-grade concepts and skills that all
students who complete the Colorado education system must have to ensure success in a postsecondary and
workforce setting.
Prepared Graduate Competencies in the 2. Patterns, Functions, and Algebraic Structures Standard are:
Are fluent with basic numerical and symbolic facts and algorithms, and are able to select and use appropriate
(mental math, paper and pencil, and technology) methods based on an understanding of their efficiency,
precision, and transparency
Understand that equivalence is a foundation of mathematics represented in numbers, shapes, measures,
expressions, and equations
Make sound predictions and generalizations based on patterns and relationships that arise from numbers,
shapes, symbols, and data
Make claims about relationships among numbers, shapes, symbols, and data and defend those claims by
relying on the properties that are the structure of mathematics
Use critical thinking to recognize problematic aspects of situations, create mathematical models, and present
and defend solutions

5/22/2012 BVSD Curriculum Essentials 14
Content Area: Mathematics - High School – Math Topics
Standard: Standard: 2. Patterns, Functions, and Algebraic Structures
Prepared Graduates:
Make sound predictions and generalizations based on patterns and relationships that arise from numbers, shapes, symbols, and data
GRADE LEVEL EXPECTATION
Concepts and skills students master:
1. Functions model situations where one quantity determines another and can be represented algebraically, graphically, and using tables.
Evidence Outcomes 21st Century Skills and Readiness Competencies
Students can:
1. Review of Algebra I and Algebra II
a. Understand the real number system and simplifying and
evaluating algebraic expressions.
b. Simplify exponential expressions and use scientific notation.
c. Add, subtract, multiply, and divide square root expressions.
d. Work with higher roots; rationalizing denominators and rational
exponents.
e. Add, subtract, and multiply polynomials, including polynomials
in several variables.
f. Factor all types of polynomials.
g. Perform additions, subtraction, multiplication, and division on
rational expressions, including complex expressions, and
specifying the domains of the expression.
h. Solve linear equations, including absolute value and literal
equations.
i. Solve quadratic equations and word problems by
factoring, square roots, and completing the square and
quadratic formula.
j. Graph and solve linear inequalities, including compound
and absolute value inequalities.
Inquiry Questions:
1. Why are relations and functions represented in multiple ways?
2. What is an inverse?
3. How is ―inverse function‖ most likely related to addition and
subtraction being inverse operations and to multiplication and
division being inverse operations?
4. What is the difference between base b and base e exponential
models?
5. How are logarithms used to scale quantities that have an
extremely broad range of values?
6. How are exponential properties and logarithmic properties
intertwined?
7. How does the nature of the compounding specifically influence
the growth factor?
8. Why do we solve systems using multiple methods?
9. What are the advantages and disadvantages to each method?
10. What is the connection between matrices and systems of
equations?
11. Why do we solve systems using multiple methods?
12. What are the advantages and disadvantages to each method?
13. What is the connection between matrices and systems of
equations?
5/22/2012 BVSD Curriculum Essentials 15
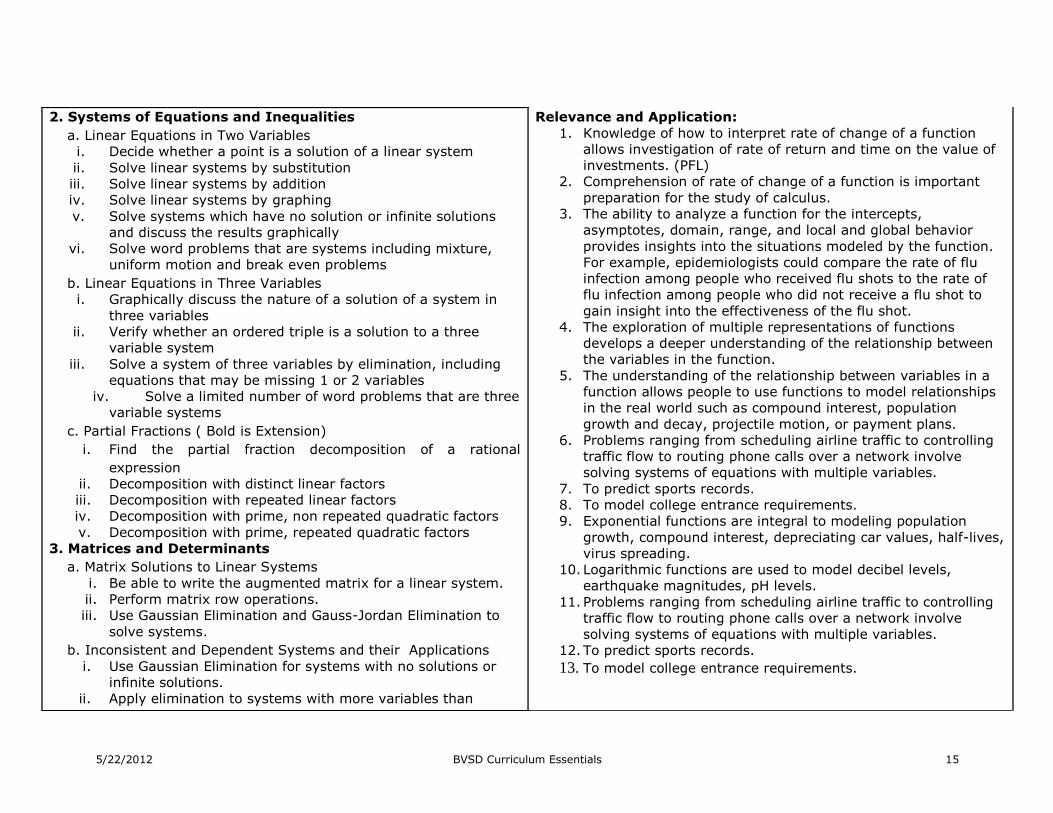
2. Systems of Equations and Inequalities
a. Linear Equations in Two Variables
i. Decide whether a point is a solution of a linear system
ii. Solve linear systems by substitution
iii. Solve linear systems by addition
iv. Solve linear systems by graphing
v. Solve systems which have no solution or infinite solutions
and discuss the results graphically
vi. Solve word problems that are systems including mixture,
uniform motion and break even problems
b. Linear Equations in Three Variables
i. Graphically discuss the nature of a solution of a system in
three variables
ii. Verify whether an ordered triple is a solution to a three
variable system
iii. Solve a system of three variables by elimination, including
equations that may be missing 1 or 2 variables
iv. Solve a limited number of word problems that are three
variable systems
c. Partial Fractions ( Bold is Extension)
i. Find the partial fraction decomposition of a rational
expression
ii. Decomposition with distinct linear factors
iii. Decomposition with repeated linear factors
iv. Decomposition with prime, non repeated quadratic factors
v. Decomposition with prime, repeated quadratic factors
3. Matrices and Determinants
a. Matrix Solutions to Linear Systems
i. Be able to write the augmented matrix for a linear system.
ii. Perform matrix row operations.
iii. Use Gaussian Elimination and Gauss-Jordan Elimination to
solve systems.
b. Inconsistent and Dependent Systems and their Applications
i. Use Gaussian Elimination for systems with no solutions or
infinite solutions.
ii. Apply elimination to systems with more variables than
Relevance and Application:
1. Knowledge of how to interpret rate of change of a function
allows investigation of rate of return and time on the value of
investments. (PFL)
2. Comprehension of rate of change of a function is important
preparation for the study of calculus.
3. The ability to analyze a function for the intercepts,
asymptotes, domain, range, and local and global behavior
provides insights into the situations modeled by the function.
For example, epidemiologists could compare the rate of flu
infection among people who received flu shots to the rate of
flu infection among people who did not receive a flu shot to
gain insight into the effectiveness of the flu shot.
4. The exploration of multiple representations of functions
develops a deeper understanding of the relationship between
the variables in the function.
5. The understanding of the relationship between variables in a
function allows people to use functions to model relationships
in the real world such as compound interest, population
growth and decay, projectile motion, or payment plans.
6. Problems ranging from scheduling airline traffic to controlling
traffic flow to routing phone calls over a network involve
solving systems of equations with multiple variables.
7. To predict sports records.
8. To model college entrance requirements.
9. Exponential functions are integral to modeling population
growth, compound interest, depreciating car values, half-lives,
virus spreading.
10. Logarithmic functions are used to model decibel levels,
earthquake magnitudes, pH levels.
11. Problems ranging from scheduling airline traffic to controlling
traffic flow to routing phone calls over a network involve
solving systems of equations with multiple variables.
12. To predict sports records.
13. To model college entrance requirements.
5/22/2012 BVSD Curriculum Essentials 16
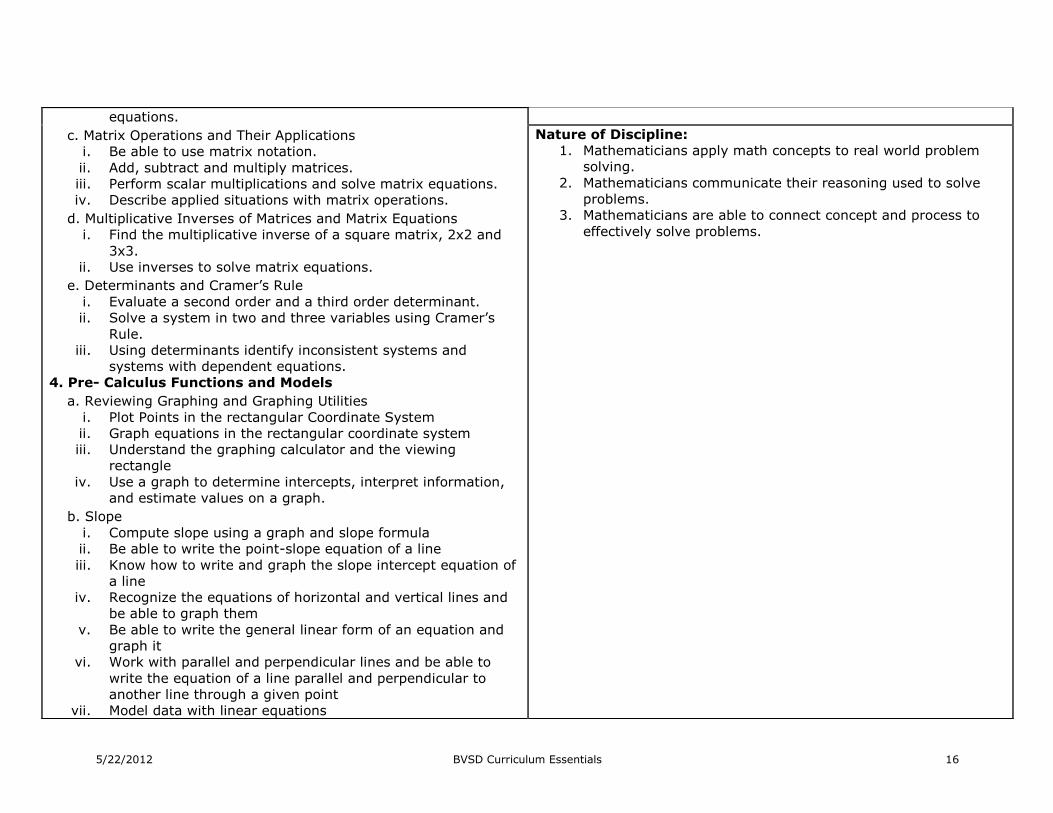
equations.
c. Matrix Operations and Their Applications
i. Be able to use matrix notation.
ii. Add, subtract and multiply matrices.
iii. Perform scalar multiplications and solve matrix equations.
iv. Describe applied situations with matrix operations.
d. Multiplicative Inverses of Matrices and Matrix Equations
i. Find the multiplicative inverse of a square matrix, 2x2 and
3x3.
ii. Use inverses to solve matrix equations.
e. Determinants and Cramer‘s Rule
i. Evaluate a second order and a third order determinant.
ii. Solve a system in two and three variables using Cramer‘s
Rule.
iii. Using determinants identify inconsistent systems and
systems with dependent equations.
4. Pre- Calculus Functions and Models
a. Reviewing Graphing and Graphing Utilities
i. Plot Points in the rectangular Coordinate System
ii. Graph equations in the rectangular coordinate system
iii. Understand the graphing calculator and the viewing
rectangle
iv. Use a graph to determine intercepts, interpret information,
and estimate values on a graph.
b. Slope
i. Compute slope using a graph and slope formula
ii. Be able to write the point-slope equation of a line
iii. Know how to write and graph the slope intercept equation of
a line
iv. Recognize the equations of horizontal and vertical lines and
be able to graph them
v. Be able to write the general linear form of an equation and
graph it
vi. Work with parallel and perpendicular lines and be able to
write the equation of a line parallel and perpendicular to
another line through a given point
vii. Model data with linear equations
Nature of Discipline:
1. Mathematicians apply math concepts to real world problem
solving.
2. Mathematicians communicate their reasoning used to solve
problems.
3. Mathematicians are able to connect concept and process to
effectively solve problems.

5/22/2012 BVSD Curriculum Essentials 17
c. Distance and Midpoint Formulas with Application to Circles
i. Find the distance between two points
ii. Find the midpoint of a line segment
iii. Be able to write the equation of a circle in standard and
general form
iv. Find the center and radius of a circle in standard or general
form
d. Functions
i. Find the domain and range of a relation
ii. Determine whether a relation is a function
iii. Be able to tell whether an equation is a function
iv. Understand function notation and evaluating a function
v. Find the domain of a function
vi. Graph a piecewise function and interpret the graph
e. Graphs of Functions
i. Graph functions by plotting points
ii. Use graphs to obtain information about domain, range and
specific function values
iii. Use the vertical line test to identify functions
iv. Analyze the graph of a function to determine the intervals
where the function is increasing, decreasing or constant
v. Determine relative maxima or minima points for a function
and determine the functions average rate of change
vi. Identify even and odd functions and discuss their
symmetries
vii. Graph step functions
f. Transformation of functions
i. Be able to graph common functions
a. Constant function
b. Identity function
c. Quadratic function
d. Cubic function
e. Square root function
f. Absolute value function
ii. Use vertical and horizontal shifts to graph functions
iii. Use reflections about the x axis and y axis to graph functions

5/22/2012 BVSD Curriculum Essentials 18
iv. Use vertical, horizontal stretching and shrinking to graph
functions
v. Understand the sequence used to graph a function using
more than one transformation
g. Combinations of Functions
i. Combine functions arithmetically and determine their
domains
a. Adding functions
b. Subtracting functions
c. Multiplying functions
d. Dividing functions
ii. Form composite functions, determine the domain, and know
the notation indicating a composite function.
iii. Be able to decompose a given function and write it as a
composition of two functions
h. Inverse Function
i. Know the definition of the inverse of a function
ii. Algebraically verify that two functions are inverses of each
other
iii. Graphically verify that two functions are inverses of each
other
iv. Use the horizontal line test to determine whether the
function has an inverse function
i. Modeling with Functions
i. Translate verbal models into algebraic expressions to
represent a function
ii. Find functions that model geometric situations using
knowledge of geometric formulas
iii. Discuss the maximizing and minimizing of functions as
applied in calculus
j. Quadratic functions
i. Recognize characteristics of parabolas
ii. Be able to graph parabolas in standard form and quadratic
function form
iii. Solve problems involving maximizing and minimizing
quadratic functions
5/22/2012 BVSD Curriculum Essentials 19
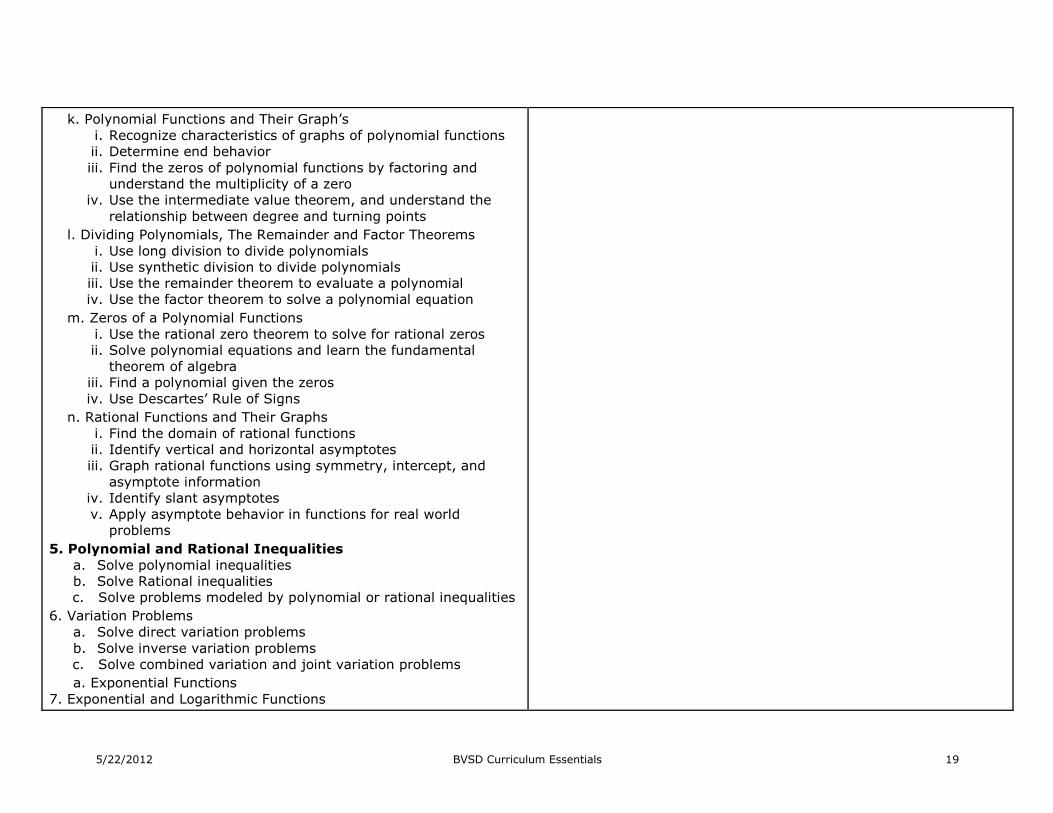
k. Polynomial Functions and Their Graph‘s
i. Recognize characteristics of graphs of polynomial functions
ii. Determine end behavior
iii. Find the zeros of polynomial functions by factoring and
understand the multiplicity of a zero
iv. Use the intermediate value theorem, and understand the
relationship between degree and turning points
l. Dividing Polynomials, The Remainder and Factor Theorems
i. Use long division to divide polynomials
ii. Use synthetic division to divide polynomials
iii. Use the remainder theorem to evaluate a polynomial
iv. Use the factor theorem to solve a polynomial equation
m. Zeros of a Polynomial Functions
i. Use the rational zero theorem to solve for rational zeros
ii. Solve polynomial equations and learn the fundamental
theorem of algebra
iii. Find a polynomial given the zeros
iv. Use Descartes‘ Rule of Signs
n. Rational Functions and Their Graphs
i. Find the domain of rational functions
ii. Identify vertical and horizontal asymptotes
iii. Graph rational functions using symmetry, intercept, and
asymptote information
iv. Identify slant asymptotes
v. Apply asymptote behavior in functions for real world
problems
5. Polynomial and Rational Inequalities
a. Solve polynomial inequalities
b. Solve Rational inequalities
c. Solve problems modeled by polynomial or rational inequalities
6. Variation Problems
a. Solve direct variation problems
b. Solve inverse variation problems
c. Solve combined variation and joint variation problems
a. Exponential Functions
7. Exponential and Logarithmic Functions

5/22/2012 BVSD Curriculum Essentials 20
a. Exponential Functions
i. Evaluate and graph exponential functions
ii. Evaluate functions with base ―e.‖
iii. Understand the characteristics and transformations of
exponential functions
iv. Work with population, investment and compound interest
problems
b. Logarithmic Functions
i. Change from logarithmic to exponential form and vice versa
ii. Evaluate logarithms and use the basic properties of
logarithms
iii. Graph logarithmic functions including transformational work
iv. Work with common and natural logarithms including
modeling real life problems
c. Properties of Logarithms
i. Use the product, quotient and power rules to expand and
condense logarithms
ii. Learn the change of base property for common and natural
logarithms
iii. Solve exponential and logarithmic equations and apply these
techniques to solving word problems
d. Modeling with Exponential and Logarithmic Functions
i. Model exponential growth and decay
ii. Use logistic growth models and Newton‘s Law of Cooling
iii. Express an exponential Function in base ―e.‖

5/22/2012 BVSD Curriculum Essentials 21
3. Data Analysis, Statistics, and Probability
Data and probability sense provides students with tools to understand information and uncertainty.
Students ask questions and gather and use data to answer them. Students use a variety of data
analysis and statistics strategies to analyze, develop and evaluate inferences based on data.
Probability provides the foundation for collecting, describing, and interpreting data.
Prepared Graduates
The prepared graduate competencies are the preschool through twelfth-grade concepts and skills
that all students who complete the Colorado education system must master to ensure their success
in a postsecondary and workforce setting.
Prepared Graduate Competencies in the 3. Data Analysis, Statistics, and Probability Standard are:
Recognize and make sense of the many ways that variability, chance, and randomness appear in a
variety of contexts
Solve problems and make decisions that depend on understanding, explaining, and quantifying the
variability in data
Communicate effective logical arguments using mathematical justification and proof. Mathematical
argumentation involves making and testing conjectures, drawing valid conclusions, and justifying
thinking
Use critical thinking to recognize problematic aspects of situations, create mathematical models, and
present and defend solutions
5/22/2012 BVSD Curriculum Essentials 22
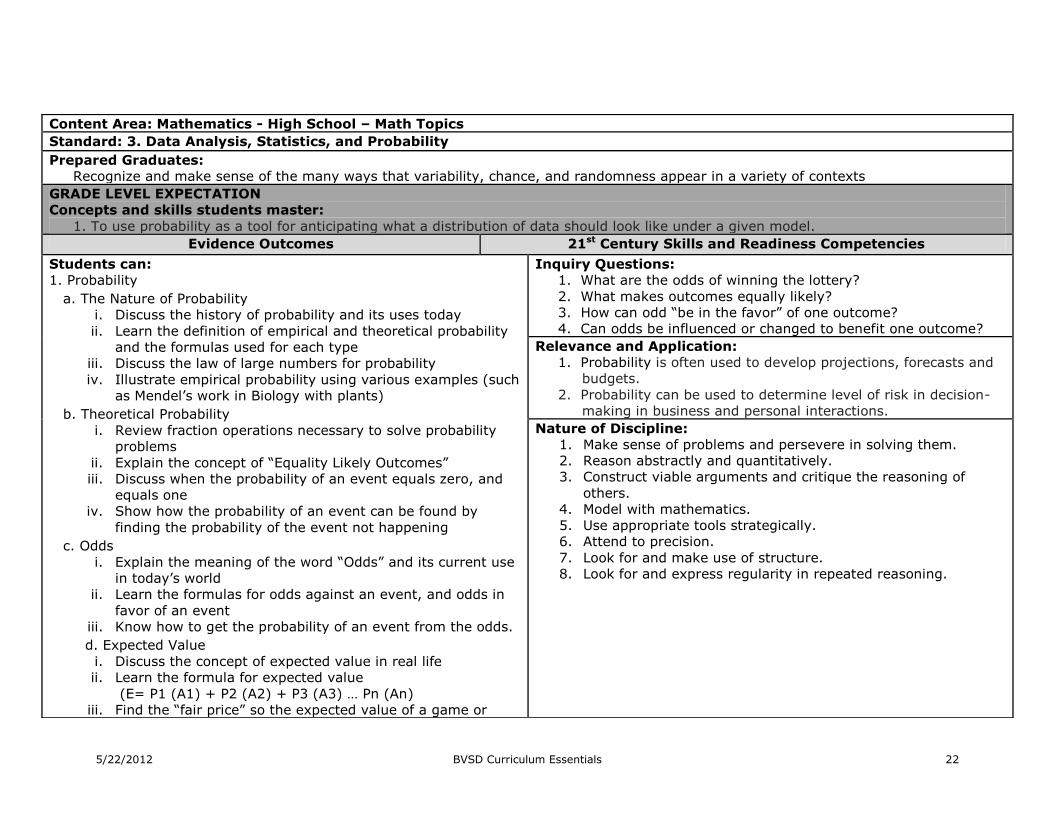
Content Area: Mathematics - High School – Math Topics
Standard: 3. Data Analysis, Statistics, and Probability
Prepared Graduates:
Recognize and make sense of the many ways that variability, chance, and randomness appear in a variety of contexts
GRADE LEVEL EXPECTATION
Concepts and skills students master:
1. To use probability as a tool for anticipating what a distribution of data should look like under a given model.
Evidence Outcomes 21st Century Skills and Readiness Competencies
Students can:
1. Probability
a. The Nature of Probability
i. Discuss the history of probability and its uses today
ii. Learn the definition of empirical and theoretical probability
and the formulas used for each type
iii. Discuss the law of large numbers for probability
iv. Illustrate empirical probability using various examples (such
as Mendel‘s work in Biology with plants)
b. Theoretical Probability
i. Review fraction operations necessary to solve probability
problems
ii. Explain the concept of ―Equality Likely Outcomes‖
iii. Discuss when the probability of an event equals zero, and
equals one
iv. Show how the probability of an event can be found by
finding the probability of the event not happening
c. Odds
i. Explain the meaning of the word ―Odds‖ and its current use
in today‘s world
ii. Learn the formulas for odds against an event, and odds in
favor of an event
iii. Know how to get the probability of an event from the odds.
d. Expected Value
i. Discuss the concept of expected value in real life
ii. Learn the formula for expected value
(E= P1 (A1) + P2 (A2) + P3 (A3) … Pn (An)
iii. Find the ―fair price‖ so the expected value of a game or
Inquiry Questions:
1. What are the odds of winning the lottery?
2. What makes outcomes equally likely?
3. How can odd ―be in the favor‖ of one outcome?
4. Can odds be influenced or changed to benefit one outcome?
Relevance and Application:
1. Probability is often used to develop projections, forecasts and
budgets.
2. Probability can be used to determine level of risk in decision-
making in business and personal interactions.
Nature of Discipline:
1. Make sense of problems and persevere in solving them.
2. Reason abstractly and quantitatively.
3. Construct viable arguments and critique the reasoning of
others.
4. Model with mathematics.
5. Use appropriate tools strategically.
6. Attend to precision.
7. Look for and make use of structure.
8. Look for and express regularity in repeated reasoning.

5/22/2012 BVSD Curriculum Essentials 23
business venture equals zero. (Fair price= expected value+
cost to play).
e. Tree Diagrams and the Counting Principle
i. Use Tree Diagrams to determine sample spaces
ii. Discuss probability problems that involve replacement and
non replacement
iii. Understand the counting principle to determine outcomes of
an experiment
f. ―AND‖ and ―OR‖ Probability Problems
i. Understand the usage of ―AND‖ and ―OR‖ in probability
problems
ii. Use the formula for ―OR‖ problems [P (AorB) = P (A) + P
(B) – P (AandB)] and ―AND‖ problems [P (AandB) = P (A) P
(B)].
iii. Learn the definition of mutually exclusive events and how
the ―OR‖ formula is changed under these conditions
iv. Discuss the relationship between independent and
dependent events and experiments done with and without
replacement.
g. Conditional Probability
i. Use the formula for Conditional Probability to solve
probability problems involving dependent events P (E2/E1)
= n (E1and E2) ÷ n (E1)
ii. Apply Venn Diagrams to help in the understanding of
conditional probability
iii. Be able to use tables or charts of information to compute
conditional probability
h. Permutations
i. Understand the definition of a permutation and how to solve
problems using the formula nPr=n! ÷ (n-r)! , both by hand
and on a calculator
ii. Know how to solve permutations involving duplicate objects
using the formula n! ’ n1! n2! n3!...nr! Where n1 n2… etc.
are the objects, which occur more than once
i. Combinations
i. Understand the definition of a combination and how to solve
problems using the formula nCr= n! ÷ (n-r)! r!
5/22/2012 BVSD Curriculum Essentials 24
ii. Practice combination problems involving the product of
several combinations
iii. Understand when to use permutations versus
combinations and the fact that permutation problems may
also be solved by the counting principle
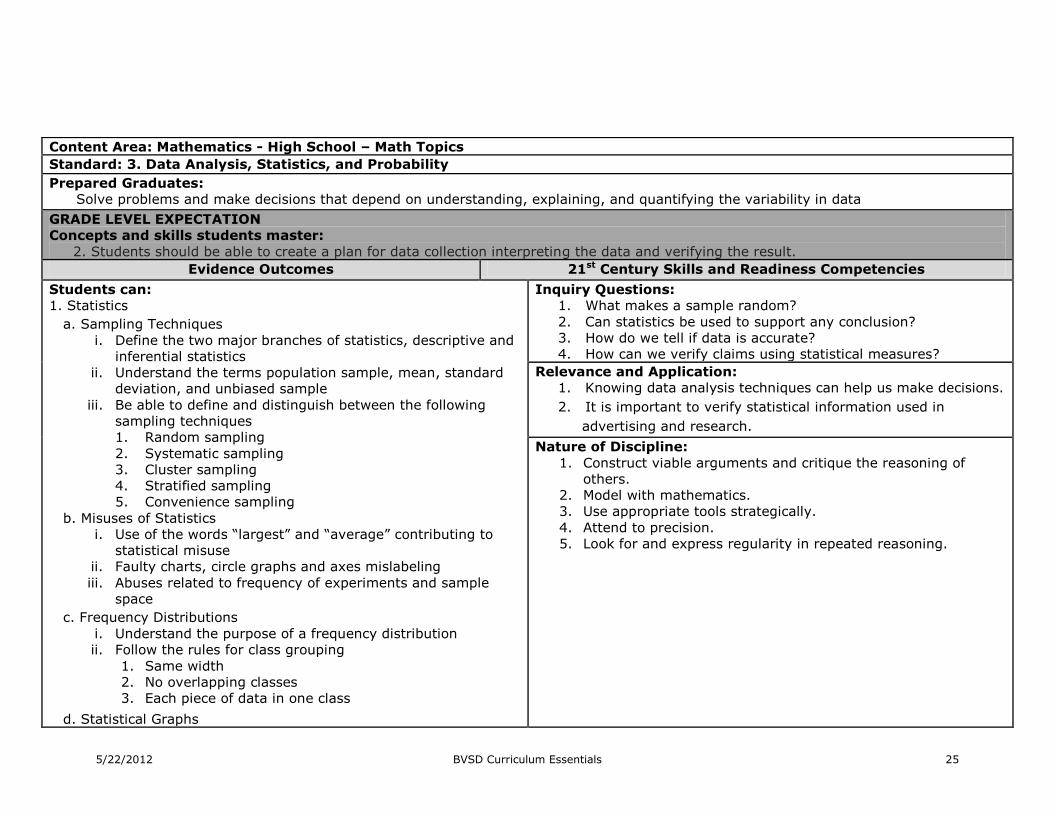
5/22/2012 BVSD Curriculum Essentials 25
Content Area: Mathematics - High School – Math Topics
Standard: 3. Data Analysis, Statistics, and Probability
Prepared Graduates:
Solve problems and make decisions that depend on understanding, explaining, and quantifying the variability in data
GRADE LEVEL EXPECTATION
Concepts and skills students master:
2. Students should be able to create a plan for data collection interpreting the data and verifying the result.
Evidence Outcomes 21st Century Skills and Readiness Competencies
Students can:
1. Statistics
a. Sampling Techniques
i. Define the two major branches of statistics, descriptive and
inferential statistics
ii. Understand the terms population sample, mean, standard
deviation, and unbiased sample
iii. Be able to define and distinguish between the following
sampling techniques
1. Random sampling
2. Systematic sampling
3. Cluster sampling
4. Stratified sampling
5. Convenience sampling
b. Misuses of Statistics
i. Use of the words ―largest‖ and ―average‖ contributing to
statistical misuse
ii. Faulty charts, circle graphs and axes mislabeling
iii. Abuses related to frequency of experiments and sample
space
c. Frequency Distributions
i. Understand the purpose of a frequency distribution
ii. Follow the rules for class grouping
1. Same width
2. No overlapping classes
3. Each piece of data in one class
d. Statistical Graphs
Inquiry Questions:
1. What makes a sample random?
2. Can statistics be used to support any conclusion?
3. How do we tell if data is accurate?
4. How can we verify claims using statistical measures?
Relevance and Application:
1. Knowing data analysis techniques can help us make decisions.
2. It is important to verify statistical information used in
advertising and research.
Nature of Discipline:
1. Construct viable arguments and critique the reasoning of
others.
2. Model with mathematics.
3. Use appropriate tools strategically.
4. Attend to precision.
5. Look for and express regularity in repeated reasoning.

5/22/2012 BVSD Curriculum Essentials 26
i. Know how to construct the following graphs from
statistical information
1. Circle Graphs
2. Histograms
3. Frequency polygons
4. Stem and leaf displays
ii. Consider the ―Rounding‖ problems that arise in circle
graphs
e. Measures of a Central Tendency
i. Know the symbol for the mean and how to calculate it
ii. Be able to rank data to find the median and the mode
iii. Find the midrange of data
iv. Understand the two measures of position, percentiles and
quartiles and how to calculate them
f. Measure of Dispersion
i. Be able to find the range of a set of data
ii. Understand the meaning and the notation for standard
deviation
iii. Be able to find standard deviation for a set of data, using
the formula
g. Normal Curve
i. Be aware of the common distribution shapes
1. Rectangular distribution
2. J-shaped distribution
3. Bi-modal distribution
4. Skewed distribution
5. Normal distribution
ii. Understand the use of z-scores to show deviation from the
mean
iii. Know how to use the z-table to find the percent of data
between any two variables
h. Linear Correction and Regression
i. Discuss the linear relationship between two variables in
terms of a positive, negative or no correlation
ii. Use the linear correlation coefficient on bivariate
iii. Discuss the level of significant concerning change results

5/22/2012 BVSD Curriculum Essentials 27
and actual relationship results
iv. Use formulas for the line of best fit to determine the
regression line for a set of bivariate data
v. Be able to find a modal class, midpoint of a class, class
width and the lower and upper limits of a class

5/22/2012 BVSD Curriculum Essentials 28
4. Shape, Dimension, and Geometric Relationships
Geometric sense allows students to comprehend space and shape. Students analyze the characteristics and
relationships of shapes and structures, engage in logical reasoning, and use tools and techniques to determine
measurement. Students learn that geometry and measurement are useful in representing and solving problems
in the real world as well as in mathematics.
Prepared Graduates
The prepared graduate competencies are the preschool through twelfth-grade concepts and skills that all
students who complete the Colorado education system must master to ensure their success in a postsecondary
and workforce setting.
Prepared Graduate Competencies in the 4. Shape, Dimension, and Geometric
Relationships standard are:
Understand quantity through estimation, precision, order of magnitude, and comparison.
The reasonableness of answers relies on the ability to judge appropriateness, compare,
estimate, and analyze error
Make sound predictions and generalizations based on patterns and relationships that arise
from numbers, shapes, symbols, and data
Apply transformation to numbers, shapes, functional representations, and data
Make claims about relationships among numbers, shapes, symbols, and data and defend
those claims by relying on the properties that are the structure of mathematics
Use critical thinking to recognize problematic aspects of situations, create mathematical
models, and present and defend solutions

5/22/2012 BVSD Curriculum Essentials 29
Content Area: Mathematics - High School – Math Topics
Standard: 4. Shape, Dimension, and Geometric Relationships
Prepared Graduates:
Understand quantity through estimation, precision, order of magnitude, and comparison. The reasonableness of answers relies on the
ability to judge appropriateness, compare, estimate, and analyze error
GRADE LEVEL EXPECTATION
Concepts and skills students master:
1. Fundamental understanding of circular trigonometry can be used in many applications.
Evidence Outcomes 21st Century Skills and Readiness Competencies
Students can:
1. Trigonometric Functions
a. Angles and Their Measure
i. Recognize and use the vocabulary of angles
ii. Use degree measure
iii. Draw angles in standard position
iv. Find co-terminal angles and compliments and supplements
v. Use radian measure and convert between degrees and
radians
b. Right Triangle Trigonometry
i. Use right triangles to evaluate trigonometric functions
(SOHCAH-TOA)
ii. Find the sine, cosine, and tangent of special angles
(30,45,60)
iii. Solve angle of elevation and depression problems
c. Unit Circle
i. Use a unit circle to define trigonometric functions and find
their values
ii. Recognize and use fundamental identities
iii. Know the domain and range of the cosine and sine functions
d. Trigonometric Functions of any Angle
i. Use the definition of the six trigonometric functions of any
angle
ii. Understand the signs of the trigonometric functions in all
four quadrants
iii. Find and use reference angles to evaluate trigonometric
functions
Inquiry Questions:
1. What is the connection between radians and degrees for
measuring angles?
2. Why is the unit circle such an important visual tool for
understanding trigonometric function values?
3. What is the underlying meaning for an specific trigonometric
function value?
4. Can students understand the three different ways the six
trigonometric functions can be defined: as the ratio of two
sides of a right triangle, as coordinates of a point x,y , in the
plane and, its distance r from the origin and as functions of any
real number?
5. How the parts of the trigonometric equation a,b,c and d affect
the nature of the trigonometric curve
6. How can we model periodic applications using sinusoidal
function
7. How does making the trigonometric functions one-to-one
enables us to find an inverse that is a function and how are the
domains restricted to accomplish this
8. How are trigonometric identities fundamentally different from
conditional equations. What algebraic skills are necessary to
verify trigonometric identities.
Relevance and Application:
1. Trigonometric ratios are used in navigation, building and
engineering.
2. To use ancient calendars.
3. Angles are used to find distances around a circle, or how fast a
point moves around a circle.
4. Trigonometric functions are used to model periodic quantities

5/22/2012 BVSD Curriculum Essentials 30
e. Graph of Trigonometric Functions
i. Understand the graph of y=Sin(x) and y=Cos (x)
ii. Graph variations of y=Sin(x) and y=Cos(x),
understanding amplitude, period, phase shifts, and vertical
shifts
f. Inverse Trigonometric Functions
i. Understand and use the inverse sine, cosine, and tangent
functions
ii. Use a calculator to evaluate inverse trigonometric functions
g. Solving Problems
i. Solve right triangles to find missing angles or sides
ii. Use the Law of Sine‘s and Cosine‘s to solve the lengths and
areas of oblique triangles (optional)
such as tidal flows, weather patterns, daylight hours, points
moving in circular motion, sound waves, light waves.
5. Law of Sines and Cosines are used to solve problems of
navigation, distances, surveying.
Nature of Discipline:
1. Mathematicians apply math concepts to real world problem
solving.
2. Mathematicians communicate their reasoning used to solve
problems.
3. Mathematicians are able to connect concept and process to
effectively solve problems.

5/22/2012 BVSD Curriculum Essentials 31
Content Area: Mathematics - High School – Math Topics
Standard: 4. Shape, Dimension, and Geometric Relationships
Prepared Graduates:
Make claims about relationships among numbers, shapes, symbols, and data and defend those claims by relying on the properties that are
the structure of mathematics.
GRADE LEVEL EXPECTATION
Concepts and skills students master:
2. Objects in the plane can be described and analyzed algebraically. (Extension)
Evidence Outcomes 21st Century Skills and Readiness Competencies
Students can:
a. Identify equations of conic sections and graph them on a
Cartesian coordinate plane.
b. Identify key characteristics for each conic section, including
focus/foci, vertex/vertices, center, and asymptotes.
c. Convert between standard form and general form for each
conic section.
d. Model practical applications involving conic sections.
e. Understand the geometric definitions for each conic section in
terms of the locus.
Inquiry Questions:
1. What are the fundamental differences in the equations for each
conic section?
2. How does the position of the focus/foci, vertex/vertices, center,
and asymptotes affect the graphical nature of each curve?
Relevance and Application:
1. The mathematics of conic sections is present in the movement
of planets, bridge and tunnel construction, navigational
systems used to keep track of a ship‘s location and the
manufacture of lenses for telescopes.
2. To model gears in machinery.
Nature of the Discipline:
1. Mathematicians apply math concepts to real world problem
solving.
2. Mathematicians communicate their reasoning used to solve
problems.
3. Mathematicians are able to connect concept and process to
effectively solve problems.

5/22/2012 BVSD Curriculum Essentials 32
Glossary of Terms
M68 Academic Vocabulary for Students
Standard 1: annual percentage rate, annual percentage yield, collateral, common difference,
Complex number, compound interest, complex conjugate, fixed payment, interest, Note, open-end
payment, ordinary interest, Percent of change, Principle, simple interest.
Standard 2: rational expression, complex expression, domain, literal equation, completing the
square, mixture problem, uniform motion problem, break even problem, ordered triple, partial
fraction, partial fraction decomposition, augmented matrix, Gaussian elimination, Gauss-Jordan
elimination, scalar, determinant, Cramer‘s Rule, range, function notation, piecewise function, relative
maxima, relative minima, average rate of change, step function, constant function, identity function,
quadratic function, cubic function, square root function, absolute value function, vertical shift,
horizontal shift, composite function, parabola, polynomial function, remainder, Remainder Theorem,
Factor Theorem, Rational Zero Theorem, Descartes‘ Rule of Signs, asymptotes, symmetry,
exponential growth, exponential decay, Composition, Exponential Function, Inverse, Logarithm ,
Matrices, transformation
Standard 3: probability, empirical probability, theoretical probability, expected value, fair price, tree
diagram, independent events, dependent events, conditional probability, Venn diagram, permutation,
combination, counting principle, descriptive statistics, inferential statistics, population sample, mean,
standard deviation, unbiased sample, circle graph, histogram, frequency polygon, stem-and-leaf
display, mean, median, mode, range, midrange of data, percentiles, quartiles, standard deviation,
rectangular distribution, j-shaped distribution, bi-modal distribution, skewed distribution, normal
distribution, z-scores, bell curve, correlation
Standard 4: Amplitude, Focus/foci, Period, Radians, Unit circle, Vertex/vertices, center, locus,
standard position, co-terminal, angle of elevation, angle of depression, reference angle, phase shift
Reference Glossary for Teachers * These are words available for your reference. Not all words below are listed above
because these are words that you will see above are for students to know and use while the
list below includes words that you, as the teacher, may see in the standards and materials.
Word Definition
Absolute Value
Function
Amplitude Half the difference between the maximum and minimum values of a function.
Angle Of
Depression Angle of depression is the angle between a horizontal line and the line joining the
observer's eye to some object beneath the horizontal line.
Examples of Angle of Depression

5/22/2012 BVSD Curriculum Essentials 33
Angle Of
Elevation Angle of elevation is the angle between a horizontal line and the line joining the
observer's eye to some object above the horizontal line.
Examples of Angle of Elevation
Annual
Percentage
Rate
The annual rate of interest; the total
interest to be paid in a year divided by the balance due.
Annual
Percentage
Yield
As the name suggests, APY is the yield you earn on a deposit over a year. It
refers to your earnings – how much money you‘re making. Because we all want
our money to work for us and grow, it is important to get a good APY from the
bank.
Asymptotes A line that a curve approaches but never reaches.
Augmented
Matrix
Augmented matrix is a coefficient matrix that has an extra column containing the
constant terms and this extra column is separated by a vertical line.
Average Rate
Of Change
The change in the value of a quantity divided by the elapsed time. For a function,
this is the change in the y-value divided by the change in the x-value for
two distinct points on the graph.
Bell Curve The "Bell Curve" is a Normal Distribution.
Bi-Modal
Distribution
Possessing two modes. The term bimodal distribution, which refers to a
distribution having two local maxima (as opposed to two equal most common
values) is a slight corruption of this definition.
Circle Graph Also known as Pie Graph or Pie Chart. A circle graph is a graph in the form of a
circle that is divided into sectors, with each sector representing a part of a set of

5/22/2012 BVSD Curriculum Essentials 34
data.Examples of Circle Graph
In the example shown below, the circle graph shows the percentages of people
who like different fruits. Each sector in the circle graph represents the percentage
of people liking the respective fruit.
Collateral Collateral is assets pledged by a borrower to secure a loan. This means the lender
can take possession of the assets if the borrower cannot pay back the loan.
Common
Difference
The difference between each number in an arithmetic series.
Example: the series {3, 5, 7, 9, 11, ...} is made by adding 2 each time, and so
has a "common difference" of 2 (there is a difference of 2 between each number)
Completing The
Square
A technique used to convert a quadratic polynomial in the form ax2 + bx + c to
the form a(x-h) 2 + k.
Complex
Number
Numbers that can be written in the form a+bi, for example,-2.7 + 8.9i, where a
and b are real numbers and i2 = -1.
Composite
Function
Combination of two functions such that the output from the first function becomes
the input for the second function.
Compound
Interest
A method of computing interest in which interest is computed from the up-to-date
balance. That is, interest is earned on the interest and not just on original balance.
Composition Combination of two functions such that the output from the first function becomes
the input for the second function.
Complex
Conjugate
The complex number a+bi and a-bi are complex conjugates.
Conditional
Probability
A probability that is computed based on the assumption that some event has
already occurred. The probability of event B given that event A has occurred is

5/22/2012 BVSD Curriculum Essentials 35
written P(B|A).
Constant
Function Constant function is a linear function of the form y = b, where b is a constant. It
is also written as f(x) = b. The graph of a constant function is a horizontal
line.
Examples of Constant Function
y = 10, y = - 3, y = 11 are some examples of constant functions.
The graph shows a constant function y = 12.
The value of the y is 12 for any x.
Correlation Correlation is the degree to which two or more quantities are linearly associated.
In a two-dimensional plot, the degree of correlation between the values on the
two axes is quantified by the so-called correlation coefficient.
Co-Terminal
Angles which, drawn in standard position, share a terminal side. For example,
60°, -300°, and 780° are all coterminal.
Counting
Principle Counting principle is used to find the number of possible outcomes. Counting
principle states that 'if an event has m possible outcomes and another
independent event has n possible outcomes, then there are mn possible
outcomes for the two events together.
Cramer’s Rule A method for solving a linear system of equations using determinants. Cramer‘s rule
may only be used when the system is square and the coefficient matrix is invertible.
Dependent
Event
An outcome that is affected by previous outcomes.
Descartes’ Rule
Of Signs
A method of determining the maximum number
of positive and negative real roots of a polynomial.
Descriptive
Statistics
Descriptive statistics comprises the kind of analyses we use when we want to
describe the population we are studying, and when we have a population that is
small enough to permit our including every case.
Determinant A value associated with a square matrix.
Domain Domain of a relation is the set of all x-coordinates of the ordered pairs of that
relation.

5/22/2012 BVSD Curriculum Essentials 36
Empirical
Probability
The empirical probability, also known as relative frequency, or experimental
probability, is the ratio of the number of outcomes in which a specified event
occurs to the total number of trials, not in a theoretical sample space but in an
actual experiment. In a more general sense, empirical probability estimates
probabilities from experience and observation.
Expected Value A quantity equal to the average result of an experiment after a large number of
trials. For example, if a fair 6-sided die is rolled, the expected value of the
number rolled is 3.5. This is a correct interpretation even though it is impossible
to roll a 3.5 on a 6-sided die. This sort of thing often occurs with expected values.
Exponential
Decay
A model for decay of a quantity for which the rate of decay is directly
proportional to the amount present. The equation for the model is A =
A0bt (where 0 < b < 1 ) or A = A0e
kt (where k is a negative number representing
the rate of decay). In both formulas A0 is the original amount present at time t =
0.
Exponential
Function
A function that has an equation of the form y=axo. These functions are used to
study population growth or decline, radioactive decay, and compound interest.
Exponential
Growth
A model for growth of a quantity for which the rate of growth is directly
proportional to the amount present. The equation for the model is A =
A0bt (where b > 1 ) or A = A0e
kt (where k is a positive number representing the
rate of growth). In both formulas A0 is the original amount present at time t = 0.
Factor
Theorem If a polynomial has a root , i.e., if , then is a factor of
.
Frequency
Polygon
A graph made by joining the middle-top points of the columns of a frequency
histogram Also known as a frequency histogram.
Gaussian
Elimination
Gaussian elimination is a method for solving matrix equations of the form Ax=b using an augmented matrix.
Gauss-Jordan
Elimination
A method for finding a matrix inverse.
Histogram A histogram is a way of summarizing data that are measured on an interval scale
(either discrete or continuous). It is often used in exploratory data analysis to
illustrate the major features of the distribution of the data in a convenient form. It
divides up the range of possible values in a data set into classes or groups. For
each group, a rectangle is constructed with a base length equal to the range of
values in that specific group, and an area proportional to the number of
observations falling into that group. This means that the rectangles might be
drawn of non-uniform height.

5/22/2012 BVSD Curriculum Essentials 37
Horizontal Shift A shift in which a plane figure moves horizontally.
Identity
Function
The function f(x) = x. More generally, an identity function is one which does not
change the domain values at all.
Note: This is called the identity function since it is the identity for composition of
functions. That is, if f(x) = x and g is any function, then (f ° g)(x) = g(x) and
(g ° f)(x) = g(x).
Independent
Events
Two random phenomena are independent if knowing the outcome of one does not
change the probabilities for outcomes of the other.
Inferential
Statistics
To extend your conclusions to a broader population, like all such classes, all
workers, all women, you must be use inferential statistics, which means you have
to be sure the sample you study is representative of the group you want to
generalize to. You must choose a sample that is REPRESENTATIVE OF THE GROUP
TO WHICH YOU PLAN TO GENERALIZE.
Interest Money paid for the use of other money. Simple or compound interest are most
common.
Inverse If a relation maps element a of its domain to element b of its range, the inverse
relation ―undoes‖ the relation and maps b back to a.
Locus A word for a set of points that forms a geometric figure or graph. For example,
a circle can be defined as the locus of points that are all the same distance from a
given point.
Logarithm For any , if , then logarithm of ‗r‘ to base ‗q‘ is ‗p‘ and it can
be written as . Log is the abbreviation for Logarithm. For example, log28
= 3 is equivalent to 23 = 8.
Matrix A rectangular array of numbers (or letters) arranged in rows and columns.
Mean The average of a set of observations.
Median The midpoint of a distribution.
Midrange Of
Data
In statistics, the mid-range or mid-extreme of a set of statistical data values is
the arithmetic mean of the maximum and minimum values in a data set
Mixture
Problem
Mixture problems involve creating a mixture from two or more things, and then
determining some quantity (percentage, price, etc) of the resulting mixture.
Mode The number which appears most often in a set of numbers.
Normal
Distribution The Normal Distribution has:
mean = median = mode
symmetry about the center
50% of values less than the
mean
and 50% greater than the
mean
Ordered Triple In three-dimensional coordinates, the triple of numbers giving the location of a
point (ordered triple), usually (x,y,z). In n-dimensional space, a sequence

5/22/2012 BVSD Curriculum Essentials 38
of n numbers written in parentheses.
Ordinary
Interest
See Simple Interest
Percentiles The pth percentile of a set of data is the number such that p% of the data is less
than that number. For example, a student whose SAT score is in the 78th
percentile has scored higher than 78% of the students taking the test.
Permutation A selection of objects in which the order of the objects matters.
Parabola A u-shaped curve with certain specific properties. Formally, a parabola is defined
as follows: For a given point, called the focus, and a given line not through the
focus, called the directrix, a parabola is the locus of points such that the distance
to the focus equals the distance to the directrix. Often yielded from a quadratic
function.
Partial Fraction When a proper rational expression is decomposed into a sum of two or more
rational expressions, it is known as Partial Fractions.
Percent Of
Change
A rate of change expressed as a percent. Example: If a population grows from 50
to 55 in one year, it grows by 5/50 = 10% a year.
Period The horizontal length of one cycle of a periodic function.
Piecewise
Function
A function whose definition changes depending on the value of the independent
variable.
Phase Shift Horizontal shift for a periodic function.For example, the function f(x) = 3sin (x –
π) has a phase shift of π. That is, the graph of f(x) = 3sin x is shifted π units to
the right.
Polynomial
Function
A function that is defined by a polynomial.
Population
Sample
A sample is a part of the population of interest, a sub-collection selected from a
population.
Principle The total amount of money borrowed (or invested), not including any interest or
dividends.
Probability A number between 0 and 1 that describes the proportion of times an outcome
would occur in a very long series of repetitions.
Quadratic
Function
A function where the highest exponent on x is a 2. Standard form has an
equation of the form y = ax2+bx+c, where a≠ 0. (i.e. y = 2x2 or y = x2 + 4x +
2).
Quartiles Quartiles are values that divide a set of data into four equal parts. A data set has
three quartiles: the lower quartile, the median of the data set, and the upper
quartile.
Median: The median divides a data set into two equal parts.
Lower quartile: Median of the lower half of the data.
Upper quartile: Median of the upper half of the data.
Radians The measure of a central angle of a circle that intercepts an arc equal in length to
a radius of the circle.
Range of a
function
The set of y-values of a function or relation. More generally, the range is
the set of values assumed by a function or relation over all permitted values of
the independent variable(s).
Range
(statistics)
The difference between the lowest and highest values.
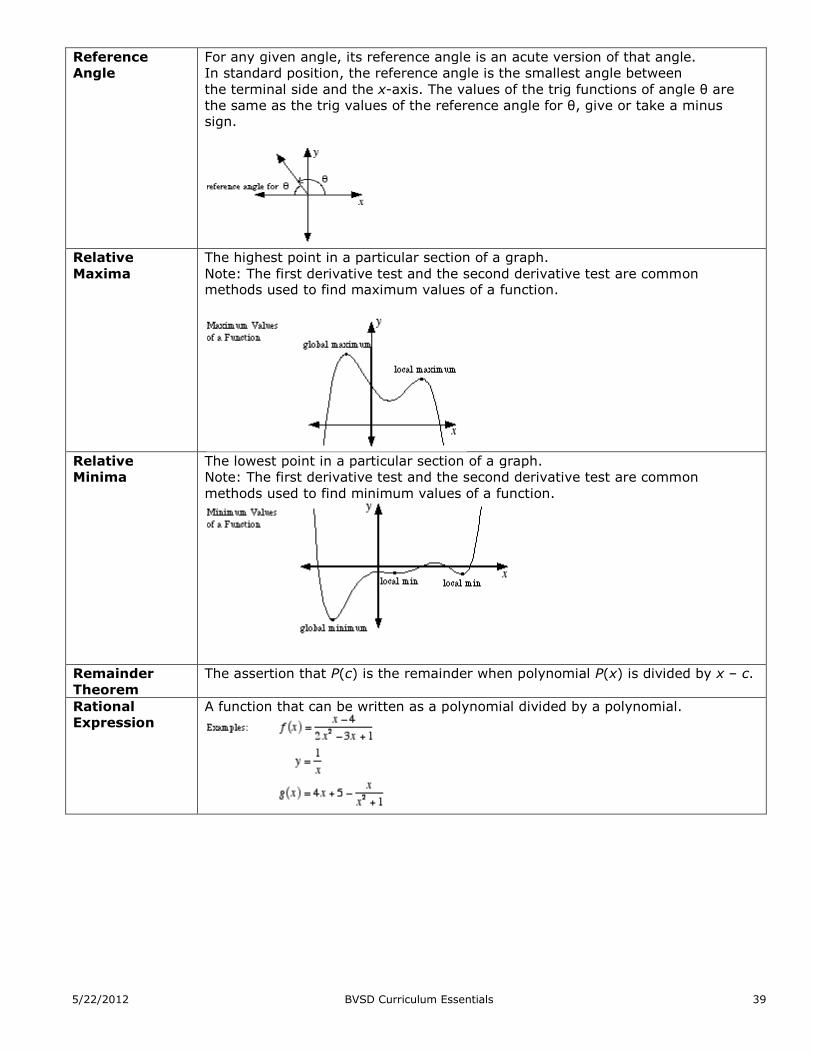
5/22/2012 BVSD Curriculum Essentials 39
Reference
Angle
For any given angle, its reference angle is an acute version of that angle.
In standard position, the reference angle is the smallest angle between
the terminal side and the x-axis. The values of the trig functions of angle θ are
the same as the trig values of the reference angle for θ, give or take a minus sign.
Relative
Maxima
The highest point in a particular section of a graph.
Note: The first derivative test and the second derivative test are common methods used to find maximum values of a function.
Relative
Minima
The lowest point in a particular section of a graph.
Note: The first derivative test and the second derivative test are common
methods used to find minimum values of a function.
Remainder
Theorem
The assertion that P(c) is the remainder when polynomial P(x) is divided by x – c.
Rational
Expression
A function that can be written as a polynomial divided by a polynomial.

5/22/2012 BVSD Curriculum Essentials 40
Rational Zero
Theorem
A theorem that provides a complete list of possible rational roots of
the polynomial equation anxn + an–1x
n–1 + ··· + a2x2 + a1x + a0 = 0 where
all coefficients are integers.
This list consists of all possible numbers of the form c/d, where c and d are
integers. c must divide evenly into the constant term a0. d must divide evenly into the leading coefficient an.
Scalar A quantity used to multiply vectors in the context of vector spaces
Simple Interest Simple interest is the interest calculated only on the principal regardless of the
interest earned so far. The formula for simple interest is I = prt where I is the
simple interest, p is the principal,r is the rate of interest, and t is the period of
time.
Skewed
Distribution
When data has a "long tail" on one side or the other
Standard
Deviation
Standard deviation is a measure of the spread or dispersion of a set of data.It is
calculated by taking the square root of the variance.
Standard
Position
An angle drawn on the x-y plane starting on the positive x-axis and
turning counterclockwise.
Stem-And-Leaf
Display
A simple way to display the shape of a distribution.

5/22/2012 BVSD Curriculum Essentials 41
Step Function
A function that has a graph resembling a staircase. Examples are the floor function (below) and the ceiling function.
Symmetry Describes a geometric figure or a graph consisting of two parts that
are congruent to each other. Symmetry in graphs can be across the origin, x-axis,
y-axis, y=x or any other line.
Theoretical
Probability Probability is a likelihood that an event will happen.
We can find the theoretical probability of an event using the following ratio:
Transformation The process of changing one configuration or expression into another in
accordance with a rule. Common geometric transformations include translations,
rotation, and reflections.
Tree Diagram A type of systematic list in which options are shown as branching diagrams.
Unbiased
Sample
A sample is an unbiased sample if every individual or the element in the
population has an equal chance of being selected.
Uniform Motion A body is said to be in Uniform Motion if it moves in a straight line at constant
speed. A body in uniform motion covers equal distance in equal intervals of time.
If a body moves in uniform motion with a constant speed v for time t, then the
distance traveled s is given as s =
Unit Circle A circle centered at the origin with a radius of 1.
Venn Diagram A Venn diagram is a diagram that uses circles to illustrate the relationships
among sets.
Examples of Venn Diagram
The Venn diagram below shows the number of grade 5 students who
scored above 50% on Math, above 50% on Science, and above 50% on
both Math and Science.

5/22/2012 BVSD Curriculum Essentials 42
From the Venn diagram, we learn that 16 students scored above 50% on Math,
21 students scored above 50% on Science, and 6 students scored above 50% on
both Math and Science.
Vertical Shift A shift in which a plane figure moves vertically.
Z-Scores The -score associated with the observation of a random variable is given by
where is the mean and the standard deviation of all observations , ..., .
Definitions adapted from:
Boulder Valley School District Curriculum Essentials Document, 2009.
―Math Dictionary‖ www.icoachmath.com/math_dictionary/mathdictionarymain.html. Copyright © 1999
- 2011 HighPoints Learning Inc. December 30, 2011.
―The Mathematics Glossary.‖ Common Core Standards for Mathematics.
http://www.corestandards.org/the-standards/mathematics/glossary/glossary/ Copyright
2011. June 23, 2011.
―Thesaurus.‖ http://www.thefreedictionary.com/statistical+distribution . Copyright © 2012 Farlex, Inc.
January 5, 2012.
(n.d.). Retrieved from sas.com.
Statistics Glossary (n.d.). Retrieved from University of Glasgow:
http://www.stats.gla.ac.uk/steps/glossary/index.html

5/22/2012 BVSD Curriculum Essentials 43
PK-12 Alignment of Mathematical Standards
The following pages will provide teachers with an understanding of the alignment of the standards
from Pre-Kindergarten through High School. An understanding of this alignment and each grade
level‘s role in assuring that each student graduates with an thorough understanding of the standards
at each level is an important component of preparing our student‘s for success in the 21st century.
Provided in this section are the Prepared Graduate Competencies in Mathematics, an At-a-glance
description of the Grade Level Expectations for each standard at each grade level and a thorough
explanation from the CCSS about the alignment of the standards across grade levels.
Prepared Graduate Competencies in Mathematics
The prepared graduate competencies are the preschool through twelfth-grade concepts and skills that
all students who complete the Colorado education system must master to ensure their success in a
postsecondary and workforce setting.
Prepared graduates in mathematics:
Understand the structure and properties of our number system. At their most basic level
numbers are abstract symbols that represent real-world quantities
Understand quantity through estimation, precision, order of magnitude, and comparison. The
reasonableness of answers relies on the ability to judge appropriateness, compare, estimate,
and analyze error
Are fluent with basic numerical and symbolic facts and algorithms, and are able to select and
use appropriate (mental math, paper and pencil, and technology) methods based on an
understanding of their efficiency, precision, and transparency
Make both relative (multiplicative) and absolute (arithmetic) comparisons between quantities.
Multiplicative thinking underlies proportional reasoning
Recognize and make sense of the many ways that variability, chance, and randomness appear
in a variety of contexts
Solve problems and make decisions that depend on understanding, explaining, and quantifying
the variability in data
Understand that equivalence is a foundation of mathematics represented in numbers, shapes,
measures, expressions, and equations
Make sound predictions and generalizations based on patterns and relationships that arise from
numbers, shapes, symbols, and data
Apply transformation to numbers, shapes, functional representations, and data
Make claims about relationships among numbers, shapes, symbols, and data and defend those
claims by relying on the properties that are the structure of mathematics
Communicate effective logical arguments using mathematical justification and proof.
Mathematical argumentation involves making and testing conjectures, drawing valid
conclusions, and justifying thinking
Use critical thinking to recognize problematic aspects of situations, create mathematical
models, and present and defend solutions
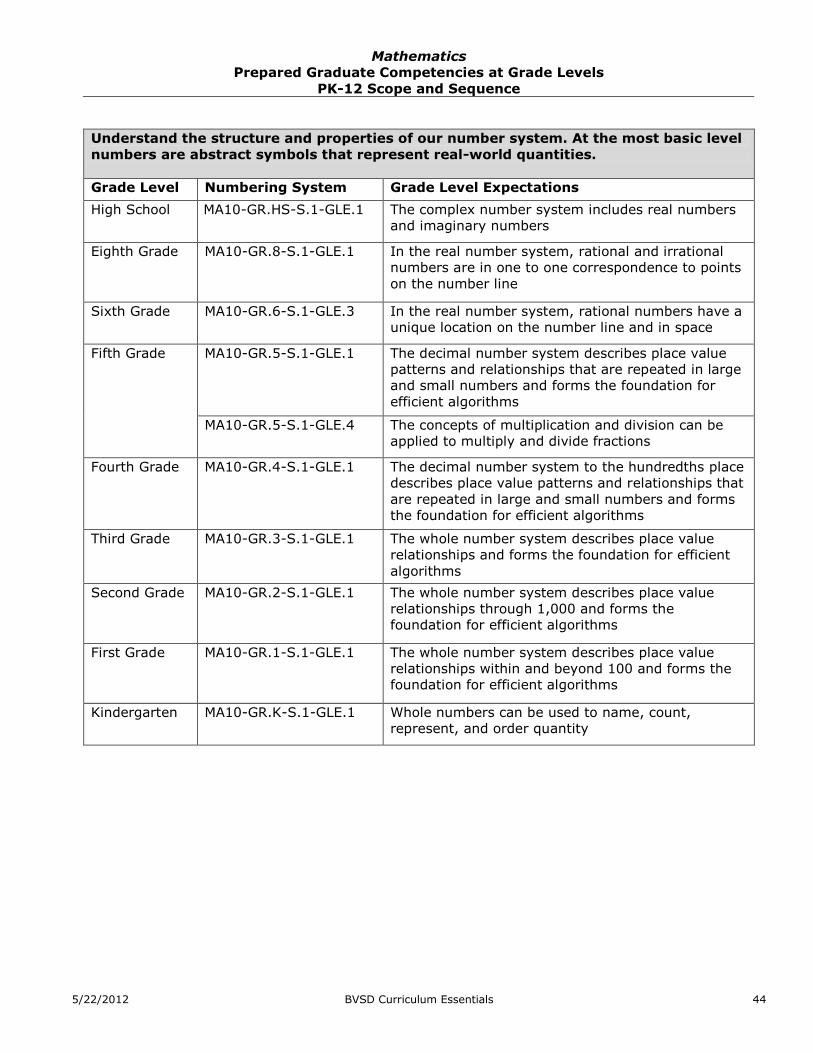
5/22/2012 BVSD Curriculum Essentials 44
Mathematics
Prepared Graduate Competencies at Grade Levels
PK-12 Scope and Sequence
Understand the structure and properties of our number system. At the most basic level
numbers are abstract symbols that represent real-world quantities.
Grade Level Numbering System Grade Level Expectations
High School MA10-GR.HS-S.1-GLE.1 The complex number system includes real numbers
and imaginary numbers
Eighth Grade MA10-GR.8-S.1-GLE.1 In the real number system, rational and irrational
numbers are in one to one correspondence to points
on the number line
Sixth Grade MA10-GR.6-S.1-GLE.3 In the real number system, rational numbers have a
unique location on the number line and in space
Fifth Grade MA10-GR.5-S.1-GLE.1 The decimal number system describes place value
patterns and relationships that are repeated in large
and small numbers and forms the foundation for
efficient algorithms
MA10-GR.5-S.1-GLE.4 The concepts of multiplication and division can be
applied to multiply and divide fractions
Fourth Grade MA10-GR.4-S.1-GLE.1 The decimal number system to the hundredths place
describes place value patterns and relationships that
are repeated in large and small numbers and forms
the foundation for efficient algorithms
Third Grade MA10-GR.3-S.1-GLE.1 The whole number system describes place value
relationships and forms the foundation for efficient
algorithms
Second Grade MA10-GR.2-S.1-GLE.1 The whole number system describes place value
relationships through 1,000 and forms the
foundation for efficient algorithms
First Grade MA10-GR.1-S.1-GLE.1 The whole number system describes place value
relationships within and beyond 100 and forms the
foundation for efficient algorithms
Kindergarten MA10-GR.K-S.1-GLE.1 Whole numbers can be used to name, count,
represent, and order quantity
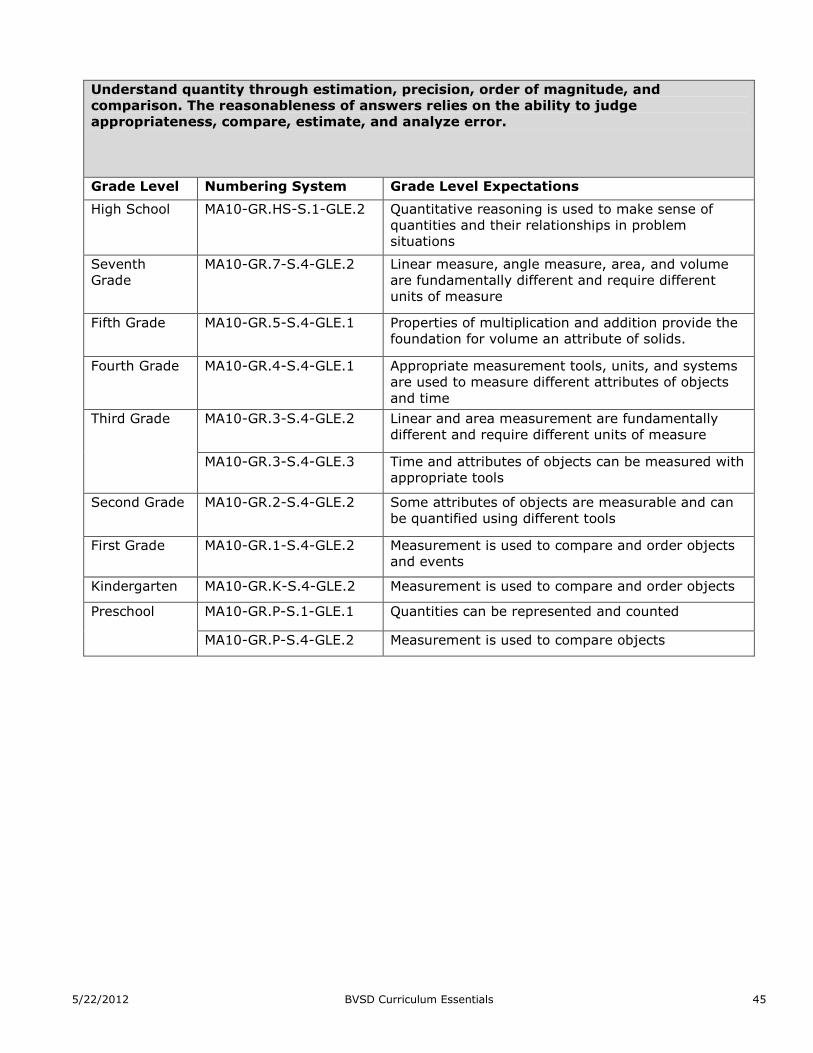
5/22/2012 BVSD Curriculum Essentials 45
Understand quantity through estimation, precision, order of magnitude, and
comparison. The reasonableness of answers relies on the ability to judge
appropriateness, compare, estimate, and analyze error.
Grade Level Numbering System Grade Level Expectations
High School MA10-GR.HS-S.1-GLE.2 Quantitative reasoning is used to make sense of
quantities and their relationships in problem
situations
Seventh
Grade
MA10-GR.7-S.4-GLE.2 Linear measure, angle measure, area, and volume
are fundamentally different and require different
units of measure
Fifth Grade MA10-GR.5-S.4-GLE.1 Properties of multiplication and addition provide the
foundation for volume an attribute of solids.
Fourth Grade MA10-GR.4-S.4-GLE.1 Appropriate measurement tools, units, and systems
are used to measure different attributes of objects
and time
Third Grade
MA10-GR.3-S.4-GLE.2 Linear and area measurement are fundamentally
different and require different units of measure
MA10-GR.3-S.4-GLE.3 Time and attributes of objects can be measured with
appropriate tools
Second Grade MA10-GR.2-S.4-GLE.2 Some attributes of objects are measurable and can
be quantified using different tools
First Grade MA10-GR.1-S.4-GLE.2 Measurement is used to compare and order objects
and events
Kindergarten MA10-GR.K-S.4-GLE.2 Measurement is used to compare and order objects
Preschool MA10-GR.P-S.1-GLE.1 Quantities can be represented and counted
MA10-GR.P-S.4-GLE.2 Measurement is used to compare objects
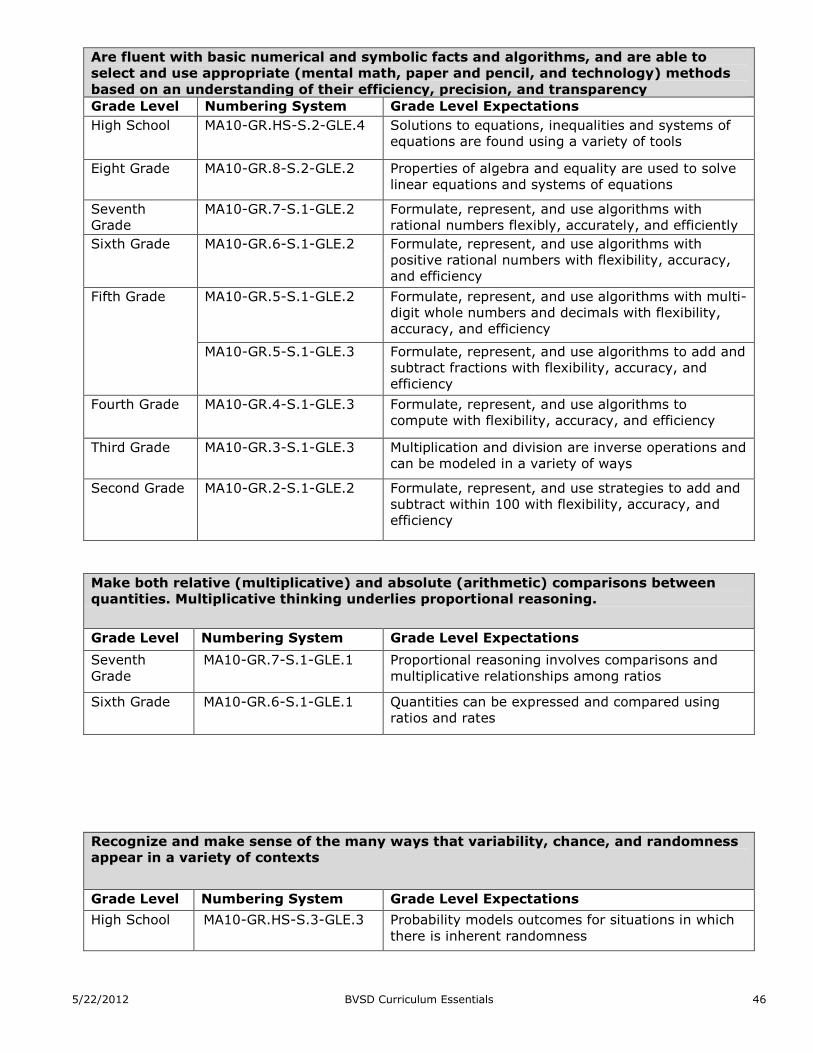
5/22/2012 BVSD Curriculum Essentials 46
Are fluent with basic numerical and symbolic facts and algorithms, and are able to
select and use appropriate (mental math, paper and pencil, and technology) methods
based on an understanding of their efficiency, precision, and transparency
Grade Level Numbering System Grade Level Expectations
High School MA10-GR.HS-S.2-GLE.4 Solutions to equations, inequalities and systems of
equations are found using a variety of tools
Eight Grade MA10-GR.8-S.2-GLE.2 Properties of algebra and equality are used to solve
linear equations and systems of equations
Seventh
Grade
MA10-GR.7-S.1-GLE.2 Formulate, represent, and use algorithms with
rational numbers flexibly, accurately, and efficiently
Sixth Grade MA10-GR.6-S.1-GLE.2 Formulate, represent, and use algorithms with
positive rational numbers with flexibility, accuracy,
and efficiency
Fifth Grade MA10-GR.5-S.1-GLE.2 Formulate, represent, and use algorithms with multi-
digit whole numbers and decimals with flexibility,
accuracy, and efficiency
MA10-GR.5-S.1-GLE.3 Formulate, represent, and use algorithms to add and
subtract fractions with flexibility, accuracy, and
efficiency
Fourth Grade MA10-GR.4-S.1-GLE.3 Formulate, represent, and use algorithms to
compute with flexibility, accuracy, and efficiency
Third Grade MA10-GR.3-S.1-GLE.3 Multiplication and division are inverse operations and
can be modeled in a variety of ways
Second Grade MA10-GR.2-S.1-GLE.2 Formulate, represent, and use strategies to add and
subtract within 100 with flexibility, accuracy, and
efficiency
Make both relative (multiplicative) and absolute (arithmetic) comparisons between
quantities. Multiplicative thinking underlies proportional reasoning.
Grade Level Numbering System Grade Level Expectations
Seventh
Grade
MA10-GR.7-S.1-GLE.1 Proportional reasoning involves comparisons and
multiplicative relationships among ratios
Sixth Grade MA10-GR.6-S.1-GLE.1 Quantities can be expressed and compared using
ratios and rates
Recognize and make sense of the many ways that variability, chance, and randomness
appear in a variety of contexts
Grade Level Numbering System Grade Level Expectations
High School MA10-GR.HS-S.3-GLE.3 Probability models outcomes for situations in which
there is inherent randomness
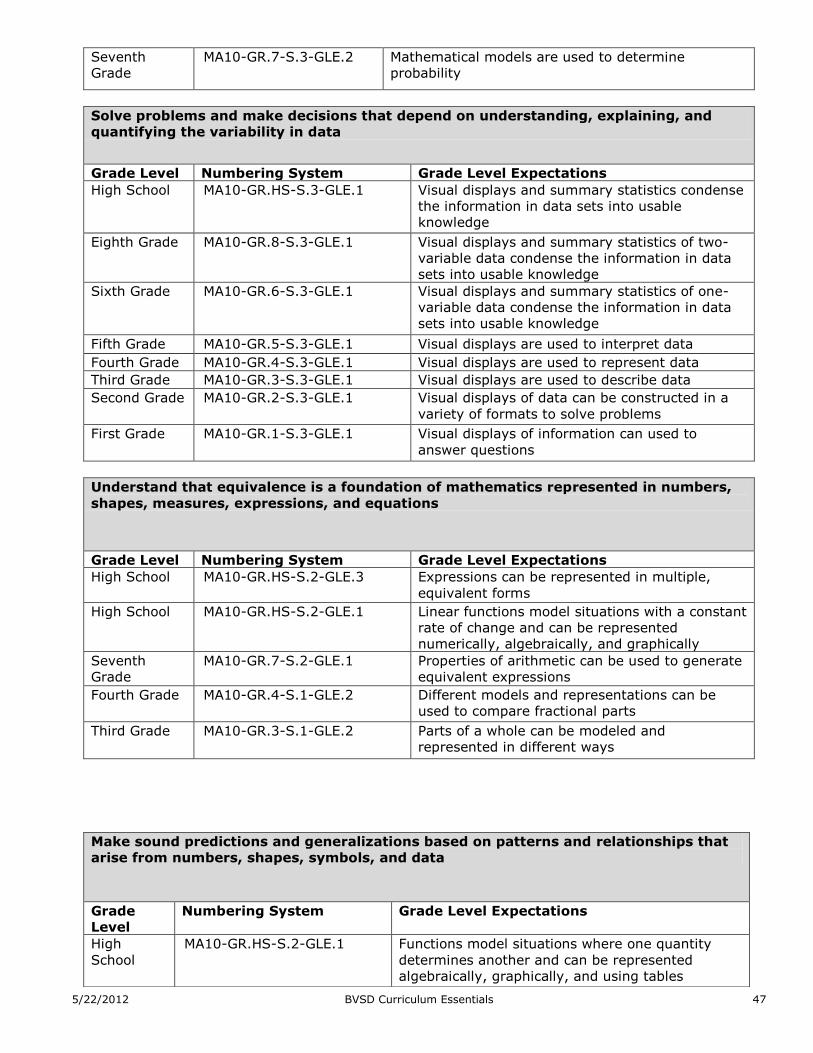
5/22/2012 BVSD Curriculum Essentials 47
Seventh
Grade
MA10-GR.7-S.3-GLE.2 Mathematical models are used to determine
probability
Solve problems and make decisions that depend on understanding, explaining, and
quantifying the variability in data
Grade Level Numbering System Grade Level Expectations
High School MA10-GR.HS-S.3-GLE.1 Visual displays and summary statistics condense
the information in data sets into usable
knowledge
Eighth Grade MA10-GR.8-S.3-GLE.1 Visual displays and summary statistics of two-
variable data condense the information in data
sets into usable knowledge
Sixth Grade MA10-GR.6-S.3-GLE.1 Visual displays and summary statistics of one-
variable data condense the information in data
sets into usable knowledge
Fifth Grade MA10-GR.5-S.3-GLE.1 Visual displays are used to interpret data
Fourth Grade MA10-GR.4-S.3-GLE.1 Visual displays are used to represent data
Third Grade MA10-GR.3-S.3-GLE.1 Visual displays are used to describe data
Second Grade MA10-GR.2-S.3-GLE.1 Visual displays of data can be constructed in a
variety of formats to solve problems
First Grade MA10-GR.1-S.3-GLE.1 Visual displays of information can used to
answer questions
Understand that equivalence is a foundation of mathematics represented in numbers,
shapes, measures, expressions, and equations
Grade Level Numbering System Grade Level Expectations
High School MA10-GR.HS-S.2-GLE.3 Expressions can be represented in multiple,
equivalent forms
High School MA10-GR.HS-S.2-GLE.1 Linear functions model situations with a constant
rate of change and can be represented
numerically, algebraically, and graphically
Seventh
Grade
MA10-GR.7-S.2-GLE.1 Properties of arithmetic can be used to generate
equivalent expressions
Fourth Grade MA10-GR.4-S.1-GLE.2 Different models and representations can be
used to compare fractional parts
Third Grade MA10-GR.3-S.1-GLE.2 Parts of a whole can be modeled and
represented in different ways
Make sound predictions and generalizations based on patterns and relationships that
arise from numbers, shapes, symbols, and data
Grade
Level
Numbering System Grade Level Expectations
High
School
MA10-GR.HS-S.2-GLE.1 Functions model situations where one quantity
determines another and can be represented
algebraically, graphically, and using tables

5/22/2012 BVSD Curriculum Essentials 48
Fifth Grade MA10-GR.5-S.2-GLE.1 Number patterns are based on operations and
relationships
Fourth
Grade
MA10-GR.4-S.2-GLE.1 Number patterns and relationships can be
represented by symbols
Preschool MA10-GR.P-S.4-GLE.1 Shapes can be observed in the world and
described in relation to one another
Apply transformation to numbers, shapes, functional representations, and data
Grade
Level
Numbering System Grade Level Expectations
High School MA10-GR.HS-S.4-GLE.1 Objects in the plane can be transformed, and
those transformations can be described and
analyzed mathematically
High School MA10-GR.HS-S.4-GLE.3 Objects in the plane can be described and
analyzed algebraically
Eighth
Grade
MA10-GR.8-S.4-GLE.1 Transformations of objects can be used to define
the concepts of congruence and similarity
Seventh
Grade
MA10-GR.7-S.4-GLE.1 Modeling geometric figures and relationships
leads to informal spatial reasoning and proof
Second
Grade
MA10-GR.2-S.4-GLE.1 Shapes can be described by their attributes and
used to represent part/whole relationships
First Grade MA10-GR.1-S.1-GLE.2 Number relationships can be used to solve
addition and subtraction problems
Kindergarten MA10-GR.K-S.1-GLE.2 Composing and decomposing quantity forms the
foundation for addition and subtraction

5/22/2012 BVSD Curriculum Essentials 49
Use critical thinking to recognize problematic aspects of situations, create mathematical
models, and present and defend solutions
Make claims about relationships among numbers, shapes, symbols, and data and
defend those claims by relying on the properties that are the structure of mathematics
Grade
Level
Numbering System Grade Level Expectations
High School MA10-GR.HS-S.4-GLE.4 Attributes of two- and three-dimensional objects
are measurable and can be quantified
Sixth Grade MA10-GR.6-S.2-GLE.1 Algebraic expressions can be used to generalize
properties of arithmetic
MA10-GR.6-S.2-GLE.2 Variables are used to represent unknown
quantities within equations and inequalities
MA10-GR.6-S.4-GLE.1 Objects in space and their parts and attributes can
be measured and analyzed
Fifth Grade MA10-GR.5-S.4-GLE.2 Geometric figures can be described by their
attributes and specific locations in the plane
Fourth
Grade
MA10-GR.4-S.4-GLE.2 Geometric figures in the plane and in space are
described and analyzed by their attributes
Third Grade MA10-GR.3-S.4-GLE.1 Geometric figures are described by their attributes
First Grade MA10-GR.1-S.4-GLE.1 Shapes can be described by defining attributes
and created by composing and decomposing
Kindergarten MA10-GR.K-S.4-GLE.1 Shapes can be described by characteristics and
position and created by composing and
decomposing
Communicate effective logical arguments using mathematical justification and proof.
Mathematical argumentation involves making and testing conjectures, drawing valid
conclusions, and justifying thinking.
This prepared graduate competency is addressed through all of the grade level expectations and is
part of the mathematical practices.
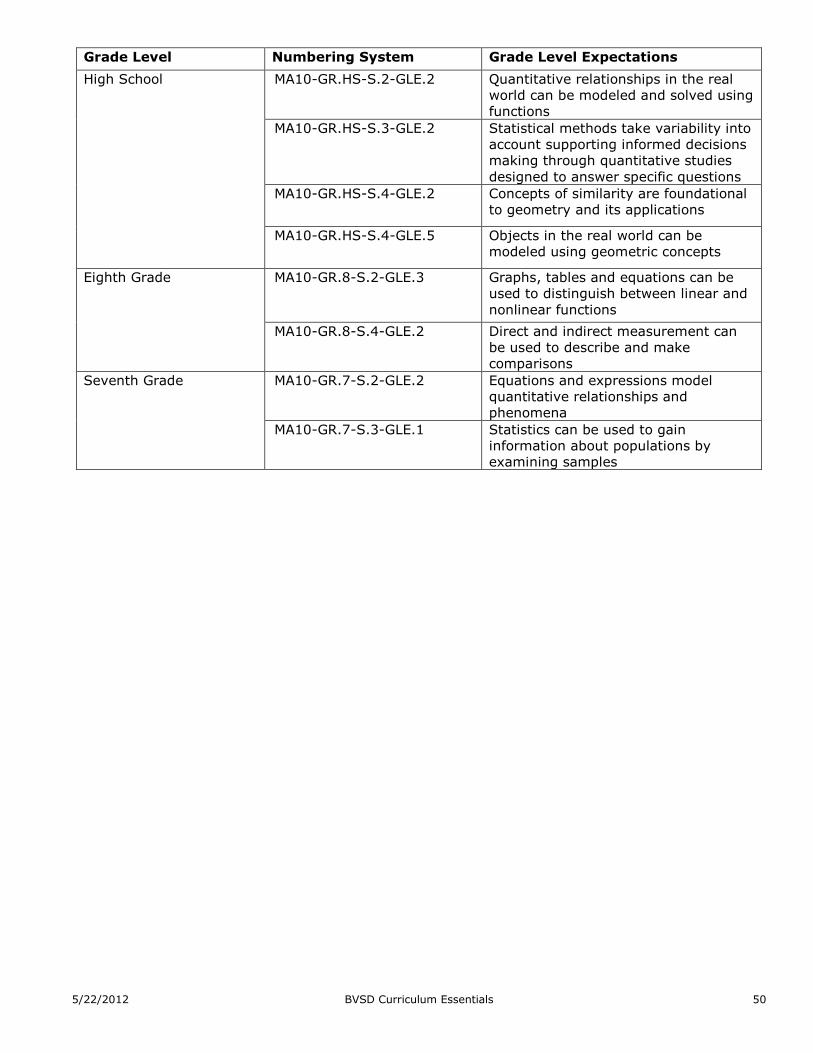
5/22/2012 BVSD Curriculum Essentials 50
Grade Level Numbering System Grade Level Expectations
High School MA10-GR.HS-S.2-GLE.2 Quantitative relationships in the real
world can be modeled and solved using
functions
MA10-GR.HS-S.3-GLE.2 Statistical methods take variability into
account supporting informed decisions
making through quantitative studies
designed to answer specific questions
MA10-GR.HS-S.4-GLE.2 Concepts of similarity are foundational
to geometry and its applications
MA10-GR.HS-S.4-GLE.5 Objects in the real world can be
modeled using geometric concepts
Eighth Grade MA10-GR.8-S.2-GLE.3 Graphs, tables and equations can be
used to distinguish between linear and
nonlinear functions
MA10-GR.8-S.4-GLE.2 Direct and indirect measurement can
be used to describe and make
comparisons
Seventh Grade MA10-GR.7-S.2-GLE.2 Equations and expressions model
quantitative relationships and
phenomena
MA10-GR.7-S.3-GLE.1 Statistics can be used to gain
information about populations by
examining samples

5/22/2012 BVSD Curriculum Essentials 51
Mathematics
Grade Level Expectations at a Glance
Standard Grade Level Expectation
High School
1. Number
Sense,
Properties,
and
Operations
3. The complex number system includes real numbers and imaginary
numbers
4. Quantitative reasoning is used to make sense of quantities and
their relationships in problem situations
2. Patterns,
Functions,
and Algebraic
Structures
2. Functions model situations where one quantity determines another
and can be represented algebraically, graphically, and using tables
2.Quantitative relationships in the real world can be modeled and
solved using functions
3.Expressions can be represented in multiple, equivalent forms
4.Solutions to equations, inequalities and systems of equations are
found using a variety of tools
3. Data
Analysis,
Statistics,
and
Probability
2. Visual displays and summary statistics condense the information in
data sets into usable knowledge
3. Statistical methods take variability into account supporting
informed decisions making through quantitative studies designed
to answer specific questions
4. Probability models outcomes for situations in which there is
inherent randomness
4. Shape,
Dimension,
and
Geometric
Relationships
3. Objects in the plane can be transformed, and those
transformations can be described and analyzed mathematically
4. Concepts of similarity are foundational to geometry and its
applications
5. Objects in the plane can be described and analyzed algebraically
6. Attributes of two- and three-dimensional objects are measurable
and can be quantified
7. Objects in the real world can be modeled using geometric concepts
From the Common State Standards for Mathematics, Pages 58, 62, 67, 72-74, and 79.
Mathematics | High School—Number and Quantity
Numbers and Number Systems. During the years from kindergarten to eighth grade, students must
repeatedly extend their conception of number. At first, ―number‖ means ―counting number‖: 1, 2, 3...
Soon after that, 0 is used to represent ―none‖ and the whole numbers are formed by the counting
numbers together with zero. The next extension is fractions. At first, fractions are barely numbers and
tied strongly to pictorial representations. Yet by the time students understand division of fractions,
they have a strong concept of fractions as numbers and have connected them, via their decimal
representations, with the base-ten system used to represent the whole numbers. During middle
school, fractions are augmented by negative fractions to form the rational numbers. In Grade 8,
students extend this system once more, augmenting the rational numbers with the irrational numbers
to form the real numbers. In high school, students will be exposed to yet another extension of
number, when the real numbers are augmented by the imaginary numbers to form the complex
numbers.
With each extension of number, the meanings of addition, subtraction, multiplication, and division are
extended. In each new number system—integers, rational numbers, real numbers, and complex
numbers—the four operations stay the same in two important ways: They have the commutative,
associative, and distributive properties and their new meanings are consistent with their previous
meanings.
Extending the properties of whole-number exponents leads to new and productive notation. For
example, properties of whole-number exponents suggest that (51/3)3 should be 5(1/3)3 = 51 = 5 and
that 51/3 should be the cube root of 5.

5/22/2012 BVSD Curriculum Essentials 52
Calculators, spreadsheets, and computer algebra systems can provide ways for students to become
better acquainted with these new number systems and their notation. They can be used to generate
data for numerical experiments, to help understand the workings of matrix, vector, and complex
number algebra, and to experiment with non-integer exponents.
Quantities. In real world problems, the answers are usually not numbers but quantities: numbers
with units, which involves measurement. In their work in measurement up through Grade 8, students
primarily measure commonly used attributes such as length, area, and volume. In high school,
students encounter a wider variety of units in modeling, e.g., acceleration, currency conversions,
derived quantities such as person-hours and heating degree days, social science rates such as per-
capita income, and rates in everyday life such as points scored per game or batting averages. They
also encounter novel situations in which they themselves must conceive the attributes of interest. For
example, to find a good measure of overall highway safety, they might propose measures such as
fatalities per year, fatalities per year per driver, or fatalities per vehicle-mile traveled. Such a
conceptual process is sometimes called quantification. Quantification is important for science, as when
surface area suddenly ―stands out‖ as an important variable in evaporation. Quantification is also
important for companies, which must conceptualize relevant attributes and create or choose suitable
measures for them.
Mathematics | High School—Algebra
Expressions. An expression is a record of a computation with numbers, symbols that represent
numbers, arithmetic operations, exponentiation, and, at more advanced levels, the operation of
evaluating a function. Conventions about the use of parentheses and the order of operations assure
that each expression is unambiguous. Creating an expression that describes a computation involving a
general quantity requires the ability to express the computation in general terms, abstracting from
specific instances.
Reading an expression with comprehension involves analysis of its underlying structure. This may
suggest a different but equivalent way of writing the expression that exhibits some different aspect of
its meaning. For example, p + 0.05p can be interpreted as the addition of a 5% tax to a price p.
Rewriting p + 0.05p as 1.05p shows that adding a tax is the same as multiplying the price by a
constant factor.
Algebraic manipulations are governed by the properties of operations and exponents, and the
conventions of algebraic notation. At times, an expression is the result of applying operations to
simpler expressions. For example, p + 0.05p is the sum of the simpler expressions p and 0.05p.
Viewing an expression as the result of operation on simpler expressions can sometimes clarify its
underlying structure.
A spreadsheet or a computer algebra system (CAS) can be used to experiment with algebraic
expressions, perform complicated algebraic manipulations, and understand how algebraic
manipulations behave.
Equations and inequalities. An equation is a statement of equality between two expressions, often
viewed as a question asking for which values of the variables the expressions on either side are in fact
equal. These values are the solutions to the equation. An identity, in contrast, is true for all values of
the variables; identities are often developed by rewriting an expression in an equivalent form.
The solutions of an equation in one variable form a set of numbers; the solutions of an equation in two
variables form a set of ordered pairs of numbers, which can be plotted in the coordinate plane. Two or
more equations and/or inequalities form a system. A solution for such a system must satisfy every
equation and inequality in the system.
An equation can often be solved by successively deducing from it one or more simpler equations. For
example, one can add the same constant to both sides without changing the solutions, but squaring
both sides might lead to extraneous solutions. Strategic competence in solving includes looking ahead
for productive manipulations and anticipating the nature and number of solutions.

5/22/2012 BVSD Curriculum Essentials 53
Some equations have no solutions in a given number system, but have a solution in a larger system.
For example, the solution of x + 1 = 0 is an integer, not a whole number; the solution of 2x + 1 = 0 is
a rational number, not an integer; the solutions of x2 – 2 = 0 are real numbers, not rational numbers;
and the solutions of x2 + 2 = 0 are complex numbers, not real numbers.
The same solution techniques used to solve equations can be used to rearrange formulas. For
example, the formula for the area of a trapezoid, A = ((b1+b2)/2)h, can be solved for h using the same
deductive process.
Inequalities can be solved by reasoning about the properties of inequality. Many, but not all, of the
properties of equality continue to hold for inequalities and can be
useful in solving them.
Connections to Functions and Modeling. Expressions can define functions, and equivalent
expressions define the same function. Asking when two functions have the same value for the same
input leads to an equation; graphing the two functions allows for finding approximate solutions of the
equation. Converting a verbal description to an equation, inequality, or system of these is an essential
skill in modeling.
Mathematics | High School—Functions
Functions describe situations where one quantity determines another. For example, the return on
$10,000 invested at an annualized percentage rate of 4.25% is a function of the length of time the
money is invested. Because we continually make theories about dependencies between quantities in
nature and society, functions are important tools in the construction of mathematical models.
In school mathematics, functions usually have numerical inputs and outputs and are often defined by
an algebraic expression. For example, the time in hours it takes for a car to drive 100 miles is a
function of the car’s speed in miles per hour, v; the rule T(v) = 100/v expresses this relationship
algebraically and defines a function whose name is T.
The set of inputs to a function is called its domain. We often infer the domain to be all inputs for which
the expression defining a function has a value, or for which the function makes sense in a given
context.
A function can be described in various ways, such as by a graph (e.g., the trace of a seismograph); by
a verbal rule, as in, ―I’ll give you a state, you give me the capital city;‖ by an algebraic expression like
f(x) = a + bx; or by a recursive rule. The graph of a function is often a useful way of visualizing the
relationship of the function models, and manipulating a mathematical expression for a function can
throw light on the function’s properties.
Functions presented as expressions can model many important phenomena. Two important families of
functions characterized by laws of growth are linear functions, which grow at a constant rate, and
exponential functions, which grow at a constant percent rate. Linear functions with a constant term of
zero describe proportional relationships.
A graphing utility or a computer algebra system can be used to experiment with properties of these
functions and their graphs and to build computational models of functions, including recursively
defined functions.
Connections to Expressions, Equations, Modeling, and Coordinates.
Determining an output value for a particular input involves evaluating an expression; finding inputs
that yield a given output involves solving an equation. Questions about when two functions have the
same value for the same input lead to equations, whose solutions can be visualized from the
intersection of their graphs. Because functions describe relationships between quantities, they are
frequently used in modeling. Sometimes functions are defined by a recursive process, which can be
displayed effectively using a spreadsheet or other technology.
Mathematics | High School—Modeling

5/22/2012 BVSD Curriculum Essentials 54
Modeling links classroom mathematics and statistics to everyday life, work, and decision-making.
Modeling is the process of choosing and using appropriate mathematics and statistics to analyze
empirical situations, to understand them better, and to improve decisions. Quantities and their
relationships in physical, economic, public policy, social, and everyday situations can be modeled using
mathematical and statistical methods. When making mathematical models, technology is valuable for
varying assumptions, exploring consequences, and comparing predictions with data.
A model can be very simple, such as writing total cost as a product of unit price and number bought,
or using a geometric shape to describe a physical object like a coin. Even such simple models involve
making choices. It is up to us whether to model a coin as a three-dimensional cylinder, or whether a
two-dimensional disk works well enough for our purposes. Other situations—modeling a delivery route,
a production schedule, or a comparison of loan amortizations—need more elaborate models that use
other tools from the mathematical sciences. Real-world situations are not organized and labeled for
analysis; formulating tractable models, representing such models, and analyzing them is appropriately
a creative process. Like every such process, this depends on acquired expertise as well as creativity.
Some examples of such situations might include:
• Estimating how much water and food is needed for emergency relief in a devastated city of 3
million people, and how it might be distributed.
• Planning a table tennis tournament for 7 players at a club with 4 tables, where each player
plays against each other player.
• Designing the layout of the stalls in a school fair so as to raise as much money as possible.
• Analyzing stopping distance for a car.
• Modeling savings account balance, bacterial colony growth, or investment growth.
• Engaging in critical path analysis, e.g., applied to turnaround of an aircraft at an airport.
• Analyzing risk in situations such as extreme sports, pandemics, and terrorism.
• Relating population statistics to individual predictions.
In situations like these, the models devised depend on a number of factors: How precise an answer do
we want or need? What aspects of the situation do we most need to understand, control, or optimize?
What resources of time and tools do we have? The range of models that we can create and analyze is
also constrained by the limitations of our mathematical, statistical, and technical skills, and our ability
to recognize significant variables and relationships among them. Diagrams of various kinds,
spreadsheets and other technology, and algebra are powerful tools for understanding and solving
problems drawn from different types of real-world situations.
One of the insights provided by mathematical modeling is that essentially the same mathematical or
statistical structure can sometimes model seemingly different situations. Models can also shed light on
the mathematical structures themselves, for example, as when a model of bacterial growth makes
more vivid the explosive growth of the exponential function.
The basic modeling cycle is summarized in the diagram (below). It involves (1) identifying variables in
the situation and selecting those that represent essential features, (2) formulating a model by creating
and selecting geometric, graphical, tabular, algebraic, or statistical representations that describe
relationships between the variables, (3) analyzing and performing operations on these relationships to
draw conclusions, (4) interpreting the results of the mathematics in terms of the original situation, (5)
validating the conclusions by comparing them with the situation, and then either improving the model
or, if it is acceptable, (6) reporting on the conclusions and the reasoning behind them. Choices,
assumptions, and approximations are present throughout this cycle.
In descriptive modeling, a model simply describes the phenomena or summarizes them in a compact
form. Graphs of observations are a familiar descriptive model— for example, graphs of global
temperature and atmospheric CO2 over time.
Analytic modeling seeks to explain data on the basis of deeper theoretical ideas, albeit with
parameters that are empirically based; for example, exponential growth of bacterial colonies (until cut-
off mechanisms such as pollution or starvation intervene) follows from a constant reproduction rate.
Functions are an important tool for analyzing such problems.

5/22/2012 BVSD Curriculum Essentials 55
Graphing utilities, spreadsheets, computer algebra systems, and dynamic geometry software are
powerful tools that can be used to model purely mathematical phenomena (e.g., the behavior of
polynomials) as well as physical phenomena.
Modeling Standards. Modeling is best interpreted not as a collection of isolated topics but rather in
relation to other standards. Making mathematical models is a Standard for Mathematical Practice, and
specific modeling standards appear throughout the high school standards indicated by a star symbol
(*).
Mathematics | High School—Geometry
An understanding of the attributes and relationships of geometric objects can be applied in diverse
contexts—interpreting a schematic drawing, estimating the amount of wood needed to frame a sloping
roof, rendering computer graphics, or designing a sewing pattern for the most efficient use of material.
Although there are many types of geometry, school mathematics is devoted primarily to plane
Euclidean geometry, studied both synthetically (without coordinates) and analytically (with
coordinates). Euclidean geometry is characterized most importantly by the Parallel Postulate, that
through a point not on a given line there is exactly one parallel line. (Spherical geometry, in contrast,
has no parallel lines.)
During high school, students begin to formalize their geometry experiences from elementary and
middle school, using more precise definitions and developing careful proofs. Later in college some
students develop Euclidean and other geometries carefully from a small set of axioms.
The concepts of congruence, similarity, and symmetry can be understood from the perspective of
geometric transformation. Fundamental are the rigid motions: translations, rotations, reflections, and
combinations of these, all of which are here assumed to preserve distance and angles (and therefore
shapes generally). Reflections and rotations each explain a particular type of symmetry, and the
symmetries of an object offer insight into its attributes—as when the reflective symmetry of an
isosceles triangle assures that its base angles are congruent.
In the approach taken here, two geometric figures are defined to be congruent if there is a sequence
of rigid motions that carries one onto the other. This is the principle of superposition. For triangles,
congruence means the equality of all corresponding pairs of sides and all corresponding pairs of
angles. During the middle grades, through experiences drawing triangles from given conditions,
students notice ways to specify enough measures in a triangle to ensure that all triangles drawn with
those measures are congruent. Once these triangle congruence criteria (ASA, SAS, and SSS) are
established using rigid motions, they can be used to prove theorems about triangles, quadrilaterals,
and other geometric figures.
Similarity transformations (rigid motions followed by dilations) define similarity in the same way that
rigid motions define congruence, thereby formalizing the similarity ideas of "same shape" and "scale
factor" developed in the middle grades. These transformations lead to the criterion for triangle
similarity that two pairs of corresponding angles are congruent.
The definitions of sine, cosine, and tangent for acute angles are founded on right triangles and
similarity, and, with the Pythagorean Theorem, are fundamental in many real-world and theoretical
situations. The Pythagorean Theorem is generalized to nonright triangles by the Law of Cosines.
Together, the Laws of Sines and Cosines embody the triangle congruence criteria for the cases where

5/22/2012 BVSD Curriculum Essentials 56
three pieces of information suffice to completely solve a triangle. Furthermore, these laws yield two
possible solutions in the ambiguous case, illustrating that Side-Side-Angle is not a congruence
criterion.
Analytic geometry connects algebra and geometry, resulting in powerful methods of analysis and
problem solving. Just as the number line associates numbers with locations in one dimension, a pair of
perpendicular axes associates pairs of numbers with locations in two dimensions. This correspondence
between numerical coordinates and geometric points allows methods from algebra to be applied to
geometry and vice versa. The solution set of an equation becomes a geometric curve, making
visualization a tool for doing and understanding algebra. Geometric shapes can be described by
equations, making algebraic manipulation into a tool for geometric understanding, modeling, and
proof. Geometric transformations of the graphs of equations correspond to algebraic changes in their
equations.
Dynamic geometry environments provide students with experimental and modeling tools that allow
them to investigate geometric phenomena in much the same way as computer algebra systems allow
them to experiment with algebraic phenomena.
Connections to Equations. The correspondence between numerical coordinates and geometric points
allows methods from algebra to be applied to geometry and vice versa. The solution set of an equation
becomes a geometric curve, making visualization a tool for doing and understanding algebra.
Geometric shapes can be described by equations, making algebraic manipulation into a tool for
geometric understanding, modeling, and proof.
Mathematics | High School—Statistics and Probability*
Decisions or predictions are often based on data—numbers in context. These decisions or predictions
would be easy if the data always sent a clear message, but the message is often obscured by
variability. Statistics provides tools for describing variability in data and for making informed decisions
that take it into account.
Data are gathered, displayed, summarized, examined, and interpreted to discover patterns and
deviations from patterns. Quantitative data can be described in terms of key characteristics: measures
of shape, center, and spread. The shape of a data distribution might be described as symmetric,
skewed, flat, or bell shaped, and it might be summarized by a statistic measuring center (such as
mean or median) and a statistic measuring spread (such as standard deviation or interquartile range).
Different distributions can be compared numerically using these statistics or compared visually using
plots. Knowledge of center and spread are not enough to describe a distribution. Which statistics to
compare, which plots to use, and what the results of a comparison might mean, depend on the
question to be investigated and the real-life actions to be taken.
Randomization has two important uses in drawing statistical conclusions. First, collecting data from a
random sample of a population makes it possible to draw valid conclusions about the whole population,
taking variability into account. Second, randomly assigning individuals to different treatments allows a
fair comparison of the effectiveness of those treatments. A statistically significant outcome is one that
is unlikely to be due to chance alone, and this can be evaluated only under the condition of
randomness. The conditions under which data are collected are important in drawing conclusions from
the data; in critically reviewing uses of statistics in public media and other reports, it is important to
consider the study design, how the data were gathered, and the analyses employed as well as the data
summaries and the conclusions drawn.
Random processes can be described mathematically by using a probability model: a list or description
of the possible outcomes (the sample space), each of which is assigned a probability. In situations
such as flipping a coin, rolling a number cube, or drawing a card, it might be reasonable to assume
various outcomes are equally likely. In a probability model, sample points represent outcomes and
combine to make up events; probabilities of events can be computed by applying the Addition and
Multiplication Rules. Interpreting these probabilities relies on an understanding of independence and
conditional probability, which can be approached through the analysis of two-way tables.

5/22/2012 BVSD Curriculum Essentials 57
Technology plays an important role in statistics and probability by making it possible to generate plots,
regression functions, and correlation coefficients, and to simulate many possible outcomes in a short
amount of time.
Connections to Functions and Modeling. Functions may be used to describe data; if the data
suggest a linear relationship, the relationship can be modeled with a regression line, and its strength
and direction can be expressed through a correlation coefficient.
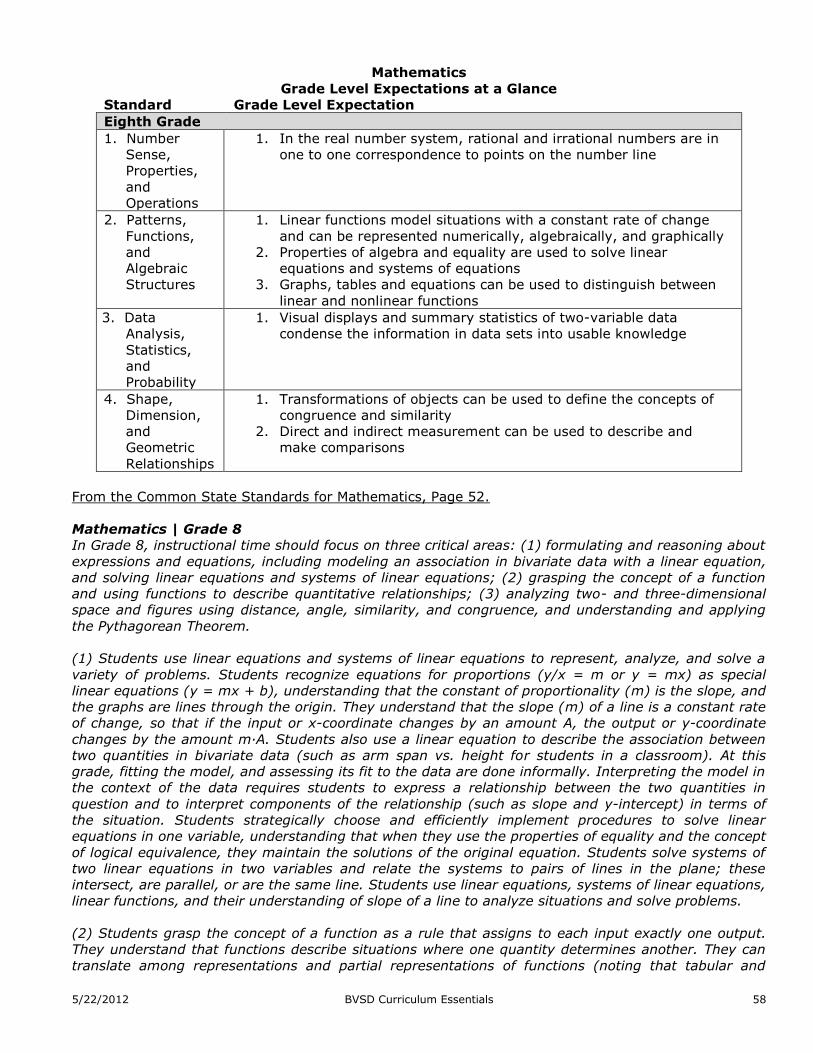
5/22/2012 BVSD Curriculum Essentials 58
Mathematics
Grade Level Expectations at a Glance
Standard Grade Level Expectation
Eighth Grade
1. Number
Sense,
Properties,
and
Operations
1. In the real number system, rational and irrational numbers are in
one to one correspondence to points on the number line
2. Patterns,
Functions,
and
Algebraic
Structures
1. Linear functions model situations with a constant rate of change
and can be represented numerically, algebraically, and graphically
2. Properties of algebra and equality are used to solve linear
equations and systems of equations
3. Graphs, tables and equations can be used to distinguish between
linear and nonlinear functions
3. Data
Analysis,
Statistics,
and
Probability
1. Visual displays and summary statistics of two-variable data
condense the information in data sets into usable knowledge
4. Shape,
Dimension,
and
Geometric
Relationships
1. Transformations of objects can be used to define the concepts of
congruence and similarity
2. Direct and indirect measurement can be used to describe and
make comparisons
From the Common State Standards for Mathematics, Page 52.
Mathematics | Grade 8
In Grade 8, instructional time should focus on three critical areas: (1) formulating and reasoning about
expressions and equations, including modeling an association in bivariate data with a linear equation,
and solving linear equations and systems of linear equations; (2) grasping the concept of a function
and using functions to describe quantitative relationships; (3) analyzing two- and three-dimensional
space and figures using distance, angle, similarity, and congruence, and understanding and applying
the Pythagorean Theorem.
(1) Students use linear equations and systems of linear equations to represent, analyze, and solve a
variety of problems. Students recognize equations for proportions (y/x = m or y = mx) as special
linear equations (y = mx + b), understanding that the constant of proportionality (m) is the slope, and
the graphs are lines through the origin. They understand that the slope (m) of a line is a constant rate
of change, so that if the input or x-coordinate changes by an amount A, the output or y-coordinate
changes by the amount m·A. Students also use a linear equation to describe the association between
two quantities in bivariate data (such as arm span vs. height for students in a classroom). At this
grade, fitting the model, and assessing its fit to the data are done informally. Interpreting the model in
the context of the data requires students to express a relationship between the two quantities in
question and to interpret components of the relationship (such as slope and y-intercept) in terms of
the situation. Students strategically choose and efficiently implement procedures to solve linear
equations in one variable, understanding that when they use the properties of equality and the concept
of logical equivalence, they maintain the solutions of the original equation. Students solve systems of
two linear equations in two variables and relate the systems to pairs of lines in the plane; these
intersect, are parallel, or are the same line. Students use linear equations, systems of linear equations,
linear functions, and their understanding of slope of a line to analyze situations and solve problems.
(2) Students grasp the concept of a function as a rule that assigns to each input exactly one output.
They understand that functions describe situations where one quantity determines another. They can
translate among representations and partial representations of functions (noting that tabular and
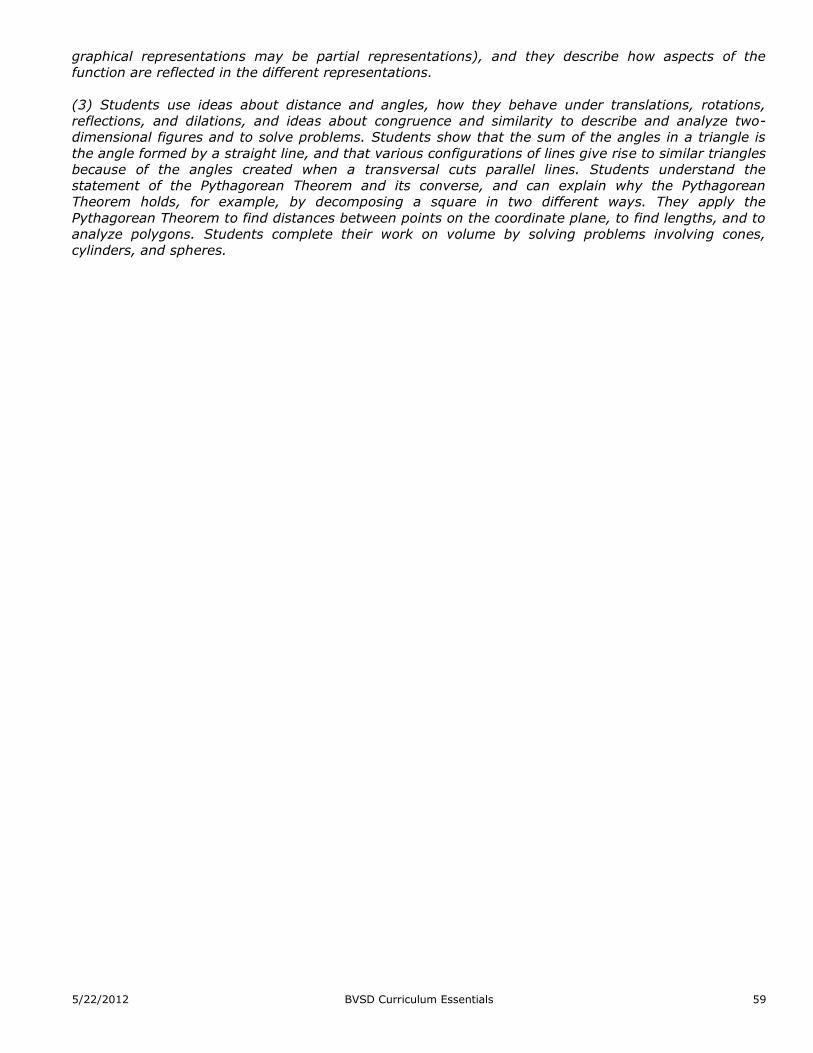
5/22/2012 BVSD Curriculum Essentials 59
graphical representations may be partial representations), and they describe how aspects of the
function are reflected in the different representations.
(3) Students use ideas about distance and angles, how they behave under translations, rotations,
reflections, and dilations, and ideas about congruence and similarity to describe and analyze two-
dimensional figures and to solve problems. Students show that the sum of the angles in a triangle is
the angle formed by a straight line, and that various configurations of lines give rise to similar triangles
because of the angles created when a transversal cuts parallel lines. Students understand the
statement of the Pythagorean Theorem and its converse, and can explain why the Pythagorean
Theorem holds, for example, by decomposing a square in two different ways. They apply the
Pythagorean Theorem to find distances between points on the coordinate plane, to find lengths, and to
analyze polygons. Students complete their work on volume by solving problems involving cones,
cylinders, and spheres.

5/22/2012 BVSD Curriculum Essentials 60
Mathematics
Grade Level Expectations at a Glance
Standard Grade Level Expectation
Seventh Grade
1. Number
Sense,
Properties,
and
Operations
1. Proportional reasoning involves comparisons and multiplicative
relationships among ratios
2. Formulate, represent, and use algorithms with rational numbers
flexibly, accurately, and efficiently
2. Patterns,
Functions,
and
Algebraic
Structures
1. Properties of arithmetic can be used to generate equivalent
expressions
2. Equations and expressions model quantitative relationships and
phenomena
3. Data
Analysis,
Statistics,
and
Probability
1. Statistics can be used to gain information about populations by
examining samples
2. Mathematical models are used to determine probability
4. Shape,
Dimension,
and
Geometric
Relationships
1. Modeling geometric figures and relationships leads to informal
spatial reasoning and proof
2. Linear measure, angle measure, area, and volume are
fundamentally different and require different units of measure
From the Common State Standards for Mathematics, Page 46.
Mathematics | Grade 7
In Grade 7, instructional time should focus on four critical areas: (1) developing understanding of and
applying proportional relationships; (2) developing understanding of operations with rational numbers
and working with expressions and linear equations; (3) solving problems involving scale drawings and
informal geometric constructions, and working with two- and three-dimensional shapes to solve
problems involving area, surface area, and volume; and (4) drawing inferences about populations
based on samples.
(1) Students extend their understanding of ratios and develop understanding of proportionality to
solve single- and multi-step problems. Students use their understanding of ratios and proportionality
to solve
a wide variety of percent problems, including those involving discounts, interest, taxes, tips, and
percent increase or decrease. Students solve problems about scale drawings by relating corresponding
lengths between the objects or by using the fact that relationships of lengths within an object are
preserved in similar objects. Students graph proportional relationships and understand the unit rate
informally as a measure of the steepness of the related line, called the slope. They distinguish
proportional relationships from other relationships.
(2) Students develop a unified understanding of number, recognizing fractions, decimals (that have a
finite or a repeating decimal representation), and percents as different representations of rational
numbers. Students extend addition, subtraction, multiplication, and division to all rational numbers,
maintaining the properties of operations and the relationships between addition and subtraction, and
multiplication and division. By applying these properties, and by viewing negative numbers in terms of
everyday contexts (e.g., amounts owed or temperatures below zero), students explain and interpret
the rules for adding, subtracting, multiplying, and dividing with negative numbers. They use the
arithmetic of rational numbers as they formulate expressions and equations in one variable and use
these equations to solve problems.
(3) Students continue their work with area from Grade 6, solving problems involving the area and
circumference of a circle and surface area of three-dimensional objects. In preparation for work on
congruence and similarity in Grade 8 they reason about relationships among two-dimensional figures

5/22/2012 BVSD Curriculum Essentials 61
using scale drawings and informal geometric constructions, and they gain familiarity with the
relationships between angles formed by intersecting lines. Students work with three-dimensional
figures, relating them to two-dimensional figures by examining cross-sections. They solve real-world
and mathematical problems involving area, surface area, and volume of two- and three-dimensional
objects composed of triangles, quadrilaterals, polygons, cubes and right prisms.
(4) Students build on their previous work with single data distributions to compare two data
distributions and address questions about differences between populations. They begin informal work
with random sampling to generate data sets and learn about the importance of representative samples
for drawing inferences.
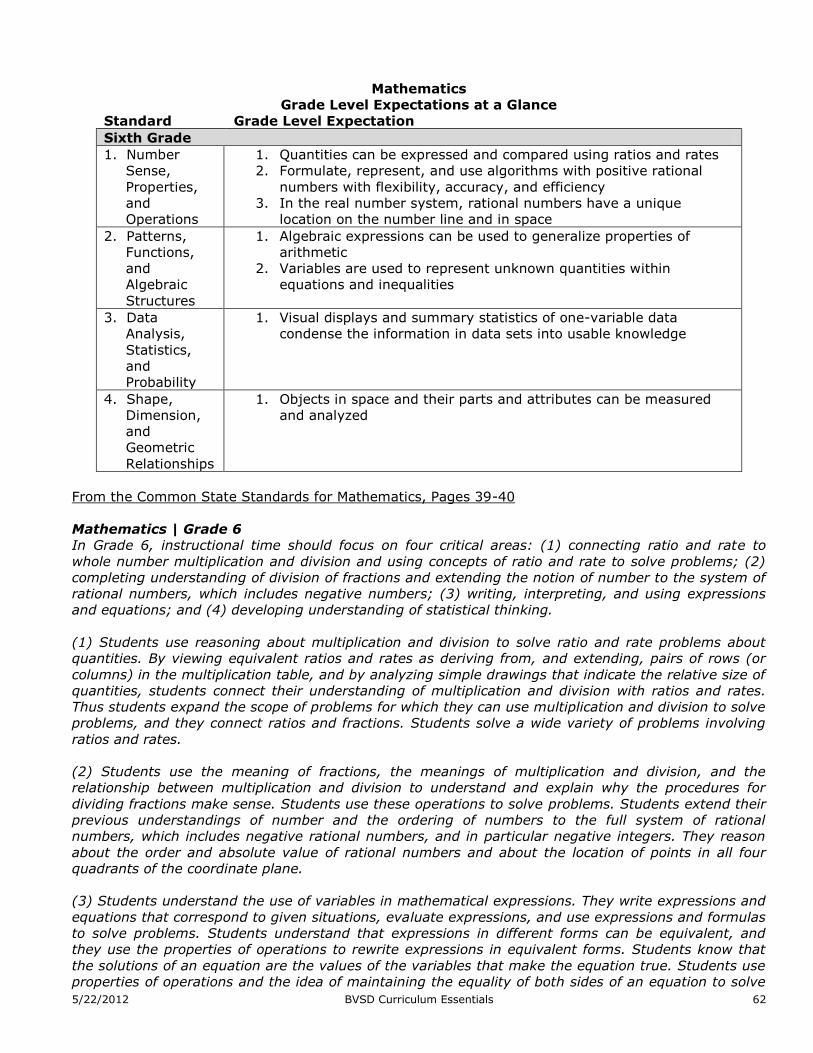
5/22/2012 BVSD Curriculum Essentials 62
Mathematics
Grade Level Expectations at a Glance
Standard Grade Level Expectation
Sixth Grade
1. Number
Sense,
Properties,
and
Operations
1. Quantities can be expressed and compared using ratios and rates
2. Formulate, represent, and use algorithms with positive rational
numbers with flexibility, accuracy, and efficiency
3. In the real number system, rational numbers have a unique
location on the number line and in space
2. Patterns,
Functions,
and
Algebraic
Structures
1. Algebraic expressions can be used to generalize properties of
arithmetic
2. Variables are used to represent unknown quantities within
equations and inequalities
3. Data
Analysis,
Statistics,
and
Probability
1. Visual displays and summary statistics of one-variable data
condense the information in data sets into usable knowledge
4. Shape,
Dimension,
and
Geometric
Relationships
1. Objects in space and their parts and attributes can be measured
and analyzed
From the Common State Standards for Mathematics, Pages 39-40
Mathematics | Grade 6
In Grade 6, instructional time should focus on four critical areas: (1) connecting ratio and rate to
whole number multiplication and division and using concepts of ratio and rate to solve problems; (2)
completing understanding of division of fractions and extending the notion of number to the system of
rational numbers, which includes negative numbers; (3) writing, interpreting, and using expressions
and equations; and (4) developing understanding of statistical thinking.
(1) Students use reasoning about multiplication and division to solve ratio and rate problems about
quantities. By viewing equivalent ratios and rates as deriving from, and extending, pairs of rows (or
columns) in the multiplication table, and by analyzing simple drawings that indicate the relative size of
quantities, students connect their understanding of multiplication and division with ratios and rates.
Thus students expand the scope of problems for which they can use multiplication and division to solve
problems, and they connect ratios and fractions. Students solve a wide variety of problems involving
ratios and rates.
(2) Students use the meaning of fractions, the meanings of multiplication and division, and the
relationship between multiplication and division to understand and explain why the procedures for
dividing fractions make sense. Students use these operations to solve problems. Students extend their
previous understandings of number and the ordering of numbers to the full system of rational
numbers, which includes negative rational numbers, and in particular negative integers. They reason
about the order and absolute value of rational numbers and about the location of points in all four
quadrants of the coordinate plane.
(3) Students understand the use of variables in mathematical expressions. They write expressions and
equations that correspond to given situations, evaluate expressions, and use expressions and formulas
to solve problems. Students understand that expressions in different forms can be equivalent, and
they use the properties of operations to rewrite expressions in equivalent forms. Students know that
the solutions of an equation are the values of the variables that make the equation true. Students use
properties of operations and the idea of maintaining the equality of both sides of an equation to solve
5/22/2012 BVSD Curriculum Essentials 63
simple one-step equations. Students construct and analyze tables, such as tables of quantities that are
in equivalent ratios,
and they use equations (such as 3x = y) to describe relationships between quantities.
(4) Building on and reinforcing their understanding of number, students begin to develop their ability
to think statistically. Students recognize that a data distribution may not have a definite center and
that different ways to measure center yield different values. The median measures center in the sense
that it is roughly the middle value. The mean measures center in the sense that it is the value that
each data point would take on if the total of the data values were redistributed equally, and also in the
sense that it is a balance point. Students recognize that a measure of variability (interquartile range or
mean absolute deviation) can also be useful for summarizing data because two very different sets of
data can have the same mean and median yet be distinguished by their variability. Students learn to
describe and summarize numerical data sets, identifying clusters, peaks, gaps, and symmetry,
considering the context in which the data were collected. Students in Grade 6 also build on their work
with area in elementary school by reasoning about relationships among shapes to determine area,
surface area, and volume. They find areas of right triangles, other triangles, and special quadrilaterals
by decomposing these shapes, rearranging or removing pieces, and relating the shapes to rectangles.
Using these methods, students discuss, develop, and justify formulas for areas of triangles and
parallelograms. Students find areas of polygons and surface areas of prisms and pyramids by
decomposing them into pieces whose area they can determine. They reason about right rectangular
prisms with fractional side lengths to extend formulas for the volume of a right rectangular prism to
fractional side lengths. They prepare for work on scale drawings and constructions in Grade 7 by
drawing polygons in the coordinate plane.

5/22/2012 BVSD Curriculum Essentials 64
Mathematics
Grade Level Expectations at a Glance
Standard Grade Level Expectation
Fifth Grade
1. Number
Sense,
Properties,
and
Operations
1. The decimal number system describes place value patterns and
relationships that are repeated in large and small numbers and
forms the foundation for efficient algorithms
2. Formulate, represent, and use algorithms with multi-digit whole
numbers and decimals with flexibility, accuracy, and efficiency
3. Formulate, represent, and use algorithms to add and subtract
fractions with flexibility, accuracy, and efficiency
4. The concepts of multiplication and division can be applied to
multiply and divide fractions
2. Patterns,
Functions,
and
Algebraic
Structures
1. Number patterns are based on operations and relationships
3. Data
Analysis,
Statistics,
and
Probability
1. Visual displays are used to interpret data
4. Shape,
Dimension,
and
Geometric
Relationships
1. Properties of multiplication and addition provide the foundation for
volume an attribute of solids
2. Geometric figures can be described by their attributes and specific
locations in the plane
From the Common State Standards for Mathematics, Page 33.
Mathematics | Grade 5
In Grade 5, instructional time should focus on three critical areas: (1) developing fluency with addition
and subtraction of fractions, and developing understanding of the multiplication of fractions and of
division of fractions in limited cases (unit fractions divided by whole numbers and whole numbers
divided by unit fractions); (2) extending division to 2-digit divisors, integrating decimal fractions into
the place value system and developing understanding of operations with decimals to hundredths, and
developing fluency with whole number and decimal operations; and (3) developing understanding of
volume.
(1) Students apply their understanding of fractions and fraction models to represent the addition and
subtraction of fractions with unlike denominators as equivalent calculations with like denominators.
They develop fluency in calculating sums and differences of fractions, and make reasonable estimates
of them. Students also use the meaning of fractions, of multiplication and division, and the relationship
between multiplication and division to understand and explain why the procedures for multiplying and
dividing fractions make sense. (Note: this is limited to the case of dividing unit fractions by whole
numbers and whole numbers by unit fractions.)
(2) Students develop understanding of why division procedures work based on the meaning of base-
ten numerals and properties of operations. They finalize fluency with multi-digit addition, subtraction,
multiplication, and division. They apply their understandings of models for decimals, decimal notation,
and properties of operations to add and subtract decimals to hundredths. They develop fluency in
these computations, and make reasonable estimates of their results. Students use the relationship
between decimals and fractions, as well as the relationship between finite decimals and whole numbers
(i.e., a finite decimal multiplied by an appropriate power of 10 is a whole number), to understand and
explain why the procedures for multiplying and dividing finite decimals make sense. They compute
products and quotients of decimals to hundredths efficiently and accurately.
5/22/2012 BVSD Curriculum Essentials 65
(3) Students recognize volume as an attribute of three-dimensional space. They understand that
volume can be measured by finding the total number of same-size units of volume required to fill the
space without gaps or overlaps. They understand that a 1-unit by 1-unit by 1-unit cube is the standard
unit for measuring volume. They select appropriate units, strategies, and tools for solving problems
that involve estimating and measuring volume. They decompose three-dimensional shapes and find
volumes of right rectangular prisms by viewing them as decomposed into layers of arrays of cubes.
They measure necessary attributes of shapes in order to determine volumes to solve real world and
mathematical problems.

5/22/2012 BVSD Curriculum Essentials 66
Mathematics
Grade Level Expectations at a Glance
Standard Grade Level Expectation
Fourth Grade
1. Number
Sense,
Properties,
and
Operations
1. The decimal number system to the hundredths place describes
place value patterns and relationships that are repeated in large
and small numbers and forms the foundation for efficient
algorithms
2. Different models and representations can be used to compare
fractional parts
3. Formulate, represent, and use algorithms to compute with
flexibility, accuracy, and efficiency
2. Patterns,
Functions,
and
Algebraic
Structures
1. Number patterns and relationships can be represented by symbols
3. Data
Analysis,
Statistics,
and
Probability
1. Visual displays are used to represent data
4. Shape,
Dimension,
and
Geometric
Relationships
1. Appropriate measurement tools, units, and systems are used to
measure different attributes of objects and time
2. Geometric figures in the plane and in space are described and
analyzed by their attributes
From the Common State Standards for Mathematics, Page 27.
Mathematics | Grade 4
fluency with multi-digit multiplication, and developing understanding of dividing to find quotients In
Grade 4, instructional time should focus on three critical areas: (1) developing understanding and
involving multi-digit dividends; (2) developing an understanding of fraction equivalence, addition and
subtraction of fractions with like denominators, and multiplication of fractions by whole numbers; (3)
understanding that geometric figures can be analyzed and classified based on their properties, such as
having parallel sides, perpendicular sides, particular angle measures, and symmetry.
(1) Students generalize their understanding of place value to 1,000,000, understanding the relative
sizes of numbers in each place. They apply their understanding of models for multiplication (equal-
sized groups, arrays, area models), place value, and properties of operations, in particular the
distributive property, as they develop, discuss, and use efficient, accurate, and generalizable methods
to compute products of multi-digit whole numbers. Depending on the numbers and the context, they
select and accurately apply appropriate methods to estimate or mentally calculate products. They
develop fluency with efficient procedures for multiplying whole numbers; understand and explain why
the procedures work based on place value and properties of operations; and use them to solve
problems. Students apply their understanding of models for division, place value, properties of
operations, and the relationship of division to multiplication as they develop, discuss, and use efficient,
accurate, and generalizable procedures to find quotients involving multi-digit dividends. They select
and accurately apply appropriate methods to estimate and mentally calculate quotients, and interpret
remainders based upon the context.
(2) Students develop understanding of fraction equivalence and operations with fractions. They
recognize that two different fractions can be equal (e.g., 15/9 = 5/3), and they develop methods for
generating and recognizing equivalent fractions. Students extend previous understandings about how
fractions are built from unit fractions, composing fractions from unit fractions, decomposing fractions
into unit fractions, and using the meaning of fractions and the meaning of multiplication to multiply a
fraction by a whole number.

5/22/2012 BVSD Curriculum Essentials 67
(3) Students describe, analyze, compare, and classify two-dimensional shapes. Through building,
drawing, and analyzing two-dimensional shapes, students deepen their understanding of properties of
two-dimensional objects and the use of them to solve problems involving symmetry.

5/22/2012 BVSD Curriculum Essentials 68
Mathematics
Grade Level Expectations at a Glance
Standard Grade Level Expectation
Third Grade
1. Number
Sense,
Properties,
and
Operations
1. The whole number system describes place value relationships and
forms the foundation for efficient algorithms
2. Parts of a whole can be modeled and represented in different ways
3. Multiplication and division are inverse operations and can be
modeled in a variety of ways
2. Patterns,
Functions,
and
Algebraic
Structures
1. Expectations for this standard are integrated into the other
standards at this grade level.
3. Data
Analysis,
Statistics,
and
Probability
1. Visual displays are used to describe data
4. Shape,
Dimension,
and
Geometric
Relationships
1. Geometric figures are described by their attributes
2. Linear and area measurement are fundamentally different and
require different units of measure
3. Time and attributes of objects can be measured with appropriate
tools
From the Common State Standards for Mathematics, Page 21.
Mathematics | Grade 3
In Grade 3, instructional time should focus on four critical areas: (1) developing understanding of
multiplication and division and strategies for multiplication and division within 100; (2) developing
understanding of fractions, especially unit fractions (fractions with numerator 1); (3) developing
understanding of the structure of rectangular arrays and of area; and (4) describing and analyzing
two-dimensional shapes.
(1) Students develop an understanding of the meanings of multiplication and division of whole
numbers through activities and problems involving equal-sized groups, arrays, and area models;
multiplication is finding an unknown product, and division is finding an unknown factor in these
situations. For equal-sized group situations, division can require finding the unknown number of
groups or the unknown group size. Students use properties of operations to calculate products of
whole numbers, using increasingly sophisticated strategies based on these properties to solve
multiplication and division problems involving single-digit factors. By comparing a variety of solution
strategies, students learn the relationship between multiplication and division.
(2) Students develop an understanding of fractions, beginning with unit fractions. Students view
fractions in general as being built out of unit fractions, and they use fractions along with visual fraction
models to represent parts of a whole. Students understand that the size of a fractional part is relative
to the size of the whole. For example, 1/2 of the paint in a small bucket could be less paint than 1/3 of
the paint in a larger bucket, but 1/3 of a ribbon is longer than 1/5 of the same ribbon because when
the ribbon is divided into 3 equal parts, the parts are longer than when the ribbon is divided into 5
equal parts. Students are able to use fractions to represent numbers equal to, less than, and greater
than one. They solve problems that involve comparing fractions by using visual fraction models and
strategies based on noticing equal numerators or denominators.
(3) Students recognize area as an attribute of two-dimensional regions. They measure the area of a
shape by finding the total number of same-size units of area required to cover the shape without gaps
or overlaps, a square with sides of unit length being the standard unit for measuring area. Students
understand that rectangular arrays can be decomposed into identical rows or into identical columns. By
5/22/2012 BVSD Curriculum Essentials 69
decomposing rectangles into rectangular arrays of squares, students connect area to multiplication,
and justify using multiplication to determine the area of a rectangle.
(4) Students describe, analyze, and compare properties of two-dimensional shapes. They compare and
classify shapes by their sides and angles, and connect these with definitions of shapes. Students also
relate their fraction work to geometry by expressing the area of part of a shape as a unit fraction of
the whole.

5/22/2012 BVSD Curriculum Essentials 70
Mathematics
Grade Level Expectations at a Glance
Standard Grade Level Expectation
Second Grade
1. Number
Sense,
Properties,
and
Operations
1. The whole number system describes place value relationships
through 1,000 and forms the foundation for efficient algorithms
2. Formulate, represent, and use strategies to add and subtract
within 100 with flexibility, accuracy, and efficiency
2. Patterns,
Functions,
and
Algebraic
Structures
1. Expectations for this standard are integrated into the other
standards at this grade level.
3. Data
Analysis,
Statistics,
and
Probability
1. Visual displays of data can be constructed in a variety of formats to
solve problems
4. Shape,
Dimension,
and
Geometric
Relationships
1. Shapes can be described by their attributes and used to represent
part/whole relationships
2. Some attributes of objects are measurable and can be quantified
using different tools
From the Common State Standards for Mathematics, Page 17.
Mathematics | Grade 2
In Grade 2, instructional time should focus on four critical areas: (1) extending understanding of base-
ten notation; (2) building fluency with addition and subtraction; (3) using standard units of measure;
and (4) describing and analyzing shapes.
(1) Students extend their understanding of the base-ten system. This includes ideas of counting in
fives, tens, and multiples of hundreds, tens, and ones, as well as number relationships involving these
units, including comparing. Students understand multi-digit numbers (up to 1000) written in base-ten
notation, recognizing that the digits in each place represent amounts of thousands, hundreds, tens, or
ones (e.g., 853 is 8 hundreds + 5 tens + 3 ones).
(2) Students use their understanding of addition to develop fluency with addition and subtraction
within 100. They solve problems within 1000 by applying their understanding of models for addition
and subtraction, and they develop, discuss, and use efficient, accurate, and generalizable methods to
compute sums and differences of whole numbers in base-ten notation, using their understanding of
place value and the properties of operations. They select and accurately apply methods that are
appropriate for the context and the numbers involved to mentally calculate sums and differences for
numbers with only tens or only hundreds.
(3) Students recognize the need for standard units of measure (centimeter and inch) and they use
rulers and other measurement tools with the understanding that linear measure involves an iteration
of units. They recognize that the smaller the unit, the more iterations they need to cover a given
length.
(4) Students describe and analyze shapes by examining their sides and angles. Students investigate,
describe, and reason about decomposing and combining shapes to make other shapes. Through
building, drawing, and analyzing two- and three-dimensional shapes, students develop a foundation for
understanding area, volume, congruence, similarity, and symmetry in later grades.

5/22/2012 BVSD Curriculum Essentials 71
Mathematics
Grade Level Expectations at a Glance
Standard Grade Level Expectation
First Grade
1. Number
Sense,
Properties,
and
Operations
1. The whole number system describes place value relationships
within and beyond 100 and forms the foundation for efficient
algorithms
2. Number relationships can be used to solve addition and subtraction
problems
2. Patterns,
Functions,
and
Algebraic
Structures
1. Expectations for this standard are integrated into the other
standards at this grade level.
3. Data
Analysis,
Statistics,
and
Probability
1. Visual displays of information can be used to answer questions
4. Shape,
Dimension,
and
Geometric
Relationships
1. Shapes can be described by defining attributes and created by
composing and decomposing
2. Measurement is used to compare and order objects and events
From the Common State Standards for Mathematics, Page 13.
Mathematics | Grade 1
In Grade 1, instructional time should focus on four critical areas: (1) developing understanding of
addition, subtraction, and strategies for addition and subtraction within 20; (2) developing
understanding of whole number relationships and place value, including grouping in tens and ones; (3)
developing understanding of linear measurement and measuring lengths as iterating length units; and
(4) reasoning about attributes of, and composing and decomposing geometric shapes.
(1) Students develop strategies for adding and subtracting whole numbers based on their prior work
with small numbers. They use a variety of models, including discrete objects and length-based models
(e.g., cubes connected to form lengths), to model add-to, take-from, put-together, take-apart, and
compare situations to develop meaning for the operations of addition and subtraction, and to develop
strategies to solve arithmetic problems with these operations. Students understand connections
between counting and addition and subtraction (e.g., adding two is the same as counting on two).
They use properties of addition to add whole numbers and to create and use increasingly sophisticated
strategies based on these properties (e.g., ―making tens‖) to solve addition and subtraction problems
within 20. By comparing a variety of solution strategies, children build their understanding of the
relationship between addition and subtraction.
(2) Students develop, discuss, and use efficient, accurate, and generalizable methods to add within
100 and subtract multiples of 10. They compare whole numbers (at least to 100) to develop
understanding of and solve problems involving their relative sizes. They think of whole numbers
between 10 and 100 in terms of tens and ones (especially recognizing the numbers 11 to 19 as
composed of a ten and some ones). Through activities that build number sense, they understand the
order of the counting numbers and their relative magnitudes.
(3) Students develop an understanding of the meaning and processes of measurement, including
underlying concepts such as iterating (the mental activity of building up the length of an object with
equal-sized units) and the transitivity principle for indirect measurement.1
(4) Students compose and decompose plane or solid figures (e.g., put two triangles together to make
a quadrilateral) and build understanding of part-whole relationships as well as the properties of the
5/22/2012 BVSD Curriculum Essentials 72
original and composite shapes. As they combine shapes, they recognize them from different
perspectives and orientations, describe their geometric attributes, and determine how they are alike
and different, to develop the background for measurement and for initial understandings of properties
such as congruence and symmetry
1Students should apply the principle of transitivity of measurement to make indirect comparisons, but
they need not use this technical term.

5/22/2012 BVSD Curriculum Essentials 73
Mathematics
Grade Level Expectations at a Glance
Standard Grade Level Expectation
Kindergarten
1. Number
Sense,
Properties,
and
Operations
1. Whole numbers can be used to name, count, represent, and order
quantity
2. Composing and decomposing quantity forms the foundation for
addition and subtraction
2. Patterns,
Functions,
and
Algebraic
Structures
1. Expectations for this standard are integrated into the other
standards at this grade level.
3. Data
Analysis,
Statistics,
and
Probability
1. Expectations for this standard are integrated into the other
standards at this grade level.
4. Shape,
Dimension,
and
Geometric
Relationships
1. Shapes are described by their characteristics and position and
created by composing and decomposing
2. Measurement is used to compare and order objects
From the Common State Standards for Mathematics, Page 9.
Mathematics | Kindergarten
In Kindergarten, instructional time should focus on two critical areas: (1) representing, relating, and
operating on whole numbers, initially with sets of objects; (2) describing shapes and space. More
learning time in Kindergarten should be devoted to number than to other topics.
(1) Students use numbers, including written numerals, to represent quantities and to solve
quantitative problems, such as counting objects in a set; counting out a given number of objects;
comparing sets or numerals; and modeling simple joining and separating situations with sets of
objects, or eventually with equations such as 5 + 2 = 7 and 7 – 2 = 5. (Kindergarten students should
see addition and subtraction equations, and student writing of equations in kindergarten is
encouraged, but it is not required.) Students choose, combine, and apply effective strategies for
answering quantitative questions, including quickly recognizing the cardinalities of small sets of
objects, counting and producing sets of given sizes, counting the number of objects in combined sets,
or counting the number of objects that remain in a set after some are taken away.
(2) Students describe their physical world using geometric ideas (e.g., shape, orientation, spatial
relations) and vocabulary. They identify, name, and describe basic two-dimensional shapes, such as
squares, triangles, circles, rectangles, and hexagons, presented in a variety of ways (e.g., with
different sizes and orientations), as well as three-dimensional shapes such as cubes, cones, cylinders,
and spheres. They use basic shapes and spatial reasoning to model objects in their environment and to
construct more complex shapes.
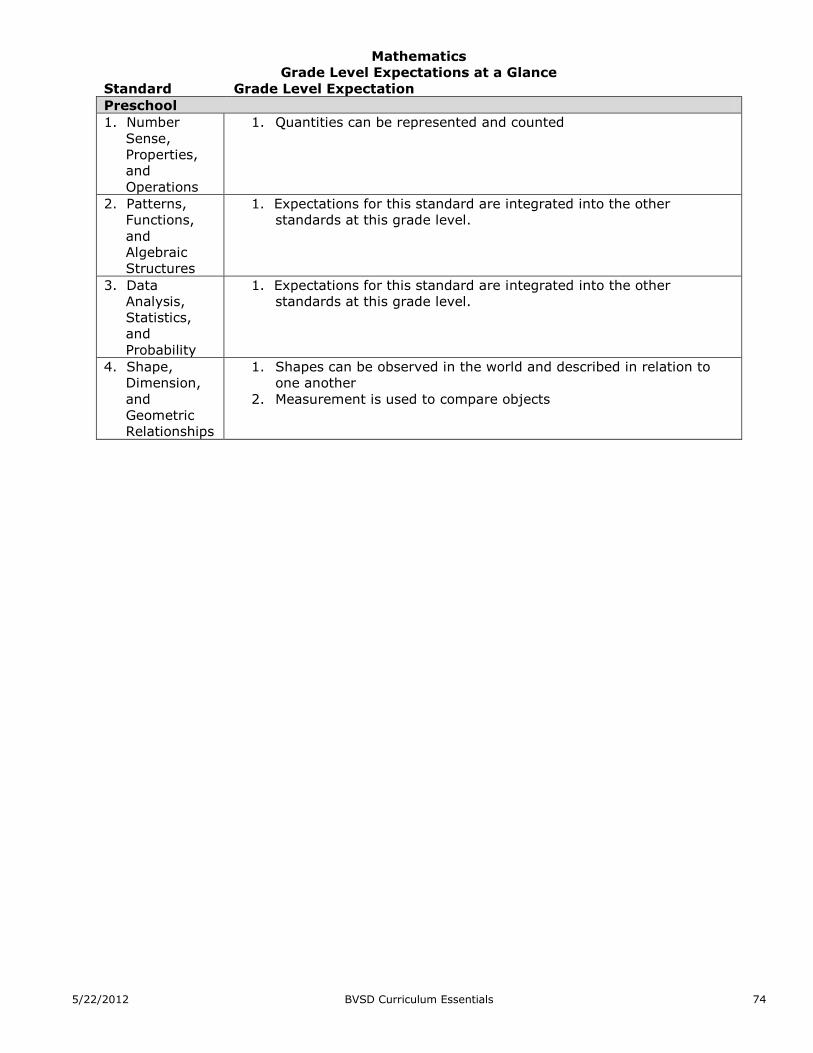
5/22/2012 BVSD Curriculum Essentials 74
Mathematics
Grade Level Expectations at a Glance
Standard Grade Level Expectation
Preschool
1. Number
Sense,
Properties,
and
Operations
1. Quantities can be represented and counted
2. Patterns,
Functions,
and
Algebraic
Structures
1. Expectations for this standard are integrated into the other
standards at this grade level.
3. Data
Analysis,
Statistics,
and
Probability
1. Expectations for this standard are integrated into the other
standards at this grade level.
4. Shape,
Dimension,
and
Geometric
Relationships
1. Shapes can be observed in the world and described in relation to
one another
2. Measurement is used to compare objects

5/22/2012 BVSD Curriculum Essentials 75