m tech thesis 2008 ntengwe444082pdfb2009
TRANSCRIPT

THE EFFECT OF IMPURITIES, SMOOTHENERS AND OTHER FACTORS ON THE RECOVERY OF COPPER FROM SOLUTIONS
by
FELIX WILLIAM NTENGWE
submitted in fulfilment of the requirements for the degree
MASTER OF TECHNOLOGY
in the subject
CHEMICAL ENGINEERING
at the
UNIVERSITY OF SOUTH AFRICA
SUPERVISOR: DR N. MAZANA
JOINT SUPERVISOR: Pr Eng F. SAMADI
December 2008

ii
DECLARATION I
This thesis, submitted for degree purposes at the University of South Africa, has not previously been submitted for degree purposes to any other institution of higher
learning. The work, ideas and presentations in this document are entirely mine except for the sources that have been acknowledged particularly in literature survey.
F. W. Ntengwe December 2008
iii
DECLARATION II
I declare that The Copperbelt University provided me with laboratory facilities which were used in carrying out experiments from April 2006 to December 2007 for the sole
purpose of facilitating the carrying out of work towards the Masters programme registered with UNISA.
Felix William Ntengwe December 2008
Head of Chemical Engineering December 2008
Dean of Engineering December 2008

iv
DEDICATION
This study is dedicated to my wife Leya,
my children
Thomas, Susan, Margret, Ruth and Mundalila
For their moral support during the preparation
of the proposal and write up of the Thesis
and
my grand parents
Mundalila Ntengwe and Jenny Mbale Chambulamemba Mpharo and Jenny Banda
For their support and care
during my kinder-garden days.

v
ACKNOWLEDGMENT
This study was constituted as a result of my registration in the Masters of Technology
(Chemical Engineering) programme in the College of Science, Engineering and
Technology at the University of South Africa during the year 2006. The study was
research based. As is the case with all research-based studies, one is bound to come
across literature of studies and publications, which are used for comparison,
strengthening of one’s approaches, identification of gaps and adoption of methodologies
used. I have come across a number of writing skills, which though different in the
approach have conveyed important messages. The origin of the writing is what makes
it different. In research, one is therefore reminded of the fact that when one uses other
people’s ideas and publications, such works need to be acknowledged. It is not often
deliberate that one does not acknowledge what has been used from other authors
because it is human to forget. It is for this reason that I wish to remind the readers of
this manuscript that effort has been made to acknowledge all works of other authors that
have been used in this document. I wish, therefore, to acknowledge and thank authors
whose ideas have been used as reference keys in the effort to make my ideas not only
clear to readers but to strengthen the manuscript as well.
In addition, I wish to thank the University of South Africa for providing the support and
guidance during the preparation of the proposal and during the entire research period. I
wish to thank Dr N Mazana and Pr Eng F Samadi, in particular, for providing guidance
and the direction during the period of my study at the University. I also would like to
thank the Copperbelt University for providing the laboratory, equipment and in some
cases chemicals and Chambeshi Metals Plc for providing copper sheets which were
used as cathodes and anodes during the study. Lastly I wish to acknowlwdge the
assistance received from Mr Chipili Protasho who assisted in the preparation of
standard solutions and the organization of equipment that were used during the
evaluation.

vi
ABSTRACT The electrochemical refining of copper was investigated at different temperatures,
distances between electrodes, different levels of overvoltage, current density, metal
impurities, smootheners, electrode-active area and concentration of electrolyte using the
parallel-plate model. The purpose of the investigation was to evaluate the effect of
smootheners, impurities and other factors on the recovery of copper from solutions.
The results showed that the metal impurities, with more negative oxidation potentials,
did not affect the electro-deposition of copper whilst metals with oxidation potentials
close and equal to that of copper reduced the current efficiency. The current density
increased with the increase in temperature, overvoltage and concentration of electrolyte.
The increase in overvoltage and current density above limiting values produced
increased rates of deposition resulting in efficiencies greater than 100% to be attained.
The increase in the limiting current density at concentration below 10.8g/L produced
low values of current efficiency ranging from 100 to 30%. The 2 and 3cm distance
between electrodes produced stable efficiencies of between 92-100% and 96-100%
respectively. The temperature was found to have indirect effect on the current
efficiency but direct effect on the dissociation of electrolyte in solution, current density
and overvoltage. An increase of 20cm2 of electrode active area reduced the current
efficiency by about 40%. The increase in concentration of electrolyte produced an
increase in the current density and efficiency ranging from 75-100%. The use of
smootheners; thiourea and EDTA (Ethylenediaminetetraacetic acid) reduced the current
density and current efficiency (100>CE>30%). However increased concentration of K-
glue, B-glue and G-Arabic in conjunction with EDTA or thiourea and NaCl improved
the current efficiency even at increased levels of overvoltage to levels of 96-100%,
100% and 90-100% respectively. Therefore, the presence of impurities, the use of high
current densities, inadequate distance between electrodes, and too low concentration of
electrolyte and the absence of glue disadvantaged the recovery process while the
presence of K-glue and B-glue reduced the inhibition effects of thiourea and EDTA and
thus improved the recovery of copper from solutions.

vii
LIST OF CONTENTS
ITEM PAGE
ABSTRACT vi
LIST OF CONTENTS vii
LIST OF FIGURES x
LIST OF TABLES xii
ABBREVIATIONS xiii
CHAPTER 1: INTRODUCTION 1
1.0 Introduction 1
1.1 Approach 1
1.2 Objectives 2
1.3 Methodology 3
1.4 Thesis Outline 3
CHAPTER 2: LITERATURE SURVEY 4
2.0 Introduction 4
2.1 Electrochemical process 5
2.2 Thermodynamics of Cells 10
2.3 Study Model 14
2.4 Benefits of the Study 20
2.5 Summary 22
CHAPTER 3: REVIEW OF ELECTROCHEMICAL ENGINEERING 23
3.0 Introduction 23
3.1 Electrochemistry 23
3.2 Kinetics of cells 27
3.3 Temperature and Energy 34
3.4 Diffusion of Ions in Cells 37
3.5 Convection of Ions between Electrodes 40
3.6 Migration of Ions between Electrodes 41
3.7 Mass Transfer in Cells 46

viii
3.8 Current Density and Overvoltage 48
3.9 Current Efficiency 52
3.10 Operation of Electrochemical Reactors 56
3.11 Smootheners and Metal Recovery 57
3.12 Nodulation 59
3.13 Impurities 60
3.14 Summary 60
CHAPTER 4: PROBLEM IDENTIFICATION 62
4.0 Introduction 62
4.1 The Problem and its Setting 62
4.1.1 Passivity 64
4.1.2 Temperature Changes 65
4.1.3 Distance between Electrodes 65
4.1.4 Variation of Concentration 66
4.1.5 Presence of Impurities 68
4.1.6 Inadequate Electrode-active Area 69
4.1.7 Development of Nodules 70
4.2 Assumptions 71
4.2.1 Assumption 1 72
4.2.2 Assumption 2 72
4.2.3 Assumption 3 73
4.2.4 Assumption 4 73
4.2.5 Assumption 5 74
4.2.6 Assumption 6 74
4.2.7 Assumption 7 75
4.3 Summary 75
CHAPTER 5: METHODOLOGY 76
5.0 Introduction 76
5.1 Study Design 76
5.2 Preparation of Reactor Baths 83
5.3 Measurements 85

ix
5.3.1 Effect of Electrode-active Area 85
5.3.2 Effect of Current Density and Overvoltage 86
5.3.3 Smootheners and Additives 87
5.3.4 Temperature 87
5.3.5Impurities 88
5.3.6 Distance Between Electrodes 88
5.4 Data Analysis 89
5.5 Summary 92
CHAPTER 6: RESULTS AND OBSERVATIONS 93
6.0 Introduction 93
6.1 Effect of Overvoltage on the Current and Current Density 93
6.2 Effect of Overvoltage on the Rate of Deposition 96
6.3 Effect of Temperature on Current Density and Efficiency 99
6.4 Effect of Current Density 102
6.5 Effect of Distance Between Electrodes 104
6.6 Effect of Concentration on Current Density and Current Efficiency 107
6.7 Effect of Impurities on the Current and Current Efficiency 112
6.8 Effect of Electrode-active Area on the Current Efficiency 117
6.9 Effect of Smootheners on the Current Density and Current Efficiency 119
6.10 Summary 138
CHAPTER 7: DISCUSSION, CONCLUSION AND RECOMMENDATIONS 140
7.0 Introduction 140
7.1 Discussion 140
7.1.1 Effect of Overvoltage and Current Density 140
7.1.2 Effect of Temperature 141
7.1.3 Effect of Distance between Electrodes 143
7.1.4 Effect of Electrolyte Concentration 143
7.1.5 Effect of Impurities 144
7.1.6 Effect of Electrode-active Area 145
7.1.7 Effect of Smootheners 146
7.2 Environmental Considerations 149

x
7.3 Economic Benefits 153
7.4 Conclusion 154
7.5 Recommendations 155
BIBLIOGRAPHY 158
APPENDICES 171
Appendix 1 Effect of Overvoltage and Current Density at 24oC 171
Appendix 2 Effect of Overvoltage and Current Density at 39oC 174
Appendix 3 Effect of Overvoltage and Current Density 60 oC 176
Appendix 4 Effect of Concentration on the Current Efficiency 181
Appendix 5 Effect of Temperature 182
Appendix 6 Effect of Electrode-active Area 185
Appendix 7 Effect of Impurities 187
Appendix 8 Equipment Used During the Study 190
LIST OF FIGURES
ITEM PAGE
Figure 2.1 Description of the Helholz Double Layer at the electrodes 10
Figure 2.2 Reactor with electrodes immersed in Cu-sulphate solution 14
Figure 2.3 Movement of copper and oxygen species towards electrodes 16
Figure 3.1 Electrochemical reactor with metal-electrolyte interfaces 24
Figure 3.2 Electrochemical reactor with regions of energy generation 33
Figure 3.3 Migration model for the ions in electrolyte 42
Figure 4.1 Agitated batch reactor 67
Figure 4.2 Continuous flow reactor 67
Figure 5.1 Circular electrochemical reactor with electrodes 83
Figure 5.2 Electrochemical reactor with (a) single cell and (b) bank of cells 83
Figure 5.3 Experimental apparatus for the measurement of current and voltage 86

xi
Figure 6.1 Effect of overvoltage on the current density at 24oC 94
Figure 6.2 Effect of overvoltage on the current density at 39oC 95
Figure 6.3 Effect of overvoltage on the current density at 60oC 95
Figure 6.4 Effect of overvoltage on the rate of deposition at 24oC 96
Figure 6.5 Effect of overvoltage on the rate of deposition at 39oC 97
Figure 6.6 Effect of overvoltage on the rate of deposition at 60oC 99
Figure 6.7 Effect of temperature on the limiting current densities 100
Figure 6.8 Effect of temperature on the current efficiency at 0.3Volts 100
Figure 6.9 Effect of current density on current efficiency at 24oC 102
Figure 6.10 Effect of current density on current efficiency at 39oC 103
Figure 6.11 Effect of current density on current efficiency at 60oC 103
Figure 6.12 Effect of distance between electrodes on the current 104
Figure 6.13 Effect of distance between electrodes on the rates of deposition 105
Figure 6.14 Effect of distance between electrodes on current efficiency at 0.3volts 106
Figure 6.15a Effect of electrolyte concentration on the current density at 60oC 107
Figure 6.15b Effect of electrolyte concentration on the current density at 60oC 108
Figure 6.16 Effect of concentration on the cell over-potential 109
Figure 6.17 Effect of concentration on the resistance, current density and potential 110
Figure 6.18 Effect of concentration on the current density and efficiency at 60oC 111
Figure 6.19 Effect of metals with highly negative oxidation potentials 112
Figure 6.20 Effect of silver nitrate on the limiting current density 113
Figure 6.21 Effect of silver nitrate on the current efficiency 114
Figure 6.22 Effect of bismuth nitrate on current density 116
Figure 6.23 Effect of bismuth nitrate on current efficiency 117
Figure 6.24 Effect of active area on limiting current density for a distance of 2cm 118
Figure 6.25 Effect of electrode-active area on the current efficiency in 15 minutes 119
Figure 6.26 Effect of sodium chloride on the current density 120
Figure 6.27 Effect of thiourea on the current density 121
Figure 6.28 Effect of thiourea on the current efficiency 123
Figure 6.29 Effect of K-glue on the current density 125
Figure 6.30 Effect of K-glue, thiourea and Na-chloride on current density 126

xii
Figure 6.31 Effect of G-Arabic, thiourea and Na-chloride on the current density 127
Figure 6.32 Effect of (1) K-glue and (2) G-Arabic on the current efficiency 128
Figure 6.33: Copper deposit at 0.1-0.4V and 0.25-0.8A with smoothener 132
Figure 6.34 Non-sticking copper at 0.9V and 0.8-1.5A without smoothener 132
Figure 6.35: Non-sticking copper at 0.5V and 1.1A at 60oC without smoothener 133
Figure 6.36: Non-sticking copper at 0.75V and 1.65A at 60oC without smoothener 133
Figure 6.37 Effect of EDTA, NaCl and B-glue on the reactor current 134
Figure 6.38 Effect of EDTA, NaCl and B-glue on the current density 134
Figure 6.39 Effect of EDTA, NaCl and B-glue on the current efficiency 136
Figure 6.40 Effect of smootheners on the colour quality of the cathode 137
Figure 6.41 Comparison of current density reduction with level of additive 138
LIST OF TABLES
ITEM PAGE
Table: 3.1 Type of electrodes and their reactions 26
Table: 4.1 Effect of concentration on the current efficiency 74
Table: 5.1 The Latin Square Design 79
Table: 5.2 Duration of project activities 82
Table: 5.3 The variation of current density with electrode-active area 85
Table: 6.1 The effect of electrode-active area on the current density 118
Table: 6.2 Correlations of K-glue-thiourea concentration (concn) with CE 130
Table: 6.3 Correlations of thiourea with the current efficiency 131
Table: 7.1 The current prices of some smootheners and inhibitors 154

xiii
LIST OF ABBREVIATIONS (ACRONYMS) a Number of moles of reactant A mol/L
Aa Factors for exponential function -
Ag Silver -
[A] Concentration of reactant A mol/L
b Number of moles of reactant B mol/L
[B] Concentration of reactant A mol/L
c Number of moles of reactant C mol/L
C Energy cost per kg of product, concentration $/kg, mol/L
Cd Cadmium -
CE Energy consumption kWh/kg
Co2+ Cobalt (II) -
Co3+ Cobalt (III) -
Cu Copper -
[C] Concentration of reactant A mol/L
d Number of moles of reactant D mol/L
D Diffusion coefficient mol/m2s
[D] Concentration of reactant A mol/L
e Electron -
E Potential at any instant, energy consumption Volts, kJ
Eo Potential at initial conditions or equilibrium Volts
F Faradays constant Coulomb
Fe2+ Iron (II) -
Fe3+ Iron (III) -
H+ Hydrogen ion -
Hg Mercury -
HG Hydrogen in glass -
H2O Water molecule -
xiv
H2SO4 Sulphuric acid -
I Current Amps
IL Limiting current Amps
j Current density A/cm2
J Flux mol/m2s, kg/m2s
Jconv Flux due to convection mol/m2s, kg/m2s
Jdiff. Flux due to diffusion mol/m2s, kg/m2s
Jmigr Flux due to migration mol/m2s, g/m2s
k Rate constant s-1, ms-1
kL Mass transfer coefficient ms-1
K Kohlrausch constant ohm-1m7/2mol-3/2
K Equilibrium constant -
L Distance cm
m Mass flow rate of water, mass deposited on cathode kg/hr, g, kg
mA Rate of change of mass on anode or cathode kg/hr-1
Ma Weight of anode kg
MA Mass of anode or cathode at any instant kg
MAo Mass of anode or cathode at initial conditions kg
Mc Weight of cathode kg
MT Theoretical mass according to Faraday’s Law kg
M2+ Metal ion -
n Number of moles -
O2 Oxygen molecule -
Ox Oxidised -
P Price of water $/kg
q Charge passed A s, Coulombs
r Rate of change of volume, reaction rate m3/hr-1, mol/s
R Gas constant, resistance kJ/kmol,K, Ohms
Red Reduced -
SO4 Sulphate ion -
t Time s

xv
T Temperature oC, K
v Speed ms-1
VA Volume of anode or cathode at any instant m3
VAo Volume of anode or cathode at initial conditions m3
Vc Cell Voltage V
Vn Neutral Voltage V
Vr Volume of reactor m3
w Mass deposited g
x Distance between electrodes cm
XA Conversion %
z Number of electrons taking part in the reaction
? Time of cathode build up or anode degradation hr
? Current efficiency, electric field strength %, Vm-1
? Molecular weight kg
? Ionic conductivity ohm-1m2mol-1
µ Chemical potential Volts
η Overvoltage Volts
α Degree of dissociation -
Λ Molar conductivity of electrolyte ohm-1m2mol-1

1
CHAPTER 1
INTRODUCTION
1.0 Introduction
This chapter deals with the background to the study. It presents the objectives which
played key roles in the implementation of the study and the realisation of the results. It
also covers brief description of the methods used and the expected relationships between
different variables that were used during the study.
1.1 Approach
A holistic approach to the recovery of copper from solutions was considered. The
recovery of copper was investigated using electrorefining process that uses electrodes of
the same material, one acting as cathode and the other as anode. The deposition, in this
process, occurs at the cathode while the dissolution at the anode. The ions in solution
were considered to play a key role in the recovery of copper as the conductivity of the
electrolyte depends on the ionic strength. The movement of the ions from solution to the
cathode and from the anode to the solution was assumed to be potential dependent. The
migration and diffusion of ions were considered to occur in the Gibs Helmholtz layers at
the electrodes. The conduction and convection of heat to and from the reactor was
controlled by steady heat supply from the water bath. The strength of the current on the
electrode was assumed to be dependent on the size of electrode-active area while the rate
of deposition was assumed to be current-density and voltage dependent. It was also
assumed that the impurities, temperature and smootheners would play a role in the
deposition process. The recovery was therefore assumed to depend on the factors
temperature, concentration of electrolyte, electrode-active area, level of smoothening
agents, impurities, current density and applied potential. If the current efficiency
depended on these factors, it means that the current efficiency (F; %) was assumed to be
2
a function (f) of each of these factors and therefore a model relationship could be
determined from equation (1.1) where C (g/L) is the concentration of electrolyte,
smoothener and impurity while A is the electrode-active area, T (K, oC) is the
temperature, j (mA/m2) is the current density and V (volts) is applied potential. The
relationship between the current efficiency and the factors can be modelled using
exploration, data mining and classical methods in the Latin Square as in bivariate
correlations.
};;;;;;{ impurSmoothelectro CVjCATCf=Φ (1.1)
1.2 Objectives
The main aim of the study is to evaluate the recovery of copper by electrochemical
method using constructed cell arrangements, so that parameters that could lower
production would be identified and optimised in order to increase the efficiency. The
specific objectives were:
1. To evaluate the effect of overvoltage on the rate of deposition and the effect of
current density on the current efficiency in order to determine optimum values,
2. To establish the effect of temperature on current efficiency in order to determine
the optimum value at which the current efficiency is greatest,
3. To determine the effect of distance between electrodes on current efficiency in
order to establish the optimum distance for the electrodes,
4. To examine the effect of electrolyte concentration on the current and production
efficiencies in order to establish the level that provides adequate recovery with
less impurities,
5. To determine the effect of metal and other impurities on the current efficiency in
order to establish the level that would provide no competition to copper ions in
electrolyte,
6. To determine the effect of electrode area on current efficiency in order to establish
the optimum electrode area in relation to the current density and efficiency and

3
7. To determine the effect of smootheners on the current efficiency in order to
establish the best smoothener.
1.3 Methodology
The parallel plate model in circular reactor was used in this study assuming that the back
and sides of both anode and cathode did not take part in chemical reaction. It was also
assumed that the geometry of the reactor did not have any effect on the chemical reaction.
By maintaining the temperature at fixed value, thermodynamic effects due to heat loss
could be assumed to be at steady state. Convection effects were assumed to be negligible
since stirring was conducted prior to the chemical reaction in order to make the
concentration of additive to be distributed evenly and not during the electrodeposition
process. Although the migration and diffusion processes contribute greatly to the
process, and have been discussed in literature, the evaluation of such mechanisms can be
achieved by the deposition or mass transferred to the cathode as the efficiency is
dependent on the effectiveness of migration and diffusion of the ions in solution in
addition to the driving force. The electrochemical refining of copper was thus
investigated at different temperatures, distances between electrodes, different levels of
overvoltage, current density, metal impurities, smootheners, electrode-active area and
concentration of electrolyte using the parallel-plate model in order to establish the effect
on the current efficiency.
1.4 Thesis Outline
A total of six chapters have been presented in this document covering the literature
review, the overview of electrochemical engineering, the problem and its setting, the
methodology for the investigation and the results. The discussion, conclusion and
recommendation make up the last chapter. The appendix section includes the information
on the crude data obtained during the study, and the apparatus as viewed through the
camera. Acronyms are defined within the document and are listed after the list of figures
and tables.

4
CHAPTER 2
LITERATURE SURVEY
2.0 Introduction
Many countries in the world, including Zambia, largely depend on copper as the
backbone of their economies. Copper is the most widely mined mineral in Zambia
though a few other minerals such as gold, cobalt and silver are also exploited. Copper
producing companies have acknowledged the importance of producing high quality
copper in order to satisfy the market demands and requirements. Copper refining by
electrochemical reaction (electrolysis) is one of the very important components in the
production of high quality metals in the mining industry and other small-scale ventures
that contribute to sustainable development. There are two methods of electrochemical
refining. Electrorefining is one method that produces high quality copper from 98% to
99.98% copper while electro-winning is used for the recovery of copper from dilute
solutions. The methods make use of electrolytic reactors that contain the cathodes and
anodes which are connected to electrical power at appropriate level, acting as the driving
force, to allow for the electrochemical reaction to proceed smoothly. Various models
have been developed to describe the behaviour of the electrodes (Rousar et al., 1986).
Many authors have presented mathematical models for such reaction systems. Bisang
(1997) developed the mathematical model of the parallel plate reactors, which take into
account the diffusion layer adjacent to the working electrode and the convective layer in
bulk solution. The results for copper electro-winning showed agreement with the
transient equation for the diffusion layer in the convective region. The parallel plate
model is widely used for copper recovery particularly in the copper mining companies.
The objective of this chapter is to cover the introductory topics of electrochemical
process, the main objectives, the benefits of the study, approach, thermodynamics of cells
and the properties of electrolytes that enable the electrochemical process to proceed.

5
2.1 Electrochemical Process
The electrochemical process uses electrodes, power supply and electrolyte solution,
which may be heated by an external source such as steam in a heat exchanger or directly
by steam flow through jackets around cell baths. One pair of electrodes forms a cell,
which acts as an electrochemical reactor. The electrochemical reactor uses the voltage
as the driving force for the chemical reactions at the electrodes. If the electrodes that
form the cell are made of different materials then the cell deposits metal ions from
solution onto the cathode. The anode does not dissolve. This method can use solutions
of fairly low concentration. Such a process, called electrowinning, is usually used to
make the starting sheets which are then used in other processes. If the electrode pair is
made of the same material then the cell formed creates an electrorefining process. The
electrorefining process is where the anodes release the metal ions into solution and are
later deposited onto the cathode producing efficiencies of above 92% (Gana et al.,
1993). The electrolyte releases oxygen atoms on the anode (Bellino et al., 2001). The
potential applied across the reactors results in polarization of electrodes to anode
(positive) and cathode (negative). Polarization is caused by various factors: shape,
composition of electrodes, type of electrolyte, temperature, flow rate, level of current
and type of species in electrolyte. Concentration polarization is the formation of ions
around the cathode or anode created by potential. The film of ions allows the
dissolution or deposition of copper on anode or cathode if the potential changes. If
concentration polarization sets in, the deposition of copper ceases until the vo ltage
increases. The film then allows the deposition of metal again. Polarization results in
the development of voltage drop across two electrodes, which obeys Ohms Law as
described in Koryta and Dvorak (1987:90-92). The Law is given by equation (2.1).
)( Φ= dbj (2.1)
Where j is the current density (mA/m2), F (%) is the current efficiency and b is the
constant given by the ratio RTlzFka/ . At low levels of current, the voltage-current
relationship is linear while the resistance remains constant. At high values of current

6
there is a marked departure from linearity (Skoog and West, 1976). Polarization results
in the deposition of metal and evolution of gas at cathode and anode respectively as
shown in anode and cathode reactions in equations (2.2) and (2.3) and the overall
reaction in equation (2.4). If the anode is soluble, then the reaction is as given by
equation (2.5).
24224 2422 OSOHeOHSO +=−+ (2.2)
CueCu =++ 22 (2.3)
24224 2222 OSOHCuOHCuSO ++=+ (2.4)
+=− 22 CueCu (2.5)
The advantage of this method is that power is available and the measuring instruments
can easily be found. The other advantage is that it produces high purity product, as
stated earlier, and can be conducted at fairly low values of voltage. But a number of
factors may affect the electrorefining process. The factors such as the separation of
electrodes, temperature, concentration of electrolyte, concentration of impurities,
electrode-active area, overvoltage, current density and type and quality of surface
smoothener play a significant role in the recovery of copper. In a study by Ling et al.
(1994), the operating conditions that were used during the operation of electrolytic
reactors include conditions that are mentioned above. The efficiency may increase or
decrease depending on the levels of such parameters used during electrolysis. It is
therefore necessary to consider such factors when evaluating the recovery of copper, for
commercial purposes, by the electrochemical method.
The stability and efficiency of electrochemical process depends on the type and
properties of electrolyte. An electrolyte is a solution containing ions, which are able to
move to and from the electrodes upon the application of potential across the electrodes.
An electrolyte may also be a melt, which is the solid electrolyte. If the electrolyte is

7
poor then a low efficiency of electrolysis will be achieved. However, if the electrolyte
is good, the efficiency of electrolysis can be high. A good electrolyte is one that offers
little resistance to the flow of current. The behaviour of electrolytes depends on the
properties of dissociation, conductivity and how much resistance the ions offer to the
flow of current in the system. The two groups of ions that play an important role in
electrolysis are the anions (-ve) and cations (+ve). The cations are attracted to the
negatively-charged cathode and the anions to the positively-charged anode. The system
so formed, called a cell, is heterogeneous in nature comprising the solid electrodes and
liquid electrolyte. A solid-solid system can form when a melt is used in the
electrochemical process. A pair of electrodes forms a cell, a group of pairs of electrodes
in one cell bath form a battery. The anodes are usually arranged in series and so are the
cathodes but anodes and cathodes are connected in parallel.
A good electrolyte should have good electrical conductivity properties. It must offer
low resistance to the flow of electrons so that the application of voltage across it will
allow the system to obey Ohm’s Law as described in Koryta and Dvorak (1987:2). The
product of resistance (R) and the current (I) gives the applied voltage according to
Ohm’s Law. The reciprocal of resistance of the electrolyte (conductance) and resistance
are both concentration dependent. The resistance depends on the crossectional area and
the length or distance through which the ions have to cover. The longer the distance the
greater is the resistance. The resistivity (resistance per unit area and unit length) and the
conductivity (reciprocal of resistivity) are also concentration dependent. An electrolyte
can be said to be strong if its ions dissociate completely in solution and weak if its ions
dissociate partially when in solution. According to Koryta and Dvorak (1987:2), “A
weak electrolyte is present in solution as both ions and molecules”. A strong electrolyte
is present in solution as the corresponding ions. Temperature can contribute to the
formation of ions in solution. For example, the temperature would affect the
dissociation of ions in solution presenting a low effect at low levels and a high effect at
higher values of temperatures. The conductivity of electrolyte, which is dependent on
ions, would thus be affected and would make the solution to attain higher or lower
conductivity of electrolyte (Koryta and Dvorak, 1987:2; AEM, 2004). The strength of

8
an electrolyte described by both Ostwald’s and Kohlrausch’s applications (Koryta and
Dvorak, 1987:2; Crow, 1994:26) represented by equations (2.6) and (2.7) where K is
the equilibrium constant and K1 is Kohlrausch’s constant (ohm-1m7/2mol-3/2), a is the
degree of dissociation and c is the number of moles would thus depend on the anions
(A-) and cations (B+) of the electrolyte compound AB.
)1/(]/[]][[ 2 αα −== +− cABBAK (2.6)
)1/(][/ 22' αα −=Λ−ΛΛΛ= ccK oo (2.7)
When a solution is formed from a salt of the desired electrolyte (copper sulphate in this
case), the heat of solution, though fairly small, is released which may be either
exothermic or endothermic. From the thermodynamics point of view, the heat of
solution is the result of the sum of the lattice and solvation energies (Crow, 1994:10-
11). The ionic activity results in the generation of chemical potential in solution. Such
potential is temperature dependent as is shown in equations (2.8) for the anode and (2.9)
for the cathode. Where e (volts) is the chemical potential at any instant and eo (volts) is
the potential at equilibrium, T is the temperature (K), R (kJ/kmolK) is a constant and a-
is the activity of the solution representing the concentration. The potential so defined is
in essence the free energy of the system when one mole of the uncharged particles
(species) is added.
][ −+= aRTInoεε (2.8)
][ ++= aRTInoεε (2.9)
The effect of the charge on ions is to introduce the electrical potential in the system
which is an additional change in free energy of the system given by the product of the
charge of the specie ions (z), the Faraday constant (F) and the potential (E) as zFE
giving the potential of the electrochemical system (ε) for copper sulphate solution to be

9
as indicated in equations (2.10) and (2.11) where ? G (kJ/kmolK) is the free energy of
the system.
zFECuRTIno ++= + ][ 2εε (2.10)
zFEG +∆=ε (2.11)
This potential, due to the transport of ions, creates the electrical migration due to the
influence of an electric field. The total current carried by each ion is only a fraction of
the current carried by the total ionic species in solution. The fraction of current carried
by each ion is called the transport number (Nj+) for the cation and (Nj
-) for the anion.
The current carried by each ion per unit area (j) is given by equations (2.12) for the
cations and (2.13) for the anions while the total transport number for both ions is given
by equation (2.14). The sum of currents per unit area should not be greater than unity.
)/()(/ −++−−−+++++++ +=+= jjjvzcvzcFFzvcN j (2.12)
)/()(/ −+−−−−+++−−−− +=+= jjjvzcvzcFFzvcN j (2.13)
−+ += jjj NNN (2.14)
The ions in solution are driven by the electric field, which is induced by potential at the
electrode. The speed of the ions is retarded, according to Crow (1994:53), by the
retarding forces of asymmetry and electrophoretic effects and viscosity. The speed (v)
of the ions is dependent on their mobility (u) and the field strength (Fs) as shown in
equations (2.15) and (2.16) for cations and anions respectively.
sFuv ++ = (2.15)
sFuv −− = (2.16)

10
When the ions reach the electrode, they form layers. The positively charged ions form a
layer near the cathode while the negatively charged ions form a layer near the anode.
Since the anode is positive and the cathode negative, double layers form at each
electrode consisting of positive and negative ions. The double layer, called Helmholtz
Layer as described in Crow (1994:69) for the ions in electrolyte, can be observed in
Figure 2.1.
Figure 2.1 Description of the Helmholtz double Layer
The amount of mass deposited on the cathode gives the yield, which is dependent on the
charge passed over the time by the applied voltage. This leads to the concept of current
efficiency of the system. The current efficiency may depend on a number of factors
such as the temperature of electrolyte, current density, overvoltage on the electrodes,
impurities in electrolyte (may be particulate in nature) and electrodes which may affect
the deposition process, the type of smoothener and its concentration which may affect
the quality of electrode surface especially in industrial applications, the distance
between the electrodes, and the concentration of electrolyte which may affect the
deposition process. It was therefore important to investigate how and to what extent
such factors affect the current efficiency in order to determine the optimum values that
could be used for the smooth operation of electrorefining reactors.
2.2 Thermodynamics of Cells
Thermodynamics is the science that deals with the movements of heat energy from
regions of high energy to regions of low energy. In machines, the energy is generated
when the work is being done. The amount of energy generated is directly proportional

11
to the work done. This leads to the First Law of Thermodynamics, which is the
principle of conservation of energy that states that energy can neither be created nor
destroyed but is converted from one form into the other. This is synonymous with the
law of conservation of mass, which states that matter is neither created nor destroyed
but is converted from one form into the other. For example, potential energy can be
converted into kinetic energy and work energy can be converted into heat energy. The
principle, according to Eastop and McConkey (1990:19-21), states that when a system
undergoes a thermodynamic cycle the net energy supplied to the system from its
surrounding is equal to the net work done by the system on its surrounding. Equation
(2.17) is the mathematical expression of the First Law of Thermodynamics, which is the
result of Joule’s Experiments (Russell and Adebiyi, 1993: Chapter 6). In other words
energy cannot be produced from nothing if work is not done. We see that the assertion
by Eastop and McConkey (1990) agrees with the argument advanced by Russell and
Adebiyi (1993).
∫∫ = dWdQ (2.17)
The systems obeying the First Law of Thermodynamics are perfect systems or ideal
systems where all the energy that is generated from doing work is converted into heat
energy. In practice, there are no such machines because friction takes up some of the
energy resulting in the reduction of efficiency to less than 100 percent. Because of this,
the First Law of Thermodynamics is modified to include the change in internal energy
(dU) as indicated in equation (2.18).
∫ ∫∫ −= dWdQdU (2.18)
The Second Law of Thermodynamics, according to Eastop and McConkey (1990:100-
101), states that it is impossible for a system to produce net work in a complete cycle if
it exchanges heat only with bodies at single fixed temperatures. This means that work
must be done at some point in the system, which will result in the change in temperature

12
that results in the change in heat energy in the system. The change in heat energy
results in the formation of high and low energy regions. Heat energy can then,
according to the Second Law of Thermodynamics, flow to lower regions. It is indeed
impossible for an electrochemical cell to exchange heat energy only with the
surrounding if no work is done and there is no change in temperature of the electrolyte.
Infact, Planck’s and Clausius assertions, according to Russell and Adebiyi (1993:
Chapter 7), agree with this argument. There must be an external load in order for the
cell to do work, i.e., convert chemical energy into electrical energy, which is convertible
into work energy. For example, a battery driving the starter motor converts chemical
energy into electrical energy, an electrical motor driving a ball mill using electrical
power converts electrical energy into work and kinetic energies, and a diesel engine
converting fuel energy (chemical energy) into mechanical energy or work energy which
is used to drive a motor that converts mechanical energy to electrical energy for home
and industrial uses. The kinetic energy of water in a river is used to drive the turbine,
which converts the kinetic energy into work energy and electrical energy. The heat
transfer from cells can be achieved by conduction through the walls of the reactor,
convection in electrolyte and radiation from the walls of the reactor and surface of the
electrolyte (McCabe and Smith, 1976: Chapters 10, 11, and 12). The principle
governing such heat transfer is Fourier’s Law for heat transfer by conduction and the
modified forms for radiation and convection.
The industrial applications of electrochemical cells involving copper electrorefining use
Plug Flow Reactors (PFR) at steady states and open to the atmosphere at the top and
batch reactors. The contributions of heat energy come from the heat of reaction, the
free energy of the reaction, the loss of heat due to conduction, convection and radiation
and the energy of the electrolyte before entering the reactor. For most practical
applications, the contributions of most of these terms that are linked to loss of energy
are not important because the cell generates heat energy, which results in rise of
temperature. It is the temperature rise that may affect the recovery of copper.
However, the heat of reaction and the free energy are important for purposes of
assessing the magnitude of heat energy that would affect the temperature of the system.

13
The relation between the heat of reaction (∆H), temperature (T) and the free energy
(∆G) has been developed by many authors who all agree that the relation is given by the
Gibbs-Helmholtz equation as shown in equation (2.19) for the heat of reaction and
equation (2.20) for the entropy of the system (Antropov, 1972:26-28; Bruce, 1995:216-
217). Entropy is the change in heat energy of the system per unit temperature.
)/( TGTGH ∂∆∂−∆=∆ (2.19)
)/(/)( TEzFTGHS ∂∂=∆−∆=∆ (2.20)
Equation (2.21) shows the transformed form of free energy of chemical equilibria as
stated by Barrow (1979:237-239). Where Ec and Ea are the potentials (volts) at the
cathode and anode respectively. Barrow (1979:246-247) also asserts that the chemical
equilibrium is related to the thermal-chemical property. The free energy of the cell
reaction is the driving force for the reaction. The over-potential helps to liberate the
ions in solution by providing an external electromotive force, which drives the ions
from the metal into solution. The magnitude of such over-potential can be determined
using equation (2.22) (Pletcher and Walsh, 1993:4-5,489; Heitz and Kreysa, 1986:94-
95).
po RTInKG −=∆ (2.21)
0)( =−−=−=∆ ac EEzFzFEG (2.22)
The values of ∆G, ∆H and ∆S can be obtained if the temperature is measured. The
value of ∆G is obtained from the direct measurement of cell potential as indicated in
equation (2.22). The values of free energy can be positive or negative. The sign of free
energy gives the idea of what sign the electromotive force (emf) of the cell is going to
be. For example, according to Perry and Chilton (1973:470-472), the emf is positive for
a cell for which the value of the free energy is negative. This means that the cell
reaction can proceed spontaneously. On the other hand the cell emf is negative for a

14
cell for which the free energy is positive. The cell potential is normally greater than
zero. It, therefore, means that the difference between the cathode and anode potentials
is also greater than zero. The cathode should have more positive equilibrium potential
than that of the anode in order for corrosion to occur. Thermodynamically, metals
corrode by anode dissolution. The standard emf values of cell reactions for various
solutions and electrode potentials are described in Barrow (1979:624).
2.3 Study Model
Several models, as stated earlier, have been developed to describe the behaviour of
electrodes (Rousar et al., 1986). A mathematical model for parallel plates was studied
in Bisang (1997). The parallel plate model used in this study was chosen for a number
of reasons (Figure 2.2). Circular and rectangular reactors can accommodate such a
model. The electrodes can easily be made from starting sheets. The cell baths are easy
to make on a lab scale and it is easy to replace the electrodes and solution.
Figure 2.2: Reactor with electrodes immersed in Cu-sulphate solution
It is easy to control the distance between electrodes and to take measurements of
overvoltage, current and electrode area. It provides for easy cleaning and assemblage of
the cell components. The surface inspection for nodules is much easier for the parallel
plate model than other models. The model is therefore suitable for the study of nodules
and the effect of smootheners (inhibitors) on the recovery of metals. It has thus found
many applications in industry. It is widely used in mining industries for the recovery of

15
numerous metals by electrolysis. The recovery of copper, silver, cobalt, nickel and
other metals uses this model to remove them from solutions although the anodes may be
made of different materials in some operations. These are the existing benefits that the
model has provided to human kind but the problems that have arisen as a result of the
usage of this model has necessitated numerous researches of which this study is one. It
is also easy to model the migration, diffusion, convection and overall mass transfer of
ions from electrolyte to the electrodes and vice versa. Detailed discussions of the
application of the model to the stated modes of mass transfer are described in Koryta
and Dvorak (1987:90-92) and Bruce (1995). The kinetics of the other models are
covered in Vetter (1967:117-119). In addition, the kinetics of the reactor deals with the
reactions at the electrodes (Wan et al., 1979). At equilibrium, the rate at the cathode is
equal to that at the anode. If the cathode reaction is the one that is required then
increasing the external potential (?) will drive the reaction (Barrow, 1979:645-652).
The net current (I) of the system is defined by the current at the cathode (Ic) and that at
the anode (Ia) as given by ac III −= while the net overvoltage is given by ac EE −=η .
It is the net current and net overvoltage that is used in the evaluation of the effect of
current and overvoltage on the rates of deposition and current efficiency. The
exponential increase of current with overvoltage is given by )/( RTFEAeI −= at both the
cathode and anode where A is the exponential factor. If the fraction of energy FE
given by FEα drives the chemical reaction at the cathode then that driving the reaction
at the anode is )1( α−FE giving the currents in the system to be )( ηαFFEcc ekI −−= at
cathode and )1(( αη −+−= FFEaa ekI at the anode where ka and kc are the rate constants (s-1)
at the anode and cathode respectively. These currents can further be reduced to RTF
oc eII /ηα+= and RTFoc eII /)1( αη −−= . The net current in the system can be used to
evaluate the Butler-Volmer equation and hence the Tafel model bInIa +=η . When
copper ions are reduced to produce an attached CuM − species, the current of the
electrodes become ][ CuMkI cc −= and ][ 2+−= CuMkI aa . Since the liberation of one
atom of copper is associated with the liberation of two hydrogen atoms according to

16
Tafel’s mechanism, the reaction is second order and therefore the current is given
by 2][ CuMkI −= .
In this model, the copper ions move to the cathode by either migration or diffusion or
both. Convective movement occurs when there is provision for stirring or use of
circulation using an external force or pump. Stirring also allows the concentration to be
maintained at a constant value. The oxygen gas is evolved at the anode. The deposition
of copper is via reductive mechanism where the ions receive electrons and are thus
reduced in state while the evolution of gas is an oxidative process where the acid
provides the electrons to the copper ions in order to reduce them.
The operation of the reactor assumes a one-dimensional mass transport model with two
films, one on each side of the electrode which obey Ficks Laws (Coulson and
Richardson, 1996), and a constant-operation temperature. The main reaction for
modelling the reactor is the reduction of copper ions at the cathode. The copper ions
diffuse, migrate and convect from bulk solution to the cathode where they are reduced.
When this happens, a vacuum of ions is created in the films (L1 and L2) and hence in
the bulk solution, which is filled by the ions released from the anode (Figure 2.3). This
phenomenon allows the concentration of ions in bulk solution to remain unchanged and
to provide adequate ions, dependent on the charge passed, to the surface of the cathode
where the deposition takes place.
Figure 2.3: Movement of copper and oxygen species towards electrodes
17
The movement of ions in the vertical area towards the cathodes defines the flux (Fx)
according to Ficks Law of diffusion and migration as indicated in equation (2.23) where
D (mol/m2s) is the diffusion coefficient, dc is the change in concentration and dx is the
change in distance between the electrodes.
)/( dxdcDFx = (2.23)
This equation can be modified for material flux to give equation (2.24) where dN is the
change in the number of mols, dt is the change in time (s)
)/(/ dxdcDdtdNFx == (2.24)
The mass deposited by the applied voltage at a particular current can be determined by
equation (2.25) where m (g) is the mass deposited, M is molecular mass of the copper.
If the deposition of copper on the cathode obeys Faraday’s Law then the current
efficiency (F) is defined by equation (2.25).
zFMjzFAMIdtdm /// Φ=Φ= (2.25)
A plot of (dm/dt) against the current density (j) yields a slope from which the current
efficiency can be calculated. The current efficiency can also be determined from
equation (2.26a) for a specified period of time, e.g., 15minutes as a modified version of
equation (2.25). The temperature of the reactor increases diffusion, current density and
the rates of chemical reactions. The mass transfer rates are enhanced when the viscosity
of electrolyte is reduced (Pletcher and Walsh, 1993:95). In the case of the batch reactor,
the rate of change of concent ration is given by equation (2.26b).
∫∫ Φ= dtzFMIdm )/( (2.26a)
][/ 2+=−= CukkCdtdc (2.26b)

18
The effect of the volume (Vr) of the reactor electrolyte subjected to overvoltage on the
concentration, for constant current, can be assessed by equation (2.27a). The
substitution of I results in the introduction of current efficiency as indicated in equation
(2.27b).
111/ −−−= rVFIzdtdc (2.27a)
∫∫ −Φ= dttMVmdc r1)/( (2.27b)
The slope of equation (2.27b) gives the current efficiency at the specified time (t)
interval for a change in concentration (dc) and the mass (m) deposited. When the
current (I) is equal to the limiting current (IL), which is equal to kLAzFC, the rate of
change in concentration with time is given by equation (2.28).
][/ 211 +−− ==− CuAVkACVkdtdc rLrL (2.28)
The distance between electrodes increases the polarity when the distance is small and
lowers it when it is large. Whilst the Ficks Law applies to the films that develop near
the electrodes, the distance between electrodes removes the bulk distance and the entire
system is turned into a thin film between the two electrodes, which then allows the
application of Ficks Laws of diffusion, and migration as shown in equation (2.29). It
can be noted in equation (2.29) that the current is inversely proportional to the distance
between the electrodes and the current efficiency can be obtained from equation (2.30).
zFAIdtdcDdtdN /)/(/ Φ==− (2.29)
zFAIxCCD //)( 0 Φ=− (2.30)
In the case where there are dissolved impurities in the electrolyte; it is safe to operate
the reactor if the potentials of such impurities (metallic) are higher than the element
19
being recovered because competition would not be there. However, when the dissolved
impurities have the potentials close to the element being recovered the chances of
recovering impurities together with desired element are high. The efficiency of such a
reaction can be modelled by considering the fraction attained by the limiting current in
the system as given by equation (2.31). The value of IF is usually less than unity. The
conversion for the reaction is dependent on the initial concentration and the current as
given in equation (2.32).
LF III /Φ= (2.31)
000 /)(/ CCCzFCIX A −=Φ= (2.32)
When the reactor is operated under mass transport control it means that the current,
which was at a value greater than the limiting current, drops to below the limiting value.
The current efficiency falls with time while the decay of concentration is exponential
with time. The current efficiency is now provided by equation (2.33).
LLt IAkzFC /)(=Φ (2.33)
The current and current efficiency as a function of electrode-active area can be defined
by equations (2.34a) and (2.34b). The slope of the plot of the change in current (dI)
versus the change in active area (dA) gives the current efficiency. Confirmation of the
result can be made using equation (2.34a).
dAbadI 11= (2.34a)
dAbad 111=Φ (2.34b)

20
Where the values of a1, a11 and b1 are given by ΦMtzF / , MItzF / and rL VCk /
respectively. A plot of current versus the active area gives the correlation that
represents the effect of active area on the current and current efficiency.
2.4 Benefits of the Study
The benefits of the study can be derived from different perspectives according to needs
of the user or community or organization. One can foresee many organisations using
the results to establish small-scale plants in order to forgo the trouble of having to buy
copper from expensive sources or importing the commodity all the time. The mining
sector and other users in the world would find the information from the study useful in
the efforts to meet the challenge of technology advancement and mining sector copper
improvement strategies. The academic fraternity and particularly students will find the
information useful as one of their reference sources in the process of carrying out their
project reviews. Other business entities particularly those that are into copper recovery
may want to use the study as an opportunity to decide to venture into the copper
recovery on a small, medium and large scale production depending on their capacities to
invest.
The major benefit that the study provided was the introduction of new combinations of
smootheners, which would enable the reactors to attainment high efficiency during the
recovery of copper from solutions. Employment generation and sustainable
development goes hand in hand with such innova tions. If the study results are adopted
they would provide job opportunities to many as a result of the expansions and creation
of new organisations or provide an opportunity to sustain lives as the demand for copper
in the informal sector for repairing equipment both in electrical and automotive small-
scale industries is increasing. The study would therefore provide an easy method to
purify copper from ore or scrap metals.
Wastewater treatment has experienced a number of problems. The removal of heavy
metals and the metals higher up in the chemical series is becoming increasingly difficult

21
as the pollution events are increasing due to faulty equipment and poor management
systems. Electrolysis is one of the methods that can easily be applied in this area on a
large scale to treat wastewaters before they are released into the environments. It is also
a good method to remove precious metals; Gold and Silver. Metal recovery by
electrochemical method provides a solution to the treatment of many industrial
wastewaters (Pletcher and Walsh, 1993: Chapter 7). According to Pletcher and Walsh
(1993:Chapter 7), the feeds to electrochemical cells may come from areas such as
leaching of ores, leaching or run-off water, cells of electrowinning and electrorefining,
rinse waters, and metal cleaning solutions. Heitz and Kreysa (1986:128, 206-208) agree
with this concept. They argue that the packed and fluidised bed electrodes are suitable
for the extraction of metals from low-grade ores and effluents. Although the method is
a single metal recovery concept, a multi-metal recovery system could be designed if the
levels of metals are high. Although the packed and fluidised bed electrodes are
different in design when compared to the parallel plate type, the principle of metal
removal from wastewaters is similar in that they both remove the undesired metals in
wastewaters.
Electroplating using electrochemical process is used in many countries in the world and
therefore is an already existing benefit to human kind. The objective of an
electroplating process is to prepare a deposit, which adheres well to the substrate
(Pletcher and Walsh, 1993: Chapter 8). The process of electroplating is exactly the
same as that of electrowinning and electrorefining where two electrodes, one the anode
and the other the cathode, are used to form part of the electroplating cell. The plating is
done on the substrate, which is the cathode. The main areas of applications include
corrosion protection, decorative appeal, wear resistance, hardness, electrical
conductivity, solderability and thermal conductivity. In the electronics industry, the
electroplating of circuit boards, electrical contacts etc., provides a solution to the
conductivity of the metals. However there are many new emerging areas of
applications that could benefit from this methodology.

22
This study has attempted to use different combinations of smootheners in order to find
the use and effectiveness of other types of smootheners that can be used in the recovery
of copper. Many authors have reported the use of bone glue, inorganic salt and organic
compounds as combination of smootheners (Yamamoto et al., 2002; Fthenakis, 2003;
Veilleaux et al., 2003; Yousef et al., 2004; Voros, 2006). The use of the combination of
smootheners depends on the cost of such materials. A combination of Bone Glue,
Thiourea and Sodium Chloride would cost differently from that of EDTA, Bone Glue
and Sodium Chloride. The most popular combinations have been the organic Thiourea,
Bone Glue and Sodium Chloride.
This research attempted to study the effects of other combinations such as Thiourea, K-
Glue, and Sodium Chloride; Thiourea, B-Glue and Sodium Chloride; EDTA, B-Glue
and Sodium Chloride and so on. The use of such combinations was meant to find a
way of reducing the nodulation problem. Gum Arabic has been used in studies
elsewhere (Gurmen et al., 2004; Srinivasan and Bommaraju, 2006:93-186). In this
study it was used as one of the smootheners in conjunction with the current inhibiting
types (Thiourea and EDTA). It was also used in conjunction with the salt in order to
determine its effect on the current density and current efficiency. Since most glue are
manufactured from cellulose of trees Gum Arabic is a product from trees grown in
North of Africa.
2.5 Summary
Copper refining by electrochemical reaction is one of the very important components in
the production of high quality metals in the mining industry and other small-scale
ventures. Electrical power is the driving force for the ions. The recovery of copper is
by reductive and oxidative mechanism which is second order. The conductivity of ions
is electrolyte and temperature dependent. The thermodynamics of the system allows
heat loss from the reactor by conduction, convection and radiation. The stability and
efficiency of electrochemical process depends on the type and properties of electrolyte
and the type and concentration of additives which provide economic benefits.
23
CHAPTER 3
REVIEW OF ELECTROCHEMICAL ENGINEERING
3.0 Introduction
The reaction of atoms using the exchange of electrons is the mystery that resulted in the
birth of electrochemistry and electrochemical engineering. Just as chemistry is the basis
for chemical reaction engineering, electrochemistry is synonymous with
electrochemical reaction engineering. The movement of the atom from solution or from
one metal to the other, of the same material, without the application of an external
voltage is not possible because a cell that is in equilibrium remains in equilibrium
forever. The application of external voltage is the key factor in the deposition of the
metal from the anode to the cathode or from solution to the cathode as the case may be.
The mass transfer through migration, convection and diffusion in electrochemical
reactors is the result of the applied overvoltage. This chapter dwells more on these
issues including the problems of nodula tion and the use of smootheners to reduce the
occurrence of nodules during electrochemical operations.
3.1 Electrochemistry
Electrochemistry deals with the study of mutual conversion of chemical and electrical
forms of energy (Antropov, 1972:22). It deals with reactions that proceed at the
expense of electrical energy. The basic features of electrochemistry are the ionic
interactions i.e. the way the ions affect each other when in solution because of the
nature of electrolytes. The ion- ion and ion-solvent interactions, which can result in the
evolvement of dissociation, solvation, and solution is one of the key features. The
interaction, called ionic activity, is dependent on the chemical and electrochemical
potential. The ionic activity can be evaluated using the Debye-Huckel theoretical
model (Crow, 1994:16). What is also significant in ion interactions is the ability of
electrolytes to ionise, dissociate and associate when in solution. The association can be

24
determined from the Bjerrum Equation (Crow, 1994:19). The conductivity of ions is
key characteristic in the classification of electrolytes. The weak, incompletely
dissociated electrolytes exhibit low dissociation values and hence give low conductivity
values. The strong, completely dissociated electrolytes exhibit high dissociation values
and hence give high conductivity values. The movement of ions due to the applied
potential by migration and diffusion, both of which are mass transfer processes, result in
the generation of flux of ions flowing towards the electrodes. An interface is created
near each electrode, which allows the diffusion and migration of ions to the electrodes.
The interface is shown in Figure 3.1.
Figure 3.1: Electrochemical reactor with metal-electrolyte interfaces
There are various types of interfaces whose magnitude is a function of composition and
the nature of the phase. For example, metal/metal, metal/electrolyte,
electrolyte/electrolyte, and solution/membrane/solution are some of the interfaces that
form part of half-cells. The reactions that take place in cells, i.e., a pair of electrodes,
are driven by electric potential. If the electric potential is removed across the anode-
cathode pair of the reactor then the anode-cathode pair reverts to equilibrium. If the
external load is attached to the anode-cathode pair dipped in electrolyte then the
chemical potential is converted into electrical potential, which is used to drive the
external load. If the external load is removed and the external electric potential is
reapplied then the chemical reaction is driven to increase the chemical potential, a
process called charging, to make available more energy for use by the external load.
The potential developed by the anode-cathode pair is electrolyte and electrode material
dependent. Different pairs of electrodes give different potentials in different

25
electrolytes. Barrow (1979:625-626) has listed values of potentials developed by
different pairs of electrodes in different electrode-electrolyte systems.
When the cell reactor is in equilibrium its potential across the electrodes can be
determined from the Nernst Equation as shown in equation (3.1) where K is the
equilibrium constant. If the equilibrium constant is large then the value of the cell
potential would be low. If it is small then the cell potential would be large. Since the
equilibrium constant is dependent on the concentration of reactants and products, the
reaction dDcCbBaA +=+ would yield a large constant only when the reaction favours
products. For example, equation (3.2) shows how the concentrations can be used in
place of the equilibrium constant in the evaluation of cell potential in the Nernst
equation as described in Antropov (1972), Skoog and West (1976) and Crow (1994).
When the values of [C] and [D] are large compared to values of [A] and [B] then the
value of InK would be large and therefore the cell potential would be low. This is why
the use of external potential is necessary to help maintain the driving force and the
continuous supply of cations into solution.
InKzFRTEE o )/(−= (3.1)
)][]/[][]([)/( badco BADCInzFRTEE −= (3.2)
The electrode potentials in terms of the activities of ions in electrolyte can be
determined from equation (3.3) for the anode and (3.4) for the cathode, which is a
replacement of the concentration terms in equation (3.2). A plot of the natural
logarithm of the activities versus the anode potentials at different isothermal
temperatures can lead to the description of the behaviour of electrode potential with
temperature. It can also provide information on the effect of temperature variations on
the current efficiency.
++= azFRTEE oaa ln)/( (3.3)
26
−+= azFRTEE occ ln)/( (3.4)
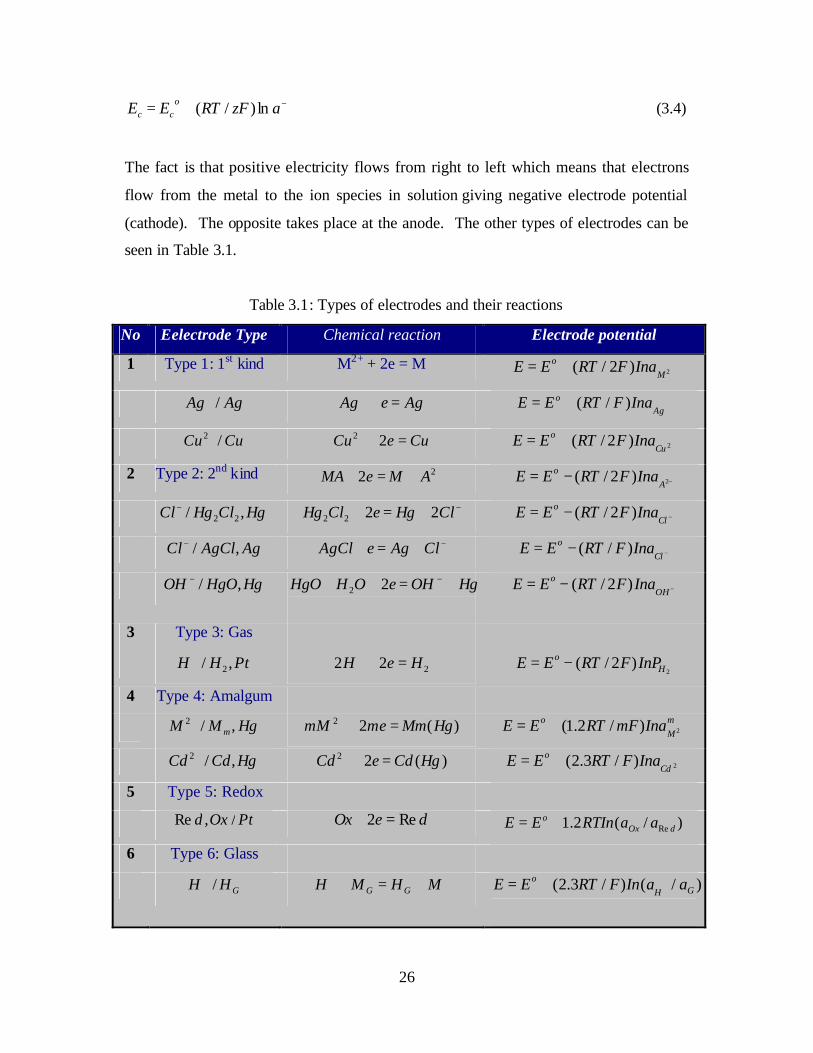
The fact is that positive electricity flows from right to left which means that electrons
flow from the metal to the ion species in solution giving negative electrode potential
(cathode). The opposite takes place at the anode. The other types of electrodes can be
seen in Table 3.1.
Table 3.1: Types of electrodes and their reactions
No Eelectrode Type Chemical reaction Electrode potential
1 Type 1: 1st kind M2+ + 2e = M ++= 2)2/(
Mo InaFRTEE
AgAg /+ AgeAg =++ ++=Ag
o InaFRTEE )/(
CuCu /2+ CueCu =++ 22 ++= 2)2/(Cu
o InaFRTEE
2 Type 2: 2nd kind ++=+ 22 AMeMA −−= 2)2/(A
o InaFRTEE
HgClHgCl ,/ 22− −+=+ ClHgeClHg 2222 −−=
Clo InaFRTEE )2/(
AgAgClCl ,/− −+=+ ClAgeAgCl −−=Cl
o InaFRTEE )/(
HgHgOOH ,/− HgOHeOHHgO +=++ −22
−−=
OHo InaFRTEE )2/(
3 Type 3: Gas
PtHH ,/ 2+ 222 HeH =++
2)2/( H
o InPFRTEE −=
4 Type 4: Amalgum
HgMM m ,/2+ )(22 HgMmmemM =++ mM
o InamFRTEE ++= 2)/2.1(
HgCdCd ,/2+ )(22 HgCdeCd =++ ++= 2)/3.2(Cd
o InaFRTEE
5 Type 5: Redox
PtOxd /,Re deOx Re2 =+ )/(2.1 Re dOxo aaRTInEE +=
6 Type 6: Glass
GHH /+ ++++ +=+ MHMH GG )/()/3.2( +
++= GHo aaInFRTEE

27
There are various types of electrodes, depending on the material used, which have a
characteristic chemical reaction. The types include whether it is of the First kind,
Second kind, Glass type, Gas type, and mercury composite called Amalgam, Redox and
Glass electrodes. Each electrode behaves according to the chemical composition
making such an electrode.
The system that has been chosen for the study is a Cu/Cu2+/Cu, which falls under Type
1, the electrode of the first kind. The electrodes are easy to make and the electrolyte is
readily available. There is a general similarity in the entire electrode systems described
in Table: 3.1. The general similarity is that there is a metal to act as electrode and
electrolyte to provide the much-needed ions that are used during the exchange of
electrons in order to produce the desired effect. The Nernst equation given by equation
(3.1) can be applied to any of the systems. Therefore electrochemistry is the basis for
electrochemical engineering. It provides the fundamental principles on which chemical
engineering unit operations of mass transfer that includes migration, diffusion and
convection, are constituted. A list of the examples of such electrodes can be seen in
Table: 3.1 below.
3.2 Kinetics of Cells
The reaction rates at the anode and cathode are potential and temperature dependent.
The rate of oxidation and reduction are given by equations (3.5) for the anode and
equation (3.6) for the cathode. The rate is dependent on the concentration of Cu2+ ions
(C+) in the case of the cathode and oxidizing species C- as in the case of the anode. The
geometry of the reactor is assumed to have no effect on the reaction which is assumed
to be unidirectional.
−= Ckr aa (3.5)
+= Ckr cc (3.6)
28
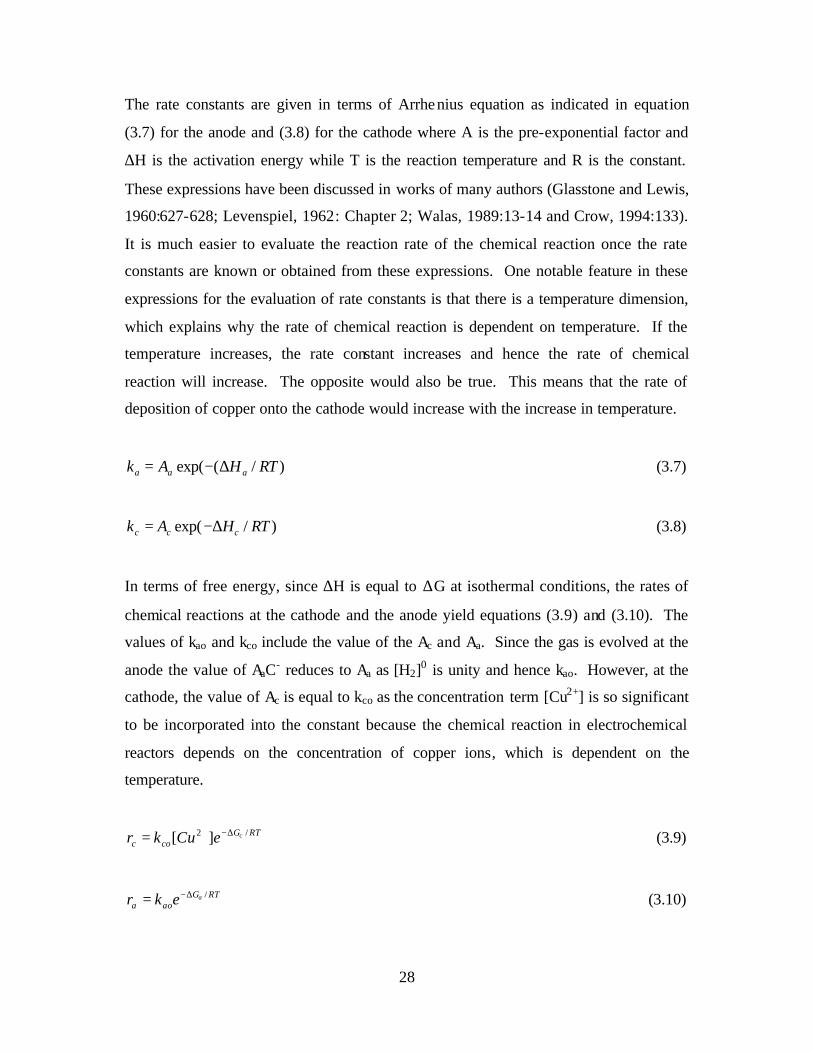
The rate constants are given in terms of Arrhenius equation as indicated in equation
(3.7) for the anode and (3.8) for the cathode where A is the pre-exponential factor and
∆H is the activation energy while T is the reaction temperature and R is the constant.
These expressions have been discussed in works of many authors (Glasstone and Lewis,
1960:627-628; Levenspiel, 1962: Chapter 2; Walas, 1989:13-14 and Crow, 1994:133).
It is much easier to evaluate the reaction rate of the chemical reaction once the rate
constants are known or obtained from these expressions. One notable feature in these
expressions for the evaluation of rate constants is that there is a temperature dimension,
which explains why the rate of chemical reaction is dependent on temperature. If the
temperature increases, the rate constant increases and hence the rate of chemical
reaction will increase. The opposite would also be true. This means that the rate of
deposition of copper onto the cathode would increase with the increase in temperature.
)/(exp( RTHAk aaa ∆−= (3.7)
)/exp( RTHAk ccc ∆−= (3.8)
In terms of free energy, since ∆H is equal to ∆G at isothermal conditions, the rates of
chemical reactions at the cathode and the anode yield equations (3.9) and (3.10). The
values of kao and kco include the value of the Ac and Aa. Since the gas is evolved at the
anode the value of AaC- reduces to Aa as [H2]0 is unity and hence kao. However, at the
cathode, the value of Ac is equal to kco as the concentration term [Cu2+] is so significant
to be incorporated into the constant because the chemical reaction in electrochemical
reactors depends on the concentration of copper ions, which is dependent on the
temperature.
RTG
cocceCukr /2 ][ ∆−+= (3.9)
RTG
aoaaekr /∆−= (3.10)

29
At the equilibrium, the rates are equal, i.e., ca rr = . Therefore, equating equation (3.9)
to equation (3.10) gives equation (3.11), which makes the rates of the reaction at the
anode and cathode to be equal. This is an important aspect of the electrochemical
reactions since the depletion of copper ions in electrolyte can result in the reduction in
ion concentration which could result in the increase of the operating current and hence
overvoltage. Such increases could bring about the rise in temperature due to increased
generation of heat energy, which is associated with the reduction in current efficiency.
A steady rate of dissolution of copper at the anode accompanied by steady deposition of
copper at the cathode would maintain a steady concentration of electrolyte.
)/exp()/exp(][ 2 RTGkRTGCuk aaocco ∆=∆−+ (3.11)
If equation (3.11) is rearranged then equation (3.12) is obtained which leads to equation
(3.14). In order to reach equation (3.13), we revert to the Arhenius expression for the
value of the rate constant (k) at each electrode. This reduces the numerator to ][ 2+Cuk .
Then by taking natural logarithms on both sides of the equation, equation (3.13) is thus
obtained. In both the equations (3.12 and 3.13), the dependence of copper ion
concentration in electrolyte on the overvoltage or overpotential is significant. It is the
overvoltage that drives the ions in electrolyte in order to effect the deposition of the
metal onto the cathode.
}/exp{}/exp{])[/( 2 RTzFERTGCukk aoco =∆−+ (3.12)
][}/{)/( 2++= CuInkkInRTzFE aoco (3.13)
We can also observe in equation (3.13) that multiplying throughout by zF and dividing
throughout by RT yield equation (3.14) which again shows the dependence of potential
on the concentration of ions or the dependence of ions on overvoltage as the reaction
proceeds. Equation (3.14) leads to a very important expression, the Nernst equation as

30
indicated earlier in equations (3.1), (3.3) and (3.4), when the term containing the rate
constants is taken as E0 to give equation (3.15).
][)/(}/{)/( 2++= CuInzFRTkkInzFRTE aoco (3.14)
][)/( 2++= CuInzFRTEE o (3.15)
The free energy at the cathode and the anode, as indicated in equations (3.11) and
(3.12), are used to effect the reduction and oxidation at the cathode and anode
respectively. The free energy is the energy the system produces after doing some
amount of work. It is a function of work. That means that the amount of energy that
can be converted into work corresponds to the free energy of the reaction system
(Antropov, 1972:540-541). In electro-chemical engineering, the work is the result of
the passage of current by the overpotential that drives the metal ions from the anode
into solution to the cathode where they are deposited. Their values can be obtained
from a number of equations. Specifically, the magnitude of such free energy is given
by equations (3.16) and (3.17). In these equations, according to Crow (1994:135), the a
is the transfer coefficient and the overvoltage plays two roles. Part of it (a fraction a) is
used to assist the cathode process while the other fraction (1- a) retards the anode
process.
)( oocc EEzFGG −+∆=∆ α (3.16)
)()1( ooaa EEzFGG −−+∆=∆ α (3.17)
The reaction rates can also be expressed in terms of the free energy of the system as
represented by equations (3.18) for the cathode and (3.19) for the anode. These
equations show how the free energy contributes to the chemical reaction in the reactors.
The small increase in free energy would result in a small increase of the reaction rate.
On the other hand, if the free energy increase were large then the reaction rate would

31
increase which would increase the rate of deposition of the metal at the cathode and the
rate of dissolution of the metal at the anode as the desired effects.
}/)]([exp{][ 2 RTEEnFGCukr occc −−∆−= + α (3.18)
}/)]()1([exp{ RTEEnFGkr oaaa −−−∆−= α (3.19)
Since E-Eo is the overvoltage or over-potential (η) at the respective electrodes, the
overvoltage has, therefore, an effect on the reaction rate of the systems at the two
electrodes. The rate constants can also be expressed in terms of potential as represented
by equations (3.20) for the anode and (3.21) for the cathode respectively. The
determination of the overvoltage and temperature would then lead to the evaluation of
the rate constants and hence the rates of reaction at the electrodes. This would lead to
the evaluation of the rate of reaction for the cell reactor.
}/)]()1([exp{1 RTEEnFHAk ooaaa −−−∆−= α (3.20)
}/)]([exp{1 RTEEnFHAk ooacc −−∆−= α (3.21)
Therefore the rate constants ka1 and kc
1 can be determined based on the initial values of
ka, kc, E and Eo in equations (3.22) for the anode and (3.23) for the cathode where E-Eo
is the over-potential or overvoltage (η). The over-potential across the cell comprises the
contributions of resistance, activation and polarization over-voltages. Koryta and
Dvorak (1987:262) argue that the passage of current in the cell results in electrodes
attaining different values of electrode potentials and this creates pola risation. The
degree of polarisation is defined in terms of overvoltage, which is equal to the electrode
potential (E) minus the equilibrium potential (E0) of the same electrode ( 0EE −=η ).
The value of the transfer coefficient (α) is taken as 0.65 at the cathode and 0.35 at the
anode when z is unity. However, when z>1 it is better to use α at the cathode and (1-α)
at the anode since the sum of values of α at the anode and cathode is not unity.

32
}/)()1(exp{1 RTEEzFkk oaa −−−= α (3.22)
}/)(exp{1 RTEEzFkk occ −−= α (3.23)
According to Antropov (1972:335-336) the overpotential can be understood by
assuming that the overall electrode reaction to which there corresponds the reversible
potential involves chemical steps. The chemical steps in cell reactors are the dissolution
of the anode and the deposition on the cathode. Heitz and Kreysa (1986:101,214),
Pletcher and Walsh (1993:75-78), and Crow (1994:143-147) have also provided full
explanations of the role of the overvoltage in electrochemical reactions. Equations
(3.24) and (3.25) give the cell voltages (Vcell and Ecell) in relation to the electrode
overvoltage as described in Heitz and Kreysa (1986:101) and Pletcher and Walsh
(1993:75) respectively. More of electrochemical kinetics is covered in Vetter
(1967:117-119.).
∑+++= IRVV caocell ηη (3.24)
circuitcellaccell IRIREEE −−−= (3.25)
Heitz and Kreysa (1986:100-101) have alluded to the fact that the cell overvoltage can
be divided into several contributing parts; the ohmic potential drop at the electrode-
electrolyte interface consisting of the equilibrium potential (Eo) and the overvoltage (η),
the diffusion overvoltage (ηd) in the diffusion boundary layer on the electrode surface,
the ohmic potential drop in electrolyte, the activation energy (EA) and the potential rise
at the other electrolyte-electrode interface as is indicated in Figure 3.2. These potentials
act together in order to realign the ions in the direction required.
The kinetics of electrode processes can be considered in two dimensions: the current-
limited control and mass transport control. At the current-limited control, i.e. constant

33
current, the change in concentration is given by equation (3.26). The change in
concentration is current and time dependent. The increased time would induce an
increased drop in concentration. Because of such effect it would be reasonable to
operate the reactor with constant concentration in order to minimise the effects of
increased overvoltage and current on the current efficiency. Effects such as increased
heat generation; resistance and the associated temperature rise have a negative effect on
the efficiency of the reactor.
IdtzFVdm }/{Φ= (3.26)
Figure 3.2: Electrochemical reactor with regions of energy generation
The rate of chemical reaction (rc) can thus be determined from equation (3.27), which
shows that it is concentration and time dependent. It is also dependent on the Current
(I). As the concentration drops, the rate of chemical reaction reduces until when the
current and overvoltage increase in order to drive more ions into solution so as to
balance up the driving force. The effect would be increased current and overvoltage
that would result in irregular deposition on the cathode. The material balance for the
system can be represented by equation (3.28) as described in Fogler (1986:8-10) and
Levenspiel (1962:101-103). The material balance is a form of conservation law which
takes into account what goes in and what comes out of the system.
IzFVdtdCrc )/()/( Φ== (3.27)
34
)/( dtdNrdVFF Ao =+− (3.28)
3.3 Temperature and Energy
During electrolysis, some of the electrical energy is converted into heat energy. The
heat energy causes the temperature of the electrode and cell electrolyte to rise. The rise
in temperature can result in overheating which causes the gas to evolve at the electrode.
The evolution of gas causes the irregular deposition of the metal thereby rendering the
surface to become rough. A rough surface causes irregular distribution of current
density on the electrode. The overall effect is the development of passivating sites,
which contribute to reduced deposition of the metal and hence reduced current
efficiency. The current efficiency can respond to changes in temperature in two ways.
Firstly, it can decrease with the increase of temperature in which case cooling the
electrolyte can be the solution to the problem or secondly, it can increase with
increasing temperature. In the second case, it might be necessary to determine the
optimum temperature so that the cell electrolyte does not decompose with rise in
temperature.
The rise in temperature increases the dissociation of the electrolyte, i.e., allows the
formation of more ions in solution and at the same time increases the solubility. The
increase in the number of ions can produce an increase in current flow which could
increase the deposition rate that may then render the reactor to operate at reduced
concentration, which could result in overheating. The cost of electrolysis would
increase when the system uses high overvoltage and current density, which would result
in increased heat generation in the system. Equation (3.29) shows the correlation
between the heat energy (Q) and the cell voltage (V) and the current (I). Since the
reactor is operated at steady state, the heat flow from the cell is equal to heat generated
by the cell.
)( nc VVIQ −= (3.29)

35
It is obvious that when the temperature is increased in the cell, the cell resistance would
decrease and hence the cell overvoltage required to drive the ions in solution would
increase since more ions would form at high temperature. This would then increase the
heat generation in the reactor. It is also obvious that the cooling of the system would
increase the operational cost. Equation (3.30) relates the cost of cooling (C) to the
period of operation (t). Increased periods result in increased costs as the coolant (m)
removes more and more heat energy from the system.
pmtC = (3.30)
The energy cost can be evaluated in terms of energy consumption (E) and the unit
energy price (PE) as indicated in equation (3.31). The higher the energy consumption
the higher would be the production cost. Similarly, the higher the unit price of energy
the higher would be the production cost. Therefore, there would be a response to the
high unit price of energy by instituting cost saving measures that would allow the high
unit price to have less or little impact on the profits. There are a number of ways in
which the energy consumption would increase. Firstly, the operation of the reactors at
temperatures higher than the normal operating conditions, a situation that could occur
when the monitoring regimes are relaxed or faulty as is the case where the temperature
control systems fail. The other way is when the plant demand increases. Increased
capacity and resistance in the reactors can increase the demand for energy. Here the
forces of demand and price could play a key role in the management of energy. Most
importantly, the optimisation of the process would reduce the cost of energy.
ee EPC = (3.31)
The heat flow from the cell to the surrounding can be evaluated using equation (3.32).
In this equation the temperature difference and the values of the mass (m) of the
cooling-process streams determine the magnitude of the heat flow from the reactors. If
large amounts of process streams are used then the value of heat energy (Q) will
increase. The opposite will also be true. On the other hand, the larger the difference in

36
temperature, the larger the increase on the value of heat flow and vice versa. Since the
chemical reaction is more efficient at the normal operating conditions, the operation of
the reactors at other temperatures would result in the reduction in efficiency of the
reactors. The operation of the reactor at temperatures above 70oC would damage the
properties of the materials being used such as glue whose structure would break down
into pieces and therefore would not be able to provide the function it is intended to do
during electrorefining. Most importantly is the current efficiency, which would be
affected if the chemical reaction is not efficient. In the same token, the non-cooling of
the process stream in order to maintain a stable operating temperature would equally
result in the reduction of efficiency since the poorly-removed heat energy would result
in further increase of temperature which would then result in the instability to set in the
system.
)( iop TTmCQ −= (3.32)
The time for the reaction can be calculated from Faraday’s Law as shown in equation
(3.33) but the direct relationship between the current density and the temperature and
the current efficiency requires investigation since the literature review has not revealed
any model of the variation of temperature with current efficiency.
IdtzFMdm Φ= )/( (3.33)
The cell resistance of the system is given by equation (3.34) or using Ohms Law
( IRV = ) where V is Voltage, I is the current and R is the resistance.
1)}298(1{ −−+= co TRR α (3.34)
2
cc cTbTa +−=Φ (3.35)
The effect of temperature on the current efficiency can thus be investigated using
equation (3.35) or data exploration method. For the electrochemical system, the change

37
in work (dW) is equal to the change in heat energy (dQ) and this is related to electrical
energy generated as a result of the application of overvoltage. According to Antropov
(1972:25-29), the work energy, the heat energy and the Gibbs free energy, if electrical
in nature, will be equal to zFE. Equation (3.36) shows such a relationship. However,
due to heat effects, the values will be different at different temperatures as shown by
equation (3.37), which is the Gibbs Helmholtz equation. This equation yields the same
values for constant volume and constant pressure systems that are reversible at
isothermal conditions. The cell potential can thus be obtained by dividing equation
(3.37) with zF to give equation (3.38).
∫ ∫∫ === dEzFQdGdW (3.36)
}/{ TEzFTQzFE ∂∂+= (3.37)
}/{)/( TETzFQEcell ∂∂+= (3.38)
3.4 Diffusion of Ions in cells
Diffusion is defined in different ways depending on the area in which it is applied. In
Physics, it is defined as the spontaneous movement and scattering of particles (atoms
and molecules) of liquids, gases and solids while in the Electrical environment it is
defined as a method of producing a junction by diffusing an impurity metal (Lapedes,
1978:451). Diffusion in liquids, which comprises positive and negative ions or
molecules, results in the generation of chemical potential (Coulson and Richardson,
1991:873). This link is in agreement with that described in Crow (1994:12, 51) as
expressed in equations (3.39) and (3.40).
zFdEdCCVdPd +∂∂+= )/( µµ (3.39)
zFERTInao ++= µµ (3.40)

38
The diffusion of molecules has been cited in Coulson and Richardson (1991:507,
1996:495-496). Coulson and Richardson (1991:819) further argue that the diffusion
potential in liquids is created when a film of molecules forms near the cathode. The
circumstances under which this could happen is when there is an electrostatic layer of
charged molecules, which interacts weakly with the cathode. The diffusion potential
arising from the electrostatic differences and the driving force accelerate the ions
towards the cathode. The ions then diffuse through the electrostatic layer when the
overvoltage is applied across the reactor. Inhibitors are thought to form a film of ions
near the cathode and the cations are allowed to diffuse through such a layer in order to
hit the cathode where they are deposited. The diffusion flux of ions from the electrodes
into solution and vice versa can thus be modelled as described in Koryta and Dvorak
(1987), Coulson and Richardson (1996:504) and Bruce (1995) using Ficks Law of
diffusion as expressed by equation (3.41).
)/( dxdcDJ diff −= (3.41)
Fick’s Law describes regions of high and low concentrations of ions. It means that the
flux of ions is driven from regions of high to regions of low concentrations. The
cathodes in electrochemical reactors act as sinks where the cations are sunk into solid
and therefore the cathodes act as regions of low concentration. It also means that the
cathodes are regions of low electrochemical potential. Thus spontaneous movement of
ions, according to Crow (1994:51), will take place from regions of high to regions of
low electrochemical potential. The rate of movement of ions is governed by the
gradient )/( x∂∂µ , which is proportional to the rate of movement (v) as is expressed in
equation (3.42). The cation has to be driven by the gradient if it has to move the
distance x. That is that the rate of movement is dependent on the chemical potential (µ).
)/( xkv ∂∂= µ (3.42)
The rate of movement of ions as flux (Jdiff) can be obtained from equation (3.43). It is
important to note that the diffusion of ions in electrolyte is temperature dependent. The

39
flux can further be expressed according to equation (3.44) since the flux is also equal
to iii vcdtdn =/ .
)}/()/({ xEFzxIncRTkJ iiidiff ∂∂+∂∂= (3.43)
)}/()/({ xEFzxIncRTckJ iiiidiff ∂∂+∂∂= (3.44)
The above equations reduce to Ficks Law of diffusion when the gradient (∂E/∂x) is
zero. The driving force, when the potential gradient is zero, is the concentration
gradient and therefore equation (3.44) reduces to equation (3.45), since the numerator
term (∂Inc) changes to the new term (∂c) thus giving the Fick’s Law of diffusion (Crow,
1994:52).
)/( xcRTkJ idiff ∂∂= (3.45)
The value of diffusivity (Di) is equal to kiRT and the constant (ki) is equal to Di/RT.
The longer the distance (x), the smaller the gradient and the lower would be the flux. In
order to create a large flow of flux, a smaller value of ∂x is required. When the
concentration gradient is zero the flux can be expressed in terms of potential as shown
in equation (3.46) where the values of c1, c11 and d1 are given by iii zck , Fzc ii and
RTDi / respectively.
)/()/( 1111 xEdcxERTcJ diff ∂∂=∂∂= (3.46)
The charge that is passed through electrolyte, due to the flux, can be determined from
equation (3.47). The conductivity of the ions can be expressed in terms of the charge (I)
and the field strength (Fs) represented by the gradient (∂E/∂x) as indicated by equation
(3.48).

40
)/(221 xEFzdcFJzI iidiffi ∂∂== (3.47)
11)/( −− =∂∂= sIFxEIκ (3.48)
On the other hand when the concentration gradient is zero then the flux (Jdiff) exhibits
linearity with the potential gradient for a single component ion (i) as is indicated in
equation (3.49). The value of the constant (ki) can be replaced by its equivalent value
d1. It can be observed that the equation reduces to Fick’s Law when it is expressed in
terms of potential. It can be observed also that the longer the distance (x) the smaller
the gradient (∂E/∂x) and the weaker will be the flux of ions. In order to conduct
electrolysis effectively, a stronger flux is required and this can be obtained when the
distance (x) between electrodes is small.
)/()/(1 xEzcDxERTzcdJ iiiiidiff ∂∂=∂∂= (3.49)
The flow of flux from either the solution to the cathode as in electrowinning or from the
anode to the cathode as in electrorefining, by the mechanism of diffusion, contributes to
the mass transfer of the metal using the cathode collection mechanism. Each of the
laws of diffusion by Stefan and Plank contribute to the transport of the metal from
electrolyte to the cathode as described by Fick’s Law (Coulson and Richardson, 1996).
3.5 Convection of Ions between Electrodes
The convection of ions in cell reactors can be defined, according to Koryta and Dvorak
(1987:86), as the transport of streaming in the system produced by the action of external
forces. Pletcher and Walsh (1994:132) define the convection as the movement of
species of ions due to mechanical force. The external force which is usually mechanical
in nature as a result of stirring or flow due to pumping of electrolyte drives the ions to
the electrodes. In non-stirred systems the convection is absent and the ions move by
diffusion and migration forces. It means that the use of batch systems may require
stirring in order to create convective mass transfer while the use of Plug Flow Reactor

41
(PFR) relies on the convective currents created by the pumping of electrolyte. For
example, the rotating disc reactor creates convection currents by the rotating action due
to the torque applied on it by the motor.
The modelling of the transport of ions by convection is based on Fick’s Second Law.
Since both diffusion and convection take place at the same time, the model is thus
modified to include the convection component as shown in equation (3.50). The change
of concentration of ions with time is thus defined where the term { }22 / dxcdD ii and
{ }dxdcv i / are the diffusion and convection components respectively.
)/()/(/ 22 dxdcvdxcdDdtdc iiii −= (3.50)
The flux of ions make available to the electrodes the ions required for the reduction or
oxidation as given in equation (3.51) which conforms to Fick’s first Law of diffusion.
)(62.0/ 122/16/13/2 ccVDdyDdcJ conv −=−= − ω (3.51)
The convective flux can also be defined by equation (3.52) where (v) the number of
ions and the concentration of component (i) is represented by ci. The value of vi is
given by 22/32/151.0 xv ων −= . When the reactors are operated at steady state, the
diffusion is equal to convective flux and equation (3.52) is reduced to equation (3.53).
ivcJ = (3.52)
)/()/( 22 dxdcvdxcdD iii = (3.53)
3.6 Migration of Ions between Electrodes
Migration is defined as the movement of cations and anions through a solution under
the influence of applied potential between electrodes placed in that solution (Crow,

42
1994:132). Pletcher and Walsh (1993:18) defines it as the movement of charged ion
species due to the potential gradient. The two definitions show similarity in that they
both refer to the potential that is used to drive the ions in the electrolyte. In order to
understand the concept of migration of ions in the electrolyte, the salt of the electrolyte
must dissociate to some degree when dissolved in solution so that the ions so formed
(negative and positive) must respond to the applied potential or the electric field. The
response to the electric field is the independent movement from regions of high to
regions of low potential. The positive ions move to the cathode independent of the
negative ions. The independence of each ion type is inherent in the type of electrolyte
and hence different electrolytes exhibit different strengths of ions when they dissociate
in solution. The Law of Independent Migration (LIM) of ions in the electrolyte also
known as the Kohlausch Law of Independent Migration (KLIM) represented by
equation (3.54) demonstrates the importance of the contribution of ion species in the
electrolyte. The conductance of the electrolyte is the sum of the contribution of the
positive and negative ions. In order to quantify the charge, we need to know the
number of moles of the ions (n+) for the cations and (n-) for the anions so that the
conductivity, according to LIM or KLIM, is then determined from equation (3.55).
oo
o −+ +=Λ λλ (3.54)
oo
o nn −−
++ +=Λ λλ (3.55)
In order to model the movement of ions we assume the velocities (v+) and (v-) for the
cations and anions respectively and that the ions travel a distance (L) between two
points through an area (A) as is shown in Figure 3.3.
Figure 3.3: Migration model for the ions in electrolyte
43
Given this scenario, there exists between the electrodes an electric field gradient in the
electrolyte. The potential gradient created by the electric field results in a force that
develops a velocity (v+) and (v-) for the cations and anions respectively. The relation
between the electric field and the potential gradient is shown in equation (3.56).
LEdLdE // ∆=−=Φ (3.56)
The movement of each component ion (i), by the electric force (Fe), given by equation
(3.57), is in the direction parallel to the electric field. The friction force (Fs), given by
equation (3.58), is thus created which retards the movement of the ions. In order to
overcome the friction force the electric force must be greater.
Φ−= ie qF (3.57)
iif vkF = (3.58)
The acceleration of the ions as a result of the imbalance between the electric and the
frictional forces is dependent on the mass of the ion. The force acting on the ion can
then be quantified according to Newton’s Law of motion as indicated in equation
(3.59).
iiiii vkqam −Φ= (3.59)
Since the acceleration is the rate of change of velocity as indicated in equation (3.60),
therefore equation (3.60) can be substituted in equation (3.59) to give equation (3.61).
22 // dtLddtdva ii == (3.60)
dLqdLvkdLdtLdm iiii Φ=+)/( 22 (3.61)

44
Equation (3.61) can further be simplified to give equation (3.62) from which an
important conclusion is drawn. The electric force )( dLqiΦ is used to develop the
kinetic energy )( 21
iivmd in the ions and overcome the frictional force )( dLvk ii in order
to deliver the ions to the electrodes where their fate is determined either by being
deposited as metal or discharged as a gas to the atmosphere.
dLqdLvkvmd iiiii Φ=+)( 21 (3.62)
The integration of equation (3.61) gives equation (3.63) for the general case, which is
another important equation of ionic migration in an electrolyte. The value of the term
e(-kt/m) is usually small and therefore can be neglected. Equation (3.63) thus reduces to
equation (3.64) for a single component ion.
}1){/( )/( mktekqv −−Φ= (3.63)
iii kqv /Φ= (3.64)
The velocities of cations and anions in the copper sulphate electrolyte can therefore be
determined from equations (3.65) and (3.66) where e1 and e11represent the ratios
++ kz / and −− kz / respectively in which k+ and k- are the friction coefficients for the
ions.
)/()/( 11 dLdEeLev −=Φ=+ (3.65)
)/()/( 1111 dLdEeLev −=Φ=+ (3.66)
We know that the factors; concentration, potential and temperature gradients, and
mechanical stirring affect the transport of ions by migration. The effects of these
factors have already been discussed in Chapter 2. But the dissociation of the salt of the
electrolyte is dependent on the temperature. The electrochemical potential (Eec) created

45
by the dissociation and migration of ions under an electric field due to the application of
the external potential (E) is related to the chemical potential (Ec) in equation (3.67). If
we include the concentration term (ci), the effect of concentration gradient on
electrochemical potential can be realised in equation (3.68).
FEzEE icec += (3.67)
FEzRTIncEE iicec ++= (3.68)
What this means is that there will be a spontaneous movement of ions from regions of
high to regions of low electrochemical potential as stated earlier. The rate of movement
of the ions as described in Crow (1994:51) is proportional to the chemical potential but
inversely proportional to the distance through which the ions migrate as given by
equations (3.69) and (3.70). It can also be said that the rate of migration depends on the
concentration and potential gradients.
)/( dLdEkv ecii = (3.69)
)}/()/({ dLdEFzdLdIncRTkv iiii += (3.70)
The flux of ions migrating to the electrodes can then be modelled over the area (A) and
through the distance (dL) to give equation (3.71), which obeys Ficks Law of mass
transfer.
)}/()/({/)/( dLdEFzdLdIncRTckvcdtdndLdzFJ iiiiiiimigr +===Φ−= (3.71)
In the reduction of positive ions, the transport is achieved by migration, convection and
diffusion but in the reduction of anions, the transport of ions to the cathode is achieved
by convection and diffusion and they are removed from the electrode by migration

46
(Antropov, 1972; Crow, 1994). Most reactors are operated under unsteady state due to
agitation but laminar conditions favour the yield in electrolytic reactors.
3.7 Mass Transfer in Cells
The transport in electrochemical cells is carried out in two ways; the transport of ions
and that of electrons. It is the movement of mass from solution to cathode in the case of
electrowinning and from the anode to the cathode in the case of electrorefining. The
solution close to the electrode surface is the critical element in mass transfer. When the
conditions are right, i.e., the material of the electrode and that of the electroactive solute
are compatible, then the transfer of electrons takes place according to the Frank-Gordon
Principle (Crow, 1994:132). The electron transfer takes place only when the two
compatible materials have electrons at the same energy level; a process called
isoenergetic electron transfer (Koryta and Dvorak, 1987:278). The transfer of electrons
accompanies the transfer of ions on the cathode and the release of the oxidised at the
anode. According to Faraday’s Law, the current passing through the electrode is
equivalent to the mass flux of the electroactive species (Koryta and Dvorak, 1987:289).
The mass transfer takes place when the electroactive species disappear in the electrode
reaction when acted upon by the current. This means that the current density (j) is
proportional to the mass flux (J) as described in equation (3.72).
zFJj = (general case) (3.72)
The relation at the cathode with the reduced species is given by equation (3.73) while
that at the anode is given by equation (3.74). The current density is thus related
according to the strength of the flux of the reduced and the oxidised.
dzFJj Re−= (3.73)
OxzFJj = (3.74)

47
When the value of the flux (J) for the reduced and oxidised are substituted in equations
(3.73) and (3.74) equation (3.75) is obtained which defines the mass transfer according
Fick’s Law of diffusion and migration of electroactive species in electrolyte at or near
the electrode when the distance of the interface (x) is zero. It also provides the
relationship between the current density and the concentration of electroactive species.
The change in concentration with time, as indicated by equation (3.76), gives the Fick’s
Second Law of diffusion as described in Pletcher and Walsh (1993:20-23).
00ReRe )/()/(/ == −== xOxOxxdd dxdcDdxdcDzFj (3.75)
)/(/ 22 dxcdDdtdc = (3.76)
One can therefore predict the relationship between the concentration and the distance
between electrodes. If the concentration decreases as the reaction proceeds then the
initial concentration is higher than that after the lapse of time. The comparison of the
reduced and the oxidised concentration shows that as the reduced increases, the
oxidised decreases. If the volume or mass lost at the anode is equated to the volume or
mass gained then the variations in volume can be given by )/( dtdVtrVV AAAo =+−
while that in terms of mass can be given by )/( dtdMtmMM AAAo =+− . Faraday’s
Law, according to Heitz and Kreysa (1986), can also give the rate of mass transfer as
)/()/( zFMIddm =θ . The rate of anodic dissolution of copper in phosphoric acid
above the potential where oxygen evolution takes place was studied in Sedahmed et al.
(1980). The variables investigated were oxygen discharge rate, phosphoric acid
concentration and electrode position. The mass transfer coefficient of the anodic
dissolution of copper in phosphoric acid was related to the oxygen discharge rate and
the physical properties of the solution. Copper was thus observed to move from the
anode into the solution and to the cathode. Copper can thus be deposited at the cathode
with no change in concentration of solution. Newton (1959) showed that the
electrolysis of metals undergoing electro-refining do not produce any change in
concentration and all cathode reactions result in the deposition of metal at cathode.
48
However, if the anode is not soluble, then the concentration can vary as more ions of
metal migrate and deposit at the cathode. The potential across the reactor will thus be
affected by changes in concentration.
In order to maximise the mass transport optimum conditions must be attained. The use
of high currents may cause overheating in the electrolyte, which may lead to uneven
potential distribution as described in Pletcher and Walsh (1993:110). The operation of
the reactor at a current that is less than that of the limiting value (I=IL) may result in the
reduction of current efficiency when changes in the electrolyte conditions occur. For
example, a decrease in electroactive species at the inlet of the reactor may result in the
current being greater than the limiting value, which may result in the birth of side
reactions. However the advantage of using high current density is that the reactor
performance is enhanced as evidenced by the increased fractional conversion and space-
time yield. The composition of the electrolyte in the bulk must be the same as that near
the electrode in order to avoid the depletion of the reduced at the interface. It is
important also to maintain uniform current at the electrodes in order to reduce the
secondary reactions and maintain the current efficiency and hence increased mass
transfer to the cathode. The control of the temperature allows the chemical reaction to
be fixed as the concentration of ions in solution is temperature dependent and so is the
dissociation of electrolyte.
3.8 Current Density and Overvoltage
The movement of fluxes results in the generation of and flow of current. The current
enables the anode to dissolve and to deposit metal at the cathode. If the area of the
anode is the same as that of the cathode, then the current per unit area, which is the
current density, will be the same for both electrodes (Newton, 1959). If the current is
reversed, then the chemical reactions at the electrodes will be reversed. Skoog and
West (1976) support this argument. They argue that cells that can reverse chemical
reactions are electrochemically reversible and that those that give different products

49
upon reversing current are irreversible. The reversing of current removes nodules on
the surfaces of electrodes.
If the systems behave according to Faraday’s Laws then the rate of reaction divided by
the charge that is used to react one-gram equivalent (zF) of the element becomes the
definition of the current density. The current density, the current per unit area of
electrode, plays a key role in electro-refining (Lapedes, 1978). It is caused by the
distribution of charges due to migration of electrons and ions. The current distribution
is not uniform in most practical situations and so is the current density. This is due to a
number of factors; the geometry of electrochemical reactors, conductivity of electrolyte,
electrode and concentration over-potentials, which are controlled by the circulation of
electrolyte and mass transfer of metal to cathode. The determination of current density
provides a means of assessing the optimum current densities that give best process
operating conditions. Over-potential is the difference between electrode potential and
equilibrium potential at the electrodes. The current density is limiting if it is
independent of potential over a large range. For example, if the current is uniformly
distributed, it is expected that the deposition of the metal will behave according to
Faradays Law that states that one gram-equivalent of a material is chemically altered at
each electrode for every 96,500 Coulombs passed through an electrolytic reactor
(Newton, 1959). The current densities at the anode and cathode have fully been
described in Crow (1994:133-137) and Subramanian and White (2000). They can then
be compared to measured values. Any increase in current density results in increased
voltage and therefore power consumption and capital costs are decreased due to reduced
electrode area (Heaton, 1986:137). This means that the electrode separation would have
to be reduced as much as is possible in order to maximize the current density and
efficiency.
Equation (3.77) is the starting point for the relation of overvoltage and current density.
The relation of reaction rate and current density is therefore linear. Any increase in
current density results in the increase in reaction rates. This means that increased
values of reactions rates would be obtained at increased values of current densities. By

50
the same token, increased values of deposited metal would be obtained at increased
values of current density.
zFjrc = (3.77)
The current density is a function of concentration, free energy and overvoltage.
Equation (3.78) shows the functionality of the terms concentration, free energy and
overvoltage at the cathode. When the free energy of the chemical reaction and the
overvoltage are increased the exponential term would increase and hence the value of
the current density would increase. In practice the increased overvoltages increase the
current density.
)/exp()/exp(][ 2 RTnFRTGCuzFkj cc ηα−∆= + (3.78)
The first exponential term can be denoted by a symbol (jo) and therefore equation (3.78)
reduces to equa tion (3.79) at the cathode. The value of the free energy is usually
smaller and therefore the current density is increased or reduced by the exponential
term, which includes the overvoltage. It is the overvoltage therefore that impacts the
current density at each electrode. The overvoltage is therefore a critical element in
maintaining a constant current density at the electrodes.
)/exp( RTnFjj oc ηα−= (3.79)
The above argument can be advanced at the anode also to give equation (3.80). As can
be observed in the equation, the overvoltage induces heat energy that causes an increase
in temperature. Increasing temperature may reduce the current density and hence
reduce the chemical reaction. The reduced chemical reaction may result in reduced
current efficiency. It is therefore important to investigate the effects of current density
and overvoltage in the evaluation of current efficiency.
51
)}/)1(exp{ RTnFjj oa ηα−−= (3.80)
By taking natural logs on both sides of (3.79) and (3.80) and letting the overvoltage as
the subject of formula, Tafel equations (3.81) and (3.82) for the cathode and anode
respectively can be obtained which give Tafel plots when j/jo is plotted against the
overpotential. The Tafel plots give an indication of how the ratios of the current
densities vary with overvoltage (E-Eo). The values of f1 and f11 are given by the ratios
zFRT α/ and zFRT )1/( α− respectively.
coo InjfInjfEE 11 +−=−=η (3.81)
aoo InjfInjfEE 1111 −+=−=η (3.82)
The current for the electrochemical reaction is introduced from the external power
supply, which provides the required overvoltage across the reactor including that which
is created due to formation and movement of ions to the electrodes. Each electrode in
the reactor receives the current. The current is then distributed on the entire electrode in
order to polarise them. The distribution of the current over the electrode area results in
the current density distribution over the area. The current is also an important element
in the operation of the reactors. At the cathode, the overvoltage drives it. Similarly, at
the anode, the overvoltage drives it. The current at the electrodes can be evaluated from
equations (3.83) for the cathode and equation (3.84) for the anode. In these equations, it
can be observed that any increase in overvoltage would result in an increase in current,
which would result in increased chemical reactions, and hence increased conversion that
would increase the current efficiency if and only if the temperature for the operation is
right.
)}/(exp{0 RTnFIIc ηα−= (3.83)
)}/)1(exp{0 RTnFIIa ηα−−= (3.84)
52
The difference between Ic and Ia, i.e., subtracting the value of current at the anode from
that at the cathode gives the net current at the cathode while the difference between Ia
and Ic, i.e., subtracting the value of current at the cathode from that at the anode gives
the net current at the anode.
3.9 Current Efficiency
The current efficiency (φ), the efficiency at which copper enters the electrolyte from the
anode, is a ratio of the weight of metal deposited to the weight of the metal that can be
theoretically deposited (Newton, 1959; Lapedes, 1976:392). It is slightly higher than
that of the cathode by about 0.5%. It can be determined from equation (3.85)
TMM /=Φ (3.85)
The current efficiency is usually affected by high current densities, which produce
passivity on the electrodes. Passivity is the non-deposition of copper on the electrodes
and the creation of pits due to exfoliating surface of the electrode. On the other hand,
low current densities are not effective in depositing metal on the cathode. It is
important to note also that the maximum value of current efficiency is 100%. However,
parallel deposition due to impurities can result in values exceeding 100% because
impurities in solution and anode tend to interfere with the deposition process. Therefore
the determination of current efficiency provides a guide on which to assess the
performance of the reactors. Equation (3.85) can further be defined according to
Faraday’s Law as the current based yield. According to Pletcher and Walsh (1993:73),
it is based on the charge (q) passed compared to theoretical charge (QT). Therefore
equation (3.86) defines the efficiency based on the charge and thus obeying the Law of
Faraday.
TQq /=Φ (3.86)

53
The charge passed through the electrolyte is dependent on the time. The longer the
time, the more the charge that can be passed and the more deposit of the metal can be
achieved. Equation (3.86) therefore provides the relationship between the charges used
to deposit certain mass of the metal to that that can be used to deposit the theoretical
amount according to Faraday. Equation (3.87) considers the valence and mass of the
metal deposited and the theoretical charge that would deposit one molecular weight of
the substance. The efficiency is also a function of concentration gradient or drop as
indicated in equation (3.87).
∫===Φ dCqzFVqmzFqMwzF )/(// (3.87)
The value of q can be calculated from equation (3.88). In this equation, the charge is a
function of current and time. At the value of current the time determines the amount of
charge passed. If there are impurities that have similar characteristics with the desired
metal to be recovered then it becomes difficult to account for the charge passed over the
specified time as some of it would be used to deposit such other metals. It would also
be difficult to account for the current efficiency. It is thus important to ensure that the
electrolyte used does not contain undesirable impurities.
∫= t
o
I
IIdtq (3.88)
As described in Antropov (1972:299-300) and Heitz and Kreysa (1986:218), the current
efficiency is also defined as the amount of current passing through a cell, which
accomplishes the desired-electrode reaction. The amount of electricity used to deposit
the metal on the cathode plus that used to liberate gas on the anode should be equal to
one gram-equivalent of the overall reaction. This means that the amount of electricity
liberating the metal at the cathode is not always the same as that that liberates the gas on
the anode. Antropov (1972:299) describes the reduction of zinc ions in acidified
solution of zinc sulphate to be 60% and that of the oxidizing hydrogen gas ions to be

54
40%. The total charge to liberate one gram equivalent would therefore be equal to
100%.
The current efficiency is affected by the distribution of current on the electrode. If the
distribution of the current (I) is uniform then it is possible to achieve 100% current
efficiency. If on the other hand the distribution is non-uniform then the current density
would be different at different points of the electrode-active area and therefore the
undesired-reduced current efficiencies can be obtained which may cause a number of
problems. According to Heitz and Kreysa (1986:54), the distribution of current density
may cause variations of thickness of deposited metal, non-uniform corrosion of
electrodes and poor energy efficiency. The current efficiency can also be assessed based
on whether the operation is at constant or varying concentration in which case we speak
of the Plug Flow Reactor (PFR) and Batch Reactor. In the case of a batch reactor, the
current efficiency can be evaluated from equation (3.89).
∫∫ −=−=Φ dtICCkFdtIaCCzF oeo /)(/)( (3.89)
The space-time yield (Yst) is also an important parameter in the evaluation of current
efficiency. If the mass (m) is deposited in time (t) in some volume (VR) of electrolyte
then the mass is directly proportional to the time but inversely proportional to the
volume of the electrolyte ( )/( Rst tVmY = ). The substitution of concentration and the
introduction of space velocity (u) yield equation (3.90).
)/()( tdCMCCuMY o =−= (3.90)
The rate of mass deposition of the substance is current-efficiency dependent and also
current dependent as shown in equation (3.91). The increase and decrease in current
would certainly increase and decrease the deposition rate respectively. The increase
and decrease in current efficiency would also mean that the deposition rate increased
and decreased respectively. There would be thus a linear relationship between the said

55
parameters. Any changes to linearity would mean that impurities have accessed the
electrolyte or the concentration behaviour has changed due to depletion of the ions in
electrolyte or the current has become inefficient due to problems at source contacts or
some other problems.
zFMItm // Φ= (3.91)
Equation (3.92) is the yield based on Faraday’s Law and introduces the current density,
which is a critical element in the electrolytic recovery of copper. We therefore see that
the yield is dependent on the current density, the volume of reactant or reactor, the
concentration of ions in solution of electrolyte and most of all dependent on the current
efficiency. The electrode-active area is critical but the optimum yield requires optimum
current density. The conversion of the ions during the electrochemical reaction on the
cathode (XA) is useful in quantifying the yield.
RzFVAMjY /Φ= (3.92)
The conversion of the chemical reaction in the reactors is concentration dependent.
Equation (3.93) gives the conversion based on concentration. The initial and final
concentrations are used for the evaluation of the conversion. In the case of PFRs, the
inlet and outlet concentrations can be used as initial and final concentration while in the
case of batch reactors the initial concentration is that at the feed time and the final
concentration is that at any instant during the reaction or that at the end of cycle time
excluding cleaning time. What is important however is to identify the limiting and
excess reactant. The conversion is always determined based on the limiting reactant or
component because the overall yield is dependent on such a reactant. Since the speed of
the chemical reaction is dependent on temperature, different values of conversion are
obtained at different temperatures signifying that the conversion is temperature
dependent.
ooA CCCX /)( −= (3.93)

56
For the batch reactor, the yield for the reactant that can be converted to 0.9g-equivalent
is given by equation (3.94). It is clearly indicated in this equation that the ratio of the
initial (higher) and final (lower) concentrations determines the magnitude of the yield.
The conversion also plays a role in that if the conversion is high then the number of
gram equivalents would be low and if low then they would be high. Since the volume is
kept constant in batch reactors, the yield is a critical element in maximising the current
efficiency.
))/){()/9.0( CCCInzFVXIMY oRA −Φ= (3.94)
In PFRs, the ratios of the final (lower) and the initial (higher) concentrations are used in
the determination of the yield. Obviously the ratio is less than unity and therefore the
value of the yield would be smaller than that of the batch system. Maintaining a
constant concentration can raise the value of the yield in this type of reactor. The yield
is also dependent on the current efficiency as shown in equation (3.95) as it provides
information on the level of current efficiency during the electrochemical reaction and
therefore is a critical element in the evaluation of current efficiency in PFRs. The
conversion plays a significant role in the determination of the reactor yield and
therefore contributes to the current efficiency. The yield based on conversion is more
useful than that based on space-time (Pletcher and Walsh, 1993:89). The values of h1
and h11 in equation (3.95) are given as rAzFVXIM /9.0 and )/( oi CCIn respectively.
Φ= 111hhY (3.95)
3.10 Operation of Electrochemical Reactors
The operation of electrolytic reactors can, therefore, be either at constant potential or at
constant current flow. If the concentration of ions that carry electrons (Cu2+) changes,
then the current will change with time. At low levels of concentration of electrolyte,
more hydrogen ions will form and less deposition will take place. The increase in

57
voltage will raise the current and more deposition will take place. On the other hand,
maintaining the concentration of copper ions in electrolyte at constant value maintains
the deposition at constant rate. This is how electro-refining cells can be operated at
constant current or at constant electrode potential. At constant current electrolysis,
Lingane (1949:2:589) and Skoog and West (1976) had shown that the variation of
potential with time is not linear. On the other hand, the variation of current with time at
constant potential was also not linear. This is in agreement with what Skoog and West
(1976) had presented. This can, therefore, mean that electrolysis can be performed by
maintaining a constant potential at the electrodes while varying the current at the
expense of concentration or operating at constant current while varying potential at the
expense of concentration. In practice the maintenance of constant concentration at a
particular flow will enable the electro-refining process to be operated at constant over-
voltage and current. This was the guiding principle for the study.
3.11 Smootheners and Metal Recovery
The chemistry of the surface reaction between the cathode and the smoothener is not
quite clear from the many studies that have been conducted elsewhere. Many attempts
have been made in the use of various inorganic and organic chemicals in combination,
according to the determined proportions, in order to observe the effects on the
deposition of copper on the cathode. The smoothness of the surface at the cathode has
been improved when additives such as thiourea, gelatine and chloride and ethylene
glycol and glycerine have been added to the electrolyte during electrolysis in order to
promote a smooth deposit (Yamamoto et al., 2002; Veilleaux et al., 2003). The
ethylene glycol (EG) and glycerine (G) were used in the ratios of 80:20 and 19.5:76 in
the electrolysis using copper and zinc as electrodes. The results showed that the EG and
G improved the smoothness and colour of the deposit in the presence of
Ethylmethylimidizolium-zinc-bromide-molten salt (EMIB-ZnBr). The current
efficiencies were found to be high (63-100%). In the electrolysis of molybdenum or
carbon electrode in pure Sulphuric Acid using 15V ac, the smoothness of surface is
improved by the addition of 0-6g/L of pyrazine (Voros, 2006). Additives such as

58
animal glue have been observed to enhance smoothness of the resulting Cadmium
Cathode during electrolysis (Fthenakis, 2003).
The influence of additive concentration and pulse electro-deposition parameters
(current-on time, current-off time and surface morphology) was investigated in the
study conducted by Yousef et al. (2004). The smootheners used were Poly-acrylamide
(PA) and Thiourea (Tu). The results showed that at concentration of 0.7g/L of PA and
0.05g/L of Tu, the grain size decreased with increase of current-on time at constant
current-off time and peak current density but increase in current-off time at constant
current-on time and peak current density resulted in grain growth. The effect of
additives such as Jaguar C13 on structure characteristics of copper deposits electro-won
at 161Am-2 from aqueous chloride electrolyte was improved quality of deposit while
additives such as glue and gelatine were found to be less effective (McKinnon et al.,
1985). The action of smootheners is to inhibit the formation of nodules and rough
surface at the cathode. A study by Stelter et al. (2002) that used polyethylene glycol
(PEG) as alternative additive to glue and thiourea for copper electro-refining produced a
smoothening effect and the PEGs offered high thermal stability and slow chemical
decomposition at higher temperatures with high cathodic polarisation. A study by
Farndon et al. (1995) on the effects of Thiourea (TU), Benzotriazole (BTA) and 4,5-
dithiaoctane-1,8-disulphonic acid (DTODSA) on the deposition of copper from dilute
acid sulphate solutions using potential sweep techniques where Tafel slopes and
exchange current densities were determined in the presence and absence of such organic
additives revealed that TU and BTA were found to inhibit the copper deposition
reaction. Increases in the BTA concentration gave a systematic lowering of the
exchange current density, whilst TU behaved in a less predictable manner.
Although many tank-houses in the world use glue, thiourea and chloride as inhibitors,
the action of such inhibitors is not yet clearly known but the disadvantages of such
inhibitors include rapid decomposition of glue as a result of acidic hydrolysis at high
temperatures and the deposition of part of thiourea sulphur in the cathode. In a study by
Muresan et al. (2003) where the objective was to determine the kinetics of copper

59
deposition in the presence of triethyl-benzyl ammonium chloride (TEBA), an attempt to
explain the inhibition process was made but is still unclear. According to Muresan et
al. (2004), the influence of TEBA on the kinetics of copper deposition was to block or
to inhibit the deposition process but did not interfere with the reaction pathway. In
essence, the TEBA competed for adsorption sites on the electrode.
In another study by Dow et al. (2005) the potential-dependent adsorption of chloride ion
on the copper surface was found to be the determining and governing factors of the
electrochemical effect of additives on the cathode which resulted in adsorption of
inhibiting reagents (PEG + Cl- + 3-mercapto-1-propanesulfonate and Junus Green B
(JGB)) and the asymmetrical filling of copper deposit inside the microvias. The
inhibition effect of PEG + Cl- + C+ and JGB was demonstrated. The dominance of the
accelerator and suppressor of inhibition process depended on the chloride ion
concentration and the convection due to stirring effect.
3.12 Nodulation
Nodulation on the cathodes is the result of formation of rounded projections on the
surface of cathodes. The nodules may be started by an impurity or particle that may
deposit on the surface of the cathode. Further deposition of copper on the particle
results in an extended growth, which may create problems of shorting and rough
surface. Nodulation studies conducted elsewhere have shown that the presence of
Nickel (Ni) particles or atoms in the anode copper decreases the exchange current
density as determined from the Tafel analysis of electrode reaction (Stankovic et al.,
2001). The use of improper proportions of smootheners can also result in the formation
of nodules at the cathode surface as reported in the study by Veilleaux et al. (2003).
The nodules of copper on the cathode can be detected by the use of galvanostatic
technique which uses the value of the starting potential and the presence of the cathodic
polarisation peak on the potential-time curve (Lafront et al., 2002). Studying the
morphology of the deposit using a scanning electron microscope at various
magnifications can confirm the results. The inappropriate concentrations of additives

60
(thiourea, gelatine, and chloride) are associated with current densities that generate
intergranular microcracks due to absorption of additives and leads to the formation of
nodules.
3.13 Impurities
The presence of impurities in solution has been observed to inhibit the deposition of
copper on the cathode. Some metals likely to be found as impurities in solutions of
electro-winning operations include Silver (Ag), Lead (Pb), Iron (Fe), Cobalt (Co) and
Zinc (Zn) (Pletcher and Walsh, 1993). A study by Lozano-Morales and Podlaha (2004)
showed that low particles of Aluminium Oxide (Al2O3) concentration (12.5g/L) resulted
in inhibited deposition rate of copper while the high particle concentration (60g/L)
inhibited the deposition rate at low over-potentials and accelerated it at high over-
potentials. The cathode nodulation was studied by electro-depositing copper at
38mAcm-2 from acid sulphate baths containing 0.5gdm-3 of various suspended
particulate (Andersen et al., 1983). The results showed that the conductive particulates
such as copper and graphite produced dense nodulation at 50 oC and less while
Antimony and Silver powders caused pitting as well as nodulation. The non-conducting
powders such as lead sulphate, lead dioxide and gypsum produced no nodulation.
However the nodulation was found to increase with the increase in temperature
particularly from 50 to 70 oC. Increasing the copper ion concentration, which was
found to decrease the nodulation gnomically, could solve the problems of nodulation.
On the other hand, the study by Ashiru (1995) where the objective was to assess levels
of impurities during silver deposition in the presence and absence of additives showed
that the brighteners were incorporated with the silver deposits and not the inhibitors like
Thiourea etc. This could be one explanation to defend the use of additives.
3.14 Summary
The reaction of atoms using the exchange of electrons is the mystery that resulted in the
birth of electrochemistry and electrochemical engineering. The application of external

61
voltage is the key factor in the deposition of the metal from the anode to the cathode.
The conductivity of ions is the key characteristic in the classification of electrolytes.
An interface near the electrode aides the deposition process by selective diffusion and
migration of ions.
The potential developed by the anode-cathode pair is electrolyte and electrode material
dependent. The kinetics of the circular reactors is dependent on the rates of reaction
which results in the dissolution and deposition of copper on the anode and cathode
respectively. During the process, electrical energy is converted into heat energy. The
ions diffuse in electrolyte according to Ficks Laws of diffusion. The current efficiency
is inversely proportional to the distance between electrodes during migration of ions
whilst the mass transfer takes place when the electroactive species disappear in the
electrode reaction when acted upon by the current. The movement of ions, assumed to
be unidirectional in the film, form fluxes of ions. The current efficiency is affected by
high current densities, which produce passivity and nodulation on the electrodes. The
passivity is the inactivity of the site while nodulation is the excessive growths of copper
deposit at one point which may result in short circuiting. This problem can be solved
when optimum conditions (optimum current densities) are maintained in the reactors.
Therefore, the operation of electrolytic reactors can be either at constant potential or at
constant current flow in order to achieve good results. Smootheners can help to
stabilise the deposition of copper at low levels of current density whilst producing high
current efficiency. Metals found as impurities include silver (Ag), lead (Pb), iron (Fe),
cobalt (Co) and zinc. These may produce different levels of interferences on the
deposition of copper.

62
CHAPTER 4
PROBLEM IDENTFICATION
4.0 Introduction
This chapter sets out the nature of the problems that can be encountered in the copper-
recovery process using the electro-refining method and includes suggested solutions of
how such problems can be solved. The major problems discussed here include the
passivity created by conditions beyond normal such as effects of concentration,
ineffective smootheners, and effects of electrode distance, active area, temperature,
current density and overvoltage on the current efficiency. There are various approaches
to solving the problems related to copper recovery as demonstrated by researches
conducted elsewhere particularly on the use of inhibitors during electro-refining. The
use of current inhibitors and smootheners from plant products opens up the way for
cheaper products to be synthesised as the organic types are becoming increasingly
costly.
4.1 The Problem and its Setting
The recovery of copper from ores and wastewaters by the electrolytic method is an
important element in most copper mining industries. It is important because most
applications of copper have a direct impact on society. The making and use of electrical
cables for lighting community and business buildings enables the people to see and
work at night or in dark places like the underground mine tunnels. The sale of copper
has direct effect on the growth of the economy. The recovery of copper from
wastewaters brings about a sustainable environment as copper destroys the micro-
organisms that bring about its sustainability in the environment. The problems that
exist are associated with the quality and quantity of the copper produced. The problem
of quantity of copper produced is usually tied to the issues of sustainability in industry.

63
The more it is produced the more sustainable will be the industry if it is backed by
increased sales. The sales depend on the quality and the demand for copper. Increased
copper sales would boost the economy of a country. The quality is a key factor in the
marketing of such products at the local and international markets.
The key factors that affect the quality and quantity of copper recovered by electrolytic
methods are the overvoltage and current density. The potential and current densities are
the main driving forces for the electrochemical reactions. Low values may not be
effective while higher values would be more effective but may produce irregular
deposits that could bring the phenomenon of nodulation, passivity and rough surfaces of
copper cathodes (Lafront et al., 2002). The other factors that reduce the quality of
copper are passivity, inadequate concentration of electrolyte, the presence of impurities,
ineffective smootheners, inadequate electrode-active area and inadequate distance
between the electrodes. The most important is the use of inappropriate levels of the
overvoltage and the current density. In order to obtain a good product from the copper
recovery process, it requires the maintenance of the process parameters at optimum
levels. For example, the optimum parameters for the electro-winning will slightly differ
from those for electrorefining depending on whether the direct current (DC) or the
Alternating Current Reversal (ACR) system is used. But when the parameter,
overvoltage, is regulated such that the current induced results in the efficiency being
increased, as determined by the amount of copper deposited on the cathode, then the
overvoltage used is at the optimum level. The major problem in the recovery of copper
by electrolysis in industry has been the reduction of current efficiency and hence the
reduction in production. The attempts to solve the problems that occur during the
recovery of copper by the electrolytic method should consider all the aspects of the
process from the quality and type of electrolyte and material of electrodes to the
variable parameters of overvoltage, current density, the distance between electrodes and
impurities, ineffective electrode-active area and the temperature in a holistic approach
to finding the levels that would give the best operating conditions in order to achieve a
high level of the current efficiency. This therefore requires a careful choice of
appropriate levels of the operating parameters.

64
4.1.1 Passivity
The creation of passivity on the electrodes where electro-deposition ceases due to high
levels of currents and overvoltages is one factor. The electro-deposition ceases because
the dissolution of the metal from the anode ceases or is markedly reduced due a number
of factors. The use of high current densities and overvoltages is one factor, which can
be resolved by using normal levels that favour the non-formation of passivity. The use
of a number of trials of current densities and overvoltages can provide adequate
information for the determination of the optimum values. The other factor is the change
in concentration of electrolyte during electro-deposition. When the concentration of
electrolyte drops, the current density may increase resulting in the development of
passivity. This problem can be solved when the concentration of metal ions in solution
remains constant (Pletcher and Walsh, 1993:401). An investigation at various leve ls of
overvoltages can produce the overvoltage required for the evaluation of copper
recovery. The third factor is the development of passivity due to the formation of a
continuous film on the anode, which prevents the dissolution of the metal. The effect is
that there is no deposition-taking place at the cathode. On the other hand a film of solid
phase formed from salts or complexes of metals with solution components having a
high resistivity, with minimum thickness, prevents the ions from entering the solution
because the oxidation takes place at the metal- film interface (Koryta and Dvorak,
1987:363-364).
Passivation is used as a means of protecting the metal from corrosion. When the
passivating film forms on the anode, the dissolution of metal ions from the anode ceases
or is considerably reduced thus reducing corrosion. This point is in agreement with the
argument advanced in Antropov (1972:532) that when the passive state region is
reached, the rate of dissolution of the metal falls abruptly in the absence of external
polarisation. This argument is based on the film and adsorption theories of passivation
(Antropov, 1972:507). According to Antropov (1972:508), passivity is not necessarily
connected to the formation of polymolecular-oxide film but can be achieved through
retardation of metal-dissolution reaction caused by adsorbed oxygen atoms. The

65
oxygen atoms, from the discharge of water molecules or hydroxyl ions, may appear on
the metal surface at potentials much less than those that evolve oxygen or those that
form oxides. Passivations on metals include the action of oxidizing agents such as
nitric acid and anode polarisation. The anodic polarisation can be detected on the
potentio-static curves of anode potential versus current density (Antropov, 1972:505).
4.1.2 Temperature Changes
The second factor is the variance of temperature as the deposition of copper progresses.
It has been stated in Section 1.2 that the chemical reaction in an electrochemical process
releases heat energy, which heats up the electrolyte resulting in the temperature to rise.
The deposition process, i.e. recovery of copper, will not be effective until the right
temperature called the optimum temperature is reached. According to Skoog and West
(1976:433-434), the high temperatures inhibit concentration polarization because the
mobility of ions is increased and the viscosity of electrolyte is reduced. In such
situations, the overvoltage effects such as evolution of gas can easily be observed. This
means therefore that the temperature plays an important role in electrochemical
reactions and that the optimum temperature for the system has to be determined
experimentally. Additional measures such as the control of temperature at a fixed
value, using heat exchange equipment and avoiding the use of high overvoltages and
stirring, which tends to reduce concentration polarisation are the desirable features for
the system that could help to solve such a problem.
4.1.3 Distance between Electrodes
The third factor is that the increased distance between electrodes results in the drop in
the flux. This would have a negative effect on the current efficiency. There are two
ways in which the distance between electrodes would affect the copper recovery. One
way is that when the distance is increased the electric field that would create the
required force to drive the ions would be weak and therefore the flux of the ions would
be weak resulting in the reduction in the deposition of copper on the cathode. The other

66
way is that if the distance between electrodes is reduced the electric field would be
strong and the rate of electrochemical reaction would increase due to increased energy
acting on the ions in electrolyte. On the other hand the chances of creating electrical
short circuits would be increased which would result in the reduction of the current
density at the surface of electrodes and cause the reduction in the recovery of copper
and hence the current efficiency. The distance between electrodes affects polarisation
and hence capacitance between electrodes (Umino et al., 2002). The formation of a
film of salt complexes would result in the development of passivity, which would
reduce the chemical reaction on the electrode surface. Conducting a number of
experiments using different distances between electrodes at fixed values of current
density and overvoltage in order to determine the value of distance that gives optimum
current efficiency could solve this problem.
4.1.4 Variation of Concentration
The fourth factor is that the concentration of electrolyte drops as the deposition
progresses and therefore requires either maintaining or varying at the expense of other
parameters. This happens when the anode electrode is no longer able to dissolve
adequate atoms of copper, which have to change the charge in order to become cations
as is the case of electrorefining. In electro-winning, the problem is the depletion of
cations in electrolyte, which then results in the drop in the current efficiency. The
decrease in concentration is proportional to time as long as the limiting current is not
exceeded (I<IL). This relation can be observed in equation (4.1) where V is the volume
of reactor (m3) and the reaction is under current limited control.
zFVtICC /0 φ=− (4.1)
When the concentration drops and the current increases, the reaction becomes transport
dependent and the current exceeds the limiting value (I>IL). The electrolyte begins to
evolve the gas of the oxidised ions and the conversion has a non-linear relationship with
time as described in Pletcher and Walsh (1993:107). When both the anode and the
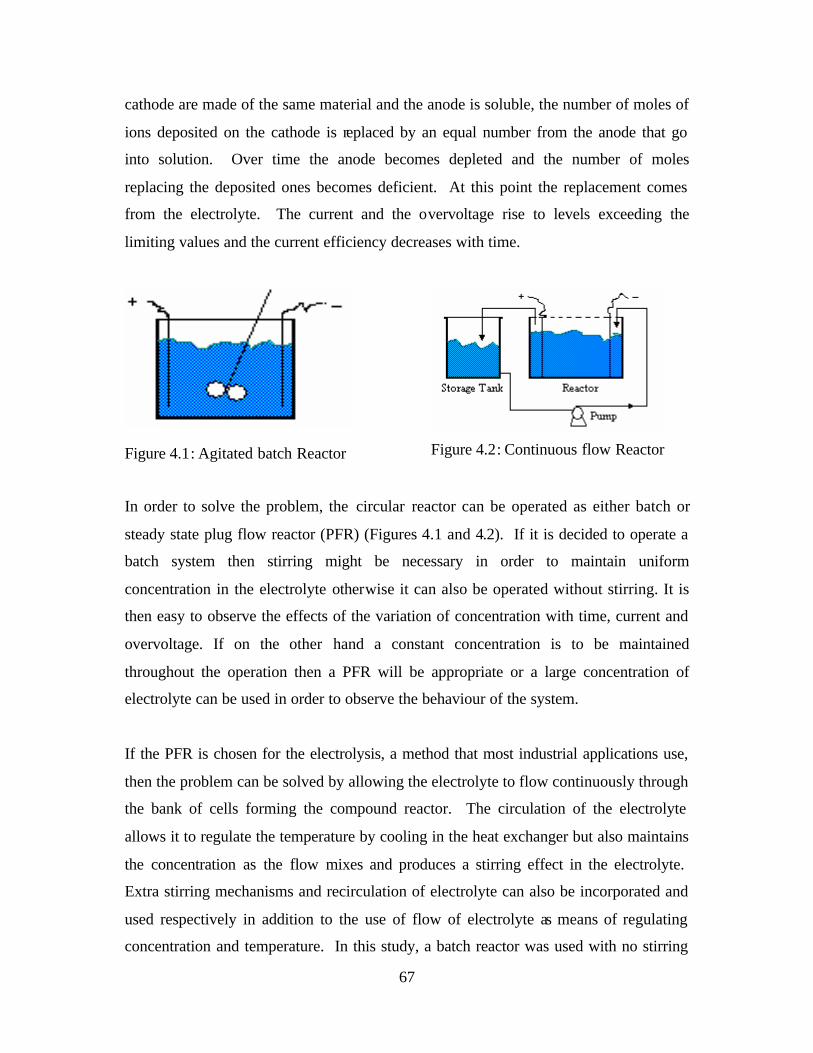
67
cathode are made of the same material and the anode is soluble, the number of moles of
ions deposited on the cathode is replaced by an equal number from the anode that go
into solution. Over time the anode becomes depleted and the number of moles
replacing the deposited ones becomes deficient. At this point the replacement comes
from the electrolyte. The current and the overvoltage rise to levels exceeding the
limiting values and the current efficiency decreases with time.
Figure 4.1: Agitated batch Reactor
Figure 4.2: Continuous flow Reactor
In order to solve the problem, the circular reactor can be operated as either batch or
steady state plug flow reactor (PFR) (Figures 4.1 and 4.2). If it is decided to operate a
batch system then stirring might be necessary in order to maintain uniform
concentration in the electrolyte otherwise it can also be operated without stirring. It is
then easy to observe the effects of the variation of concentration with time, current and
overvoltage. If on the other hand a constant concentration is to be maintained
throughout the operation then a PFR will be appropriate or a large concentration of
electrolyte can be used in order to observe the behaviour of the system.
If the PFR is chosen for the electrolysis, a method that most industrial applications use,
then the problem can be solved by allowing the electrolyte to flow continuously through
the bank of cells forming the compound reactor. The circulation of the electrolyte
allows it to regulate the temperature by cooling in the heat exchanger but also maintains
the concentration as the flow mixes and produces a stirring effect in the electrolyte.
Extra stirring mechanisms and recirculation of electrolyte can also be incorporated and
used respectively in addition to the use of flow of electrolyte as means of regulating
concentration and temperature. In this study, a batch reactor was used with no stirring

68
during the operation and therefore convective effects due to stirring were not
considered.
4.1.5 Presence of Impurities
The fifth factor is the presence of dissolved impurities which presents the problem of
competition between ions in solution especially when the ions have close oxidation
potentials ; this would result in the ions participating in the chemical reaction (Pozniak
and Cole, 2007). There are two types of impurities. The first type is the chemical
impurities. The metals that dissolve in electrolyte with copper such as silver (Ag), Gold
(Au), Platinum (Pt), Bismuth (Bi), Iron (Fe), Nickel (Ni), Zinc (Zn), Tin (Sn), Rubidium
(Rb) and Lead (Pb) may compete with copper when the conditions favour all the
elements. The second type of impurity is particulate matter, which may be suspended
or dissolved in nature; these impurities may interfere with the deposition of copper or
may enhance the formation of nodules on the surface of the cathode. This problem can
be solved when a number of experiments can be conducted in order to determine the
levels of impurities that would interfere with the electrochemical process using the
conditions that favour the dissolution of copper only. The metals Ag, Au, and Pt are
nobler than copper and therefore do not dissolve at the conditions at which copper
dissolves. The metals Sb, Bi and Sn precipitate after dissolving from the anode and end
up in the slimes. The metal Pb forms an insoluble precipitate after being oxidised in the
anode and will also end up in the slimes. The metals ions Fe2+, Fe3+, Co2+and Co3+, and
metals Ni and Zn form sulphate species which remain in solution because such species
are reduced at potentials that are more negative than that at which copper deposits. The
conditions for copper deposition that tend to eliminate the participation of metal
impurities are reported in Pletcher and Walsh (1993:231-233).
The second type of impurities, particulate matter, is brought into the electrolyte during
the preparation and handling of electrolyte processes. The particulate matter may be
dissolved or suspended. The particles may acquire charge and can be carried along with
cations to the cathode where their deposition may result in the formation of nodules.

69
The deposition of copper on the nodules may be increased resulting in the development
of short circuits between electrodes if the electrode separation distance is small. Since
the level of particulate matter is unknown, the carrying out of a number of experiments
at different levels of particulate matter can reveal the optimum level. Ideally, the zero
level of particulate matter would give a high quality surface but due to the nature of
operations, particularly in industry, it is not possible to attain this level due to the
handling problems of storage, infiltration of particulates during pumping and
particulates from the atmosphere.
4.1.6 Inadequate Electrode-active Area
The sixth factor is the electrode-active area. If the electrode-active area is inadequate
then the current efficiency would decrease while the opposite is also true. For example,
a small active area may carry a high current density and the current efficiency would be
affected in that irregular deposition may occur which would bring about the problems of
nodulation or passivity as described in Lafront et al. (2002). A small electrode-active
area is unproductive in the sense that the quantities to be produced would be small. A
large electrode-active area would result in the lowering of the current density over the
electrode (Karabacak and Lu, 2006). Equation (4.2) describes the relationship between
the current, the electrode-active area and concentration. The current density is
dependent on the electrode active area and the overvoltage. Since the area (A) does not
change during the experiment, a trial of different sizes of electrodes would give the
variation of size with current. However, the variation of current with the concentration
is a prominent feature in electrochemical reactions.
nFCAkI L= (4.2)
When the concentration is kept constant, the current is directly proportional to the
electrode-active area (A). At the same time, the current is proportional to overvoltage at
a fixed value of electrode-active area. It means therefore that any change in the
geometry of the electrode-active area results in the change in the current and

70
overvoltage levels at the electrode. The current density decreases with increasing cros-
sectional area. It appears that this is not much of a problem except that large current
densities realised from using small active areas, could affect the deposition due to the
passivation and release of gas from the electrolyte.
4.1.7 Development of Nodules
The seventh and last factor is the development of nodules on the surface of electrodes
due to inadequate separation, which creates short circuits when they grow larger. The
formation of nodules may be due to factors such as current density and overvoltage.
The current density encourages increased precipitation rate of copper on the cathode at
the expense of crystal size (Skoog and West, 1976:433-434). It means that the size of
crystals is reduced when the rate of formation is increased. Since the desired product is
copper on the cathode, the smaller the size of crystals the better. However, high current
densities give rise to irregular precipitates that have low strength. The concentration
polarization, due to high current densities and overvoltages, and gas evolution may
accompany the deposition process. The effect of this is that a spongy deposit is realised
which reduces the efficiency. For example Skoog and West (1976:433-434) state that
the usual offender in such situations is hydrogen-cathodic deposition.
The other factor that aids the formation of nodules is the non-effectiveness of
smootheners to produce a smooth surface on the cathode. Because smootheners have
different properties, their effect on the chemical reaction on the cathode would be
different. The most recognisable effect would be the control of the grain size of the
deposit on the surface of the cathode. Since the diffusion, migration and convection
processes all take place concurrently in the electrolyte, the effect of the smoothener
would be to inhibit the excessive deposition of copper ions on the cathode which would
result in a smooth grain formation of copper on its surface. The inhibiting action can be
achieved by the blocking action of the smoothener molecules, which are larger in size
than those of copper ions and therefore produce a filtering action to the copper ions.
The ions from the other compounds like sodium chloride attach to the metal cathode

71
before electrolysis and are continuously replaced by the copper ions during the
electrochemical reaction. If this action does not produce a good surface on the cathode,
it means that the smoothener is not effective. The non-effectiveness of the smoothener
would lead to excessive deposition of copper that would lead to the development of
coarse surface and hence the current efficiency and the overall production would be
reduced. The problem can be solved when moderate levels of current densities are
used. Controlling cathode potentials or the addition of depolarisers could also control
the evolution of gas. A number of current inhibiting actors (smootheners) have been
tried in order to reduce the problem of nodulation and irregula r deposition of copper
(Stelter et al., 2002). Thiourea has been extensively used as grain refiner (Hiskey and
Cheng, 1998) but the use of K-Glue, B-Glue, and P-Glue in electrorefining of copper
has not been reported in literature.
4.2 Assumptions
An assumption is a proposal that is required to be verified in the study. Although it may
have been proven elsewhere by the process of search, the use of research can either
confirm or disprove it. If the assumption survives the experimental testing then it
becomes a theory that can be subjected to many other studies that would approve or
disapprove it based on the evidence obtained. The assumption is also an expression of
opinion based on incomplete evidence. The research commences with a number of
questions one of which is “Is the assumption true or false?” The other questions might
be: How does the parameter affect the result? How long does it take to obtain the
expected result? What level of the independent produces lowest and highest results?
What is the quality of the result? What is the effect of impurities, temperature,
concentration and smootheners on the recovery of copper?
The assumption sets out the relation between the expected result and the output. The
output is the variable that is used to produce the result. For example, if the output is
overvoltage and the expected result is the deposited copper on the cathode then the
output has an effect on the result. This answers the question “What is the effect of

72
overvoltage on the recovery of copper?” If “Copper is deposited on the cathode” (is the
answer), then the result is good and the level of overvoltage is appropriate. If on the
other hand the result is poor then a wrong level of output is used and would require
adjustment to the level so that it gives the good result. Such action is called
optimisation. The aim of optimising a process is to maintain optimum values of
variable parameters in order to continuously bring about the desired result. Another
example, which is the further explanation of the first, is that if XY 2= where X is the
independent and Y is the dependent variable, any change that is effected in X will affect
the value of Y. A further explanation to this example is that the value of Y should be
equal to twice that of X. If upon assigning the value of X the value of Y is not equal to
twice that of X then the assumption is not true but false and therefore disproved. This
explains how the Null Hypothesis can be used to confirm or disprove the assumptions.
A similar approach was used in analysing the assumptions that were identified for the
study.
4.2.1 Assumption 1
The first assumption is that increased overvoltage and current density increases the rate
of deposition and hence affects the current efficiency. This assumption relates to the
first problem where passivity is created due to excessive overvoltage or currents. In
order to prove or disprove the assumption, a number of experiments were carried out
using different levels of overvoltage and current densities, while keeping the distance
between electrodes constant. It was expected that the efficiency close to 100% could be
obtained only at the right level of the overvoltage and current density. It has already
been stated that excessive overvoltages produce passivity, which reduces the deposition
of copper onto the cathode. Therefore reduced overvoltage would deposit less copper.
4.2.2 Assumption 2
The second assumption is that the temperature improves the current efficiency. This
relates to the second problem where the generation of heat energy by the chemical

73
reactions in cells results in the rise in temperature. The carrying of electrolysis at
different intervals of temperature would provide evidence on which to prove the effect
of temperature on the current efficiency. If the increase in temperature does not
increase the current efficiency then the assumption is false.
4.2.3 Assumption 3
The third assumption is that the distance between electrodes affects the current
efficiency. This assumption relates to the third problem where conducting the
electrochemical reaction with increasing distance between electrodes can affect the
current efficiency. The decreased distance can increase the current density and the rate
of electrochemical reaction. The development of nodules is attributed to the use of high
overvoltages. The formation of nodules has been reported in studies conducted
elsewhere (Stankovic et al., 2001; Veilleaux et al., 2003).
4.2.4 Assumption 4
The fourth assumption is that the concentration of electrolyte affects current efficiency.
This assumption relates to the fourth problem where the concentration is a major factor
in the deposition of copper. At fixed value of electrode-active area, the current
efficiency is proportional to concentration as long as the limiting current is not
exceeded. This is achieved when the system is operated at the current-limited control.
Equation (4.3) can be used to derive the relationship.
LL IzFACk /=Φ (4.3)
As soon as the limiting current is exceeded, the overvoltage increases and the current
efficiency decreases. The plot of current efficiency and the concentration gives the
behaviour of the system as described by equation (4.4) on which the assumption can be
proven or disproven.

74
ItCCzFV o /)( −=Φ (4.4)
For the case of electrorefining, the current efficiency is dependent on the concentration
as described in equation (4.4) where its data is indicated in Table: 4.1.
Table 4.1: Effect of concentration on the current efficiency
Concentration (mol/L) Time (s) Current Efficiency
C0-C1 t1 F 1
Co-C2 t2 F 2
Co-C3 t3 F 3
Co-C4 t4 F 4
Co-C5 t5 F 5
4.2.5 Assumption 5
The fifth assumption is that the impurities affect the current efficiency. This relates to
the fifth problem where increasing concentration of impurities would produce an effect
on the current efficiency. There are a number of ways in which this assumption can be
proven. The first way is that if the current efficiency exceeds 100% then it would mean
that other metals other than copper have been deposited on the cathode or error has been
introduced during the process of measurement. The other way is that the deposition of
particulate matter on the cathode grows and causes short circuits between the anode and
the cathode assuming a narrow distance of separation though it may be the optimum
one, resulting in the reduction of current density at the electrodes and hence can affect
the current efficiency.
4.2.6 Assumption 6
The sixth assumption is that the electrode-active area reduces the current efficiency.
This relates to the sixth problem. The current density is lowered by the increase in
75
active area at constant overvoltage. The lowering of current density would result in the
lowering of the deposition rate. Regardless of the type of system, whether it is the
continuous flow reactor (PFR) or batch system, the conversion as given by equation
(4.5) is affected. The active area can be determined using the method described in
Pletcher and Walsh (1993:85) and then evaluating the conversion from equation (4.5)
where b11 is given by kLt. If the active electrode-active area is large then the conversion
would be large and vice versa and thus proving or disproving the assumption.
)1/(}1)1{( 1111ssA AbAbX +−+= (4.5)
4.2.7 Assumption 7
The seventh assumption is that the effective inhibitors reduce the formation of nodules
on the cathode. Effective inhibitors affect the current efficiency. The assumption relates
to the seventh and last problem where the nodules form due to ineffective smoothening.
In order for the smoothener to be effective, the right amount of its concentration is
required during the operation. Therefore the right level of concentration can be
determined experimentally. Smootheners may be required to achieve the desired result.
4.3 Summary
The recovery of copper from ores and wastewaters by electrolytic method is an
important element in most mining and other industries. The problems that exist are
associated with the quality and quantity of copper that is produced. The key factors that
affect the quality and quantity of copper are the overvoltage and current density,
electrode-active area, distance between electrodes, level of electrolyte concentration,
smootheners and impurities, and temperature. Attempts to solve the problems of the
operation of circular reactors should consider all the aspects of the process from the
quality and type of electrolyte and material of electrodes to the variable parameters of
the factors that can affect the current efficiency in order to prove the assumptions.

76
CHAPTER 5
METHODOLOGY
5.0 Introduction
The methodology sets out the materials and equipment that were assembled and
operated in order to measure the various parameters or variables in the study. It
provides information on the relations between the dependent and independent variables
on which the conclusion can be drawn. The methodology is therefore critical as the
results are determined by it. In describing the methodology for this study, it has been
segmented into several sections; study design, preparation of reactors, measurements of
current, temperature and voltage, the preparation of electrolytes and compositions of
smootheners, measurement of impurities and data analysis. Each of these sections
provides adequate information on which experiments can be carried out in order to
obtain the results in a similar manner. The study design gives information on how the
study was set out and how it can be accomplished in order to achieve the prescribed
objectives. The methodology on preparations of electrolytes and smootheners and the
measurements of current and voltage provides the conditions that are critical in order to
obtain accurate results.
5.1 Study Design
The study design is an approach that is used to solve the identified problem using the
predetermined methodology in order to achieve the objectives. The variables are
identified and used to obtain the general behaviour of the system when the independent
variables are manipulated. Sometimes the dependent variables themselves can be
subjected to the treatment and the effects are observed after the treatment. The
experimental study design is the most common design used for scientific and
engineering projects. It is the method that leads to the achievement of the objectives

77
while reducing the error of uncontrolled variations on the treatment or comparisons.
According to Barnard and Cronje (2000:47-48), the idea is to use common sense in
grouping the units into sets, and then assigning the treatments so that each one occurs
once in a set. In most experimental designs, the variables are independent and
dependent. It is the independent variables that are manipulated. Any change on the
independent variable can either have an effect on the dependent or not. The cause is
induced on the independent and the effect is observed on the dependent. By identifying
a number of variables in a study it is possible to achieve the objectives. It is for this
reason that a number of variables were identified for this study based on the
experimental design. The most important variables identified for the study were
temperature, concentration of electrolyte, current, overvoltage, distance between
electrodes, electrode design or electrode-active area, smoothener concentration and the
current efficiency. These variables were also identified to be the most critical variables
for the study.
The experimental designs can use single-variable or multi-variable designs. There are
three types of single-variable designs. These are; before-and-after without control,
before-and-after with control and after-only with control. The before-and-after without
control is the experimental method in which the test units act as their own control.
According to Barnard and Cronje (2000), the method measures the dependent variable
before it is exposed to the treatment and again after it has been exposed. However
Barnard and Cronje (2000:49) argue that this experimental method exerts no control
over the influence of outside forces. The before-and-after with control introduces
another dimension to the before-and-after without control. Some of the limitations of
the before-and-after without control method can be overcome by introducing the control
units or groups. However, the sizes of the test and control units must be the same. For
example, if a study is to be conducted with a sample size of 350, both the test and
control units must have the same sample size. The after-only with control single
variable design provides only two measurements to be made. A measurement can be
taken on the test unit and the other on the control unit. The difference gives the effect
of the treatment.
78
In multi-variable designs, a number of multi- level treatments can be tested using two or
more variables and the researcher can also use these designs to control the effect of one
or more of the extraneous factors. The common practice is to use randomised designs
and advanced statistical techniques to analyse the data. There are three types of multi-
variable designs; completely randomised design, randomised block design and Latin
square design. These designs are used to test the effect of the variable at different
levels. They can also be used to test two or more treatment variables. This is the reason
why they are sometimes referred to as factorial designs. The completely randomised
design is the simplest form of multi-variable design. The treatments are conducted
randomly on the test units and the effect is observed by determining the variance, which
shows whether there is a significant difference between the various units.
The randomised block design requires that the conditions must be the same in each of
the units that is subjected to the test. For example, if it is a social economic survey, the
conditions in high- income groups may not be the same as those in low-income groups.
Therefore a better comparison would be low-income grouping to another low-income
grouping while a high- income group should be compared to another high- income
grouping in order to avoid misleading results. According to Barnard and Cronje
(2000:52), the randomised block design enables the researcher to control the effect of
one of the main sources of variation while measuring the effect of treatment.
The Latin square design is a design that uses the Latin square which comprises the
square of four horizontal and four vertical columns. The Latin square allows the
researcher to control two sources of extraneous variation provided that they do not
influence each other. Each unit in the square appears once in the horizontal row and
once in the vertical one. For example, Table 5.1 shows the number (1) appearing once
in each of the rows and columns in the Latin square. In the Latin square method, the
number of vertical variables should always be equal to the number of horizontal
variables. The application of this design is in the analysis of data particularly when
determining the correlations between the variables as in One and Bivariate correlations
which are used to investigate the type of model that can fit the data.

79
Table 5.1: The Latin Square design
4 3 2 1
3 4 1 2
2 1 4 3
1 2 3 4
In the determination of the effect of current density and overvoltage on the current
efficiency and rates of deposition, the distance between electrodes was set at a fixed
value while the overvoltage, current, and current density were varied in order to obtain
the effect on the recovery of copper on the cathode. The Latin Square method of
analysing data was then possible by using four different distances in the square for data
collected at the same temperature.
In the determination of the effect of distance between electrodes, the current, current
density, and overvoltage were kept at constant values while the distance was varied in
order to obtain the effect on the copper recovery. Again the use of the distances at the
same temperature formed a Latin Square that was used in the analysis of data.
In the determination of the effect of concentration of electrolyte, the electrochemical
reactors were operated at constant temperature and constant reaction volume. The
concentrations were different for different samples. It is important to understand that
the reactors were operated as batch reactors. The concentration of reactants changed
during the chemical reaction. The limiting reactant was the copper ions while the
excess reactant was the acid (H2S04).
The effect of impurities on the current efficiency was studied using different levels of
impurities in the electrolyte and observing the effect on the cathode surface. The values
of electrode distance, current and current density and overvoltage were kept at

80
controlled levels. The quality of surface was used as criteria for the determination of
the effect of impurities on electro-deposition and the weight of the cathode was used as
a guide to the efficiency for the recovery of copper by this method. The weight of the
cathode was a key criterion for determining the efficiency of operation.
The effect of smootheners on current efficiency was studied using the type and
concentration of smootheners. The values of the current, current density, distance
between electrodes, and overvoltage were kept at fixed values. Various levels of
smoothener concentration were used (one at a time of each type) during the operation of
the reactors. The recovery was monitored in order to determine the effect before-and-
after with control of the smootheners on the copper recovery. The weight of the
cathode electrode was a key factor in the determination of the efficiency of the
recovery.
The effect of temperature on current efficiency was investigated by controlling the
temperature using water bath thermostat. Two methods could be used. The first
method would be to immerse the heat exchanger inside the reactor and allow the
cooling media to pass through it at different flow rates. The flow rate of the coolant
would be used as a control of the temperature in the reactors. The second method
would be to allow the electrolyte to flow through the exchanger by the forced
mechanism of a pump or simply using the gravity. The recovery of copper would be
measured at each of the temperatures and compared to the efficiency defined by
Faraday’s Law. The method used in this study was to place the circular reactors in a
water bath whose temperature was controlled by the in-built setting of the thermostat.
The effect of electrode-active area on the current density and current efficiency was
studied using various electrode-active areas at fixed values of distance between
electrodes, current, current density, and overvoltage. The active area of electrode
provided meaningful information on its variation with the current efficiency. Just as
before, the key criterion for the determination of the current efficiency is the weight of
the cathode at a particular value of electrode-active area.

81
The timing of activities was set out as is shown in Table 5.2. The proposal was
developed during the period from the second month (February) of 2006 to the twelfth
month (December) of the same year. The proposal was developed in order to generate
the preliminary information on the project, to focus the study and to identify the
hypotheses that would be used during the study. It was also meant to identify the
activities and the timing of such activities. The literature review provides key
information on how other authors have dealt with the subject matter, the methodologies
they used and the results that were obtained. It also provides an opportunity to identify
gaps, the areas that have not been tackled on the subject matter etc. It was important
therefore that the literature review was covered first before the experimental work. Part
of the review was carried out at the proposal development stage. This is the reason why
it was set to commence in the first month of the project activities in the year 2007.
Although five months were used to obtain the required literature, new developments in
the field were also checked at other times during the remainder of the study. The
procurement of materials was allocated two months because of the uncertainties of the
availability of the same from the providers. The cons truction of cells was given two
month. This was due to the fact that the binding of the materials and drying could take
a while particular when making the rectangular reactor casings. Therefore more time
was needed for this activity in order to avoid the disruption of the project. The
experimental activity was allocated more time than the other activities, apart from the
activity on the writing of the thesis, because this was one of the most important activity
that provided results and the required correlations on the variations between
overvoltage, distance between electrodes, temperature, smootheners, impurities and
electrode-active area and the current efficiency. Four months were used for the
investigation of the effect of smootheners and four months for the investigation of the
effect of temperature on the current and current efficiency. The other activities were
allocated two months each. It was anticipated that the collection of data in the
laboratory would end in good time to have the results analysed, processed and have
adequate time for the submission of the thesis and paper in good time. However, the
analysis and writing up of the thesis was allocated six months initially but changed to
accommodate the review process.

82
Table 5.2: Duration of project activities
Duration (years) 2006 2007 2008
Activity/Duration (months) 2 4 6 8 10 12 14 16 18 20 22 24 26 28 30 32 34 36
1 Developing the proposal
1. Literature Review
2. Procurement of materials
3. Construction of cells
4. Experimental
(i) Effect of current and voltage
(ii) Effect of distance
(iii) Effect of smootheners
(iv) Effect of Concentration
(v) Effect of impurities
(vi) Effect of electrode area
(vii) Effect of temperature
5. Writing the Thesis and paper
6. Review of Paper and Thesis
7. Submission of Paper and Thesis

83
5.2 Preparation of Reactor Baths
The material of the reactor baths must be that which does not react with electrolyte or
does not dissolve in electrolyte. This is because the electrolyte in electrochemical cells
contains sulphuric acid, which may create corrosive conditions on the reactor bath
surface. It is for this reason that reactor baths may be lined with polymeric materials
that are highly resistant to corrosion-action of acids. Rubber, Glass and Perspex are
materials that are highly resistant to corrosion. This is why glass beakers (Pyrex) and
rectangular-perspex containers were assembled and constructed respectively for the
recovery of copper. The beakers were used as single pair reactors while the perspex-
rectangular containers were used as multiple cell reactors at lower temperatures. The
electrochemical reactions were conducted in cells each containing a specific volume of
electrolyte, cathodes and anodes (Figures 5.1 and 5.2 and Appendix 8: Figures 5-6).
Fig. 5.1: Circular electrochemical reactor with electrodes
Fig. 5.2: Electrochemical reactor with (a) single cell and (b) bank of cells

84
The cells were supplied with external potential through anodes and cathodes and the
current was distributed over the electrode surfaces. There were a number of cathodes
and anodes in each battery of cells although a single electrode pair was also used. Each
pair of electrodes was treated as an independent cell and therefore the analysis was
based on such single cells. It was not important to consider all the cells because the
electrode active areas were the same and therefore the cells were identical.
The cooling of the reactors was achieved by the use of heat exchangers (water baths) in
which the reactors were immersed at a particular temperature. The temperatures were
chosen from a range of 24 to 60oC in order to determine the variation with the current
efficiency. This range was chosen because it is the safest range that does not affect the
properties of organic smootheners that were chosen for the study. The properties of
plant-based smootheners (K-Glue and B-Glue) would be affected particularly their
viscosities. The current, voltage and the weights of the cathode were measured at each
temperature setting in order to determine the current efficiency. The water bath was
fitted with an electrical heating element that was controlled by the thermostat. There
was no direct contact between electrolyte and the cooling medium and the reactors were
operated without stirring.
The reactors were assembled so that they could use direct current (DC). Although
initially Periodic Current (PRC) was proposed, logistical problems could not allow the
research to proceed with this method because the gadgets could not be found. The
anode and cathodes were made from the copper starting sheets that were produced in
the local mining industries and other vendors. After cutting to the required size the
anodes and cathodes were dipped in the solution of copper sulphate dissolved in water.
The copper sulphate is a good source of copper ions. It is also a salt that dissociates
highly in water. The power was applied across the cells by connecting the negative
terminal to the cathode and the positive one to the anode in order to complete the
circuit. The positive terminal was connected to one side of the rheostat while the other
positive was then connected to the anode. This was done in order to control the current
flowing in the circuit. It was also used to set the value of the current required at a

85
particular setting of the experiment. The arrangement was then ready for taking
measurements.
5.3 Measurements
5.3.1 Electrode-active Area
The effect of electrode-active area on the current density and current efficiency was
studied using various electrode-active areas at fixed values of distance between
electrodes and overvoltage (V). The current density (j) was determined by the level of
overvoltage and the concentration of electrolyte. Four runs were conducted at each
level of overvoltage and the average values of the mass deposited and expected current
density were obtained for each run in order to determine the variations with the
electrode-active area. The variation of the expected current density with electrode-
active area can be seen in Table: 5.3 at each set value of overvoltage.
Table 5.3: The variation of current density with electrode-active area
Active area 10 cm3 12.5 cm3 17.5 cm3 22.5 cm3 30 cm3
V j V j V j V j V j N0
Volt A/cm2 Volt A/cm2 Volt A/cm2 Volt A/cm2 Volt A/cm2
1 0.1 j1 0.1 j1 0.1 j1 0.1 j1 0.1 j1
2 0.2 j2 0.2 j2 0.2 j2 0.2 j2 0.2 j2
3 0.3 j3 0.3 j3 0.3 j3 0.3 j3 0.3 j3
4 0.4 j4 0.4 j4 0.4 j4 0.4 j4 0.4 j4
n Vn jn Vn jn Vn jn Vn jn Vn jn
Vn= Set value of voltage and jn=Expected current density at the applied overvoltage
A Metre Rule was used to measure the sides of the electrodes that were dipped in
electrolyte in order to determine the electrode-active area. The product of the sides
gave the electrode-active area. The level of electrolyte inside the reactor was kept at
constant value during the reaction by topping up the electrolyte when it dropped due to

86
evaporation particularly at the temperature of 60oC. The evaporation process was not
significant at other temperatures. Effects of evaporation were not significant in this
study.
5.3.2 Effect of Current Density and Overvoltage
The measurements of current and overvoltage were carried out using the circuit shown
in Figure 5.3. The circuit comprised the reactor bath with anode and cathode
electrodes, the dc-voltmeter (V), dc-ammeter (A), the variable resistor (R) with a
capacity of 50O and the variable power supply (E) with AC and DC ports (0-25Volts).
When the power was switched on, the current was allowed to flow in the circuit. The
resistor was then used to adjust the overvoltage and hence the current that was used to
drive the ions in the reactor. The current was drawn from the cathode to the anode. The
readings of current, concentration and overvoltage were taken periodically in order to
determine the effect of current and current density on the current efficiency. The cycle
of measurements for the mass that was deposited was fifteen to twenty minutes or thirty
minutes. It was also possible to determine the cycle of the operation from the periodical
measurements.
Figure 5.3: Experimental apparatus for the measurements of current and overvoltage.
The dc-ammeters and dc-voltmeters were used for the measurement of the current and
voltage respectively using indicating arrows built in the meters. A variable resistor

87
(Rheostat) was used in order to vary the voltage and hence the current across the cell so
as to compare the effect of different values on the deposition of copper. The
connections were the positive of the voltmeter to the positive of power supply and
negative to the negative i.e., in parallel while the ammeter was in series.
5.3.3 Smootheners and Additives
Smootheners were prepared from different materials and introduced in the solution in
order to determine the best composition of smootheners that could improve the current
efficiency. This process can result in the development of new types of smootheners.
The materials used during the study for the making of smootheners include reagents;
Glue, Thiourea, Sodium Chloride or Potassium Chloride, Gum Arabic,
Ethylenediamineteraactic acid (EDTA), K-Glue, P-Glue and B-Glue and Sulphuric
Acid. Each amount of the stated smootheners was weighed and dissolved in water and
the volume was made up to the mark of the volumetric flask. Dilution was done in
order to obtain the concentration required. A known volume of each of the smootheners
was added to the samples before the electrochemical reaction was conducted. This was
done in order to determine the effect on the current density and current efficiency. Any
change in the combination of Glue, Ligno and Salt or use of a different type of glue
produced changes in the current density and hence the current efficiency. A plot of the
volume of smootheners on the independent axis, the current density and current
efficiency on the dependent axis provided the correlation required for the analysis.
5.3.4 Temperature
The operation of the reactor at different temperatures provided information on the
variation of temperature with current and current density as well as the current
efficiency. The temperature was measured using the mercury- in-glass Thermometer (0-
100oC). Values of 24, 39 and 60oC were chosen because this is the range in which plant
based glues would not be affected by heat and therefore would give maximum
application to the smoothening effect. At temperatures above and below this range the

88
glues would break down in their properties and solidify at temperatures below this
range. The periodic measurement of temperature was beneficial in order to monitor the
effects on the current, current density and current efficiency. Before taking the
measurements, the thermometer was checked for its latest calibration in order to ensure
that the thermometer was in good order with continuous mercury inside. The
thermometer was then dipped in electrolyte for thirty seconds. The reading was then
recorded. Repeated readings (4) were carried out in order to ensure that the average
temperature was obtained. Parallax error was eliminated by positioning the instrument
at right angles to the eye.
5.3.5 Impurities
The impurities were weighed using a weighting scale and the weighed amounts were
dissolved in water and made up to the calibrated volume of the volumetric flask. The
impurities were then diluted to the required concentration and were introduced in five to
six different samples containing the same concentration of reactant. The samples were
then subjected to chemical reaction in order to determine the effect of impurities on
current efficiency. This was done in order to determine the level of metals that would
affect the electro-refining process. Previous studies by Lozano-Morales and Podlaha
(2004), Mackinnon et al. (1985) and Stankovic et al. (2001) have also addressed the
issue of metal and other factors on the electrodeposition of metals. The types of
impurities used were Silver Nitrate, Bismuth Nitrate and Iron (Fe), Zinc (Zn) and
Cobalt (Co).
5.3.6 Distance between Electrodes
The distance between electrodes was measured and set using a Metre Rule. The
electrodes were placed at different distances (1cm, 2cm, 3cm and 4cm) in the cell, one
distance at a time, in order to determine the effect of separation on the current, current
density and current efficiency at constant levels of concentration. The electrochemical
reaction was also conducted at different values of electrolyte concentrations and

89
constant values of distance between electrodes, overvoltage and current densities. This
was done in order to determine the effect on current efficiency. A plot of current,
current density and current efficiency as dependents, against the distance between
electrodes as the independent, provided the information on the behaviour of the system.
5.4 Data Analysis
The analysis of data was approached in three ways: by data mining, data exploration
and final analysis. Data mining is a methodology that is used on large data sets in order
to discover interesting aspects, which could further be analysed. Data exploration uses
manual techniques that are used to find the way through the data set in order to bring
important aspects of the data into focus for further analysis. The final analysis of data
incorporates the use of reductive, mathematical and visual techniques. The reductive
techniques use aggregation of facts as a basis for the analysis of data. For example the
summary and simple statistical methods fall under this technique. The mathematical
technique also called classical method, uses data as a whole as the basis for the analysis.
The general approach of this technique is the application of the model and then testing
the accuracy. If the approach does not yield the desired accuracy then a new model can
be tried.
The visual analysis was used as the method in which data as a whole was used as the
basis for analysis. The data was presented visually and any modelling could be done as
a result of the analysis of the visuals. The models in visuals may not be mathematical
but something else. The visual analysis is an important tool because it allows the
researcher to use the natural abilities to analyse the data holistically by examining the
patterns, trends and structures that are exposed by the attributes of data. According to
Cleveland (1993), visualisation is critical to data analysis. It provides a front line
attack, revealing intricate structures in data that cannot be absorbed in any other way.
The analysis of data was, therefore, done under two categories. The first category is the
Exploratory Data Analysis (EDA) while the second one is the Confirmatory Data

90
Analysis (CDA). Data mining, exploration and visual methods are grouped under this
category while classical or mathematical methods fall under the second category.
The EDA is an approach or philosophy for data analysis that employs a variety of
techniques mostly graphical in order to maximize insight into data set, uncover
underlying structure, extract important variables, detect anomalies, test assumptions and
develop models. The approach depends on the attitude of the person that analyses data
and on how the data is going to be analysed. The approach is synonymous with the
attitude. The philosophy of EDA, according to Tukey (1977) and Velleman and
Hoaglin (1981), is not identical to statistical graphics although the two terms are used
almost interchangeably. Statistical graphics is a collection of techniques that are
graphically based and all focusing on one data characterization aspect. EDA
encompasses a larger venue. It is an approach to data analysis that postpones the usual
assumptions about what kind of model the data follow with the more direct approach of
allowing the data itself to reveal its underlying structure and model (Box et al., 1978).
EDA is not a mere collection of techniques but is a philosophy of how the data is
dissected depending on what is looked for, how it is looked for and how it is interpreted.
There are a number of ways that are used in EDA for analysing data. Some of the
methods include, histogram, sequence plot, autocorrelation plot and lag plot. A
histogram may be used for the purpose of summarizing the distribution of univariate
data set graphically. A histogram shows graphically the centre or location of the data,
spread or scale of data, skewness, presence of outliers and multiple modes in the data.
The vertical axis shows the frequency while the horizontal axis the response variable.
A sequence plot is an easy way to graphically summarise univariate data sets
(Anscombe, 1973; Chambers et al., 1983; Du Toit et al., 1986). The assumption of
univariate data sets is that the data behaves like random drawings with a common
location, common scales from a fixed distribution. The shifts in location and scale are
quite evident from sequence plots and outliers can easily be detected. The
autocorrelation plots are common-used tool for checking randomness in data sets (Box
and Jenkins, 1976:28-32). Autocorrelations are also used in the model identification for

91
autoregressive, moving average time series models (Chatfield, 1989:20, 49-50). Lag
plots check the randomness or not of the data sets. The random data do not exhibit
identifiable structures in the plots. On the other hand, non-random structures in the
plots indicate that the data is not random. A lag is fixed time displaced in the given data
set.
The most techniques used in EDA include the probability plots and goodness of fit of
data (Kuo and Marcia 1993:199-223). The normal probability plots are techniques for
assessing whether data is normally distributed or not (Chambers et al., 1983). The
goodness of fit of data can be tested by the Anderson-Darling Test, which is used to test
if data came from a specific distribution (Stephens, 1974). The critical values for the
Anderson-Darling Test are dependent on the data distribution that is being tested.
Typical values and formulae for normal, lognormal, exponential etc are described in
Stephens (1974:730-737, 1976:357-369, 1977). In EDA, the data collection is followed
by the analysis with a view to determining the model. In the case of Bayesian analysis,
the researcher attempts to use scientific and engineering knowledge in the analysis by
imposing a data- independent distribution on the parameters of the selected model. The
analysis therefore consists of formally combining both the prior distribution on the
parameters and the collected data in order to jointly test the assumptions about the
parameters of the model. The building of a model follows the selection of the model,
model fitting and validation. In the model selection, the plots of data, process
knowledge and assumptions about the process are used to determine the type of model
that fits the data. The selected model and the information about the data are used to
select an appropriate model- fitting method that can be used to estimate the unknown
parameters in the model (NIST and SEMATECH, 2006). Once the parameters have
been estimated, the model is then carefully assessed to see if the assumptions of the
analysis appear plausible. The checks of model fit can be framed as comparisons to
replication distribution under posterior predictive distribution (Gelman, 2004). From
the Bayesian stand point, the parameters; data and replicated data have a joint
distribution, which is symmetrical (Meng, 1994, Gelman et al., 2003). The use of data

92
frame expands the data matrix in order to allow for more general structures (Chambers
and Hastie, 1992; Billard and Diday, 2003).
The models have been developed to fit complex and realistic data, which may include
the use of non-parametric and semi-parametric methods, sieve models, tree-based
models and adaptive linear regression methods (Tukey and Mosteller, 1978; Hastie et
al., 2002). On the other hand hierachical models based on parametric and Bayesian
methods capture heterogeneity and non- linearity (Carlin and Louis, 1996; Denison et
al., 2002). In this study, only EDA was used to analyse the data in order to determine
the models that best fit the collected data. In classical analysis (CA), sometimes called
mathematical method, which is similar to and the same as CDA, the data collection is
followed by the imposition of a model. Models such as normality, linearity, etc. are
followed by the analysis, estimation, and testing of the models which are focused on the
parameters of such models. In CDA, the evidence is an important element in the
analysis of data because the evidence allows the researcher to evaluate its strength and
judges its merits and applicability. The evidence is also the basis for the testing of
assumptions and models.
5.5 Summary
The methodology sets out the number of equipment that can be assembled and operated
in order to measure the parameters or variables. It describes the study design,
individual methods for assessing the variable relationships and the methods of analysing
data. The study design is an approach that is used to solve the identified problem using
predetermined methodology in order to achieve the objectives. The measurement of
voltage, current and temperature was achieved by using voltmeters, ammeters
thermometer respectively. The measurements of concentration were achieved by
weighing using analytical balance and 1-Litre or 2.5-Litre volumetric flasks. Various
combinations of smootheners were used in order to establish their effect on the current
density and efficiency at each setting of the reactor. The data analysis was carried out
using data exploration plot and bivariate correlations.

93
CHAPTER 6
RESULTS AND OBSERVATIONS
6.0 Introduction
The results presented in this chapter are the outcomes of numerous experiments that
were conducted during the study. A number of investigations were carried out
involving the effect of over-voltage, current density, and temperature, level of
impurities, surface smootheners, the active area and distance between electrodes on the
current efficiency. Because the high currents and voltages can cause instability in the
electrochemical system, it was important to initially determine the limiting currents
before evaluating the current efficiency.
6.1 Effect of Overvoltage on the Current and Curent Density
The conductivity of electrolyte depends on the type of electrolyte, the pH and the
temperature. Obviously, the limiting currents would not be the same at different
temperatures. The voltage and current density plots for electrochemical systems
containing 5% copper sulphate electrolyte revealed different limiting currents at
different temperatures for different distances of separations. At 24oC, as indicated in
Figure 6.1 and Appendix 5: A, the limiting current for electrode distances of 1, 2, 3 and
4cm were found to be 12, 6.0, 6.2 and 6.2 mA respectively. The highest value was for
the one-centimeter distance. The limiting voltages were found to be 1, 0.6, 0.7, and
0.7Volts for the 1, 2, 3, and 4cm distance between electrodes. As can be observed from
the results, the limiting values for the 1cm distance between the electrodes (both voltage
and current density), are higher than the ones for the other distances. These limiting
currents are too low to support the reduction of copper on the cathode-solution surface.

94
Figure 6.1: Effect of overvoltage on the current density at 24oC
At 39oC, the effect of overvoltage was investigated at distances of 1, 2, 3, and 4cm
distances between electrodes. The purpose was to determine the limiting current
densities in order to avoid the use of high values which could result in irregular
deposition of copper on the cathode. The current densities at this temperature were
observed to be different from those at 24oC. The values were found to be 40, 35, 35,
and 40mA/cm2 for the 1, 2, 3, and 4cm distances between electrodes respectively
(Figure 6.2 and Appendix 5: B). The corresponding limiting voltages were 0.8, 0.7, 0.6,
and 0.5 for the 1, 2, 3, and 4cm distances between electrodes respectively. These values
were found to be higher than those obtained at 24oC. When compared to current density
values reported by Pletcher and Walsh (1993: 75-77) for the recovery of copper (25-
40mA/cm2) these values fall within the acceptable range that would give an efficiency
of 95%. It would appear from the results that the 2 and 3cm distances between
electrodes would be the most appropriate at this temperature but the time for the
recovery of copper would be increased. This means that the cycle time for the removal
of copper from the cell would be increased. For example, one would use a period of
one hour instead of 30minutes or 30minutes instead of 15minutes. This enables the
system to collect more deposit on the cathode.

95
Figure 6.2: Effect of overvoltage on the current density at 39oC
The current densities of copper-sulphate electrolyte at 60oC and at different separations
of electrodes were found to be higher than those at 24oC and 39oC. The limiting current
densities were found to be 60, 65, 50, and 70mA/cm2 for the 1, 2, 3, and 4cm distances
between electrodes respectively (Figure 6.3 and Appendix 5: C). The corresponding
limiting overvoltages were 0.8, 1, 0.9, and 1.1Volts for the 1, 2, 3, and 4cm distance
between electrodes respectively. The increase in current densities can be attributed to
the complete ionisation of the electorlyte due to the heat of dissociation, solvation
provided by the surrrounding and that due to reaction between the acid and copper
sulphate. The limiting currents at this temperature provide a wide range of choice of
operating current for the reactor at all the four distances between electrodes (Cell Sizes).
Figure 6.3: Effect of overvoltage on current density at 60oC
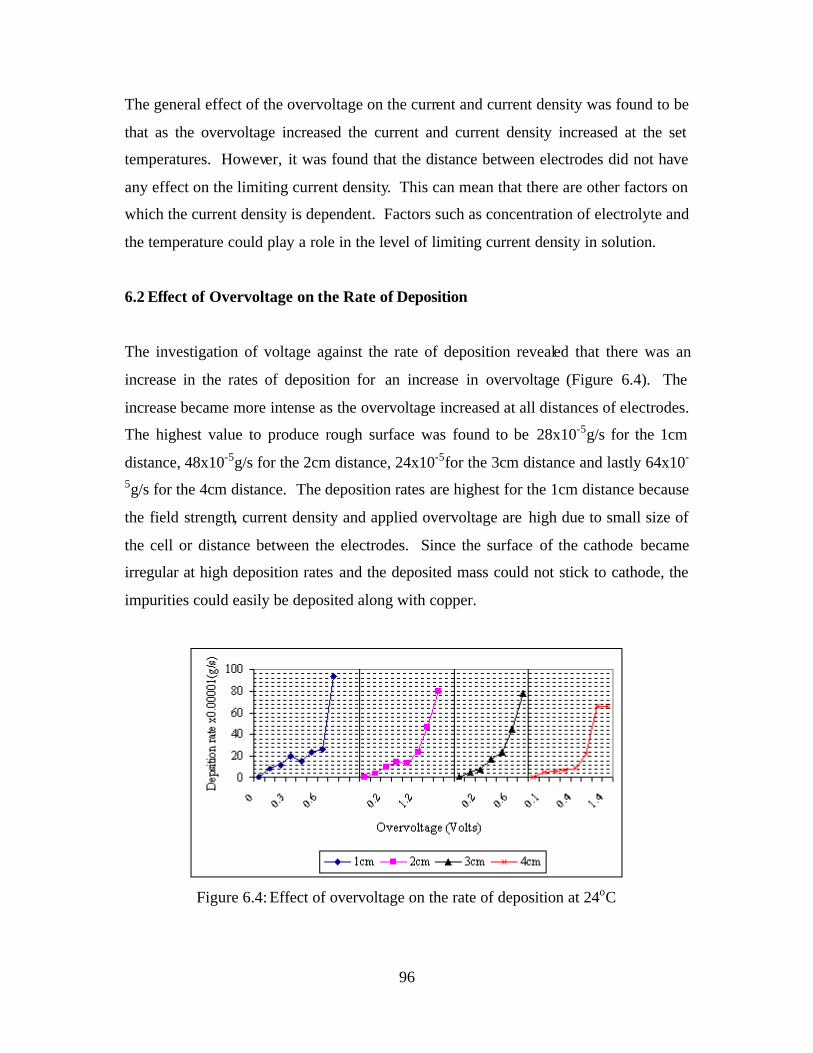
96
The general effect of the overvoltage on the current and current density was found to be
that as the overvoltage increased the current and current density increased at the set
temperatures. However, it was found that the distance between electrodes did not have
any effect on the limiting current density. This can mean that there are other factors on
which the current density is dependent. Factors such as concentration of electrolyte and
the temperature could play a role in the level of limiting current density in solution.
6.2 Effect of Overvoltage on the Rate of Deposition
The investigation of voltage against the rate of deposition revealed that there was an
increase in the rates of deposition for an increase in overvoltage (Figure 6.4). The
increase became more intense as the overvoltage increased at all distances of electrodes.
The highest value to produce rough surface was found to be 28x10-5g/s for the 1cm
distance, 48x10-5g/s for the 2cm distance, 24x10-5for the 3cm distance and lastly 64x10-
5g/s for the 4cm distance. The deposition rates are highest for the 1cm distance because
the field strength, current density and applied overvoltage are high due to small size of
the cell or distance between the electrodes. Since the surface of the cathode became
irregular at high deposition rates and the deposited mass could not stick to cathode, the
impurities could easily be deposited along with copper.
Figure 6.4: Effect of overvoltage on the rate of deposition at 24oC

97
The deposition-voltage curves are similar to current-voltage curves. The region where
the curves are steep, after the limiting overvoltage, the system became unstable and the
liberation of hydrogen produced spongy-copper deposit onto the cathode. The rate of
deposition increased as the voltage increased. The rate of deposition at 0.3 Volts was
lower (19.8x10⁻⁵g/s) than that at 0.6Volts (27x10-5g/s) for the 1cm distance. That at 0.2
Volts was lower (10x10-5g/s) than that at 1.2 Volts (24x10-5g/s) for the 2cm distance
and that at 0.2 Volts (7.6x10⁻⁵g/s) was lower than that at 0.6Volts (45x10-5g/s) for the
3cm distance between electrodes (Figure 6.4). Similarly, the deposition rate at 0.4 was
lower (8.5x10⁻⁵g/s) than that at 1.4volts (66x10-5g/s) for the 4cm distance between
electrodes signifying that the applied voltage influenced the deposition of copper from
solution.
It is therefore important to examine the deposition rates and such rates can also be used
as means to determine the stable operating region for the reactor. For example, for the
1cm distance 0.6Volts would be the maximum operating voltage while that for the 2, 3
and 4cm distances is 0.5, 0.5 and 0.4 volts respectively because the use of voltage above
these levels for the stated distances would produce irregular- loose deposit on the
cathode. The results in Figure 6.5 show the effect of overvoltage on the rate of
deposition at 39oC for a 5% concentration of electrolyte solution at electrode distances
of 1, 2, 3, and 4cm.
-20
0
20
40
60
80
100
120
140
0 0.2 0.4 0.6 0.8 1 1.2 1.4
Overvoltage (Volts)
Dep
ositio
n ra
te x
0.0
0001
(g/s
)
1cm 2cm 3cm 4cm
Figure 6.5: Effect of overvoltage on the rate of deposition at 39oC

98
The general correlation between the overvoltage and the deposition rate was that the
rate increased as the overvoltage (overpotential) increased at all the distances between
electrodes. The other observations were that the lowest values of deposition rates at
0.1Volts were 8.6x10⁻⁵, 9.5x10⁻⁵, 5x10⁻⁵, and 6.3x10⁻⁵g/s for the 1, 2, 3, and 4cm
distances between electrode respectively while the highest values reached in the study
were 123x10-3at 1.0Volts for 1cm distance, 65x10-5g/s at 1.0 Volts for a 2cm distance,
114x10-5g/s at 1.3Volts for the 3cm distance and 32x10-5g/s at 1.0Volts for the 4cm
distance. At voltages above 0.8Volts a non-sticking spongy deposit was observed at the
cathode. The spongy deposit made it difficult to clean the cathodes because cleaning
could result in loss of the spongy deposit of copper and thus could contribute to the
error in the efficiency. The deposition rates below these values for each distance
produced a smooth deposit with a copper brown colour. However it was observed that
the use of voltage above the limiting value resulted in an irregular, non-sticking and
nodular deposit which signified an unstable system. The irregular-spongy deposit could
be lost during the washing and therefore could contribute to the increase in error in the
rate of deposition and hence the current efficiency as stated earlier. This is the reason
why the limiting current was determined before the experiments started.
The effect of overvoltage on the rate of deposition at 60oC revealed a number of
patterns in correlations (Figure 6.6). There was an increase in the deposition rates for
all distances between electrodes. The lowest rates were 8.8x10⁻⁵g/s for 1cm distance
while those of 2cm, 3, and 4cm distances were 9.2 x10⁻⁵g/s, 3.8 x10⁻⁵g/s and 4.1 x10-
5g/s respectively at 0.1Volts. The highest values of deposition rates for each distance
between electrodes (1-4cm) were 170 x10-5g/s at 1Volt, 150 x10-5g/s at 1.6 Volt, 132
x10-5g/s at 1.6 Volts and 119 x10-5g/s at 1.8 Volts respectively. If we can examine the
deposition rate for the same overvoltage and each size of the cell we can see that the
values are decreasing as the size of the cell increases. For example, at 1Volt the
deposition rate is 170 x10-5g/s for the 1cm size, 80 x10-5g/s for the 2cm size, 78 x10-5g/s
for the 3cm size and 48 x10-5g/s for the 4cm size. In general, the deposition rate was
found to decrease with the increase in distance. Whilst there was an increase in rates of
deposition with the increase in overvoltage, there was also a corresponding decrease in

99
concentration of copper sulphate solution. It is important to note also that the rates of
deposition were found to be much higher when the voltages exceeded the limiting
values. The increased rates meant that even the elements that have reduction potentials
higher to that of copper could be deposited also. The weight of the deposit would thus
be increased and the current efficiency would be affected especially for efficiencies
greater than 100%.
-50
0
50
100
150
200
0 0.5 1 1.5 2
Overvoltage (Volts)
Dep
ositi
on ra
te x
0.0
0001
(g/s
)
1cm 2cm 3cm 4cm
Figure 6.6: Effect of overvoltage on the rate of deposition at 60oC
6.3 Effect of Temperature on Current Density and Efficiency
It has been observed that the temperature enhances the conductivity of ions in solution.
Increased temperatures increase the conductivity of solutions. The increased
temperatures enhance the dissolution of electrolyte into the solvent thereby increasing
the number of ions and at the same time increasing the conductivity. These effects were
found to contribute to the levels of current density and efficiency. The limiting
overvoltages were found to be in the same range (0.5-1.1Volts) but these produced the
lowest values of current densities at 24oC, increased values at 39oC and the highest
values were at 60oC. This explains why the choice of operation temperature for the
process had to be 60oC. The results in Figure 6.7 further shows that increasing the
temperature resulted in the increase in the limiting current density. This phenomenon
was observed for all distances between electrodes.

100
Figure 6.7: Effect of temperature on the limiting current densities
The effect of temperature on the current efficiency, without adding the additives, as
shown in Figure 6.8 revealed the most stable and highest efficiencies at distances
between electrodes of 2 and 3cm at 24, 39 and 60oC. The lowering of current efficiency
due to distance was observed at 4cm at 60oC. This implies that the temperature had
little effect on the current efficiency. The choice of the 2cm distance that was used in
further experiments was based on the results from experiments conducted so far.
Unacceptable values of efficiencies were observed in the case of 1cm distance between
electrodes where the efficiency higher than 100%, which is the maximum, was observed
at 60oC. This was due to inadequate distance between electrodes which resulted in
excessive overvoltage and current density to develop across the reactor.
0
0.2
0.4
0.6
0.8
1
1.2
1.4
0 10 20 30 40 50 60 70
Temperature (*C)
Cur
rent
eff
icie
ncyx
100
(%)
1cm
2cm
3cm
4cm
Figure 6.8: Effect of temperature on the current efficiency at 0.3Volts

101
Generally, the temperature did not have any effect on the current efficiency as is
observed in Figure 6.8 for values at 24oC and 39oC for all distances between electrodes
and values for the 2, 3 and 4cm distances between electrodes. The decline of values for
the 4cm distance might be due to effects of concentration and separation distance. At
4cm electrode distance, the values of efficiencies fell below the maximum value (100%)
and therefore were not acceptable. Since high efficiencies (68<CE<100%) could be
obtained at all the temperatures, effects of temperature could only be considered in the
temperature–concentration of electrolyte system where, as alluded earlier, the
temperature aids the dissociation process of electrolyte. The efficiency at 60oC for the
1cm distance between electrodes indicates a distance effect rather than temperature
effect and its high value (120%) can be due to increased current density developed at
the electrodes, as a result of inadequate distance, that resulted in irregular depositions to
be obtained at values of overvoltage from 0.4Volts and above which resulted in
unacceptable current efficiency to be obtained.
The fact that the 1cm distance is small, high current density could easily be achieved
when 0.3Volts was applied while a low current density could easily be achieved at the
4cm distance due to the increase in distance between electrodes. This is due to the fact
that as the distance between electrodes increases, the field strength that produces the
current density weakens due to the weakened potential affected by increased resistance
due to water molecules in solution. Although the conductivity is increased at higher
temperatures, the efficiency can be reduced when the current density is lowered by
lowering the temperature which induces the dissociation of electrolyte in solution. This
means that temperatures below 24oC would produce fewer ions in solution and hence
the efficiency would be unstable because the system would starve for ions sooner than
the chosen normal period of electrorefining. In the same token, the temperatures above
60oC would allow the water in the solution to evaporate quicker than expected due to
excess heat at such high temperatures. Most organic smootheners would break down
particularly those from cellulose material. It is for this reason that the temperatures
between 24<T<60oC were chosen for the study. The 60oC was particularly chosen for
the later parts of the study because it would allow the copper sulphate to release

102
adequate ions in solution as indicated by the increase in current density with the
increase in temperature.
6.4 Effect of Current Density on Current Efficiency
The effect of current density on the current efficiency was investigated at temperatures
of 24oC, 39oC and 60oC and distances between electrodes of 1, 2, 3, and 4cm as shown
by Figures 6.9, 6.10, 6.11 and Appendices 1, 2, and 3 using data exploration method of
analysis. The results for the 1cm and 4cm distances showed efficiencies above 100% at
current densities greater than 74mA/cm2 at 24oC while the efficiencies for the 2 and
3cm distances were found to be normal (80<CE<100%) (Figure 6.9).
Figure 6.9: Effect of current density on the current efficiency at 24oC
At 39oC, the results for the 1cm distance between electrodes showed a similar pattern as
those for the 1cm distance at 24oC (Figure 6.10). The values for the 2cm distance
showed some values of efficiencies to be above 100% for current densities above
50mA/cm2. For the case of the 3cm distance, increased values of efficiencies at current
densities above 73mA/cm2 were observed whilst the efficiencies above 100% were also
observed above 30mA/cm2 for the 4cm distance between electrodes. It can be
concluded from the results that stable efficiencies can be obtained for the 2 and 3cm
distances between electrodes at the current densities below the 50 and 73mA/cm2
respectively. It can also be concluded that efficiencies above 100% mean that
erroneous readings, error in weighing and parallel reactions may have occurred.
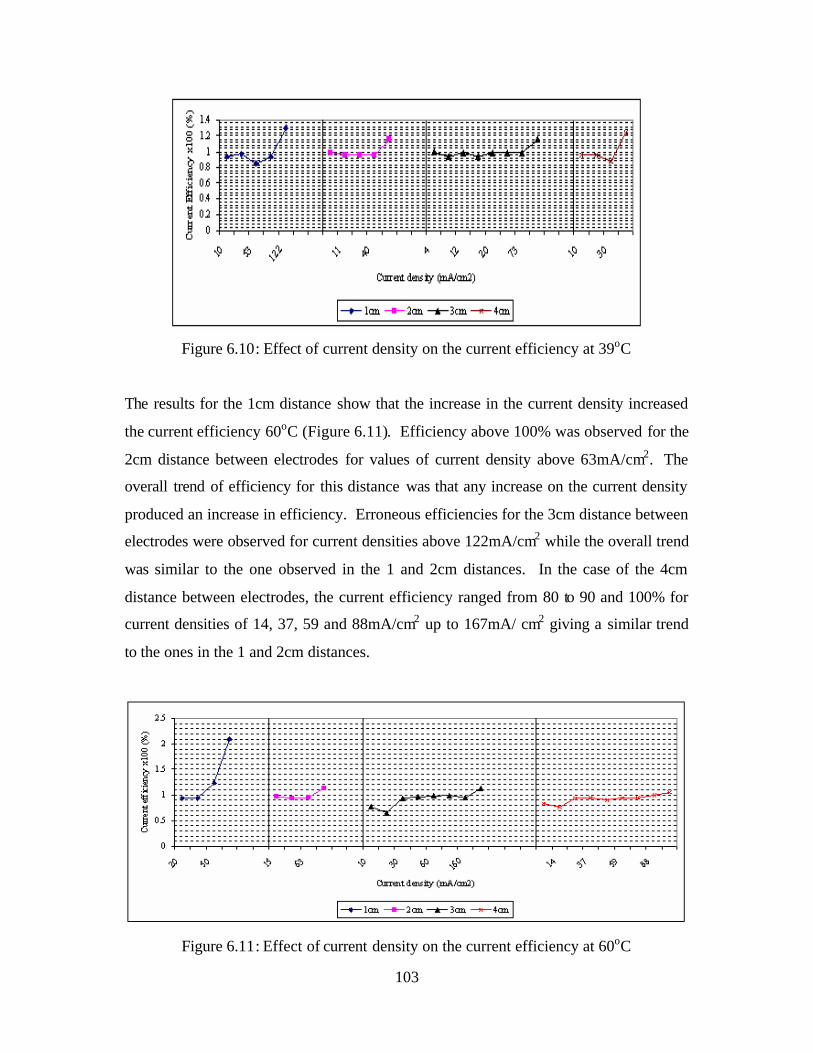
103
Figure 6.10: Effect of current density on the current efficiency at 39oC
The results for the 1cm distance show that the increase in the current density increased
the current efficiency 60oC (Figure 6.11). Efficiency above 100% was observed for the
2cm distance between electrodes for values of current density above 63mA/cm2. The
overall trend of efficiency for this distance was that any increase on the current density
produced an increase in efficiency. Erroneous efficiencies for the 3cm distance between
electrodes were observed for current densities above 122mA/cm2 while the overall trend
was similar to the one observed in the 1 and 2cm distances. In the case of the 4cm
distance between electrodes, the current efficiency ranged from 80 to 90 and 100% for
current densities of 14, 37, 59 and 88mA/cm2 up to 167mA/ cm2 giving a similar trend
to the ones in the 1 and 2cm distances.
Figure 6.11: Effect of current density on the current efficiency at 60oC

104
6.5 Effect of Distance between Electrodes
The effect of distance between electrodes was investigated against the current in the
circuit for a fixed voltage at three different temperatures (24, 39 and 60oC). The results
showed that the 1cm distance between electrodes had the highest currents for all the
three temperatures with values of 0.5, 0.5 and 0.6Amps respective ly (Figure 6.12). For
the 2cm distance the highest and lowest values of current were 0.5Amps and 0.3Amps
respectively while in the case of 3cm distance, the highest value of current was
0.3Amps at 60oC (T60) and the lowest was 0.2Amps at 24oC (T24) and 39oC (T39). In
the case of the 4cm distance between electrodes, the highest and lowest values of
current at 60oC were 0.14 and 0.08 Amps respectively. The results mean that increasing
the distance between electrodes increases the resistance across the cell and therefore
reduces the current strength and the current density on the active areas of the electrodes.
The reduced current density can increase the time for the deposition due to decreased
deposition rate that follows at lowered values of current density.
0
0.1
0.2
0.3
0.4
0.5
0.6
0.7
1 1.5 2 2.5 3 3.5 4
Distance between electrodes (cm)
Cur
rent
(Am
ps)
T24 T39 T60
Figure 6.12: Effect of distance between electrodes on the current
It is therefore important to determine the appropriate current for the deposition before
the actual operation of the reactors. The practice is to carry out a quick assessment of

105
the current using voltamograph for a particular system which is determined by the
concentration of electrolyte and the cell overvoltage.
The effect of distance between electrodes was investigated, also, in terms of the
variability between the rate of deposition and the separation of electrodes at the same
current. The results showed that at 24oC the highest deposition rate was at 9.2x10⁻⁴g/s
at 2cm distance while the lowest rate was found to be 2.8x10⁻⁴g/s at 4cm distance. The
deposition rates at 39oC showed the highest rate was 9.6x10⁻⁴g/s at 1cm distance while
the lowest rate was 1.2x10⁻⁴g/s for the 4cm distance. In the case of 60oC temperature,
the highest deposition rate (Rr) was 10.8x10⁻⁴g/s while the lowest value was for the 4cm
distance at 2.4x10⁻⁴g/s (Figure 6.13). At T24 the rate of deposition decreased as the
current decreased. A similar pattern was observed at temperatures T39 and T60. It
means therefore that increasing the distance between electrodes decreases the current
and current density and therefore decreases the rate of deposition due to decreased
electric field strength on the electrode-active area.
0
2
4
6
8
10
12
0 1 2 3 4 5
Distance between electrodes (cm)
Rat
e of
dep
ositi
on x
0.00
01 (g
/s)
T24
T39
T60
Figure 6.13: Effect of distance between electrodes on the rates of deposition
The effect of distance between electrodes on the current efficiency was investigated at
the same fixed voltage (0.3V) at three different temperatures (24, 39 and 60oC). The
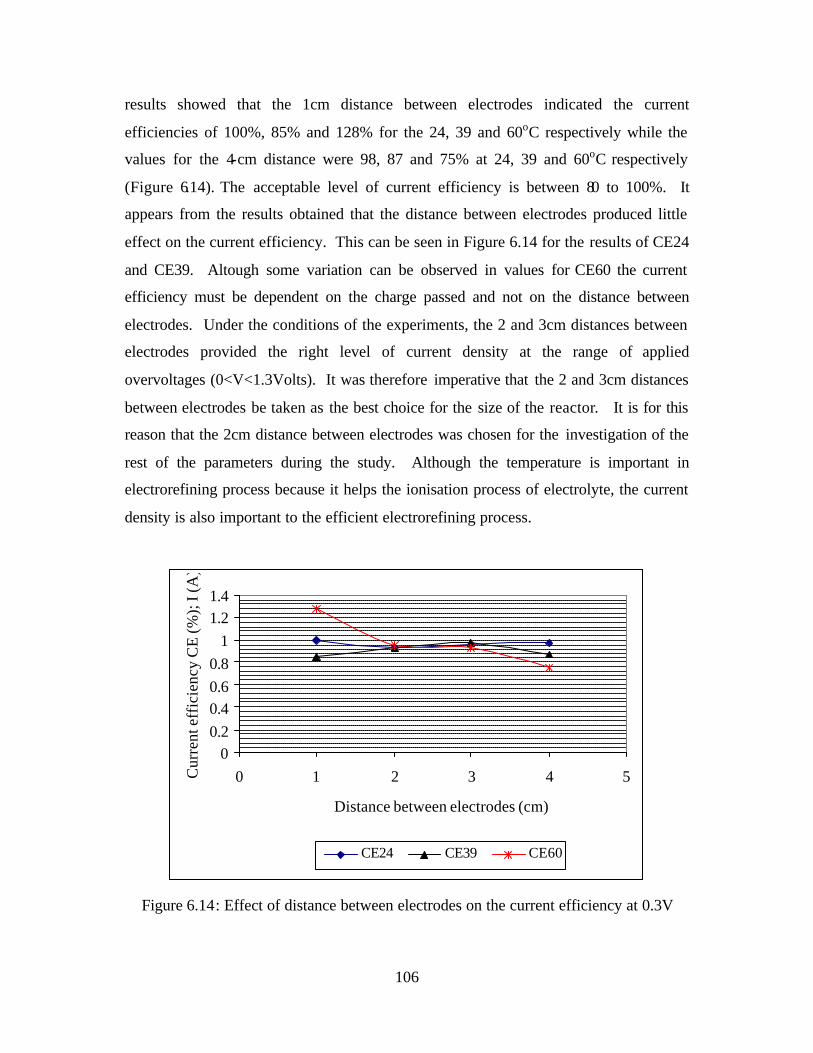
106
results showed that the 1cm distance between electrodes indicated the current
efficiencies of 100%, 85% and 128% for the 24, 39 and 60oC respectively while the
values for the 4-cm distance were 98, 87 and 75% at 24, 39 and 60oC respectively
(Figure 6.14). The acceptable level of current efficiency is between 80 to 100%. It
appears from the results obtained that the distance between electrodes produced little
effect on the current efficiency. This can be seen in Figure 6.14 for the results of CE24
and CE39. Altough some variation can be observed in values for CE60 the current
efficiency must be dependent on the charge passed and not on the distance between
electrodes. Under the conditions of the experiments, the 2 and 3cm distances between
electrodes provided the right level of current density at the range of applied
overvoltages (0<V<1.3Volts). It was therefore imperative that the 2 and 3cm distances
between electrodes be taken as the best choice for the size of the reactor. It is for this
reason that the 2cm distance between electrodes was chosen for the investigation of the
rest of the parameters during the study. Although the temperature is important in
electrorefining process because it helps the ionisation process of electrolyte, the current
density is also important to the efficient electrorefining process.
00.20.40.60.8
11.21.4
0 1 2 3 4 5
Distance between electrodes (cm)
Cur
rent
eff
icie
ncy
CE
(%);
I (A
)
CE24 CE39 CE60
Figure 6.14: Effect of distance between electrodes on the current efficiency at 0.3V

107
Apart from choosing the correct distance between electrodes and the temperature, the
factors such as electrode-active area and concentration of electrolyte could contribute to
the efficient operation of electrorefining. The designer of the reactors should ensure that
the electrodes provide adequate electrode-active area to allow the smooth recovery of
copper from solutions.
6.6 Effect of Concentration on Current Density and Current Efficiency
The solution of electrolyte was prepared in varying concentrations from 1.5g/L to
74g/L. The individual concentrations were 1.5, 3, 6, 8.9, 14.8, 29.6, 59.2 and 74g/L.
Other details can be seen in Appendix 4. A voltamogram was taken for each solution in
order to determine the limiting currents (Figures 6.15a and 6.15b). The results of the
voltamogram showed low values of limiting currents for solutions with low
concentration, and high values for solutions with high concentration. A solution with
1.5g/L concentration, which was the least, gave a limiting current density of 1.5mA/cm2
while the solution with a concentration of 74g/L, which was the highest, gave a limiting
current of 70mA/cm2. The limiting currents for 3, 6, 8.9, 29.6 and 59.2 were found to be
3, 6, 7, 16, 32, and 60mA/cm2. It can be observed from these findings that the values of
limiting currents are equal to the concentration of the solutions in the case of very low
concentrations or dilute solutions only.
Figure 6.15a: Effect of electrolyte concentration on the limiting current at 60oC
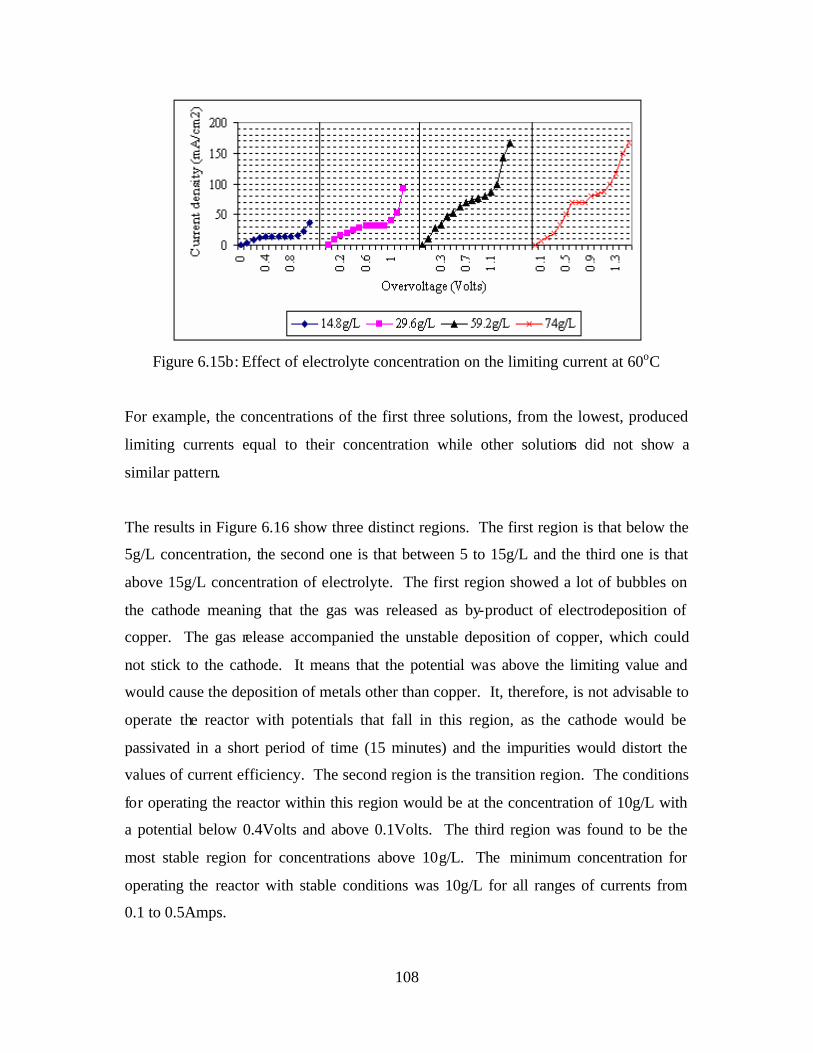
108
Figure 6.15b: Effect of electrolyte concentration on the limiting current at 60oC
For example, the concentrations of the first three solutions, from the lowest, produced
limiting currents equal to their concentration while other solutions did not show a
similar pattern.
The results in Figure 6.16 show three distinct regions. The first region is that below the
5g/L concentration, the second one is that between 5 to 15g/L and the third one is that
above 15g/L concentration of electrolyte. The first region showed a lot of bubbles on
the cathode meaning that the gas was released as by-product of electrodeposition of
copper. The gas release accompanied the unstable deposition of copper, which could
not stick to the cathode. It means that the potential was above the limiting value and
would cause the deposition of metals other than copper. It, therefore, is not advisable to
operate the reactor with potentials that fall in this region, as the cathode would be
passivated in a short period of time (15 minutes) and the impurities would distort the
values of current efficiency. The second region is the transition region. The conditions
for operating the reactor within this region would be at the concentration of 10g/L with
a potential below 0.4Volts and above 0.1Volts. The third region was found to be the
most stable region for concentrations above 10g/L. The minimum concentration for
operating the reactor with stable conditions was 10g/L for all ranges of currents from
0.1 to 0.5Amps.

109
0
0.5
1
1.5
2
2.5
1 2 5 10 15 50
Concentration of electrolyte (g/L)
Ove
rvol
tage
(Vol
ts)
0.1A 0.2A 0.3A 0.4A 0.5A
Figure 6.16: Effect of concentration on the cell overpotential
The current efficiency is usually affected when the deposition process is unstable. The
instability is caused by the use of high potential which drives the ions hurriedly to the
cathode. The cathode releases the gas instead of the anode. The result is that the
reduced ions do not have enough time to embed themselves onto the cathode and
therefore remain attached to the cathode loosely creating a loose layer, which eventually
passivates the cathode and the reaction stops within 10 to 30 minutes. One of the
conditions that create high potentials in the electrolytic reactors is the use of low
concentrations. It can be observed in Figure 6.16 that the potentials created by
concentrations below 5g/L are all within the unstable region and therefore the current
efficiencies would be greatly affected. The other condition is the use of high current or
current densities that produce current efficiencies greater than 100%. This has already
been discussed in the above sections where it was established that high levels of current
or current densities produce increased rates of deposition of copper on the cathode,
which may lead to the formation of nodules that can cause short circuits. Conversely
low potentials and currents produced low deposition rates. However concentrations
greater than 10g/L produced stable conditions and provided adequate ions necessary for
electrodeposition of copper on the cathode.

110
0
10
20
30
40
50
0 10 20 30 40 50 60
Concentration of electrolyte (g/L)
Cur
rent
den
sity
(mA
/cm
2);
Res
ista
nce
(Ohm
s)
j0.4V R0.4V j0.25V R0.25V
Figure 6.17: Effect of concentration on resistance, current density and potentials
The investigation of electrolyte concentration and cur rent density and resistance
revealed two key observations. The cell resistance increased with decreased level of
concentration and conversely the resistance decreased with the increase in
concentration. The current density decreased with the decrease in concentration and
conversely the current density increased with the increase in concentration of electrolyte
(Figure 6.17). The highest resistance was in 1g/L at 25 and 20O for the 0.25Volts
(R0.25V) and 0.4Volts (R0.4V) respectively while the lowest was in 50g/L
concentration of electrolyte. The highest concentration in the study was 50g/L while
the lowest was 1g/L of copper sulphate. This translates to 19.9g/L and 0.398g/L of
copper respectively. The highest concentration of electrolyte produced the highest
current densities of 40mA/cm2 at 0.4Volts (j0.4V) and 20mA/cm2 at 0.25V (j0.25V)
while the lowest concentration produced the lowest current densities of 2mA/cm2 at
0.4Volts and 1mA/cm2) at 0.25Volts. These results mean that the conditions favour the
recovery of copper at concentrations above 10g/L; the best starting point being 15g/L.
The use of the voltage range of 0.25 to 0.4Volts did not present any problem to the
circular reactor. Any potential within this range would be suitable for the recovery of
copper at concentrations above 15g/L of copper-sulphate solutions. However, the use
of low concentrations below the 15g/L more so below 10g/L, has the disadvantage of
high resistance to the flow of ions or current between electrodes in the reactor. The
reason is that the molecules of water would exceed molecules of the electrolyte. This

111
makes it difficult for the current to flow. It means that the voltage has to rise in order to
produce a significant level of current. The results in Figure 6.17 also show that the
resistance is high for concentrations below the 15g/L value as compared to the ones
above the same level. It also means that if one has to operate the reactor effectively,
one has to choose concentrations above the 15g/L level. Obviously, the current
efficiency would be affected; increasing for concentrations above 15g/L level and
decreasing for concentrations below the same level.
The effect of concentration on the current efficiency can be seen in Figure 6.18. The
limiting current density (Lj) increased with the increase in concentration showing a
stable increase at concentrations above 10.8g/L. For concentrations below the 10.8g/L
the limiting current density was unstable and so was the current efficiency (CE)
indicating a decrease in this region but a stable efficiency above this concentration. The
current density (j) increased up to the 10.8g/L level and remained constant for values
above it. The limiting current increased as the concentration of electrolyte increased. It
is therefore not recommended that the reactor operates at concentrations below 10.8g/L
as unstable values of current efficiency would be obtained making the operation
inefficient. The current efficiency for this region was found to be between 65 to 115%.
0
20
40
60
80
100
120
0 20 40 60 80
Concentration of electrolyte (g/L)
Cur
rent
eff
icie
ncy
CE
(%);
J (m
A/c
m2)
; Lj (
mA
/cm
2)
LjjCE
Figure 6.18: Effect of concentration on current density and efficiency at 60oC

112
The efficiency of 115% is unacceptable as the maximum efficiency is 100%. The high
result could be due to low concentration which produced an unstable system. The
voltage could drive other metals along with copper to the cathode.
6.7 Effect of Impurities on the Current and Current Efficiency
The information in Figure 6.19 and Appendix 7:A shows the voltamographs that were
determined in order to establish the operating current density for the system (50g/L
CuSO4 + 90g H2SO4) in the presence of different levels of concentrations of impurity
(Ni + Fe + C0) prepared as 1000ppm of solution. The results showed that for the
impurity concentrations of 1ppm, 6ppm, 12ppm and 20ppm the limiting currents were
0.91, 1, 1.1 and 1.2amps respectively. The results mean that a choice of current of up to
0.91amps can be made for the safe operation of the reactor in order to observe any
effect of impurities on the current efficiency. The choice of current of 0.5amps which
represents a current density of 25mA/cm2 for an overvoltage of 0.2 volts were used to
establish the effect of impurities on the efficiency. It was observed that the combined
impurity (Fe + Co + Ni) had no effect on the current efficiency at concentration levels
of 1 to >100ppm (Appendix 7: B).
Figure 6.19: Effect of metals with highly negative oxidation potentials

113
The reason for this was that the concentration of copper sulphate is higher than that of
the impurity and therefore if there was any competition, it could not be significant to
produce any effect on the deposition of copper on the cathode since the reduction
potential for copper (0.34V) is lower than that of the metal ions of Iron (III) (0.77V) but
much higher than Zinc (II) (-0.76V) Nickel (II) (-0.25V) and Cobalt (II) (-0.28V).
Other systems of impurities, particularly systems that will have impurities that have the
same reduction potentials or close to the reduction potentia l of copper were
investigated.
The systems of impurities using silver nitrate and bismuth nitrate were used as study
cases. The silver nitrate solution (0.1M) was prepared by dissolving 16.99g of the
electrolyte in distilled water and the volume was made up to one Litre. Volumes of 1,
2, 5, 10, and 20ml of silver nitrate (AgNO3), molecular mass of 169.9g/mol, were added
to samples 1, 2, 3, 4, 5 of copper sulphate solution (50g/L) and the volume was made up
to 250ml respectively. The concentration of silver nitrate in samples 1, 2, 3, 4, and 5
were 0.03, 0.06, 0.14, 0.3, and 0.6g/L respectively. The control sample did not contain
silver nitrate. The results of the voltamograph in Figure 6.20 show that the silver nitrate
as impurity affected the limiting current. The control sample with 0g/L of silver nitrate
shows clearly that the limiting current density is at the level of 50mA/cm2 and that of
0.03g/L of silver nitrate attained 70mA/cm2 level.
0
50
100
150
200
250
0 0.5 1 1.5 2
Overvoltage (Volts)
Cur
rent
den
sity
(mA
/cm
2)
0g/L
.03g/L
.06g/L
.14g/L
.3g/L
.6g/L
Figure 6.20: Effect of silver nitrate on the limiting current density

114
The concentrations from 0.06 to 0.6g/L of silver nitrate interfered with the limiting
current density formation and the voltamographs are almost linear. The normal
voltamograph is that of the sample with no impur ity (control sample), which shows a
linear ascent up to the limiting value and stays horizontal from 0.4 to 1Volts after which
the ascent is linear again but does not carry on with linearity (confirmation may be
required). For the purposes of this study the measurements went up to 200mA/cm2
(5Amps) for the dependent variable and 1.6Volts maximum for the independent
variable. The significance of these results is that they can be used to determine the
presence of impurities that have the same reduction potentials as copper. It would be
difficult, however, to determine the limiting current for samples that contain high levels
of impurities, as the voltamographs would be linear in such cases. Perhaps the trial and
error method would lead to the determination of such values. The results of the effect
of silver nitrate on the current efficiency at constant current (I) revealed two patterns; a
steep decline of the efficiency curve and a slow slanting curve. The steep-decline curve
from the current efficiencies (CE) of 101% to 30% indicates that there was a slow
inhibition of the deposition of copper (m) to the cathode (Figure 6.21). No visible
deposits of silver metal were obtained on the surface. One would say that the inhibition
was due to the competition between the metals copper and silver.
0
0.2
0.4
0.6
0.8
1
1.2
0 0.2 0.4 0.6 0.8CE
x100
(%);
m (g
), C
urre
nt (A
)
Concentration of Silver Nitrate (g/L)
CE
m
I
Figure 6.21: Effect of silver nitrate on the current efficiency

115
In the case of the slow-decline curve, there was a strong inhibition on the deposition of
copper to the cathode. This was demonstrated by the formation of visible layer of
silver on the surface of both the cathode and anode. One notable feature was that even
when the current was not allowed to pass through the circuit, silver was observed to
surround the electrodes completely within a one-minute period. The inhibition
continued until the concentration of 0.6g/L of silver nitrate produced no deposit on the
cathode. The mass deposited in the fifteen-minute duration was zero for a current of
0.5Amps and a potential of 0.15Vo lts and therefore the rate of deposition (g/s) was also
zero at this concentration level of impurity. This is a total inhibition of copper but
silver metal was seen to deposit on the layer that covered the electrodes. The highest
efficiency was that of the control sample while the lowest current efficiency was tha t of
the sample with 0.6g/L of silver nitrate solution. Therefore the presence of silver
nitrate, as impurity, produced a negative effect on the current efficiency because the
current efficiency decreased with the increase in the concentration of impurity.
The system with bismuth nitrate (Bi(NO3)3.5H2O), molecular mass of 484.98g/mol, as
impurity was investigated in the circular batch reactor at 60oC. Five samples were used
in the investigation; a control sample with 0% concentration of bismuth nitrate and four
samples each with 0.05, 0.22, 0.5 and 1.48% concentration of Bismuth Nitrate in reactor
electrolyte. A voltamograph provides an idea as to whether impurities are present if the
voltamograph of electrolytes containing impurities deviate from the characteristics of
that of the control sample. A check on the current density for an active area of 25cm2
revealed two deviations from normal. The current density was lowered for voltage
values greater than 1.1Volts i. e., just above the normal limiting current density for the
control sample. This was exhibited in all the samples more so in samples with 0.22 and
0.5% concentration of bismuth nitrate (Figure 6.22). The other notable feature of the
voltamographs is that the voltamograph of electrolyte with 1.48% concentration of
bismuth nitrate, revealed a highest value of limiting current density (120mA/cm2) while
the rest of electrolytes with impurities exhibited the lowest current density (50mA/cm2).
The advantage with bismuth nitrate is that it precipitates into white crystals when the

116
electrochemical reaction proceeds. It also precipitates readily in the presence of
chlorides to bismuth chloride, which are white crystals. The addition of chloride
compound to electrolytes introduces this benefit of removing bismuth in the bulk of
electrolyte to the bottom of the reactor. This is why most copper refineries introduce
either sodium chloride or potassium chloride in the electrolyte at some point in the
refinery or direct into the reactors before or during the recovery of copper.
0
50
100
150
200
250
0 0.5 1 1.5 2
Overvoltage (Volts)
Cur
rent
den
sity
(mA
/cm
2)
0.00%
0.05%
0.22%
0.50%
1.48%
3.10%
Figure 6.22: Effect of bismuth nitrate on current density
It can be concluded therefore that bismuth nitrate affected the current density more so at
values above the limiting current density of the control sample. The limiting value
deviated especially when the concentration of bismuth nitrate was 1.48% and above.
The graphs for the 1.48% and 3.1% exhibited linearity. These levels of concentration
cannot be used as criterion for the estimation of the limiting current. It can also be
estimated that the resistance remains constant at these levels of impurities.
The current efficiency was investigated at the same levels as those at which the
voltamographs were taken using two different currents and current densities. The
results were recorded at 0.5 and 0.8Amp currents and 0.2 and 0.3V overvoltage
respectively. The results in Figure 6.23 and Appendix 7C revealed a decrease in current
efficiency as the level of bismuth nitrate increased. The control sample produced the
highest current efficiency at both the 20mA/cm2 (0.5A, 25cm2) current density and 0.2V

117
and 40mA/cm2 current density (0.8A, 25cm2) and 0.3V. The 3.1% concentration of
bismuth nitrate produced the lowest current efficiency at both the 0.5A and 0.2V and
0.8A and 0.3V respectively. Even though the effect is less than that of silver nitrate, the
current efficiency need not be lowered at any time. Electrode potential for bismuth (III)
is 0.32V which is close to that of copper (Appendix 7D). However it could not deposit
on cathode but formed a white precipitate that could retard the deposition process.
0
0.2
0.4
0.6
0.8
1
1.2
0 0.05 0.22 0.54 1.48 3.1
Concentration of Bismuth Nitrate (%)
Cur
rent
eff
icie
ncy
x100
%
0.5A
0.8A
Figure 6.23: Effect of bismuth nitrate on current efficiency
6.8 Effect of Electrode-active Area on the Current Efficiency
The active area of the electrode affected the limiting current as indicated in Figure 6.24
and Appendix 6: A and B. Five different distances were used during the investigation
(10, 12.5, 17.5, 22.5 and 30cm2). The results show that the limiting current for a small
active area (10cm2) was lower (60mA/cm2) when compared to those of the other active
areas. The highest active area (30cm2) exhibited the highest limiting current
(80mA/cm2). The values for the 2cm and 3cm distances were found to be 65 and
70mA/cm2 respectively. This means that the active area produces some effect on the
limiting current density because changes in the limiting current density as indicated by
the range of 60-80mA/cm2 can produce changes in the behaviour of the cell. The rate
of reaction and therefore the rate of deposition of copper can be affected. If there is a
drop of current density by 20mA/cm2, there is a corresponding drop of mass deposited
at the cathode.

118
Figure 6.24: Effect of active area on limiting current density for a distance of 2cm
The determination of the limiting current by carrying out a voltametric investigation,
allows the researcher to choose the correct level of operating current because the use of
currents above the limiting value results in accelerated deposits, which could lead to
poor deposition on the surface. The effect of active area on the current density can be
observed in Table 6.1 in which the increase in electrode active area produces a decrease
in the current density. It can be observed that the voltage across the cell decreases as
the active area increases. The decrease in the current density produces a decrease in the
deposition of copper from solution at fixed time and current.
Table 6.1: The effect of electrode active area on the current density
Time
(min.)
Area
(cm2)
η
(V)
I
(A)
j
(A/cm2)
M
(g)
Temp
(oC)
Distance
(cm)
15 10 0.3 0.5 0.050 0.1746 60 2
15 12.5 0.3 0.5 0.040 0.1455 60 2
15 17.5 0.2 0.5 0.030 0.1397 60 2
15 22.5 0.15 0.5 0.022 0.113 60 2
15 30 0.15 0.5 0.017 0.0924 60 2

119
The study of the circular reactor in order to establish the effect of active area on the
current efficiency revealed that an increase in active area from 10 to 30cm2 produced a
decrease in the current efficiency from 118 to 62% for a decrease in current density of
from 0.05 to 0.017A/cm2. The results also showed that the decrease in current density
produced a decrease in the mass deposited per time (Figure 6.25). In the duration of
15minutes, the 10cm2 active area deposited 0.1746g at a current density of 0.113g/s of
copper respectively.
The current efficiency (CE) was found to decrease as the electrode-active area increased
(Figure 6.25). The mass (m) deposited decreased as the electrode-active area increased.
The correlation of the current density (j) with electrode-active area indicated a decrease
of current density with increasing electrode-active area. The mass deposited decreased
as the electrode-active area increased
0
0.5
1
1.5
10 12.5 17.5 22.5 30
Electrode-active area (cm2)
j (A
/cm
2 ), m
ass
(g),
CE
(%)
j m CE
Figure 6.25: Effect of electrode-active area on the current efficiency in 15 minutes
6.9 Effect of Smootheners on the Current Density and Current Efficiency
The sodium chloride, a chemical that is frequently used as an additive in electrorefining
processes, was weighed and added to samples and the volume of the samples were
made up to 250ml. It is an inorganic compound that readily dissociates in water. It

120
forms sodium sulphate when ions of sodium and sulphate react. The concentrations of
sodium chloride in the samples ranged from 0 to 0.21%. The control sample had a
concentration of 0%, which was the lowest concentration, while the highest
concentration was in the sample with 0.21% sodium chloride. The effect of sodium
chloride on the current density was investigated in order to determine whether it played
a role in the shift of the limiting current from that of the control sample to something
else. The results in Figure 6.26 show that the current density increased with the
increase in voltage up to the current density of 50mA/cm2 and voltage of 0.4Volts.
From this point, the current density increased with a very small gradient up to
80mA/cm2 giving a change in voltage (?V) of 0.86Volts.
0
50
100
150
200
250
0 0.5 1 1.5 2
Overvoltage (Volts)
Cur
rent
den
sity
(mA
/cm
2 )
0.00%0.03%
0.05%0.11%
0.21%
Figure 6.26: Effect of sodium chloride on the current density
During this period, the electrolyte provided increased resistance to the flow of electrons
and hence the flux. When the voltage equal to ?V was reached, the resistance, which
can be estimated from RIV = , was then overcome and the current density began to
flow linearly with the applied potential. The region covered by the voltage (?V) is the
limiting current density region. When the system was operated at current densities
below this value, no abnormal nucleation was observed on the surface at the desired
concentration of electrolyte (50g/L). But the operation of the system above the limiting
current density region revealed abnormal nucleation of copper and gas bubbles on the

121
surface of the cathode simultaneously. The curves for the 0.03% and 0.05% samples
were above the curve for the control sample above the limiting current density region
while those of the 0.11% and 0.21% concentrations were below that of the control
sample. This means that concentrations of sodium chloride above 0.05% lower the
current density and those below 0.05% concentration increase the current density at
levels above the limiting value. Therefore sodium chloride as an additive did not affect
the current density when the reactor was operated at current densities below the limiting
value since the results, at all concentrations of sodium chloride, showed no deviation
from normal.
Thiourea, an organic compound, was used as one of the additives. The others are
chloride and glues of different types. Thiourea was used in order to establish the effect
on the current density and hence the current efficiency. Concentrations of 0 to 300ppm
were added to 250ml reactor samples by dissolving appropriate amounts of the
compound in electrolyte and making up the volume to 250ml. It is interesting to note
from the results in Figure 6.27 that a strong inhibition was produced by increased
concentration of thiourea particularly at concentrations of 200 and 300ppm.
0
50
100
150
200
250
0 0.5 1 1.5 2
Overvoltage (Volts)
Cur
rent
den
sity
(mA
/cm
2 )
0ppm
10ppm
20ppm
40ppm
200ppm
300ppm
Figure 6.27: Effect of thiourea on the current density

122
At these levels of concentration, thiourea lowered the level of the limiting current from
60mA/cm2 to 40mA/cm2 at 200ppm concentration level and 20mA/cm2 at 300ppm
concentration level indicating a strong inhibition of the flow of current of ions in the
system. On the other hand, the concentration levels of thiourea from 40ppm and below
produced a lowering of limiting current density of 10mA/cm2 at 0.5Volts potential.
The inhibition of current requires a careful examination of the behaviour of the
additives in the system. The interaction between Tu and copper sulphate and that of
glue and NaCl might require further examination. The complexing nature of copper
with additives was seen to produce a green colour that is characteristic of Cu (I) ions.
The results also revealed that the potential required to overcome resistance in the
systems was 0.5Volts for all the cases of the concentrations of thiourea, which
represents a range of 0.5 to 1Volt potential. The 1-Volt potential is also the point where
all the concentrations of Thiourea below the 40ppm mark failed to inhibit the current
density. Therefore, at concentrations below the 40ppm level, thiourea was able to
inhibit the limiting current density below the 1-Volt potential while above this potential
it did not. The inhibition was overcome by increased overvoltage. At concentrations
above 40ppm, thiourea inhibited the limiting current density up to the 1-Volt potential
and continued to slow down the current density above this potential. Therefore
increased overvoltage did not have any effect on the inhibition process of thiourea at
concentrations above 40ppm. The effect of thiourea on the current efficiency can be
seen in Figure 6.28. The amount of copper deposited in fifteen minutes was used in
evaluating the efficiency. The results show that the current efficiency decreased as the
concentration of thiourea increased. The current efficiency of the control sample
(0ppm) was found to be the highest (106%) and that of the highest concentration of
thiourea (1600ppm) the lowest (40%) in this study. In terms of resistance, the
concentrations from 800ppm and above produced increased resistances while those
below 800ppm produced resistances proportionate to the concentration. The lowest
resistance was 0.52? at 0ppm concentration of thiourea, which is the resistance of the
control sample.

123
0
0.2
0.4
0.6
0.8
1
1.2
1.4
1.6
1.8
0 40 80 160 400 800 1200 1600
Vol
tage
(V
); C
urre
nt (
A);
mas
s (g
); R
esis
tanc
e (O
hm);
CEx
100(
%)
Concentration of Thio-urea in samples (ppm)
V
I
R
m
CE
Figure 6.28: Effect of thiourea on the current efficiency (CE)
The behaviour of resistance with respect to thiourea was that as the concentration
increased the resistance increased. This explains why thiourea is a strong inhibitor of
current and current density. Whilst the current remained constant throughout the study,
the voltage varied from 0.35Volts at 0ppm, being the least value, to 1.1Volts at
1600ppm concentration of thiourea being the highest value reached in the study. It was
observed, also, that the rate of deposition decreased with the increase in the
concentration of thiourea. The rate of deposition being the lowest at 1600ppm and the
highest being that in the control sample at 0ppm. In terms of smoothening effect, the
surface of the cathode exhibited a bright and smooth colour of copper deposit on the
cathode indicating that thiourea was effective in smoothening the surface of the
cathode. However, the smoothening effect was observed to be effective at
concentrations up to 580ppm. At this concentration level, the resistance curve crosses
the current efficiency curve. The general correlation between resistance, current
efficiency and concentration of thiourea is that the concentration of thiourea is function
of current efficiency and resistance. It further means that the current efficiency is
inversely proportional to the concentration of thiourea and inversely proportional to the
electrolyte resistance. But the concentration of thiourea is directly proportional to the
resistance. As the concentration increases the resistance increases. A model can thus

124
be developed from the above-stated relationships, which is indicated in equation (6.1)
where f1 (mol/L? ) is a constant, C (mol/L) is the concentration of thiourea, F is the
current efficiency (%) and R (? ) is the resistance. At the point where the resistance
meets the current efficiency, the value of the efficiency will be equal to the value of the
resistance but the units will be different.
dRfdC )/( 1 Φ= (6.1)
Similarly, as the voltage increases the resistance increases and the current efficiency
decrease. This means, also, that the current efficiency is inversely proportional to the
voltage and the model for such correlation is that indicated in equation (6.2). Where f2
(V/? ) is a constant and therefore the term f2/? becomes a constant representing the
current I (Amps), which reduces equation (6.2) to equation (6.3).
dRfdV )/( 2 Φ= (6.2)
IdRdV = (6.3)
In the investigation of the effect of glue, different types of glue were tried in order to
produce some effect on the current efficiency. Paper glues K-glue, P-glue and B-glue
were tried in the study. The P-glue is the paper glue manufactured by Penguins Plc.
The density of glue was measured by weighing, using the analytical balance, a known
volume of the glue. The mass divided by the volume gave the density of glue having
unknown density. The average density of most glue was found to be 1.0312g/ml, which
was approximated to 1g/ml. The volumes of glue measuring 0ml, 1ml, 5ml, 10ml, and
20ml were added to samples in order to produce concentrations of 0, 4, 20, 40 and
80ppm of glue that was added to the control sample, and samples 1, 2, 3 and 4
respectively. The volumes of the samples were then increased to reach the 250ml mark
through the addition of more electrolytes. The results in Figure 6.29 indicated that glue
did not have any effect on the limiting current density in the potential range of 0-1Volts.
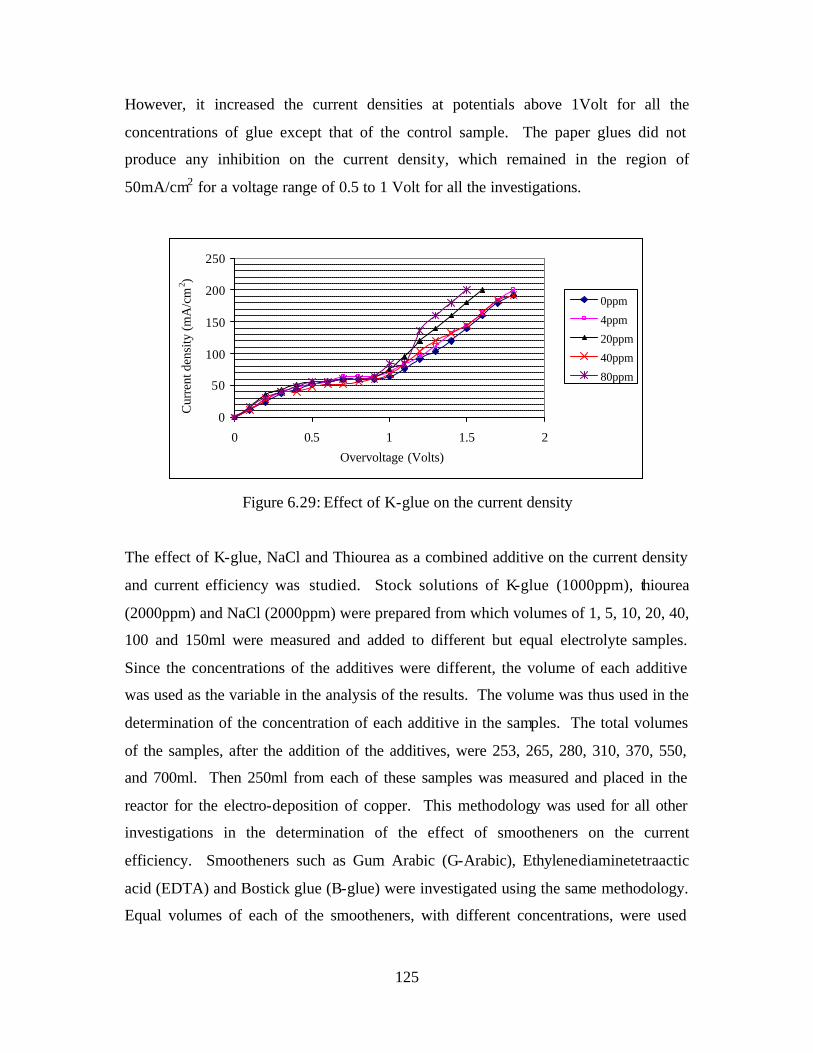
125
However, it increased the current densities at potentials above 1Volt for all the
concentrations of glue except that of the control sample. The paper glues did not
produce any inhibition on the current density, which remained in the region of
50mA/cm2 for a voltage range of 0.5 to 1 Volt for all the investigations.
0
50
100
150
200
250
0 0.5 1 1.5 2
Overvoltage (Volts)
Cur
rent
den
sity
(mA
/cm
2 )
0ppm
4ppm
20ppm
40ppm
80ppm
Figure 6.29: Effect of K-glue on the current density
The effect of K-glue, NaCl and Thiourea as a combined additive on the current density
and current efficiency was studied. Stock solutions of K-glue (1000ppm), thiourea
(2000ppm) and NaCl (2000ppm) were prepared from which volumes of 1, 5, 10, 20, 40,
100 and 150ml were measured and added to different but equal electrolyte samples.
Since the concentrations of the additives were different, the volume of each additive
was used as the variable in the analysis of the results. The volume was thus used in the
determination of the concentration of each additive in the samples. The total volumes
of the samples, after the addition of the additives, were 253, 265, 280, 310, 370, 550,
and 700ml. Then 250ml from each of these samples was measured and placed in the
reactor for the electro-deposition of copper. This methodology was used for all other
investigations in the determination of the effect of smootheners on the current
efficiency. Smootheners such as Gum Arabic (G-Arabic), Ethylenediaminetetraactic
acid (EDTA) and Bostick glue (B-glue) were investigated using the same methodology.
Equal volumes of each of the smootheners, with different concentrations, were used

126
during the study in order to determine their effect on the deposition of copper on the
cathode.
The results in Figure 6.30 show the effect of K-glue, NaCl and thiourea on the current
density. Since K-glue did not produce significant changes in the limiting current
density, it therefore was not expected to produce any significant changes in the current
density in the presence of thiourea and sodium chloride. Similarly, sodium chloride did
not produce significant changes in the limiting current density and therefore was also
not expected to produce any changes in the limiting current densities. Therefore the
changes in the limiting current densities that can be observed in Figure 6.30 must be due
to the inhibition effect produced by thiourea. The inhibition on the electrodes resulted
in the lowering of the limiting current densities.
0
50
100
150
200
250
0 0.5 1 1.5 2 2.5 3
Overvoltage (Volts)
Cur
rent
den
sity
(mA
/cm
2 )
5ml
10ml
20ml
40ml
100ml
150ml
Figure 6.30: Effect of K-glue, thiourea and NaCl on the current density
The inhibition effect by thiourea in the presence of K-glue and NaCl can be determined
by the lowering of the limiting current from 60mA/cm2 to 50, 40, 30, 25 and 20mA/cm2
for the 10, 20, 40, 100 and 150ml representing concentrations of 0.071, 0.129, 0.216,
0.364 and 0.429g/L respectively. The 5ml volume of thiourea, representing a
concentration of 0.04g/L, did not produce any effect on the limiting current density.
One obvious factor contributing to the lowering of the limiting current density must be
due to the fact that thiourea has negative sites, which enable it to migrate to the anode,

127
surrounds it and prevents the free flow of ions from the anode to the electrolyte. This
process lowers the flow of current in the circuit as the resistance increases across the
cell reactor. The effect of K-glue above the limiting current is to increase the current
densities so that if one attempts to operate the reactor at high current densities, the K-
glue attempts to stabilise the flow of current in the reactor and therefore assists in the
smooth deposition of copper during electro-refining thereby producing normal grain
size of copper atoms on the surface of the cathode.
Gum Arabic, as one of the surface smootheners, was used during the electrorefining
process. Gum Arabic is a product extracted from trees (Acacia). Its action, during
electrorefining, was similar to that of K-glue. Since the effect of glues was to improve
the current efficiency, the limiting current was not affected by G-Arabic. It means that
it did not inhibit the current density. However, G-Arabic was found to produce the
smoothening effect on the grains that were deposited on the cathode. Like K-glue, G-
Arabic was found to increase the current density above the limiting value. The results
in Figure 6.31 indicate that the lowering of the limiting current density and the general
lowering of the current density can be attributed to thiourea and not G-Arabic and NaCl.
0
50
100
150
200
250
0 0.5 1 1.5 2 2.5
Overvoltage (Volts)
Cur
rent
den
sity
(mA
/cm
2 ) 1ml
5ml
10ml
20ml
40ml
100ml
150ml
Figure 6.31: Effect of G-Arabic, thiourea and NaCl on the current density

128
The results show that the limiting current density was lowered from 65mA/cm2 for the 1
and 5ml volumes of thiourea representing concentrations of 0.008g/L and 0.038g/L
respectively to 40mA/cm2 for the 10 and 20ml representing concentrations of 0.071 and
0.129g/L, 25, 20, and 15mA/cm2 for the 40, 100 and 150ml representing concentrations
of 0.216, 0.364 and 0.429g/L respectively.
Thiourea maintains its superiority as a strong inhibitor at vo lumes above 40ml than at
volumes below 20ml, i.e., by maintaining low current densities above the limiting
values when compared to those at volumes below 20ml. Thiourea produces increased
resistance to the flow of electrons and hence the flow of ions in solution resulting in
reduced deposition on the cathode.
The effect of K-glue and G-Arabic on the current efficiency was studied at constant
current (I) with varying potential (V) and resistance (R) as indicated in Figure 6.32 (1)
and (2) respectively. The resistance increased as the concentration of additives
increased and so was the voltage. The K-glue stabilised the current efficiency and
therefore maintained it to levels above 95% for values of volume of 20ml representing a
concentration of 0.0645g/L and above
Figure 6.32: Effect of (1) K-glue and (2) G-Arabic on the current efficiency
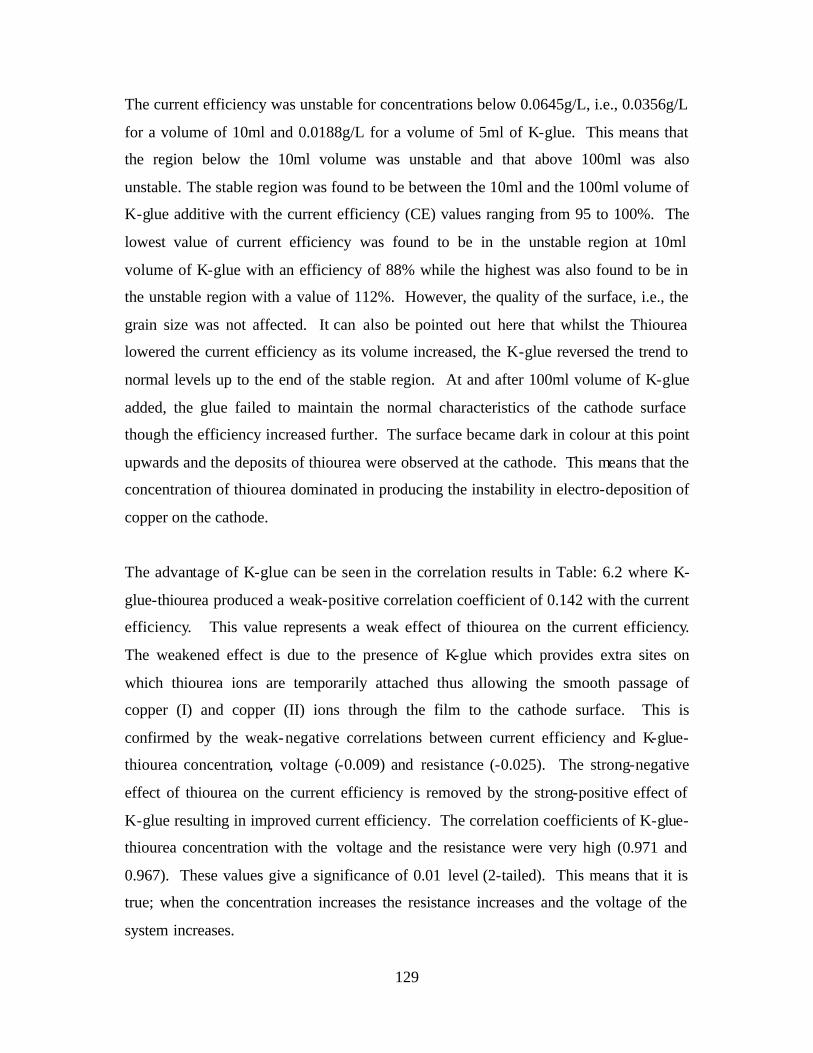
129
The current efficiency was unstable for concentrations below 0.0645g/L, i.e., 0.0356g/L
for a volume of 10ml and 0.0188g/L for a volume of 5ml of K-glue. This means that
the region below the 10ml volume was unstable and that above 100ml was also
unstable. The stable region was found to be between the 10ml and the 100ml volume of
K-glue additive with the current efficiency (CE) values ranging from 95 to 100%. The
lowest value of current efficiency was found to be in the unstable region at 10ml
volume of K-glue with an efficiency of 88% while the highest was also found to be in
the unstable region with a value of 112%. However, the quality of the surface, i.e., the
grain size was not affected. It can also be pointed out here that whilst the Thiourea
lowered the current efficiency as its volume increased, the K-glue reversed the trend to
normal levels up to the end of the stable region. At and after 100ml volume of K-glue
added, the glue failed to maintain the normal characteristics of the cathode surface
though the efficiency increased further. The surface became dark in colour at this point
upwards and the deposits of thiourea were observed at the cathode. This means that the
concentration of thiourea dominated in producing the instability in electro-deposition of
copper on the cathode.
The advantage of K-glue can be seen in the correlation results in Table: 6.2 where K-
glue-thiourea produced a weak-positive correlation coefficient of 0.142 with the current
efficiency. This value represents a weak effect of thiourea on the current efficiency.
The weakened effect is due to the presence of K-glue which provides extra sites on
which thiourea ions are temporarily attached thus allowing the smooth passage of
copper (I) and copper (II) ions through the film to the cathode surface. This is
confirmed by the weak-negative correlations between current efficiency and K-glue-
thiourea concentration, voltage (-0.009) and resistance (-0.025). The strong-negative
effect of thiourea on the current efficiency is removed by the strong-positive effect of
K-glue resulting in improved current efficiency. The correlation coefficients of K-glue-
thiourea concentration with the voltage and the resistance were very high (0.971 and
0.967). These values give a significance of 0.01 level (2-tailed). This means that it is
true; when the concentration increases the resistance increases and the voltage of the
system increases.

130
Table: 6.2 Correlations of K-glue-thiourea concentration (concn) with CE Concn CE Voltage Resistance Current
Concn Pearson Correlation
Sig. (2-tailed)
N
1
.
6
.142
.788
6
.971**
.001
6
.967**
.002
6
.a
.
6
CE Pearson Correlation
Sig. (2-tailed)
N
.142
.788
6
1
.
6
-.009
.986
6
-.025
.963
6
.a
.
6
Voltage Pearson Correlation
Sig. (2-tailed)
N
.971**
.001
6
-.009
.986
6
1
.
6
1.000**
.000
6
.a
.
6
Resistance Pearson Correlation
Sig. (2-tailed)
N
.967**
.002
6
-.025
.963
6
1.000**
.000
6
1
.
6
.a
.
6
Current Pearson Correlation
Sig. (2-tailed)
N
.a
.
6
.a
.
6
.a
.
6
.a
.
6
1
.
6 **. Correlation is significant at the 0.01 level (2-tailed). a. Cannot be computed because at least one of the variables is constant.
Thiourea alone produced strong-positive correlation coefficients with voltage and
resistance and strong-negative correlation with the current efficiency. The Pearson
Correlation analyses in Table 6.3 show negative correlation coefficients for the current
efficiency with voltage (-0.995), resistance (-0.994) and thiourea concentration (-0.946).
This means that increasing these factors does not increase the current efficiency.
Therefore, the removal of copper from solutions can best be done at fixed values of
voltage and concentration of thiourea. It can also be observed, however, that correlation
coefficients for thiourea concentration with voltage and resistance were positive (0.965;
0.965). This means that increasing the concentration of thiourea would increase the
voltage and resistance in the reactor.

131
Table: 6.3 Correlations of thiourea with the current efficiency Thiourea CE Voltage Resistance Current
Thiourea
Concn
Pearson Correlation
Sig. (2-tailed)
N
1
.
8
-.946**
.000
8
.965**
.000
8
.965**
.000
8
.a
.
8
CE Pearson Correlation
Sig. (2-tailed)
N
-.946**
.000
8
1
.
8
-.995**
.000
8
-.994**
.000
8
.a
.
8
Voltage Pearson Correlation
Sig. (2-tailed)
N
.965**
.000
8
-.995**
.000
8
1
.
8
1.000**
.000
8
.a
.
8
Resistance Pearson Correlation
Sig. (2-tailed)
N
.965**
.000
8
-.994**
.000
8
1.000**
.000
8
1
.
8
.a
.
8
Current Pearson Correlation
Sig. (2-tailed)
N
.a
.
8
.a
.
8
.a
.
8
.a
.
8
.a
.
8 **. Correlation is significant at the 0.01 level (2-tailed). a. Could not be computed because at least one of the variables was constant.
This agrees well with Ohm’s Law (V=IR). In both the cases of CE and thiourea
correlations the siginificance was at 0.01 level (2-tailed). This means that the results are
99.99% true. This is the reason why glues are added to the electrorefining processes in
order to improve the efficiency
Ten grams of G-Arabic were weighed and dissolved in water to make a solution with a
concentration of (10,000ppm) from which concentrations of 0.0395, 0.189, 0.357,
0.645, 1.081, 1.818 and 2.142g/L were produced in the reactor by adding volumes of 1,
5, 10, 20, 40, 100, and 150ml respectively. The effect of G-Arabic, in the presence of
Thiourea (2000ppm) and NaCl (2000ppm), on the reactor electrolyte was to stabilise the
system so that it could be operated at stable current efficiencies thereby producing a

132
smooth surface particularly in the most stable regions below the 50ml and above the
10ml volumes representing concentrations of 1.25 and 0.357g/L respectively. In
addition, the effect of G-Arabic was to stabilise the current in order to produce a smooth
deposit on the cathode. As can be observed in Figure 6.32 (2), stable current
efficiencies were obtained. The variation of resistance in solution was due to thiourea
(Tu) and not K-glue and G-Arabic. The effect of G-Arabic was to reverse the reductive
trend produced by Tu to levels of 100% and below. The system required increased
values of overvoltage as the concentration of the additives increased in order to
maintain the current efficiency at the 100% and below levels. The surface on the
cathode for the voltage range (0.25-0.55V) exhibited good colour, normal grain and no
thiourea deposit as can be seen in Figure 6.33. Whereas, it was difficult to produce
smooth surface on the cathode without smoothener at high voltage and current density
as is shown in Figures 6.34-6.36, the smoothener plays an important role in producing a
high quality surface and hence high quality copper cathode. The anode did not also
show any deposit of thiourea in this region. But at potentials above 0.55V the surface
began to change from copper colour to dark-black colour and some deposit of thiourea
could be observed on the cathode that could produce an increase in current efficiency
above normal values as shown in Figures 6.34-6.36 above. At the point when the
solution began to produce gas bubbles, the deposition was found to be irregular.
Figure 6.33: Copper deposit at 0.1-0.4V
and 0.25-0.8A with smoothener
Figure 6.34: Non-sticking copper at
0.9V and 0.8-1.5A without smoothener

133
Figure 6.35 Non-sticking copper at
0.5V and 1.1A at 60oC without
smoothener
Figure 6.36: Non-sticking copper at
0.75V and 1.65A at 60oC without
smoothener
The bubbles were found to contribute to the irregularity of the deposited mass. The
attachment of such a deposit was found to be weak on the cathode and could therefore
be washed easily. The surface of the cathode was observed to become darker and
darker as the potential was increased and so was the current density signifying that the
conditions were not conducive for normal copper recovery from solution.
The effect of Ethylenediaminetetraacetic acid (EDTA) (20,000ppm) as an inhibitor to
the process of electrochemical reaction was studied in the presence of NaCl (2,000ppm
or 2g/L) and Bostick Glue (B-Glue) with a concentration of 18800ppm. The
concentrations of EDTA in the samples were 0.377, 0.714, 1.29, 2.16, 3.64 and 4.29g/L
for volumes of 5, 10, 20, 40, 100 and 150ml respectively. The results in Figure 6.37
show that the increased concentration of EDTA produced inhibition on the current in
the reactor resulting in the lowering of current. The lowering of the current was due to
increased resistance created in solution by the ions from EDTA. EDTA is a poor
conducting electrolyte, like Tu, but forms complex ions with copper which results in an
easy release of ions to be deposited on the cathode. Copper (I) ions tend to react faster
than Copper (II) ions hence the additives facilitate the process of reducing copper to
lower valence level. The results also show that the lowest value of current (0.15A) for
I1 was observed at the highest EDTA concentration of 4.29g/L while the highest value
(0.3A) was observed at the lowest EDTA concentration of 0.377g/L.

134
00.2
0.40.60.8
11.21.4
1.6
0 20 40 60 80 100 120 140 160
Volume of individual additive (ml)
Cur
rent
(Am
ps) I1
I2I3
I4I5
I6
Figure 6.37: Effect of EDTA, NaCl and B-glue on the reactor current
Similarly, the highest levels of currents for I2 (0.65A), I3 (0.76A), I4 (1A), I5 (1.2A)
and I6 (1.4A) were observed at EDTA concentration of 0.377g/L while the lowest
values were at I2 (0.08A), I3 (0.3A), I4 (0.4A), I5 (0.45A at 100ml) and I6 (0.41A) at
EDTA concentration of 4.29g/L. The lowering effect of current by the inhibitors results
in the lowering of the current density and particularly, the limiting current density. The
plot of current density versus overvoltage for a system using EDTA as inhibitor in the
presence of smootheners NaCl and B-glue revealed that EDTA is a superior inhibitor
when compared to B-glue and sodium chloride. The EDTA was found to be equally a
strong inhibitor as thiourea as is indicated by the results in Figure 6.38.
0
50
100
150
200
250
0 0.5 1 1.5 2
Overvoltage (Volts)
Cur
rent
den
sity
(mA
/cm
2)
5ml
10ml
20ml
40ml
100ml
150ml
Figure 6.38: Effect of EDTA, NaCl and B-glue on current density

135
The usual action of such inhibitors is to lower the current density and hence the limiting
current density. The limiting current densities were therefore lowered from 70mA/cm2
for the 5ml (0.377g/L) to 20mA/cm2 for the 100 and 150ml (3.64 and 4.29g/L) volumes
of EDTA. If the concentrations of additives are properly chosen, it is possible to strike
a balance between the attainment of increased current efficiency and good surface
properties of the cathode and anode during the chemical reaction. One can, therefore,
operate the reactor at high values of current densities in the presence of smootheners
without compromising the current efficiency and quality of copper on the cathode. For
example, if the system is operated at 50mA/cm2, it will be operating at the limiting
current level at a concentration level of EDTA of 1.29g/L or 20ml volume. The
problems of irregular granulation on the surface due to high levels of current densities
can be minimized as the presence of B-glue and NaCl stabilizes the system. However,
if it is operated at the current density above this value then the system may overheat and
cause the electrolyte to boil thereby releasing a great deal of gas bubbles on the cathode
which then results in irregular deposition of copper on the cathode.
The release of gas bubbles was found to be the major contributor to the formation of
rough surface. The advantage of using the surface smootheners is that the system can
be operated at high current density that does not exceed the limiting value and still
obtain high current efficiencies because the smootheners provide conduc ive conditions
for the deposition of copper.
The EDTA was found to produce a greater stability in the values of current efficiency
when compared to thiourea at all levels of concentration, when the reactor was operated
at constant current (I) and current density. The potential across the reactor increased as
the resistance (R) increased. The resistance increased due to the increase in
concentration of EDTA (Figure 6.39). This means that it was possible to operate the
reactor at high values of overpotential without affecting the chemical reaction. The
potential across the reactor varied with the volume of additive and therefore varied with
the concentration of the additive. The current efficiency was more stable as the
concentration of additives increased. The resistance increased as the concentration of

136
additive increased. The region of stability however, narrowed from 10 to 20ml
representing concentration difference of 0.576g/L, i.e., from 0.714 to 1.29g/L. But the
system could still be operated with good surface properties up to the 50ml level. The
surface properties above the 50ml volume representing a concentration of 2.5g/L were
found to be poor.
00.20.40.60.8
11.21.41.61.8
5 10 20 40 100 150
Volume of individual additive (ml)
Vol
tage
(Vol
ts),
Cur
rent
(A),
Res
ista
nce
(Ohm
), C
Ex10
0 (%
)
V
I
R
CE
Figure 6.39: Effect of EDTA, NaCl and B-glue on the current efficiency
The increased resistance with the highest value at 150ml of 1.5O and lowest at 5ml of
0.48O resulted in the variation of potential across the reactor but the current efficiency
was maintained above the 90% level by the use of B-glue and NaCl along with EDTA.
The effect of smootheners on the surface of the cathode was further investigated in
terms of the strength of the colour of the surface of the electrode. At the same time, the
formation of nodules was also investigated. The formation of large nodules was not
observed during the entire range of the additive volume variation which is relative to the
variation of concentration. Only fine nodules were observed at volumes above 100ml.
These nodules did not stick to the cathode and could easily be washed with water
leaving the dark colour of the deposit on the cathode. The results in Figure 6.40 show
that as the volume of the smootheners increased the Tinctorial Power increased.
Tinctorial Power is the strength of colour as perceived by the eye and was measured
using a standard Caramel Colours Chart as given in Figure 6.40. The results mean that
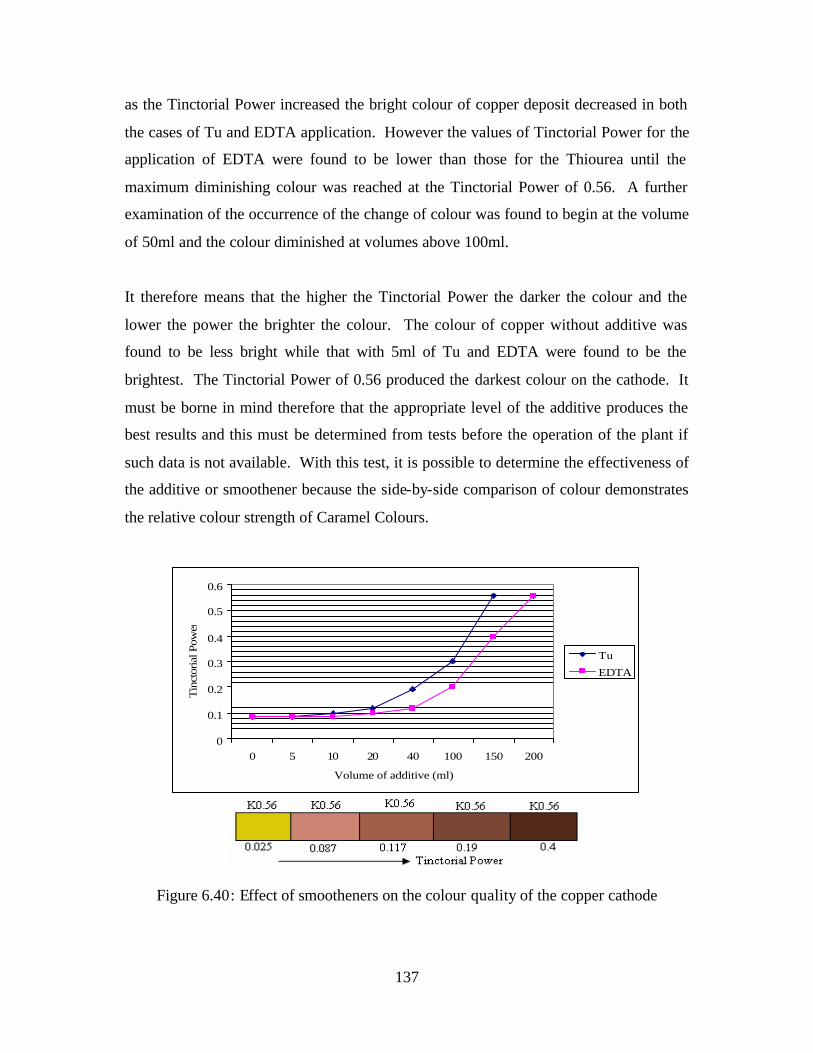
137
as the Tinctorial Power increased the bright colour of copper deposit decreased in both
the cases of Tu and EDTA application. However the values of Tinctorial Power for the
application of EDTA were found to be lower than those for the Thiourea until the
maximum diminishing colour was reached at the Tinctorial Power of 0.56. A further
examination of the occurrence of the change of colour was found to begin at the volume
of 50ml and the colour diminished at volumes above 100ml.
It therefore means that the higher the Tinctorial Power the darker the colour and the
lower the power the brighter the colour. The colour of copper without additive was
found to be less bright while that with 5ml of Tu and EDTA were found to be the
brightest. The Tinctorial Power of 0.56 produced the darkest colour on the cathode. It
must be borne in mind therefore that the appropriate level of the additive produces the
best results and this must be determined from tests before the operation of the plant if
such data is not available. With this test, it is possible to determine the effectiveness of
the additive or smoothener because the side-by-side comparison of colour demonstrates
the relative colour strength of Caramel Colours.
0
0.1
0.2
0.3
0.4
0.5
0.6
0 5 10 20 40 100 150 200
Volume of additive (ml)
Tin
ctor
ial P
ower
Tu
EDTA
Figure 6.40: Effect of smootheners on the colour quality of the copper cathode

138
The colour strength is quantified by a measurement called Tinctorial Power (K0.560).
The higher the Tinctorial Power (K0.560) the darker is the Caramel Colour. Tinctorial
Power, K0.560 (TP, K0.560) is also defined as the absorbance of a 0.1% weight/volume
solution measured through a 1 cm light path at a wavelength of 560 nanometers using a
high quality spectrophotometer (2 nm or less bandpass). The determinations of the
colours in this study were side-by-side comparison of colours.
010203040506070
0 1 2 3 4 5
Concentration of Additive (g/L)
Cur
rent
Den
sity
(mA
/cm
2)
TuKG TuGAR EDTABG
Figure 6.41: Comparison of current density reductions with level of additives
If this test appears to be difficult particularly to colour-blind personnel, then the
comparison given in Figure 6.41 is indicative of how the best range of concentration of
additives can be determined. The combination of Thiourea and K-Glue produced a
better surface quality for a good range of concentration volume of 5-100 ml for K-Glue
when compared to that of Thiourea and Gum Arabic of 5-40 ml and that of EDTA and
B-Glue of 10-50 ml. This makes K-Glue a better choice for the operation.
6.10 Summary
The current density and overvoltage were important variables to drive the chemical
reaction in the circular reactors. The metal impurities with more negative oxidation
potentials did not affect the electrodeposition of copper whilst metals with oxidation
potentials close to that of copper reduced the current efficiency. The current density
increased with the increase in temperature, overvoltage and concentration of electrolyte.

139
The increase in overvoltage and current density above limiting values produced
increased rates of deposition. The increase in concentration of electrolyte produced an
increase in limiting current density. The increase in electrode-active area produced a
decrease in the current efficiency. The sodium chloride, as an additive, did not affect
the current density.
The use of smootheners; thiourea, EDTA reduced the limiting current density and hence
the current efficiency. This effect was counteracted by using glue which enabled the
process to attain normal efficiency level. The process can therefore be operated at high
values of overvoltage and current densities as long as the limiting current is within the
range that the process is able to operate efficiently. The current efficiency was found to
be inversely proportional to the voltage. This leads to the lowering of current efficiency
at high values of overvoltage. If the reactor has to be operated at high level
(V>0.9volts) of overvoltage adequate inhibitor must be added in order to lower the
limiting current and hence the operating current density that would produce normal
current efficiency (90<CE<100%). Therefore the use of K-glue, B-glue in conjunction
with each of EDTA or thiourea and NaCl improved the current efficiency.
The results have generally shown that as the volume, which is a direct function of
concentration, of smootheners increased the Tinctorial Power increased. Tinctorial
Power is the strength of colour as perceived by the eye and was measured using
standard Caramel Colours Chart. The quality of the surface was also an indicator that
the quality of copper deposited was of good qua lity and that the process operated at
optimum conditions. If the colour of the surface was copper brown, with no dark spots
but with regular granulation, then the quality of copper deposited was good. If the
surface showed any abnormal deposition it means that the conditions under which the
reactor was operated were not optimum.

140
CHAPTER 7
DISCUSSION, CONCLUSION AND RECOMMENDATIONS
7.0 Introduction
This chapter presents the discussions, conclusions and recommendations based on the
data and results that were obtained during the study. It also examines whether the
objectives and assumptions have been achieved and proven respectively. The key
issues under the discussion are the effects of the key variables that received the
treatment in order to produce the effect on the dependents. The key variables were the
temperature, current density and overvoltage, electrode-active area, concentration of
electrolyte, impurities and smootheners and distance between electrodes. The key
dependent was the current efficiency as the main focus of the study.
7.1 Discussion
7.1.1 Effect of Overvoltage and Current Density on the current efficiency
The current density and overvoltage are among the key critical parameters in the
electrodeposition processes. It has already been observed that the increase in
overvoltage results in the increase in current and hence the current density for a
particular active area and distance between electrodes. The current density is also
affected by temperature and concentration of electrolyte (Kang-gen et al., 2000).
Because the current density increases with temperature, electrorefining can only be
conducted at constant temperature in order to obtain optimum results. A careful choice
of current density is important because if it is outside the limiting value the process
ceases to provide efficient results. High values of current densities bring about
erroneously high efficiencies. The objective was to evaluate the effect of overvoltage
and current density on the current efficiency in order to determine the optimum values.

141
The optimum values are values that produce the efficiency required for the production
of good quality copper. Since it was observed that increasing the overvoltage resulted
in the increase in current and current density, the increase in overvoltage resulted in the
increase in the rate of deposition. Similarly, the increase in the current density resulted
in the increase of the rate of deposition. The assumption for the problem that the
increased overvoltage and current density increases the rate of deposition was achieved.
It is also an obvious matter that the assumption; increasing the deposition rate increases
the current efficiency which obeys the Law of Faraday was proven. This assumption
related to the problem of passivity that develops due to excessive overvoltage or current
density.
7.1.2 Effect of Temperature
The rate of chemical reaction is an exponential function of temperature as alluded to
earlier in the literature survey and review of electrochemical engineering. It is observed
from the rate equations therefore that there is a reduction in chemical reaction when the
temperature is lowered and an increase in chemical reaction when it is increased.
Obviously, conducting the chemical reaction at temperatures below room temperature
would give yield at increased periods of time and hence would not be beneficial to the
productivity. It would also increase the cost of maintaining the temperature as ice
would be required to reduce and maintain the temperature below room conditions. It
was also decided not to use the temperatures above 60oC because evaporation and
boiling would have been a problem. The level of electrolyte would be lowered before
the time for the chemical reaction would lapse. It is for this reason that the
temperatures for the study were chosen from room conditions with increments of 15 and
21oC as 24, 39 and 60oC respectively. The properties of organic compounds could be
affected at temperatures near and above the boiling point. The effect of temperature on
electrodeposition of copper has been studied elsewhere (Kang-gen et al., 2000). It has
now been further confirmed that the temperature affects the limiting currents. This was
shown in the results in Figure 6.7 where it is indicated that the limiting current for the
1cm distance between electrodes at 0.8volts at 24oC was lowest (11mA/cm2) when

142
compared to those at 39oC (40mA/cm2) and 60oC (60mA/cm2). Similarly, the limiting
current was highest at 60oC and lowest at 24oC for the 2, 3 and 4cm distances between
electrodes respectively. If the temperature affects the limiting currents it means,
therefore, that the current efficiency would equally be affected.
It can be observed also that the temperature enhances the conductivity of ions in
solution thereby increasing the conductivity of the solution. This is achieved by the
increase in temperature which enhances the dissolution of electrolyte into the solvent
thereby increasing the number of ions and at the same time increasing the conductivity.
In another study, the temperature was found to increase the electrodeposition of cuprous
oxide (Rakhsheni and Varghese, 2006). It is therefore not surprising to have obtained
increased values of masses at 60oC than those at 24 and 39oC. This explains why it was
decided to choose the operation temperature for the process to be 60oC. The rate of
deposition increased as the temperature increased meaning that the reaction was
favoured at 60oC than at temperatures below it. The increase in the rate was attributed
to the increase in temperature, which increased the temperature-dependent conductivity
of ions. The reaction was therefore endothermic. Since the efficiency depends on the
current and the mass deposited at a particular temperature, Faraday’s Law would apply
at every other temperature as given by 60/ MItxmzF=Φ . The rate of deposition is
suggestive of the rate of reaction. The two should be equal if the efficiency is one
hundred percent. If the temperature is changed the rate of deposition would change and
therefore the rate of reaction at each of the electrodes would change as well. Similarly
the rate constant would change as it is dependent on the temperature. The Faraday’s
Law is not violated regardless of temperature since it depends on the charge passed per
time. Since the objective was to establish the effect of temperature on the current
efficiency, the increased rates of deposition and increased levels of efficiencies signifies
that the temperature plays a significant role in improving the efficiency since the values
of limiting currents increased with the increase in temperature. The rates of deposition
increased also with the increase in temperature.

143
7.1.3 Effect of Distance Between Electrodes
The way in which the distance between electrodes affected the current efficiency was by
lowering the rate of deposition when the distance increased due to the reduction in
strength of current density. The rates of deposition were lowered at higher distances
between electrodes at 24oC. Similarly, the rates of deposition were lowered at 39oC for
the 2cm and 3cm distances but high for the 1cm distance. In the case of operating the
system at 60oC, the rates were favoured at distances of 1cm and 2cm and low for the 3
and 4cm distances between electrodes. The rates would be increased at 4cm distance if
the current density is increased for the same active area and lowering the current density
for the 1cm distance would reduce the deposition rates. The operating variables of
current density and overvoltage can be chosen from a voltamogragh, which gives the
limiting current density, or if the limiting current is known then a choice of the
operating current and current density and overvoltage can be made. The objective was
to determine the effect of distance between electrodes on the current efficiency in order
to establish the optimum distance. The assumption related to this objective was that the
distance between electrodes affects the current efficiency. This assumption related to
the problem where conducting electrolysis with increasing distance between electrodes
can affect the current efficiency. It has been proven beyond reasonable doubt that the
increase in the distance between electrodes lowers the current and hence the current
density, overvoltage and the current efficiency but increases the resistance of the
system.
7.1.4 Effect of Electrolyte Concentration
The concentration of electrolyte has been observed to contribute to the increase in
current dens ity (Kang-gen et al., 2000). In another study, the concentration was used to
investigate the effect on the current efficiency where it was found that the efficiencies
were different for different distances of electrode beds (Ruotolo and Gubulin, 2002). In
this study the current-efficiency results were also different for different values of
concentrations particularly in the region of low concentration. In order to obtain good

144
results it is important therefore that the concentration is maintained at a value above
10.8g/L. At lower concentrations the resistance increases because the pH is reduced
due to the presence of more water molecules than those of sulphuric acid, which aids
the ionisation of the electrolyte solid to remain dissolved in solution. The relationship
developed in this study between the current efficiency and concentration can help the
plant operators and other engineering related areas to have information on what level of
efficiency they would expect at a particular concentration. It means therefore that
increasing the concentration provides more stable conditions for the process to deposit
copper on the cathode at higher concentrations than lower ones. It can be observed
therefore that the objective; to examine the effect of electrolyte concentration on the
current and production efficiencies in order to establish the level that provides adequate
recovery was achieved. It can also be observed that the assumption (Fourth
Assumption) related to this objective that the concentration of electrolyte affects the
current efficiency was proven. This assumption related to the fourth problem where the
concentration of copper (II) sulphate is a major factor in the deposition of copper.
7.1.5 Effect of Impurities
The concentration was used in the investigation of the effect of impurities on the current
efficiency. Since it was found that increased concentration affects the efficiency more,
it would be prudent on the plant operators to ensure that impurities are checked before
the electrolyte is delivered to the reactors for the recovery of copper. Impurities such as
silver and bismuth nitrates can easily be controlled by introducing sodium chloride or
potassium chloride which precipitates such impurities in their chloride forms. For
example, silver ions precipitate out as silver chloride, immediately the salt is added,
before the current is passed through electrolyte as given by the overall
reaction )()(2)(2)( 3232 lNONasAgCllNaCllNOAg +=+ . However, the precipitation of
bismuth is delayed until when the current is passed into solution. When the current is
passed, The bismuth chloride begins to precipitate out of the solution as white crystals
as given by the reaction )()(2)(2)( 3232 lNONasBiCllNaCllNOBi +=+ . Silver ions
were observed to be more reactive than copper (II) ions for obvious reasons. Silver is

145
higher up in the electrochemical series than copper and therefore is classified as being
more reactive than copper (II). This is the reason why silver ions reacted immediately
with the electrode surfaces forming a layer (1-2mm) on the cathode and anode within
one minute of their introduction into the electrolyte. As the current was passed more
silver ions were deposited on the coating making it difficult for copper (II) ions to
deposit themselves on the cathode. This resulted in the lowering of the current
efficiency. In the case of bismuth, a little layer formed but most of it remained floating
in the bulk electrolyte as bismuth chloride. It is important to note that the oxidation
potentials of these impurities are similar to that of copper (II) hence the reason why they
were able to compete with copper ions.
It was a different scenario in the case of the impurities that have oxidation potentials
higher or more negative than that of copper. A combined impurity made of three metal
ions (Fe + Ni + Co) was found to have little effect on the current efficiency because the
oxidation potentials of these metals are more negative than that of copper. If we
examine the assumption that was developed for the effect of impurities on the current
efficiency in Chapter 4, we can observe that the presence of impurities in electrolyte
affects the current efficiency and therefore the assumption was proven. The increase in
concentration of impurities was found to produce a further decline in current efficiency.
It can therefore be concluded that the presence of impurities produces a negative effect
on the current efficiency. The effect is proportional to the level of its concentration. If
the concentration of impurities increases the lowering of the current efficiency is
increased and vice versa. A negative slope could be obtained which would give an
inverse relationship in the model. Thus the objective, to determine the effect of metal
and other impurities on the current efficiency was achieved.
7.1.6 Effect of Electrode-active Area
The effect of active area can be obtained in terms of changes in current efficiency as
was given by the trend models or as is given by wdAd =Φ where the value of the
constant (w) is equal to the slope, which is negative and the relationship is linear. If we
146
go to the results in Chapter 6, we observe that the mathematical models for the
relationship provide the effect of the active area on the current efficiency. The active
area must be proportionate to the current density required for the operation as increased
active areas reduce levels of current densities and hence the current efficiencies. Let us
examine the objective and the assumption that were developed for the problem. The
objective was to determine the effect of electrode area on current efficiency in order to
establish the optimum electrode area in relation to the current density and efficiency.
The assumption was that the electrode-active area reduces the current efficiency. What
was observed during the study was that the current density was lowered by the increase
in electrode-active area at constant overvoltage or current density. The results therefore
had shown that the electrode-active area affected the current density and the current
efficiency as demonstrated by the results in Chapter 6. The assumption had been proven
because the current density was lowered as the electrode-active area increased at
constant values of current density and overvoltage.
7.1.7 Effect of Smootheners
In the use of smootheners, the concentration was a critical factor in establishing the
effect on the current efficiency and the smoothness of the cathode surface. The
smootheners used in this study were thiourea, EDTA, G-Arabic, K-glue, B-glue and P-
glue as stated earlier. The resistance of the solution was observed to increase as the
concentration of the smootheners increased. In another study, it was found that the
measured resistivities increased as thiourea concentration increased from 10–6 to 10–3 M
as the current density increased from 1-50 mA/cm2 (Donepudi et al., 2001). This
explains why there is need for higher potential application when the concentration of
the smootheners is increased. The effect of G-Arabic, in the presence of Thiourea on
the reactor electrolyte was to stabilise the system so that it could be operated to attain
stable current efficiencies thereby producing a smooth surface particularly in the most
stable regions below the 50ml and above the 10ml volumes representing concentrations
of 1.25 and 0.357g/L respectively. However a tarnishing reaction takes place at the
147
surface of copper electrode where it reacts with thiourea (Llopis et al., 1962). The
tarnishing reaction results in the lowering of the brightness of copper colour to a
tarnished one. The presence of thiourea in the deposit at the electrode is suggestive of
the fact that the reaction SHCNNHeHNCSNHH T2422 22 +→++ −+ occurs at the
surface of the electrode or at the electrolyte-electrode interface (Donepudi et al., 2001).
It is this reaction that produces the tarnished colour of the surface at the cathode when
high levels of concentration of thiourea are used.
In the bulk solution, thiourea forms an intermediate complex with copper ions which
reluctantly gives up the copper ion to the cathode. Thus two parallel reactions take
place. The first reaction is the main one that converts directly the copper ions into
copper solid as given by CueCu T→++ 22 where the letter T stands for the
temperature at which the reactor is operated. This reaction takes place when there is
low concentration of thiourea. When adequate thiourea is added, the solution changes
colour from blue to light green signifying the complexing nature of thiourea. The
reaction is as given by −−+ →+ 242
424
2 )( ChSNCuSNChCu T . In addition, the effect of
G-Arabic was to stabilise the current density in order to produce a smooth deposit on
the cathode at higher levels of current densities until the critical point was reached when
the surface began to burn out as a result of the imbalance in the system due to increased
concentration of thiourea (Tu). The effect of addition of thiourea on the kinetics of
anodic dissolution and cathodic reaction on copper in acidic sulfate solutions has been
studied using potentiodynamic polarization measurements which showed that it has a
very strong influence on the kinetics of discharge processes at different metals and
produced decreasing exchange current densities and changes of Tafel slopes (Stankovic
and Vukovic, 1996). According to Doona and Stanbury (1996), In excess Cu(II), the
complex ion [Cu(Tu)]2+ has a stability constant 11 1.03.2 −±= Mβ . The fast reduction of
Cu(II) in excess Thiourea obeys the rate law as is given by the expression 72212 ][}{/}{ TuCukdtCud ++ =− . The rate law means that the reduction of copper (II) is
second order with respect to copper concentration, seventh order with respect to Tu
concentration and ninth order overall. It also means that when Tu is limiting the

148
reduction of copper would be affected and the extent to which the reaction can go
depends on the amount of Tu in solution.
The EDTA is a more efficient and widely tested chelating agent (Huang et al., 1997;
Wu et al., 1999; Grcman et al., 2003). In electrorefining, EDTA forms a tetra-sodium
EDTA salt which remains ionised in solution. If the EDTA salt is used in
electrorefining, then it behaves like other salts, i.e., ionise when dissolved in water. The
EDTA ion chelates with copper to give an intermediate complex ion as is given by the
intermediate reaction −−+ →+ 242 )()( EDTACuEDTACu T . The associated ions of
sulphate and sodium from copper sulphate and tetrasodium-EDTA ((Na)4EDTA)
respectively form Sodium Sulphate salt which precipitates out in solution when the
current (I) is passed at a given temperature (T) as is given by the
reaction 42)(2
4 224 SONaSONa TI →+ −+ . The most likely path way of the reaction
between the ions of copper and EDTA is the formation of copper (I) complex ion as is
given by the chemical reaction −−+ →+ 22
42 )()(2 EDTACuEDTACu T . The reaction of
the intermediate ion thus requires less current density in order to release the copper ion
and deposit it onto the cathode. This would be one explanation of the process of
inhibition by EDTA. It means therefore that there would be a saving of electrical
energy. The lowering of current usage means that the operator can be able to use high
current density without disturbing the electro-deposition process and thus can realise
high yields at high current densities in short periods of time.
The effect of Gum Arabic on the chemical reaction is to provide stability when the
deposition proceeds. It is a stabilizer. It is an organic compound and therefore has
properties similar to K-glue and B-glue. The common ground for these glues is that all
are manufactured from plants. Gum Arabic is extracted from Acacia trees mainly in
countries in North Africa. Gum Arabic is prepared from an exudates from the stems
and branches of sub-Saharan Acacia senegal and Acacia seyal (Leguminosae) trees and
produced naturally as large nodules during a process called gummosis to seal wounds in
the bark of the tree (Verbeken et al., 2003). Gum Arabic consists of a mixture of lower
149
molecular weight polysaccharide which is the major component and higher molecular
weight hydroxyproline-rich glycoprotein with values of Molecular Weights of 0.25x10⁶
and 2.5x10⁶ respectively (Goodrum et al., 2000). It is a complex and variable mixture
of arabinogalactan oligosaccharides, polysaccharides and glycoproteins. Depending on
the source, the glycan components contain a greater proportion of L-arabinose relative
to D-galactose (Acacia seyal) or D-galactose relative to L-arabinose (Acacia Senegal).
The gum from Acacia seyal also contains significantly more 4-O-methyl-D-glucuronic
acid but less L-rhamnose and unsubstituted D-glucuronic acid than that from Acacia
Senegal (Phillips et al., 2008). It is therefore a hydrocolloid that is useful in promoting
physiological effects (Williams and Phillips, 2008). Because of its long chain and large
molecular weight, it is suitable for the stabilization and emulsification processes. Its
presence in electrorefining of copper helps to stabilize the movement of copper ions
from the anode to the solution and from the solution to the cathode. We can see
therefore that this is how the smootheners affect the deposition and the quality of the
surface of the cathode.
7.2 Environmental Considerations
The environmental considerations should be directed at the effluents from the
electrorefining process. The gases from the cells, the spent solutions and the dust from
thiourea and also EDTA all can be suspected to produce different levels of impacts on
the workers. In handling solid thiourea, the workers may inhale dusts that have been
found to produce hypothyroidism in workers in a thiourea plant (WHO, 2003).
Thiourea (CH4N2S) occurs in two tautomeric forms: and thus has three functional
groups: amino, imino, and thiol (BUA, 1995). The first form has all the hydrogens
bonded to nitrogen and the nitrogens are bonded to carbon while sulphur is also bonded
to carbon. In the second form one nitrogen is bonded to two hydrogens while each of
the other hydrogens are bonded to the other nitrogen and sulphur. Thiourea is soluble in
water (137 g/litre at 20 °C), soluble in polar protic and aprotic organic solvents, and
insoluble in non-polar solvents (BUA, 1995, Mertschenk et al., 1995: 803–815.). The
effects of thiourea can thus be discussed in two dimensions: the effects on the

150
environment and the effects on humans. A number of effects have been determined in
numerous studies.
The effects on the environment have been documented in a report by WHO (WHO,
2003). A few are highlighted here. The available experimental data on the
environmental bioaccumulation as well as the measured n-octanol/water partition
coefficients indicated no bioaccumulation potential for thiourea in aquatic organisms.
The administration of thiourea to laboratory animals caused a reduction in weight gain
and enlargement of the thyroid gland resulting in symptoms of hypothyroidism to
appear. However no reports of carcinogenicity have been attributed to thiourea
exposure in humans. Glazer and Orion (1984) investigated the effects of thiourea on
the development of nematodes. Excised tomato roots, growing on basal medium and
inoculated with eggs of Meloidogyne javanica, were exposed to thiourea concentrations
in the range of 6–46 mg/litre. After 96 hours of exposure, thiourea concentrations of
12 mg/litre inhibited nematode development. Only 36% matured to adults (in the
untreated control: 90%) after an observation period of 4 weeks
Different fungi were found to be relatively insensitive to thiourea exposure. But
complete growth inhibition was observed for Penicillium rugulosum after a 7-day
exposure to 2000 mg thiourea/litre (Lashen and Starkey, 1970). According to Lashen
and Starkey (1970), terrestrial plants proved to be generally more sensitive. Whereas
thiourea concentrations below 12 mg/litre increased the growth of excised tomato roots
(Lycopersicum esculentum) within 4 weeks of exposure in a defined basal medium, 18,
23, and 46 mg/litre reduced growth by about 45%, 60%, and 30%, respectively (Glazer
& Orion, 1984).
The effects of thiourea on humans include the following: The side-effects of thiourea
have been described from observations of the former therapeutic use of thiourea in the
1940s as a thyroid depressant (MAK, 1988). Cases of contact dermatitis have been
described in thiourea production workers; the contact dermatitis disappeared rapidly
after the workers had been transferred to another workplace (Speranski et al., 1969).
151
The concentrations of thyroid hormones T4 and T3 were significantly lower in the
exposed workers than in the controls (T4: 78.0 ± 5.2 versus 109.4 ± 2.0 nmol/litre, P <
0.05; T3: 1.2 ± 0.1 versus 3.8 ± 0.1 nmol/litre, P < 0.001) (Talakin et al., 1985).
Products such as wet suits, swimming goggles, orthopaedic devices, protective gloves,
and shoes containing these compounds have been shown to produce allergic contact
dermatitis (Kanerva et al., 1994; McCleskey and Swerlick, 2001). In an early study
with hyperthyroid patients (n = 12), it was shown that a dose of 15 mg (about 0.2 mg/kg
body weight per day for a 70-kg person) daily for 10–12 weeks was insufficient to
depress thyroid activity, as judged by the concentrations of serum precipitable iodine,
while a dose of 70 mg daily (1.0 mg/kg body weight per day) in conjunction with iodine
solution produced a remission in hyperthyroidism (Winkler et al., 1947). It is therefore
necessary that thiourea be removed from effluents by the addition of hydrogen peroxide
( 22OH ) after the determination of its concentration using the method developed
elsewhere ( Krzewska et al., 1984).
EDTA salts are used as a component in food products, pharmaceuticals and formulated
consumer products, such as soaps, shampoos and detergents, so there is great potential
for consumer exposure. For example, EDTA salts are used for surface preparation,
metal cleaning and plating in metal work. They are used as personal care products to
increase effectiveness and improve stability of solid soaps, creams, oils, ointments
shampoos and hair preparation. They are used in agriculture to provide micronutrients
to fertilizers, in photography as bleach in film processing and in textiles for dyeing
colour stripping. In water treatment, EDTA salts are used to control hardness and scale
formation due to calcium and magnesium. Most of the chelating agents are used as
components in chemical processes. The pulp and paper, cleaning, chemical processing,
agriculture and water treatment take up about 80% of the world consumption (SRI,
2003). Although EDTA salts have been found to be non-toxic to fish, ingestion of salts
with high pH or low pH can cause ulceration and burns of the mouth and throat. High
pH tetrasodium EDTA have been found to produce severe eye irritation and can impair
the vision (Dow, 2004:3-7). According to the Detergent Ingredient Review Committee

152
(DIRC, 1995), “The salts of EDTA are soluble in water and therefore form ions of
sodium and EDTA but there is no evidence of bio-accumulation in most of the aquatic
organisms”. Conclusions from the Institute for Health and Consumer Protection (IHCP)
European Union Risk Assessment Report of EDTA show that there is no risk to the
environment (IHCP, 2004).
The World Health Organization (WHO) and the United States Food and Drug
Administration (USFDA) have independently assessed the health safety of EDTA and
have set the acceptable daily intake of EDTA at 2.5 mg/kg/person/day or roughly 150
mg/day for the calcium disodium salt. Human consumption of EDTA at levels observed
in drinking water combined with that amount of EDTA consumed as part of average
daily food intake, are well within WHO and FDA acceptable daily intake guidelines.
It is acceptably clear that EDTA is safe and does not accumulate in the environment,
EDTA would be the best choice for electrorefining process because it would not
produce adverse effects on the workers. However, the main disadvantage is that the
cost of EDTA in the recovery of metals from soils has been reported to be high
(Nogueira et al., 2007). The other chemical that would be of great concern to the
environment is the acid in the electrolytes of electrorefining processes. The sulphuric
acid is highly soluble in water and has a half life of 2-20 days. The entry into the
environment is through industrial effluents. It has high potency to provide hydrogen
ions in solution. Increasing hydrogen ions in solution increases the acidity. If the acid
is not adequately neutralised, a great deal of damage to the environment would take
place; instant damage at high levels of hydrogen concentration and gradual at lower
levels of concentrations. The damage to environment can be classified into two
categories. The short term category produces acute effects. The acute-ecological
effects include death of animals, fish, and birds which can be observed in 2-4days after
exposure. The long term category is the chronic phase in which the chronic effects
include short life span, lower fertility, changes in the behaviour of animals (Vincoli,
1997:2813). It is therefore important that adequate neutralisation using lime would be
necessary before the discharge of effluents from electrorefining plant in order to protect

153
the life of plants, aquatic life, and the prevention of lowering of the quality of surface
and underground waters.
7.3 Economic Benefits
Many organisations in Zambia would find the results useful in the initiation of efforts to
establish small-scale plants. The mining sector of Zambia or the Government of the
Republic of Zambia would find the information useful in the efforts to meet the
challenge of technology advancement and mining sector copper improvement strategies.
The academic fraternity and particularly students will find the information useful as one
of their reference sources in the process of carrying out their project reviews. Other
business entities particularly those that are into copper recovery may want to use the
study as an opportunity to decide to venture into the copper recovery using
electrorefining method.
The major benefit that the study will provide is the use of new smootheners, which are
available and are not currently exploited. Employment generation and sustainable
development goes hand in hand with such innovations. If the study can be adopted then
it would provide an opportunity to many and therefore sustain lives in the informal
sector as the demand for copper in the informal sector for repairing equipment both in
electrical and automotive small scale industries is increasing. The study would
therefore provide an easy way to purify copper from ore or scrap metals.
Wastewater treatment is experiencing a number of problems. The removal of heavy
metals and the metals higher up in the chemical series is becoming increasingly difficult
as the pollution events are increasing due to faulty equipment and lax management
systems. Electrorefining is one of the methods that can easily be adapted and applied in
this area at a large scale to treat wastewaters, removing metals, before they are released
into the environments. It is also a good method to remove precious metals such as gold
and silver.

154
Electroplating using electrochemical process is used in many countries in the world and
therefore this is an already existing benefit that human kind is enjoying. However there
are many new areas of applications that could benefit from this methodology. The use
of smootheners such as K-glue and B-glue which can help to reduce the nodulation
problem would provide a great benefit to the electrochemical industry. It can be
observed in Table 7.1 that the price of the smootheners could be a factor that could
increase the cost of the recovery of copper from solutions.
Table 7.1: The current prices of some smootheners and inhibitors
No Item Cost/kg ($) Cost/tonne ($)
1 Paper Glue (Beacon Zip); solid 13.3 13 300
2 Paper Glue (Krazy Glue); gel 7.5 7 500
3 Paper Glue (Craft Glue); gel 24.3 24 300
4 Paper Glue (Bostik Glue Stick); solid 21.0 21 000
5 Bone Glue; granules 1.5 1 500
6 Gum Arabic (Acacia Senegal); granules 5.0 5 000
7 EDTA; granules 2.0 2 000
At 7.5$/kg K-glue would introduce a lower cost to the recovery than B-glue whose
price per kilogram, 21$, is on the high side. Even the cost of some other smootheners
such as Beacon Zip (solid), Craft glue (gel) at 13.3 and 24.3$/kg respectively can be
considered to be on the high side when compared to K-glue. Although bone glue is the
cheapest at 1.5$/kg it may not be the effective smoothener at the current levels that K-
glue and B-glue have proven to be in this study. Gum Arabic has proven to be equally
effective as K-glue in this study and its price per tonne is 33.3% lower than that of K-
glue. It would provide a better leverage in terms of cost.
7.4 Conclusion
The study drew a number of conclusions. The increase in electrode active area
decreased the current and the current density and hence the current efficiency. It

155
requires the adjustment of overvoltage in order to maintain the same deposition rate at
the desired electrode active area. The increase in overvoltage and current density
increased the deposition rate, which resulted in irregular deposits on the cathode
particularly at current densities exceeding the limiting value. The increase in
temperature of the reactor favoured the current efficiency more so at temperatures
above 40oC and temperatures less than 70oC for the 2 and 3cm distances between
electrodes. The increase in distance between electrodes produced a decrease in the rate
of deposition on the cathode. Therefore adjustment to the overvoltage and current
density was required in order to maintain the same level of rate of deposition and
current efficiency. The concentration of electrolyte was a principal factor to the level of
the limiting current and the smooth operation of the circular reactors. Concentrations
above 10.8g/L produced stable current efficiencies. The metal impurities that have
reduction potentials greater than that of copper were found to have no effect on the
electrolytic process while those with similar decomposition potentials like Silver and
bismuth nitrates produced strong inhibition on the electrochemical reaction and hence
lowered the current efficiencies. The use of K-glue, B-glue, G-Arabic, thiourea and
EDTA produced varying smoothening effects on the cathode. Therefore the limiting
current, current density, active area, temperature, and concentration of electrolyte and
smootheners are useful parameters in the evaluation of copper recovery from solutions.
7.5 Recommendations
In making recommendations one has to have the operating factors that affect the
electrorefining process in mind. It is also important to note that the copper recovery by
the electrochemical method is widely used in the world but the problems that enchroach
the process during operation have been a challenge to many that operate such processes.
Often times the staff that operate such processes are semi skilled as is the case in most
third world countries and therefore it is common that employees can ignore important
parameters that are required to produce quality copper. In such cases the industry may
spend huge sums of money on the correction of such problems. The recommendations
that are given below are inter- linked with the fact that the current efficiency is a critical

156
parameter in ensuring that the yie ld is at the level that can bring about profitability to
industries.
The increase in electrode active area decreases the current and the current density and
hence the current efficiency. It is therefore recommended that the reactors be operated
at right level of current density determined from chromatogram studies. This requires
the adjustment of overvoltage in order to obtain the current that can produce the desired
current density in order to maintain a high current efficiency. The key in determining
such is the limiting current density. The increase in overvoltage and current density
increases the deposition rate, which results in irregular deposits to form on the cathode
particularly at current densities exceeding the limiting value. The problem can be
solved through the determination of the value of the limiting current density and then,
as stated earlier, adjusting the overvoltage to the level that attains the current density to
the level below the limiting value. The increase in temperature of the reactor favoured
the current efficiency more so at temperatures above 30oC and temperatures less than
70oC. Although the current efficiencies were high in some cases at temperatures lower
than the stated range, the instability can make the operation difficult as most ions of the
electrolyte are not released into solution. It is therefore recommended that the operation
of the reactors be at temperatures above 30oC (39 to 70oC) as temperatures above 70oC
can damage the plant based smootheners K-glue and B-glue.
The increase in distance between electrodes produced a decrease in the rate of
deposition on the cathode. Therefore adjustment to the overvoltage and current density
is required in order to maintain the same level of rate of deposition and current
efficiency. The concentration of electrolyte is a principal factor in the operation of
electrorefining process. The level of the limiting current and the smooth operation of
the circular reactors depended on the concentration. It is important therefore that the
concentration in reactors be maintained at levels above 10g/L and below 100g/L. This
range produced high levels of current efficiencies. The other reason is that at
concentrations lower than 10g/L the resistance in the solution increases and therefore
157
the current density is affected. Electrowinning may be very useful at concentrations
below this range.
The metal impurities that have oxidation potentials more negative than that of copper
were found to have no effect on the electrolytic process. Users of electrorefining
process should not worry about these. However, elements that have the same oxidation
potentials as that of copper, examples being bismuth and silver or their nitrates, which
were found to compete with copper during the electrochemical reactions need to be
eliminated before the process begins or during the process by adding an eliminator such
as sodium chloride which can precipitate out such metals as bismuth and silver as
chlorides. Such compounds do not ionise easily in the electrolyte at the operating
temperature.
Smootheners have been found to refine the grain of the cathode surface and hence help
to improve production efficiency. Smootheners such as thiourea and Bone glue are
extensively used in industry to produce commercial grade copper. Sodium Chloride
and potassium chloride are also used. The use of G-Arabic is reported in other studies
as indicated in the report. However the use of K-glue, B-glue and P-glue in
electrorefining is not reported in literature. These compounds were found to be
effective in the smoothening of cathode surfaces. The users of electrorefining
processes should try K-glue and B-glue in order to reduce the costs of production.
Thiourea and EDTA should not be used alone because these chemicals are strong
current density inhibitors and impact on the current efficiency highly. Both these
chemicals were found to lower the current efficiency. Therefore it is recommended that
each of thiourea and EDTA be used in conjunction with either K-glue or P-glue or B-
glue or G-Arabic in the presence of sodium chloride.

158
BIBLIOGRAPHY
Andersen, T. N., Pitt, C. H. and Livingston, L. S. 1983. Nodulation of electrodeposited
copper due to suspended particulate. Journal of Applied Electrochemistry, 13
(4): 429-438
Anscombe, F., 1973. Graphs in Statistical Analysis. The American Statistician. pp
195-199.
Antropov, L. I. 1972. Concentration polarization. In: Theoretical Che mistry.
Moscow: Mir Publishers.
Ashiru, O. A. 1995. Influence of bath additives on the composition of
electrodeposited silver coatings. John Wiley & Sons Ltd., 23(9): 618-622.
Barnard, H. and Cronje, W. 2000. Study guide for the M. Tech students involved
with research projects and the scientific reporting of results. Pretoria:
Technicon SA [S.n].
Barrow, G. M. 1979. Physical Chemistry. 4th Ed. New York: McGraw-Hill Book
Company.
Bellino, M. and Harris, B. 2001. Anodic Oxygen Recovery in Nickel and Cobalt
Sulphate Electrowinning for Reuse in the Leaching Step as potential added benefit
through recovery of oxygen-rich gases. In: Electrometallurgy 2001 Symposium,
31st Annual Hydrometallurgical, Université Laval, Sainte-Foy, Quebec, Canada

159
Billard, L., and Diday, E. 2003. From the Statistics of Data to the Statistics of
Knowledge: Symbolic Data Analysis. Journal of American Statistical
Association, 98: 470-487.
Bisang, J. M. 1997. Modelling the start-up of a continuous parallel plate
electrochemical reactor. Journal of Applied Electrochemistry, 27(4): 379-384.
Box, G. E. P. and Jenkins, G. 1976. Time Series Analysis: Forecasting and Control,
Holden-Day, pp 28-32
Box, G. E. P., Hunter, W. G. and Hunter, J. S. 1978. Statistics for Experimenters: An
Introduction to Design, Data Analysis, and Model Building. New York: John
Wiley and Sons.
Bruce, P. G. (Editor) 1995. Solid State Electrochemistry. Cambridge: Cambridge
University Press, pp 199-201.
BUA, 1995. Thiourea. German Chemical Society (GDCh) Advisory Committee on
Existing Chemicals of Environmental Relevance (BUA). Stuttgart: S. Hirzel,
Wissenschaftliche Verlagsgesellschaft (BUA Report 179).
Carlin, B. P. and Louis, T. A. 1996. Bayes and Empirical Bayes Methods for Data
Analysis. London: Chapman and Hall.
Chambers, J., Cleveland, W., Kleiner, B. and Tukey, T. 1983. Graphical Methods for
Data Analysis. Wadsworth.
Chambers, J. M. and Hastie, T. J. 1992. Statistical Models in S. London: Chapman
and Hall
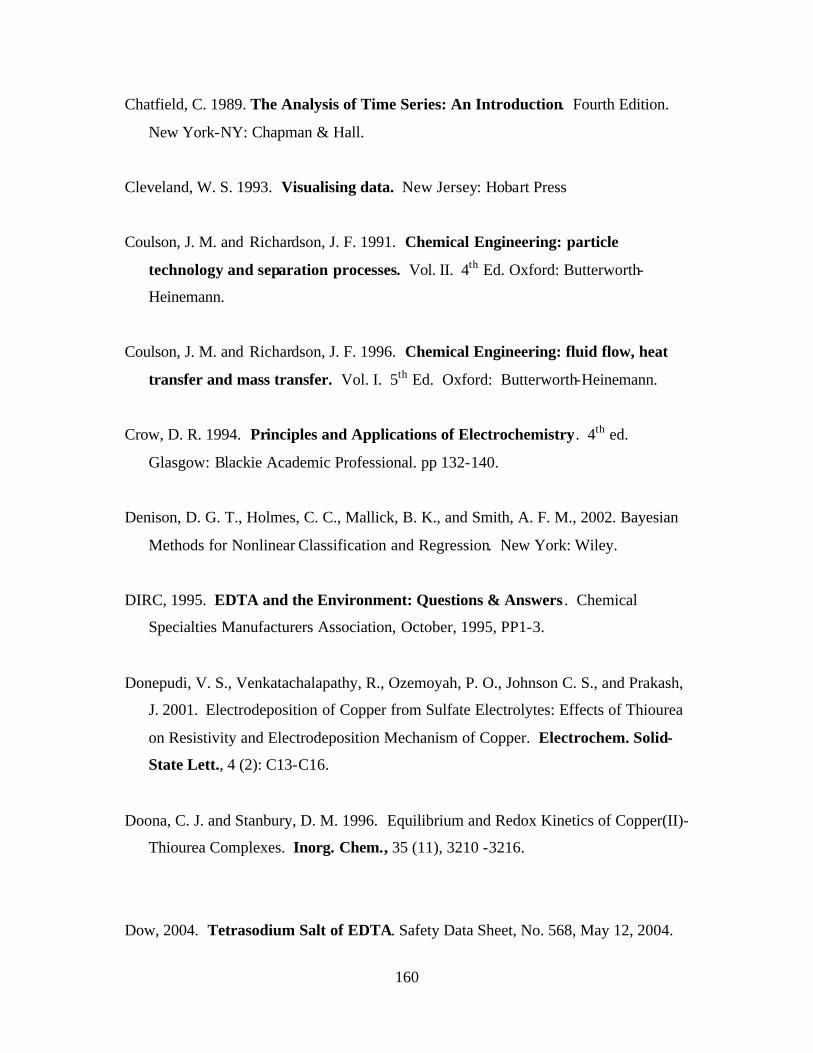
160
Chatfield, C. 1989. The Analysis of Time Series: An Introduction. Fourth Edition.
New York-NY: Chapman & Hall.
Cleveland, W. S. 1993. Visualising data. New Jersey: Hobart Press
Coulson, J. M. and Richardson, J. F. 1991. Chemical Engineering: particle
technology and separation processes. Vol. II. 4th Ed. Oxford: Butterworth-
Heinemann.
Coulson, J. M. and Richardson, J. F. 1996. Chemical Engineering: fluid flow, heat
transfer and mass transfer. Vol. I. 5th Ed. Oxford: Butterworth-Heinemann.
Crow, D. R. 1994. Principles and Applications of Electrochemistry. 4th ed.
Glasgow: Blackie Academic Professional. pp 132-140.
Denison, D. G. T., Holmes, C. C., Mallick, B. K., and Smith, A. F. M., 2002. Bayesian
Methods for Nonlinear Classification and Regression. New York: Wiley.
DIRC, 1995. EDTA and the Environment: Questions & Answers . Chemical
Specialties Manufacturers Association, October, 1995, PP1-3.
Donepudi, V. S., Venkatachalapathy, R., Ozemoyah, P. O., Johnson C. S., and Prakash,
J. 2001. Electrodeposition of Copper from Sulfate Electrolytes: Effects of Thiourea
on Resistivity and Electrodeposition Mechanism of Copper. Electrochem. Solid-
State Lett., 4 (2): C13-C16.
Doona, C. J. and Stanbury, D. M. 1996. Equilibrium and Redox Kinetics of Copper(II)-
Thiourea Complexes. Inorg. Chem., 35 (11), 3210 -3216.
Dow, 2004. Tetrasodium Salt of EDTA. Safety Data Sheet, No. 568, May 12, 2004.

161
Dow, W., Huang, H., Yen, M. and Huang, Hsiao-Chun. 2005. Influence of convection-
dependent adsorption of additives on microvic filling by copper electro-plating. J.
Electrochem. Soc., 152(6): C425-C434.
Du Toit, S. H., Steyn A. G. W. and Stumpf, R. H. 1986. Graphical Exploratory Data Analysis. New York: Springer-Verlag.
Eastop, T. D. and McConkey, A. 1990. Applied Thermodynamics for Engineering
Technologists. 4th Ed. Oxford: Butterworth and Henneman
Farndon, E. E., Walsh, F. C. and Campbell, S. A. 1995. Effect of thiourea,
benzotriazole and 4,5-dithiaoctane-1, 8-disulphonic acid on the kinetics of copper
deposition from dilute acid sulphate solutions. Journal of Applied
Electrochemistry, 25(6): 574-583.
Fogler, 1986. Elements of Chemical reaction Engineering. 4th Ed. New York: Pearson
Higher Education.
Fthenakis, V. M. 2003. Life cycle impact analysis of Cadmium in CdTe PV
Productions. Renewable and Sustainable Energy Reviews , 8(2004): 303-334.
Gana, R., Figueroa, M., Kattan, L. and Castro, S., 1993. Direct electrorefining of
copper scrap using an anode-support system in a bipolar cell. Journal of Applied
Electrochemistry, 23 (3): 813-818.
Gelman, A., Berkhof, J. and Van Mechelen, I. 2003. A Bayesian Formulation of
Exploratory Data Analysis and Goodness-of-Fit Testing. Inter-national Statistical
Review.

162
Gelman, A. 2004. Exploratory Data Analysis for complex models. Journal of
Computational and Graphical Statistics, Volume 13, Number 4, Pages 755–779
Glasstone, S. and Lewis, D. 1960. Elements of Physical Chemistry. 2nd Ed. London:
The Macmillan Press.
Glazer, I. and Orion, D. 1984. Influence of urea, hydroxyurea and thiourea on
Meloidogyne javanica and infected excised tomato roots in culture. Journal of
Nematology, 16(2):125–130.
Goodrum, L. J., Patel, A., Leykam, J f. and Kieliszewski, M J. 2000. Gum arabic
glycoprotein contains glycomodules of both extensin and arabinogalactan-
glycoproteins, Phytochemistry, 54: 99-106
Grcman, H., Vodnik, D., Velikonja-Bolta, S. and Lestan, D. 2003.
Ethylenediaminedissuccinate as a new chelate for environmentally safe enhanced
lead phytoextraction. J. Environ. Quality, 32:500-506.
Gurmen, S., Orhan, G., Arslan, G., and Timur, S. 2004. Copper refining at high current
densities. Istanbul: ARI-The bulletin of the Istanbul Technical University, 54
(2): 1-44.
Hastie, T., Tibshirani, R., and Friedman, J. 2002. The Elements of Statistical
Learning. New York: Springer-Verlag
Heaton, H. E. 1986. The Chemistry Industry. 1st Ed. Glasgow: Blackie & Son
Limited.
Heitz, E. and Kreysa, G. 1986. Principles of Electrochemical Engineering.
Frankfurt: VCH, Verlags gasellschaft MBH Publishers.

163
Hiskey, J. B. and Cheng, X. 1998. Fundamental Studies of Copper Anode Passivation
during Electrorefining: Part III. The effect of Thiourea. Metallurgical and
Materials Transactions B 29B (1): 53-58
Huang, J. W., Chen, J., Berti, W. R. and Cunningham, S. D. 1997. Phytoremediation of
lead-contaminated soils: Role of synthetic chelates in lead phytoextraction.
Environ. Sci. Technol., 31(3): 800-805.
IHCP, 2004. Tetrasodium Ethylenediaminetetraacetate (Na4EDTA), European
Chemicals Bureau, European Union Risk Assessment Report (S.a).
Kang-gen, Z., Ging-Gang, L. and Qi-Xiu, Z. 2000. Electrodeposition of Copper by
IMPC method. Journal of Central South University of Technology, 7(4): 186-
190.
Kanerva, L., Estlander, T. and Jolanki, R. 2000. Occupational allergic contact dermatitis
from trichlorozincates of 4-(dimethylamino)benzendiazonium (Diazo A) and 3-
methyl-4-(pyrrolidin-1-yl)benzenediazonium (Diazo Y) and thiourea in diazo copy
paper. Contact Dermatitis, 43(3):170–171.
Karabacak, T., Kim, S., Koratka, N. and Lu, T. 2006. Water electrolysis activated by
Ru nanorod array electrodes. Applied Physics Letters , 88(26).
Koryta, J. and Dvorak, J. 1987. Principles of Electrochemistry. Chichester: John
Wiley & Sons.
Krzewska, S., Pajdowski, L., Podsiadly, H.and Podsiadly. J. 1984. Electrochemical
determination of thiourea and glue in the industrial copper electrolyte.
Metallurgical Transactions B: Process Metallurgy, 15 (3): 451-459.

164
Kuo, W. P., and Marcia M., (Eds), 1993. “Quality Through Engineering Design”,
specifically, the article Filliben, Cetinkunt, Yu, and Dommenz (1993), Exploratory
Data Analysis Techniques as Applied to a High-Precision Turning Machine .
New York: Elsevier.
Lafront, A-M., Veilleaux, B. and Ghali, E. 2002. Galvanostatic and microscopic studies
of nodulation during copper electrolysis. Journal of Applied Electrochemistry,
32(3): 329-337.
Lapedes, D. N. 1978. McGraw-Hill dictionary of Scientific and Technical Terms .
2nd Ed. New York: McGraw-Hill.
Lashen, E. and Starkey, R. 1970. Decomposition of thioureas by a penicillium species
and soil and sewage-sludge microflora. Journal of General Microbiology,
64:139–150.
Levenspiel, O. 1962. Kinetics of homogeneous reactions. In: Chemical Reaction
Engineering. New York: John Wiley and Sons.
Ling, X., Gu, Z. H., and Fahidy, T. Z. 1994. Effect of operating conditions on anode passivation in electrorefining of copper. Journal of Applied Electrochemistry, 24(11): 1109-1115.
Lingane, J. J. 1949. Acta Anal. Chem.
Llopis J., Gamboa, J., Arizmendi, L. and Alonso, F. 1962. Tarnishing Reaction of
Copper with Solutions of Thiourea and Derivatives: Study by Radiotracers. Journal
of The Electrochemical Society, 109 (5): 368-377.
Lonzano-Morales, A., and Podlaha, E. J., 2004. The effect of Al2O3 Nanopowdwer on
Cu electrodeposition. J. Electrochem. Soc., 151(7): C478-C483.

165
Mackinnon, G. J., Brannen, J. M. and Mcmillan, R. S. 1985. Factors affecting the
structure of copper deposits electrowon from aqueous chloride electrolyte. Journal
of Applied Electrochemistry, 15(1985): 649-658.
MAK, 1988. Thiourea. In: Henschler D, ed. Occupational toxicants: Critical data
evaluation for MAK values and classification of carcinogens. Volume 1. Deutsche
Forschungsgemeinschaft (DFG); Commission for the Investigation of Health
Hazards of Chemical Compounds in the Work Area (MAK Commission).
Weinheim: VCH Verlagsgesellschaft mbH, pp 301–312
McCabe, W. L. and Smith, J. 1976. Unit Operations Of Chemical Engineering. 3rd
Ed. New York: McGraw-Hill.
McCleskey, P. E. and Swerlick, R. A. 2001. Clinical review: thioureas and allergic
contact dermatitis. Cutis, 68(6):387–396.
Meng, X. L. 1994. Posterior Predictive p-Values. The Annals of Statistics, 22, 1142–
1160
Mertschenk, B., Beck, F. and Bauer, W. 1995. Thiourea and thiourea derivates. In:
Elvers B, ed. Ullmann’s encyclopedia of industrial chemistry, 5th ed. Volume
A26. Weinheim, VCH.
Muresan, L., Varvara, S., Popescu, I. C., and Maurin, G. 2004. Copper
electrodeposition from sulphate electrolytes in the presence of hydroxy ethylated-
2butyne-1, 4-diol. Hydrometallurgy, 75(1-4): 147-156.
Newton, J. 1959. Extractive Metallurgy. New York: John Wily & Sons. PP 452-455,
465-472.

166
NIST and SEMATECH, 2006. e-Handbook of Engineering Statistical Methods.
Available at http://www.itl.nist.gov/div898/handbook
Nogueiraa, G. M., Pazosa, M., Sanromana, M. A. and Cameselle, C. 2007. Improving
on electrokinetic remediation in spiked Mn kaolinite by addition of complexing
agents. Electrochimica Acta, 52(10): 3349-3354.
Perry, R.H. and Chilton, C.H. 1973. Chemical Engineers Handbook. New York:
McGraw-Hill.
Phillips, G. O., Ogasawara, T. and Ushida, K. 2008. The regulatory and scientific
approach to defining gum arabic (Acacia Senegal and Acacia seyal) as a dietary
fibre. Food Hydrocolloids , 22(1): 24-35.
Pletcher, D. and Walsh, F. C. 1993. Industrial Electrochemistry. 2nd Ed. Glasgow:
Blackie Academic & Professional. pp 75-77, 232-233.
Pozniak, B. P. and Cole, R. B. 2007. Current Measurements within the Electrospray
Emitter. Journal of the American Society for Mass Spectrometry, 18(4): 737-
748.
Rakhsheni, A. E. and Varghese, J. 2006. The effect of temperature on electrodeposition
of Cuprous Oxide. PSS, 105(1): 183-188.
Rousar, I., Micka, K. and Kimla, A. 1986. Electrochemical Engineering I. New
York: Elsevier.
Ruotolo, L. A. M., and Gubulin, J. C. 2002. Electrodeposition of copper ions on fixed
bed electrodes: kinetic and hydrodynamic study. Brazillian Journal of Chemical
Engineering, 19(1): 105-118.

167
Russell, L. D. and Adebiyi, G. A. 1993. Classical Thermodynamics. New York:
Saunders College Publishing.
Sedahmed, G. H., Mansour, I. A. S., Zatout, A. A. and Abdel-Hay, N. A. 1980. The
role of mass transfer in the kinetics of anodic dissolution of gas-evolving metallic
surfaces. Journal of Applied Electrochemistry, 10(4): 543-547.
Skoog, D. A. and West, D. M. 1976. Fundamentals of Analytical Chemistry. 3rd Ed.
New York: Holt, Rinehart and Winston, pp 291, 298, 299, 419-424.
Speranski, N. J., Zacharow, I. R. and Taranucha, N. M. 1969. Occupational skin
diseases in workers at a thiourea-processing factory. Gigiena Trudai
Professional’nye Zabolevaniya, 13:50–51.
SRI, 2003. Chemical Economics Handbook Product Review Chelating Agents, SRI
International, October 2003, pp 5-6, 16-17.
Srinivasan, S. and Bommaraju, T. 2006. Fuel Cells: From fundamentals to applications.
In: Electrochemical Technologies and Applications . Springer US.
Stankovic, Z. D. and Vukovic, M. 1996. The influence of thiourea on kinetic
parameters on the cathodic and anodic reaction at different metals in H2SO4
solution. Electrochimica acta, 41(16): 2529-2535.
Stankovic, Z. D., Cvetkovski, V. and Rajcic-Vujasinovic, M. 2001. The effect of
Nickel presence in anodic copper on kinetics and mechanism of anodic dissolution
and cathodic deposition of copper. J. Electrochem. Soc., 148(6): C443-C446.
Stelter, M., Bombach, H. and Nesterov, N. 2002. Using Polyethylene Glycols as
Alternative Inhibitors in Copper Electrorefining, Journal of Minerals, Metals and
Materials Society, 54(4): 32-36.

168
Stelter, M. and Bombach, H. 2004. Process Optimisation in copper electrorefining.
Advanced Engineering Materials, 6(7): 558-562.
Stephens, M. A. 1974. EDF Statistics for Goodness of Fit and Some Comparisons,
Journal of the American Statistical Association, 69(347): 730-737.
Stephens, M. A. 1976. Asymptotic Results for Goodness-of-Fit Statistics with Unknown
Parameters. Annals of Statistics, 4(2): 357-369..
Stephens, M. A. 1977. Goodness of Fit with Special Reference to Tests for
Exponentiality. Stanford-CA: Stanford University, Department of Statistics,
Technical Report No. 262.
Subramanian, V. R. and White, R. E. 2000. A semi-analytical method for predicting
primary and secondary current density distributions: linear and non- linear boundary
conditions. J. of Electrochem. Soc., 147(5): 1636-1644.
Talakin, Y., Kolornoiskaya, M., Meleknin, U. D., Grishina, K. A., Chernykh, L. Y. and
Kondratenko, L. A. 1985. Functional status of the thyroid gland of workers
employed in thiourea manufacture. Gigiena Truda i Professional’nye
Zabolevaniya, 9:50–51.
Tukey, J. 1977. Exploratory Data Analysis. Addison-Wesley.
Tukey, J. and Mosteller, F. 1978. Data Analysis and Regression. Journal of the
Royal Statistical Society. Series A (General), Vol. 141, No. 4 (1978), pp. 549-550..
Umino, M., Oda, N. and Yasuhara, Y. 2002. Experimental and theoretical studies of
the effect of electrode polarisation on capacitances of blood and potassium chloride
solution. Journal of Medical and Biological Engineering and Computing, 40
(5): 533-541.

169
Veilleaux, B., Lafront, A-M., Ghali, E. and Roberge, P. R. 2003. The use of
electrochemical noise measurements to detect bad copper electrorefining conditions.
Journal of Applied Electrochemistry, 33(11): 1093-1098.
Velleman, P., and Hoaglin, D. 1981. The ABC's of EDA: Applications, Basics, and
Computing of Exploratory Data Analysis, Duxbury.
Verbeken, D., Dierckx, S. and Dewettinck, K. 2003. Exudate gums: occurence,
production, and applications, Appl. Microbiol. Biotechnol, 63(1): 10-21.
Vetter, K. J. 1967. Electrochemical kinetics. New York: Academic Press.
Vincoli, J. W. 1997. Risk management for hazardous chemicals. Technology and
Engineering. pp 2813.
Voros, K. 2006. Laboratory Manual. Available at www.microlab.berkely.edu
Walas, S. M. 1989. Reaction Kinetics for Chemical Engineers . Butterworth, Boston.
pp 14, 20.
Wan, C. C., Cheh, H. Y. and Linford, H. B. 1979. A study of electrochemical kinetics
of copper deposition under pulsed current conditions. Journal of Applied Electro-
chemistry, 9(1): 29-35
WHO, 2003. Thiourea. International Programme on Chemical Safety II.Series
ISBN 92 4 153049 9 (NLM Classification: WK 202), ISSN 1020-6167.
Williams, P. A. and Phillips, G. O. 2008. Gum Arabic. In: Handbook of
hydrocolloids , Cambridge, England: CRC Press.

170
Winkler, A. W., Man, E. B. and Danowski, T. S. 1947. Minimum dosage of thiourea,
given together with iodine medication, necessary for the production amd
maintenance of a remission in hyperthyroidism. Journal of Clinical Investigation,
26:446–452.
Wu, J., Hsu, F. C. and Cunningham, S. D. 1999. Chelate-assisted Pb phytoextraction:
Pb availability, uptake and translocation constraints. Environ. Sci. Technol.
33(11):1898-1904.
Yamamoto, H., Iwagishi, T., Koyama, K., Shirai, H. and Kobayashi, H. 2002.
Electrodeposition of Zinc from Lewis Basic 1-Ethyl-3-Methylimidazolium Bromide
- Zinc Bromide Molten Salt. In: Proceedings of the 13th International
Symposium on Molten Salts and Molten Salts XIII, Vol. 13: 863-872.
Yousef, Kh. M. S., Koch, C. C., and Fedkiw, P. S. 2004. Influence of additives and
pulse electrodeposition parameters on production of nanocrystalline zinc from zinc
chloride electrolytes. Journal of the Electrochemical Society, 151(2): C103-C111.
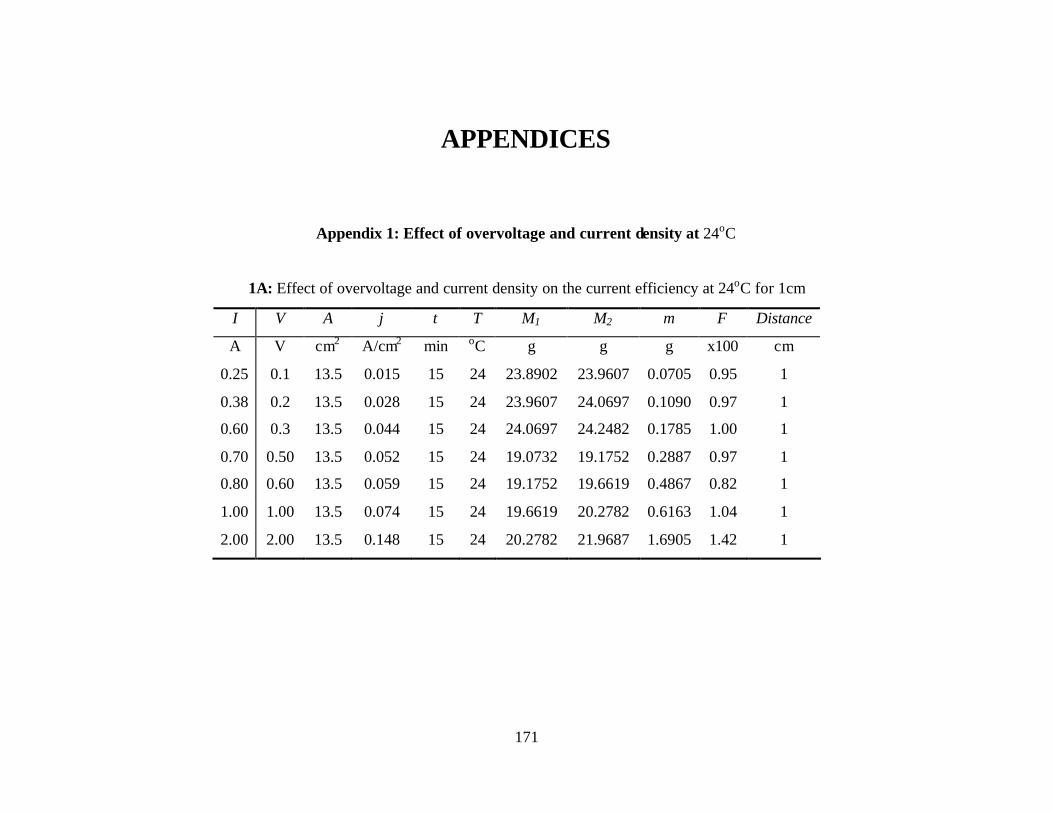
171
APPENDICES
Appendix 1: Effect of overvoltage and current density at 24oC
1A: Effect of overvoltage and current density on the current efficiency at 24oC for 1cm
I V A j t T M1 M2 m F Distance
A V cm2 A/cm2 min oC g g g x100 cm
0.25 0.1 13.5 0.015 15 24 23.8902 23.9607 0.0705 0.95 1
0.38 0.2 13.5 0.028 15 24 23.9607 24.0697 0.1090 0.97 1
0.60 0.3 13.5 0.044 15 24 24.0697 24.2482 0.1785 1.00 1
0.70 0.50 13.5 0.052 15 24 19.0732 19.1752 0.2887 0.97 1
0.80 0.60 13.5 0.059 15 24 19.1752 19.6619 0.4867 0.82 1
1.00 1.00 13.5 0.074 15 24 19.6619 20.2782 0.6163 1.04 1
2.00 2.00 13.5 0.148 15 24 20.2782 21.9687 1.6905 1.42 1

172
1B: Effect of overvoltage and current density on the current efficiency at 24oC for 2cm
1C: Effect of overvoltage and current density on the current efficiency at 24oC for 3cm
I V A j t T M1 M2 m F Distance
A V cm2 A/cm2 min oC g g g x100 cm
0.14 0.10 22.5 0.004 15 24 23.2934 23.3326 0.0392 0.94 3
0.25 0.20 22.5 0.010 15 24 23.3326 23.4007 0.0681 0.92 3
0.55 0.30 22.5 0.023 15 24 23.4007 23.5593 0.1586 0.97 3
0.66 0.40 22.5 0.030 15 24 23.5593 23.7493 0.1900 0.97 3
I V A j t T M1 M2 m F Distance
A V cm2 A/cm2 min oC g g g x100 cm
0.10 0.10 12 0.008 15 24 24.2482 24.2792 0.0310 1.00 2
0.30 0.20 12 0.025 15 24 24.2792 24.3700 0.0908 1.02 2
0.35 0.30 12 0.029 30 24 32.1369 32.4145 0.2776 0.93 2
0.40 0.80 12 0.033 30 24 32.4145 32.6586 0.2441 1.03 2
0.80 1.20 12 0.067 30 24 32.6586 33.0950 0.4364 0.92 2
1.70 1.80 12 0.142 30 24 33.0950 33.9335 0.8385 0.83 2

173
1D: Effect of overvoltage and current density on the current efficiency at 24oC for 4cm
I V A j t T M1 M2 m F Distance
A V cm2 A/cm2 min oC g g g x100 cm
0.14 0.1 20.3 0.010 15 24 24.3700 24.4090 0.0390 0.94 4
0.20 0.2 20.3 0.010 15 24 24.4090 24.4610 0.0520 0.88 4
0.40 0.30 20.3 0.020 30 24 31.3160 31.4318 0.1158 0.98 4
0.50 0.40 20.3 0.025 30 24 31.4318 31.5860 0.1542 1.00 4
0.80 0.70 20.3 0.039 30 24 31.4170 31.8050 0.3880 0.82 4
1.25 1.11 20.3 0.062 30 24 31.8050 32.9908 1.1858 1.60 4
1.65 1.40 20.3 0.081 30 24 32.9908 34.1867 1.1959 1.22 4

174
Appendix 2: Effect of overvoltage and current density at 39oC
2A: Effect of overvoltage and current density on current efficiency for 1cm distance
I V A j t T M1 M2 m F Distance
A V cm2 A/cm2 min oC g g g x100 cm
0.28 0.1 16 0.010 15 39 13.7640 13.8414 0.0774 0.93 1
0.50 0.2 16 0.028 15 39 13.8414 13.9856 0.1442 0.97 1
0.85 0.3 16 0.053 15 39 13.9856 14.2023 0.2177 0.85 1
1.25 0.4 16 0.078 15 39 14.2033 14.5580 0.3547 0.93 1
2.00 0.8 16 0.122 15 39 14.5580 15.3320 0.7740 1.30 1
2B: Effect of overvoltage and current density on current efficiency for 2cm distance
I V A j t T M1 M2 m F Distance
A V cm2 A/cm2 min oC g g g x100 cm
0.30 0.10 27.5 0.010 15 39 27.2559 27.3412 0.0853 0.96 2
0.40 0.20 27.5 0.020 15 39 27.3412 27.4325 0.0913 0.96 2
0.80 0.40 27.5 0.030 15 39 27.4325 27.6390 0.2065 0.87 2
1.30 0.80 27.5 0.050 30 39 27.6390 28.1173 0.4783 1.24 2

175
2C: Effect of overvoltage and current density on current efficiency for 3cm distance
I V A j t T M1 M2 m F Distance
A V cm2 A/cm2 min oC g g g x100 cm
0.15 0.10 24.8 0.004 16 39 18.3652 18.4132 0.0480 1.00 3
0.20 0.20 24.8 0.008 15 39 18.4132 18.4687 0.0555 0.93 3
0.32 0.30 24.8 0.012 15 39 18.4687 18.5617 0.0930 0.98 3
0.70 0.40 24.8 0.016 15 39 18.5617 18.7712 0.1095 0.93 3
1.00 0.50 24.8 0.020 15 39 18.7712 19.0583 0.2871 0.98 3
1.52 0.80 24.8 0.061 15 39 19.0583 19.5022 0.4439 0.98 3
1.80 1.00 24.8 0.073 21 39 19.5022 20.2454 0.7432 0.98 3
3.00 1.30 24.8 0.121 15 39 20.2454 21.2688 1.0234 1.15 3
2D: Effect of overvoltage and current density on current efficiency for 4cm distance
I V A j t T M1 M2 m F Distance
A V cm2 A/cm2 min oC g g g x100 cm
0.10 0.05 14 0.010 15 39 15.5205 15.5205 0.0000 0.00 2
0.20 0.10 14 0.011 15 39 15.5205 15.5773 0.0568 0.96 2
0.30 0.20 14 0.020 15 39 15.5773 15.6357 0.0854 0.96 2
0.60 0.45 14 0.040 15 39 15.6357 15.8063 0.1706 0.96 2
0.85 1.00 14 0.061 15 39 15.8063 16.4094 0.2909 1.15 2
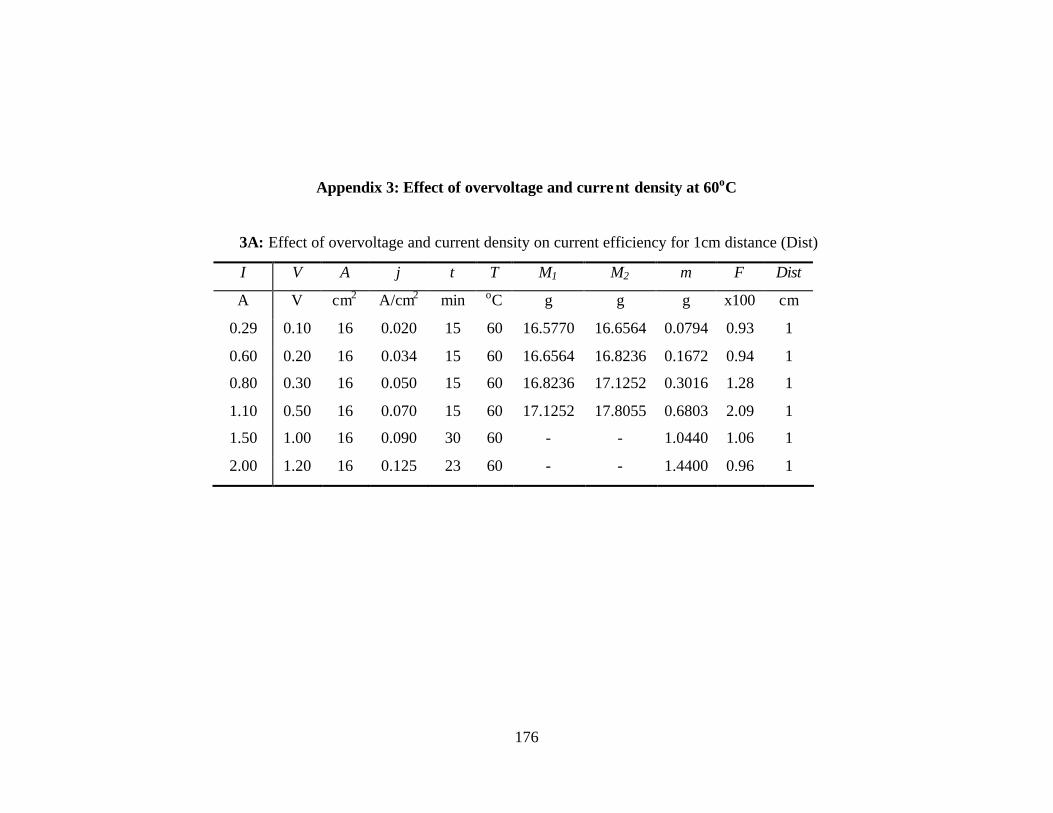
176
Appendix 3: Effect of overvoltage and current density at 60oC
3A: Effect of overvoltage and current density on current efficiency for 1cm distance (Dist)
I V A j t T M1 M2 m F Dist
A V cm2 A/cm2 min oC g g g x100 cm
0.29 0.10 16 0.020 15 60 16.5770 16.6564 0.0794 0.93 1
0.60 0.20 16 0.034 15 60 16.6564 16.8236 0.1672 0.94 1
0.80 0.30 16 0.050 15 60 16.8236 17.1252 0.3016 1.28 1
1.10 0.50 16 0.070 15 60 17.1252 17.8055 0.6803 2.09 1
1.50 1.00 16 0.090 30 60 - - 1.0440 1.06 1
2.00 1.20 16 0.125 23 60 - - 1.4400 0.96 1

177
3B: Effect of overvoltage and current density on current efficiency for 2cm distance
I V A j t T M1 M2 m F Dist
A V cm2 A/cm2 min oC g g g x100 cm
0.29 0.10 13.5 0.015 15 60 22.7720 22.8550 0.0830 0.97 2
0.50 0.20 13.5 0.037 15 60 22.8550 22.9920 0.1370 0.93 2
0.85 0.35 13.5 0.063 15 60 22.9920 23.2325 0.2405 0.95 2
1.65 0.80 13.5 0.122 15 60 23.2325 25.1320 0.5525 1.13 2
1.80 1.0 13.5 0.133 15 60 - - 0.7200 0.82 2
2.2 1.2 13.5 0.163 15 60 - - 0.9270 0.86 2
3.0 1.4 13.5 0.222 12 60 - - 1.0800 0.92 2
3.8 1.6 13.5 0.281 12 60 - - 1.3500 0.91 2

178
3C: Effect of overvoltage and current density on current efficiency for 3cm distance
I V A j t T M1 M2 m F Dist
A V cm2 A/cm2 min oC g g g x100 cm
0.15 0.10 16 0.01 15 60 23.5590 23.5932 0.0342 0.77 3
0.30 0.20 16 0.02 15 60 23.5932 23.6513 0.0581 0.65 3
0.50 0.30 16 0.03 15 60 23.6513 23.7895 0.1382 0.93 3
0.75 0.40 16 0.04 17 60 23.7895 24.0321 0.2426 0.96 3
1.00 0.50 16 0.06 15 60 24.0321 24.3186 0.2865 0.98 3
1.65 0.80 16 0.10 15 60 24.3186 24.8036 0.4850 0.99 3
2.52 1.00 16 0.16 15 60 23.9243 24.6292 0.7049 0.95 3
3.60 1.60 16 0.23 15 60 24.6292 25.8208 1.1916 1.13 3

179
3D: Effect of overvoltage and current density on current efficiency for 4cm distance
I V A j t T M1 M2 m F Dist
A V cm2 A/cm2 min oC g g g x100 cm
0.10 0.10 20.3 0.005 15 60 22.8441 22.8307 0.0000 0.00 4
0.15 0.20 20.3 0.010 15 60 22.8307 22.8676 0.0369 0.83 4
0.28 0.30 20.3 0.014 15 60 22.8676 22.9608 0.0932 0.75 4
0.60 0.40 20.3 0.025 15 60 22.9608 23.1263 0.1655 0.94 4
0.75 0.50 20.3 0.037 15 60 23.1263 23.3395 0.2132 0.95 4
1.00 0.60 20.3 0.049 15 60 23.3395 23.6092 0.2697 0.90 4
1.30 0.80 20.3 0.059 18 60 23.6092 24.0366 0.4274 0.93 4
1.55 1.00 20.3 0.076 37 60 24.0366 25.1176 1.0810 0.95 4
1.80 1.30 20.3 0.088 15 60 25.1176 25.6515 0.5339 1.00 4
3.40 1.80 20.3 0.167 15 60 25.6515 26.7246 1.0731 1.05 4

180
3E: Effect of voltage on the deposition rate at 24oC
1cm 2cm 3cm 4cm
Voltage Rate x10-5 Voltage Rate x10-5 Voltage Rate x10-5 Voltage Rate x10-5
(Volts) (g/s) (Volts) (g/s) (Volts) (g/s) (Volts) (g/s)
0 0 0 0 0 0 0 0
0.1 7.8 0.1 3.4 0.1 4.3 0.1 4.3
0.2 12 0.2 10 0.2 7.6 0.2 5.8
0.3 19.8 0.3 15 0.3 17.6 0.3 6.4
0.4 16 0.8 14 0.4 24 0.4 8.5
0.5 24 1.2 24.2 - - 0.7 21.6
0.6 27 1.7 46.6 - - 1.11 66
2 94 - - - - 1.4 66

181
Appendix 4: Effect of concentration on the current efficiency
The effect of electrolyte concentration on current efficiency
Item Cn η I Area j Ma Mc m t Efficiency
Units g/L V A cm2 A/cm2 g g g min X100%
1 1.50 0.50 0.05 30.25 0.00165 25.6217 25.6377 0.0160 15 1.08
2 3.00 0.30 0.09 30.25 0.00300 25.6377 25.6638 0.0261 15 0.98
3 6.00 0.50 0.21 30.25 0.00694 25.6638 25.7122 0.0484 15 0.78
4 8.90 0.40 0.15 25.00 0.00600 23.2670 23.3060 0.0390 15 0.66
5 14.8 0.40 0.38 27.50 0.01382 23.4736 23.5816 0.1080 15 0.96
6 29.6 0.35 0.50 27.50 0.01818 23.5816 23.7268 0.1452 15 0.98
7 59.2 0.35 0.50 32.50 0.01538 23.7268 23.8670 0.1402 15 0.95
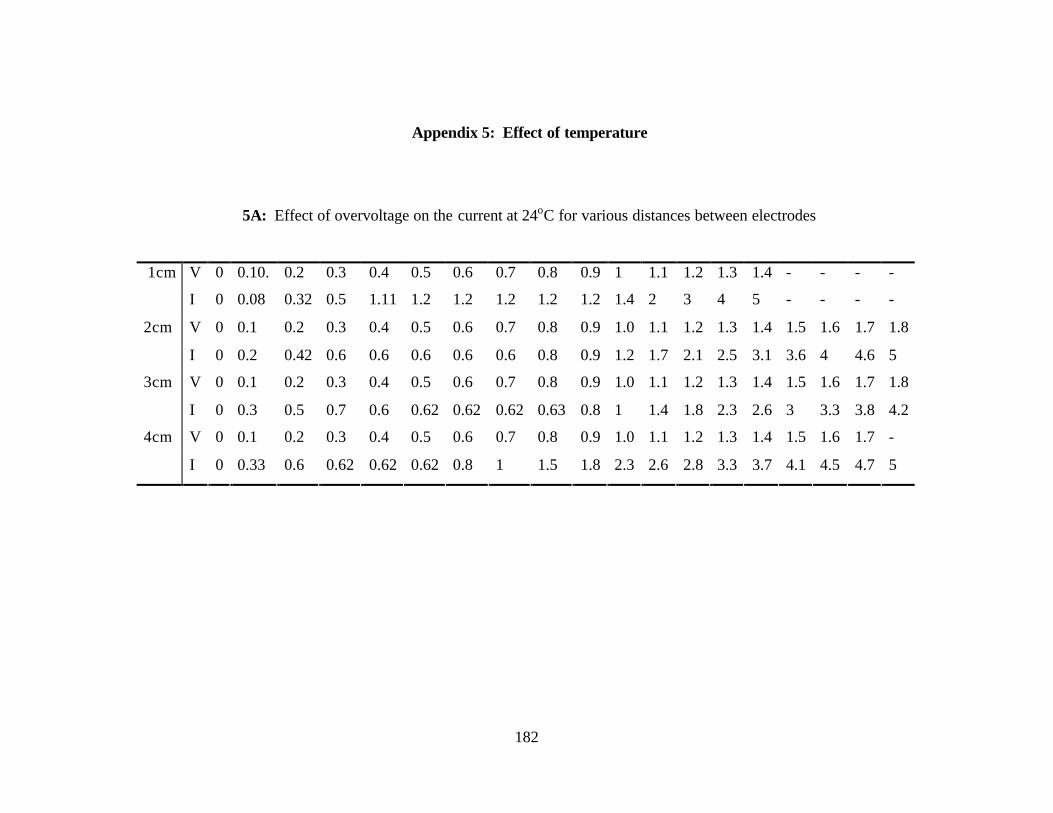
182
Appendix 5: Effect of temperature
5A: Effect of overvoltage on the current at 24oC for various distances between electrodes
V 0 0.10. 0.2 0.3 0.4 0.5 0.6 0.7 0.8 0.9 1 1.1 1.2 1.3 1.4 - - - - 1cm
I 0 0.08 0.32 0.5 1.11 1.2 1.2 1.2 1.2 1.2 1.4 2 3 4 5 - - - -
V 0 0.1 0.2 0.3 0.4 0.5 0.6 0.7 0.8 0.9 1.0 1.1 1.2 1.3 1.4 1.5 1.6 1.7 1.8 2cm
I 0 0.2 0.42 0.6 0.6 0.6 0.6 0.6 0.8 0.9 1.2 1.7 2.1 2.5 3.1 3.6 4 4.6 5
V 0 0.1 0.2 0.3 0.4 0.5 0.6 0.7 0.8 0.9 1.0 1.1 1.2 1.3 1.4 1.5 1.6 1.7 1.8 3cm
I 0 0.3 0.5 0.7 0.6 0.62 0.62 0.62 0.63 0.8 1 1.4 1.8 2.3 2.6 3 3.3 3.8 4.2
V 0 0.1 0.2 0.3 0.4 0.5 0.6 0.7 0.8 0.9 1.0 1.1 1.2 1.3 1.4 1.5 1.6 1.7 - 4cm
I 0 0.33 0.6 0.62 0.62 0.62 0.8 1 1.5 1.8 2.3 2.6 2.8 3.3 3.7 4.1 4.5 4.7 5

183
5B: Effect of overvoltage on current density at 39oC for various distances between electrodes
V 0 0.1 0.2 0.3 0.4 0.5 0.6 0.7 0.8 0.9 1.0 1.10 1.20 1.30 1.4 - - - - - 1cm
jx10 0 0.2 0.4 1.0 1.6 2.8 4.0 4.0 4.4 6.4 8.0 10.4 13.2 16.4 20 - - - - -
V 0 0.1 0.2 0.3 0.4 0.5 0.6 0.7 0.8 0.9 1.0 1.10 1.20 1.30 1.4 - - - - - 2cm
jx10 0 0.8 2.6 3.4 3.6 3.6 3.6 3.6 4.8 6.0 8.0 10.8 14.0 16.0 20 - - - - -
V 0 0.1 0.2 0.3 0.4 0.5 0.6 0.7 0.8 0.9 1.0 1.10 1.20 1.30 1.4 1.50 1.60 1.70 1.80 - 3cm
jx10 0 1.1 2.2 3.4 3.6 3.6 4.0 4.0 4.0 4.8 5.2 6.80 9.20 11.2 13 14.8 17.2 18.8 20.0 -
V 0 0.1 0.2 0.3 0.4 0.5 0.6 0.7 0.8 0.9 1.0 1.10 1.20 1.30 1.4 1.50 1.60 1.70 1.80 1.9 4cm
jx10 0 0.9 2.1 3.2 3.2 3.4 4.0 4.0 4.0 4.0 4.8 7.20 8.00 10.0 11 13.6 14.4 16.8 18.4 20

184
5C: Effect of overvoltage on the current density at 60oC for various distances between electrodes
V 0 0.1 0.2 0.3 0.4 0.5 0.6 0.7 0.8 1.0 1.1 1.2 1.3 1.4 - - 1cm
jx10 0 1.0 4.0 5.0 6.0 6.0 6.0 6.0 7.0 11.2 14 16 18 20 - -
V 0 0.1 0.2 0.3 0.4 0.5 0.6 0.7 0.8 0.9 1.0 1.1 1.2 1.3 1.4 - 2cm
jx10 0 2.0 3.2 4.0 5.6 6.0 6.4 6.4 6.4 8.0 11.2 13.6 16 18 20 -
V 0 0.1 0.2 0.3 0.4 0.5 0.6 0.7 0.8 0.9 1.0 1.1 1.2 1.3 1.4 1.5 3cm
jx10 0 1.0 2.7 3.7 4.4 5.2 5.2 5.6 6.0 5.2 8.0 11.2 13.2 14.8 17.6 20
V 0 0.1 0.2 0.3 0.4 0.5 0.6 0.7 0.8 0.9 1.0 1.1 1.2 1.3 1.4 1.5 4cm
jx10 0 1.2 2.0 3.6 4.4 5.2 6.8 6.8 6.8 7.6 8.4 10.4 12.4 14 16 20

185
Appendix 6: Effect of electrode active area
6A: Effect of active area on current density for 5% concentration of electrolyte
V 0 0.1 0.2 0.3 0.4 0.5 0.6 0.7 0.8 0.9 1 1.1 1.2 1.3 1.4 1.5 1.6 1.7 1.8 1.9 2.0 10.0cm2
j 0 20 38 48 54 58 60 60 86 98 130 160 180 240 280 320 350 410 440 470 500
V 0 0.1 0.2 0.3 0.4 0.5 0.6 0.7 0.8 0.9 1.0 1.1 1.2 1.3 1.4 1.5 1.6 1.7 - - - 12.5cm2
j 0 16 36 56 57 64 68 68 72 96 144 160 208 240 280 320 360 400 - - -
V 0 0.1 0.2 0.3 0.4 0.5 0.6 0.7 0.8 0.9 1.0 1.1 1.2 1.3 1.4 1.5 1.6 1.7 - - - 17.5cm2
j 0 14 33 46 57 57 69 69 69 74 97 120 154 177 200 240 263 286 - - -
V 0 0.1 0.2 0.3 0.4 0.5 0.6 0.7 0.8 0.9 1.0 1.1 1.2 1.3 1.4 1.5 - - - - - 22.5cm2
j 0 11 24 41 49 58 62 71 71 71 102 120 147 178 209 236 - - - - -
V 0 0.1 0.2 0.3 0.4 0.5 0.6 0.7 0.8 0.9 1.0 1.1 1.2 1.3 - - - - - - - 30cm2
j 0 15 29 49 50 57 60 67 67 77 93 143 157 183 - - - - - - -
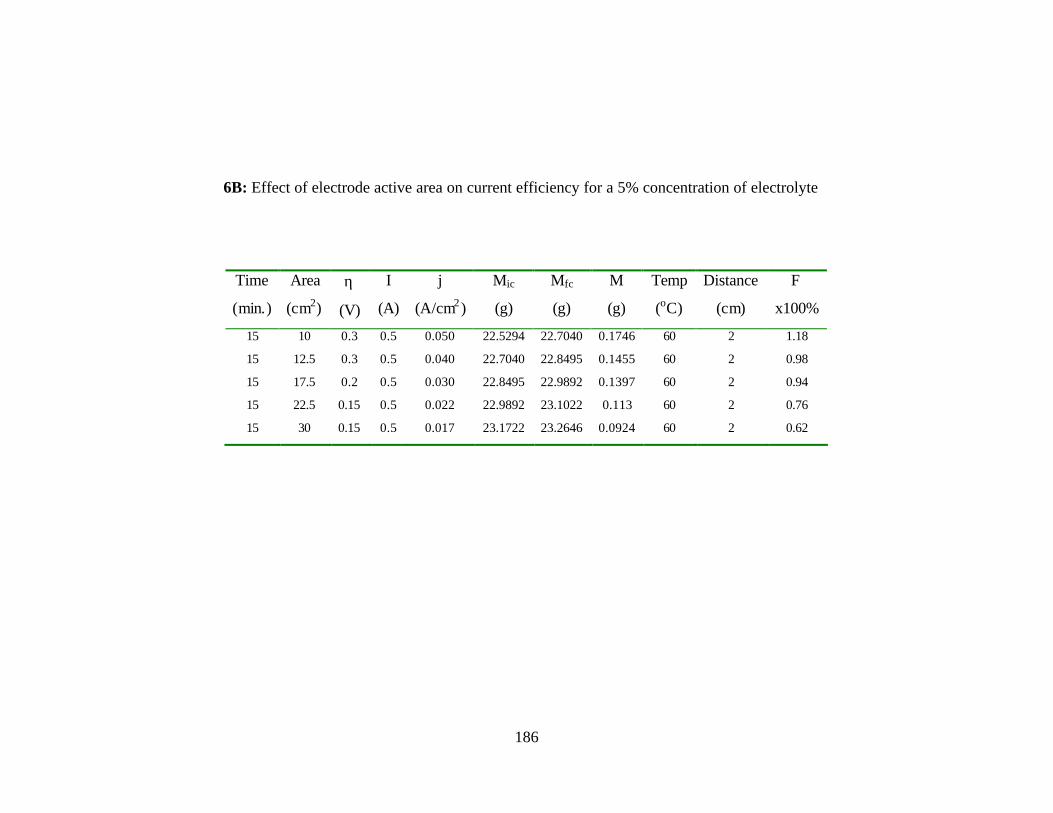
186
6B: Effect of electrode active area on current efficiency for a 5% concentration of electrolyte
Time
(min.)
Area
(cm2)
η
(V)
I
(A)
j
(A/cm2)
Mic
(g)
Mfc
(g)
M
(g)
Temp
(oC)
Distance
(cm)
F
x100%
15 10 0.3 0.5 0.050 22.5294 22.7040 0.1746 60 2 1.18
15 12.5 0.3 0.5 0.040 22.7040 22.8495 0.1455 60 2 0.98
15 17.5 0.2 0.5 0.030 22.8495 22.9892 0.1397 60 2 0.94
15 22.5 0.15 0.5 0.022 22.9892 23.1022 0.113 60 2 0.76
15 30 0.15 0.5 0.017 23.1722 23.2646 0.0924 60 2 0.62

187
Appendix 7: Effect of impurities
7A: Voltametric readings for electrolyte with dissolved impurities (Fe + Co + Ni)
(a) Distance between electrodes=2cm, concentration of reactant=50g/L, temperature=60oC
V 0 0.1 0.2 0.3 0.4 0.5 0.6 0.7 0.8 0.9 1.0 1.1 1.2 1.3 1.4 1.5 1.7 1.9 1ppm
I 0 0.25 0.52 0.78 0.75 0.91 0.91 0.91 0.91 1.0 1.2 1.7 2.1 2.5 3.0 3.4 4.2 5.0
V 0 0.1 0.2 0.3 0.4 0.5 0.6 0.7 0.8 0.9 1.0 1.1 1.2 1.3 1.5 1.7 - - 6ppm
I 0 0.31 0.7 0.85 1.0 1.1 1.1 1.1 1.1 1.3 1.5 2.0 2.5 3.0 4.0 5.0 - -
V 0 0.1 0.2 0.3 0.4 0.5 0.6 0.7 0.8 0.9 1.0 1.1 1.2 1.4 1.6 1.8 - - 12ppm
I 0 0.34 0.6 0.88 1.0 1.0 1.2 1.2 1.2 1.3 1.5 2.0 2.4 3.3 4.3 5.0 - -
V 0 0.1 0.2 0.3 0.4 0.5 0.6 0.7 0.8 0.9 1.0 1.1 1.2 1.3 1.4 1.5 1.7 - 20ppm
I 0 0.38 0.72 0.92 1.1 1.1 1.2 1.2 1.2 1.3 1.5 2.0 2.5 3.0 3.5 4.0 5.0 -

188
7B: Effect of combined impurities (Fe +Co + Ni) on current efficiency at 25mA/cm2)
(a) Distance between electrodes is 2cm, concentration is 50g/L and temperature is 60oC
I V t M1 M2 m F tcum mcum Fcum Imp
A V min g g g x100 min g % ppm
0.5 0.2 15 24.4925 24.6375 0.1450 0.98 15 0.1450 98.0 1
0.5 0.2 15 24.6375 24.7810 0.1435 0.97 30 0.2885 97.4 6
0.5 0.2 15 24.7810 24.9263 0.1453 0.98 45 0.4338 97.7 12
0.5 0.2 15 24.9263 25.0728 0.1465 0.99 60 0.5803 98.0 20
0.5 0.2 15 25.0728 25.2290 0.1562 1.05 75 0.7365 99.5 40
0.5 0.2 15 25.2290 25.3790 0.1502 1.05 90 0.8867 99.8 60
0.5 0.2 15 25.3790 25.5303 0.1513 1.02 105 1.0380 100.0 >100
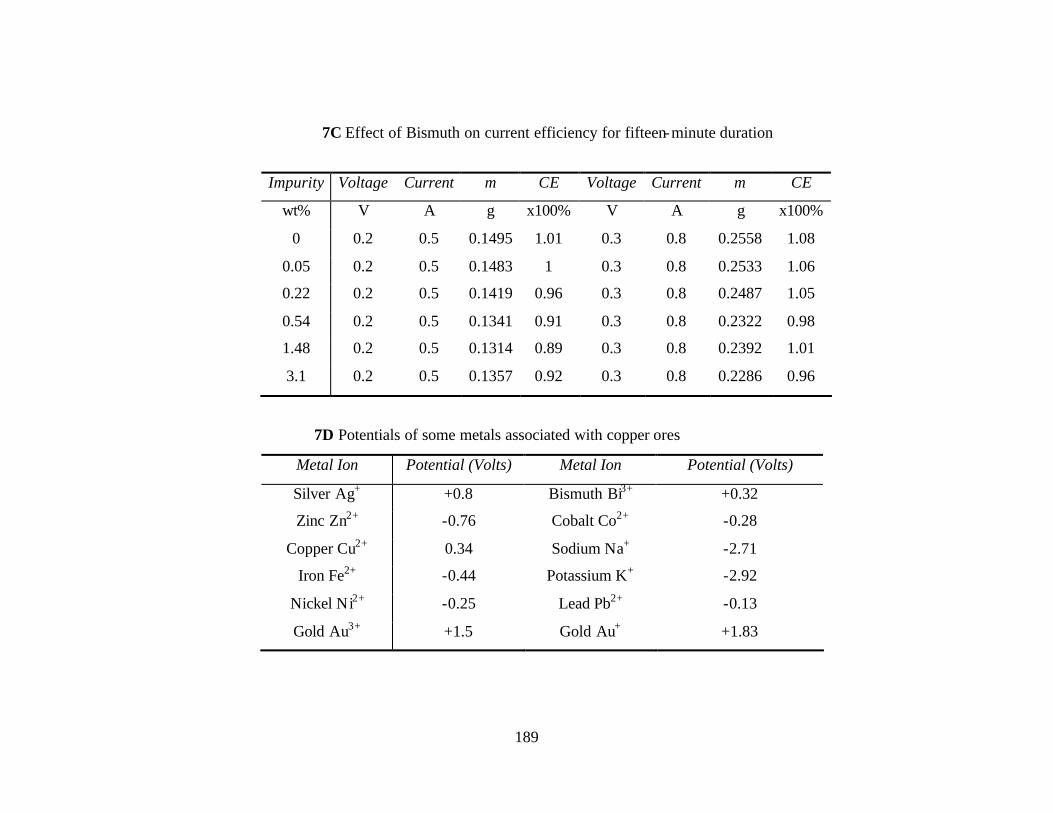
189
7C Effect of Bismuth on current efficiency for fifteen-minute duration
7D Potentials of some metals associated with copper ores
Metal Ion Potential (Volts) Metal Ion Potential (Volts)
Silver Ag+ +0.8 Bismuth Bi3+ +0.32
Zinc Zn2+ -0.76 Cobalt Co2+ -0.28
Copper Cu2+ 0.34 Sodium Na+ -2.71
Iron Fe2+ -0.44 Potassium K+ -2.92
Nickel Ni2+ -0.25 Lead Pb2+ -0.13
Gold Au3+ +1.5 Gold Au+ +1.83
Impurity Voltage Current m CE Voltage Current m CE
wt% V A g x100% V A g x100%
0 0.2 0.5 0.1495 1.01 0.3 0.8 0.2558 1.08
0.05 0.2 0.5 0.1483 1 0.3 0.8 0.2533 1.06
0.22 0.2 0.5 0.1419 0.96 0.3 0.8 0.2487 1.05
0.54 0.2 0.5 0.1341 0.91 0.3 0.8 0.2322 0.98
1.48 0.2 0.5 0.1314 0.89 0.3 0.8 0.2392 1.01
3.1 0.2 0.5 0.1357 0.92 0.3 0.8 0.2286 0.96
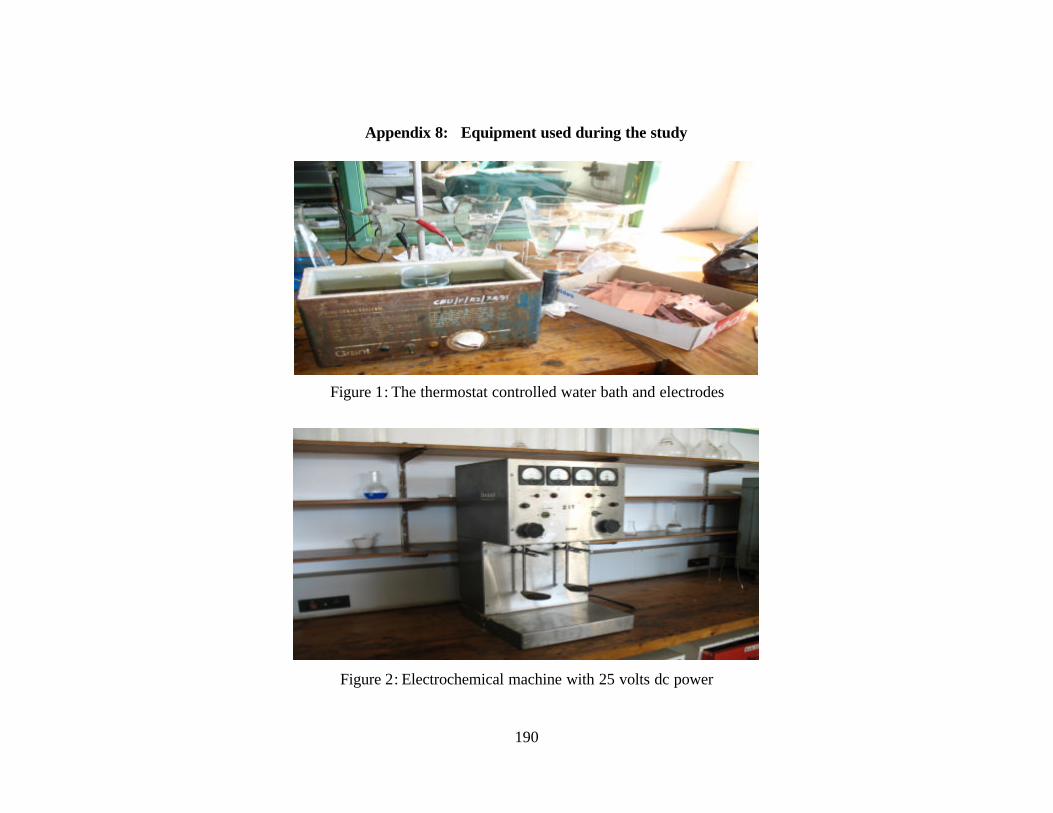
190
Appendix 8: Equipment used during the study
Figure 1: The thermostat controlled water bath and electrodes
Figure 2: Electrochemical machine with 25 volts dc power

191
Figure 3: Weighing Scale
Figure 4: Cleaning solvents; dilute nitric acid and propan-2-ol
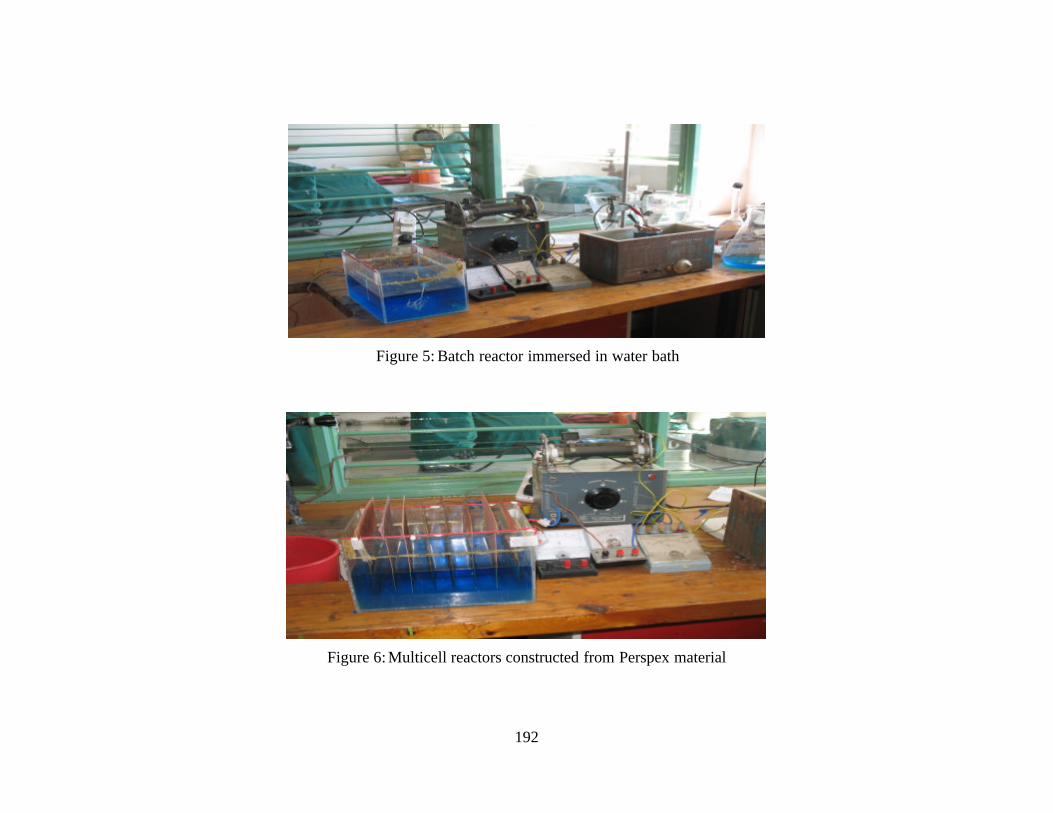
192
Figure 5: Batch reactor immersed in water bath
Figure 6: Multicell reactors constructed from Perspex material