m.trimet.org · page overview board of directors...
TRANSCRIPT

Budget and Grants Administration DepartmentTri-County Metropolitan Transportation District of Oregon
PROPOSEDBUDGET2020 • 2021

Page Overview Board of Directors ................................................................. Overview-1 TriMet Officials .................................................................... Overview-1 Budget Message .................................................................... Overview-2 2020-2021 TriMet Budget Organization Chart ................... Overview-20 Financial Summary Resource Summary ............................................... Financial Summary-1 Requirement Summary .......................................... Financial Summary-2 CIP Resource Summary ........................................ Financial Summary-5 CIP Requirement Summary .................................. Financial Summary-6 Summary of Fund History ..................................... Financial Summary-7 Pass through Revenues and Requirements ............ Financial Summary-8 Resources Resources Graph .................................................................. Resources-1 Resource Summary .............................................................. Resources-2 Resource Summary by Source ............................................. Resources-3 Federal & State/Local Grant Summary ................................ Resources-4 Requirements Requirements Graph ....................................................... Requirements-1 Requirement Summary ................................................... Requirements-2 Requirements by Object Class ....................................... Requirements-5 Personnel Services Schedule .......................................... Requirements-6 Materials & Services Schedule ...................................... Requirements-7 Summary of Employees ................................................. Requirements-8 Summary of Fixed Route Service ................................ Requirements-11 Summary of Fixed Route and Accessible Transportation Vehicles ............................................ Requirements-12 Debt Service Summary of Debt Service ................................................ Debt Service-1 Summary of Debt Service Principal and Interest ............. Debt Service-2 TriMet Continuing Revenues and Calculation of Payroll Tax Debt Service Ratio ............................ Debt Service-3
Other Post Employment Benefits ...................................................... OPEB-1
Page
General Manager Division Division Summary ..........................................................................GM-1 Office of the General Manager .......................................................GM-2 Diversity and Transit Equity ...........................................................GM-6 Internal Audit ..................................................................................GM-9 Chief Operating Officer Division Division Summary .......................................................................... CO-1 Office of the Chief Operating Officer ............................................. CO-2 Operations Planning & Development ............................................. CO-6 Business Planning & Asset Management ..................................... CO-10 Operations Training & Planning ................................................... CO-14 Transportation Division Division Summary ........................................................................... TR-1 Transportation Administration ......................................................... TR-2 Bus Transportation ........................................................................... TR-6 Field Operations............................................................................. TR-10 Service Delivery ............................................................................ TR-13 Accessible Transportation Programs ............................................. TR-17 Rail Transportation ........................................................................ TR-22 Commuter Rail............................................................................... TR-26 Streetcar ......................................................................................... TR-31 Safety & Security Division Division Summary ............................................................................SS-1 Safety & Security Administration .....................................................SS-2 Safety & Environmental Services .....................................................SS-6 Security & Emergency Management ..............................................SS-10 Bus Transportation Training ...........................................................SS-14 Rail Transportation Training ..........................................................SS-17 Maintenance Division Division Summary .......................................................................... MT-1 Maintenance Administration ........................................................... MT-2 Bus Maintenance ............................................................................ MT-6 Facilities Management Bus-Rail ................................................... MT-11 Rail Maintenance of Way ............................................................. MT-17 Rail Equipment Maintenance ........................................................ MT-22
TABLE OF CONTENTS

Page Information Technology Division Division Summary ............................................................................ IT-1 IT Administration .............................................................................. IT-2 IT Operations & Infrastructure .......................................................... IT-6 Information Security ....................................................................... IT-10 Enterprise Systems .......................................................................... IT-14 Intelligent Transportation Systems .................................................. IT-18 Public Affairs Division Division Summary .......................................................................... PA-1 Public Affairs Administration ......................................................... PA-2 Planning & Policy ........................................................................... PA-6 GIS & Location Based Services .................................................... PA-10 Transit Equity, Inclusion & Community Affairs ........................... PA-13 Government Services and Public Affairs ...................................... PA-17 Communications & Marketing ...................................................... PA-21 Customer Information Services ..................................................... PA-25 Finance & Administrative Services Division Division Summary .......................................................................... FA-1 Finance & Administrative Services ................................................. FA-2 Financial Services .......................................................................... FA-6 Budget & Grants Administration .................................................. FA-10 Risk Management.......................................................................... FA-14 Procurement & Supply Chain Management .................................. FA-18 Fare Revenue & Administrative Services ..................................... FA-22 Labor Relations & Human Resources Division Division Summary .......................................................................... HR-1 Human Resources Administration .................................................. HR-2 Benefits & HRIS ............................................................................. HR-6 Talent Management ....................................................................... HR-10 Labor Relations ............................................................................. HR-14 Compensation ................................................................................ HR-18 Legal Services Division Division Summary ........................................................................... LS-1 Legal Services Administration ......................................................... LS-2 Litigation .......................................................................................... LS-6 Real Estate & Transit Oriented Development ................................ LS-10
Page Engineering & Construction Division Division Summary ........................................................................... EC-1 Engineering & Construction Administration ................................... EC-2 Design & Construction .................................................................... EC-6 Major Projects ................................................................................ EC-10 Project Development & Permitting ................................................ EC-14 Capital Improvement Program (CIP) CIP Resource Summary .................................................................. CIP-1 CIP Requirement Summary ............................................................ CIP-2 CIP Detail ....................................................................................... CIP-3 CIP Division Summary ................................................................... CIP-7 General Information Exhibit 1 Ridership and Service (Fixed Route) ....................... General-1 Exhibit 2 Fares and Passenger Revenue (Fixed Route) ........... General-2 Exhibit 3 Employer Taxes (Unadjusted CPI-W) ..................... General-3 Exhibit 4 Expenses (Fixed Route) ........................................... General-4 Exhibit 5 Fixed Route Financial Indicators ............................. General-5 Exhibit 6 LIFT Revenue, Ridership and Service ..................... General-6 Exhibit 7 Local Economic Trends ........................................... General-7 Exhibit 8 Debt and Capital Investment .................................... General-8 Local Economic Trends ........................................................... General-9 Ridership ................................................................................ General-10 Service ................................................................................... General-11 Expense .................................................................................. General-12 Revenue ................................................................................. General-13 Personnel Profile .............................................................. Personnel Profile-1 Appendix Glossary ................................................................................ Appendix-1 Acronyms .............................................................................. Appendix-7

Overview-1
BOARD OF DIRECTORS Bruce Warner, President (District #1) Ozzie Gonzalez (District #2) Dr. Linda Simmons, Secretary/Treasurer (District #3) Lori Irish Bauman (District #4) Keith Edwards (District #5) Travis Stovall, Vice President (District #6) Kathy Wai (District #7) Mailing Address: TriMet Board of Directors Office of the General Manager
1800 SW 1st Avenue, Suite 300 Portland, Oregon 97201 Staff to the Board: Kimberley Angove
Telephone 503-962-4831 Facsimile 503-962-6451 Email [email protected]
TRIMET OFFICIALS
Doug Kelsey, General Manager Dee Brookshire, Budget Officer Mailing Address:
TriMet 1800 SW 1st Avenue, Suite 300 Portland, Oregon 97201

Overview-2
March 2020 To: TriMet Board of Directors From: Doug Kelsey, TriMet General Manager Re: 2021 Proposed Budget In 2020 TriMet continues to transform transit in the tri-county area. FY2021 lends itself to begin an intensive capital project period during which TriMet may begin project design on the new Metropolitan Area Express (MAX) line running from downtown Portland to Tualatin, start expansion to the Fair Complex in Hillsboro on the Red Line, complete construction on the Division Transit project, and build a new bus garage. FY2021 Budget Summary The TriMet Proposed Budget for FY2021 outlines a resource and expenditure plan for July 1, 2020 through June 30, 2021. The FY2021 Proposed Budget totals $1.5 billion and includes:
• Total day-to-day Operating Requirements of $730.4 million, which includes $607.3 million for all activities required to operate the system (including other post-employment benefits) and $123.1 million for Debt Service.
• Capital Improvement Program (CIP) Requirements of $329.7 million.
• Pass Though Requirements, Funding Exchange Payments and Special Payments totaling $18.8 million, under which TriMet receives funds required to be provided to other governmental agencies.
• Contingency is an appropriated amount of a minimum of 3% of operating requirements and is adjusted for known
risks. Contingency is intended for those activities unknown at the time of budget adoption. FY2021 contingency totals $33.7 million.
• Ending Fund Balance totals $456.0 million and is unappropriated and not available for spending in FY2021. Fund balance includes $271.8 million in restricted bond proceeds and other restrictions to be spent after FY2021; $47.5 million restricted for future debt service payments; and $136.8 million in unrestricted fund balance, which contains between 2.0 and 2.5 months operating reserves as required by the TriMet Board of Directors.
2021 Look Ahead TriMet is entering its most intensive decade yet with size, complexity of operations and overall expansion and growth. Expansion Projects: The Division Transit Project is a new type of high-capacity bus transit project that spans the length of Division Street between Downtown Portland and Gresham, is underway and set to begin revenue service in 2022. A Better Red [MAX Red Line Extension & Improvements] is in the early stages of development with a planned opening in 2023-24 with an anticipated Federal Capital Investment Grant project cost of $206 million. Southwest Corridor Light Rail Project that would bring high capacity transit and vital pedestrian/bicyclist safety and roadway improvements to the congested and rapidly growing corridor is in the design phase with funding yet to be secured. Carbon Reduction: The agency has committed to fully implementing a non-diesel bus fleet by 2040, or before, and will purchase its last diesel bus in 2024. Additionally, the agency is

Overview-3
converting the electrical energy source for MAX powered energy use to 100% wind-power and switching to renewable fuel on its diesel buses in 2020. TriMet is also conducting its first carbon baseline review of the organization as well as a waste audit, from which it will develop a long-term carbon reduction strategy. Low-Income Fare Program: In FY2019, TriMet launched its Low-Income Fare (LIF) Program with funding through Keep Oregon Moving (HB 2017). More than 29,000 Oregonians, living on a low income of up to 200% of the federal poverty level, signed up for TriMet’s Honored Citizen reduced fare through February 2020. Those enrolled through the Low Income Fare Program have taken over 350,000 rides per month on average (over the first half of FY2020). With new enrollees every month, the average rides will continue to grow. Service expansion and State of Good Repair: TriMet plans to add an additional 3% in bus service in FY2021 with no changes to MAX, Commuter rail or service provided to Portland Streetcar and continued strong support for Ride Connection. LIFT paratransit service is continuous, only growing with demand and travel within the service district. TriMet will also be implementing extensive replacements and upgrades to its existing infrastructure. One specific project will include a four-week shut down of the MAX for the Steel Bridge MAX Improvements in August 2020. 2020 Accomplishments TriMet has made substantial progress on the FY2020 Business Plan including some of the following highlights:
• Completed Objective: “Achieve market acceptance of Hop Fastpass® as a fare instrument”. Hop now accounts for over 80 percent of fares collected on TriMet, and the adoption is ahead of schedule.
• Added more bus service, including two new Frequent Service Lines.
• On-time performance for bus and light rail continue to meet or exceed targets, even with increasing targets compared to the previous year.
• Began construction on Division Transit Project after receiving $87.4 million in grant funds from the Federal Transit Administration.
• First test fleet of five battery-electric buses in operation, with more on order.
• Completed light rail and signal improvements at Rose Quarter and the Lloyd neighborhood.
• Provided comprehensive outreach and engagement encouraging enrollment in Low-Income Fare Program facilitated through Hop.
• Phased out non-Hop paper fares (excluding LIFT Paratransit and fixed-route bus ticket printer fares) with robust public engagement.
• Implemented LIFT C.A.R.E.S (Customer Automated Ride Experience System), an automated call-back function for LIFT riders.
• First- and last-mile services defined with partners and targeted for funding through Keep Oregon Moving, with start of service planned for FY2021.
• Enterprise-level risk management registry developed. Additional progress on the FY2020 Business Plan is expected through the end of the fiscal year with FY2021 currently under development.

Overview-4
Strategic Goals & Strategies Annually, TriMet updates and adopts the upcoming fiscal year Business Plan with a rolling five-year horizon. The update incorporates input from employees and the public, an in-depth review by the Executive Management team, and is approved by the General Manager. The Business Plan identifies longer-term strategic priorities and annual points of emphasis which inform both the operating and capital budgets each year. TriMet will continue to engage diverse communities as we implement and update the Plan, because they are the ultimate reason we strive for success. TriMet will always continue to build a culture of safety and incorporate equity in decision-making and activities. The Business Plan includes a series of Key Strategic Actions over the next five years that will move TriMet toward success in meeting its goals and objectives. Some of the most budgetary significant initiatives and actions from the Business Plan that inform TriMet’s FY2021 budget and future year priorities include non-diesel options of the bus fleet, continued enhancement of bus service, reduction of carbon emissions, expansion of light rail, continuation of robust health benefits, successful negotiation of a union Working and Wage Agreement and increasing visible security presence on the system. Vision & Focus: In alignment with TriMet’s Vision, Mission and Values, the Business Plan identifies twelve strategic Goals. The Goals are achieved through 36 measurable Objectives. The current status, results, targets and key strategic actions accompany each Objective. The following graphic illustrates the Goals from the Business Plan.
The FY2021 departmental budgets describe the main Goals and underlying Objectives for which the department is responsible for delivering.

Overview-5
Fund Description/Structure & Basis of Budgeting TriMet is a governmental proprietary enterprise fund organized under the provisions of Oregon Revised Statutes (ORS) 267 to provide mass transit services to the Portland Metropolitan area with the assumption of the operations of a privately owned bus system. As such, TriMet is authorized to levy taxes and charge fares to pay for its operations. TriMet is also authorized to issue general obligation and revenue bonds. TriMet uses one major budgetary fund to account for its operating activities. As required by ORS 294.456, TriMet appropriates funds at the organization unit and major program level which includes the following:
• Each division individually (personnel services, materials and services, operating and capital projects)
• OPEB and Pension UAAL • Debt Service • Pass Through/Funding Exchanges/Special Payments • Contingency
Fund Equity: The unappropriated fund balance reflects the difference between assets and liabilities and includes the following three categories:
• Restricted Bond Proceeds & Other Restricted funds including funds held for major capital project spending in a subsequent year.
• Restricted Debt Service includes funds held to pay debt obligations in a subsequent year.
• Unrestricted Fund Balance includes cash, investments, receivables, prepaid expenses, and materials & supplies.
Causes & consequences of changes in fund equity may occur due to differences from budget to actual results in either revenues or expenditures. TriMet forecasts passenger and tax revenues based on historical trends, service changes, and growth in the region, which may be different than actual results. In addition, TriMet’s expenditures may be less than budgeted due to vacancies in approved positions, unscheduled overtime (often caused by inclement weather), and delays in major capital project development. Basis of Budgeting: TriMet budgets on the cash basis whereas TriMet’s financials are issued on the full accrual basis of accounting or GAAP. Differences in revenues and expenses from budgetary basis to full accrual (GAAP) include:
• Additions due to budget activity not qualifying as revenues/expenses under GAAP such as principal payments on long-term debt and capital asset addition.
• Additions due to adjustments required by GAAP such as unfunded pension costs, depreciation, leveraged lease revenue, claims liability changes, unfunded OPEB costs.
• Subtractions due to resources not qualifying as revenues under GAAP such as net book value of assets retired and debt issuance.
Differences in fund balance from budgetary basis to full accrual (GAAP) include:
• Additions due to capital assets • Subtractions due to debt, OPEB and deferred amounts • Net pension liability and deferred amounts • Claims liability • Lease leaseback and deferred amounts

Overview-6
Financial Policies TriMet faces financial challenges that could impede its ability to meet present and future expectations for transit service. TriMet’s Strategic Financial Plan outlines the financial and operational policies that guide TriMet forward in navigating near-term challenges and achieving a sustainable future. TriMet considers the budget balanced under three scenarios 1) when total expenditures are equal to total revenues, 2) total expenditures are less than total revenues resulting in increases to fund balance, and 3) expenditures exceed revenues and spending from previous year’s unappropriated fund balances occur. For FY2021, TriMet’s budget is balanced under scenario three. This budget document demonstrates the following financial strategic policies to guide financial decision making including:
• Fiscal Policy. One-time-only revenues support one-time-only expenditures including capital additions, startup costs, one-time maintenance efforts and other costs that are non-recurring. Continuing revenues pay for continuing expenditures and one-time expenditures.
• Unrestricted Fund Balance. Begin each fiscal year with an unrestricted fund balance equal to 2.0 to 2.5 times average monthly operating expenditures.
• Debt Management. Debt service on senior lien payroll tax revenue bonds must be no more than 7.5% of continuing revenues.
• Fare Policy. Sustainable system that encourages and supports ridership and ensures broad access to transit services.
• Capital Asset Management. Maintaining assets in a state of good repair throughout their useful life to help ensure a safe, reliable and convenient service for customers.
• Pension Funding Plan. Plans provide a process to fully fund the pension benefit plans and OPEB benefits.
Budget Process Local Budget Law Local government budgeting in Oregon is governed by Local Budget Law, Chapter 294 of the Oregon Revised Statutes. The law has two major objectives:
• Provide standard procedures for preparing, presenting, and administering local budgets
• Ensure citizen involvement in the preparation of the budget
Development of the TriMet budget is an effort shared by riders as well as the broader community, with consideration of safety, equity, and long-term concerns and issues. The Tax Supervising and Conservation Commission (TSCC), a five-member citizen board appointed by the Governor, reviews the budgets of all governmental jurisdictions in Multnomah County. The TSCC, together with the State Department of revenue, is responsible for ensuring the TriMet budget complies with Local Budget Law. Budget Officer and Budget Committee To give the public ample opportunity to participate in the budget process, Local Budget Law requires that a Budget Officer be appointed and a Budget Committee formed. The Budget Officer prepares the Proposed Budget under direction of the General Manager. The Board of Directors also serves as the Budget Committee, then reviews and if needed, revises the Proposed Budget before it is formally adopted. For TriMet, the Budget

Overview-7
Officer is the TriMet Chief Financial Officer, Executive Director of Finance & Administrative Services and the Budget & Grants Administration Department, which is responsible for the actual preparation and publishing of the budget document. Notices are published, budget are made available for public review, and opportunities for public comment are provided. These actions encourage public participation in the budget decision-making process and give public exposure to budget programs and fiscal policies before adoption. Preparing the Proposed Budget Divisions prepare budget modification requests in accordance with direction given by the Board of Directors and General Manager. These are submitted to the General Manager, who then analyzes and approves the requests. The Proposed budget is the culmination of an extensive process of budget development, analysis, and revision. Public Involvement Process TriMet engages in a proactive public outreach effort throughout the year by holding public meetings to gather feedback on service changes, equity, and services for seniors and people on a low income. The budget development process includes management, labor, riders, and internal and external experts. In advance of the Proposed Budget, TriMet held two general community meetings (one in the fall and one in spring), four culturally specific outreach meetings, and three liaison meetings in non-English speaking communities. Direct Public Testimony Community members may directly contact TriMet with input for the budget during public outreach meetings described above or
through trimet.org. In addition, community members also have opportunity to personally testify on the TriMet budget at the budget hearing of the Board of Directors. Budget Posted Information TriMet maintains a community budget web page: www.trimet.org/about/accountability.htm#finncial. The site contains TriMet’s Proposed, Approved and Adopted budgets, along with TriMet’s audited financial statements, Strategic Financial Plan, Pension/OPEB Valuations, and Board approved policies. Approving the Budget In accordance with Local Budget Law, the Board of Directors will convene as the Budget Committee to consider the Proposed Budget. Announcements advertising the Budget Committee meetings are printed in a local newspaper and posted on TriMet’s external website. The public is encouraged to attend and provide testimony on the Proposed Budget. The timing and frequency of the public notices are governed by Local Budget Law. The Budget Committee meets to accomplish the following actions:
• Receive the budget message and budget document • Hear and consider public testimony • Review and approve a balanced budget
The Budget Officer provides a copy of the Proposed Budget to each member of the Budget Committee prior to the first Budget Committee meeting. The budget becomes a public record at this point.

Overview-8
At the first Budget Committee meeting, as required by Oregon Budget Law, the General Manager and Budget Officer deliver the budget message, explaining the Proposed Budget and significant changes in TriMet’s financial position. After the initial meeting, TriMet publishes the Approved Budget. If the Budget Committee were to meet after the initial meeting, notice of other meetings are provided as required by Oregon public meeting law. All meetings are open to the public. There are no changes between the Proposed and Approved budgets. The Approved Budget is sent to the TSCC for review and analysis. Tax Supervising & Conservation Commission Hearing TSCC is responsible for reviewing, holding hearings and producing a report on the budget of every jurisdiction in Multnomah County. The TSCC holds a required public hearing, with the TriMet Board of Directors and management in attendance, on the Approved Budget. The outcome of this hearing is a letter certifying that the budget is in compliance with Local Budget Law. The letter may contain recommendations and/or objections. TriMet is responsible for addressing any objections or recommendations. Adopting the Budget The Board of Directors votes to officially adopt the budget before the start of the new fiscal year, which begins on July 1st. Changes that are allowed between the time the budget is approved and final adoption are defined by Local Budget Law and are limited. Changes normally include adjustments to revenue projections and capital carryover.
Amending the Budget Changes after budget adoption are completed through formal resolution to the Board of Directors. Such changes occur when moving funds from one organizational units appropriation to another or when moving funds from contingency to an organizational unit. Budget Calendar Following is a summary of the FY2021 budget calendar:
• December 6, 2019 – Baseline Budget and Budget Manual completed
• December 9, 2019 – General Manager gives internal budget message presentation
• January 3, 2020 – Operating budget requests due • January 8, 2020 – Capital budget requests due • January 31, 2020 – Proposed Budget changes due • March 11, 2020 – Proposed Budget released • March 25, 2020 – Approved Budget released • April 10, 2020 – Final Adopted Budget changes due • April 22, 2020 – TSCC public hearing on budget and
final capital changes are due • May 27, 2020 – Board of Directors action to adopt the
budget • July 1, 2020 – Adopted Budget is effective • July 15, 2020 – Adopted Budget released for distribution
Priorities & Issues: The following discusses the agency-wide policy, economic, regulatory or legislative challenges for the upcoming year along with management’s planned action to address the issues.

Overview-9
Electrification During FY2019, TriMet adopted a Non-Diesel Bus Plan that called for a transition away from diesel fuel for buses and a move toward battery-electric buses. In FY2020, TriMet began testing its first fleet of five battery electric buses and will be taking delivery of four zero-emission repowered transit buses. In FY2021 and beyond, TriMet will be ordering more battery-electric buses, testing different manufacturer’s products for efficiency and performance. The FY2021 Budget includes funding for the purchase of an additional 10 battery electric buses (5 new Gillig and 5 diesel to electric repowers) and related infrastructure. TriMet will also continue to pursue grant funding opportunities to offset the higher up-front costs of these buses. Bus Service Enhancements TriMet will continue to increase bus service, with greater frequencies on several lines, including improving headways on two Frequent Service lines to every 12 minutes through the weekday on Lines 6-ML King Jr Blvd and 12-Barbur/Sandy Blvd. Construction on the Division Transit Project will continue throughout FY2021, partially funded by a Small Starts grant from the Federal Transit Administration. Carbon Emissions FY2021 continues TriMet’s substantial efforts to reduce carbon emissions, informed by a baseline carbon audit to be completed before the end of FY2020. Commitments made by TriMet include purchasing renewable wind power for light rail electrification, ending diesel bus purchases after 2025, and converting existing buses to renewable diesel. The FY2021 Budget reflects ongoing efforts to continue these commitments.
Light Rail Expansion Engineering will continue on the Better Red Project, which will improve track sections on the MAX Red Line and extend its service to 10 existing stations in Beaverton and Hillsboro. Work will also continue on design and engineering for the Southwest Corridor Light Rail Project. Health Benefits Controlling healthcare costs remain a long-term challenge for the agency. TriMet implemented a self-insured medical plan for both union and non-union employees effective January 1, 2017. Annual premium levels for medical coverage at TriMet remain high compared to the market as a whole, TriMet generally pays 94% and 95% of healthcare premiums for non-union and union employees respectively. Higher rates of inflation are also applied to health benefits costs and wages depending on the economy and affordability.
Visible Presence on the System TriMet continues to emphasize visible presence of employees on the system. More visibility and greater presence means enhanced customer service, greater passenger comfort, and increased fare compliance. Aging Infrastructure TriMet’s light rail system is approaching 34 years old with many assets due for replacement. Coupled with assets such as aging platforms, rail infrastructure and rolling stock, and maintenance facilities the agency is developing funding strategies to ensure the assets are maintained in a state of good repair.

Overview-10
Trends TriMet monitors historical information as well as economic and political climates when forecasting revenues and expenses. In the General Information tab are referenced statistics the agency utilizes when making financial decisions including the following information:
• Ridership and Service • Fares and Passenger Revenue • Employer Taxes • Expenses • Fixed Route Financial Indicators • Local Economic Trends • Debt and Capital Investment
Long Range Planning TriMet utilizes a 10-year financial forecasting model to help guide the financial health of the agency. The longer term modeling takes into account upcoming pressures on both the capital and operating impacts of the future. Such things as payroll tax growth, inflation, infrastructure needs, staffing levels, and vehicle replacements are evaluated in the financial forecast, helping inform the upcoming year budget. Budget Overview The FY2021 Proposed Budget short-term factors that have guided the development of this annual budget focus on continued implementation of the requirements of Keep Oregon Moving (HB 2017) including; expanding service and operation of a Transit Assistance Program, improving and increasing service; the cost of operating and maintaining the existing transit
system; the costs of fixed route bus and rail service to maintain headways and capacity as the region grows (including vehicle replacements); costs of ADA-complementary paratransit service; operating cost of other service changes; costs associated with further development of Hop Fastpass®; capital investments in infrastructure and expansion for the future; mid-life overhaul of light rail vehicles; debt service expense; and, continued commitment to strengthen pension reserves. Services - The demand for more bus and rail service continues. Customers, employers, and local governments in the region continue to desire more service than TriMet is able to fund. To help TriMet pay for service and expansion, the Oregon legislature in 2003 and 2009 authorized TriMet to increase the payroll tax rate one-tenth of one percent over ten years. This funding, along with that from Keep Oregon Moving, will put roughly $6.5 million in service improvements on the streets in FY2021, with weekly bus service hours projected to increase about 3%. The funding will also be used in the coming years for new digital information displays to be installed at transit centers and at roughly 100 bus stops. The displays will provide real-time arrival information, service alerts and custom media, bringing this information to heavily trafficked and high-need areas. Installation of the new displays will begin in early 2020. To further the customer experience, TriMet will install 100 new shelters and other amenities such as lighting and transit trackers in high-need areas using the funds, with bus stops in areas with higher ridership and disadvantaged areas receiving priority. Meanwhile the renovation and upgrading of TriMet’s oldest MAX stations on the eastside will continue as part of a multi-year program.

Overview-11
In addition to expanding service and customer amenities, TriMet is evolving the ways riders can pay for that service. In Fiscal Year 2018, Hop Fastpass launched, bringing the region’s riders a state-of-the-art fare collection system, serving TriMet, C-TRAN and Portland Streetcar customers. Since then, adoption of the electronic fare system has increased dramatically. Now more than 80% of TriMet’s passenger revenues flow through the Hop system. TriMet has continued to innovate Hop payments since its initial launch, partnering with Apple and Google to roll out the first virtual transit cards in North America for both platforms, which made it even easier for riders to pay fares while getting the benefit of fare-capping. This progressive electronic payment feature provides riders the ability to earn a day or month pass as they ride, without the upfront cost of a pass. With fare capping, Honored Citizen fare payers, which includes (among others) those who qualify with a low income that is up to 200% of the federal poverty level, receive a 50% reduction in 2½ Hour Tickets and Day passes, as well as unlimited rides within a calendar month for $28. Hop offers many options for those without access to bank or similar financial institution payment methods, as TriMet’s Hop retail network includes over 500 locations where cash can be converted to Hop value. The first payroll tax increase authorized by the TriMet Board of Directors began January 1, 2005 and ended January 1, 2014 and continues to pay for the service including numerous bus frequent service upgrades, the MAX Green Line, WES, MAX Orange Line, and the associated cost of those operations. The Board of Directors initiated the second payroll tax increase of 0.10% over ten years in September 2015 by increasing the
employer and self-employed payroll tax rates .01% starting January 1, 2016 and will continue the annual increase through January 1, 2025. The revenues from this tax rate increase will help pay for additional service such as the Division Transit Project, Better Red project and other new service-related projects identified in TriMet’s Service Enhancement Plans and the Capital Improvement Plan (CIP). FY2021 includes an increase of $6.5 million for bus services increases, equating to a 3% increase or approximately 1,300 weekly vehicle hours. See the summary of Fixed Route Service changes by mode in the Requirements tab, page 11. The passage of Keep Oregon Moving, which was passed by the Oregon Legislature in summer 2017 to address many different transportation issues across the state, established a statewide employee payroll tax that dedicates funds for public transportation. TriMet expects to realize about $40-$50 million annually via a grant in quarterly allocations. The first allocation of grant funds was received in May 2019. Compensation – A critical element of TriMet’s multi-year effort to achieve long-term fiscal stability has been to reduce the growth rate of active employee and retiree benefit costs, primarily by reforming healthcare with premium share, coinsurance, and deductibles paid by employees, and reducing retirement benefits for new hires by closing the Defined Benefit (DB) plan and migrating to a Defined Contribution (DC) plan. TriMet began this effort with non-union new employees in 2003, when the DB pension plan was closed and replaced with a DC pension plan. In 2009, retiree medical benefits were also closed to new non-union employees. Since 2012 non-union employees and retirees in the Preferred Provider Organization health plan have paid 20% co-insurance and 6% premium contributions.

Overview-12
Non-union employees and retirees in the Health Maintenance Organization plan have $10 co-pays and 6% premium contributions. In January 2014 non-union retirees age 65 and older in the PPO health plan were moved to a lower cost Medicare supplement plan. Union benefit costs have similarly been reformed over the last two contracts. Healthcare benefit changes have instituted premium share, co-insurance, and deductibles essentially parallel to the non-union plan. Simultaneously the DB pension plan for union employees was closed August 2012 and new hires now participate in a DC pension plan. To further trim costs, TriMet implemented a self-insured medical plan for both union and non-union employees effective January 1, 2017. The FY2021 Proposed Budget includes a non-union merit budget increase of 3.0% as well as a 1.5% pool targeted specifically to address identified pay equity issues. The Working and Wage Agreement with the union expired on November 30, 2019. Future union wage increases must be negotiated with the union. Therefore, no wage increases are included in the FY2021 Proposed Budget. Pension Funding - TriMet is continuing to strengthen its union DB pension plan reserves and has set a long-term horizon to pay unfunded liabilities. The FY2021 Proposed Budget is consistent with the pension policies approved by the Board of Directors on February 26, 2014 and amended November 23, 2019. Capital Maintenance and Replacement - Additional buses, light rail maintenance of way, light rail vehicle maintenance,
facilities modernization, technology changes and station upgrade projects are included in the Proposed Budget. Diesel Fuel - The cost of bus diesel fuel has decreased over the past five years. From a high in FY2015 at $3.15 per gallon to a low in FY2019 at $1.69 per gallon, although the average in FY2020 is around $2.05 per gallon. In FY2021 the budget reflects an increase to $2.80 per gallon. Diesel fuel costs for LIFT and WES have also decreased over the past five years. From a high in FY2015 of $3.30 per gallon to a low in FY2019 of $2.30 per gallon, although average in FY2020 is around $2.23 per gallon. In FY2021 the budget reflects a moderate increase to $2.45 per gallon. Transit Equity, Inclusion & Community Affairs - TriMet increased the fare reductions dedicated to diversity and transit equity programs in September 2016, from $1.3 million to $1.5 million. The increase resulted from the change in the Honored Citizen fare from $1.00 to $1.25, and initiated to provide relief to Honored Citizens riders on a low income. In FY2021, TriMet continues to provide free fare grants and fare supports to riders through TriMet’s Access Transit programs, which provides non-profits an opportunity to purchase fares for low income riders at a discount though the Fare Assistance Program and, provides free fare grants to community based organizations through the Fare Relief Program. Now, using Statewide Transportation Improvement Fund (STIF) dollars, TriMet also offers free fare grants to 15 school districts across the service area for low income high school students. In addition to TriMet’s Access Transit programs, the agency’s Hop Fastpass® fare program, provides fare equity for frequent riders through its innovative fare-capping policy.

Overview-13
Resources Approximately 92% of TriMet’s revenues come from three sources; payroll tax revenues, passenger revenues and federal funds. In addition, the budget also includes Capital Improvement Program (CIP) revenues that are dedicated for major capital projects separate from operations. The following describes the major revenues and other financing sources and the Resources tab provides financial details by source including the federal and state grant/local contributions. Operating Revenues The revenue TriMet earns from fares covers more than $124 million in current annual operating costs, or 17% of our operating expenses. Passenger Revenue - The FY2021 Proposed Budget assumes no base fare increase. FY2021 passenger revenues are estimated to increase 6.8% or $7.0 million over estimated FY2020, primarily due to increasing ridership due to service and the addition of safety and security personnel who will perform code enforcement. In addition, the implementation of the Low-Income Fare Program, increased Hop Fastpass market penetration, (STIF-dedicated) new service and continued on-time performance will have positive effects on ridership. Accessible Transportation Contract Revenues - State and federal sources dedicated to LIFT Paratransit Service revenues are estimated at $8.96 million in FY2020 and remain at $8.96 million in FY2021. 1Underlying payroll tax revenues exclude revenues from the increase in the payroll tax rate.
Service Contract Revenues - This category contains only Portland Streetcar personnel revenue from the City of Portland, which contracts for operating personnel. In FY2021, these revenues are projected to be $8.57 million. Advertising Revenues - This category contains transit advertising revenue from local vendors advertising on TriMet buses and light rail vehicles. In FY2021, these revenues are projected to be $3.86 million. Non-Operating Revenues Payroll Tax Revenues - TriMet is projecting strong payroll tax revenue growth through FY2021. In FY2019, underlying employer payroll tax revenues1 increased 2.9%. Underlying employer payroll tax revenues are forecast to increase 6.0% by the end of FY2020 and 6.6% in FY2021. By comparison, average annual growth of underlying employer payroll tax has been 5.8% over the last five years. Self-employment Tax Revenues – The underlying growth from self-employment tax revenues decreased 3.6% in FY2019 and is projected to decrease 0.2% by the end of FY2020, but increase 3.0% in FY2021. Self-employment tax revenues make up 5% of payroll tax revenue. Federal Formula Grants - Federal formula funds constitute 10.3% of TriMet’s continuing resources for operations. In addition to approximately $43.0 million of Section 5307 Urbanized Area Formula funds, $27.5 million Section 5337 State of Good Repair funds, $1.3 million Section 5310 Enhanced Mobility of Seniors & Individuals with Disabilities funds and

Overview-14
$3.6 million Section 5339(a) Buses & Bus Facilities Formula funds, TriMet receives $21.4 million dollars a year in federal highway program funds through the Surface Transportation Block Grant (STBG) Program and Congestion Mitigation & Air Quality (CMAQ) Program to pay for regional rail program debt service. Congress has appropriated the last year of a five-year program under the Fixing America’s Surface Transportation (FAST) Act. TriMet’s financial forecast and the FY2021 Proposed Budget include increased projections as a result of the FAST Act authorization. Statewide Transportation Improvement Fund Grant Revenue - With the passage of Keep Oregon Moving, TriMet received a partial year receipt of $24.6 million in grant funding in May 2019. TriMet expects to receive $12.45 in FY2020 and estimates $20.19 in FY2021. In addition, TriMet may receive discretionary STIF monies, which are awarded based on a proposal and may vary from year to year depending on the desired project. In FY2021, TriMet received $280,000 in discretionary STIF dollars and will be requesting $350,000 for FY2021. State & Local Operating Grants – TriMet receives funding from state and local partners to fund various LIFT operations. In FY2020, TriMet anticipates receiving $869,442 and is budgeted to receive $1,547,653 in FY2021. Other Revenues - $9.1 million in other revenue is expected in FY2021 through interest revenue, fuel credit revenue and miscellaneous revenue, which is 1.3% of TriMet revenues.
Capital Resources Capital resources include Small Starts, Full Funding Grant Agreements, and Bond Proceeds.
Requirements/Expenditures TriMet’s requirements total $1.5 billion for FY2021. The Requirements tab details expenditures by organization unit (divisions), by Object Class and includes the personnel services schedule, materials & services schedule, summary of employees, and summary of fixed route service. The following subsections discuss various important factors affecting expenditures. Service - TriMet is proposing to expand bus service hours 3% in FY2021. TriMet will make a series of changes to bus service including increased frequency, route changes and extensions. These investments are paid for by revenues generated by the increase in the employer payroll tax rate and the STIF. The

Overview-15
service improvements will occur throughout FY2021. The cost of the service improvements is approximately $6.5 million. Pension Funding - The implementation of Governmental Accounting Standards Board (GASB) No. 68 standard and industry best practices led TriMet to adopt pension funding plans that lay out how TriMet will bring its two closed DB pension plans to fully funded status over a reasonable long-term horizon. As of June 30, 2019, the non-union plan is 93.1% funded with a net pension liability of $10.0 million. As of November 2019, the non-union plan is considered fully funded as the anticipated normal growth in the account will continue to fund the account to meet all obligations. The union plan is 80.5% funded, with a net pension liability of $138.8 million as of June 30, 2018. The FY2021 Proposed Budget is consistent with the pension policies proposed by the Board of Directors on February 26, 2014 and amended November 2019. According to the 2018 National Association of State Retirement Administrators (NASRA), Summary of Findings, the national average pension funding level for governmental plans is 72.6%. Capital Investments – TriMet has an intensive capital program. Capital expenditures are made for the acquisition or construction of a major capital asset that has a useful life of greater than one year. The FY2021 Capital Improvement Program (CIP) Proposed Budget totals $329.7 million, the details of which are included in the CIP tab. Following are the major investments for FY2021: Vehicle Purchases:
• Buses. TriMet replaced 392 buses between FY2014 and FY2020 and is planning to replace 19 buses in FY2021. The entire fleet will be low-floor low emission, air conditioned, and using a renewable diesel blend to emit
a lower amount of greenhouse gases. FY2020 included 26 expansion buses for service coverage and, similarly, FY2021 includes 25 expansion buses. TriMet has received three federal Low or No Emission Vehicle (Low-No) Program grants for the purchase of battery-electric buses – one in FY2016 ($3.4 million), one in FY2018 ($2.3 million), and one in FY2019 ($2.1 million). The FY2016 grant dollars were used to purchase five New Flyer battery-electric buses; the FY2018 grant dollars are being used to acquire five Gillig battery-electric buses, which are expected to be acquired and in service sometime in FY2021; and, the FY2019 grant dollars will be used to purchase three Proterra battery-electric buses, which are expected to be acquired and in service sometime in FY2022.
• LIFT Vehicles. The FY2021 Proposed Budget assumes purchases will be funded using Bond funds. This spending will purchase 42 replacement vehicles.
• Light Rail Vehicles (LRV). The FY2021 Proposed Budget includes $25.8 million for continued design work and initial manufacturing on the next generation of LRV.
System Expansion/Enhancement:
• Southwest Corridor Light Rail Project. Funding is included in the FY2021 Proposed Budget to fund continuing engineering (design) and federal environmental impact work. The majority of the early costs are supported by Metropolitan Transportation Improvement Program (MTIP) backed bonds.
• Division Transit Project. The FY2021 Proposed Budget includes funding to complete design and continuing construction of high capacity bus service between Downtown Portland and Gresham, running across the Tilikum Crossing Bridge and along Division Street.

Overview-16
TriMet received a Medium-High Small Starts rating in February 2018 and received Federal funding in January 2020. Revenue service is anticipated to begin in fall 2022.
• A Better Red (MAX Red Line Extension & Improvements). The FY2021 Budget includes $10.4 million of funding to continue design work to extend the MAX Red Line west to Fair Complex/Hillsboro Airport Station and improve sections of the line to provide system wide reliability improvements. The Single Year Grant Agreement (SYGA) application will be submitted in July 2020, with construction scheduled to begin in April 2021, and service along the improve line beginning in 2023-2024. The current total Federal Capital Investment Grant project cost is anticipated to be $206 million.
• Portland-Milwaukie Light Rail. There is $5.4 million in the FY2021 budget to finish development around the MAX Orange Line, connecting Portland and Milwaukie. This spend is focused primarily on constructing the Gideon pedestrian overcrossing and Ruby Junction Operating Facility. In addition, the remaining grant funds of approximately $18 million may be utilized for additional project related work through 2024.
• Electric Vehicle Charging Infrastructure. TriMet committed $6.6 million in the FY2021 budget to further develop the charging infrastructure at the Powell bus facility to support electric buses in the future. In addition, TriMet is spending $230,000 to add additional charging capability to the Merlo bus facility to support the buses procured with the Low-No Program grants detailed previously.
State of Good Repair: The Federal Transit Administration requires all transit agencies to develop a Transit Asset Management (TAM) Plan. TriMet adopted its TAM plan in September 2018. The TAM Plan represents an opportunity for TriMet to better anticipate lifecycle costs and to maintain the system in a state of good repair. While TriMet has always dedicated funding towards maintaining assets in a state of good repair, the TAM Plan provides a framework by which TriMet can track its progress toward a mature, data-driven asset management system by setting a baseline of existing conditions and activities required to maintain all of TriMet’s assets in a state of good repair. The budget dedicates $128.8 million towards SGR projects, which is 39.1% of the CIP Budget. In addition to the vehicle purchases detailed earlier – much of which is SGR replacement – the following projects reflect the most significant SGR spend:
• Operating Facilities. The FY2021 Proposed Budget funds a variety of operating facilities repairs and expansions, including continued work on Powell Maintenance Facility overhaul, work to develop the infrastructure for electric bus charging; continued design and development of the Columbia bus base; modifications and expansions of the Ruby Junction Rail Operations Facility to accommodate the needs of system expansion, and various maintenance and operator support facility upgrades and refurbishments.
• Steel Bridge MAX Improvements. Funding is included in the FY2021 Proposed Budget for critical state of good repair work to improve reliability of the MAX light rail rail system through equipment and infrastructure improvements and upgrades on this vital asset that all MAX lines cross.

Overview-17
• Ticket Vending Machine & Fixed-Route Bus Farebox Replacement. There is $8.1 million of funding included in the FY2021 budget to replace the ticket vending machines on rail platforms and bus fareboxes.
• IT Infrastructure. The FY2021 Budget includes $4.6 million to replace aging IT equipment, including mobile routers, servers, communications towers, desktop computers, and fiber lines.
Other Capital Projects:
• Safety Enhancements. In addition to spending dedicated to safety and security imbedded in the other projects, the FY2021 Budget includes $5.5 million for projects specifically focused on improving safety and security for bus and rail facilities and vehicles.
• Enhanced Transit Concepts. There is $6.2 million budgeted in FY2021 to develop and implement projects in partnership with local agencies to create priority treatments along TriMet’s Frequent Service bus network, decrease bus travel time, and increase service reliability.
Debt Service Total FY2021 debt service is $123.1 million, of which $60.0 million is reserved for a Bank Line of Credit. Up to $21.4 million of TriMet’s FY2021 debt service is funded by MTIP revenues, the regional federal flexible highway funds that TriMet receives from Metro each year to pay debt service on TriMet’s 2011 and 2018 Capital Grant Receipt Revenue Bonds. Existing senior lien payroll tax revenue funded debt service for FY2020 was budgeted at 6.0% of continuing revenues. In FY2021, TriMet may issue bonds totaling approximately $200
million, bringing Debt service on senior lien payroll tax revenue bonds to 6.4%, well below the 7.5% of continuing revenues limit set by the Board of Directors. Staffing Increases In FY2021, TriMet will increase staffing by 67.50 union positions (66 FTE): • 42.50 positions (41 FTE) dedicated to transportation
operations • 8 positions dedicated to safety & security • 9 positions dedicated to maintenance • 4 positions dedicated to financial & administrative services • 4 positions dedicated to public affairs In addition, 46 non-union positions (44.05 FTE) will be added: • 1 position dedicated to operations planning & development • 1 position dedicated to business planning & development • 4 positions dedicated to safety & security • 8 positions (7.50 FTE) dedicated to maintenance • 18 positions dedicated to information technology • 1 position (-0.45 FTE net with reductions to limited term)
dedicated to public affairs • 5 positions dedicated to financial & administrative services • 1 position dedicated to labor relations & human resources • 3 positions dedicated to legal services • 4 positions dedicated to the CIP where between 75% and
85% of their costs will be covered by individual project funding, such as the Southwest Corridor Light Rail Project, A Better Red project and the Division Transit Project.

Overview-18
Numerous full-time positions have start dates later in the budget year. In Summary The FY2021 Proposed Budget focuses on enhancing customer and employee safety, incorporation of STIF programs, such as the transit assistance program, implementation of key state of good repairs on critical infrastructure; development of a long term carbon reduction strategy that includes zero emissions power sources for TriMet’s facilities and fleet, implementation of bus and rail fleet replacement and expansion, and increased speed and capacity in the Portland metro areas key transit corridors. TriMet’s fiscal plan continues to address essential capital maintenance and replacement in addition to the advancement of important regional expansion projects such as the Division Transit Project and Southwest Corridor Light Rail Project. The fiscal plan is consistent with Board policy to fund the non-union unfunded pension liability over a closed 10-year period and funding the union unfunded pension liability over a closed 15-year to an open 5-year amortization. The fiscal plan also dedicates new payroll tax revenues to new service and meets Board Strategic Finance Plan policies, including limiting debt service to no more than 7.5% of ongoing revenue. TriMet is committed to staying on course to achieve long-term fiscal stability to keep its commitments to riders, employees, retirees and payroll taxpayers and to meet the transit needs of the growing region.

Office of the General Manager
Labor Relations & Human Resources
Division
Engineering & Construction
Division
Administration
Legal ServicesDivision
Internal Audit Chief Operating Officer
Public AffairsDivision
Finance & Administrative
Services Division
Budget Organization Chart: FY2020-2021 Proposed Budget
Design & Construction
Major Projects
Project Development &
Permitting
Administration
Planning & Policy
Transit Equity, Inclusion &
Community Affairs
Government Services & Public
Affairs
Communications & Marketing
Customer Information
Services
Administration
Financial Services
Budget & Grants Administration
Risk Management
Procurement & Supply Chain Management
Fare Revenue & Administrative
Services
Administration
Benefits & HRIS
Talent Management
Labor Relations
Compensation
Administration
Litigation
Real Estate & Transit Oriented
Development
Safety & Security Division
Operations Planning &
Development
Business Planning & Asset
Management
Operations Training & Planning
Information Technology
Division
Transportation Division
Maintenance Division
Administration
Safety & Environmental
Services
Security & Emergency
Management
Administration
IT Operations & Infrastructure
Information Security
Enterprise Systems
Intelligent Transportation
Systems
Administration
Bus Transportation
Service Delivery
Accessible Transportation
Rail Transportation
Commuter Rail
Streetcar
Administration
Bus Maintenance
Facilities Management
Rail Maintenance of Way
Rail Equipment Maintenance
Overview-19

Overview-20
[This Page Left Intentionally Blank]

Resource Summary
Financial Summary-1
Revenue Category FY2018 FY2019 FY2020 FY2020 FY2021
Actual Actual Budget Estimate Proposed Approved AdoptedBeginning Fund Balance as of July 1*
Restricted Bond Proceeds & Other Restricted 205,684,755 399,336,631 291,548,472 212,029,068 311,888,985Restricted Fund Adjustment 72,394,918 72,394,918Restricted Debt Service 39,587,854 59,291,993 45,463,021 45,426,652 45,500,000Unrestricted Budgetary Fund Balance 196,190,565 207,823,042 167,453,887 205,468,279 158,428,682
Total Beginning Fund Balance $441,463,174 $666,451,666 $576,860,298 $535,318,917 $515,817,667Operating Revenue
Passenger 113,836,174 106,832,387 110,000,000 102,500,000 109,500,000Transit Advertising 3,678,750 3,741,830 3,854,000 3,752,500 3,865,100ATP Serv - Contract Rev 7,607,217 8,061,672 8,095,000 8,954,000 8,954,000Service Contracts 7,992,688 8,574,236 8,985,285 8,574,000 8,574,000
Total Operating Revenue $133,114,828 $127,210,125 $130,934,285 $123,780,500 $130,893,100Tax Revenue **
Payroll Tax Rev-Employer 340,352,473 354,486,790 389,650,000 378,808,384 410,187,000Payroll Tax Rev-Self Empl 16,627,433 16,254,849 19,495,000 16,378,458 17,144,000Payroll Tax Rev-State In-Lieu 2,063,285 2,009,113 2,265,000 2,230,108 2,352,000
Total Tax Revenue $359,043,191 $372,750,752 $411,410,000 $397,416,950 $429,683,000Other Revenue
Federal Operating Grants 118,123,666 95,086,660 100,725,641 91,401,639 103,509,803State STIF-Discretionary 280,000 350,000State STIF-Formula 3,469,676 36,019,560 12,453,510 20,194,315State Operating Grants 1,509,381 1,111,897 850,297 850,297 1,527,953Local Operating Grants 93,785 19,145 19,700Local Operating Revenue 1,661,951 1,164,800 1,424,000 1,339,200Interest 5,972,142 14,489,668 1,450,000 2,600,000 2,613,000Miscellaneous 5,210,745 8,611,489 6,210,000 12,185,300 6,486,400
Total Other Revenue $132,571,669 $122,769,390 $146,700,298 $120,933,891 $136,040,371Total Operating Resources(Excluding Beginning Fund Balance)
$624,729,688 $622,730,267 $689,044,583 $642,131,341 $696,616,471
CIP Resources 11,583,602 9,411,789 48,403,328 69,534,344 85,070,547
Bond Proceeds 262,145,000 200,000,000 200,000,000 200,000,000Light Rail Program Resources 102,286,142 42,500,535Bank Line of Credit Principal 10,000,000 60,000,000Other Non-Operating Resources 4,041,244 5,026,950 14,571,877 13,354,437 11,089,888
Total Resources $1,446,248,850 $1,356,121,207 $1,528,880,086 $1,460,339,039 $1,568,594,573
* Budgetary Fund Balance. Restricted funds include funds held in trust to pay debt service, plus bond proceeds and other resources designated for specific projects.Restricted Fund Adjustment is due to change in basis of accounting for debt service from GAAP/full accrual to cash basis.Unrestricted funds are resources maintained to cover cash flow until tax and grant revenues are collected.
** Budgeted payroll tax revenues are an estimate of fiscal year payroll tax cash receipts. Actuals are an estimate of payroll taxes from wages and salaries earned in the fiscal year.

Requirement Summary
Financial Summary-2
Division/Department FY2018 FY2019 FY2020 FY2020 FY2021Actual Actual Budget Estimate Proposed Approved Adopted
Office of the General Manager DivisionOffice of General Manager Department 795,965 687,878 655,035 631,278 676,875Diversity & Transit Equity Department 645,092 1,228,919Internal Audit Department 280,784 248,620 297,845 261,335 310,562
Total Office of the General Manager Division $1,721,841 $2,165,417 $952,880 $892,613 $987,437Chief Operation Officer Division
Office of Chief Operating Officer Department 928,930 780,977 1,024,304Operations Planning & Development Department 1,416,244 1,279,072 1,377,940Business Planning & Asset Management Department 1,197,467 1,137,989 2,764,940Operations Training & Planning Department 8,637,235 8,337,536 8,466,029
Total Chief Operation Officer Division $12,179,876 $11,535,574 $13,633,213Transportation Division
Transportation Administration Department 2,405,540 2,719,885 889,514 916,792 1,091,553Bus Transportation Department 127,399,863 133,707,095 154,288,238 151,898,452 156,261,125Field Operations Department 18,144,068 18,967,046Service Delivery Department 1,647,548 1,681,006 2,340,693 2,642,646 2,391,134Accessible Transportation Programs Department 37,919,475 37,717,269 40,300,623 39,954,290 41,496,663Rail Transportation Department 23,430,185 23,990,155 34,086,365 33,784,565 35,427,667Commuter Rail Department 5,939,868 6,050,894 6,446,052 6,453,351 7,462,864Portland Streetcar Department 15,333,422 16,604,710 17,056,681 17,098,615 18,639,614
Total Transportation Division $232,219,969 $241,438,060 $255,408,166 $252,748,711 $262,770,620Safety & Security Division
Safety & Security Administration Department 585,047 550,276 635,806Safety & Environmental Services Department 3,690,285 3,762,631 3,121,871 2,842,351 3,146,457Security & Emergency Management Department 16,389,475 19,233,132 25,765,163 22,794,377 27,291,813Bus Transporation Training Department 4,213,812 4,431,074Rail Transportation Training Department 1,688,238 1,798,237
Total Safety & Security Division $25,981,810 $29,225,074 $29,472,081 $26,187,004 $31,074,076Maintenance Division
Maintenance Administration Department 1,227,999 614,000 1,570,089Bus Maintenance Department 57,586,009 64,346,536 65,306,804 63,713,661 69,240,615Facilities Management Bus-Rail Department 19,265,257 20,824,982 21,850,932 21,341,341 22,345,609Rail Maintenance Of Way Department 17,311,769 18,165,371 19,168,435 18,519,901 20,788,762Rail Equipment Maintenance Department 40,229,899 45,119,028 47,576,045 44,219,817 46,728,338
Total Maintenance Division $134,392,934 $148,455,917 $155,130,215 $148,408,720 $160,673,413

Requirement Summary
Financial Summary-3
Division/Department FY2018 FY2019 FY2020 FY2020 FY2021Actual Actual Budget Estimate Proposed Approved Adopted
Information Technology DivisionIT Administration Department 11,106,337 13,427,001 7,390,031 6,199,893 8,107,839IT Operations & Infrastructure Department 3,036,201 3,283,218 3,647,167Information Security Department 587,419 640,909 803,687Enterprise Systems Department 4,965,382 4,768,169 5,094,789Intelligent Transportation Systems Department 2,280,602 2,292,007 2,595,133
Total Information Technology Division $11,106,337 $13,427,001 $18,259,635 $17,184,196 $20,248,615Public Affairs Division
Public Affairs Administration Department 647,097 555,095 1,028,259 898,266 1,190,208Policy & Planning Department 5,418,760 5,207,339 5,480,873 4,774,591 5,377,227GIS & Location Based Services Department 522,755 555,612Transit Equity Inclusion & Community Affairs Department -3,543 2,484,153 2,052,077 3,367,209Government Services and Public Affairs Department 588,749 635,406 1,039,844 939,951 1,004,310Communications & Marketing Department 4,760,805 4,596,676 4,147,802 4,147,176 4,178,362Customer Information Services Department 3,409,251 3,877,235 3,813,407 3,733,374 3,846,117
Total Public Affairs Division $15,343,874 $15,427,363 $17,994,338 $16,545,435 $18,963,433Finance & Administrative Services Division
Finance & Administrative Services Department 509,393 1,094,425 1,133,252 1,014,141 1,194,774Financial Services Department 2,686,174 2,790,921 3,026,711 2,958,703 3,224,395Budget & Grants Administration Department 832,267 1,184,157 1,224,837 1,160,658 1,273,955Risk Management Department 3,593,101 3,706,133 3,982,071 3,932,590 4,343,707Procurement & Supply Chain Management Department 1,721,610 1,685,248 5,437,815 5,154,901 6,251,311Fare Revenue & Administrative Services Department 9,781,837 9,878,254 10,870,273 11,218,857 12,977,737
Total Finance & Administrative Services Division $19,124,382 $20,339,138 $25,674,959 $25,439,850 $29,265,879Labor Relations & Human Resources Division
Human Resources Administration Department 703,203 1,015,387 1,065,997 812,826 1,149,315Benefits & HRIS Department 1,392,918 1,633,452 1,448,888 1,404,665 1,678,709Talent Management Department 1,335,168 1,543,537 1,671,980 1,563,076 2,154,433Labor Relations Department 850,870 939,782 1,062,317 892,973 853,706Compensation Department 425,554 427,827 451,356
Total Labor Relations & Human Resources Division $4,282,159 $5,132,158 $5,674,736 $5,101,367 $6,287,519Legal Services Division
Legal Services Administration Department 2,229,357 2,276,330 1,471,209 1,362,277 1,555,808Litigation Department 942,851 922,602 962,485Real Estate & Transit Oriented Development Department 2,604,364 2,354,645 3,758,815
Total Legal Services Division $2,229,357 $2,276,330 $5,018,424 $4,639,524 $6,277,108
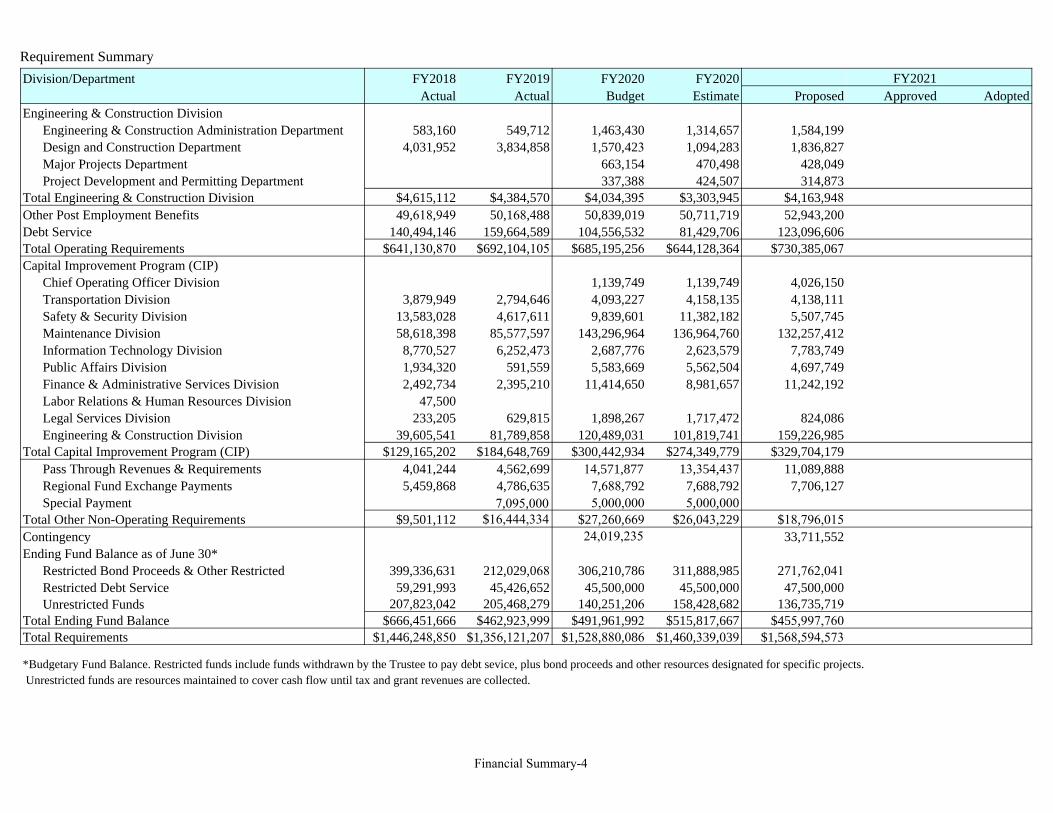
Requirement Summary
Financial Summary-4
Division/Department FY2018 FY2019 FY2020 FY2020 FY2021Actual Actual Budget Estimate Proposed Approved Adopted
Engineering & Construction DivisionEngineering & Construction Administration Department 583,160 549,712 1,463,430 1,314,657 1,584,199Design and Construction Department 4,031,952 3,834,858 1,570,423 1,094,283 1,836,827Major Projects Department 663,154 470,498 428,049Project Development and Permitting Department 337,388 424,507 314,873
Total Engineering & Construction Division $4,615,112 $4,384,570 $4,034,395 $3,303,945 $4,163,948Other Post Employment Benefits 49,618,949 50,168,488 50,839,019 50,711,719 52,943,200Debt Service 140,494,146 159,664,589 104,556,532 81,429,706 123,096,606Total Operating Requirements $641,130,870 $692,104,105 $685,195,256 $644,128,364 $730,385,067Capital Improvement Program (CIP)
Chief Operating Officer Division 1,139,749 1,139,749 4,026,150Transportation Division 3,879,949 2,794,646 4,093,227 4,158,135 4,138,111Safety & Security Division 13,583,028 4,617,611 9,839,601 11,382,182 5,507,745Maintenance Division 58,618,398 85,577,597 143,296,964 136,964,760 132,257,412Information Technology Division 8,770,527 6,252,473 2,687,776 2,623,579 7,783,749Public Affairs Division 1,934,320 591,559 5,583,669 5,562,504 4,697,749Finance & Administrative Services Division 2,492,734 2,395,210 11,414,650 8,981,657 11,242,192Labor Relations & Human Resources Division 47,500Legal Services Division 233,205 629,815 1,898,267 1,717,472 824,086Engineering & Construction Division 39,605,541 81,789,858 120,489,031 101,819,741 159,226,985
Total Capital Improvement Program (CIP) $129,165,202 $184,648,769 $300,442,934 $274,349,779 $329,704,179Pass Through Revenues & Requirements 4,041,244 4,562,699 14,571,877 13,354,437 11,089,888Regional Fund Exchange Payments 5,459,868 4,786,635 7,688,792 7,688,792 7,706,127Special Payment 5,000,000 5,000,000
Total Other Non-Operating Requirements $9,501,112 $16,444,334 $27,260,669 $26,043,229 $18,796,015Contingency 33,711,552Ending Fund Balance as of June 30*
Restricted Bond Proceeds & Other Restricted 399,336,631 212,029,068 306,210,786 311,888,985 271,762,041Restricted Debt Service 59,291,993 45,426,652 45,500,000 45,500,000 47,500,000Unrestricted Funds 207,823,042 205,468,279 140,251,206 158,428,682 136,735,719
Total Ending Fund Balance $666,451,666 $462,923,999 $491,961,992 $515,817,667 $455,997,760Total Requirements $1,446,248,850 $1,356,121,207 $1,528,880,086 $1,460,339,039 $1,568,594,573
*Budgetary Fund Balance. Restricted funds include funds withdrawn by the Trustee to pay debt sevice, plus bond proceeds and other resources designated for specific projects.Unrestricted funds are resources maintained to cover cash flow until tax and grant revenues are collected.
7,095,000
24,019,235

CIP Resources
Financial Summary-5
FY2018 FY2019 FY2020 FY2020 FY2021Actual Actual Budget Estimate Proposed Approved Adopted
State, Local Government & Private Contributions 2,840,261 3,036,417 26,573,543 26,371,656 38,486,295Federal Transit Administration Grants, Programmed 8,743,341 37,040,636 21,829,785 43,162,688 46,584,252Revenue Bond Proceeds 47,657,538 128,208,072 220,818,550 172,226,371 216,903,580Operating Resources Dedicated for Capital* 69,924,062 16,363,644 31,221,056 32,589,064 27,730,052Total CIP Resources $129,165,202 $184,648,769 $300,442,934 $274,349,779 $329,704,179
* Line included for information only. Operating resources are drawn on agency resources.

CIP Requirements
Financial Summary-6
Operating FY2018 FY2019 FY2020 FY2020 FY2021
Actual Actual Budget Estimate Proposed Approved Adopted
Chief Operating Officer Division 1,139,749 1,139,749 4,026,150
Transportation Division 3,879,949 2,794,646 4,093,227 4,158,135 4,138,111
Safety & Security Division 13,583,028 4,617,611 9,839,601 11,382,182 5,507,745
Maintenance Division 58,618,398 85,577,597 143,296,964 136,964,760 132,257,412
Information Technology Division 8,770,527 6,252,473 2,687,776 2,623,579 7,783,749
Public Affairs Division 1,934,320 591,559 5,583,669 5,562,504 4,697,749
Finance & Administrative Services Division 2,492,734 2,395,210 11,414,650 8,981,657 11,242,192
Labor Relations & Human Resources Divison 47,500
Legal Services Division 233,205 629,815 1,898,267 1,717,472 824,086
Engineering & Construction Division 39,605,541 81,789,858 120,489,031 101,819,741 159,226,985Total CIP Requirements $129,165,202 $184,648,769 $300,442,934 $274,349,779 $329,704,179

SUMMARY OF FUND HISTORY
FY2018 FY2019 FY2020 Fund
Actual Actual Budget Proposed Approved Adopted
I. Operating Program
A. Resources
441,463,174 666,451,666 576,860,298 Beginning Fund Balance-Restricted and Unrestricted 515,817,667
113,836,174 106,832,387 110,000,000 Passenger Revenue 109,500,000
19,278,654 20,377,738 20,934,285 Other Operating Revenue 21,393,100
359,043,191 372,750,752 411,410,000 Tax Revenue 429,683,000
132,571,669 122,769,390 146,700,298 Other Revenue 136,040,371
4,041,244 5,026,950 14,571,877 Other Non-Operating Resources 11,089,888
262,145,000 200,000,000 Bond Proceeds 200,000,000
10,000,000 Bank Line of Credit 60,000,000
102,286,142 42,500,535 Light Rail Funds Restricted for Debt Service
$1,434,665,248 $1,346,709,418 $1,480,476,758 Total Operating Program Resources $1,483,524,026
B. Requirements
347,112,367 365,565,529 399,216,820 Personnel Services 409,914,461
153,524,357 166,873,987 181,421,904 Materials & Services 197,374,000
140,494,146 159,664,589 104,556,532 Debt Service 123,096,606
9,501,112 16,444,334 27,260,669 Other Non-Operating Requirements 18,796,015
24,019,235 Contingency 33,711,552
666,451,666 462,923,999 491,961,992 Ending Fund Balance-Restricted and Unrestricted 455,997,760
$1,317,083,648 $1,171,472,438 $1,228,437,152 Total Operating Program Requirements $1,238,890,394
II. CIP
A. Resources
2,840,261 3,036,717 26,573,543 State, Local Government & Private Contributions 38,486,295
8,743,341 6,375,073 21,829,785 Federal Transit Administration Grants 46,584,252
$11,583,602 $9,411,790 $48,403,328 Total CIP Resources $85,070,547
B. Requirements
129,165,202 184,648,769 300,442,934 Projects 329,704,179
$129,165,202 $184,648,769 $300,442,934 Total CIP Requirements $329,704,179
$1,446,248,850 $1,356,121,207 $1,528,880,086 Total Resources $1,568,594,573
$1,446,248,850 $1,356,121,207 $1,528,880,086 Total Requirements $1,568,594,573
FY2021
Financial Summary-7

PASS THROUGH REVENUES AND REQUIREMENTS
FY2018 FY2019 FY2020 FY2020
Actual Actual Budget Estimate Proposed Approved Adopted
Special Transportation Fund Formula 4,002,543 3,902,407 3,456,875 3,456,875 3,456,875
Special Transportation Fund Discretionary 609,054
Title XIX Match Clackamas, Multnomah & Washington Counties 2,544 740,562 740,562 740,562
99W ODOT Agreement #30684 - City of Portland Match 17,130 21,612
99W ODOT Agreement #30684 - City of Tigard Match 21,571 27,082
State STIF-Discretionary 200,000 200,000
State STIF-Formula Regional Coordination 5,431,244 4,888,120 3,534,613
State STIF-Formula Direct Pass Thru to Jurisdictions Outside TriMet 4,743,196 4,268,880 3,157,838
Total pass through revenues and requirements $4,041,244 4,562,699 $14,571,877 $13,354,437 $11,089,888
REGIONAL FUND EXCHANGE PAYMENTS
FY2018 FY2019 FY2020 FY2020
Actual Actual Budget Estimate Proposed Approved Adopted
Metro Program Fund Exchanges 5,459,868 4,786,635 7,688,792 7,688,792 7,706,127
Total regional fund exchanges $5,459,868 $4,786,635 $7,688,792 $7,688,792 $7,706,127
SPECIAL PAYMENTS
FY2018 FY2019 FY2020 FY2020
Actual Actual Budget Estimate Proposed Approved Adopted
Active Transportation/Safe Routes to School 2,000,000
Enhanced Transit Projects 95,000
ODOT Project Development: Highway/Arterial 5,000,000 5,000,000 5,000,000
Total special payments $7,095,000 $5,000,000 $5,000,000
FY2021
FY2021
FY2021
Financial Summary-8

Resources-1
CIP, $85,070,547, 8.57%
State Operating Grants,
$22,072,268, 2.22%
Other Non-Operating,
$11,089,888, 1.12%
Passenger Revenue, $109,500,000, 11.03%
Interest, $2,613,000, 0.26%
Federal Operating Grants, $103,509,803, 10.43%
Bond Proceeds, $200,000,000, 20.15%
Tax Revenue, $429,683,000, 43.28%
Other Sources, $29,238,400, 2.95%
TOTAL RESOURCESBudget FY2021
Total Resources = $992,776,906*
*Total Resources exclude Beginning Fund Balance of $515,817,667

Resource Summary
Resources-2
Revenue Category FY2018 FY2019 FY2020 FY2020 FY2021
Actual Actual Budget Estimate Proposed Approved AdoptedBeginning Fund Balance as of July 1*
Restricted Bond Proceeds & Other Restricted 205,684,755 399,336,631 291,548,472 212,029,068 311,888,985Restricted Fund Adjustment 72,394,918 72,394,918Restricted Debt Service 39,587,854 59,291,993 45,463,021 45,426,652 45,500,000Unrestricted Budgetary Fund Balance 196,190,565 207,823,042 167,453,887 205,468,279 158,428,682
Total Beginning Fund Balance $441,463,174 $666,451,666 $576,860,298 $535,318,917 $515,817,667Operating Revenue
Passenger 113,836,174 106,832,387 110,000,000 102,500,000 109,500,000Transit Advertising 3,678,750 3,741,830 3,854,000 3,752,500 3,865,100ATP Serv - Contract Rev 7,607,217 8,061,672 8,095,000 8,954,000 8,954,000Service Contracts 7,992,688 8,574,236 8,985,285 8,574,000 8,574,000
Total Operating Revenue $133,114,828 $127,210,125 $130,934,285 $123,780,500 $130,893,100Tax Revenue **
Payroll Tax Rev-Employer 340,352,473 354,486,790 389,650,000 378,808,384 410,187,000Payroll Tax Rev-Self Empl 16,627,433 16,254,849 19,495,000 16,378,458 17,144,000Payroll Tax Rev-State In-Lieu 2,063,285 2,009,113 2,265,000 2,230,108 2,352,000
Total Tax Revenue $359,043,191 $372,750,752 $411,410,000 $397,416,950 $429,683,000Other Revenue
Federal Operating Grants 118,123,666 95,086,660 100,725,641 91,401,639 103,509,803State STIF-Discretionary 280,000 350,000State STIF-Formula 3,469,676 36,019,560 12,453,510 20,194,315State Operating Grants 1,509,381 1,111,897 850,297 850,297 1,527,953Local Operating Grants 93,785 19,145 19,700Local Operating Revenue 1,661,951 1,164,800 1,424,000 1,339,200Interest 5,972,142 14,489,668 1,450,000 2,600,000 2,613,000Miscellaneous 5,210,745 8,611,489 6,210,000 12,185,300 6,486,400
Total Other Revenue $132,571,669 $122,769,390 $146,700,298 $120,933,891 $136,040,371Total Operating Resources(Excluding Beginning Fund Balance)
$624,729,688 $622,730,267 $689,044,583 $642,131,341 $696,616,471
CIP Resources 11,583,602 9,411,789 48,403,328 69,534,344 85,070,547
Bond Proceeds 262,145,000 200,000,000 200,000,000 200,000,000Light Rail Program Resources 102,286,142 42,500,535Bank Line of Credit Principal 10,000,000 60,000,000Other Non-Operating Resources 4,041,244 5,026,950 14,571,877 13,354,437 11,089,888
Total Resources $1,446,248,850 $1,356,121,207 $1,528,880,086 $1,460,339,039 $1,568,594,573
* Budgetary Fund Balance. Restricted funds include funds held in trust to pay debt service, plus bond proceeds and other resources designated for specific projects.Restricted Fund Adjustment is due to change in basis of accounting for debt service from GAAP/full accrual to cash basis.Unrestricted funds are resources maintained to cover cash flow until tax and grant revenues are collected.
** Budgeted payroll tax revenues are an estimate of fiscal year payroll tax cash receipts. Actuals are an estimate of payroll taxes from wages and salaries earned in the fiscal year.

Resource Summary By Source
Resources-3
Revenue Category FY2018 FY2019 FY2020 FY2020 FY2021Actual Actual Budget Estimate Proposed Approved Adopted
Beginning Fund Balance as of July 1*Restricted Bond Proceeds & Other Restricted 205,684,755 399,336,631 291,548,472 212,029,068 311,888,985Restricted Fund Adjustment 72,394,918 72,394,918Restricted Debt Service 39,587,854 59,291,993 45,463,021 45,426,652 45,500,000Unrestricted Budgetary Fund Balance 196,190,565 207,823,042 167,453,887 205,468,279 158,428,682
Total Beginning Fund Balance $441,463,174 $666,451,666 $576,860,298 $535,318,917 $515,817,667Operating Revenue
Passenger 113,836,174 106,832,387 110,000,000 102,500,000 109,500,000Transit Advertising 3,678,750 3,741,830 3,854,000 3,752,500 3,865,100ATP Serv - Contract Rev 7,607,217 8,061,672 8,095,000 8,954,000 8,954,000Service Contracts 7,992,687 8,574,236 8,985,285 8,574,000 8,574,000Local Operating Revenue 1,661,951 1,164,800 1,424,000 1,339,200
Total Operating Revenue $134,776,779 $127,210,125 $132,099,085 $125,204,500 $132,232,300Non-Operating Resources
Interest 5,972,142 14,489,668 1,450,000 2,600,000 2,613,000Miscellaneous 5,210,745 8,611,489 6,210,000 12,185,300 6,486,400
Total Non-Operating Resources $11,182,887 $23,101,157 $7,660,000 $14,785,300 $9,099,400Tax Revenue **
Payroll Tax Rev-Employer 340,352,473 354,486,790 389,650,000 378,808,384 410,187,000Payroll Tax Rev-Self Empl 16,627,433 16,254,849 19,495,000 16,378,458 17,144,000Payroll Tax Rev-State In-Lieu 2,063,285 2,009,113 2,265,000 2,230,108 2,352,000
Total Tax Revenue $359,043,191 $372,750,752 $411,410,000 $397,416,950 $429,683,000Grants
Federal Operating Grants 118,123,666 95,086,660 100,725,641 91,401,639 103,509,803State STIF-Discretionary 280,000 350,000State STIF-Formula 3,469,676 36,019,560 12,453,510 20,194,315State Operating Grants 1,509,381 1,111,897 850,297 850,297 1,527,953Local Operating Grants 93,785 19,145 19,700Capital Grants 111,029,483 48,875,608 21,829,785 43,162,688 46,584,252
Total Grants $230,756,315 $148,543,841 $159,705,283 $147,887,279 $172,186,023Other Resources
Capital Assistance 2,840,261 3,036,717 26,573,543 26,371,656 38,486,295Bond Proceeds 262,145,000 200,000,000 200,000,000 200,000,000Bank Line of Credit Principal 10,000,000 60,000,000Other Non-Operating Resources 4,041,244 5,026,950 14,571,877 13,354,437 11,089,888
Total Other Resources $269,026,505 $18,063,667 $241,145,420 $239,726,093 $309,576,183Total Resources $1,446,248,850 $1,356,121,207 $1,528,880,086 $1,460,339,039 $1,568,594,573* Budgetary Fund Balance. Restricted funds include funds held in trust to pay debt service, plus bond proceeds and other resources designated for specific projects.
Restricted Fund Adjustment is due to change in basis of accounting for debt service from GAAP/full accrual to cash basis.Unrestricted funds are resources maintained to cover cash flow until tax and grant revenues are collected.
** Budgeted payroll tax revenues are an estimate of fiscal year payroll tax cash receipts. Actuals are an estimate of payroll taxes from wages and salaries earned in the fiscal year.

Resources-4
Federal & State Grant/Local Contribution Summary
Percent of FY2021Type of Funding Purpose Contributions Proposed Approved AdoptedFederal Operating Grants
FTA Urbanized Area Formula Program (5307) Preventive Maintenance 80.00% 43,000,000FTA MAP-21 State of Good Repair Funds (5337) Preventive Maintenance 80.00% 27,524,142Regional STBG & CMAQ FHWA Flex Funds Regional Rail Debt Service 89.73% 21,390,000Regional STBG FHWA Flex Funds Metro Program Fund Exchanges 89.73% 7,706,127Regional STBG FHWA Flex Funds Regional Transp Options Program 89.73% 500,000Federal Section 20005 (b)(2) Discretionary Funds Transit Oriented Development 77.00% 350,000Integrated Mobility Innovation Dem Program (5312) Integrated Mobility Options 77.46% 1,449,826Federal Transit Security Operating Grant Funds Anti-Terrorism Transit Security 100.00% 63,333FTA Enhanced Mobility of Sr & Indv w/Dis Funds (5310) Ride Connection Contracted Service 80.00% 1,324,375Homeland Security Funds Safety & Security-Police/Canine 100.00% 202,000Total Federal Operating Grants $103,509,803
Federal CIP GrantsFTA Section 5339(a) Bus & Bus Facilities Formula Fixed Route Buses Repl & Exp-Diesel Buses 80.00% 3,570,000FTA Section 5309 CIG New Starts Portland-Milwaukie Light Rail Project 55.88% 5,435,353FTA Section 5309 CIG Small Starts Division Transit Project 61.15% 33,200,413FTA Section 5339(c) Low or No-Emission Veh Electric Buses 49.00% 2,290,000FTA Section 5312 Innovations in Transit Public Safety Operator Safety & Rider Awareness 72.34% 151,052FTA Section 5307 Urbanized Area Formula 162nd Ave Pedestrian Access Improvement 80.00% 461,743Regional STBG FHWA Flex Powell-Division Corridor Safety & Access to Transit 89.73% 1,475,691Total Federal CIP Grants $46,584,252
Total Federal Grants $150,094,055State Operating Grants
State 5310 Formula LIFT Operations 89.73% 758,100State STIF-Formula Service and Fare Programs 100.00% 20,194,315State STIF-Discretionary Spot Improvement Program & Market Study 80.00% 350,000State Special Transportation LIFT Operations 100.00% 92,153State 5310 Accessibility Services Progam LIFT Operations 87.73% 677,700Total State Operating Grants $22,072,268

Resources-5
Federal & State Grant/Local Contribution Summary
Percent of FY2021Type of Funding Purpose Contributions Proposed Approved AdoptedState CIP Grants
State STIF Formula Diesel Bus Purchases 2,121,800State STIF Formula Electric Bus Purchases 2,499,585State STIF Formula Security Funds for Transit Enhancement 626,000State ATCMTD Grant Next Gen Transit Signal Priority 1,057,432State STIF Formula Next Gen Transit Signal Priority 282,077State STIF Formula Garage. Layover and TC Expansion 1,381,300State STIF Formula Transit Tracker Displays 1,163,000State STIF Formula Bus Stop Development 1,700,000State STIF Formula Electric Vehicle Infrastructure 6,609,440State STIF Formula Enhanced Transit Concepts 5,303,000Total State CIP Grants $22,743,634
Total State Grants $44,815,902Local CIP Contributions
City of Portland 162nd Ave Ped Access Improvement 115,437City of Portland & City of Gresham Powell-Division Corridor Safety & Access to Transit 58,796City of Portland & City of Gresham Division Transit Project 11,443,428Metro Red Line Extension & Reliability Improvements 4,000,000Multiple Local Agencies Third Party Recovery 125,000Total Local CIP Contributions $15,742,661
Total Local Contributions $15,742,661

Resources-6
[This Page Left Intentionally Blank]

Requirements-1
Operations, $423,444,033, 38.06%
CIP, $329,704,179, 29.63%
Other Post Employment Benefits, $52,943,200,
4.76%
Debt Service, $123,096,606, 11.06%Contingency,
$33,711,552, 3.03%
Other Non-Operating, $18,796,015, 1.69%
General & Administrative, $130,901,228, 11.77%
TOTAL REQUIREMENTSBudget FY2021
Total Operating & Capital Requirements = $1,112,596,813*
*Total Requirements exclude Ending Fund Balance of $455,997,760.

Requirement Summary
Requirements-2
Division/Department FY2018 FY2019 FY2020 FY2020 FY2021Actual Actual Budget Estimate Proposed Approved Adopted
Office of the General Manager DivisionOffice of General Manager Department 795,965 687,878 655,035 631,278 676,875Diversity & Transit Equity Department 645,092 1,228,919Internal Audit Department 280,784 248,620 297,845 261,335 310,562
Total Office of the General Manager Division $1,721,841 $2,165,417 $952,880 $892,613 $987,437Chief Operation Officer Division
Office of Chief Operating Officer Department 928,930 780,977 1,024,304Operations Planning & Development Department 1,416,244 1,279,072 1,377,940Business Planning & Asset Management Department 1,197,467 1,137,989 2,764,940Operations Training & Planning Department 8,637,235 8,337,536 8,466,029
Total Chief Operation Officer Division $12,179,876 $11,535,574 $13,633,213Transportation Division
Transportation Administration Department 2,405,540 2,719,885 889,514 916,792 1,091,553Bus Transportation Department 127,399,863 133,707,095 154,288,238 151,898,452 156,261,125Field Operations Department 18,144,068 18,967,046Service Delivery Department 1,647,548 1,681,006 2,340,693 2,642,646 2,391,134Accessible Transportation Programs Department 37,919,475 37,717,269 40,300,623 39,954,290 41,496,663Rail Transportation Department 23,430,185 23,990,155 34,086,365 33,784,565 35,427,667Commuter Rail Department 5,939,868 6,050,894 6,446,052 6,453,351 7,462,864Portland Streetcar Department 15,333,422 16,604,710 17,056,681 17,098,615 18,639,614
Total Transportation Division $232,219,969 $241,438,060 $255,408,166 $252,748,711 $262,770,620Safety & Security Division
Safety & Security Administration Department 585,047 550,276 635,806Safety & Environmental Services Department 3,690,285 3,762,631 3,121,871 2,842,351 3,146,457Security & Emergency Management Department 16,389,475 19,233,132 25,765,163 22,794,377 27,291,813Bus Transporation Training Department 4,213,812 4,431,074Rail Transportation Training Department 1,688,238 1,798,237
Total Safety & Security Division $25,981,810 $29,225,074 $29,472,081 $26,187,004 $31,074,076Maintenance Division
Maintenance Administration Department 1,227,999 614,000 1,570,089Bus Maintenance Department 57,586,009 64,346,536 65,306,804 63,713,661 69,240,615Facilities Management Bus-Rail Department 19,265,257 20,824,982 21,850,932 21,341,341 22,345,609Rail Maintenance Of Way Department 17,311,769 18,165,371 19,168,435 18,519,901 20,788,762Rail Equipment Maintenance Department 40,229,899 45,119,028 47,576,045 44,219,817 46,728,338
Total Maintenance Division $134,392,934 $148,455,917 $155,130,215 $148,408,720 $160,673,413

Requirement Summary
Requirements-3
Division/Department FY2018 FY2019 FY2020 FY2020 FY2021Actual Actual Budget Estimate Proposed Approved Adopted
Information Technology DivisionIT Administration Department 11,106,337 13,427,001 7,390,031 6,199,893 8,107,839IT Operations & Infrastructure Department 3,036,201 3,283,218 3,647,167Information Security Department 587,419 640,909 803,687Enterprise Systems Department 4,965,382 4,768,169 5,094,789Intelligent Transportation Systems Department 2,280,602 2,292,007 2,595,133
Total Information Technology Division $11,106,337 $13,427,001 $18,259,635 $17,184,196 $20,248,615Public Affairs Division
Public Affairs Administration Department 647,097 555,095 1,028,259 898,266 1,190,208Policy & Planning Department 5,418,760 5,207,339 5,480,873 4,774,591 5,377,227GIS & Location Based Services Department 522,755 555,612Transit Equity Inclusion & Community Affairs Department -3,543 2,484,153 2,052,077 3,367,209Government Services and Public Affairs Department 588,749 635,406 1,039,844 939,951 1,004,310Communications & Marketing Department 4,760,805 4,596,676 4,147,802 4,147,176 4,178,362Customer Information Services Department 3,409,251 3,877,235 3,813,407 3,733,374 3,846,117
Total Public Affairs Division $15,343,874 $15,427,363 $17,994,338 $16,545,435 $18,963,433Finance & Administrative Services Division
Finance & Administrative Services Department 509,393 1,094,425 1,133,252 1,014,141 1,194,774Financial Services Department 2,686,174 2,790,921 3,026,711 2,958,703 3,224,395Budget & Grants Administration Department 832,267 1,184,157 1,224,837 1,160,658 1,273,955Risk Management Department 3,593,101 3,706,133 3,982,071 3,932,590 4,343,707Procurement & Supply Chain Management Department 1,721,610 1,685,248 5,437,815 5,154,901 6,251,311Fare Revenue & Administrative Services Department 9,781,837 9,878,254 10,870,273 11,218,857 12,977,737
Total Finance & Administrative Services Division $19,124,382 $20,339,138 $25,674,959 $25,439,850 $29,265,879Labor Relations & Human Resources Division
Human Resources Administration Department 703,203 1,015,387 1,065,997 812,826 1,149,315Benefits & HRIS Department 1,392,918 1,633,452 1,448,888 1,404,665 1,678,709Talent Management Department 1,335,168 1,543,537 1,671,980 1,563,076 2,154,433Labor Relations Department 850,870 939,782 1,062,317 892,973 853,706Compensation Department 425,554 427,827 451,356
Total Labor Relations & Human Resources Division $4,282,159 $5,132,158 $5,674,736 $5,101,367 $6,287,519Legal Services Division
Legal Services Administration Department 2,229,357 2,276,330 1,471,209 1,362,277 1,555,808Litigation Department 942,851 922,602 962,485Real Estate & Transit Oriented Development Department 2,604,364 2,354,645 3,758,815
Total Legal Services Division $2,229,357 $2,276,330 $5,018,424 $4,639,524 $6,277,108

Requirement Summary
Requirements-4
Division/Department FY2018 FY2019 FY2020 FY2020 FY2021Actual Actual Budget Estimate Proposed Approved Adopted
Engineering & Construction DivisionEngineering & Construction Administration Department 583,160 549,712 1,463,430 1,314,657 1,584,199Design and Construction Department 4,031,952 3,834,858 1,570,423 1,094,283 1,836,827Major Projects Department 663,154 470,498 428,049Project Development and Permitting Department 337,388 424,507 314,873
Total Engineering & Construction Division $4,615,112 $4,384,570 $4,034,395 $3,303,945 $4,163,948Other Post Employment Benefits 49,618,949 50,168,488 50,839,019 50,711,719 52,943,200Debt Service 140,494,146 159,664,589 104,556,532 81,429,706 123,096,606Total Operating Requirements $641,130,870 $692,104,105 $685,195,256 $644,128,364 $730,385,067Capital Improvement Program (CIP)
Chief Operating Officer Division 1,139,749 1,139,749 4,026,150Transportation Division 3,879,949 2,794,646 4,093,227 4,158,135 4,138,111Safety & Security Division 13,583,028 4,617,611 9,839,601 11,382,182 5,507,745Maintenance Division 58,618,398 85,577,597 143,296,964 136,964,760 132,257,412Information Technology Division 8,770,527 6,252,473 2,687,776 2,623,579 7,783,749Public Affairs Division 1,934,320 591,559 5,583,669 5,562,504 4,697,749Finance & Administrative Services Division 2,492,734 2,395,210 11,414,650 8,981,657 11,242,192Labor Relations & Human Resources Division 47,500Legal Services Division 233,205 629,815 1,898,267 1,717,472 824,086Engineering & Construction Division 39,605,541 81,789,858 120,489,031 101,819,741 159,226,985
Total Capital Improvement Program (CIP) $129,165,202 $184,648,769 $300,442,934 $274,349,779 $329,704,179Pass Through Revenues & Requirements 4,041,244 4,562,699 14,571,877 13,354,437 11,089,888Regional Fund Exchange Payments 5,459,868 4,786,635 7,688,792 7,688,792 7,706,127Special Payment 5,000,000 5,000,000
Total Other Non-Operating Requirements $9,501,112 $16,444,334 $27,260,669 $26,043,229 $18,796,015Contingency 33,711,552Ending Fund Balance as of June 30*
Restricted Bond Proceeds & Other Restricted 399,336,631 212,029,068 306,210,786 311,888,985 271,762,041Restricted Debt Service 59,291,993 45,426,652 45,500,000 45,500,000 47,500,000Unrestricted Funds 207,823,042 205,468,279 140,251,206 158,428,682 136,735,719
Total Ending Fund Balance $666,451,666 $462,923,999 $491,961,992 $515,817,667 $455,997,760Total Requirements $1,446,248,850 $1,356,121,207 $1,528,880,086 $1,460,339,039 $1,568,594,573
*Budgetary Fund Balance. Restricted funds include funds withdrawn by the Trustee to pay debt sevice, plus bond proceeds and other resources designated for specific projects.Unrestricted funds are resources maintained to cover cash flow until tax and grant revenues are collected.
7,095,000
24,019,235

Requirements by Object Class (Summary of Detail Estimate Sheets)
Requirements-5
Division/Department FY2018 FY2019 FY2020 FY2020 FY2021Actual Actual Budget Estimate Proposed Approved Adopted
Personnel ServicesGeneral Manager 1,409,670 1,543,049 820,380 758,452 853,437Chief Operating Officer 11,327,406 10,638,073 11,357,413Transportation 178,268,625 186,676,015 198,113,182 195,075,307 201,089,220Safety & Security 7,634,395 8,147,359 4,027,633 3,623,753 5,295,576Maintenance 77,865,291 83,010,789 87,761,640 83,546,774 88,221,413Information Technology 6,570,821 8,323,011 10,394,030 10,244,228 12,079,615Public Affairs 7,878,266 8,326,581 9,928,344 9,673,473 10,142,733Finance & Administrative Services 10,545,049 11,507,543 16,573,041 15,819,723 17,880,579Labor Relations & Human Resources 2,955,485 3,828,693 3,919,296 3,686,434 4,079,919Legal Services 2,001,974 2,024,646 2,440,454 2,412,392 2,657,508Engineering & Construction 2,427,266 2,153,349 3,372,395 2,698,638 3,513,848Other Post Employment Benefits 49,555,525 50,024,494 50,539,019 50,503,557 52,743,200
Total Personnel Services $347,112,367 $365,565,529 $399,216,820 $388,680,804 $409,914,461Materials & Services
General Manager 312,171 622,368 132,500 134,161 134,000Chief Operating Officer 852,470 897,501 2,275,800Transportation 53,951,344 54,762,045 57,294,984 57,673,404 61,681,400Safety & Security 18,347,415 21,077,715 25,444,448 22,563,251 25,778,500Maintenance 56,527,643 65,445,128 67,368,575 64,861,946 72,452,000Information Technology 4,535,516 5,103,990 7,865,605 6,939,968 8,169,000Public Affairs 7,465,608 7,100,782 8,065,994 6,871,962 8,820,700Finance & Administrative Services 8,579,333 8,831,595 9,101,918 9,620,127 11,385,300Labor Relations & Human Resources 1,326,674 1,303,465 1,755,440 1,414,933 2,207,600Legal Services 227,383 251,684 2,577,970 2,227,132 3,619,600Engineering & Construction 2,187,846 2,231,221 662,000 605,307 650,100Other Post Employment Benefits 63,424 143,994 300,000 208,162 200,000
Total Materials & Services $153,524,357 $166,873,987 $181,421,904 $174,017,854 $197,374,000
Other RequirementsCapital Improvement Program (CIP) 129,165,202 184,648,769 300,442,934 274,349,779 329,704,179Pass Through/Fund Exchanges/Special Payments 9,501,112 16,444,334 27,260,669 26,043,229 18,796,015Debt Service 140,494,146 159,664,589 104,556,532 81,429,706 123,096,606Contingency 24,019,235 33,711,552
Ending Fund Balance as of June 30*Restricted Bond Proceeds & Other Restricted 399,336,631 212,029,068 306,210,786 311,888,985 271,762,041Restricted Debt Service 59,291,993 45,426,652 45,500,000 45,500,000 47,500,000Unrestricted Funds 207,823,042 205,468,279 140,251,206 158,428,682 136,735,719
Total Ending Fund Balance $666,451,666 $462,923,999 $491,961,992 $515,817,667 $455,997,760Total Requirements $1,446,248,850 $1,356,121,207 $1,528,880,086 $1,460,339,039 $1,568,594,573*Budgetary Fund Balance. Restricted funds include funds withdrawn by the Trustee to pay debt sevice, plus bond proceeds and other resources designated for specific projects.

Personnel Services Schedule
Requirements-6
Budget BudgetExpense Catagory Explanation FY2020 FY2021Earning
Salaries and Wages Base compensation for all non-temporary positions, including training pay, student training cost, and union employee wage premiums based on years of service.
228,305,435 236,004,827
Sick and Vac Payout $322,507 for union sick and vacation/holiday payout; $529,982 for non-union vacation payout. 672,465 852,489
Other Wages Road relief, night & shift differential, incentive pay, tool allowance, time slip differential, extra service pay, premium pay and split shift travel time pay for union employees.
3,345,738 3,406,702
Scheduled Overtime Overtime that has been built into union operator shifts. 10,434,922 10,747,322
Unscheduled Overtime All other overtime except scheduled overtime. 10,296,401 10,803,101
Limited Term Employment Salaries & Wages and fringe benefits for employees hired for 6 months or more, work 20 hours or more per week, and have a predetermined end date.
2,630,568 3,777,454
Unemployment TriMet reimburses the State of Oregon for actual claims paid. 128,116 128,116
Unpaid Absence All excused and unexcused time loss for which employees are not paid. -3,227,474 -3,318,274
Fringe Benefits
Medical and Dental $18,050 average for full-time and part-time union employee; $15,967 average for full-time non-unionemployee; $12,835 average for part-time non-union employee.
58,172,272 59,165,787
Disability and Life Insurance $341 average for full-time union employee; $235 average for part-time union employee; $686 average for full-time and part-time non-union employee.
925,343 862,432
Social Security FICA 7.65% of first $137,700 of salaries and wages; 1.45% thereafter. 19,121,101 19,861,829TriMet Payroll Tax-PRT 0.7787% of gross income. 1,928,009 2,029,831
Pension Expense-Normal Cost*(cost of benefits earned this year)
$7,580 average for union full-time employee; $5,685 average for union part-time employee; 8.0% of gross income for non-union full-time and part-time employee in Defined Benefit Plan; 8.0% of base pay for union full-time, union part-time employee, non-union full-time and non-union part-time employee in Defined Contribution Plan.
23,082,413 21,043,938
Capitalized Labor-Fringe Capitalized labor and fringe reimbursement excluding Other Post Employment Benefits -12,526,293
Workers' Compensation Medical and time loss payments to employees injured in work related accidents. Time loss is paid at 66.7% of average weekly wage not to exceed $1,389.05 per week.
-11,713,5084,576,000 4,332,000
Total Personnel Services** $348,677,801 $357,171,261
*Union defined benefit pension assumes 7% return on investments decreasing to a 6.5% long-term rate over 15 years; non-union defined benefit assumes 6.5%long-term return on investments.
**Total does not include Post Employment Benefit costs of $50,539,019 in FY2020 and $52,743,200 in FY2021. See Post Employment Benefits department for DB pension plan assumptions.

Materials & Services Schedule
Requirements-7
Expense Category Budget Budget Percent Explanation
FY2020 FY2021 ChangeAdverstising/Promotion Media Fees 563,470 367,100 -34.85% One-time-only expenditures removed.Audits 365,000 315,000 -13.70%Banking Charges 1,479,350 2,647,000 78.93% Budget increased to reflect actual expense.Bridge, Tunnel & Highway Expenses 329,600 382,600 16.08%Casualty and Liability Costs 6,718,030 7,996,800 19.03%Contract Maintenance 24,490,644 23,712,400 -3.18%Contracted Dispatch 2,488,170 2,562,800 3.00%Contracted Eligibility Assessment 384,150 392,500 2.17%Custodial Service 2,014,670 1,831,600 -9.09%Dues & Subscriptions 398,920 417,200 4.58%Education & Training 1,375,443 1,317,900 -4.18%Employee Relations & Union Contractual Services 361,500 448,000 23.93% Budget increased to reflect actual expense.Health Benefit Consultant 282,240 253,100 -10.32%Lease Expenses 2,365,790 2,989,200 26.35% Budget increased to reflect actual expense.Legal 412,900 393,500 -4.70%Light Rail Propulsion Power 5,407,200 5,796,300 7.20%Maintenance Materials-Revenue Equipments 19,592,670 20,239,400 3.30%Miscellaneous Expenses 361,900 432,000 19.37%Other Materials & Services 7,650,090 7,496,600 -2.01%Other Services 6,438,124 8,092,600 25.70% Budget increased to reflect actual expense.Portland Streetcar 8,968,620 10,399,200 15.95%Professional & Technical Services 3,342,200 5,788,500 73.19% Increase in consultant services related to grantsPurchased Transportation Service 32,605,440 33,931,600 4.07%Revenue Vehicles - Diesel Fuel 14,448,640 17,513,000 21.21% $2.80/gallon for bus; $2.45/gallon for LIFT and WES.Revenue Vehicles - Oil & Lubricants 1,118,870 1,065,300 -4.79%Revenue Vehicles - Tires 1,478,400 1,437,000 -2.80%Sercurity Services 23,473,448 23,842,400 1.57%Software License Fees 5,326,135 6,951,100 30.51% Increase in software license fees and warranty costs.Temporary Help 445,100 446,200 0.25%Telephone Expense 565,800 582,000 2.86%Tickets, Passes & Fare Media Cards 1,319,700 2,075,000 57.23% Budget increased to reflect actual expenseUniforms 718,500 743,500 3.48%Utilities (Natural Gas, Electricity, Water/Sewer) 4,131,190 4,515,600 9.31%Total Materials & Services* $181,121,904 $197,174,000 8.86%
*Total does not include Other Post Employment Benefit costs of $300,000 in FY2020 and $200,000 in FY2021. See Other Post Employment Benefits department for service contracts for retirement plans.

SUMMARY OF EMPLOYEES
FY2018 FY2019 FY2020
Actual Actual Budget Proposed Approved Adopted
General Manager Division
Non-Union Employees
Full-Time Employees 10.00 3.00 4.00 4.00
Total General Manager Division 10.00 3.00 4.00 4.00
Chief Operating Officer Division
Non-Union Employees
Full-Time Employees 34.00 38.00 40.00
Union Employees
Full-Time Employees 50.00 50.00 50.00
Total Chief Operating Officer Division 84.00 88.00 90.00
Transportation Division
Non-Union Employees
Full-Time Employees 65.00 64.00 65.00 65.00
Limited Term Employees 3.00 1.00 1.00 1.00
Union Employees
Full-Time Employees 1,428.00 1,523.00 1,523.00 1,558.00
Part-Time Employees 252.75 237.75 232.50 238.50
Total Transportation Division 1,748.75 1,825.75 1,821.50 1,862.50
Safety & Security Division
Non-Union Employees
Full-Time Employees 22.00 18.00 22.00 25.00
Limited Term Employees 1.00
Union Employees
Full-Time Employees 44.00 4.00 13.00 21.00
Total Safety & Security Division 66.00 22.00 35.00 47.00
Maintenance Division
Non-Union Employees
Full-Time Employees 87.00 80.00 89.00 96.50
Limited Term Employees 1.00 2.00 1.00 1.00
Union Employees
Full-Time Employees 687.00 682.00 742.00 751.00
Total Maintenance Division 775.00 764.00 832.00 848.50
FY2021
Requirements-8

SUMMARY OF EMPLOYEES
FY2018 FY2019 FY2020
Actual Actual Budget Proposed Approved Adopted
FY2021
Information Technology Division
Non-Union Employees
Full-Time Employees 51.00 68.00 70.00 88.00
Total Information Technology Division 51.00 68.00 70.00 88.00
Public Affairs Division
Non-Union Employees
Full-Time Employees 52.00 60.00 64.00 64.00
Limited Term Employees 5.00 12.00 16.00 14.75
Part-Time Employees 1.00 0.00 0.00 0.80
Union Employees
Full-Time Employees 21.00 21.00 22.00 23.00
Part-Time Employees 5.25 5.25 5.25 8.25
Total Public Affairs Division 84.25 98.25 107.25 110.80
Finance & Administrative Services Division
Non-Union Employees
Full-Time Employees 44.00 54.00 61.00 66.00
Union Employees
Full-Time Employees 53.00 83.00 84.50 88.50
Total Finance & Administrative Services Division 97.00 137.00 145.50 154.50
Labor Relations & Human Resources Division
Non-Union Employees
Full-Time Employees 23.00 18.00 31.00 32.00
Limited Term Employees 1.00
Part-Time Employees 2.00 1.00 0.80 0.80
Total Labor Relations & Human Resources Division 25.00 20.00 31.80 32.80
Legal Services Division
Non-Union Employees
Full-Time Employees 14.00 19.00 20.00 21.00
Limited Term Employees 2.00
Total Legal Services Division 14.00 19.00 20.00 23.00
Engineering & Construction Division
Non-Union Employees
Full-Time Employees 78.00 56.00 66.00 66.00
Limited Term Employees 16.00 16.00 23.00 27.00
Part-Time Employees 2.00 0.00 0.00 0.00
Total Engineering & Construction Division 96.00 72.00 89.00 93.00
Requirements-9

SUMMARY OF EMPLOYEES
FY2018 FY2019 FY2020
Actual Actual Budget Proposed Approved Adopted
FY2021
Operating Program
Non-Union Employees
Full-Time Employees 446.00 474.00 530.00 567.50
Limited Term Employees 25.00 32.00 41.00 46.75
Part-Time Employees 5.00 1.00 0.80 1.60
Total Non Union Employees 476.00 507.00 571.80 615.85
Union Employees
Full-Time Employees 2,233.00 2,363.00 2,434.50 2,491.50
Part-Time Employees 258.00 243.00 237.75 246.75
Total Union Employees 2,491.00 2,606.00 2,672.25 2,738.25
Total Operating Program Employees (1) 2,967.00 3,113.00 3,244.05 3,354.10
(1) Actual number of employees, at any given, time, may vary significantly from these totals due to the nature of some operations.
Requirements-10

SUMMARY OF FIXED ROUTE SERVICE (Hours and Miles)
FY2018 FY2019 FY2020 FY2020 FY2021 % Change % Change % of
Weekly Vehicle Hours Actual Actual Budget Estimate Proposed Budget** Estimate*** Total
Fixed Route
Bus Service 42,782 45,596 44,079 44,071 45,405 3.01% 3.03% 85.59%
Light Rail (Train Hours) 6,415 6,773 6,093 6,093 6,093 0.00% 0.00% 11.49%
Commuter Rail (Train Hours) 107 108 122 122 122 0.00% 0.00% 0.23%
Portland Streetcar (Train Hours)* 1,430 1,430 1,431 1,431 1,431 0.00% 0.00% 2.70%
Fixed Route Total 50,734 53,907 51,725 51,717 53,051 2.56% 2.58% 100.00%
FY2018 FY2019 FY2020 FY2020 FY2021 % Change % Change % of
Weekly Vehicle Miles Actual Actual Budget Estimate Proposed Budget Estimate Total
Fixed Route
Bus Service 481,211 538,975 546,750 550,888 567,563 3.81% 3.03% 74.28%
Light Rail (Car Miles) 179,252 191,847 175,420 196,375 175,420 0.00% -10.67% 22.97%
Commuter Rail (Train Miles) 2,272 2,344 2,307 2,310 2,307 0.00% -0.13% 0.30%
Portland Streetcar (Car Miles)* 18,831 18,831 18,836 18,836 18,836 0.00% 0.00% 2.45%
Fixed Route Total 681,566 751,997 743,313 768,409 764,126 2.80% -0.56% 100.00%
*Streetcar vehicles are owned by the City of Portland, which manages Portland Streetcar service. TriMet furnishes vehicle operators and mechanics to Portland
Streetcar, with costs reimbursed to TriMet by the City of Portland. In addition, TriMet funds approximately 60% of the City of Portland' s net cost (after fares) of
Streetcar operation.
**The % Change Budget is the percentage of change from the prior year Budget amount to the current year Budget amount.
***The % Change Estimate is the percentage of change from the prior year Estimate actual amount to the current year Budget amount and will change once actuals are posted at June 30.
Requirements-11

SUMMARY OF FIXED ROUTE AND ACCESSIBLE TRANSPORTATION VEHICLES
FY2018 FY2019 FY2020 FY2020 FY2021 % Change % Change
Fixed Route Services Actual Actual Budget Estimate Proposed Budget Estimate
Bus Service
Peak Vehicles 561 586 600 589 617 2.83% 4.75%
Total Vehicles 680 709 715 725 725 1.40% 0.00%
Light Rail
Peak Vehicles 116 116 115 116 116 0.87% 0.00%
Total Vehicles 145 145 145 145 145 0.00% 0.00%
Commuter Rail
Peak Vehicles 3 3 4 3 3 -25.00% 0.00%
Total Vehicles 6 6 8 8 8 0.00% 0.00%
Portland Streetcar* . .
Peak Vehicles 14 12 14 14 14 0.00% 0.00%
Total Vehicles 17 17 17 17 17 0.00% 0.00%
FY2018 FY2019 FY2020 FY2020 FY2021 % Change % Change
Accessible Transportation Actual Actual Budget Estimate Proposed Budget Estimate
Peak Vehicles 212 215 225 225 225 0.00% 0.00%
Total Vehicles 268 268 278 278 278 0.00% 0.00%
*Streetcar vehicles are owned by the City of Portland, which manages Portland Streetcar service. TriMet furnishes vehicle operators and mechanics to Portland
Streetcar, with costs reimbursed to TriMet by the City of Portland. In addition, TriMet funds approximately 60% of the City of Portland' s net cost (after fares) of
Streetcar operation.
Requirements-12

Debt Service-1
Summary of Debt Service
Operating FY2018 FY2019 FY2020 FY2021
Actual Actual Budget Estimate Proposed Approved Adopted
2009 Senior Lien Revenue Bonds Series A and B 2,435,445 2,442,836 2,463,769 2,463,769 717,969
2012 Senior Lien Revenue Bonds 2,680,208 2,706,375 3,071,625 3,071,625 3,072,000
2013 Interim Bonds 1) 102,181,934 100,605,896 25,375,000 25,302,082
2015 Revenue Bonds 11,552,416 11,675,244 8,591,325 7,776,008 8,125,700
2016 Revenue Bonds 1,734,288 2,487,523 3,099,925 3,099,925 3,104,775
2017 Revenue Bonds 5,007,437 5,694,700 6,731,063 6,731,063 6,731,588
2018 Payroll Bonds -Sr Lien 168,211 6,077,451 8,493,950 8,493,950 8,630,150
2020 Payroll Bonds - Sr Lien Principal 710,000
2020 Payroll Bonds - Sr Lien Interest 4,700,000 2,944,750 7,458,949
2020 Payroll Bonds - Sr Lien Bond Issuance Cost 450,000 450,000
2021 Senior Lien Revenue Bonds 2,000,000
2005 Lease Leaseback 865,175
2011 Capital Grant Receipt Bonds 2) 10,967,099 11,069,403 11,714,700 11,714,700 11,680,000
2017 Capital Grant Bonds 2,075,417 2,487,357 3,800,750 3,800,750 3,800,750
2018 Capital Grant Bonds 2) 1,688,833 4,175,103 5,244,425 5,244,425 5,629,550
Bank Line of Credit 10,021,778 20,700,000 46,250 60,000,000
Bond Issuance Costs and Misc 2,858 220,923 120,000 740,409 120,000
Total Debt Service $140,494,146 $159,664,589 $104,556,532 $81,429,706 $123,096,606
Refunding FY2018 FY2019 FY2020 FY2021
Actual Actual Budget Estimate Proposed Approved Adopted2015 Revenue Bonds Refunding Escrow Deposit 3) $49,480,917
1) 2013 Portland-Milwaukie Light Rail Project interim financing issuance costs.
2) Includes capitalized interest payment. Bond proceeds to pay capitalized interest are in Beginning Fund Balance.
3) A portion of the outstanding 2015 revenue bonds were refunded in FY20 through the 2019 senior lien issuance; the escrow deposit is not subject to budget limitations.

Summary of Debt Service Principle and Interest
Debt Service-2
Principal
2009 Senior Lien Revenue Bonds Series A and B
2011 Capital Grant Receipt Bonds 10,850,000
2012 Senior Lien Revenue Bonds 2,725,000
2015 Revenue Bonds 5,115,000
2016 Revenue Bonds 380,000
2017 Revenue Bonds 2,450,000
2017 Capital Grant Bonds
2018 Capital Grant Bonds 395,000
2018 Payroll Bonds -Sr Lien 1,620,000
2020 Payroll Bonds - Sr Lien Interest 710,000
2021 Senior Lien Revenue Bonds
2005 Lease Leaseback 865,175
Bank Line of Credit 60,000,000
2020 Payroll Bonds - Sr Lien Bond Issuance Cost
Bond Issuance Costs and Misc
FY2021 Total Debt Service $85,110,175
Interest Total
717,969 717,969
830,000 11,680,000
347,000 3,072,000
3,010,700 8,125,700
2,724,775 3,104,775
4,281,588 6,731,588
3,800,750 3,800,750
5,234,550 5,629,550
7,010,150 8,630,150
7,458,949 8,168,949
2,000,000 2,000,000
865,175
60,000,000
450,000 450,000
120,000 120,000
$37,986,431 $123,096,606

TriMet Continuing Revenues and Calculation of Payroll Tax Debt Service Ratio
Debt Service-3
Revenue Category FY2018 FY2019 FY2020 FY2020 FY2021Actual Actual Budget Estimate Proposed Approved Adopted
Operating RevenuePassenger 113,836,174 106,832,388 110,000,000 102,500,000 109,500,000Transit Advertising 3,678,750 3,741,830 3,854,000 3,752,500 3,865,100Accessible Transportation Contract (see Note 1) 7,607,217 8,061,672 8,095,000 8,954,000 8,954,000Service Contracts (see Note 2) 7,992,687 8,574,236 8,985,285 8,574,000 8,574,000
Total Operating Revenue $133,114,828 $127,210,126 $130,934,285 $123,780,500 $130,893,100Tax Revenue
Payroll Tax Rev-Employer 340,352,473 354,486,790 389,650,000 378,808,384 410,187,000Payroll Tax Rev-Self Empl 16,627,433 16,254,850 19,495,000 16,378,458 17,144,000Payroll Tax Rev-State In-Lieu 2,063,285 2,009,113 2,265,000 2,230,108 2,352,000
Total Tax Revenue $359,043,191 $372,750,753 $411,410,000 $397,416,950 $429,683,000Other Revenue
Federal Operating Grants (see Note 3) 96,030,443 74,771,164 69,291,081 67,739,072 70,524,142State STIF-Formula 16,227,000 10,897,300 19,206,024State Operating Grants (see Note 4) 1,509,381 1,111,897 850,297 850,297 1,527,953Interest 5,972,142 14,489,668 1,450,000 2,600,000 2,613,000Miscellaneous 5,210,745 8,611,489 6,210,000 12,185,300 6,486,400
Total Other Revenue $108,722,711 $98,984,218 $94,028,378 $94,271,969 $100,357,519
Net Contiuing Resources* $600,880,730 $598,945,097 $636,372,663 $615,469,419 $660,933,619
Debt Service on Senior Lien Bonds $29,527,047 $31,690,026 $38,096,657 $35,828,967 $41,986,306Senior Lien Debt Service as a Percent of Net Continuing Revenues 4.9% 5.3% 6.0% 5.8% 6.4%
* Net Continuing Revenues exclude :1) Surface Transportation Block Grant Program/Congestion, Mitigation & Air Quality grant funds pledged to TriMet by Metro to support grant receipt bonds2) Other state and federal grant revenues legally required to be used for an intended purpose (Homeland Security, Regional Transportation Option (RTO) Program and Regional Fund Exchanges),
and a portion of State STIF-Formula revenue
Notes:1) Revenue offset rides provided by LIFT.2) Streetcar personnel revenue and CTRAN revenues.3) Federal Section 5307 Urbanized Area Formula Funds and Federal Section 5337 State of Good Repair Funds.4) Contracted Accessibility Services - State 5310, State 5310 Formula Funds, STF Formula Funds.

Debt Service-4
[This Page Left Intentionally Blank]

Other Post Employment Benefits
OPEB-1
FY2018 FY2019 FY2020 FY2021
Other Post Employment Benefits Explanation Actual Actual Budget Estimate Proposed Approved Adopted
Union (note 1)
Pension UAAL Expense (note 2) Current year portion of 15 years funding of UAAL 25,008,181 25,004,359 25,000,000 26,880,338 30,500,000
Retiree Life Insurance Retiree Life Insurance Premiums 414,310 439,174 453,449 455,221 477,900
Retiree Medical/Medicare/Dental Post Employment Medical/Dental Benefits 15,389,883 15,611,005 16,227,482 16,182,276 17,671,700
Medicare Part B Post Employment Medicare Part B Benefit (4) 2,333,042 2,675,407 2,950,397 2,903,659 3,403,300Total Union $43,145,416 $43,729,945 $44,631,328 $46,421,494 $52,052,900
Non-Union
Pension UAAL Expense (note 3) Current year portion of 10 years funding of UAAL 5,498,557 5,495,885 5,500,000 3,406,852
Retiree Life Insurance Premiums Retiree Life Insurance Premiums 58,009 63,779 68,429 67,369 74,600
Retiree Medical/Medicare/Dental Post Employment Medical/Dental Benefits 2,016,793 2,111,251 2,204,236 2,143,326 2,390,500Total Non-Union $7,573,359 $7,670,915 $7,772,665 $5,617,547 $2,465,100
Professional & Technical Service contracts for retirement plans 63,424 143,994 300,000 208,162 200,000 Capitalized Fringe Capital grant fringe reimbursement -1,163,250 -1,376,366 -1,864,974 -1,535,484 -1,774,800Total Other Post Employment Benefits $49,618,949 $50,168,488 $50,839,019 $50,711,719 $52,943,200
Pension Expense-Normal Cost (cost of benefits earned this year) is incorporated in departmental costs.
Notes:1. Union retiree/disabled medical assumes current Working & Wage Agreement.2. Pension assumptions: union defined benefit pension unfunded liability funded over 15 years (or until fully funded) beginning with FY2014.3. Penions assumptions: non-union defined benefit pension unfunded liability funded over 10 years (or until fully funded) beginning with FY2014.4. Union non-active employees, retirees, spouses, surviving spouses and dependents having enrolled in Medicare and a TriMet sponsored Medicare Advantage plan will be
reimbused by the District the actual cost of the Medicare Part B monthly premium.

OPEB-2
[This Page Left Intentionally Blank]

GM-1
OFFICE OF THE GENERAL MANAGER DIVISION
Summary FY2018 FY2019 FY2020 FY2021
Actual Actual Budget Estimate Proposed Approved Adopted
Personnel Services 1,409,670 1,543,049 820,380 758,452 853,437Materials & Services 312,171 622,368 132,500 134,161 134,000
Total $1,721,841 $2,165,417 $952,880 $892,613 $987,437
General Manager Division PageDivision Summary ....................................................................................... GM-1Office of the General Manger ...................................................................... GM-2Diversity and Transit Equity ........................................................................ GM-6Internal Audit ............................................................................................... GM-9

GM-2
Office of General Manager Department
Summary FY2018 FY2019 FY2020 FY2021
Actual Actual Budget Estimate Proposed Approved Adopted
Personnel Services 674,602 591,573 524,035 498,897 544,375
Materials & Services 121,363 96,305 131,000 132,381 132,500
Total $795,965 $687,878 $655,035 $631,278 $676,875
Responsibilities: Business Plan:The Office of the General Manager is under the direct authority of the Board The OGM ensures agency goals are on track and in line of Directors. The General Manager is appointed by the Board and is charged with all goals and objectives of the Business Plan.with Managing the agency. TriMet is governed by a seven-member Board of Directors. The Board sets agency policy, enacts legislation and reviews Performance Measures:certain contracts. 1) Approval rating at or above 80% Attitude & Awareness Survey.
2) All Board objectives for General Manager completed FY2021.Goals & Objectives: 3) GM objectives to increase executive diversity are met.1) Keep the Board fully informed to make decisions that advance TriMet's 4) 50% or more of key positions included in succession plans have
vision, mission, values and fiscal stability. candidates identified as "ready now" or "ready soon" FY2021.2) Set and lead strategic direction.3) Build and establish external and internal partnerships.

GM-3
Office of General Manager Department-Personnel Services
Expense Category FY2018 FY2019 FY2020 FY2020 FY2021
Actual Actual Budget Estimate Budget
Labor 267,690 464,469 407,691 406,116 428,659
Fringe 406,912 127,104 116,344 92,781 115,716
Total $674,602 $591,573 $524,035 $498,897 $544,375

Office of General Manager Department-Personnel Profile
Position Title Total FTE Base Salary Expense Grade Min Max
General Manager 1.00 313,425 30 269,614 404,424
Executive Assistant, Senior (GM & Board) 1.00 88,026 13 66,884 100,327
Total 2.00 401,451
GM-4

GM-5
Office of General Manager Department-Materials & Services
Expense Category FY2018 FY2019 FY2020 FY2020 FY2021
Actual Actual Budget Estimate Budget
Legal 9,596 3,813
Audits 19,450 -22,250
Professional & Technical-Gen & Adm 3,000 1,500 3,000
Other Services- Gen & Adm 5,900 713 4,000 2,032 4,000
Office Supplies 4,690 6,868 5,000 3,191 5,100
Other Materials- Gen & Adm 5,390 2,248 9,000 4,575 9,100
Unreconciled Mastercard Expense 16,834
Telephone 927 269 1,000 618 1,000
NU-Dues & Subscriptions 7,610 1,000 5,736 1,000
NU-Local Travel & Meetings 9,102 8,758 9,000 7,010 9,100
NU-Education & Training - Gen & Adm 1,211 1,577 9,000 17,545 9,100
NU-Out-Of-Town Travel 21,179 22,538 35,000 25,309 35,400
Official Meeting Expense 26,583 51,559 40,000 37,585 40,400
Board Recognition 8,928 905 5,000 5,302 5,100
Employee Development 1,353 6,311 5,000 2,500 5,100
Employee Recognition 4,079 5,386 5,000 2,644 5,100
Awards & Banquets 2,975
Total $121,363 $96,305 $131,000 $132,381 $132,500

GM-6
Diversity & Transit Equity Department
Summary FY2018 FY2019 FY2020 FY2021
Actual Actual Budget Estimate Proposed Approved Adopted
Personnel Services 459,613 711,085
Materials & Services 185,479 517,834
Total $645,092 $1,228,919

GM-7
Diversity & Transit Equity Department-Personnel Services
Expense Category FY2018 FY2019 FY2020 FY2020 FY2021
Actual Actual Budget Estimate Budget
Labor 322,075 533,560
Fringe 138,372 231,995
Capitalized Labor-Fringe -834 -54,470
Total $459,613 $711,085

GM-8
Diversity & Transit Equity Department-Materials & Services
Expense Category FY2018 FY2019 FY2020 FY2020 FY2021
Actual Actual Budget Estimate Budget
First Step Youth 81,500 80,000
Other Services- Gen & Adm 38,790 336,677
Other Materials- Gen & Adm 2,407 1,100
Community Outreach 44,413 61,750
Telephone 3,371 5,564
NU-Dues & Subscriptions 500 6,910
NU-Local Travel & Meetings 1,735 5,028
NU-Education & Training - Gen & Adm 6,376 9,206
NU-Out-Of-Town Travel 6,387 11,599
Total $185,479 $517,834

GM-9
Internal Audit Department
Summary FY2018 FY2019 FY2020 FY2021
Actual Actual Budget Estimate Proposed Approved Adopted
Personnel Services 275,455 240,391 296,345 259,555 309,062Materials & Services 5,329 8,229 1,500 1,780 1,500
Total $280,784 $248,620 $297,845 $261,335 $310,562
Responsibilities: Business Plan:The Internal Audit Department performs audits and provides advisory services Internal Business Practicesto give the District reasonable assurance that its control objectives are met. Goal #1 Deliver Safe, efficient, and Equitable ServiceThe key control objectives are: Objective #13 Increase personal safety
People & InnovationGoals & Objectives: Goal #2 TriMet is Where Diverse and Talented People 1) Safeguarding and proper maintenance of assets. Want to Come, Stay, and Thrive2) Compliance with laws, regulations, contracts, plans, policies and procedures. Objective #28 Foster sense of community and cross-functional 3) Reliability and integrity of financial and operating information. camaraderie.4) Economical and efficient use of resources. Financial5) Risk assessments to mitigate exposure. Goal #2 Fiscally sound and compliant
Objective #33 Manage financial performance within Strategic Financial Plan guidelines
Performance Measures:1) Complete the projects identified in the Internal Audit's
Annual Plan.2) Realize the improvement goals specified in the Annual Plan.

GM-10
Internal Audit Department-Personnel Services
Expense Category FY2018 FY2019 FY2020 FY2020 FY2021
Actual Actual Budget Estimate Budget
Labor 198,140 189,132 212,466 193,303 228,384
Fringe 77,315 68,310 83,879 66,252 80,678
Capitalized Labor-Fringe -17,051
Total $275,455 $240,391 $296,345 $259,555 $309,062

Internal Audit Department-Personnel Profile
Position Title Total FTE Base Salary Expense Grade Min Max
Manager, Internal Audit 1.00 137,384 18 102,080 153,120
Internal Auditor, Senior 1.00 91,000 15 79,406 119,110
Total 2.00 228,384
GM-11

GM-12
Internal Audit Department-Materials & Services
Expense Category FY2018 FY2019 FY2020 FY2020 FY2021
Actual Actual Budget Estimate Budget
Other Services- Gen & Adm 404 602 1,500 792 1,500
Other Materials- Gen & Adm 76 36
Telephone 116 106 57
NU-Dues & Subscriptions 725 1,573 640
NU-Local Travel & Meetings 20
NU-Education & Training - Gen & Adm 4,084 2,629 255
NU-Out-Of-Town Travel 3,223
Total $5,329 $8,229 $1,500 $1,780 $1,500

CO-1
CHIEF OPERATING OFFICER DIVISION
Summary FY2018 FY2019 FY2020 FY2021
Actual Actual Budget Estimate Proposed Approved Adopted
Personnel Services 11,327,406 10,638,073 11,357,413Materials & Services 852,470 897,501 2,275,800
Total $12,179,876 $11,535,574 $13,633,213
Chief Operating Officer Division PageDivision Summary ...................................................................................... CO-1Office of the Chief Operating Officer ......................................................... CO-2Operations Planning & Development .......................................................... CO-6Business Planning & Asset Management .................................................... CO-10Operations Training & Planning .................................................................. CO-14

CO-2
Office of Chief Operating Officer Department
Summary FY2018 FY2019 FY2020 FY2021
Actual Actual Budget Estimate Proposed Approved Adopted
Personnel Services 531,510 455,332 549,804Materials & Services 397,420 325,645 474,500
Total $928,930 $780,977 $1,024,304
Responsibilities: Performance Measures:The Chief Operating Officer Division is responsible for directing the overall 1) On-time performance. Bus 83.8% or better for the year. MAX on-timestrategy and management of the Transportation, Maintenance, Safety and performance 88% or better for the year.Security and Information Technology Divisions as well as Operations Planning 2) Personal safety. Rate of passenger injuries below Business Plan target.& Development, Business Planning & Asset Management and Operations Employee injury rates lower than previous year.Training & Planning. 3) Asset management. Complete inventory and condition assessments on-time
Meet milesstones for Enterprise Asset Management System (EAMS)Goals & Objectives: procurement and implementation.1) Maintain on-time performance at or above tragets.2) Increase personal safety for riders and employees.3) Enhance asset management practices for safety and reliability.
Business Plan:Customers Category Goal #1 Safisfied Riders Objective #1 Provide safe serviceInternal Business Practices Category Goal #1 Deliver Safe, Efficient, and Equitable Service Objective #15 Provide reliable performance Objective #17 Ensure cost-effective servicePeople & Innovation Category Goal #2 TriMet is Where Diverse and Talented People Want to Come, Stay & Thrive Objective #33 Recruit a talented workforce

CO-3
Office of Chief Operating Officer Department-Personnel Services
Expense Category FY2018 FY2019 FY2020 FY2020 FY2021
Actual Actual Budget Estimate Budget
Labor 421,071 362,855 437,130
Fringe 110,439 92,477 112,674Total $531,510 $455,332 $549,804

Office of Chief Operating Officer Department-Personnel Profile
Position Title Total FTE Base Salary Expense Grade Min Max
Chief Operating Officer 1.00 225,689 26 192,765 289,147
Executive Administrative Assistant 1.00 66,165 11 56,173 84,261
Total 2.00 291,854
CO-4

CO-5
Office of Chief Operating Officer Department-Materials & Services
Expense Category FY2018 FY2019 FY2020 FY2020 FY2021
Actual Actual Budget Estimate Budget
Legal 10,000 42,795 11,100
Professional & Technical-Gen & Adm 110,000 68,982 114,100
Temporary Help-Gen & Adm 5,500 2,750 6,000
Other Services- Gen & Adm 10,500 8,268 14,000
Office Supplies 6,600 3,609 20,000
Other Materials- Gen & Adm 6,000 3,075 9,000
Telephone 27,900 21,647 35,000
NU-Dues & Subscriptions 7,400 4,143 74,100
NU-APTA & OTA Dues 139,520 116,010 92,500
NU-Local Travel & Meetings 6,000 3,063 26,700
NU-Education & Training - Gen & Adm 11,000 8,075 25,000
NU-Out-Of-Town Travel 50,000 39,448 40,000
Employee Recognition 7,000 3,780 7,000
Total $397,420 $325,645 $474,500

CO-6
Operations Planning & Development Department
Summary FY2018 FY2019 FY2020 FY2021
Actual Actual Budget Estimate Proposed Approved Adopted
Personnel Services 1,378,644 1,243,277 1,339,940Materials & Services 37,600 35,795 38,000
Total $1,416,244 $1,279,072 $1,377,940
Responsibilities: Business Plan:The Operations Planning & Development Department is responsible for Financial Category budgeting, planning for future services, and analysis and reporting for Goal #1 Fiscally Sound and Compliant operations including the Chief Operating Officer, Transportation, and Objective #36 Manage financial performance within Strategic Maintenance divisions. Financial Plan guidelines
Internal Business Practices Category Goals & Objectives: Goal #1 Deliver Safe, Efficient, and Equitable Service1) Direct operations planning and innovations for future growth and changes. Objective #15 Provide reliable performance2) Facilitate operations coordination and data-driven decision making to Objective #16 Improve service delivery
achieve operations excellence. Goal #3 Business Practices that Create Value and Spur Innovation and 3) Lead advances toward a cohesive and user friendly business intelligence Continuous Improvement
model. Objective #25 Develop and pursue strategic partnerships to optimize and innovate practices and processes
Performance Measures:
1) Operations plans for new transit services and annual operations budgetcompleted on schedule to meet state and federal requirements.
2) Successful implementation cross-departmental initiatives to improveoperations processes.
3) Timely reporting of service performance and ridership data andanalysis to support operations improvements.

CO-7
Operations Planning & Development Department-Personnel Services
Expense Category FY2018 FY2019 FY2020 FY2020 FY2021
Actual Actual Budget Estimate Budget
Labor 1,020,112 960,063 1,026,505
Fringe 358,532 318,182 313,435Capitalized Labor-Fringe -34,968
Total $1,378,644 $1,243,277 $1,339,940

Operations Planning & Development Department-Personnel Profile
Position Title Total FTE Base Salary Expense Grade Min Max
Director, Operations Planning & Development 1.00 158,227 20 120,234 180,349
Manager, Rail Operations Planning 1.00 122,897 16 86,398 129,597
Manager, Service Performance & Analysis 1.00 97,675 16 86,398 129,597
Analyst, Operations 5.00 388,106 13 66,884 100,327
Business Process Analyst 1.00 107,842 16 86,398 129,597
Analyst, Senior Operations & Finance Planning 1.00 94,246 15 79,406 119,110
Assistant, Senior Administrative 1.00 57,512 9 47,037 70,555
Total 11.00 1,026,505
CO-8

CO-9
Operations Planning & Development Department-Materials & Services
Expense Category FY2018 FY2019 FY2020 FY2020 FY2021
Actual Actual Budget Estimate Budget
Legal 18,000 25,164 18,200
Professional & Technical-Gen & Adm 10,000 5,000 10,100
Other Services- Gen & Adm 5,500 2,765 5,600
Other Materials- Gen & Adm 4,100 2,866 4,100
Total $37,600 $35,795 $38,000

CO-10
Business Planning & Asset Management Department
Summary FY2018 FY2019 FY2020 FY2021
Actual Actual Budget Estimate Proposed Approved Adopted
Personnel Services 911,717 900,112 1,058,640Materials & Services 285,750 237,877 1,706,300
Total $1,197,467 $1,137,989 $2,764,940
Responsibilities: Business Plan:The Business Planning & Asset Management Department, which includes the Mobility & Customers CategoryLocation-Based Services group, is responsible for updating, and managing TriMet's Goal #1 Safisfied RidersBusiness Plan, including Goals, Objectives, Measures, Targets. Key Strategic Actions. Objective #5 Improve customer information and servicesCollaborating across divisions and departments to advance Asset Management capabilities, Internal Business Practices Categorypractices, and systems at TriMet. Developing strategic plan for Mobility services, including Goal #3 Business practices that create value and spur implementation of Mobility as a Service (MaaS) solutions. Manage Location-Based innovation and continuous improvement
Services, the Geographic Information System (GIS) program, and the e-survey Objective #25 Develop and pursue strategic partnerships program in support of agency-wide initiatives. to optimize and innovate practices and processes
Financial CategoryGoals & Objectives: Goal #2 Manage assets to ensure safety and optimize value,1) Develop and publish annual Business Plan update on schedule for each fiscal year. performance, and resiliency2) Deliver FTA-compliant inventory and condition assessment in time for annual. Objective #37 Meet or exceed state of good repair
budget cycle. targets for all identified asset classes3) Develop a Mobility Services Strategic Plan, MaaS platform, and a plan- book-pay software solution. Performance Measures:
1) Business Plan completed on time for each fiscal year.2) FTA-compliant inventory delivered to Finance on time each
fiscal year.3) Complete Mobility Services Strategic Plan.

CO-11
Business Planning & Asset Management Department-Personnel Services
Expense Category FY2018 FY2019 FY2020 FY2020 FY2021
Actual Actual Budget Estimate Budget
Labor 664,295 674,281 794,384
Fringe 247,422 225,831 264,256
Total $911,717 $900,112 $1,058,640

Business Planning & Asset Management Department-Personnel Profile
Position Title Total FTE Base Salary Expense Grade Min Max
Director, Business Planning and Asset Management 1.00 167,960 21 130,346 195,520
Analyst, Bus Stops Planner 1.00 79,847 12 61,321 91,980
Analyst, Business Planning & Asset Management 1.00 82,144 12 61,321 91,980
Analyst, GIS Data 2.00 143,008 12 61,321 91,980
Analyst, IT Systems 1.00 99,258 15 79,406 119,110
Electronic Survey Developer & Analyst 1.00 84,795 14 72,900 109,351
Manager, Mobility & Location-Based Services 1.00 137,373 19 110,833 166,251
Total 8.00 794,385
CO-12

CO-13
Business Planning & Asset Management Department-Materials & Services
Expense Category FY2018 FY2019 FY2020 FY2020 FY2021
Actual Actual Budget Estimate Budget
Professional & Technical-Gen & Adm 150,000 113,764 1,664,600
Other Services- Gen & Adm 131,300 121,863 16,500
Other Materials- Gen & Adm 4,450 2,250 3,500
NU-Out-Of-Town Travel 21,700
Total $285,750 $237,877 $1,706,300

CO-14
Operations Training & Planning Department
Summary FY2018 FY2019 FY2020 FY2021
Actual Actual Budget Estimate Proposed Approved Adopted
Personnel Services 8,505,535 8,039,352 8,409,029Materials & Services 131,700 298,184 57,000
Total $8,637,235 $8,337,536 $8,466,029
Responsibilities: Performance Measures:The Operations Training & Planning department is responsible for 1) Collaborate with BOLI and internal stakeholders to determine strategies tomanaging all aspects of the Districts' in-house Transportation and reduce overall cost of current apprenticeship programs and recurrent trainingMaintenance training for both union/non-union staff, and State of Oregon needs within Maintenance.Apprenticeship Programs. In addition, enforces the District's Safety 2) Review possibilities of bringing in a younger demographic for early entry levelManagement Systems(SMS) by establishing and implementating industry positions to fill future maintenance apprenticeship/training programsstandards and other current practices that demostrate safety as priority 3) Increase the use of e-learning platforms to enhance training onto all shift andand fundamental value. shop locations District wide.
4) Target at least 4% training and development costs as a percentage of payroll forGoals & Objectives: our target training audience.1) Provide quality, cost-effective, and value-added training designed to 5) Continue partnership with TriMet's HR Department by expanding our outreach
increase employee and organizational safety and productivity. efforts to community based organizations such as community colleges, Women2) Provide development opportunities that enhance knowledge, develop in Trades, veteran organizations and more.
skills, and enrich our organization.3) Support and leverage technology and/or tools to improve our
Transportation Maintenance Departments' safety and efficiency.4) Promote an organizational environment that values diversity, development,
and growth opportunities for transportation and maintenance employees.
Business Plan:Customers Category Goal #1 Safisfied Riders Objective #1 Provide safe serviceInternal Business Practices Category Goal #1 Deliver Safe, Efficient, and Equitable Service Objective #15 Provide reliable performance Objective #17 Ensure cost-effective servicePeople & Innovation Category Goal #2 TriMet is Where Diverse and Talented People Want to Come, Stay & Thrive Objective #29 Invest wisely in people Objective #33 Recruit a talented workforce

CO-15
Operations Training & Planning Department-Personnel Services
Expense Category FY2018 FY2019 FY2020 FY2020 FY2021
Actual Actual Budget Estimate Budget
Labor 5,948,880 5,715,335 6,047,158
Fringe 2,556,655 2,332,607 2,361,871Capitalized Labor-Fringe -8,590
Total $8,505,535 $8,039,352 $8,409,029

Operations Training & Planning-Personnel Profile
Position Title Total FTE Base Salary Expense Grade Min Max
Coordinator, Training and Development 1.00 69,000 11 56,173 84,261
Director, Operational Training and Development 1.00 136,000 20 120,234 180,349
Sr. Manager, Training 1.00 110,000 18 102,080 153,120
Manager, Bus Operator Training 1.00 95,298 15 79,406 119,110
Assistant Manager, Transportation Training 1.00 76,987 14 72,900 109,351
Assistant, Operations Training 1.00 53,435 7 39,262 58,894
Specialist, Operations 2.00 125,736 9 47,037 70,555
Supervisor, Training Field Operations 3.00 238,888 0840 64,418 85,883
Training Supervisor 27.00 2,245,477 0832 61,360 81,806
Assistant Manager, Rail Operations Training 1.00 83,416 14 72,900 109,351
Training Supervisor Rail 12.00 985,005 0775 61,360 81,806
Supervisor, Maintenance Training 3.00 278,226 14 72,900 109,351
Maintenance Trainer 8.00 663,395 0918 79,830 79,830
Assistant, Senior Administrative 1.00 61,048 9 47,037 70,555
Manager, Maintenance Training 1.00 106,628 16 86,398 129,597
Supervisor, Engineering Training 5.00 435,896 13 66,884 100,327
Total 69.00 5,764,435
CO-16

CO-17
Operations Training & Planning Department-Materials & Services
Expense Category FY2018 FY2019 FY2020 FY2020 FY2021
Actual Actual Budget Estimate Budget
Temporary Help-Trans Adm 5,000 2,500 5,100
Other Services- Gen & Adm 2,500 1,380 2,500
Other Services-Transp Adm 4,500 12,758 4,500
Uniforms- Rev Veh Op 25,500 20,928 25,800
Office Supplies 9,000 7,227
Other Materials- Gen & Adm 4,500 7,280 4,500
Other Materials- Transp Adm 4,500 8,570 4,500
Unreconciled Mastercard Expense 3,405
Computer Equip under $5,000 10,000 8,352 10,100
UN-Oper Training Materials_A5049501 47,957
Telephone 8,000 19,197
NU-Local Travel & Meetings 12,000 6,000
UN-Local Travel & Meetings 2,500 1,250
NU-Education & Training - Gen & Adm 17,700 138,176
NU-Out-Of-Town Travel 23,000 11,500
UN-Education & Training - Gen & Adm 48
Operator Roadeo 3,000 1,656
Total $131,700 $298,184 $57,000

CO-18
[This Page Left Intentionally Blank]

TR-1
TRANSPORTATION DIVISION
Summary FY2018 FY2019 FY2020 FY2021
Actual Actual Budget Estimate Proposed Approved Adopted
Personnel Services 178,268,625 186,676,015 198,113,182 195,075,307 201,089,220
Materials & Services 53,951,344 54,762,045 57,294,984 57,673,404 61,681,400
Total $232,219,969 $241,438,060 $255,408,166 $252,748,711 $262,770,620
Transportation Division Summary PageDivision Summary ..................................................................................... TR-1Transportation Administration ................................................................... TR-2Bus Transportation ..................................................................................... TR-6Field Operations ........................................................................................ TR-10Service Delivery ......................................................................................... TR-13Accessible Transportation Programs ......................................................... TR-17Rail Transportation .................................................................................... TR-22Commuter Rail .......................................................................................... TR-26Portland Streetcar ...................................................................................... TR-31

TR-2
Transportation Department
Summary FY2018 FY2019 FY2020 FY2021
Actual Actual Budget Estimate Proposed Approved Adopted
Personnel Services 1,579,752 1,882,668 574,064 556,363 707,653
Materials & Services 825,788 837,217 315,450 360,429 383,900
Total $2,405,540 $2,719,885 $889,514 $916,792 $1,091,553
Responsibility: Business Plan:The Transportation Administration Division is responsible for the following Internal Business Practice functions: Bus Operations, Accessible Transportation Programs - LIFT, Goal 1: Deliver Safe, Efficient, and Equitable ServiceCommuter Rail Operations, Operations Command Center, Rail Operations, Objective #14 Increase personal safety Service Delivery, and Portland Streetcar Operations. Objective #15 Provide reliable performance
Objective #17 Ensure cost effective serviceGoals & Objectives: Objective #18 Increase resiliency1) Oversee actions to reduce employee injuries. Customer2) Oversee actions to improve on-time performance. Goal #1: Satisfied Riders3) Oversee actions to increase customer satisfaction. Objective #3 Improve overall customer experience
Goal 2: Satisfied Community Stakeholders and Employers Objective #10 Advance mobility for those with limited optionsPeople & Innovation Goal 3: Foster Service Excellence and Innovation Objective #35 Foster employee innovation
Performance Measures:1) Employee injuries per 200,000 hours.2) Pullout/In-service on-time performance/Lost trips.3) Complaints/Commendations per 100,000 boardings.

TR-3
Transportation Department-Personnel Services
Expense Category FY2018 FY2019 FY2020 FY2020 FY2021
Actual Actual Budget Estimate Budget
Labor 1,109,136 1,417,366 486,011 388,005 538,743
Fringe 528,681 512,766 88,053 168,358 168,910
Capitalized Labor-Fringe -58,065 -47,464
Total $1,579,752 $1,882,668 $574,064 $556,363 $707,653

Transportation Administration Department-Personnel Profile
Position Title Total FTE Base Salary Expense Grade Min Max
Executive Director, Transportation 1.00 200,230 23 152,812 229,219
Administrative Assistant, Executive 1.00 73,133 11 56,173 84,261
Total 2.00 273,363
TR-4

TR-5
Transportation Department-Materials & Services
Expense Category FY2018 FY2019 FY2020 FY2020 FY2021
Actual Actual Budget Estimate Budget
Legal 63,664 178,847 14,520
Professional & Technical-Gen & Adm 173,406 87,100 56,600 29,423 116,100
DOTS Renewal Medical Svcs 172,029 165,848 92,000 52,364 92,900
Temporary Help-Trans Adm 18,100
Other Services- Gen & Adm 157,895 68,624 20,500 26,952 20,700
Uniforms - Veh Ops 388
Office Supplies 4,278 1,792 3,250 11,923 23,500
Winter Supplies-Snow & Ice Impl 15,200
Equip/Furn < $5,000-Fac/Eq Maint 7,584 579
Other Materials- Gen & Adm 29,207 58,146 6,000 23,848 6,100
Unreconciled Mastercard Expense 165
Telephone 5,672 10,860 61,000 83,619 61,600
NU-Dues & Subscriptions 5,846 -1,505
NU-APTA & OTA Dues 149,651 143,841 25,772
NU-Local Travel & Meetings 1,219 1,035 900 1,279 900
NU-Education & Training - Gen & Adm 22,284 15,554 52,700 33,120 5,000
NU-Out-Of-Town Travel 21,691 35,423 6,500 32,578 7,600
Employee Recognition 10,974 19,349 16,000 9,850 16,200
Awards & Banquets 51,724 15,016
Total $825,788 $837,217 $315,450 $360,429 $383,900

TR-6
Bus Transportation Department
Summary FY2018 FY2019 FY2020 FY2021
Actual Actual Budget Estimate Proposed Approved Adopted
Personnel Services 124,807,932 131,203,172 150,476,888 147,346,000 153,058,225
Materials & Services 2,591,931 2,503,923 3,811,350 4,552,452 3,202,900
Total $127,399,863 $133,707,095 $154,288,238 $151,898,452 $156,261,125
Responsibility: Business Plan:The Bus Operations Department is responsible for the following major Internal Business Practice functions: control center operations, fixed-route bus operations, bus re-route Goal 1: Deliver Safe, Efficient, and Equitable Serviceplanning, special event planning, and unified service communications. Objective #14 Increase personal safety
Objective #15 Provide reliable performanceGoals & Objectives: Objective #18 Increase resiliency1) Implement Core Rules for bus operations. Customer Satisfaction2) Reduce employee injuries. Goal #1: Satisfied Riders3) Reduce bus rule violations. Objective #3 Improve overall customer experience4) Reduce customer complaints. People & Innovation 5) Increase on-time performance. Goal 3: Foster Service Excellence and Innovation
Objective #35 Foster employee innovation, including process improvements
Performance Measures:1) Core Rules for bus operations implemented.2) Employee injuries.3) Bus rule violations.4) Complaints/Commendations per 100,000 boardings.5) Pullout/In-service on-time performance/Lost trips.

TR-7
Bus Transportation Department-Personnel Services
Expense Category FY2018 FY2019 FY2020 FY2020 FY2021
Actual Actual Budget Estimate Budget
Labor 86,191,519 90,764,678 104,307,685 102,468,080 106,400,904
Fringe 38,617,293 40,447,703 46,169,203 44,877,920 46,657,321
Capitalized Labor-Fringe -880 -9,209
Total $124,807,932 $131,203,172 $150,476,888 $147,346,000 $153,058,225
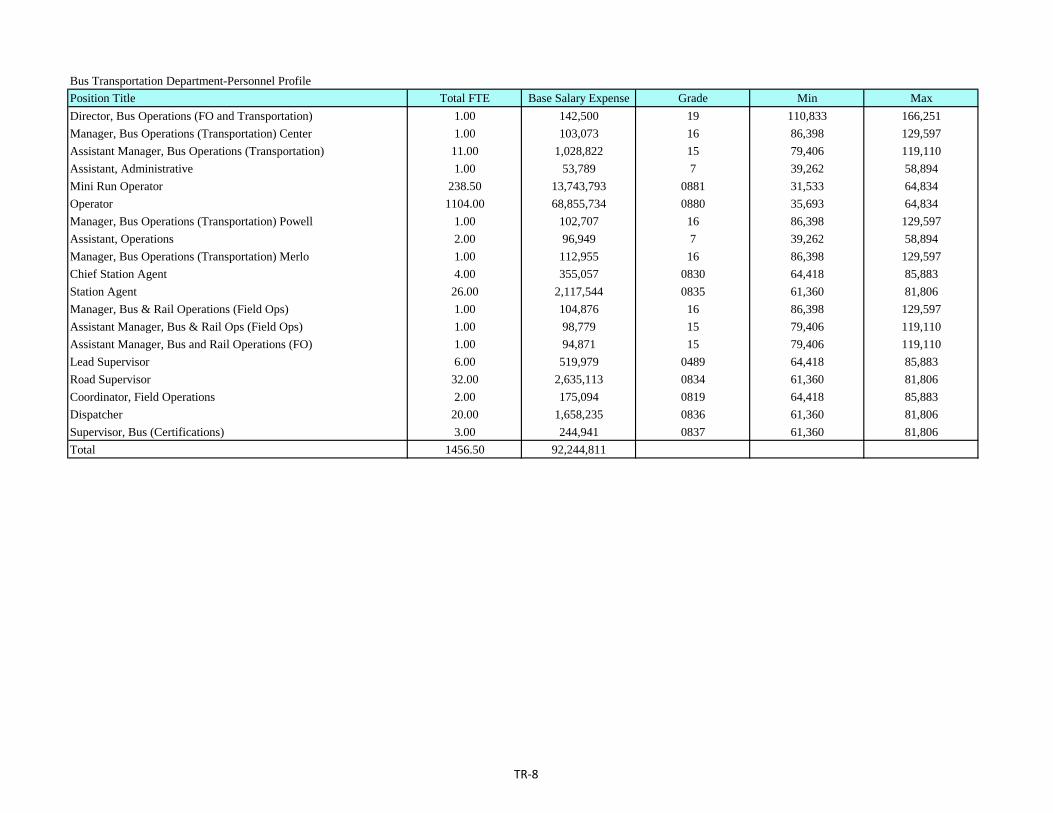
Bus Transportation Department-Personnel Profile
Position Title Total FTE Base Salary Expense Grade Min Max
Director, Bus Operations (FO and Transportation) 1.00 142,500 19 110,833 166,251
Manager, Bus Operations (Transportation) Center 1.00 103,073 16 86,398 129,597
Assistant Manager, Bus Operations (Transportation) 11.00 1,028,822 15 79,406 119,110
Assistant, Administrative 1.00 53,789 7 39,262 58,894
Mini Run Operator 238.50 13,743,793 0881 31,533 64,834
Operator 1104.00 68,855,734 0880 35,693 64,834
Manager, Bus Operations (Transportation) Powell 1.00 102,707 16 86,398 129,597
Assistant, Operations 2.00 96,949 7 39,262 58,894
Manager, Bus Operations (Transportation) Merlo 1.00 112,955 16 86,398 129,597
Chief Station Agent 4.00 355,057 0830 64,418 85,883
Station Agent 26.00 2,117,544 0835 61,360 81,806
Manager, Bus & Rail Operations (Field Ops) 1.00 104,876 16 86,398 129,597
Assistant Manager, Bus & Rail Ops (Field Ops) 1.00 98,779 15 79,406 119,110
Assistant Manager, Bus and Rail Operations (FO) 1.00 94,871 15 79,406 119,110
Lead Supervisor 6.00 519,979 0489 64,418 85,883
Road Supervisor 32.00 2,635,113 0834 61,360 81,806
Coordinator, Field Operations 2.00 175,094 0819 64,418 85,883
Dispatcher 20.00 1,658,235 0836 61,360 81,806
Supervisor, Bus (Certifications) 3.00 244,941 0837 61,360 81,806
Total 1456.50 92,244,811
TR-8

TR-9
Bus Transportation Department-Materials & Services
Expense Category FY2018 FY2019 FY2020 FY2020 FY2021
Actual Actual Budget Estimate Budget
Quality Assurance / ADA 2,000 1,000 2,000
Temporary Help-Trans Adm 16,851 15,115 16,500 26,490
Photo Copier Maint-Doc Svcs 5,547 21,205
Vehicle Control Sys Maint 649,200 553,827 491,900
Laundry 4,333 9,802 4,500 3,253 4,500
Backup Cab Service 2,427 2,283 3,500 3,423 3,500
Other Services- Gen & Adm 44,249 7,657
Other Services-Transp Adm 146,408 294,688 107,200 68,706 108,200
Uniforms- Rev Veh Op 450,663 404,111 593,500 587,099 617,300
Office Supplies 38,729 40,965 18,925 20,128
Winter Supplies-Snow & Ice Impl 31,542 3,745 15,000 8,545 500
Other Materials- Gen & Adm 180 8
Other Materials- Transp Adm 53,017 25,411 58,500 78,461 59,000
Unreconciled Mastercard Expense 8,065 50 1,242
Postage - Gen & Admin 97,660 115,436
Computer Equip under $5,000 625 4,481
Doc Svcs Supplies 14,245 22,218
Telephone 34,970 32,539 5,118
Data Communication Services 197,000 225,957 199,000
PI/PD Expense 1,466,992 1,345,591 2,000,000 2,757,869 1,700,000
NU-Dues & Subscriptions 754 1,099 220
NU-Local Travel & Meetings 1,291 12 4
NU-Education & Training - Gen & Adm 7,745 6,147 95
NU-Out-Of-Town Travel 65,916 61,687 1,000 6,016
Driver Accommodations 56,900 75,312
CDL Renewals 5,027 8,007 13,500 7,950 14,000
Employee Recognition 622 199 159
Employee Awards 46 3,000 1,500 3,000
Operator Recognition 82,566 75,551 54,500 104,274
Special Events Serv 12,266 10,225 16,000 11,315
Total $2,591,931 $2,503,923 $3,811,350 $4,552,452 $3,202,900

TR-10
Field Operations Department
Summary FY2018 FY2019 FY2020 FY2021
Actual Actual Budget Estimate Proposed Approved Adopted
Personnel Services 16,465,269 17,755,668
Materials & Services 1,678,799 1,211,378
Total $18,144,068 $18,967,046

TR-11
Field Operations Department-Personnel Services
Expense Category FY2018 FY2019 FY2020 FY2020 FY2021
Actual Actual Budget Estimate Budget
Labor 11,794,146 12,771,145
Fringe 4,671,168 4,984,678
Capitalized Labor-Fringe -45 -155
Total $16,465,269 $17,755,668

TR-12
Field Operations Department-Materials & Services
Expense Category FY2018 FY2019 FY2020 FY2020 FY2021
Actual Actual Budget Estimate Budget
Professional & Technical-Gen & Adm 255,851 4,502
Temporary Help-Trans Adm 268,108
Vehicle Control Sys Maint 454,959 571,123
Other Services-Transp Adm 138,388 89,848
Uniforms - Veh Ops 3,990
Uniforms- Rev Veh Op 53,628 37,926
Office Supplies 14,966 38,468
Computer Supplies - Trans Admin 990
OCC Equip & Supplies 44,288 47,104
Other Materials- Transp Adm 96,909 45,786
Default Expense 107
Telephone 65,375 73,699
Data Communication Services 244,042 211,359
NU-Local Travel & Meetings 10
NU-Education & Training - Gen & Adm 710 9,978
NU-Out-Of-Town Travel 1,686 10,676
Driver Accommodations 32,571 67,887
CDL Renewals 1,455 813
Employee Recognition 883 2,092
Total $1,678,799 $1,211,378

TR-13
Service Delivery-Department
Summary FY2018 FY2019 FY2020 FY2021
Actual Actual Budget Estimate Proposed Approved Adopted
Personnel Services 1,600,567 1,554,093 2,315,993 2,431,385 2,137,634
Materials & Services 46,981 126,913 24,700 211,261 253,500
Total $1,647,548 $1,681,006 $2,340,693 $2,642,646 $2,391,134
Responsibility: Business Plan:The Service Delivery Department is responsible for the following major Internal Business Practice functions: workforce planning, utilization and communication, schedule Goal #1 Deliver Safe, Efficient, and Equitable Servicemaking, systems and production, planning and projects, operating practices, Objective #14 Increase personal safety and the Service Improvement Process. Objective #15 Provide reliable performance
Objective #16 Improve service deliveryGoals & Objectives: Objective #18 Increase resiliency1) Develop and implement Operating Hiring Plan. Customer 2) Reduce the average run lengths for assignments. Goal #1 Satisfied Riders3) Reduce Operator overtime. Objective #3 Improve overall customer experience4) Reduce customer complaints.5) Increase on-time performance. Performance Measures:6) Increase attendance. 1) Operating Hiring Plan implemented.7) Improve business process for the schedule making and production/Service 2) Average run lengths reduced for Operators.
Improvement Process. 3) Operator overtime reduced.8) Initiate data dashboard with key performance indicators. 4) Complaints/Commendations per 100,000 boardings.9) Enhance employee recognition programs. 5) Pullout/In-service on-time performance/Lost trips.10) Align operating practices with industry best practices. 6) Operator attendance.
7) Business Process Analysis project completed.8) Data dashboard project started.9) Employee Recognition Committee formed.10) Rail Operating Rule Program.

TR-14
Service Delivery Department-Personnel Services
Expense Category FY2018 FY2019 FY2020 FY2020 FY2021
Actual Actual Budget Estimate Budget
Labor 1,142,016 1,119,471 1,681,081 1,829,189 1,582,982
Fringe 458,551 434,622 634,912 661,620 554,652
Capitalized Labor-Fringe -59,424
Total $1,600,567 $1,554,093 $2,315,993 $2,431,385 $2,137,634

Service Delivery Department-Personnel Profile
Position Title Total FTE Base Salary Expense Grade Min Max
Director, Bus & Rail Operations (Service Delivery) 1.00 129,262 18 102,080 153,120
Manager, Bus & Rail Operations (C&WU) 1.00 93,164 15 79,406 119,110
Manager, Bus & Rail Operations (SM, S & P) 1.00 98,472 16 86,398 129,597
Assistant Manager, Bus & Rail Operations (ORPI) 1.00 92,775 15 79,406 119,110
Assistant Manager, Bus & Rail Ops (SIPS) 1.00 94,000 15 79,406 119,110
Coordinator, Employee Programs 1.00 67,746 10 51,431 77,145
Coordinator, Operations 2.00 127,088 10 51,431 77,145
Planner III 1.00 91,537 13 66,884 100,327
Schedule Data Technician 3.00 251,451 0867 61,360 81,806
Schedule Writer II 5.00 419,224 0874 61,360 81,806
Manager, Bus & Rail Ops (Ops Plan and Projects) 1.00 97,623 16 86,398 129,597
Total 18.00 1,562,342
TR-15

TR-16
Service Delivery Department-Materials & Services
Expense Category FY2018 FY2019 FY2020 FY2020 FY2021
Actual Actual Budget Estimate Budget
Professional & Technical-Gen & Adm 101,273 14,000 81,986 172,600
Other Services-Transp Adm 28,647 7,545 6,000 6,348 6,200
Other Services- Revenue Veh.Maint 81
Office Supplies 245 1,200 12,387
Equip/Furn < $5,000-Rev Eq Maint 778
Other Materials- Transp Adm 10,044 4,816 2,500 3,694 2,500
Unreconciled Mastercard Expense 268
Computer Equip under $5,000 1,395
Microcomputer Mtc Mat'l 1,970 1,000 1,125 1,000
Telephone 2,612 2,999 78,425
NU-Dues & Subscriptions 843
NU-Local Travel & Meetings 2,128
NU-Education & Training - Gen & Adm 2,850 640 7,331
NU-Out-Of-Town Travel 2,828 7,425 10,883
Employee Recognition 3,589
Operator Recognition 55,000
Special Events Serv 16,200
Total $46,981 $126,913 $24,700 $211,261 $253,500

TR-17
Accessible Transportation Programs-Department
Summary FY2018 FY2019 FY2020 FY2021
Actual Actual Budget Estimate Proposed Approved Adopted
Personnel Services 1,350,379 1,369,201 1,315,223 1,326,985 1,354,663
Materials & Services 36,569,096 36,348,068 38,985,400 38,627,305 40,142,000
Total $37,919,475 $37,717,269 $40,300,623 $39,954,290 $41,496,663
Responsibility: Business Plan:The Accessible Transportation Programs - LIFT Department is responsible Internal Business Practice for the following major functions: Americans with Disabilities Act (ADA) Goal #1 Deliver Safe, Efficient, and Equitable Servicecoordination, Committee on Accessible Transportation business meetings, Objective #14 Increase personal safety LIFT application and eligibility process, paratransit operations and Objective #15 Provide reliable performancemaintenance. The in-person assessment part of the eligibility process is Objective #17 Ensure cost effective serviceoperated under contract with Medical Transportation Management, Inc. The Objective #18 Increase resiliencyparatransit service is operated under an operations and maintenance contract Customer with First Transit and Penske. First Transit is responsible for operations (e.g., Goal #1 Satisfied Ridersdispatch, transportation, and call center). Penske is responsible for maintenance Objective #3 Improve overall customer experienceof the paratransit vehicles. LIFT also has a contract in place with Broadway Cab Goal #2 Satisfied Community Stakeholders and Employersto provide overflow service when capacity is met with TriMet vehicles. Objective #10 Advance mobility for those with limited options
People & InnovationGoals & Objectives: Goal #3 Foster Service Excellence and Innovation 1) Develop a strategic plan for LIFT. Objective #35 Foster employee innovation, including2) Implement Interactive voice response software. process improvements3) Launch EZ Wallet software for eFare.4) Purchase replacement vehicles. Performance Measures:5) Reduce major collisions. 1) Strategic plan finalized.6) Reduce customer complaints. 2) Interactive voice response software implemented.7) Increase on-time performance. 3) EZ Wallet software demonstrated.8) Decrease deadhead miles. 4) Replacement vehicles commissioned.9) Increase revenue rides per hour. 5) Collisions per 100,000 miles.10) Develop innovation framework for the Transportation Division. 6) Complaints/Commendations per 1,000 boardings.11) Propose a project for the Innovation Academy. 7) Pullout/In-service on-time performance/Lost trips.
8) Total deadhead percentage.9) Rides per hour.10) Innovation training made available.11) Innovation project accepted by the Innovation Academy.

TR-18
Accessible Transportation Programs Department-Personnel Services
Expense Category FY2018 FY2019 FY2020 FY2020 FY2021
Actual Actual Budget Estimate Budget
Labor 955,713 980,864 978,428 978,824 1,024,910
Fringe 394,666 388,337 336,795 348,161 329,753
Total $1,350,379 $1,369,201 $1,315,223 $1,326,985 $1,354,663

Accessible Transportation Programs Department-Personnel Profile
Position Title Total FTE Base Salary Expense Grade Min Max
Director, Accessible Transportation Programs 1.00 124,967 18 102,080 153,120
Manager, Lift Eligibility & Community Relations 1.00 80,000 15 79,406 119,110
Manager, Lift Service Delivery 1.00 105,062 16 86,398 129,597
Assistant Manager, Lift Service Delivery 1.00 84,938 13 66,884 100,327
Administrator, Lift Service Quality 1.00 72,761 11 56,173 84,261
Assistant, ATP 3.00 152,048 7 39,262 58,894
Coordinator, Lift Eligibility 4.00 262,759 11 56,173 84,261
Specialist, Senior, Eligibility 1.00 76,690 12 61,321 91,980
Analyst, Business (Lift) 1.00 65,686 11 56,173 84,261
Total 14.00 1,024,911
TR-19

TR-20
Accessible Transportation Programs Department-Materials & Services
Expense Category FY2018 FY2019 FY2020 FY2020 FY2021
Actual Actual Budget Estimate Budget
Contracted Dispatch 2,347,590 2,298,066 2,488,170 2,364,006 2,562,800
Contracted Eligibility Assessment 347,765 363,015 384,150 380,561 392,500
Professional & Technical-Gen & Adm 315 2,506 9,000 4,878 20,000
Temporary Help-Trans Adm 8,000 4,000 10,000
Equipment Repair & Mtc - Gen & Adm 136 17 2,000 1,215 3,000
ATP Central Maintenance 2,396,852 2,344,290 2,794,720 2,718,729 2,878,600
Background Check Services 15,513 18,646 18,000 15,891 20,000
Printing/Bindery Services 15,837 17,257 28,000 16,617 30,000
Other Services- Gen & Adm 43,093 9,392 25,000 15,493 35,000
Other Services- Revenue Veh.Maint 6,112 44,500 23,000 44,900
Diesel Fuel- Rev Vehicle Oper 1,507,743 1,704,879 1,681,040 1,651,160 1,733,200
Oil & Lubricants 40,451 61,697 79,000 66,410 40,000
Gasoline - Rev Veh Operations 53,637 4,646 80,000 40,000 40,000
Tires - Rev Vehicle Oper 143,855 120,615 146,400 110,549 152,300
Office Supplies 18,949 25,915 25,000 27,753 30,000
Equip/Furn < $5,000-Gen & Adm 13,535 1,460 12,000 7,290 20,000
Other Materials- Gen & Adm 13,276 5,856 12,000 13,364 15,000
Other Materials- Transp Adm 314
Unreconciled Mastercard Expense 568
Postage - Gen & Admin 24,697 28,598 31,000 38,707 38,000
ATP Maintenance Materials 22,086 16,539 16,000 8,930 25,000
Telephone 64,989 60,800 56,000 77,977 60,000
Data Communication Services 37,603 47,333 33,000 104,192 127,300
Physical Damage Ins-Region 1 722,912 773,097 865,830 803,082 891,800
ATP Direct Srvc Provider - Mult. 24,130,737 23,920,669 25,945,770 25,914,836 26,724,100
ATP Backup Cabs 4,211,529 4,150,940 3,800,000 3,859,351 4,018,500
Eligibility Transportation 206,999 180,802 210,000 194,720 210,000
NU-Local Travel & Meetings 80 24
NU-Education & Training - Gen & Adm 1,862 9,566
NU-Out-Of-Town Travel 7,786 5,074 253

TR-21
Accessible Transportation Programs Department-Materials & Services
Expense Category FY2018 FY2019 FY2020 FY2020 FY2021
Actual Actual Budget Estimate Budget
Employee Recognition 996 1,135
Cat Committee 13,183 16,824 18,000 12,129 20,000
Office Leases 158,410 158,410 172,820 151,898
Total $36,569,096 $36,348,068 $38,985,400 $38,627,305 $40,142,000

TR-22
Rail Transportation Department
Summary FY2018 FY2019 FY2020 FY2021
Actual Actual Budget Estimate Proposed Approved Adopted
Personnel Services 23,059,058 23,321,383 33,402,865 33,255,068 33,443,967
Materials & Services 371,127 668,772 683,500 529,497 1,983,700
Total $23,430,185 $23,990,155 $34,086,365 $33,784,565 $35,427,667
Responsibility: Business Plan:The Rail Transportation Department is responsible for the following major Internal Business Practice functions: control center operations, light rail operations, rail access planning, Goal #1 Deliver Safe, Efficient, and Equitable Servicespecial event planning, unified service communications, along with the Objective #14 Increase personal safety operations and maintenance of Streetcar. Objective #15 Provide reliable performance
Objective #18 Increase resiliencyGoals & Objectives: Customer Satisfaction1) Reduce employee injuries. Goal #1: Satisfied Riders2) Reduce rail rule violations. Objective #3 Improve overall customer experience3) Reduce customer complaints.4) Develop and implement a rail access program. Performance Measures:5) Increase on-time performance. 1) Monthly, quarterly, and annual CMS assessment goals achieved6) Fulfill the requirements of the Intergovernmental Agreement related to the 2) Employee injuries.
Operations & Maintenance of the Portland Streetcar System. 3) Rail rule violations per million miles.4) Complaints/Commendations per 100,000 boardings.5) Rail access program document completed and updated annually.6) Pullout/In-service on-time performance/Lost trips.7) Satisfy Master Agreement Roles and Responsibilities/Annual
Performance Measures.
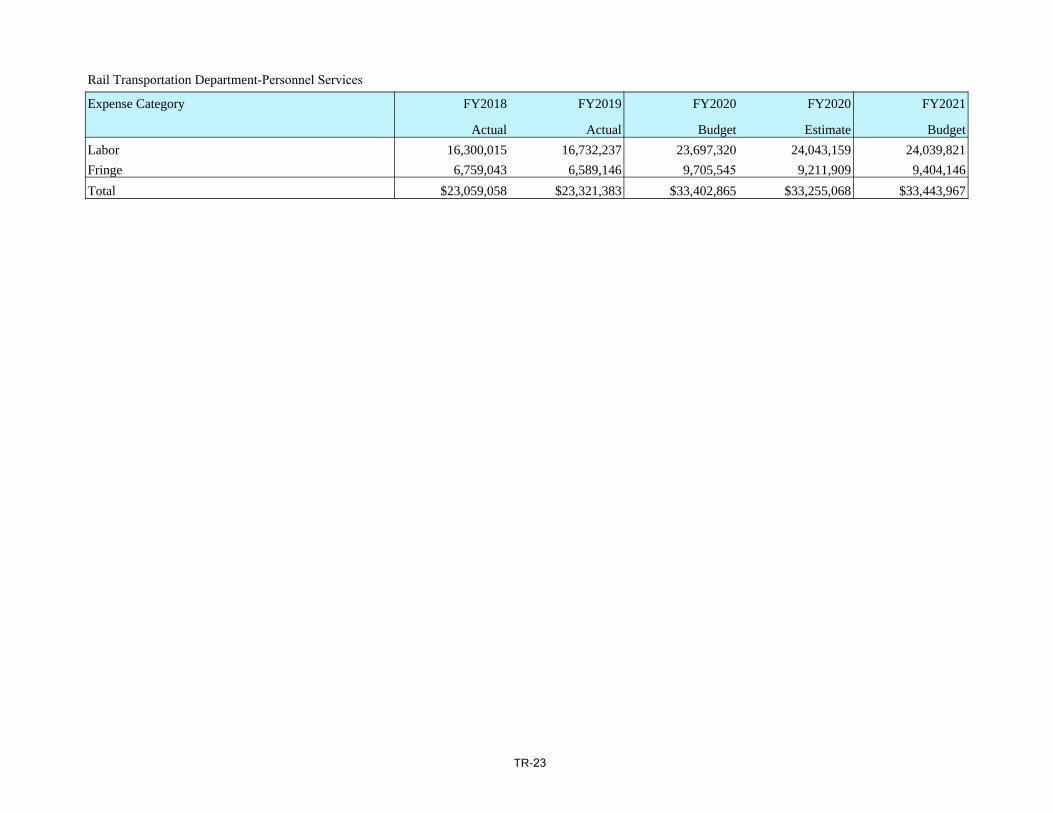
TR-23
Rail Transportation Department-Personnel Services
Expense Category FY2018 FY2019 FY2020 FY2020 FY2021
Actual Actual Budget Estimate Budget
Labor 16,300,015 16,732,237 23,697,320 24,043,159 24,039,821
Fringe 6,759,043 6,589,146 9,705,545 9,211,909 9,404,146
Total $23,059,058 $23,321,383 $33,402,865 $33,255,068 $33,443,967

Rail Transportation Department-Personnel Profile
Position Title Total FTE Base Salary Expense Grade Min Max
Director, Rail Operations, Field Ops & OCC 1.00 120,905 20 120,234 180,349
Manager, Bus & Rail Operations (Field Ops) 1.00 104,155 16 86,398 129,597
Manager, Bus & Rail Operations (Ops Cmnd Ctr) 1.00 108,000 16 86,398 129,597
Manager, Rail Operations (Transportation) Elmo 1.00 101,168 16 86,398 129,597
Manager, Rail Operations (Transportation) RJ 1.00 112,134 16 86,398 129,597
Assistant Manager, Bus & Rail Ops (Ops Cmd Ctr) 6.00 564,778 15 79,406 119,110
Assistant Manager, Rail Ops (Transportation) 2.00 191,358 14 72,900 109,351
Specialist, Operations 3.00 190,674 9 47,037 70,555
Rail Supervisor 35.00 2,887,626 0536 81,806 81,806
Coordinator, Field Operations 2.00 175,510 0819 64,418 85,883
Rail Controller 29.00 2,390,106 0538 81,806 81,806
Supervisor, Rail (Certifications) 2.00 163,613 0535 81,806 81,806
Rail Operator 196.00 13,239,636 0580 50,294 67,142
Total 280.00 20,349,663
TR-24

TR-25
Rail Transportation Department-Materials & Services
Expense Category FY2018 FY2019 FY2020 FY2020 FY2021
Actual Actual Budget Estimate Budget
Temporary Help-Trans Adm 1,500 750
Other Services- Gen & Adm 14,229 7,276 14,000 17,601 14,100
Other Services-Transp Adm 240 3,365 328
Uniforms- Rev Veh Op 81,940 66,090 89,000 95,269 89,900
Office Supplies 18,794 26,986 5,421
Computer Supplies - Trans Admin 225 1,896
OCC Equip & Supplies 31,000 18,985 31,300
Other Materials- Gen & Adm 176,290 281,684 31,000 35,688 31,300
Other Materials- Transp Adm 1,464 423
Unreconciled Mastercard Expense 8,532
Default Expense -80
Telephone 2,794 2,361 492
Data Communication Services 13,500 14,991 13,600
PI/PD Expense 69,543 244,739 500,000 323,470 1,800,000
NU-Local Travel & Meetings 65
NU-Education & Training - Gen & Adm 75 310
NU-Out-Of-Town Travel 29,584 2,450
CDL Renewals 1,794 2,578 3,500 2,177 3,500
Employee Recognition 5,428 2,125 1,024
Total $371,127 $668,772 $683,500 $529,497 $1,983,700

TR-26
Commuter Rail Department
Summary FY2018 FY2019 FY2020 FY2021
Actual Actual Budget Estimate Proposed Approved Adopted
Personnel Services 1,747,923 1,914,362 1,940,088 2,032,211 2,146,664
Materials & Services 4,191,945 4,136,532 4,505,964 4,421,140 5,316,200
Total $5,939,868 $6,050,894 $6,446,052 $6,453,351 $7,462,864
Responsibility: Business Plan:The Westside Express Service (WES) Commuter Rail Department is Internal Business Practice responsible for the following major functions: commuter rail operations and Goal #1 Deliver Safe, Efficient, and Equitable Servicemaintenance. WES is governed by Federal Railroad Administration safety Objective #14 Increase personal safety regulations. The Portland and Western Railroad (P&W) is the owner/operator of Objective #15 Provide reliable performancecommon carrier railroad rights along the WES line. The commuter rail service is Objective #18 Increase resiliencyoperated under a Shared-Use Agreement with P&W responsible for the workforce Goal #2 Design and Deliver Successful Projectsand training for the following groups: operating crews, train dispatchers, and Customer Satisfactionmaintenance of way (track, signals, and highway-rail grade crossings) employees. Goal#1 Satisfied Riders
Objective #3 Improve overall customer experienceGoals & Objectives:1) Implement Positive Train Control. Performance Measures:2) Implement System Safety Program Plan. 1) Positive Train Control implemented.3) Conduct full-scale exercise for passenger train emergency preparedness. 2) System Safety Program Plan implemented.4) Complete WES Corridor Capital Improvement Projects. 3) Full-scale exercise completed.5) Reduce customer complaints. 4) WES Corridor Capital Improvement Project completed.6) Increase on-time performance. 5) Complaints/Commendations per 100,000 boardings.7) Maintain employee injuries. 6) Pullout/In-service on-time performance/Lost trips.
7) Employee injuries.

TR-27
Commuter Rail Department-Personnel Services
Expense Category FY2018 FY2019 FY2020 FY2020 FY2021
Actual Actual Budget Estimate Budget
Labor 1,289,532 1,419,702 1,392,331 1,455,259 1,395,100
Fringe 489,030 590,537 547,757 583,945 751,564
Capitalized Labor-Fringe -30,639 -95,877 -6,993
Total $1,747,923 $1,914,362 $1,940,088 $2,032,211 $2,146,664

Commuter Rail Department-Personnel Profile
Position Title Total FTE Base Salary Expense Grade Min Max
Director, Rail Operations (Commuter) 1.00 135,569 18 102,080 153,120
Manager, Rail Operations (Commuter) 1.00 96,000 16 86,398 129,597
Assistant Supervisor Commuter Rail Vehicle Maint 3.00 258,498 0872 79,830 79,830
Commuter Rail Vehicle Maint. Tech. Trainee 1.00 69,410 0875 69,410 69,410
Commuter Rail Vehicle Maint. Technician 7.00 505,210 0888 69,410 69,410
Service Worker 2.00 104,169 0944 37,482 54,267
Helper 2.00 130,291 0533 64,834 64,834
Total 17.00 1,299,147
TR-28

TR-29
Commuter Rail Department-Materials & Services
Expense Category FY2018 FY2019 FY2020 FY2020 FY2021
Actual Actual Budget Estimate Budget
Professional & Technical-Trans Adm 3,195 3,255 5,411
Landscape Maint Services 26,196 34,800 4,400 16,787 4,400
Contracted Fac Mtc 7,410 46,290 6,000 20,274 6,100
Facilities Maint. Agreements - WES 37,599 38,430 45,320 25,396 45,300
Calibration & Tool Repair 8,037 5,725 4,900 2,450 4,900
Contr Maint - Type I LRV-Rev Eq Maint 204,556 36,296 97,704 119,372 63,100
Maintenance of Way - Commuter Rail 768,472 731,694 814,080 666,935 1,309,800
Laundry 4,946 5,863 6,500 5,959 6,600
Other Services- Revenue Veh.Maint 851 1,034 4,800 6,587 4,800
Waste Disposal Services 103 2,100 1,050 2,100
Uniforms- Rev Veh Op 1,834 2,930 1,700 1,655 1,700
Diesel Fuel- Rev Vehicle Oper 219,845 256,545 260,100 262,907 272,200
Office Supplies 9,864 5,811 1,056
Maint Mat'l - Snow & Ice 1,200 600 1,200
Maint Mat'l - Rev Eq 171,375 285,691 257,000 376,905 259,600
Freight 32,182 24,045 30,000 29,342 30,300
Maint Material - Other 21,236 26,879 13,000 17,346 13,100
Shop Equip < $5000 - Fac Eq Maint 29,791 41,977 12,500 18,172 12,600
Cleaning Suppl- Rev Equip Maint 4,230 11,915 13,500 8,389 11,600
Cleaning Suppl- Fac/Eq Maint 2,200 1,100 2,200
Small Hand Tools-Fac/Eq Maint 6,063 3,231 5,000 4,534 5,100
Other Materials- Rev Eq Maint 14,488 9,373 13,000 6,877 13,100
Unreconciled Mastercard Expense 153 276
Default Expense 730
Landscape Maint Material 1,024 92 4,000 3,522 4,000
Maint Matl Landscape 243
Safety Supplies- Gen & Adm 15,655 3,586 7,000 5,817 7,100
Obsolete Inventory 14
Invoice Price Variance -51 -481 -183
Average Cost Variance -158

TR-30
Commuter Rail Department-Materials & Services
Expense Category FY2018 FY2019 FY2020 FY2020 FY2021
Actual Actual Budget Estimate Budget
Utilities - Electricity 35,278 36,038 42,910 36,657 43,300
Utilities - Gas 10,706 10,565 12,450 8,339 11,900
Utilities - Water 13,854 19,495 15,000 20,706 17,400
Telephone 59,611 51,329 64,000 60,384 64,600
Data Communication Services 45,825 78,069 78,000 129,225 78,800
Utilities - Other 316 4,232 3,430 3,937 5,500
Network Access Services 31,002 31,301 33,500 25,536 33,800
Train Operations 2,095,884 2,003,016 2,329,670 2,217,693 2,649,400
On-Time Performance Incentive - Commuter Rail 305,497 321,227 320,000 308,936 329,600
NU-Local Travel & Meetings 677 465 300
NU-Education & Training - Gen & Adm 875
NU-Out-Of-Town Travel 3,134 3,786
CDL Renewals 218 1,000 500 1,000
Employee Recognition 1,298 306
Total $4,191,945 $4,136,532 $4,505,964 $4,421,140 $5,316,200

TR-31
Portland Streetcar Department
Summary FY2018 FY2019 FY2020 FY2021
Actual Actual Budget Estimate Proposed Approved Adopted
Personnel Services 7,657,745 7,675,468 8,088,061 8,127,295 8,240,414
Materials & Services 7,675,677 8,929,242 8,968,620 8,971,320 10,399,200
Total $15,333,422 $16,604,710 $17,056,681 $17,098,615 $18,639,614
Responsibility: Business Plan:The Portland Streetcar Department is a City of Portland and TriMet partnership Internal Business Practice activity. The Streetcar service is operated under an Intergovernmental Goal #1 Deliver Safe, Efficient, and Equitable ServiceAgreement (Streetcar Operating Agreement) with the City. TriMet is Objective #14 Increase personal safety responsible for the following major functions: operations (e.g., control center Objective #15 Provide reliable performanceand transportation) and maintenance. TriMet personnel who perform these Objective #18 Increase resiliencyduties are under the supervision of TriMet's Manager, Rail Operations Customer Satisfaction(Streetcar). These personnel remain TriMet employees, are paid and receive Goal #1 Satisfied Ridersbenefits from TriMet in the same manner as if their work was regular TriMet Objective #3 Improve overall customer experience operations. The Manager, Rail Operations (Streetcar) is the primary liaison with City management and supervision who oversee the Intergovernmental Agreement. Performance Measures:
1) Operation of streetcar vehicles in revenue service. Maintenance ofSeparately, TriMet funds approximately 70% of the annual operating cost (net streetcar vehicles, track, overhead electrification and rail signals.of fares) for Portland Streetcar. This expense is budgeted as a materials and services item. Annual Performance Measures.
2) Memorandum of Agreement #35 implementation plan initiated.The TriMet funding and personnel support described above are per agreements 3) Rule violations per million miles.between TriMet and the City of Portland and between TriMet and the 4) Absenteeism goals.Amalgamated Transit Union (ATU). 5) Complaints/Commendations per 100,000 boardings.
6) CMS implemented, monthly, quarterly, and annual CMS assessmentGoals & Objectives: goals were achieved.1) Satisfy the Intergovernmental Agreement (Streetcar Operating Agreement).2) Implement Memorandum of Agreement #35.3) Reduce rule violations.4) Reduce absenteeism.5) Reduce customer complaints.6) Implement a Competency Management System.

TR-32
Portland Streetcar Department-Personnel Services
Expense Category FY2018 FY2019 FY2020 FY2020 FY2021
Actual Actual Budget Estimate Budget
Labor 5,365,281 5,312,591 5,661,133 5,648,160 5,670,610
Fringe 2,292,464 2,362,877 2,426,928 2,479,135 2,569,804
Total $7,657,745 $7,675,468 $8,088,061 $8,127,295 $8,240,414

Portland Streetcar-Personnel Profile
Position Title Total FTE Base Salary Expense Grade Min Max
Manager, Rail Operations (Streetcar) 1.00 103,829 16 86,398 129,597
Streetcar Superintendent 2.00 195,187 0146 97,594 97,594
Rail Controller 3.00 245,419 0538 81,806 81,806
Streetcar Operator 56.00 3,770,433 0488 50,294 67,142
Streetcar Journeyman Mechanic 10.00 716,196 0451 69,410 69,410
Streetcar Maintenance Training Technician 1.00 72,530 0182 72,530 72,530
Signals Maintainer 1.00 75,587 0541 72,675 72,675
Track Maintainer 1.00 75,587 0540 72,675 72,675
Total 75.00 5,254,768
TR-33

TR-34
Portland Streetcar Department-Materials & Services
Expense Category FY2018 FY2019 FY2020 FY2020 FY2021
Actual Actual Budget Estimate Budget
Portland Streetcar 7,675,379 8,929,225 8,968,620 8,971,320 10,399,200
Safety Supplies - Fac/Eq Maint 298 17
Total $7,675,677 $8,929,242 $8,968,620 $8,971,320 $10,399,200

SS-1
SAFETY & SECURITY DIVISION
Summary FY2018 FY2019 FY2020 FY2021
Actual Actual Budget Estimate Proposed Approved Adopted
Personnel Services 7,634,395 8,147,359 4,027,633 3,623,753 5,295,576
Materials & Services 18,347,415 21,077,715 25,444,448 22,563,251 25,778,500
Total $25,981,810 $29,225,074 $29,472,081 $26,187,004 $31,074,076
Safety & Security Division PageDivision Summary ..................................................................................... SS-1Safety & Security Administration .............................................................. SS-2Safety & Environmental Services .............................................................. SS-6Security & Emergency Management ......................................................... SS-10Bus Transportation Training ...................................................................... SS-14Rail Transportation Training ...................................................................... SS-17

SS-2
Safety & Security Administration Department
Summary FY2018 FY2019 FY2020 FY2021
Actual Actual Budget Estimate Proposed Approved Adopted
Personnel Services 573,047 529,007 623,706
Materials & Services 12,000 21,269 12,100
Total $585,047 $550,276 $635,806
Responsibility: Business Plan: The Safety & Security Administration Department is responsible for strategic Financial Goals Categoryplanning for the division; access control card issuance; contract and Goal #1 Fiscally Sound and CompliantIntergovernmental Agreement (IGA) administration; and financial projection Objective #36 Manage financial performance within Strategic and reconciliation for the division, including Department of Homeland Security Financial Plan Guidelinesgrant application & reporting.
Goals & Objectives: Performance Measures:1) Complete complex strategic financial planning, forecasting and analysis. 1) Ensure Department of Homeland Security grants compliance.2) Manage annual budget process and monitoring. 2) Accurate and timely communication with Finance & Administrative3) Prepare accounting reports for division. Services division.4) Manage division contracts and Intergovernmental Agreements. 3) Produce accurate and timely financial reports for Executive Director.5) Perform grants administration and reporting. 4) Ensure division budget is consistent with Finance & Administrative
Services division's recommendations.5) Monitor expenditures and maintain division budget according to
Adopted Budget.6) Lead annual Strategic Planning for division to identify budget
resources, contracts, IGAs and staffing needs.

SS-3
Safety & Security Administration Department-Personnel Services
Expense Category FY2018 FY2019 FY2020 FY2020 FY2021
Actual Actual Budget Estimate Budget
Labor 421,990 396,587 463,768
Fringe 151,057 132,420 159,938
Total $573,047 $529,007 $623,706

Safety & Security Administration Department-Personnel Profile
Position Title Total FTE Base Salary Expense Grade Min Max
Executive Director, Safety & Security 1.00 183,000 22 141,179 211,771
Assistant, Safety & Security - Environmental 1.00 45,302 7 39,262 58,894
Senior Administrative Assistant 1.00 57,442 9 47,037 70,555
Senior Administrator, Safety & Security Programs 1.00 86,479 13 66,884 100,327
Total 4.00 372,223
SS-4

SS-5
Safety & Security Administration Department-Materials & Services
Expense Category FY2018 FY2019 FY2020 FY2020 FY2021
Actual Actual Budget Estimate Budget
Office Supplies 2,299
Other Materials- Gen & Adm 1,500 5,847 1,500
Unreconciled Mastercard Expense -1
Computer Equip under $5,000 2,000 3,679 1,000
Telephone 1,000 2,535 2,000
NU-Local Travel & Meetings 1,500 1,500 1,500
NU-Education & Training - Gen & Adm 1,000 2,169 1,000
NU-Out-Of-Town Travel 5,000 3,000 5,100
Employee Recognition 241
Total $12,000 $21,269 $12,100

SS-6
Safety & Environmental Services Department
Summary FY2018 FY2019 FY2020 FY2021
Actual Actual Budget Estimate Proposed Approved Adopted
Personnel Services 1,253,933 1,552,414 1,341,971 1,269,922 1,353,757
Materials & Services 2,436,352 2,210,217 1,779,900 1,572,429 1,792,700
Total $3,690,285 $3,762,631 $3,121,871 $2,842,351 $3,146,457
Responsibility: Business Plan: The Safety & Environmental Services Department is responsible for Customers Goals Categoryproviding a safe and secure system for our riders and employees. In addition, Goal #1 Satisfied Ridersthe department leads the organization in creating a culture of safety and service Objective #1 Provide safe service excellence, in which safety is the fundamental value, which guides all agency decisions. Internal Business Practices Goals Category
Goal #1 Deliver Safe, Efficient and Equitable ServiceGoals & Objectives: Objective # 14 Increase Personal Safety1) Finalize and implement the Safety Management System (SMS) Plan. Objective # 18 Increase Resiliency2) Conduct audits, inspections and corrective action reports (assurance). People and Innovation Goals Category3) Conduct hazard identification, evaluation and analysis. Goal #1 Ensure a Culture of Safety4) Maintain compliance with all regulatory manadates. Objective # 28 Successfully implement and achieve strong 5) Provide safety technical assistance to the Engineering & Construction Division acceptance of the Safety Management System (SMS)
with construction-related products.Performance Measures:1) TriMet workplace safety incident rates at or below transit industry
standards and rates of comparable mass transit agencies.2) Fulfill all regulatory requirements for safety and environmental
programs.3) Identify and develop a data safety management system (SMS).4) Conduct safety job audits and enhance operational efficiencies.

SS-7
Safety & Environmental Services Department-Personnel Services
Expense Category FY2018 FY2019 FY2020 FY2020 FY2021
Actual Actual Budget Estimate Budget
Labor 972,566 1,146,732 1,038,028 998,494 1,130,875
Fringe 326,339 457,691 390,608 357,502 399,047
Capitalized Labor-Fringe -44,972 -52,009 -86,665 -86,074 -176,165
Total $1,253,933 $1,552,414 $1,341,971 $1,269,922 $1,353,757

Safety and Environmental Services-Personnel Profile
Position Title Total FTE Base Salary Expense Grade Min Max
Dir, Safety Management Sys & Environmental Svcs. 1.00 129,705 19 110,833 166,251
Manager, Environmental Services 1.00 106,623 15 79,406 119,110
Administrator, Drug & Alcohol Testing Program 1.00 71,585 13 66,884 100,327
Coordinator, Environmental 1.00 82,263 12 61,321 91,980
Specialist, Drug & Alcohol Program 1.00 61,610 9 47,037 70,555
Specialist, Senior, System Safety 1.00 100,585 15 79,406 119,110
Specialist, System Safety 5.00 418,161 13 66,884 100,327
Manager, Safety Systems 1.00 105,000 16 86,398 129,597
Specialist, Safety and Security Data Management 1.00 55,343 11 56,173 84,261
Total 13.00 1,130,875
SS-8

SS-9
Safety & Environmental Services Department-Materials & Services
Expense Category FY2018 FY2019 FY2020 FY2020 FY2021
Actual Actual Budget Estimate Budget
Professional & Technical-Gen & Adm 1,133,008 730,633 440,000 499,546 491,200
Drug & Alcohol Testing 93,824 128,441 143,500 194,710 145,000
Safety Occupational Serv 169 375
Environmental Consulting 94,145 251,562 210,000 122,968 200,000
Temporary Help-Trans Adm 47,000 23,500 10,000
Contracted Maint - Environmental 848,351 629,090 650,000 475,176 670,000
Other Services- Gen & Adm 37,040 35,354 7,400 10,072 7,500
Waste Disposal Services 150,560 294,073 200,000 155,267 200,000
Office Supplies 4,301 5,334 10,000 5,470 8,000
Other Materials- Gen & Adm 6,936 13,942 13,000 35,916 8,000
Computer Equip under $5,000 9,219 27,188 12,000 8,389 10,000
Environmental Material 635 25
Safety Supplies- Gen & Adm 118 29
Telephone 7,174 6,732 9,000 5,818 7,000
NU-Dues & Subscriptions 3,828 6,912 4,000 5,335 4,000
NU-Local Travel & Meetings 440 654 1,000 3,201 2,000
NU-Education & Training - Gen & Adm 13,623 50,411 15,000 11,107 13,000
NU-Out-Of-Town Travel 32,139 28,135 17,000 15,380 17,000
Employee Recognition 842 1,327 1,000 574
Total $2,436,352 $2,210,217 $1,779,900 $1,572,429 $1,792,700

SS-10
Security & Emergency Management Department
Summary FY2018 FY2019 FY2020 FY2021
Actual Actual Budget Estimate Proposed Approved Adopted
Personnel Services 653,741 764,411 2,112,615 1,824,824 3,318,113
Materials & Services 15,735,734 18,468,721 23,652,548 20,969,553 23,973,700
Total $16,389,475 $19,233,132 $25,765,163 $22,794,377 $27,291,813
Responsibility: Business Plan: The Security & Emergency Management Department is also responsible for Customers Goals Category providing a safe and secure system for our riders and employees. The Goal #1 Satisfied RidersEmergency Management program is primarily responsible for agency Objective #1 Provide safe service preparedness planning, response and recovery efforts, and ensuring the agency Internal Business Practices Goals Categoryis resilient to external stressors. Goal #1 Deliver Safe, Efficient and Equitable Service
Objective # 14 Increase Personal SafetyGoals & Objectives: Objective # 18 Increase Resiliency1) Coordinate and manage the TriMet Transit Police, transit security officers,
deputy district attorney contracts and activities. Performance Measures:2) Incorporate Crime Prevention through Environmental Design (CPTED) 1) Improve TriMet's customer perception of safety and security.
into TriMet projects and system. 2) Provide additional presence on the system.3) Manage fare enforcement, security and Transit Police contracts, including 3) Reduce fare evasion rates on MAX trains.
coordination of fare enforcement controls and oversight.4) Conduct high-visibility patrols, including fare and code of conduct
enforcement missions.

SS-11
Security & Emergency Management Department-Personnel Services
Expense Category FY2018 FY2019 FY2020 FY2020 FY2021
Actual Actual Budget Estimate Budget
Labor 414,184 530,691 1,450,154 1,284,478 2,361,997
Fringe 239,557 233,720 662,461 540,346 956,116
Total $653,741 $764,411 $2,112,615 $1,824,824 $3,318,113

Security and Emergency Management-Personnel Profile
Position Title Total FTE Base Salary Expense Grade Min Max
Director, Security & Emergency Management 1.00 133,818 19 110,833 166,251
Manager, Security and Emergency Management 1.00 91,799 15 79,406 119,110
Assistant, Administrative 2.00 73,335 7 39,262 58,894
Coordinator, Exclusions 1.00 68,931 10 51,431 77,145
Security Access Control Specialist/Coordinator 1.00 29,060 9 47,037 70,555
Chief Fare Inspector 2.00 171,766 0341 64,418 85,883
Coordinator, Crime Prevention & Data Analysis 1.00 71,049 0437 58,947 78,582
Fare Inspector 18.00 1,477,938 0342 61,360 81,806
Assistant Manager, Fare Enforcement 2.00 150,450 12 61,321 91,980
Manager, Fare Enforcement 1.00 95,110 16 86,398 129,597
Total 30.00 2,363,256
SS-12

SS-13
Security & Emergency Management Department-Materials & Services
Expense Category FY2018 FY2019 FY2020 FY2020 FY2021
Actual Actual Budget Estimate Budget
Professional & Technical-Gen & Adm 13,600 21,791 14,000
Temporary Help-Trans Adm 13,714 15,000 20,965 10,000
Security Services 11,514,946 10,887,035 15,119,500 13,235,312 15,119,500
Deputy DA Contract -79,968 190,297 236,578 247,198 246,000
Other Security Services 2,890,801 5,785,313 6,687,720 5,629,463 7,041,900
Building Security Maintenance 137,890 139,241 200,000 154,391 215,800
Exclusion & Tow Hearings 25,902 3,515 35,000 20,645 30,000
Security Services - Canine Unit 635,872 695,376 697,500 686,968 697,500
Security Services - Anit-Terrorism Team 310,436 233,858 340,800 342,176 340,800
Security Services - Gang Outreach 76,863 111,932 138,350 232,836 130,900
Other Services- Gen & Adm 94,540 227,673 32,600 214,772 33,000
Uniforms- Rev Veh Op 3,400 5,045 3,400
Office Supplies 7,347 11,446 3,000 1,556 2,000
Other Materials- Gen & Adm 58,621 135,617 100,500 113,116 62,400
Computer Equip under $5,000 9,804 5,647 2,000 15,352 2,000
Telephone 8,542 12,200 8,000 11,324 9,500
NU-Dues & Subscriptions 2,690 78 2,000 1,000 1,500
NU-Local Travel & Meetings 2,361 2,105 6,000 3,588 4,500
NU-Education & Training - Gen & Adm 7,411 970 3,000 6,257 3,000
NU-Out-Of-Town Travel 31,001 11,704 6,000 4,798 6,000
Assault Rewards 675 1,000 2,000 1,000
Total $15,735,734 $18,468,721 $23,652,548 $20,969,553 $23,973,700

SS-14
Bus Transporation Training Department
Summary FY2018 FY2019 FY2020 FY2021
Actual Actual Budget Estimate Proposed Approved Adopted
Personnel Services 4,085,205 4,171,078
Materials & Services 128,607 259,996
Total $4,213,812 $4,431,074

SS-15
Bus Transporation Training Department-Personnel Services
Expense Category FY2018 FY2019 FY2020 FY2020 FY2021
Actual Actual Budget Estimate Budget
Labor 2,940,850 3,058,501
Fringe 1,144,355 1,112,577
Total $4,085,205 $4,171,078

SS-16
Bus Transporation Training Department-Materials & Services
Expense Category FY2018 FY2019 FY2020 FY2020 FY2021
Actual Actual Budget Estimate Budget
Accident Investigations 6,390 3,503
Temporary Help-Trans Adm 10,398
Other Services-Transp Adm 595 89,549
Uniforms- Rev Veh Op 381 8,521
Office Supplies 7,403 10,233
Other Materials- Transp Adm 22,289 16,737
Computer Equip under $5,000 4,263 2,560
UN-Oper Training Materials_A5049501 126 3,507
Telephone 27,103 34,460
NU-Local Travel & Meetings 446 284
NU-Education & Training - Gen & Adm 43,859 72,687
NU-Out-Of-Town Travel 6,257 4,472
Operator Roadeo 9,495 3,085
Total $128,607 $259,996

SS-17
Rail Transportation Training Department
Summary FY2018 FY2019 FY2020 FY2021
Actual Actual Budget Estimate Proposed Approved Adopted
Personnel Services 1,641,516 1,659,456
Materials & Services 46,722 138,781
Total $1,688,238 $1,798,237

SS-18
Rail Transportation Training Department-Personnel Services
Expense Category FY2018 FY2019 FY2020 FY2020 FY2021
Actual Actual Budget Estimate Budget
Labor 1,216,174 1,205,356
Fringe 425,342 454,100
Total $1,641,516 $1,659,456

SS-19
Rail Transportation Training Department-Materials & Services
Expense Category FY2018 FY2019 FY2020 FY2020 FY2021
Actual Actual Budget Estimate Budget
Other Services- Gen & Adm 80,539
Uniforms- Rev Veh Op 4,211
Office Supplies 9,866 5,035
Other Materials- Gen & Adm 15,905 1,761
Unreconciled Mastercard Expense 951
Computer Equip under $5,000 17,662 17,699
Telephone 2,338 9,192
NU-Education & Training - Gen & Adm 20,344
Total $46,722 $138,781

SS-20
[This Page Left Intentionally Blank]

MT-1
MAINTENANCE DIVISION
Summary FY2018 FY2019 FY2020 FY2021
Actual Actual Budget Estimate Proposed Approved Adopted
Personnel Services 77,865,291 83,010,789 87,761,640 83,546,774 88,221,413
Materials & Services 56,527,643 65,445,128 67,368,575 64,861,946 72,452,000
Total $134,392,934 $148,455,917 $155,130,215 $148,408,720 $160,673,413
Maintenance Division PageDivision Summary ..................................................................................... MT-1Maintenance Administration ..................................................................... MT-2Bus Maintenance ....................................................................................... MT-6Facilities Management Bus-Rail ............................................................... MT-11Rail Maintenance of Way .......................................................................... MT-17Rail Equipment Maintenance .................................................................... MT-22

MT-2
Maintenance Administration Department
Summary FY2018 FY2019 FY2020 FY2021
Actual Actual Budget Estimate Proposed Approved Adopted
Personnel Services 696,699 348,350 919,789
Materials & Services 531,300 265,650 650,300
Total $1,227,999 $614,000 $1,570,089
Responsibilities: Business Plan:The Maintenance Administration Department is responsible for managing and Customers Category maintaining all aspects of the District's assets; including bus and light rail Goal #1 Satisfied Riders vehicles, all TriMet-owned properties, light rail system elements, non-revenue Objective #1 Provide safe service vehicles, and the bus electrification project to reduce TriMet's carbon footprint. Internal Business Practices Category The Maintenance Division enforces the District's Safety Management Systems Goal #1 Deliver Safe, Efficient, and Equitable Serviceby establishing and implementing industry standards and other current practices Objective #15 Provide reliable performancethat demonstrate safety as a fundamental value and a priority in all aspects of Objective #17 Ensure cost-effective serviceTriMet's maintenance work. People & Innovation Category
Goal #2 TriMet is Where Diverse and Talented People Want to Come, Goals & Objectives: Stay, and Thrive1) Procure and deliver a pilot fleet of fully-electric battery powered buses and Objective #33 Recruit a talented workforce
charging facilities and to develop a strategy about how and when to shifttoward clean fuel buses. Performance Measures:
2) Support and leverage technology and tools to improve safety and efficiency 1) Reduce greenhouse gas (GHG).in all maintenance departments. 2) Safety compliance improvements.
3) Provide quality, cost-effective and value-added training designed to increase employee 3) Continue to improve preventative maintenance conformance in alland organizational safety, enhance knowledge, develop skills and boost productivity. Maintenance Departments.
4) Promote an organizational environment that values diversity, development, 4) Continue to improve the Mean Distance between Failures (MDBF) - alland growth opportunities for all maintenance employees. all modes
5) Analyze the possibility of hiring a diverse demographic for entry-level 5) Improve all modes of service and elevator interruptions for riders.positions (possibly new classification) to fill future training programs.
6) Continue HR partnerships to expand outreach efforts to organizations, suchas community colleges, Women in Trades, veteran organizations and more.

MT-3
Maintenance Administration Department-Personnel Services
Expense Category FY2018 FY2019 FY2020 FY2020 FY2021
Actual Actual Budget Estimate Budget
Labor 671,331 335,666 846,659
Fringe 147,912 73,956 201,640
Capitalized Labor-Fringe -122,544 -61,272 -128,510
Total $696,699 $348,350 $919,789

Maintenance Administration Department-Personnel Profile
Position Title Total FTE Base Salary Expense Grade Min Max
Executive Director, Maintenance Operations 1.00 189,339 22 141,179 211,771
Project Manager, Bus Electrification 1.00 124,308 17 93,951 140,927
Supervisor, Maintenance 1.00 86,763 14 72,900 109,351
Executive Administrative Assistant 1.00 75,499 11 56,173 84,261
Total 4.00 475,909
MT-4

MT-5
Maintenance Administration Department-Materials & Services
Expense Category FY2018 FY2019 FY2020 FY2020 FY2021
Actual Actual Budget Estimate Budget
Other Services- Revenue Veh.Maint 210,800 105,400 243,800
Office Supplies 60,800 30,400 103,800
Equip/Furn < $5,000-Rev Eq Maint 5,000
Telephone 157,100 78,550 190,500
NU-Dues & Subscriptions 2,500 1,250 2,500
NU-Local Travel & Meetings 3,800 1,900 3,800
NU-Education & Training - Gen & Adm 55,100 27,550 54,200
NU-Out-Of-Town Travel 27,000 13,500 27,300
Employee Recognition 14,200 7,100 19,400
Total $531,300 $265,650 $650,300
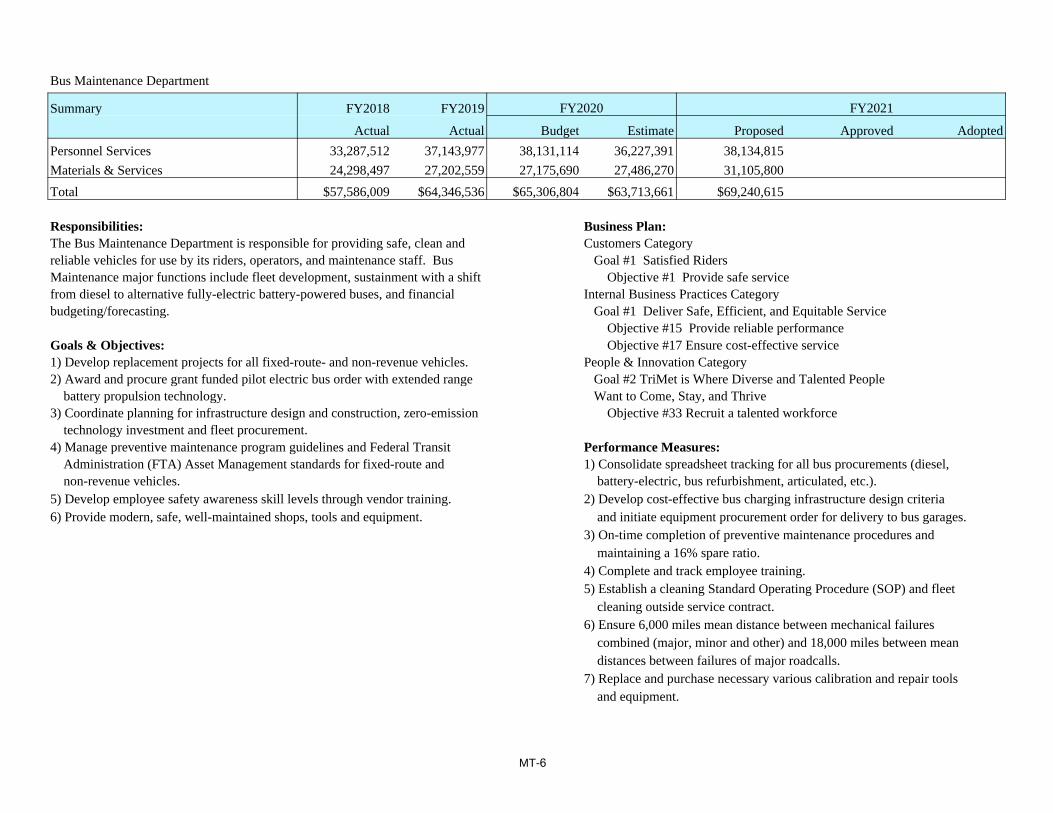
MT-6
Bus Maintenance Department
Summary FY2018 FY2019 FY2020 FY2021
Actual Actual Budget Estimate Proposed Approved Adopted
Personnel Services 33,287,512 37,143,977 38,131,114 36,227,391 38,134,815
Materials & Services 24,298,497 27,202,559 27,175,690 27,486,270 31,105,800
Total $57,586,009 $64,346,536 $65,306,804 $63,713,661 $69,240,615
Responsibilities: Business Plan:The Bus Maintenance Department is responsible for providing safe, clean and Customers Category reliable vehicles for use by its riders, operators, and maintenance staff. Bus Goal #1 Satisfied Riders Maintenance major functions include fleet development, sustainment with a shift Objective #1 Provide safe service from diesel to alternative fully-electric battery-powered buses, and financial Internal Business Practices Category budgeting/forecasting. Goal #1 Deliver Safe, Efficient, and Equitable Service
Objective #15 Provide reliable performanceGoals & Objectives: Objective #17 Ensure cost-effective service1) Develop replacement projects for all fixed-route- and non-revenue vehicles. People & Innovation Category2) Award and procure grant funded pilot electric bus order with extended range Goal #2 TriMet is Where Diverse and Talented People
battery propulsion technology. Want to Come, Stay, and Thrive3) Coordinate planning for infrastructure design and construction, zero-emission Objective #33 Recruit a talented workforce
technology investment and fleet procurement.4) Manage preventive maintenance program guidelines and Federal Transit Performance Measures:
Administration (FTA) Asset Management standards for fixed-route and 1) Consolidate spreadsheet tracking for all bus procurements (diesel,non-revenue vehicles. battery-electric, bus refurbishment, articulated, etc.).
5) Develop employee safety awareness skill levels through vendor training. 2) Develop cost-effective bus charging infrastructure design criteria6) Provide modern, safe, well-maintained shops, tools and equipment. and initiate equipment procurement order for delivery to bus garages.
3) On-time completion of preventive maintenance procedures andmaintaining a 16% spare ratio.
4) Complete and track employee training.5) Establish a cleaning Standard Operating Procedure (SOP) and fleet
cleaning outside service contract.6) Ensure 6,000 miles mean distance between mechanical failures
combined (major, minor and other) and 18,000 miles between meandistances between failures of major roadcalls.
7) Replace and purchase necessary various calibration and repair toolsand equipment.
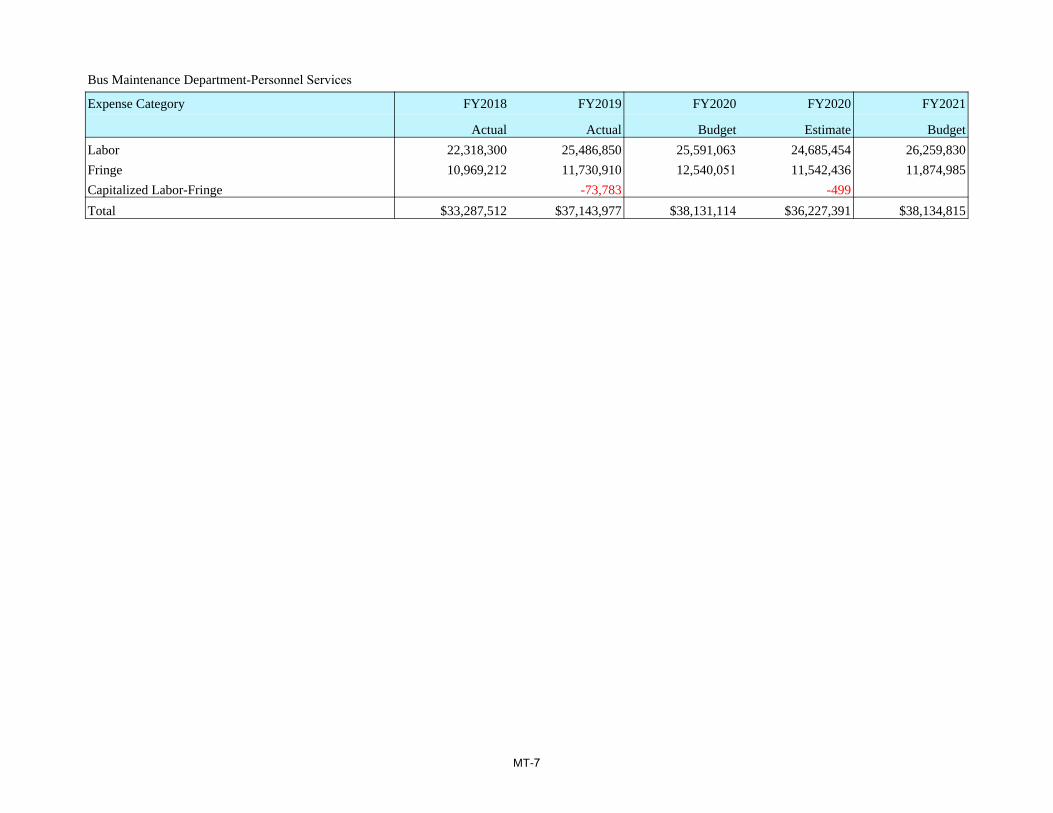
MT-7
Bus Maintenance Department-Personnel Services
Expense Category FY2018 FY2019 FY2020 FY2020 FY2021
Actual Actual Budget Estimate Budget
Labor 22,318,300 25,486,850 25,591,063 24,685,454 26,259,830
Fringe 10,969,212 11,730,910 12,540,051 11,542,436 11,874,985
Capitalized Labor-Fringe -73,783 -499
Total $33,287,512 $37,143,977 $38,131,114 $36,227,391 $38,134,815

Bus Maintenance Department-Personnel Profile
Position Title Total FTE Base Salary Expense Grade Min Max
Director, Bus Maintenance 1.00 143,940 19 110,833 166,251
Apprentice Mechanic 21.00 1,332,692 0934 46,259 64,834
Assistant, Senior Administrative 1.00 60,466 9 47,037 70,555
Manager, Bus Maintenance 3.00 320,651 16 86,398 129,597
Supervisor Maintenance 3.00 170,016 14 72,900 109,351
Supervisor, Maintenance 18.00 1,551,346 14 72,900 109,351
Assistant Supervisor 10.00 849,726 0566 87,547 87,547
Cleaner 4.00 169,728 0940 31,616 49,421
Journeyman Mechanic 195.00 13,907,006 0931 69,410 69,410
Maintenance Mechanic 9.00 595,733 0532 37,627 66,123
MMIS Clerk 7.00 455,624 0543 34,403 63,690
Service Worker 86.50 4,286,053 0944 37,482 54,267
Service Worker Spotter 4.00 229,549 0946 40,706 57,491
Spotter 4.00 273,333 0936 66,123 66,123
Tireman 5.00 419,994 0941 68,536 68,536
Helper 4.00 265,110 0533 64,834 64,834
Total 375.50 25,030,967
MT-8

MT-9
Bus Maintenance Department-Materials & Services
Expense Category FY2018 FY2019 FY2020 FY2020 FY2021
Actual Actual Budget Estimate Budget
Professional & Technical-Gen & Adm 8,994 15,490 155,000 87,367 227,000
Contracted Bus Mtc - Maf 167,625 670,769 1,000,000 764,392 1,000,000
Cont EV charger Maint and Monitoring 74,313
Body Repair - NRV 16,251 14,188 10,000 15,261 10,100
Laundry 95,770 104,399 111,380 98,396 118,500
Other Services- Revenue Veh.Maint 150,640 235,807 56,140 98,814 74,800
Diesel Fuel- Rev Vehicle Oper 10,892,557 11,368,767 12,507,500 12,194,753 15,507,600
Diesel Fuel- NRV Maintenance 43,343 45,763 45,000 44,409 45,500
Oil & Lubricants 460,474 786,992 514,870 506,441 535,800
Gasoline - NRV Maintenance 414,651 428,020 400,000 435,167 404,000
Tires - Rev Vehicle Oper 1,130,402 1,184,146 1,300,000 1,384,472 1,252,400
Tires Serv Vehicle-Rev Equip Maint 40,458 59,274 32,000 27,619 32,300
Office Supplies 90,504 101,989 42,000 53,732
Repair Mat'l - Rev Eq 72,119 182,462 125,630 95,461 130,600
Repair Mat'l - Fac Mtc 84
Maint Material - Serv Veh 357,478 346,805 250,000 272,053 285,800
Maint Mat'l - Rev Eq 8,616,274 9,943,376 10,078,670 10,165,209 10,866,200
Freight 26,084 42,645 1,130 602 1,100
Equip/Furn < $5,000-Rev Eq Maint 63,612 55,164 25,000 24,917 26,100
Cleaning Suppl- Rev Equip Maint 255,202 308,128 247,100 315,015 257,000
Small Hand Tools-Rev Eq Maint 61,456 29,992 26,820 30,800 29,100
Inventory Adjustments 715,900 718,665 331,210
Other Materials- Rev Eq Maint 29,663 44,225 26,720 46,074 27,900
Unreconciled Mastercard Expense 3,407
Default Expense 14,062 -1,157
Safety Supplies-Rev Eq Maint 169,161 212,959 103,730 130,624 109,400
Winter Supplies 305,586 136,892 70,000 200,350 72,900
Obsolete Inventory 553 243 553
Invoice Price Variance -1,528 -23,192 -1,562
Average Cost Variance -2,902 731 255

MT-10
Bus Maintenance Department-Materials & Services
Expense Category FY2018 FY2019 FY2020 FY2020 FY2021
Actual Actual Budget Estimate Budget
Propulsion Power 25,181 82,800
Telephone 45,729 45,835 31,500 33,764
NU-Local Travel & Meetings 62 430 180
NU-Education & Training - Gen & Adm 21,392 25,850 3,500 4,955
NU-Out-Of-Town Travel 27,995 44,863 8,793
CDL Renewals 7,146 10,497 7,000 6,775 7,200
Employee Recognition 9,743 44,749 5,000 10,362
Rental 2,696 1,490 720 1,700
Total $24,298,497 $27,202,559 $27,175,690 $27,486,270 $31,105,800

MT-11
Facilities Management Bus-Rail Department
Summary FY2018 FY2019 FY2020 FY2021
Actual Actual Budget Estimate Proposed Approved Adopted
Personnel Services 8,630,533 9,301,758 11,041,712 10,503,477 11,077,609
Materials & Services 10,634,724 11,523,224 10,809,220 10,837,864 11,268,000
Total $19,265,257 $20,824,982 $21,850,932 $21,341,341 $22,345,609
Responsibilities: Business Plan:The Facilities Management Bus-Rail Department is responsible for managing and Customers Category maintaining facility assets, planning, acquiring/allocating resources, providing Goal #1 Satisfied Riders a safe, healthy and productive work environment. Objective #1 Provide safe service
Internal Business Practices Category Goals & Objectives: Goal #1 Deliver Safe, Efficient, and Equitable Service1) Maintenance of transit centers, MAX station platforms, park and rides, Objective #15 Provide reliable performance
layover facilities, operations and administration facilities, bus stops and shelters to Objective #17 Ensure cost-effective serviceinsure riders enjoy functional, clean and welcoming facilities. People & Innovation Category
2) Meet or exceed Federal Transit Administration (FTA) State of Good Repair Goal #2 TriMet is Where Diverse and Talented and Asset Management standards for TriMet facilities. People Want to Come, Stay, and Thrive
3) Set clear expectations and insure equitable treatment by issuing and training Objective #33 Recruit a talented workforce upon SOP's for core activities.
4) Provide regular communication and updates on agency initiatives and Performance Measures:values for all staff. 1) Monitor Key Performance Indicators (KPIs) for maintenance
5) Insure management is present in shops and in the field on a regular basis. effectiveness.2) Deliver preventive maintenance service in alignment with FTA State
of Good Repair program requirements. Demonstrated throughComputerized Maintenance Management System (CMMS) reports,relevant KPI's, and confirm through Internal, Oregon Department ofTransit (ODOT) and FTA Audits and customer satisfaction measures.
3) Reduced operating costs, demonstrated by reduced unit costs for discreteimprovement activities, overall budget conformance, and alignment withStrategic Financial Plan Guidelines.

MT-12
Facilities Management Bus-Rail Department-Personnel Services
Expense Category FY2018 FY2019 FY2020 FY2020 FY2021
Actual Actual Budget Estimate Budget
Labor 5,936,920 6,594,468 7,836,159 7,626,776 7,965,082
Fringe 2,693,613 2,707,290 3,491,882 3,157,661 3,410,239
Capitalized Labor-Fringe -286,329 -280,960 -297,712
Total $8,630,533 $9,301,758 $11,041,712 $10,503,477 $11,077,609

Facilities Management Department-Personnel Profile
Position Title Total FTE Base Salary Expense Grade Min Max
Director, Facilities Management 1.00 138,800 19 110,833 166,251
Manager, Facilities Management 2.00 204,545 16 86,398 129,597
Manager, Maintenance Project Management 1.00 110,596 17 93,951 140,927
Supervisor, Facilities Management 7.00 605,084 13 66,884 100,327
Supervisor, Facilities Management (CMMS) 1.00 80,755 13 66,884 100,327
Analyst, Operations Maintenance 2.00 113,582 11 56,173 84,261
Program Administrator, Space Planning 1.00 80,696 12 61,321 91,980
Project Coordinator, Maintenance 1.00 75,042 11 56,173 84,261
Project Manager, Maintenance 1.00 102,340 15 79,406 119,110
Technician, Engineering 1.00 68,226 10 51,431 77,145
Assistant Supervisor 1.00 84,198 0566 87,547 87,547
Assistant Supervisor Facilities 3.00 251,308 0964 79,830 79,830
Apprentice Plant Maint Mech 10.00 637,773 0572 46,259 64,834
Facilities Maintenance Trainer 2.00 168,456 0915 79,830 79,830
Maintenance Technician 5.00 337,741 0965 66,123 66,123
Plant Maintenance Mechanic 27.00 1,914,398 0557 69,410 69,410
Assistant, Senior Administrative 2.00 123,011 9 47,037 70,555
Supervisor, Electrical, Facilities Management 1.00 87,130 13 66,884 100,327
Supervisor, Landscape 1.00 81,075 12 61,321 91,980
Helper 12.00 801,299 0533 64,834 64,834
Landscaper 5.00 350,002 0974 49,587 66,123
Service Worker 15.00 775,992 0944 37,482 54,267
Service Worker Pressure Washer 4.00 229,549 0947 40,706 57,491
Wayside Cleaner 6.00 404,023 0537 66,123 66,123
Total 112.00 7,825,621
MT-13

MT-14
Facilities Management Bus-Rail Department-Materials & Services
Expense Category FY2018 FY2019 FY2020 FY2020 FY2021
Actual Actual Budget Estimate Budget
Professional & Technical-Gen & Adm 71,318 5,363 40,000 28,385 139,900
Professional & Technical - Fac Eq Mtc 19,516 1,006 10,000 5,000 10,100
Mech/Structural Consult 20,828 19,899 6,036
Temporary Help-Gen & Adm 4,170 12,518 21,216
Landscape Maint Services 781,796 800,972 952,000 843,298 963,400
Transit Mall Services 1,836,047 1,888,967 1,844,800 1,859,577 1,936,100
Contracted Build Maint 457,229 442,612 580,000 460,663 596,900
Cont ROW Mtc Station 12,901 21,447 18,000 9,000 18,200
Contracted Fac Mtc 776,128 591,913 410,000 431,042 414,100
Cont ROW Mtc Elevator 356,807 432,361 352,000 301,338 355,500
Hillsboro Parking Garage IGA 67,432 30,200 15,100 30,000
Shelter Services 186,400 163,225 191,900
Office Maint Custodial 593,876 746,032 640,670 684,819 647,100
Shelter Cleaning 675,985 687,037 735,000 627,155 756,500
Shelter Cleaning - Vandlsm 38,389 45,940 34,000 29,855 35,000
Transit Center Cleaning 327,430 320,469 320,000 303,887 329,300
Office Maintance - Other 4,321
Laundry 6,621 7,830 15,000 15,295 10,300
Other Services-Facility/Eq Maint 20,282 286,615 39,600 129,127 40,800
Waste Disposal Services 384 25,000 12,500 25,800
Office Supplies 6,390 10,056 2,145
Maint Mat'l - Snow & Ice 38,055 146,186 40,000 39,439 40,800
Maint Material - Other 414,767 324,450 190,000 268,776 195,500
Mtc Matl Outside Plant 127,969 196,449 140,000 156,622 141,400
Mtc Material Shop 96,013 90,203 70,000 78,293 70,700
Shop Equip < $5000 - Fac Eq Maint 5,207 5,542 5,000 3,165 5,100
Shelter Materials 523 14,098 124,700 149,556 30,500
Bus Stop Poles/Signage 411 25,541 14,000 57,105 19,600
Park & Ride Materials 116 894
Cleaning Suppl- Fac/Eq Maint 109,172 122,450 135,000 159,695 137,100

MT-15
Facilities Management Bus-Rail Department-Materials & Services
Expense Category FY2018 FY2019 FY2020 FY2020 FY2021
Actual Actual Budget Estimate Budget
Small Hand Tools-Fac/Eq Maint 54,802 72,322 58,000 45,902 59,400
Other Materials- Rev Eq Maint 9,222 2,689 9,000 5,810 9,100
Other Materials- Fac/Eq Maint 2,148 6,415 7,000 5,332 7,200
Unreconciled Mastercard Expense 16,060
Computer Equip under $5,000 622 4,300 2,933
Landscape Maint Material 9,935 14,733 15,000 13,185 15,500
Maint Matl Landscape 9,730 7,378 20,000 11,134 20,200
On-Street Amenities Materials 22,348 40,661 15,000 7,500 15,500
Facility Moving Expenses 10,377 14,551 7,100 39,950 7,200
Safety Supplies - Fac/Eq Maint 19,484 31,027 22,100 25,316 22,400
Transit Center Materials 135
Bikes On Transit Material 1,800
Utilities - Electricity 806,262 793,969 825,800 807,790 818,800
Utilities - Gas 258,452 252,855 270,100 231,630 266,300
Utilities - Water 1,018,808 1,129,292 1,047,600 1,113,468 1,204,900
Building Util Electric 1,124,097 1,279,086 1,181,000 1,238,905 1,235,400
VT Utilities - Electric - Fac/Eq Maint 10,744 11,828 11,150 11,625 13,600
Electricity - Shelters 15,230 19,998 20,100 19,487 19,900
Telephone 37,500 55,371 12,825
Utilities - Other 131,163 162,303 120,200 134,018 158,600
Building Util Other 125,240 131,251 115,000 123,018 139,400
Utilities Parking 35,679 33,894 35,000 33,348 35,100
Tunnel Sewer/Storm Water Runoff 1,657 1,428 4,500 2,965 3,000
NU-Dues & Subscriptions 476 1,227 158
NU-Local Travel & Meetings 1,316 2,838 131
NU-Education & Training - Gen & Adm 15,056 6,205 450
Apprenticeship Training 73,619 70,423 34,000 26,141 34,300
NU-Out-Of-Town Travel 6 1,999 226
CDL Renewals 62 62 2,000 1,000 2,000
Employee Recognition 1,712 1,181

MT-16
Facilities Management Bus-Rail Department-Materials & Services
Expense Category FY2018 FY2019 FY2020 FY2020 FY2021
Actual Actual Budget Estimate Budget
Rental 41,147 55,729 38,200 43,414 38,600
Total $10,634,724 $11,523,224 $10,809,220 $10,837,864 $11,268,000

MT-17
Rail Maintenance of Way Department
Summary FY2018 FY2019 FY2020 FY2021
Actual Actual Budget Estimate Proposed Approved Adopted
Personnel Services 10,137,687 10,636,489 12,334,135 11,466,518 13,533,362
Materials & Services 7,174,082 7,528,882 6,834,300 7,053,383 7,255,400
Total $17,311,769 $18,165,371 $19,168,435 $18,519,901 $20,788,762
Responsibilities: Business Plan:The Rail Maintenance of Way Department is responsible for maintenance of Customers Category all "railroad" elements of TriMet's light rail system; including track, traction Goal #1 Satisfied Riders electrification, rail signals, and bridge and tunnel trackway. Under a services Objective #1 Provide safe service reimbursement agreement with the City of Portland, Portland's Streetcar track, Internal Business Practices Category electrification, and rail signals are also maintained. Goal #1 Deliver Safe, Efficient, and Equitable Service
Objective #15 Provide reliable performanceGoals & Objectives: Objective #17 Ensure cost-effective service1) Manage preventive and corrective maintenance for safe and reliable performance. People & Innovation Category2) Respond to equipment defects during Revenue Service. Perform heavy Goal #2 TriMet is Where Diverse and Talented
maintenance activities during non-revenue time. People Want to Come, Stay, and Thrive3) Manage contracts for procurement of maintenance of way materials, Objective #33 Recruit a talented workforce
services, and capital project activities to ensure cost-effective service.4) Ongoing productivity improvement through frontline employee involvement. Performance Measures:
1) Maintain light rail system railway elements in "as new" condition inalignment with FTA State of Good Repair program requirements.
2) Monitor KPI and maintenance work order system reports for on-timecompletion of preventive and corrective maintenance.
3) Perform Rail Maintenance of Way capital projects on-time andwithin budget.
4) Increased frontline employee engagement in system improvementactivities.

MT-18
Rail Maintenance of Way Department-Personnel Services
Expense Category FY2018 FY2019 FY2020 FY2020 FY2021
Actual Actual Budget Estimate Budget
Labor 7,121,886 7,644,255 8,446,390 8,125,354 9,564,829
Fringe 3,022,443 2,992,502 3,887,745 3,348,569 3,968,533
Capitalized Labor-Fringe -6,642 -268 -7,405
Total $10,137,687 $10,636,489 $12,334,135 $11,466,518 $13,533,362

Rail MOW Department-Personnel Profile
Position Title Total FTE Base Salary Expense Grade Min Max
Director, MOW Operations 1.00 122,330 19 110,833 166,251
Manager, Rail Maintenance of Way (MOW) 3.00 335,947 16 86,398 129,597
Supervisor, Rail MOW 10.00 916,422 14 72,900 109,351
Coordinator, MOW Projects 2.00 168,984 13 66,884 100,327
Engineer, MOW 1.00 117,440 17 93,951 140,927
Assistant Supervisor 3.00 271,378 0566 87,547 87,547
Assistant Supervisor MOW 2.00 172,973 0564 83,574 83,574
Assistant Supervisor Signals 3.00 259,224 0556 83,574 83,574
Maintenance of Way Laborer 11.00 696,428 0561 38,771 68,058
MMIS Clerk 1.00 65,042 0543 34,403 63,690
Overhead Traction Apprentice 2.00 129,667 0569 46,467 64,834
Power Maintainer 21.00 1,629,142 0531 76,128 76,128
Signal Maintainer Apprentice 7.00 435,261 0568 46,259 64,834
Signals Maintainer 24.00 1,765,802 0541 72,675 72,675
Track Maintainer 17.00 1,260,469 0540 72,675 72,675
Traction Substation Technician 10.00 788,478 0779 76,128 76,128
Traction Substation Technician Apprentice 2.00 129,667 0570 46,467 64,834
Assistant, Senior Administrative 1.00 60,466 9 47,037 70,555
Total 121.00 9,325,120
MT-19

MT-20
Rail Maintenance of Way Department-Materials & Services
Expense Category FY2018 FY2019 FY2020 FY2020 FY2021
Actual Actual Budget Estimate Budget
Professional & Technical-Gen & Adm 7,463 278 4,300 2,150 129,300
Landscape Maint Services 12,284 10,357 12,000 28,335 12,100
Cont ROW Mtc Power Fac 2,500 1,250 2,500
Cont ROW Mtc Signals 9,148 3,035 50,000 25,000 50,500
Cont ROW Mtc Track 281,516 248,567 195,000 175,948 197,000
Cont ROW Mtc OCS 34,872 4,898 25,000 19,000 25,300
Cont ROW Mtc Bridge 10,823 12,423 54,000 36,519 54,500
Cont ROW Mtc Substations 11,947 85,100 60,000 69,340 60,600
Street Light Maintenance -- Hillsboro IGA 35,215 10,500 5,250 10,600
Calibration & Tool Repair 11,605 20,381 15,000 14,681 15,200
Laundry 5,000 2,500 11,200
Other Services-Facility/Eq Maint 5,203 1,173 11,000 6,440 11,100
Office Supplies 14,028 15,606 3,569
Computer Supplies - Trans Admin 5,374 13,478 6,000 10,606 21,100
Freight 9 3,588 2,200 2,016 2,200
Mtc Material Shop 69
Cleaning Suppl- Fac/Eq Maint 505
Small Hand Tools-Fac/Eq Maint 96,589 127,337 41,000 50,087 44,000
Other Materials- Gen & Adm 16,874
Other Materials- Rev Eq Maint 13,520 12,971 20,000 15,229 20,200
Unreconciled Mastercard Expense 41
Safety Supplies - Fac/Eq Maint 81,232 47,056 36,000 34,246 39,400
Obsolete Inventory 37
Materials - Track 172,781 309,851 170,000 168,285 171,700
Maint Matl Signals 361,273 541,094 170,000 464,239 171,700
Maint Materials Comm/Video 54,989
Maint Materials OCS 82,650 115,669 60,000 68,396 60,600
Maint Matl Substations 33,169 148,633 40,000 114,555 40,400
Propulsion Power 5,249,751 5,272,389 5,407,200 5,255,092 5,713,500
Telephone 156,377 176,547 18,648

MT-21
Rail Maintenance of Way Department-Materials & Services
Expense Category FY2018 FY2019 FY2020 FY2020 FY2021
Actual Actual Budget Estimate Budget
PI/PD Expense 16,248 -10,120 100,000 50,000
NU-Dues & Subscriptions 551 865 1,512
NU-Local Travel & Meetings 19,530 90
NU-Education & Training - Gen & Adm 13,007 22,475
NU-Out-Of-Town Travel 11,480 5,027 1,726
Steel Bridge Sublease 348,646 338,117 329,600 404,158 382,600
CDL Renewals 720 1,000 500 1,000
Employee Recognition 2,634 1,997 606
Rental 1,922 7,000 3,500 7,100
Total $7,174,082 $7,528,882 $6,834,300 $7,053,383 $7,255,400
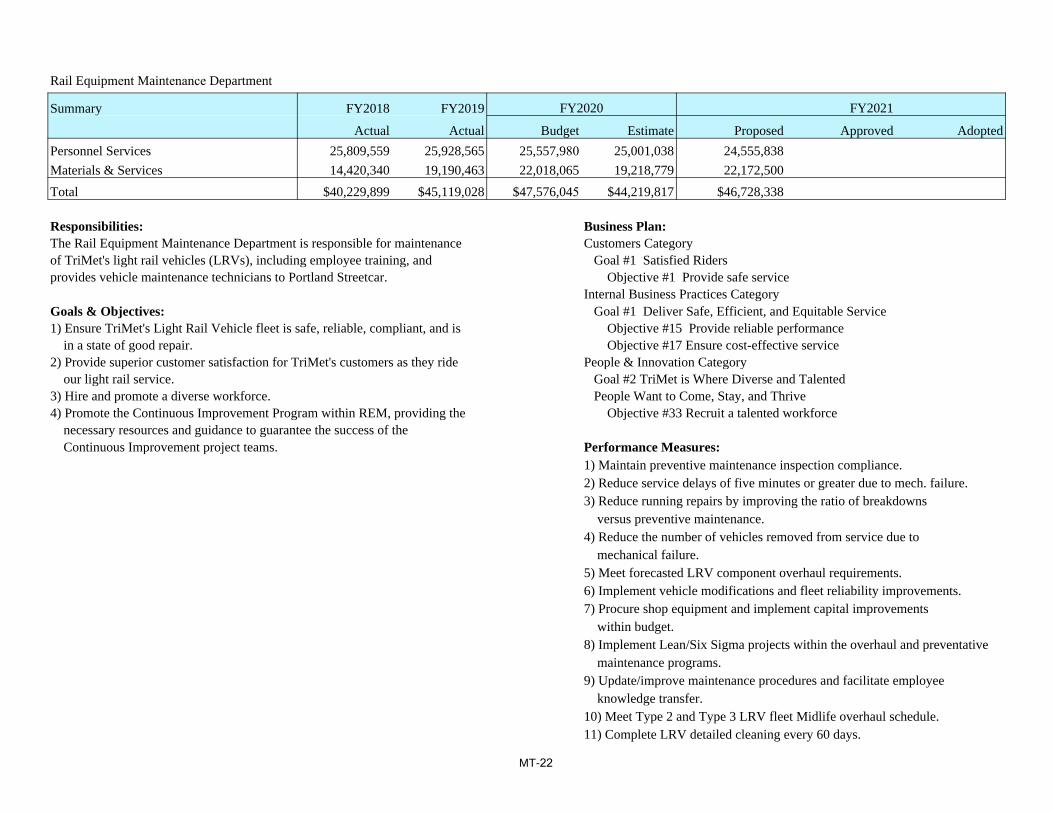
MT-22
Rail Equipment Maintenance Department
Summary FY2018 FY2019 FY2020 FY2021
Actual Actual Budget Estimate Proposed Approved Adopted
Personnel Services 25,809,559 25,928,565 25,557,980 25,001,038 24,555,838
Materials & Services 14,420,340 19,190,463 22,018,065 19,218,779 22,172,500
Total $40,229,899 $45,119,028 $47,576,045 $44,219,817 $46,728,338
Responsibilities: Business Plan:The Rail Equipment Maintenance Department is responsible for maintenance Customers Category of TriMet's light rail vehicles (LRVs), including employee training, and Goal #1 Satisfied Riders provides vehicle maintenance technicians to Portland Streetcar. Objective #1 Provide safe service
Internal Business Practices Category Goals & Objectives: Goal #1 Deliver Safe, Efficient, and Equitable Service1) Ensure TriMet's Light Rail Vehicle fleet is safe, reliable, compliant, and is Objective #15 Provide reliable performance
in a state of good repair. Objective #17 Ensure cost-effective service2) Provide superior customer satisfaction for TriMet's customers as they ride People & Innovation Category
our light rail service. Goal #2 TriMet is Where Diverse and Talented 3) Hire and promote a diverse workforce. People Want to Come, Stay, and Thrive4) Promote the Continuous Improvement Program within REM, providing the Objective #33 Recruit a talented workforce
necessary resources and guidance to guarantee the success of theContinuous Improvement project teams. Performance Measures:
1) Maintain preventive maintenance inspection compliance.2) Reduce service delays of five minutes or greater due to mech. failure.3) Reduce running repairs by improving the ratio of breakdowns
versus preventive maintenance.4) Reduce the number of vehicles removed from service due to
mechanical failure.5) Meet forecasted LRV component overhaul requirements.6) Implement vehicle modifications and fleet reliability improvements.7) Procure shop equipment and implement capital improvements
within budget.8) Implement Lean/Six Sigma projects within the overhaul and preventative
maintenance programs.9) Update/improve maintenance procedures and facilitate employee
knowledge transfer.10) Meet Type 2 and Type 3 LRV fleet Midlife overhaul schedule.11) Complete LRV detailed cleaning every 60 days.

MT-23
Rail Equipment Maintenance Department-Personnel Services
Expense Category FY2018 FY2019 FY2020 FY2020 FY2021
Actual Actual Budget Estimate Budget
Labor 18,198,893 18,114,968 17,461,969 17,365,525 16,965,014
Fringe 7,610,666 7,813,597 8,096,011 7,638,437 7,590,824
Capitalized Labor-Fringe -2,924
Total $25,809,559 $25,928,565 $25,557,980 $25,001,038 $24,555,838

Rail Equip Maint Department-Personnel Profile
Position Title Total FTE Base Salary Expense Grade Min Max
Director, Rail Equipment Maintenance 1.00 134,127 20 120,234 180,349
Manager, Rail Equipment Maintenance 3.00 322,564 16 86,398 129,597
Supervisor, Rail Maintenance 14.00 1,244,279 14 72,900 109,351
Inspector, REM 1.00 89,779 14 72,900 109,351
Project Manager, Assistant, REM 2.00 188,708 14 72,900 109,351
Technician CAD 1.00 70,429 11 56,173 84,261
Assistant Supervisor Rail 6.00 488,862 0529 79,830 79,830
Helper 3.00 199,597 0533 64,834 64,834
LRV Apprentice 19.00 1,083,243 0573 46,259 64,834
LRV Mechanic 115.00 8,203,874 0551 69,410 69,410
LRV Vehicle Body & Paint Technician 4.00 268,392 0553 52,770 67,392
Maintenance Mechanic 2.00 132,246 0532 37,627 66,123
MMIS Clerk 1.00 63,690 0543 34,403 63,690
MMIS Timekeeper Clerk 3.00 173,555 0543 34,403 63,690
Service Worker 47.00 2,344,745 0944 37,482 54,267
Wheel True Technician 8.00 590,137 0552 69,846 69,846
Assistant, Senior Administrative 2.00 112,590 9 47,037 70,555
Engineer, REM 2.00 208,596 17 93,951 140,927
Manager, REM Technical Support 1.00 112,933 18 102,080 153,120
Technical Support Assistant, REM 1.00 88,019 11 56,173 84,261
Total 236.00 16,120,365
MT-24

MT-25
Rail Equipment Maintenance Department-Materials & Services
Expense Category FY2018 FY2019 FY2020 FY2020 FY2021
Actual Actual Budget Estimate Budget
Professional & Technical-Gen & Adm 127,715 251,109 4,000 77,107 200,000
Temporary Help-Trans Adm 1,000 500 1,000
Calibration & Tool Repair 19,512 11,352 14,500 15,628 14,600
Contr Maint - Type I LRV-Rev Eq Maint 800 1,683,367 11,845,300 7,592,888 11,940,500
Laundry 132,837 151,088 120,220 116,475 121,400
Other Services- Gen & Adm 17,268 11,847 5,000 7,368 5,100
Other Services- Revenue Veh.Maint 5,032 7,546 16,000 9,289 16,200
Graphics Material 333 427 1,000 1,018 1,000
Office Supplies 39,007 37,121 11,392
Computer Supplies - Trans Admin 33,654 51,823 13,000 18,735 13,100
Maint Matl LRV 1 Overhaul 6,781,508
VT Maint Material - Rev Eq Mtc 1,227
Repair Mat'l - Rev Eq 4,382 42,317 24,000 24,814 24,200
Rep Mat'l Rev Eq Vndlsm 32,148 19,821 43,500 31,163 43,900
Maint Material - Serv Veh 4,362 4,556 2,459
Maint Mat'l - Rev Eq 5,782,852 15,812,223 9,257,000 10,470,421 9,113,600
Freight 206,227 166,399 100,000 127,189 101,000
Equip/Furn < $5,000-Rev Eq Maint 5,081 3,914
Equip/Furn < $5,000-Gen & Adm 29,265 3,817 10,493
Shop Equip < $5000 - Fac Eq Maint 104,099 108,903 107,000 123,551 108,100
Cleaning Suppl- Rev Equip Maint 177,501 218,312 130,400 165,629 131,700
Small Hand Tools-Fac/Eq Maint 78,692 65,160 58,000 64,314 58,600
Inventory Adjustments 177,345 107,499 32,248
Other Materials- Gen & Adm 49
Other Materials- Transp Adm 222 293
Other Materials- Rev Eq Maint 200,949 228,841 195,000 205,807 197,000
Unreconciled Mastercard Expense 6,683 1,089
Default Expense 195
Computer Equip under $5,000 2,500 1,250
Safety Supplies- Gen & Adm 122,316 104,461 78,600 76,191 79,400

MT-26
Rail Equipment Maintenance Department-Materials & Services
Expense Category FY2018 FY2019 FY2020 FY2020 FY2021
Actual Actual Budget Estimate Budget
Obsolete Inventory 28,336 772
Invoice Price Variance -2,772 358 -1,601
Average Cost Variance -553 1,279 -214
Maint Matl Fare Equip 1,320 140
Telephone 23,256 34,186 12,480
NU-Local Travel & Meetings 287 503
Local Travel & Meetings Non Training 121
NU-Education & Training - Gen & Adm 25,370 17,075 10,200
NU-Out-Of-Town Travel 4,519 11,331 5,402
UN-Out-Of-Town Travel 2,911
Out-Of-Town Travel Non Training 438
Inventory Adjustment Expense 270,825
CDL Renewals 688 720 2,045 1,023 2,100
Employee Recognition 7,561 2,796 350
Total $14,420,340 $19,190,463 $22,018,065 $19,218,779 $22,172,500

IT-1
INFORMATION TECHNOLOGY DIVISION
Summary FY2018 FY2019 FY2020 FY2021
Actual Actual Budget Estimate Proposed Approved Adopted
Personnel Services 6,570,821 8,323,011 10,394,030 10,244,228 12,079,615
Materials & Services 4,535,516 5,103,990 7,865,605 6,939,968 8,169,000
Total $11,106,337 $13,427,001 $18,259,635 $17,184,196 $20,248,615
Information Technology Division PageDivision Summary ....................................................................................... IT-1IT Administration ........................................................................................ IT-2IT Operations & Infrastructure .................................................................... IT-6Information Security .................................................................................... IT-10Enterprise Systems ...................................................................................... IT-14Intelligent Transportation Systems .............................................................. IT-18

IT-2
IT Administration Department
Summary FY2018 FY2019 FY2020 FY2021
Actual Actual Budget Estimate Proposed Approved Adopted
Personnel Services 6,570,821 8,323,011 689,676 505,327 788,639
Materials & Services 4,535,516 5,103,990 6,700,355 5,694,566 7,319,200
Total $11,106,337 $13,427,001 $7,390,031 $6,199,893 $8,107,839
Responsibility: Business Plan:The Information Technology Department is responsible for managing Internal Business Practice information resources including corporate data, computing tools and networks Goal #1 Deliver Safe, Efficient, and Equitable Service used to carry out agency-wide business processes and management goals. Objective #14 Increase personal safety
Objective #15 Provide reliable performance Goals & Objectives Objective #18 Increase resiliency 1) Provide technical support. Goal #2 Design and Deliver Successful Projects2) Provide consulting services. Objective #22 Improve existing MAX infrastructure for reliability3) Complete business process analysis. and capacity4) Perform data modeling and design.5) Manage shared data repository. Performance Measures:6) Provide system development standards. 1) Network and server availability exceeding 99% uptime,7) Perform project development and maintenance. measured on a 24-hour basis using industry criteria.8) Complete hardware and software acquisition. 2) Maintain a technical service request resolution rate of 95% per week9) Manage metropolitan-wide networks. witn an average completion time not exceeding four (4) hours.10) Manage desktop connectivity, e-mail and Internet. 3) IT project selection and execution is closely aligned with the agency's11) Manage telephone and voice systems. strategic goals and priorities.12) Manage system and network security.13) Provide application training and support.
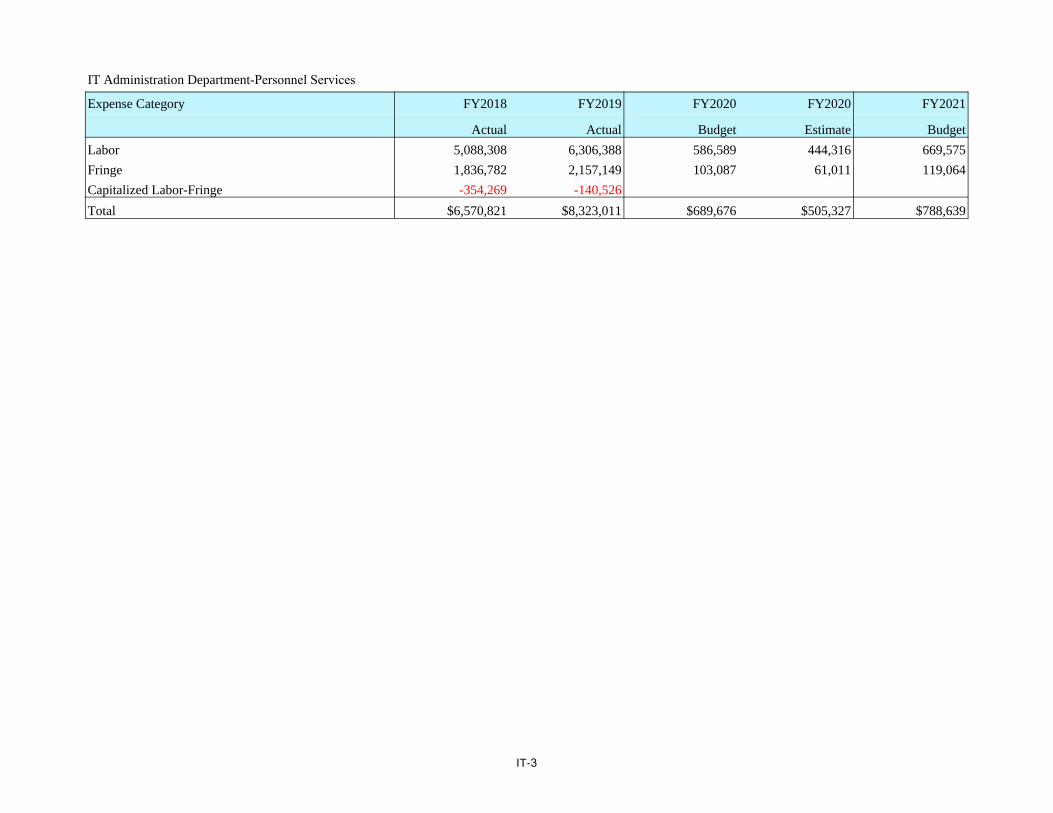
IT-3
IT Administration Department-Personnel Services
Expense Category FY2018 FY2019 FY2020 FY2020 FY2021
Actual Actual Budget Estimate Budget
Labor 5,088,308 6,306,388 586,589 444,316 669,575
Fringe 1,836,782 2,157,149 103,087 61,011 119,064
Capitalized Labor-Fringe -354,269 -140,526
Total $6,570,821 $8,323,011 $689,676 $505,327 $788,639

IT Admin-Personnel Profile
Position Title Total FTE Base Salary Expense Grade Min Max
Chief Information Officer 1.00 222,688 26 192,765 289,147
Executive Administrative Assistant 1.00 75,774 11 56,173 84,261
Total 2.00 298,462
IT-4

IT-5
IT Administration Department-Materials & Services
Expense Category FY2018 FY2019 FY2020 FY2020 FY2021
Actual Actual Budget Estimate Budget
PCI Compliance Audit 47,550 3,867
Professional & Technical-Gen & Adm 455,097 607,525 150,000 125,307 180,000
Temporary Help-Gen & Adm 364,962 566,674 60,800 30,400 10,300
Microcomputer Mtc Serv 903 788
Communication Systems Maintenance 400,305 414,462
Computer Hardware Maint-Fac Maint 155,958 138,468
Software Maintenance 40,503 20,252
Warranty Costs 294,436 410,966 1,054,620 676,490 35,200
Other Services- Gen & Adm 3,275 3,253 3,500 2,975 8,300
Office Supplies 949 941 1,100 784 1,000
Other Materials- Gen & Adm 11,030 62,751 8,060 7,652 8,100
Unreconciled Mastercard Expense 326
Microcomputer Software 7,926 4,630 8,000 6,689 8,100
PCI Compliance Equipment 4,290 3,584
Microcomputer Mtc Mat'l 12,827 18,092
Telephone 14,340 21,817 17,500 14,754 20,000
Network Access Services 59,893 69,387
NU-Dues & Subscriptions 10,645 6,850 8,000 11,623 8,100
NU-Local Travel & Meetings 312 2,533 1,000 1,553 2,000
NU-Education & Training - Gen & Adm 36,158 24,689 33,800 27,020 50,000
NU-Out-Of-Town Travel 24,142 20,326 26,840 21,807 36,000
Employee Recognition 1,011 986 1,000 570 1,000
Software License Fees 2,588,678 2,701,149 5,326,135 4,766,942 6,951,100
Total $4,535,516 $5,103,990 $6,700,355 $5,694,566 $7,319,200

IT-6
IT Operations & Infrastructure Department
Summary FY2018 FY2019 FY2020 FY2021
Actual Actual Budget Estimate Proposed Approved Adopted
Personnel Services 2,292,051 2,482,933 3,134,867
Materials & Services 744,150 800,285 512,300
Total $3,036,201 $3,283,218 $3,647,167
Responsibility: Business Plan:The Operations & Infrastructure Department is responsible for the planning, Internal Business Practice design, implementation, operations and standards for IT supported enterprise- Goal #1 Deliver Safe, Efficient, and Equitable Service wide infrastructure in a high availability environment that is spread across Objective #14 Increase personal safetygeographically separated facilities to ensure stability of mission critical systems Objective #15 Provide reliable performance in the event of unplanned, disruptive events. Objective #18 Increase resiliency
Goal #2 Design and Deliver Successful ProjectsGoals & Objectives Objective #22 Improve existing MAX infrastructure for reliability1) Maintain a high availability network, ensuring uptime to maintain business and capacity
productivity.2) Evaluates new technologies and methods to ensure alignment with best Performance Measures:
practices in technology infrastructure, information security and system 1) Ensure services maintain 99% uptime for unplanned outages.operations. 2) Maintain a technical service request resolution rate of 95% per week
3) Ensures infrastructure is properly architected and sized to deliver reliable with an average completion time not exceeding four (4) hours.performance and failover and recovery systems are in place; replacement 3) Projects are delivered on time and on budget.schedules are followed; monitoring/alerting programs are in place; andproper inventories are maintained.
4) Manage telephone and voice systems.5) Manage physical infrastructure for communication rooms, cabinets
and data centers including fiber inventory, Uninterruptible Powersupply (UPS) and generator monitoring.
6) Manage desktop systems including personal computers, printers, etc.7) Administer the Mobile Device Management system.8) Purchase and setup of agency software and hardware.

IT-7
IT Operations & Infrastructure Department-Personnel Services
Expense Category FY2018 FY2019 FY2020 FY2020 FY2021
Actual Actual Budget Estimate Budget
Labor 1,995,885 2,050,366 2,580,330
Fringe 701,254 644,372 841,812
Capitalized Labor-Fringe -405,088 -211,805 -287,275
Total $2,292,051 $2,482,933 $3,134,867

IT Operations & Infrastructure Department-Personnel Profile
Position Title Total FTE Base Salary Expense Grade Min Max
Director, IT Operations & Infrastructure 1.00 158,590 21 130,346 195,520
Manager, Network Communications 1.00 95,333 18 102,080 153,120
Manager, Physical Infrastructure 1.00 131,547 18 102,080 153,120
Manager, Servers & Storage 1.00 63,067 18 102,080 153,120
Manager, Technical Services 1.00 108,096 17 93,951 140,927
Systems Engineer (Server Administration) 1.00 92,087 15 79,406 119,110
Mobile Device Engineer 2.00 136,165 14 72,900 109,351
Network Engineer, Senior (Communications) 3.00 364,931 18 102,080 153,120
Network Engineer (Communications) 1.00 93,994 16 86,398 129,597
Network Engineer (Fiber) 3.00 296,456 14 72,900 109,351
Specialist, Technical Support 5.00 340,986 12 61,321 91,980
Systems Engineer, Senior (Server Administration) 4.00 406,414 16 86,398 129,597
Systems Engineer, Server Administration 1.00 53,378 16 86,398 129,597
Telecommunications Engineer 2.00 188,394 16 86,398 129,597
Virtual Desktop Engineer 1.00 41,323 13 66,884 100,327
Total 28.00 2,570,761
IT-8

IT-9
IT Operations & Infrastructure Department-Materials & Services
Expense Category FY2018 FY2019 FY2020 FY2020 FY2021
Actual Actual Budget Estimate Budget
Professional & Technical-Gen & Adm 8,200 7,907 9,400
Temporary Help-Gen & Adm 130,000 180,866 225,000
Microcomputer Mtc Serv 1,500 943 1,000
Communication Systems Maintenance 405,000 412,309 50,100
Computer Hardware Maint-Fac Maint 110,000 120,271 80,800
Other Materials- Gen & Adm 5,000 5,374 46,000
Microcomputer Mtc Mat'l 12,500 8,721 10,000
Network Access Services 71,950 63,894 90,000
Total $744,150 $800,285 $512,300

IT-10
Information Security Department
Summary FY2018 FY2019 FY2020 FY2021
Actual Actual Budget Estimate Proposed Approved Adopted
Personnel Services 499,719 493,496 688,687
Materials & Services 87,700 147,413 115,000
Total $587,419 $640,909 $803,687
Responsibility: Business Plan:The Information Security Department's mission is to design, Internal Business Practice implement and maintain an information security program that protects the Goal #1 Deliver Safe, Efficient, and Equitable Service agencies systems, services, and data against unauthorized use, disclosure, Objective #15 Provide reliable performance modification, damage, and loss. The Information Security Department is Objective #18 Increase resiliency committed to engaging the TriMet community to establish an appropriate information security governance structure that enables collaboration and Performance Measures:support for new initiatives, while adhering to the Agency Vision, Mission, 1) Automate a significant portion of Tier I & Tier II workloadsand Values. with the new technologies.
2) Eliminate or significantly reduce all agency critical and highGoals & Objectives vulnerabilities.1) Perform complex analysis and threat hunting in the entire TriMet 3) Publish appropriate policies.
environment. 4) Build out dashboards and reporting for all cyber security2) Deploy and operationalize Endpoint Detection & Response Platform. related activities.3) Deploy and operationalize Security Operations Automation Response 5) Reduced incident recovery time.
platform (SOAR).4) Integrate agency cybersecurity solutions into SOAR tool.

IT-11
Information Security Department-Personnel Services
Expense Category FY2018 FY2019 FY2020 FY2020 FY2021
Actual Actual Budget Estimate Budget
Labor 369,685 377,269 576,063
Fringe 130,034 116,227 183,540
Capitalized Labor-Fringe -70,916
Total $499,719 $493,496 $688,687

Information Security Department-Personnel Profile
Position Title Total FTE Base Salary Expense Grade Min Max
Director, Information Security 1.00 154,533 21 130,346 195,520
Analyst, Cybersecurity 2.00 136,165 14 72,900 109,351
Analyst, Senior, Network Ops & Cybersecurity 3.00 285,365 17 93,951 140,927
Total 6.00 576,063
IT-12

IT-13
Information Security Department-Materials & Services
Expense Category FY2018 FY2019 FY2020 FY2020 FY2021
Actual Actual Budget Estimate Budget
PCI Compliance Audit 87,700 147,413 100,000
Other Materials- Gen & Adm 15,000
Total $87,700 $147,413 $115,000

IT-14
Enterprise Systems Department
Summary FY2018 FY2019 FY2020 FY2021
Actual Actual Budget Estimate Proposed Approved Adopted
Personnel Services 4,687,482 4,510,638 4,903,789
Materials & Services 277,900 257,531 191,000
Total $4,965,382 $4,768,169 $5,094,789
Responsibility: Business Plan:The Enterprise Systems Department is responsible for the following major Financial Categoryfunctions: solution development, maintenance, monitoring and automation for Goal #2 Manage Assets to Ensure Safety and Optimize Value,custom, open-source and off-the-shelf applications, data management and Performance, and Resiliencyadministration, information technology planning and project management, Objective #37 Meet or exceed state of good repair targets for allsystems/process analysis and development of long-term information identified asset classestechnology strategies. People and Innovation Category
Goal #2 TriMet is where diverse and talented people comeGoals & Objectives: to stay and thrive1) Development and implementation of Information Technology Service Objective #30 Ensure open and honest communication
Management (ITSM) best practices. between management and front-line employees2) Increase transparency on project status and resource allocations. Internal Business Practice Category3) Foster growth in Business Intelligence and DevOps focus areas. Goal #1 Deliver Safe, Efficient, and Equitable Service 4) Lead the technical assessment, selection and implementation of Objective #16 Improve Service Delivery
new technologies for the agency.5) Maintenance and development of the Information Technology (IT) Performance Measures:
Strategic Plan. 1) Implementation of agency-wide solutions for technology modernization6) Promote maintenance and enhancement of existing systems that work to improve data analysis and data and document sharing.
well, without incurring capital investment. 2) Continued development information technology policies, standardsand guidelines.
3) Increase automation and monitoring for all aspects of solutionconstruction and development.
4) Implementation of the IT Project Management Office (PMO).5) Map strategies for data warehouse implementation and on-demand data
analysis for non-technical users.

IT-15
Enterprise Systems Department-Personnel Services
Expense Category FY2018 FY2019 FY2020 FY2020 FY2021
Actual Actual Budget Estimate Budget
Labor 3,486,937 3,412,494 3,713,733
Fringe 1,263,835 1,133,803 1,219,269
Capitalized Labor-Fringe -63,290 -35,659 -29,213
Total $4,687,482 $4,510,638 $4,903,789

Enterprise Systems Department-Personnel Profile
Position Title Total FTE Base Salary Expense Grade Min Max
Director, Enterprise Systems 1.00 155,759 22 141,179 211,771
Manager, Data Sciences 1.00 68,474 19 110,833 166,251
Manager, Enterprise Systems Development 1.00 135,000 18 102,080 153,120
Manager, Oracle Technology 1.00 133,818 19 110,833 166,251
Manager, Strategic Planning & PMO 1.00 133,000 19 110,833 166,251
Analyst, IT Systems 5.00 475,191 15 79,406 119,110
Database Architect 2.00 236,398 18 102,080 153,120
Enterprise Architect 1.00 80,687 16 86,398 129,597
Oracle Applications DBA 3.00 399,726 17 93,951 140,927
Oracle Developer 3.00 374,454 17 93,951 140,927
Project Manager, IT 2.00 229,094 17 93,951 140,927
Software Engineer 7.00 711,254 15 79,406 119,110
Software Engineer, Senior 3.00 363,949 18 102,080 153,120
Software Engineer, Senior (Dev/Ops) 1.00 128,910 18 102,080 153,120
Technical Writer 1.00 88,019 14 72,900 109,351
Total 33.00 3,713,733
IT-16

IT-17
Enterprise Systems Department-Materials &Services
Expense Category FY2018 FY2019 FY2020 FY2020 FY2021
Actual Actual Budget Estimate Budget
Professional & Technical-Gen & Adm 210,000 200,727 120,000
Temporary Help-Gen & Adm 62,900 52,901 50,000
Other Materials- Gen & Adm 5,000 3,903 21,000
Total $277,900 $257,531 $191,000

IT-18
Intelligent Transportation Systems Department
Summary FY2018 FY2019 FY2020 FY2021
Actual Actual Budget Estimate Proposed Approved Adopted
Personnel Services 2,225,102 2,251,834 2,563,633
Materials & Services 55,500 40,173 31,500
Total $2,280,602 $2,292,007 $2,595,133
Responsibility: Business Plan:The Intelligent Transportation Systems (ITS) Department is responsible for Internal Business Practice Categorypurchasing, developing, maintaining and managing all mission critical Goal #1 Deliver Safe, Efficient, and Equitable Service information systems and data required for daily and emergency transit Objective #15 Provide reliable performance operations. Major systems include: Land Mobile Radio (LMR), Light Rail Objective #16 Improve Service Delivery Control (AIM CCS), Fixed Route and ParaTransit Bus Dispatch (ITCS Goal #3 Business Practices that Create Value CAD/AVL), Closed Circuit Television (CCTV), Physical Intrusion Detection and Spur Innovation and Continuous Improvement Systems, EFare (HOP Fastpass), Electronic Point of Sale (ePOS at TTO) and Objective #23 Maximize benefits and potential of Hop Fastpass Transit Signal Priority (TSP). Customers
Goal #1 Satisfied Riders Goals & Objectives: Objective #6 Achieve market acceptance of Hop Fastpass as a 1) Ensure that major ITS systems are functioning as intended with downtime fare instrument
limited to system upgrades, security and maintenance software patching.2) Improve ITS systems in conjunction with the Transportation Division Performance Measures:
to ensure that TriMet service is efficient and effective as possible. 1) Measure uptime of 95%, with downtime limited to upgrades and3) Provide real time and post operational data from ITS systems for; security, maintenance and patching.
customer service information systems, system analysis and all other 2) Successful completion of Rail Operations Optimization TechnologyTriMet and regional partners. (ROOT) pilot.
3) Ensure NextGen Transit Signal Priority (TSP) is in place for DivisionTransit Project launch.
4) Complete remaining Hop Fastpass project on time and within budget.

IT-19
Intelligent Transportation Systems Department-Personnel Services
Expense Category FY2018 FY2019 FY2020 FY2020 FY2021
Actual Actual Budget Estimate Budget
Labor 1,771,826 1,779,449 2,140,277
Fringe 588,215 542,874 621,474
Capitalized Labor-Fringe -134,939 -70,489 -198,118
Total $2,225,102 $2,251,834 $2,563,633

Intelligent Transportation Systems Department-Personnel Profile
Position Title Total FTE Base Salary Expense Grade Min Max
Director, Intelligent Transportation Systems 1.00 170,619 21 130,346 195,520
Manager, ITS Fare Revenue Systems 1.00 68,474 19 110,833 166,251
Manager, OCC Systems 1.00 133,818 19 110,833 166,251
Software Engineer, Senior 3.00 380,575 18 102,080 153,120
Systems Engineer 1.00 105,421 16 86,398 129,597
Systems Engineer (ATP) 1.00 118,078 16 86,398 129,597
Systems Engineer (LMR) 2.00 250,331 18 102,080 153,120
Systems Engineer (Safety & Security) 2.00 133,360 16 86,398 129,597
Systems Engineer, Senior (CAD/AVL) 1.00 114,453 18 102,080 153,120
Systems Engineer, Senior (Fare Systems) 2.00 232,399 18 102,080 153,120
Systems Engineer, Senior (Rail) 2.00 229,136 18 102,080 153,120
Systems Engineer, Senior (Vehicle Technologies) 1.00 121,468 18 102,080 153,120
Systems Engineer, Senior (Vehicle Technologies) 1.00 82,144 13 66,884 100,327
Total 19.00 2,140,276
IT-20
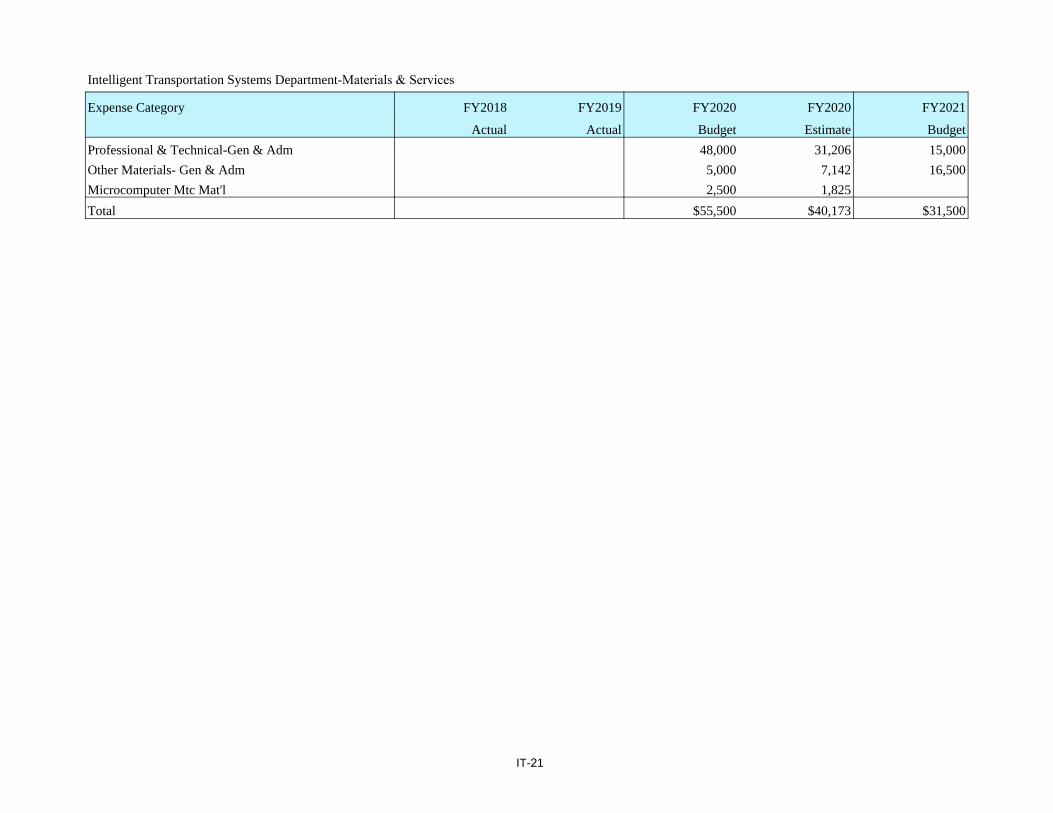
IT-21
Intelligent Transportation Systems Department-Materials & Services
Expense Category FY2018 FY2019 FY2020 FY2020 FY2021
Actual Actual Budget Estimate Budget
Professional & Technical-Gen & Adm 48,000 31,206 15,000
Other Materials- Gen & Adm 5,000 7,142 16,500
Microcomputer Mtc Mat'l 2,500 1,825
Total $55,500 $40,173 $31,500

IT-22
[This Page Left Intentionally Blank]

PA-1
PUBLIC AFFAIRS DIVISION
Summary FY2018 FY2019 FY2020 FY2021
Actual Actual Budget Estimate Proposed Approved Adopted
Personnel Services 7,878,266 8,326,581 9,928,344 9,673,473 10,142,733
Materials & Services 7,465,608 7,100,782 8,065,994 6,871,962 8,820,700
Total $15,343,874 $15,427,363 $17,994,338 $16,545,435 $18,963,433
Public Affairs Division PageDivision Summary ...................................................................................... PA-1Public Affairs Administration ..................................................................... PA-2Planning & Policy ....................................................................................... PA-6GIS & Location Based Services .................................................................. PA-10Transit Equity, Inclusion & Community Affairs ......................................... PA-13Government Services and Public Affairs .................................................... PA-17Communications & Marketing .................................................................... PA-21Customer Information Services ................................................................... PA-25
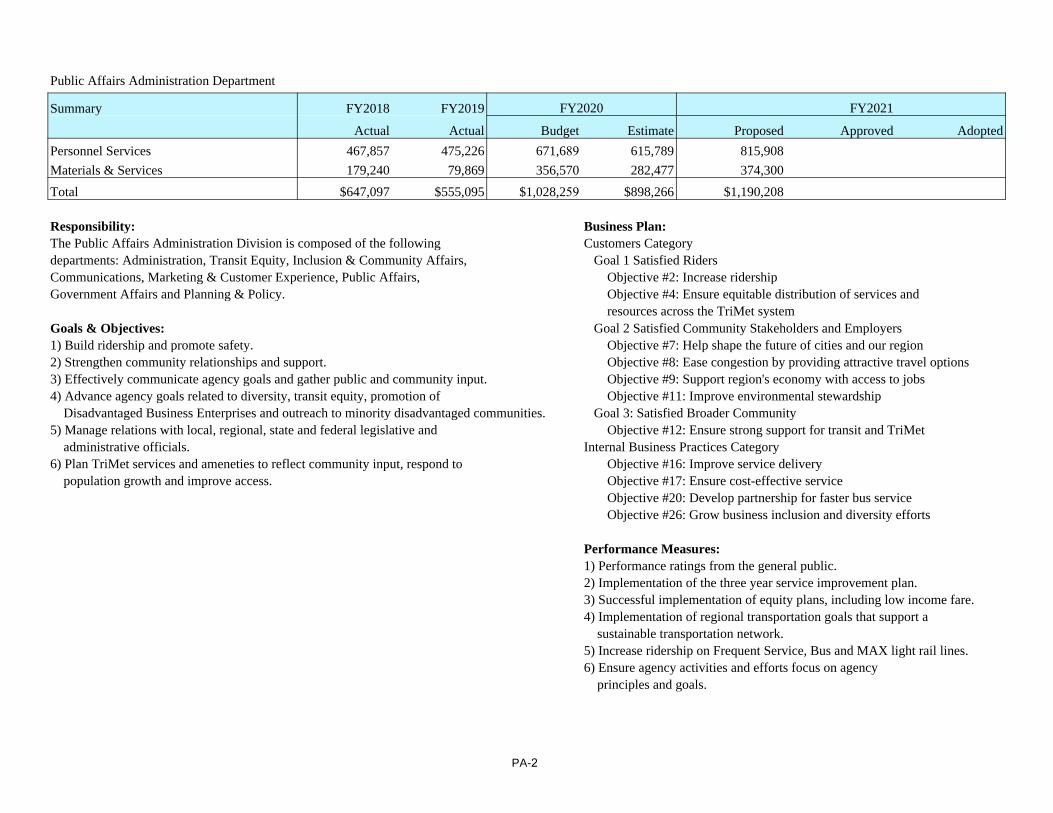
PA-2
Public Affairs Administration Department
Summary FY2018 FY2019 FY2020 FY2021
Actual Actual Budget Estimate Proposed Approved Adopted
Personnel Services 467,857 475,226 671,689 615,789 815,908
Materials & Services 179,240 79,869 356,570 282,477 374,300
Total $647,097 $555,095 $1,028,259 $898,266 $1,190,208
Responsibility: Business Plan:The Public Affairs Administration Division is composed of the following Customers Category departments: Administration, Transit Equity, Inclusion & Community Affairs, Goal 1 Satisfied Riders Communications, Marketing & Customer Experience, Public Affairs, Objective #2: Increase ridershipGovernment Affairs and Planning & Policy. Objective #4: Ensure equitable distribution of services and
resources across the TriMet systemGoals & Objectives: Goal 2 Satisfied Community Stakeholders and Employers1) Build ridership and promote safety. Objective #7: Help shape the future of cities and our region2) Strengthen community relationships and support. Objective #8: Ease congestion by providing attractive travel options3) Effectively communicate agency goals and gather public and community input. Objective #9: Support region's economy with access to jobs4) Advance agency goals related to diversity, transit equity, promotion of Objective #11: Improve environmental stewardship
Disadvantaged Business Enterprises and outreach to minority disadvantaged communities. Goal 3: Satisfied Broader Community5) Manage relations with local, regional, state and federal legislative and Objective #12: Ensure strong support for transit and TriMet
administrative officials. Internal Business Practices Category6) Plan TriMet services and ameneties to reflect community input, respond to Objective #16: Improve service delivery
population growth and improve access. Objective #17: Ensure cost-effective service Objective #20: Develop partnership for faster bus service Objective #26: Grow business inclusion and diversity efforts
Performance Measures:1) Performance ratings from the general public.2) Implementation of the three year service improvement plan.3) Successful implementation of equity plans, including low income fare.4) Implementation of regional transportation goals that support a
sustainable transportation network.5) Increase ridership on Frequent Service, Bus and MAX light rail lines.6) Ensure agency activities and efforts focus on agency
principles and goals.

PA-3
Public Affairs Administration Department-Personnel Services
Expense Category FY2018 FY2019 FY2020 FY2020 FY2021
Actual Actual Budget Estimate Budget
Labor 317,890 375,303 552,393 499,754 679,085
Fringe 149,967 99,923 119,296 116,336 136,823
Capitalized Labor-Fringe -301
Total $467,857 $475,226 $671,689 $615,789 $815,908

Public Affairs Administration Department-Personnel Profile
Position Title Total FTE Base Salary Expense Grade Min Max
Executive Director, Public Affairs 1.00 218,203 24 165,265 247,899
Executive Administrative Assistant 1.00 70,803 11 56,173 84,261
Specialist, Administrative 1.00 56,971 9 47,037 70,555
Total 3.00 345,977
PA-4

PA-5
Public Affairs Administration Department-Materials & Services
Expense Category FY2018 FY2019 FY2020 FY2020 FY2021
Actual Actual Budget Estimate Budget
Legal 3,298 12,162 10,600 5,300 10,700
Professional & Technical-Gen & Adm 104,905 39,281 73,600 37,850 94,400
Temporary Help-Gen & Adm 7,400 3,700 7,500
Other Services- Gen & Adm 6,340 511 18,600 10,972 18,800
Office Supplies 6,465 4,730 7,700 9,789 7,800
Other Materials- Gen & Adm 3,997 699 4,800 3,121 4,800
Unreconciled Mastercard Expense 530
Telephone 654 418 66,800 67,382 67,500
NU-Dues & Subscriptions 20,431 5,869 29,500 32,051 29,800
NU-Local Travel & Meetings 10,725 3,087 18,170 13,257 18,400
NU-Education & Training - Gen & Adm 1,804 230 38,400 31,481 32,800
NU-Out-Of-Town Travel 20,190 8,017 80,000 66,076 80,800
Employee Recognition 431 4,865 1,000 968 1,000
Total $179,240 $79,869 $356,570 $282,477 $374,300

PA-6
Policy & Planning-Department
Summary FY2018 FY2019 FY2020 FY2021
Actual Actual Budget Estimate Proposed Approved Adopted
Personnel Services 1,157,877 1,280,228 1,181,619 1,277,577 1,225,827
Materials & Services 4,260,883 3,927,111 4,299,254 3,497,014 4,151,400
Total $5,418,760 $5,207,339 $5,480,873 $4,774,591 $5,377,227
Responsibility: Business Plan:The Planning & Policy Department provides proactive, informative, responsive Customers Category and effective service planning. This is consistent with the Regional Transportation Goal 1 Satisfied Riders Plan and TriMet's budget priorities. The department strives for policy development Objective #2 Increase ridershipand review, planning and conceptual design of access to transit, especially by Objective #4 Ensure equitable distribution of services andpedestrians and bicyclists. The department plans for bus stop locations and amenities, resources across the TriMet systemoutreach for service and budget priorities and a transit improvement processes. Goal 2 Satisfied Community Stakeholders and EmployersThis includes fostering and improving partnerships for transit growth, including Objective #7 Help shape the future of cities and our regionthe STIF/STF process, grant management and agency-wide grant submissions. in th line with Metro 2040 Growth Concept
Objective #8 Ease congestion by providing attractive travelGoals & Objectives: options during peak periods1) Lead development of TriMet service plan. Objective #9 Support the region's economy by expanding 2) Manage implementation of three year service improvement plan. employee access to jobs and customer access to businesses 3) Promote safe access to transit through investment in bus stop amenities, and Internal Business Practices Category
the bike and pedestrian network. Goal #1 Deliver Safe, Efficient, and Equitable Service 4) Management of STIF/STF processes and funding. Objective #16 Improve service delivery
Goal #2 Design and Deliver Successful Projects Objective #20 Develop partnerships to support faster more reliable bus service
Performance Measures:1) Develop annual service plans within budget, on-time and achieve
ridership objectives: Develop and share with public Transit InvestmentPriorities and service decision-making information.
2) Increase improvements in access to transit with partners.3) Successfully manage Intergovernmental Agreements with
City of Portland re: Portland Streetcar.4) Forward movement on 100% Americans with Disabilities Act (ADA)
accessible bus stops.5) Receive approval for FY2022-2023 STIF Plan.

PA-7
Policy & Planning Department-Personnel Services
Expense Category FY2018 FY2019 FY2020 FY2020 FY2021
Actual Actual Budget Estimate Budget
Labor 889,540 1,005,986 957,906 991,353 1,030,424
Fringe 316,027 316,418 371,796 360,810 368,453
Capitalized Labor-Fringe -47,690 -42,176 -148,083 -74,586 -173,050
Total $1,157,877 $1,280,228 $1,181,619 $1,277,577 $1,225,827

Policy & Planning Department-Personnel Profile
Position Title Total FTE Base Salary Expense Grade Min Max
Director, Mobility Planning & Policy 1.00 138,333 20 120,234 180,349
Manager, Service Planning and Development 2.00 200,403 16 86,398 129,597
Assistant, Administrative 0.75 29,952 7 39,262 58,894
Coordinator, Operating Projects 1.00 81,943 14 72,900 109,351
Coordinator, Strategic Planning 1.00 83,973 14 72,900 109,351
Planner I 1.00 52,603 9 47,037 70,555
Planner II 3.00 206,639 12 61,321 91,980
Planner III 1.00 81,198 13 66,884 100,327
Planner III, STP 1.00 77,170 13 66,884 100,327
Specialist, Grant Development 1.00 78,210 13 66,884 100,327
Total 12.75 1,030,424
PA-8

PA-9
Policy & Planning Department-Materials & Services
Expense Category FY2018 FY2019 FY2020 FY2020 FY2021
Actual Actual Budget Estimate Budget
Professional & Technical-Gen & Adm 677,982 163,721 298,200 152,128 419,700
Metro Unified Work Prog 183,750 242,839 250,100 246,260 250,100
Job Access Program Services 8,734
Ride Connection Program 2,177,113 1,886,927 1,502,100 1,298,024 963,500
Accessibility Services - State Program (5310) 247,980 139,549 677,654 338,857 1,006,000
Accessibility Services - Federal (Program) 915,156 1,448,390 1,272,900 1,288,060 1,275,000
Other Services- Gen & Adm 10,135 14,097 277,200 139,066 214,800
Other Materials- Gen & Adm 382 4,144 20,100 10,550 20,300
Computer Equip under $5,000 270 2,385 1,000 2,129 2,000
Telephone 3,478 3,431 418
NU-Dues & Subscriptions 630 740
NU-APTA & OTA Dues 11,000
NU-Local Travel & Meetings 19 37
NU-Education & Training - Gen & Adm 238 314 114
NU-Out-Of-Town Travel 43,750 20,537 1,674
Total $4,260,883 $3,927,111 $4,299,254 $3,497,014 $4,151,400
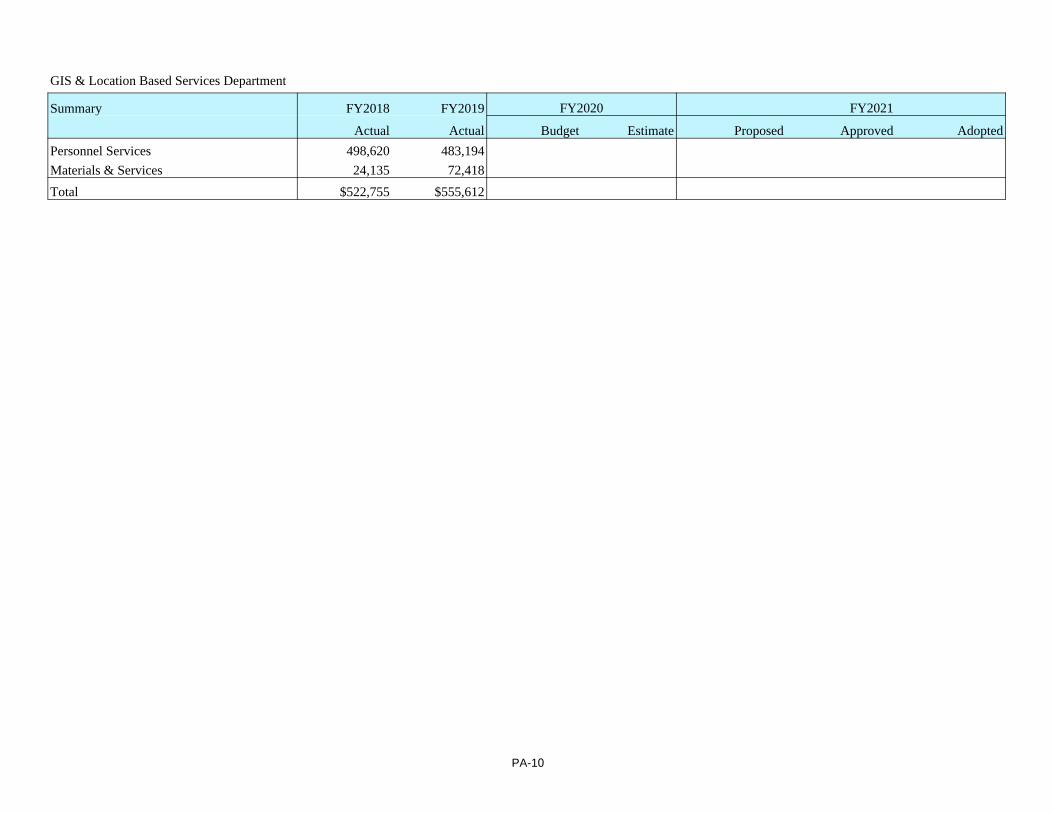
PA-10
GIS & Location Based Services Department
Summary FY2018 FY2019 FY2020 FY2021
Actual Actual Budget Estimate Proposed Approved Adopted
Personnel Services 498,620 483,194
Materials & Services 24,135 72,418
Total $522,755 $555,612

PA-11
GIS & Location Based Services Department-Personnel Services
Expense Category FY2018 FY2019 FY2020 FY2020 FY2021
Actual Actual Budget Estimate Budget
Labor 397,779 372,876
Fringe 142,693 124,205
Capitalized Labor-Fringe -41,852 -13,887
Total $498,620 $483,194

PA-12
GIS & Location Based Services Department-Materials & Services
Expense Category FY2018 FY2019 FY2020 FY2020 FY2021
Actual Actual Budget Estimate Budget
Other Services- Gen & Adm 5,000 63,666
Other Materials- Gen & Adm 3,337 90
Telephone 15,798 8,662
Total $24,135 $72,418

PA-13
Transit Equity Inclusion & Community Affairs-Department
Summary FY2018 FY2019 FY2020 FY2021
Actual Actual Budget Estimate Proposed Approved Adopted
Personnel Services -3,543 1,411,253 1,310,539 1,238,209
Materials & Services 1,072,900 741,538 2,129,000
Total -$3,543 $2,484,153 $2,052,077 $3,367,209
Responsibility: Business Plan:The Transit Equity, Inclusion & Community Affairs Department is responsible Customers Category for assisting TriMet in reaching the agency's goals related to equity, outreach to Goal 1 Satisfied Riders minority communities, transit equity, community engagement, Disadvantaged Objective #4 Ensure equitable distribution of services and Business enterprise (DBE) utilization, and Community Affairs. resources across the TriMet system
Goal #3 Satisfied Broader CommunityGoals & Objectives: Objective #12 Ensure strong support for transit and TriMet1) Build strategic relationships and support for TriMet's projects. Internal Business Practices Category2) Direct the development, implementation and monitoring of TriMet's DBE Goal #3 Business Practices that Create Value and Spur Innovation and
and Minority, Woman & Emerging Small Business (MWESB) program and goals. Continuous Improvement3) Support the expansion of TriMet's Honored Citizen Fare to incorporate the Objective #26 Grow business inclusion and diversity efforts
successful implementation of a regional Low-Income Fare Program.4) Coordinate Access Transit Program & expansion with House Bill 2017 (HB2017) funds. Performance Measures:5) Coordinate TriMet's Title VI compliance, complaint management, training, 1) Meet TriMet's 10.72% aspirational DBE goal of identified budget.
monitoring, reporting, & complete TriMet's 2019 Title VI program update. 2) Work with TriMet staff to coordinate, monitor and direct title VI reporting.6) Support the implementation of TriMet's Language Assistance Plan. 3) Develop and foster partnerships/relationships with diverse7) Support the development and implementation of TriMet's equity plan. communities and leaders to gain support for agency programs.8) Support targeted community engagement strategy and share TriMet' story. 4) Register 15,000 new participants annually in Low Income Fare.9) Support and staff Transit Equity Advisory Committee (TEAC) and Safety 5) Expend 95% of awarded TriMet's Access Transit resources annually.
and Security, Small Business, LAP and the youth subcommittee. 6) Support identified and targeted Construction projects.7) Complete TriMet's Title VI prog. update and Language Assistance Plan.8) Launch TriMet's Targeted Community Outreach Plan.9) Support TriMet's efforts to increase ridership.10) Successfully deploy HB2017 funds for high school access
transit grant program.

PA-14
Transit Equity Inclusion & Community Affairs Department-Personnel Services
Expense Category FY2018 FY2019 FY2020 FY2020 FY2021
Actual Actual Budget Estimate Budget
Labor 1,584,266 1,510,420 1,565,505
Fringe -3,543 644,150 567,308 553,628
Capitalized Labor-Fringe -817,163 -767,189 -880,924
Total -3,543 $1,411,253 $1,310,539 $1,238,209

Transit Equity Inclusion & Community Affairs Department-Personnel Profile
Position Title Total FTE Base Salary Expense Grade Min Max
Dir, Transit Equity, Inclusion and Comm. Affairs 1.00 146,074 20 120,234 180,349
Manager, Multicultural Programs 1.00 94,864 14 72,900 109,351
Program Manager, Low Income Fare 1.00 90,320 14 72,900 109,351
Administrator, Title VI and Equity Programs 1.00 94,754 14 72,900 109,351
Assistant, Administrative 1.00 47,486 7 39,262 58,894
Coordinator, Community Affairs 1.00 78,000 13 66,884 100,327
Coordinator, Outreach Programs and Events 2.00 134,407 11 56,173 84,261
Coordinator, Senior, Community Engagement Programs 1.00 77,002 13 66,884 100,327
Representative, Community Affairs 5.00 348,199 12 61,321 91,980
Representative, Diversity and Transit Equity 1.00 74,902 12 61,321 91,980
Specialist, Administrative 1.00 57,824 9 47,037 70,555
Specialist, Community Affairs 1.00 57,582 10 51,431 77,145
Specialist, Senior, Communications 1.00 69,846 12 61,321 91,980
Manager, Senior, Community Affairs & Comm. 1.00 109,245 16 86,398 129,597
Supervisor, Community Affairs 1.00 85,000 14 72,900 109,351
Total 20.00 1,565,505
PA-15

PA-16
Transit Equity Inclusion & Community Affairs Department-Materials & Services
Expense Category FY2018 FY2019 FY2020 FY2020 FY2021
Actual Actual Budget Estimate Budget
First Step Youth 72,500 41,535 73,200
Ride Connection Program 23,800 11,900
Other Services- Gen & Adm 544,100 413,087 1,974,500
Office Supplies 54
Other Materials- Gen & Adm 65,000 35,071
Unreconciled Mastercard Expense 56
Community Outreach 367,500 234,538 81,300
Telephone 141
NU-Local Travel & Meetings 1,439
NU-Out-Of-Town Travel 3,717
Total $1,072,900 $741,538 $2,129,000

PA-17
Government Services and Public Affairs-Department
Summary FY2018 FY2019 FY2020 FY2021
Actual Actual Budget Estimate Proposed Approved Adopted
Personnel Services 302,766 309,471 556,544 556,679 546,310
Materials & Services 285,983 325,935 483,300 383,272 458,000
Total $588,749 $635,406 $1,039,844 $939,951 $1,004,310
Responsibility: Business Plan:The Government Services and Public Affairs Department is responsible for Research analysis on regional needs. Provide accurate and detailed managing on-going intergovernmental relations and for long-range funding, analysis of TriMet rider preferences to support customer friendly initiatives.policy development and implementation with local, regional, state and federal Manage TriMet's fare policies to support revenue generation, access, legislative and administrative officials. ridership development and equity, including overseeing partner agreements
Goal #1 Achieve market acceptance of Hop Fastpass as a fare instrumentGoals & Objectives: Goal #2 Develop partnerships to support faster and more reliable bus 1) Develop, manage and coordinate governmental relations programs. service Progress on developing partnership and improving bus service.2) Establish effective communication with local, regional, state and federal Meet milestones for successful development of SW Corridor and
jurisdictions and partners. maximize benefits and potential of Hop Fastpass Introduced Hop3) Maintain a high level of support with administrative and legislative officials Fastpass. Develop higher capacity bus services Division
at all levels. Transit Project (DTP)4) Establish a viable political framework for implementation of TriMet funding goals. Goal #3 Ensure strong support for transit and TriMet and increase5) Provide the mechanisms and programs necessary to obtain financial, funding for regional mobility expansion.
legislative and political support that will enable TriMet to fund andimplement its capital and operating programs. Performance Measures:
1) Provide accessible information regarding service improvements andfare programs.
2) Provide timely and relevant service-focused rider information,and complete quarterly service change information across all channelsaccurately and on-time.
3) Respond to rider surveys and feedback by recommending and/orimplementing changes to improve the rider experience.
4) Provide accessible information regarding service improvementsand fare programs.

PA-18
Government Services and Public Affairs Department-Personnel Services
Expense Category FY2018 FY2019 FY2020 FY2020 FY2021
Actual Actual Budget Estimate Budget
Labor 224,210 232,841 401,857 409,334 413,628
Fringe 78,556 76,630 154,687 147,345 132,682
Total $302,766 $309,471 $556,544 $556,679 $546,310

Government Services and Public Affairs Department-Personnel Profile
Position Title Total FTE Base Salary Expense Grade Min Max
Director, Public Affairs 1.00 142,449 19 110,833 166,251
Manager, Governmental Affairs 1.00 99,365 15 79,406 119,110
Analyst, Senior, Research 1.00 88,651 13 66,884 100,327
Coordinator, Senior Fare Policy Program 1.00 83,163 13 66,884 100,327
Total 4.00 413,628
PA-19

PA-20
Government Services and Public Affairs Department-Materials & Services
Expense Category FY2018 FY2019 FY2020 FY2020 FY2021
Actual Actual Budget Estimate Budget
Professional & Technical-Gen & Adm 216,140 233,412 275,500 205,476 278,300
Student Pass/BETC Program 39,800 20,364 10,000
Consumer Research & Eval 102,500 84,625 103,500
Other Services- Gen & Adm 6,343 18,819 6,200 19,048 6,300
Other Materials- Gen & Adm 449 412 1,000 500 1,000
Telephone 796 106 798
NU-Dues & Subscriptions 2,020 10,411
NU-APTA & OTA Dues 55,700 55,700 58,300 52,358 58,900
NU-Local Travel & Meetings 1,813 3,094 103
NU-Education & Training - Gen & Adm 117
NU-Out-Of-Town Travel 2,605 3,981
Total $285,983 $325,935 $483,300 $383,272 $458,000

PA-21
Communications & Marketing Department
Summary FY2018 FY2019 FY2020 FY2021
Actual Actual Budget Estimate Proposed Approved Adopted
Personnel Services 2,676,507 2,682,506 2,898,432 2,781,126 3,025,362
Materials & Services 2,084,298 1,914,170 1,249,370 1,366,050 1,153,000
Total $4,760,805 $4,596,676 $4,147,802 $4,147,176 $4,178,362
Responsibility: Business Plan:The Communications & Marketing Department develops and executes a Goal #1 Increase Ridershipcomprehensive communication, marketing, outreach and customer experience Goal #2 Improve the Customer Experienceplan to ensure the agency's communications are consistent and effective as Goal #3 Grow TriMet's brand we bolster TriMet's reputation and brand (overall customer experience). We Tell our story, engage the communitybuild public understanding of, and support for, TriMet's initiatives and our vision, mission and values. We help shape public perception and continue to Performance Measures:support TriMet's Business Plan. 1) Engage the media to promote TriMet's benefit to the region through
positive employee and agency stories.Goals & Objectives: 2) Educate media partners about new agency initiatives.1) Provide the media with factual agency materials and assist in fulfilling 3) Further develop and promote all existing communications
timely public record requests. channels to TriMet's workforce.2) Keep TriMet employees informed on agency news, goals & initiatives. 4) Gather feedback while developing and promoting new ways to3) Promote and encourage safety around transit, transit use, service engage employees.
improvements, fare programs and key agency themes. 5) Increase visibility of safety-related outreach and events.4) Develop/maintain/deliver high quality brand identity to promote 6) Promote agency initiatives, safety campaigns and educate the
TriMet's key principles via our communication channels. public on Hop Fastpass® fare program.5) Deliver information to riders via content channels; promote and 7) Increase Employer pass program participation.
enhance the customer experience through easy-to-use tools. 8) Maintain favorability ratings through brand management and6) Develop and deliver improvements to the overall customer experience develop timely and accurate agency information for the public.
that encourages and delights our riders. 9) Handle customer survey feedback and respond to customer needs.10) Grow Riders Club and Rider Panel to help engage customers around
TriMet initiatives.11) Increase active use and usability of trip tools and rider services.12) Listen to the customer and develop ways to improve the
overall customer experience.

PA-22
Communications & Marketing Department-Personnel Services
Expense Category FY2018 FY2019 FY2020 FY2020 FY2021
Actual Actual Budget Estimate Budget
Labor 1,935,750 1,998,080 2,303,811 2,225,124 2,278,272
Fringe 744,897 734,274 905,665 825,553 815,900
Capitalized Labor-Fringe -4,140 -49,848 -311,044 -269,551 -68,810
Total $2,676,507 $2,682,506 $2,898,432 $2,781,126 $3,025,362

Communications & Marketing Department-Personnel Profile
Position Title Total FTE Base Salary Expense Grade Min Max
Managing Director, Comms, Mrkting & Custmr Exp 1.00 160,761 20 120,234 180,349
Manager, Creative Services 1.00 108,355 15 79,406 119,110
Manager, Employee Communications 1.00 98,357 15 79,406 119,110
Manager, Marketing & Outreach Services 1.00 96,000 15 79,406 119,110
Manager, Marketing & Rider Communications 1.00 96,348 15 79,406 119,110
Manager, Media Relations & Communications 1.00 110,604 16 86,398 129,597
Assistant, Administrative 0.80 39,262 7 39,262 58,894
Coordinator, Outreach Programs and Events 7.00 357,685 11 56,173 84,261
Coordinator, Outreach Services 1.00 77,592 11 56,173 84,261
Coordinator, Senior, Employee Communications 1.00 75,000 12 61,321 91,980
Coordinator, Transportation Options 1.00 76,724 11 56,173 84,261
Coordinator, Video Production 1.00 50,627 8 42,994 64,491
Coordinator, Web & Social Media 1.00 70,713 11 56,173 84,261
Designer, Graphics 1.00 66,560 10 51,431 77,145
Designer, Web/Developer 2.00 138,876 11 56,173 84,261
Graphics Designer 2.00 127,843 10 51,431 77,145
Production Coordinator, Media Planner/Buyer 1.00 66,325 10 51,431 77,145
Public Information Officer 2.00 161,745 13 66,884 100,327
Representative, Transportation Options 2.00 129,724 10 51,431 77,145
Specialist, Transportation Options 2.00 97,822 9 47,037 70,555
Coordinator, Marketing Communications 1.00 71,349 11 56,173 84,261
Total 31.80 2,278,272
PA-23

PA-24
Communications & Marketing Department-Materials & Services
Expense Category FY2018 FY2019 FY2020 FY2020 FY2021
Actual Actual Budget Estimate Budget
Production 285,058 107,771 138,700 110,705 140,100
Professional & Technical-Gen & Adm 153,903 226,988 129,000 175,837 180,300
Temporary Help-Gen & Adm 16,937
Software Hosting/Subscription Services 44,769 54,937 46,761
Other Services- Gen & Adm 28,387 35,783 35,600 22,069 36,000
Graphics Material 10,046 5,688 8,200 4,557 8,300
Other Materials- Gen & Adm 100,000
Computer Equip under $5,000 7,559 4,665 5,000
Promotions 408,700 381,846 349,000 322,486 150,500
Publications 334 1,674 1,000 1,314 1,000
Outreach/Promotions 267,928 233,956 86,200 206,498 87,100
Van Pool 14,265 17,273 48,800 25,893 49,300
Sales Programs 33,377 23,378 18,300 35,785 18,500
Telephone 11,362 8,802 2,639
NU-Dues & Subscriptions 2,403 1,596 80
Chamber Dues & Fees 5,909 11,548 5,800 9,500 5,900
NU-Local Travel & Meetings 6,096 1,132 34
NU-Education & Training - Gen & Adm 10,555 8,237 2,959
NU-Out-Of-Town Travel 32,329 50,267 917
Media Fees 714,602 716,657 424,770 393,643 227,000
Employee Communications 29,779 21,972 4,000 4,373 4,000
Employee Recognition 140,000
Total $2,084,298 $1,914,170 $1,249,370 $1,366,050 $1,153,000

PA-25
Customer Information Services Department
Summary FY2018 FY2019 FY2020 FY2021
Actual Actual Budget Estimate Proposed Approved Adopted
Personnel Services 2,778,182 3,095,956 3,208,807 3,131,763 3,291,117
Materials & Services 631,069 781,279 604,600 601,611 555,000
Total $3,409,251 $3,877,235 $3,813,407 $3,733,374 $3,846,117
Responsibility: Business Plan:The Customer Information Services Department supports the agency's Goal #1 Increase Ridershipbusiness plan creating the best possible experience for our riders. The Goal #2 Improve the Customer Experiencedepartment builds and supports strategic rider-focused initiatives to enhance the Goal #3 Grow TriMet's brand customer experience, guide the agency's customer service performance and Tell our story, engage the communitybuild community support in alignment with TriMet's brand position and shared values.
Performance Measures:Goals & Objectives: 1) Provide accessible information regarding service improvements andPromote, support and provide amenities, tools and service to our riders and fare programs.prospective riders to enhance the rider experience. 2) Provide timely and relevant service-focused rider information,
and complete quarterly service change information across allCustomer Information channels accurately and on-time.1) Proactively deliver timely, accurate service information to riders via static 3) Meet response targets for the Service Improvement Process (SIP),
and dynamic content channels, including quarterly service changes. Trip Planning and Hop account support.2) Respond to rider requests for information, amenities and signage. 4) Respond to rider surveys and feedback by recommending and/or3) Distribute schedules and service information internally and externally to implementing changes to improve the rider experience.
regional partners and ticket outlets. 5) Provide accessible information regarding service improvements andfare program.
Customer Service/Rider Support1) Provide excellent customer service and assist riders via phone, email,
social media and in-person.2) Support and promote service outreach and information.3) Support Field Operations with on-street staffing, and manage TriMet's Ride
Guide & Ask Me volunteer programs.4) Provide customer service training to TriMet.5) Provide accurate and detailed analysis of TriMet rider preferences
to support customer friendly initiatives.

PA-26
Customer Information Services Department-Personnel Services
Expense Category FY2018 FY2019 FY2020 FY2020 FY2021
Actual Actual Budget Estimate Budget
Labor 1,917,679 2,136,720 2,183,558 2,171,805 2,295,663Fringe 864,206 960,790 1,025,249 959,958 1,024,144
Capitalized Labor-Fringe -3,703 -1,554 -28,690
Total $2,778,182 $3,095,956 $3,208,807 $3,131,763 $3,291,117

Customer Information Services Department-Personnel Profile
Position Title Total FTE Base Salary Expense Grade Min Max
Manager, Customer Information 1.00 83,257 13 66,884 100,327
Manager, Customer Service 1.00 79,500 13 66,884 100,327
Manager, Senior, Customer Information 1.00 90,230 16 86,398 129,597
Analyst, Business Customer Experience 1.00 60,395 11 56,173 84,261
Coordinator, On-Street Customer Service 1.00 62,504 10 51,431 77,145
Coordinator, Service Information 2.00 103,397 9 47,037 70,555
Representative, Field Outreach & Comm. Rels. 8.25 300,880 0715 33,280 41,600
Supervisor, Customer Service Center 2.00 162,677 0710 60,258 80,350
Customer Experience Agent 11.00 525,096 0714 38,355 50,752
Customer Service Representative 5.00 344,344 0731 51,563 68,744
Specialist, Information Development 5.00 391,636 0732 58,427 77,896
Senior Administrative Assistant 1.00 47,341 9 47,037 70,555
Total 39.25 2,251,257
PA-27

PA-28
Customer Information Services Department-Materials & Services
Expense Category FY2018 FY2019 FY2020 FY2020 FY2021
Actual Actual Budget Estimate Budget
Production 7,278
Professional & Technical-Gen & Adm 1,796 106 7,200 7,614 7,300
Student Pass/BETC Program 2,703 3,275
Consumer Research & Eval 110,804 125,696
Other Services- Gen & Adm 287 1,456 2,500 2,090 2,500
Uniforms - Veh Ops 1,351
Uniforms- Rev Veh Op 2,500 3,495 2,500
Graphics Material 466 133
Schedule & service information 190,445 190,771 188,000 198,210 189,900
Office Supplies 2,559 5,322 650
Other Materials- Gen & Adm 2,793 3,458 2,500 4,973 2,500
Unreconciled Mastercard Expense 76
Postage - Gen & Admin 54
Promotions 9,983
Schedule Books & Map 9,071 8,938 10,800 5,400 10,900
Outreach/Promotions 5,000
On Street Customer Service 24,661 12,085 23,500 44,653 23,700
Van Pool 1,151
Customer Info Material 30,809 6,573 11,300 13,110 11,400
Sales Programs 193
Customer information & signage 177,703 226,506 214,500 219,326 216,600
Call Center Operations 15,646 108,851 85,000 62,318 85,900
Customer Information Materials 55,000 27,650
Telephone 53,371 64,825 4,816
NU-Dues & Subscriptions 95 2,800
NU-Education & Training - Gen & Adm 1,281 2,223
Customer Service Training 2,554 1,800 4,506 1,800
Total $631,069 $781,279 $604,600 $601,611 $555,000

FA-1
FINANCE & ADMINISTRATIVE SERVICES DIVISION
Summary FY2018 FY2019 FY2020 FY2021
Actual Actual Budget Estimate Proposed Approved Adopted
Personnel Services 10,545,049 11,507,543 16,573,041 15,819,723 17,880,579Materials & Services 8,579,333 8,831,595 9,101,918 9,620,127 11,385,300
Total $19,124,382 $20,339,138 $25,674,959 $25,439,850 $29,265,879
Finance & Administrative Services Division PageDivision Summary ....................................................................................... FA-1Finance & Administrative Services ............................................................. FA-2Financial Services ........................................................................................ FA-6Budget & Grants Administration ................................................................. FA-10Risk Management ........................................................................................ FA-14Procurement & Supply Chain Management ................................................ FA-18Fare Revenue & Administrative Services .................................................... FA-22

FA-2
Finance & Administration Department
Summary FY2018 FY2019 FY2020 FY2021
Actual Actual Budget Estimate Proposed Approved Adopted
Personnel Services 360,708 409,053 649,619 550,798 817,674Materials & Services 148,685 685,372 483,633 463,343 377,100
Total $509,393 $1,094,425 $1,133,252 $1,014,141 $1,194,774
Responsibility: Business Plan:The Finance & Administration Department is responsible for managing Financial Categoryagency financial activities, assuring effective financial controls, planning for Goal #1 Fiscally Sound and Compliant future financial requirements and handling the receptionist area. Objective #36 Manage financial performance within Strategic Financial
Plan guidelinesGoals & Objectives: Goal #2 Manage Assets to Ensure Safety and Optimize Value, Performance, & Resiliency 1) Complete complex strategic financial planning, forecasting and analysis. Objective #37 Meet or exceed state of good repair targets for all identified 2) Manage annual budget process and monitoring. asset classes3) Prepare capital planning and project financing. Goal #3 Financial Capacity to Advance Regional Expectations for Service4) Prepare accounting reports for agency assets and activities. Growth and Quality as Represented in the Regional Transportation Plan5) Process payroll and pension disbursements. Objective #38 Manage financial capacity to deliver regional expectations for 6) Perform cash management and manage investments. service growth7) Perform debt management and ensure compliance.8) Manage agency contracts and procurement process, stores and Performance Measures:
warranty program. 1) Accurate and timely communication of financial issues with General9) Perform grants administration and reporting. Manager and Board.10) Manage the agency's Workers' Compensation program. 2) Publication of accurate and timely agency financial reports with no material11) Manage Public Liability claims and agency risk management. audit findings.12) Manage deferred compensation (457) plan and defined contribution (401a) 3) Enforcement of appropriate financial controls to assure safety of District
plan management and oversight. assets, including enforcement of cash and fare revenue policies.13) Manage fare system and revenue collection controls and oversight. 4) Publication of annual District budget consistent with state law, and assurance14) Manage the administrative function of the receptionist area. of ongoing compliance.
5) Implementation of debt and lease programs to meet agency capital needs.6) Enforcement of procurement and contracting process consistent with Board
policy and FTA requirements.7) Establishment of appropriate risk management programs, including
commercial and self-insurance.8) Accurate reporting of District defined benefit pension plan assets and
liabilities and oversight of plans.9) Management of agency's deferred compensation plan and defined
contribution plan to ensure compliance with fiduciary duties.

FA-3
Finance & Administration Department-Personnel Services
Expense Category FY2018 FY2019 FY2020 FY2020 FY2021
Actual Actual Budget Estimate Budget
Labor 277,372 306,273 540,665 451,496 686,078
Fringe 83,336 102,780 108,954 99,302 131,596
Total $360,708 $409,053 $649,619 $550,798 $817,674

Finance & Administration Services Department-Personnel Profile
Position Title Total FTE Base Salary Expense Grade Min Max
Exec Director, Finance & Administrative Services 1.00 241,421 26 192,765 289,147
Executive Administrative Assistant 1.00 77,189 11 56,173 84,261
Receptionist 1.00 40,893 4 29,768 44,652
Total 3.00 359,503
FA-4

FA-5
Finance & Administration Department-Materials & Services
Expense Category FY2018 FY2019 FY2020 FY2020 FY2021
Actual Actual Budget Estimate Budget
Legal 5,108 25,000 12,500 125,000
Professional & Technical-Gen & Adm 9,269 244,000 250,766 25,000
Recruitment Expense 135 1,000 500 1,000
Temporary Help-Gen & Adm 43,834 2,574
Equipment Repair & Mtc - Gen & Adm 884
Other Services- Gen & Adm 8,137 8,097 15,300 17,361 18,500
Office Supplies 667 915 17,000 10,341 14,200
Equip/Furn < $5,000-Gen & Adm 716 139,369 21,799 12,000
Other Materials- Gen & Adm 2,500 1,874 2,500
Unreconciled Mastercard Expense -44 63
Telephone 590 138 7,100 8,360 7,200
NU-Dues & Subscriptions 1,900 577 18,100 17,738 16,000
NU-Local Travel & Meetings 31 2,100 1,070
NU-Education & Training - Gen & Adm 874 4,994 48,133 29,106 38,000
NU-Out-Of-Town Travel 90,510 48,261 100,400 72,850 107,700
Employee Recognition 1,457 4,595 3,000 2,835 10,000
Office Leases 460,469 16,180
Total $148,685 $685,372 $483,633 $463,343 $377,100

FA-6
Financial Services Department
Summary FY2018 FY2019 FY2020 FY2021
Actual Actual Budget Estimate Proposed Approved Adopted
Personnel Services 2,210,725 2,344,103 2,526,711 2,475,545 2,629,395
Materials & Services 475,449 446,818 500,000 483,158 595,000
Total $2,686,174 $2,790,921 $3,026,711 $2,958,703 $3,224,395
Responsibility: Business Plan:The Financial Services Department is responsible for accounting and reporting Financial Categoryon the day-to-day financial activities of TriMet. The department includes Goal #1 Fiscally Sound and Compliant the major functions of accounts payable, receivable, financial Objective #36 Manage financial performance within Strategicaccounting & payroll. Financial Plan guidelines
Internal Business PracticesGoals & Objectives: Goal #3 Business Practices that Create Value and Spur Innovation and 1) In connection with the annual external financial audit, lead and direct Continuous Improvement
financial audit, single audit, statewide transportation improvement Objective #27 Innovatively increase financial resources fund (STIF) procedures and debt compliance.
2) Maintain annual and monthly financial reporting.3) Prepare accounting reports for all grants, including STIF. Performance Measures:4) Accounting, reporting and compliance with long-term debt. 1) Governmental Accounting Standards Board (GASB) pronouncements5) Develop and evaluate self-insurance reserves in conjunction with implemented timely and effectively.
Risk Management and Legal departments. 2) No material audit findings noted by external auditors for financial statements.6) Accounting, reporting and inventories over capital assets. 3) Monthly financial reports prepared timely.7) Manage cash and investments as well as cash flow analysis. 4) Principal and interest on long-term debt and lease-leaseback paid timely.8) Manage accounts receivable and revenue accounting. 5) Cash and investment management controls in place and operating effectively.9) Ensure timely processing and payment for accounts payable disbursements. 6) Timely vendor payments/processing of accounts payable transactions.10) Accounting and reporting for pension plans and Other 7) Accurate and timely accounting and reporting of payroll tax revenues
Post-Employment Benefits. and related tax revenues.11) Accounting and reporting for employer payroll tax and self-employment 8) Accurate and timely accounting and financial reporting over federal, state
tax revenues. and local grants awards.12) Compliance with federal and state payroll tax reporting. 9) Bi-weekly in house payroll processed accurately and timely.13) Compliance with annual wage reporting (W2). Collaborate with IT and other departments to implement technology to ensure14) Process bi-weekly in-house payroll. financial business processes are effective and efficient.15) Support annual budget process for long-term debt, Workers
Compensation, PIPD and leasee.

FA-7
Financial Services Department-Personnel Services
Expense Category FY2018 FY2019 FY2020 FY2020 FY2021
Actual Actual Budget Estimate Budget
Labor 1,583,681 1,704,066 1,828,064 1,809,880 1,905,968
Fringe 628,336 640,587 698,647 665,665 723,427
Capitalized Labor-Fringe -1,292 -550
Total $2,210,725 $2,344,103 $2,526,711 $2,475,545 $2,629,395

Financial Services-Personnel Profile
Position Title Total FTE Base Salary Expense Grade Min Max
Director, Financial Services 1.00 159,634 21 130,346 195,520
Manager, Accounting 1.00 116,808 16 86,398 129,597
Manager, Payroll 1.00 101,021 15 79,406 119,110
Accountant, Financial 1.00 56,219 11 56,173 84,261
Accountant, Senior (Long-Term Liabilities) 1.00 83,947 13 66,884 100,327
Accountant, Senior (Treasury & Cash Management) 1.00 87,345 13 66,884 100,327
Assistant, Finance 1.00 48,797 7 39,262 58,894
Business Analyst, Senior (Financial Systems) 1.00 129,297 16 86,398 129,597
Business Systems Analyst 1.00 45,039 14 72,900 109,351
Financial Analyst III, Senior (Grants) 1.00 88,342 13 66,884 100,327
Revenue Accountant, Senior 1.00 80,317 12 61,321 91,980
Revenue Accountant 1.00 61,315 10 51,431 77,145
Specialist, Accounts Receivable 1.00 54,080 9 47,037 70,555
Finance Clerk 6.00 392,606 0323 51,272 68,349
Senior Accounts Payable Clerk 1.00 77,875 0322 57,387 76,523
Senior Payroll Clerk 2.00 153,046 0340 57,387 76,523
Timekeeper 1.50 117,250 0336 63,253 84,344
Total 23.50 1,852,938
FA-8

FA-9
Financial Services Department-Materials & Services
Expense Category FY2018 FY2019 FY2020 FY2020 FY2021
Actual Actual Budget Estimate Budget
Legal 593 8,000 5,323 8,000
Audits 236,654 315,000 342,728 315,000
Professional & Technical-Gen & Adm 11,390 15,870 30,000 30,089 28,000
Banking Charges 43,079 65,459 85,000 64,726 175,000
Temporary Help-Gen & Adm 40,346 77,875 11,000 8,371 20,000
Software Hosting/Subscription Services 957 14,000 7,000 14,000
Other Services- Gen & Adm 35,708 15,187 26,000 13,778 24,000
Office Supplies 13,603 8,032 2,438
Equip/Furn < $5,000-Gen & Adm 27,332 6,115 6,000 3,079 6,000
Other Materials- Gen & Adm 7,830 7,044 4,000 3,545 4,000
Telephone 1,153 1,113
NU-Dues & Subscriptions 4,690 6,321 1,105
NU-Local Travel & Meetings 1,250 95
NU-Education & Training - Gen & Adm 4,896 7,670 168
Fines and Penalties - Payroll 283,215 -1,800 1,000 808 1,000
Employee Recognition 590
Total $475,449 $446,818 $500,000 $483,158 $595,000

FA-10
Budget & Grants Administration-Department
Summary FY2018 FY2019 FY2020 FY2021
Actual Actual Budget Estimate Proposed Approved Adopted
Personnel Services 781,427 924,148 1,065,437 1,018,717 1,112,855
Materials & Services 50,840 260,009 159,400 141,941 161,100
Total $832,267 $1,184,157 $1,224,837 $1,160,658 $1,273,955
Responsibility: Business Plan:The Budget & Grants Administration Department is responsible for major Financial Categoryfunctions: Agency financial planning, forecasting and budgeting, performance Goal #1 Fiscally Sound and Compliant reporting and analysis, fare revenue analysis and grants administration. Objective #36 Manage financial performance within Strategic Financial Plan guidelines
Goal #2 Manage Assets to Ensure Safety and Optimize Value, Performance Goals & Objectives: and Resiliency1) Perform complex financial planning, forecasting and analysis. Objective #37 Meet or exceed state of good repair targets for all identified asset classes 2) Manage annual budget process and maintain documentation. Goal #3 Financial Capacity to Advance Regional Expectations for Service 3) Develop Transit Asset Management (TAM) analysis. Growth and Quality as Represented in the Regional Transportation Plan,4) Develop federal, state, local grant and financial reporting. Objective #38 Manage financial capacity to deliver regional expectations 5) Manage grant applications/compliance, prepare and submit applications. for service growth6) Conduct passenger revenue analysis and forecasting.7) Prepare Capital Improvement Program. Performance Measures:8) Develop Monthly Performance Report and Dashboard. 1) Financial forecast document and budget manual prepared by mid-February9) Prepare and submit Monthly and Annual National Transit Database (NTD) each year to begin the budget process. Includes revenue and ridership forecastsreports. based on best available information.
2) Budget document completed annually on schedule to meet Oregon budgetlaw requirements.
3) Accurate analysis of TAM plan assets.4) Respond to requests for information/analysis from colleagues with 24 hours
with an estimate of when the analysis can be completed.5) Prepare Capital Improvement Program by early-January each year to align
with the budget process.6) Accurately and on timely manner prepared and delivered monthly performance report
statistices and dashboard to the Board.7) Monthly and Annual NTD reports prepared and submitted on schedule to
meet FTA requirements.

FA-11
Budget & Grants Administration Department-Personnel Services
Expense Category FY2018 FY2019 FY2020 FY2020 FY2021
Actual Actual Budget Estimate Budget
Labor 569,040 697,438 777,363 769,838 827,252
Fringe 214,764 226,710 288,074 248,879 285,603
Capitalized Labor-Fringe -2,377
Total $781,427 $924,148 $1,065,437 $1,018,717 $1,112,855

Budget & Grants Administration Department-Personnel Profile
Position Title Total FTE Base Salary Expense Grade Min Max
Director, Budget & Grants 1.00 178,000 21 130,346 195,520
Manager, Financial Analysis and Forecasting 1.00 107,313 17 93,951 140,927
Administrator, Grants 1.00 91,033 15 79,406 119,110
Analyst, Financial 1.00 66,394 11 56,173 84,261
Analyst, Financial, Senior (Budget & Forecasting) 1.00 100,138 15 79,406 119,110
Fin Analyst III, Senior (Budget & Forecasting) 1.00 94,071 14 72,900 109,351
Financial Analyst IV, Senior (IT Specialist) 1.00 100,303 14 72,900 109,351
Analyst, Senior, Grants Compliance 1.00 90,000 14 72,900 109,351
Total 8.00 827,252
FA-12

FA-13
Budget & Grants Administration Department-Materials & Services
Expense Category FY2018 FY2019 FY2020 FY2020 FY2021
Actual Actual Budget Estimate Budget
Professional & Technical-Gen & Adm 8,830 204,912 85,600 69,830 86,500
Economic Forecasts 31,320 32,544 32,600 46,639 32,000
Ridership Counts/Surveys 25,000 12,589 25,000
Other Services- Gen & Adm 3,301 10,512 15,000 7,524 15,000
Office Supplies 2,460 1,683 2,235
Other Materials- Gen & Adm 1,886 1,200 2,350 2,600
Telephone 347 318
NU-Dues & Subscriptions 1,404 1,630 735
NU-Local Travel & Meetings 16 43 39
NU-Education & Training - Gen & Adm 3,162 6,481
Total $50,840 $260,009 $159,400 $141,941 $161,100

FA-14
Risk Management Department
Summary FY2018 FY2019 FY2020 FY2021
Actual Actual Budget Estimate Proposed Approved Adopted
Personnel Services 585,535 687,101 718,271 709,810 727,007
Materials & Services 3,007,566 3,019,032 3,263,800 3,222,780 3,616,700
Total $3,593,101 $3,706,133 $3,982,071 $3,932,590 $4,343,707
Responsibility: Performance Measures:The Risk Management Department is responsible for managing Self-Insured 1) Workers' Compensation Program. Immediately address all situations ofWorkers Comp, Light Duty Program and Risk Management. safety concern. Ensure the prudent allocation of agency resources in a
manner that optimally addresses risks and exposures.Goals & Objectives: 2) Light Duty Program. Provide work for as many employees as possible.1) Self-Insured Workers Comp. Manage our agency's self-insured workers Meet all reporting requirements to qualify for reimbursement from the
compensation and liability programs. Investigate, determine liability, State of Oregon for wage and job site modifications.obtain settlement or pursue subrogation (recovery) for all of the agency's 3) Liability Claims. The number of new liability claims, each month, should beclaims. equal to or less than the number of liability claims closed each month.
2) Light Duty Program. Coordinate the agency's light duty program 4) Risk Management. Manage agency's insurance broker relationship.for injured workers. Pursue reimbursement through the states EAIP Assist with marketing and timely renewal of agency property and liability policiesand PWP programs, which incentivize the use of workers in a Support staff and agency project managers with evaluation and managementmodified duty capacity. of contratual risk. Assist in the evaluation of agency risk through risk
3) Risk Management. Insurance broker relationship. Agency property analysis and regular risk assessments.and liability policies. Evaluation of risk
Business Plan: Financial Category Goal #1 Fiscally Sound and Compliant Objective #36 Manage financial performance within Strategic Financial Plan guidelines Goal #2 Manage Assets to Ensure Safety and Optimize Value, Performance, and Resiliency Objective #37 Meet or exceed state of good repair targets for all identified asset classesInternal Business Practices Goal #1 Deliver Safe, Eff. and Equitable Service Objective #14 Increase Personal Safety

FA-15
Risk Management Department-Personnel Services
Expense Category FY2018 FY2019 FY2020 FY2020 FY2021
Actual Actual Budget Estimate Budget
Labor 442,033 506,267 521,991 523,729 537,951
Fringe 143,502 180,834 196,280 186,081 189,056
Total $585,535 $687,101 $718,271 $709,810 $727,007

Risk Management Department-Personnel Profile
Position Title Total FTE Base Salary Expense Grade Min Max
Director, Risk Management 1.00 135,000 19 110,833 166,251
Assistant, Administrative 1.00 50,669 7 39,262 58,894
Assistant, Claims 1.00 44,595 8 42,994 64,491
Claims Adjuster 2.00 158,641 11 56,173 84,261
Coordinator, Claims 1.00 88,456 12 61,321 91,980
Technician, Claims 1.00 60,590 9 47,037 70,555
Total 7.00 537,951
FA-16

FA-17
Risk Management Department- Materials & Services
Expense Category FY2018 FY2019 FY2020 FY2020 FY2021
Actual Actual Budget Estimate Budget
Claims Services 2,895 1,497 2,600 2,032 2,600
Temporary Help-Gen & Adm 5,420
Other Services- Gen & Adm 26,575 -2,948 8,000 4,670 8,100
Office Supplies 10,181 8,601 5,277
Other Materials- Gen & Adm 7,316 28 1,000 500 1,000
Telephone 517 371
Phys Damage Ins - B,G &Eq 418,979 905,563 950,000 979,615 1,050,000
Railroad Protective Ins 555,067 165,248 200,000 169,393 215,000
Cyber Security Insurance 54,045 234,825 27,700 292,370 30,000
PMLR Insurance Costs 1,650,191 229,972 324,500 261,137 360,000
WES Insurance Costs 1,047,648 1,450,000 1,074,136 1,600,000
Public Entity Liability Insurance 275,394 423,490 300,000 433,600 350,000
NU-Dues & Subscriptions 260 485 50
NU-Local Travel & Meetings 106
NU-Education & Training - Gen & Adm 620 4,252
Total $3,007,566 $3,019,032 $3,263,800 $3,222,780 $3,616,700

FA-18
Procurement & Supply Chain Management Department
Summary FY2018 FY2019 FY2020 FY2021
Actual Actual Budget Estimate Proposed Approved Adopted
Personnel Services 1,437,978 1,476,719 5,208,430 4,965,735 5,851,011Materials & Services 283,632 208,529 229,385 189,166 400,300
Total $1,721,610 $1,685,248 $5,437,815 $5,154,901 $6,251,311
Responsibility: The Procurement, Contracts & Supply Chain Management Department is People & Innovation Categoryresponsible for three major sections: Contracts, Purchasing, and Stores and Warranty Goal #2 TriMet is Where Diverse & Talented People Want to Programs. Come, Stay and Thrive.
Objective #30 Ensure open and honest communication between Goals & Objectives: management and front-line employees. 1) Manage the competitive process for all goods and services by various sourcing Objective 35 Foster employee innovation, including process
methods, including Request for Proposals, Qualification-Based Selection, improvements.Invitations to Bid, Request for Quotations, and Co-op Purchasing Agreements.
2) Negotiate and draft contracts resulting from various sourcing methods. Performance Measures: 3) Provide support to project managers during the contract administration process. 1) Effectively support the agency in the acquisition of all non-inventory4) Purchase of operational inventory (bus/rail parts), operating supplies (e.g., fuel goods and services to ensure high quality and best value for TriMet.
products, office supplies, and copiers and related supplies. 2) Ensure contracts comply with all federal, state and local rules and5) Manage the purchasing card program and dispose of surplus property. regulations, manage risk and negotiate terms and conditions.6) Manage inventory levels to ensure parts availability to meet internal customer 3) Ensure all solicitations are open, fair and competitive.
demands, and minimize inventory write-downs for obsolescence and loss. 4) Effectively source goods and materials to ensure lowest total cost7) Work collaboratively with Maintenance to ensure effective utilization of the of ownership. utilizing factors such as quality, price, availability,
inventory assets. lead-time (impact on inventory value), operating costs and disposal.8) Pursue warranty recollection for vehicle, infrastructure, facility and parts 5) Implement Material Requirements Planning (MRP) process for rail
to ensure responsible parties are held accountable. reliability program to improve parts forecasting. Participate in StoresContinuous Improvement process with a goal of just-in-time
Business Plan: arrival of needed repair parts and components.Internal Business Practices Category 6) Timely disposal of District's surplus property while obtaining max value. Goal #3 Business Practices that Create Value and Spur Innovation and 7) Reduce number of vehicles / LRVs held from service awaiting parts. Continuous Improvement. 8) Reduction in cycle count adjustments from year-to-year. Objective #24 Test electric buses in service for performance and cost-effectiveness. 9) Reduce inventory levels (value) from year-to-year. Objective #25 Develop and pursue strategic partnerships to optimize and 10) Reduce value of obsolescence. innovate practices and processes. Objective #26 Grow business inclusion and diversity efforts.
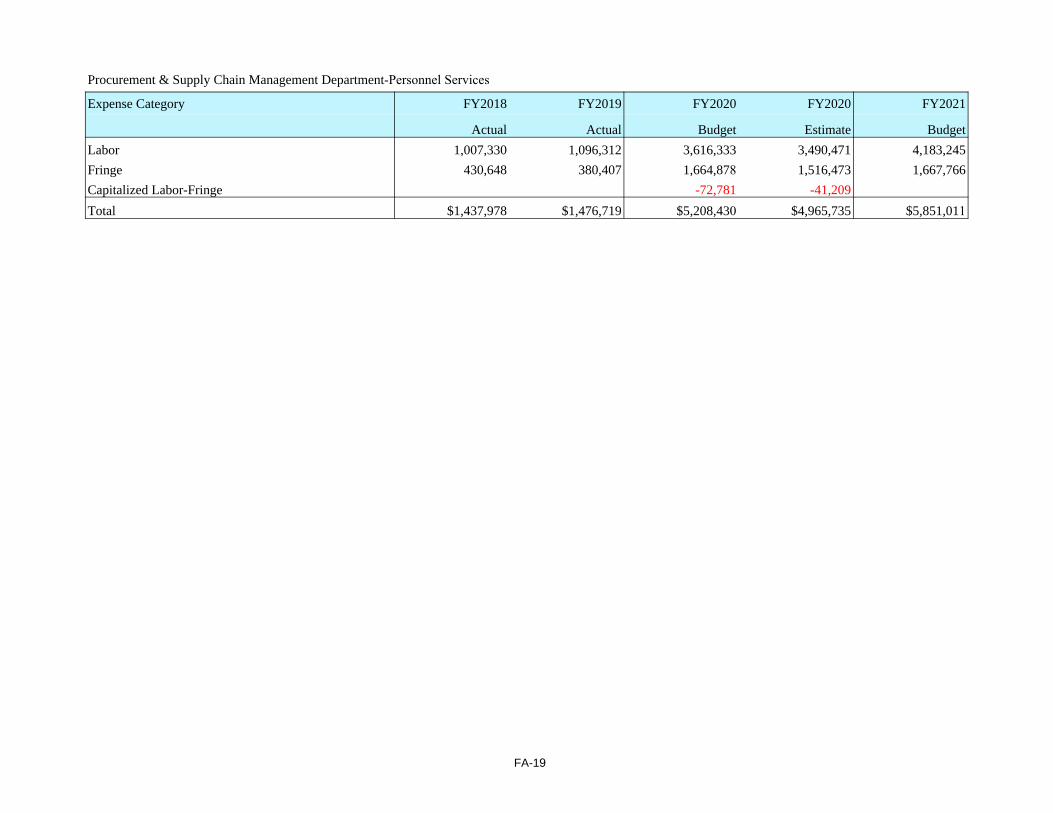
FA-19
Procurement & Supply Chain Management Department-Personnel Services
Expense Category FY2018 FY2019 FY2020 FY2020 FY2021
Actual Actual Budget Estimate Budget
Labor 1,007,330 1,096,312 3,616,333 3,490,471 4,183,245
Fringe 430,648 380,407 1,664,878 1,516,473 1,667,766
Capitalized Labor-Fringe -72,781 -41,209
Total $1,437,978 $1,476,719 $5,208,430 $4,965,735 $5,851,011

Procurement & Supply Chain Management-Personnel Profile
Position Title Total FTE Base Salary Expense Grade Min Max
Director, Procurement and Supply Chain Management 1.00 128,000 19 110,833 166,251
Manager, Contracts 1.00 90,001 16 86,398 129,597
Manager, Purchasing 1.00 98,457 16 86,398 129,597
Manager, Stores & Warranty Programs 1.00 107,456 16 86,398 129,597
Administrator II, Contracts 3.00 198,436 11 56,173 84,261
Administrator III, Contracts 4.00 336,218 13 66,884 100,327
Coordinator, Warranty Programs 1.00 62,688 11 56,173 84,261
Assistant Storekeeper 4.00 310,170 0371 72,946 72,946
Assistant Storekeeper Inventory Control 1.00 74,714 0371 72,946 72,946
Buyer 4.00 310,066 0432 57,450 76,606
Partsman 19.00 1,249,827 0376 64,834 69,472
Senior Buyer 2.00 170,685 0373 80,246 80,246
Senior Partsman 5.00 376,409 0372 69,472 69,472
Senior Storekeeper 1.00 76,606 0368 76,606 76,606
Administrator, Senior Contracts/Equity 1.00 80,000 13 66,884 100,327
Analyst, Supply Chain 1.00 60,415 12 61,321 91,980
Assistant, Senior Administrative 1.00 48,922 9 47,037 70,555
Supervisor, Supply Chain 4.00 321,501 12 61,321 91,980
Total 55.00 4,100,571
FA-20

FA-21
Procurement & Supply Chain Management Department-Materials & Services
Expense Category FY2018 FY2019 FY2020 FY2020 FY2021
Actual Actual Budget Estimate Budget
Photocopier Maintenance 28,569 17,602 15,000 12,287 15,200
Laundry 4,030 2,015 6,500
Other Services- Gen & Adm 19,517 9,938 20,000 11,690 20,200
Procurement Advertising 153,995 70,000 75,000 37,500 75,800
Office Supplies 61,495 91,637 69,000 60,041 69,700
Freight 35,000 33,692 35,400
Equip/Furn < $5,000-Rev Eq Maint 1,000 8,000 16,000
Other Materials- Gen & Adm 3,313 7,205 3,500 3,956 69,500
Other Materials- Rev Eq Maint 5,000 3,496 5,100
Unreconciled Mastercard Expense 3,990
Default Expense -617 1,157
Facility Moving Expenses 85,000
Safety Supplies- Gen & Adm 1,400 700 1,400
Telephone 533 1,486
NU-Dues & Subscriptions 11,829 6,179 5,250
NU-Local Travel & Meetings 501 105 52
NU-Education & Training - Gen & Adm 3,880 4,994 2,775
NU-Out-Of-Town Travel 1,748
CDL Renewals 455 228 500
Rental 589
Total $283,632 $208,529 $229,385 $189,166 $400,300
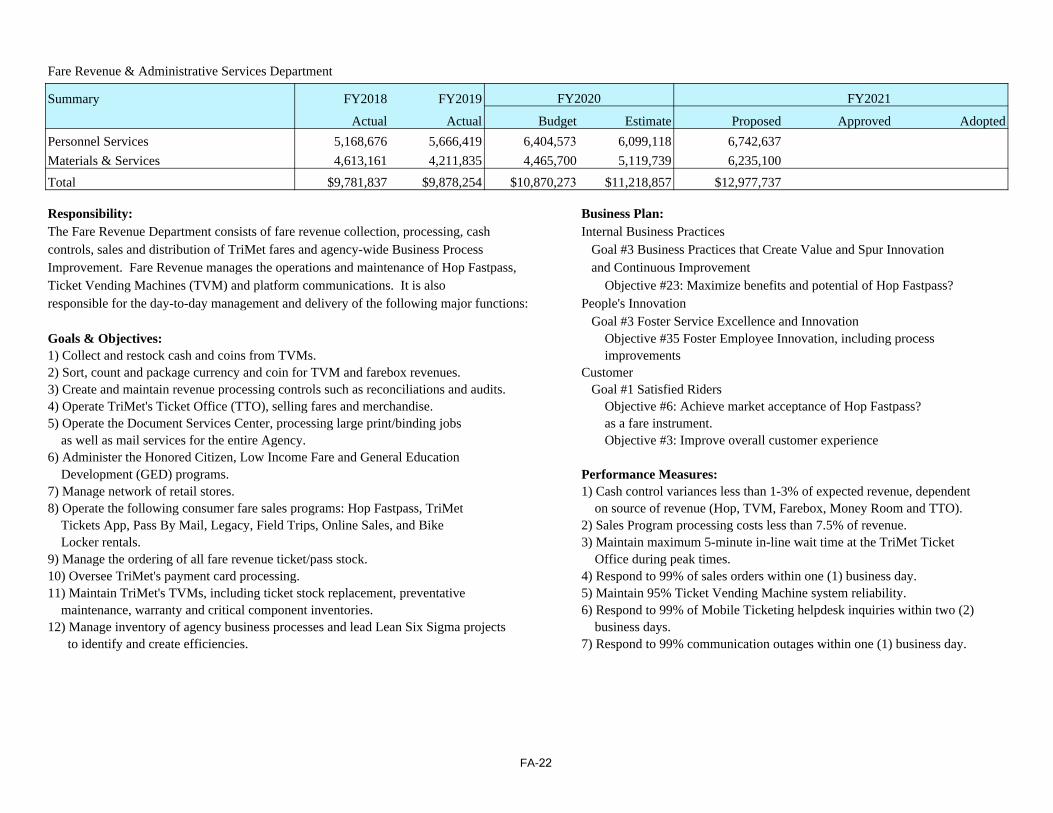
FA-22
Fare Revenue & Administrative Services Department
Summary FY2018 FY2019 FY2020 FY2021
Actual Actual Budget Estimate Proposed Approved Adopted
Personnel Services 5,168,676 5,666,419 6,404,573 6,099,118 6,742,637
Materials & Services 4,613,161 4,211,835 4,465,700 5,119,739 6,235,100
Total $9,781,837 $9,878,254 $10,870,273 $11,218,857 $12,977,737
Responsibility: Business Plan:The Fare Revenue Department consists of fare revenue collection, processing, cash Internal Business Practices controls, sales and distribution of TriMet fares and agency-wide Business Process Goal #3 Business Practices that Create Value and Spur Innovation Improvement. Fare Revenue manages the operations and maintenance of Hop Fastpass, and Continuous ImprovementTicket Vending Machines (TVM) and platform communications. It is also Objective #23: Maximize benefits and potential of Hop Fastpass?responsible for the day-to-day management and delivery of the following major functions: People's Innovation
Goal #3 Foster Service Excellence and InnovationGoals & Objectives: Objective #35 Foster Employee Innovation, including process1) Collect and restock cash and coins from TVMs. improvements2) Sort, count and package currency and coin for TVM and farebox revenues. Customer3) Create and maintain revenue processing controls such as reconciliations and audits. Goal #1 Satisfied Riders 4) Operate TriMet's Ticket Office (TTO), selling fares and merchandise. Objective #6: Achieve market acceptance of Hop Fastpass? 5) Operate the Document Services Center, processing large print/binding jobs as a fare instrument.
as well as mail services for the entire Agency. Objective #3: Improve overall customer experience6) Administer the Honored Citizen, Low Income Fare and General Education
Development (GED) programs. Performance Measures: 7) Manage network of retail stores. 1) Cash control variances less than 1-3% of expected revenue, dependent8) Operate the following consumer fare sales programs: Hop Fastpass, TriMet on source of revenue (Hop, TVM, Farebox, Money Room and TTO).
Tickets App, Pass By Mail, Legacy, Field Trips, Online Sales, and Bike 2) Sales Program processing costs less than 7.5% of revenue.Locker rentals. 3) Maintain maximum 5-minute in-line wait time at the TriMet Ticket
9) Manage the ordering of all fare revenue ticket/pass stock. Office during peak times.10) Oversee TriMet's payment card processing. 4) Respond to 99% of sales orders within one (1) business day.11) Maintain TriMet's TVMs, including ticket stock replacement, preventative 5) Maintain 95% Ticket Vending Machine system reliability.
maintenance, warranty and critical component inventories. 6) Respond to 99% of Mobile Ticketing helpdesk inquiries within two (2)12) Manage inventory of agency business processes and lead Lean Six Sigma projects business days.
to identify and create efficiencies. 7) Respond to 99% communication outages within one (1) business day.

FA-23
Fare Revenue & Administrative Services Department-Personnel Services
Expense Category FY2018 FY2019 FY2020 FY2020 FY2021
Actual Actual Budget Estimate Budget
Labor 3,622,463 4,062,928 4,620,581 4,490,472 4,807,473
Fringe 1,567,470 1,677,700 1,941,116 1,841,454 1,935,164
Capitalized Labor-Fringe -21,257 -74,209 -157,124 -232,808
Total $5,168,676 $5,666,419 $6,404,573 $6,099,118 $6,742,637

Fare Revenue & Administrative Services-Personnel Profile
Position Title Total FTE Base Salary Expense Grade Min Max
Director, Fare Revenue & Administrative Services 1.00 125,000 19 110,833 166,251
Manager, Fare Revenue 1.00 90,594 15 79,406 119,110
Manager, Fare Revenue Systems 1.00 107,939 16 86,398 129,597
Accountant, Cash Control 2.00 111,454 10 51,431 77,145
Business Analyst, Fare Revenue 1.00 83,901 12 61,321 91,980
Document Svcs Operator/Mail Svcs Clerk 1.00 35,901 4 29,768 44,652
Senior Analyst, Business Process 1.00 103,283 16 86,398 129,597
Supervisor, Document Services 1.00 55,744 9 47,037 70,555
Mail Services Clerk 1.00 58,656 0356 42,973 57,304
Analyst, Senior, Fare Systems 3.00 277,027 14 72,900 109,351
Supervisor TTO 1.00 80,350 0716 60,258 80,350
Assistant Supervisor TTO 1.00 76,420 0736 55,827 74,443
Fare Revenue Specialist 9.00 614,644 0733 51,022 68,037
Moneyroom Supervisor 1.20 99,699 0330 63,253 84,344
Moneyroom Clerk 3.80 314,792 0331 61,360 81,806
Manager, Fare & Communication Equipment 1.00 95,403 16 86,398 129,597
Supervisor, Electronic Maintenance & Repair 1.00 92,505 13 66,884 100,327
Supervisor, Engineering Training 1.00 90,827 13 66,884 100,327
Supervisor, FEM Communications 1.00 87,385 13 66,884 100,327
Assistant Supervisor Field Technician 2.00 183,830 0590 87,547 87,547
Field Technician 18.00 1,419,737 0591 76,128 76,128
Field Technician Apprentice 5.00 386,139 0592 46,259 64,834
Total 58.00 4,591,230
FA-24
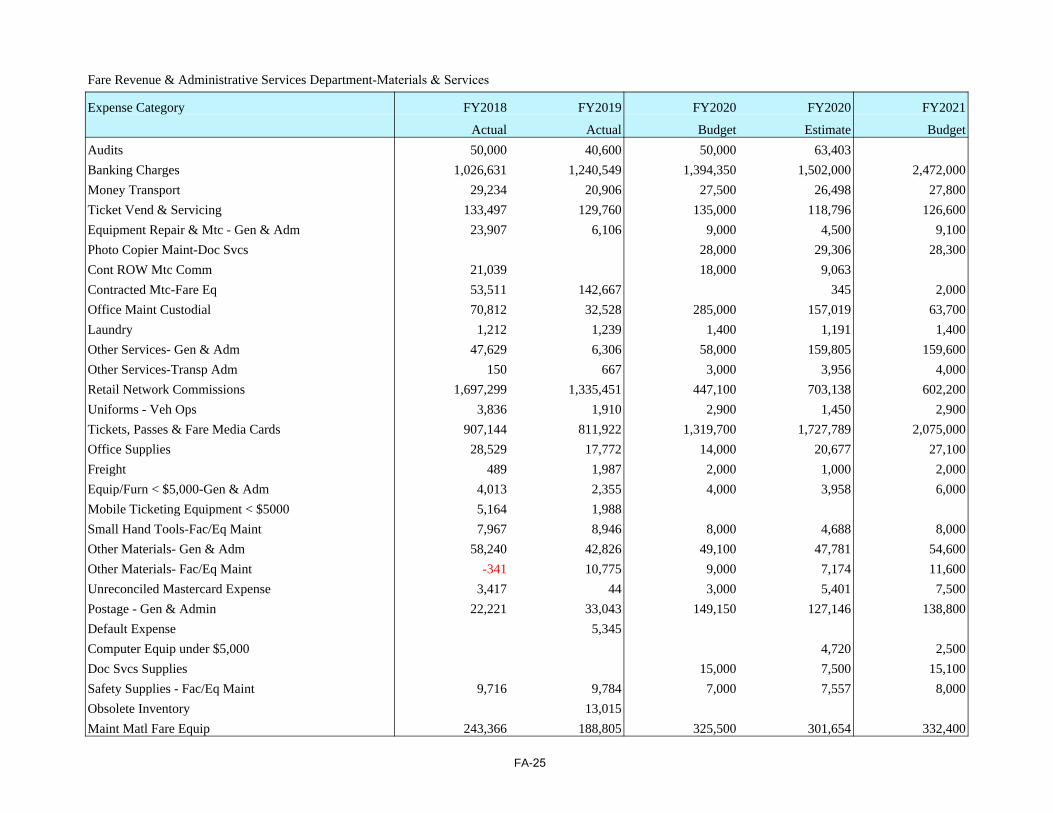
FA-25
Fare Revenue & Administrative Services Department-Materials & Services
Expense Category FY2018 FY2019 FY2020 FY2020 FY2021
Actual Actual Budget Estimate Budget
Audits 50,000 40,600 50,000 63,403
Banking Charges 1,026,631 1,240,549 1,394,350 1,502,000 2,472,000
Money Transport 29,234 20,906 27,500 26,498 27,800
Ticket Vend & Servicing 133,497 129,760 135,000 118,796 126,600
Equipment Repair & Mtc - Gen & Adm 23,907 6,106 9,000 4,500 9,100
Photo Copier Maint-Doc Svcs 28,000 29,306 28,300
Cont ROW Mtc Comm 21,039 18,000 9,063
Contracted Mtc-Fare Eq 53,511 142,667 345 2,000
Office Maint Custodial 70,812 32,528 285,000 157,019 63,700
Laundry 1,212 1,239 1,400 1,191 1,400
Other Services- Gen & Adm 47,629 6,306 58,000 159,805 159,600
Other Services-Transp Adm 150 667 3,000 3,956 4,000
Retail Network Commissions 1,697,299 1,335,451 447,100 703,138 602,200
Uniforms - Veh Ops 3,836 1,910 2,900 1,450 2,900
Tickets, Passes & Fare Media Cards 907,144 811,922 1,319,700 1,727,789 2,075,000
Office Supplies 28,529 17,772 14,000 20,677 27,100
Freight 489 1,987 2,000 1,000 2,000
Equip/Furn < $5,000-Gen & Adm 4,013 2,355 4,000 3,958 6,000
Mobile Ticketing Equipment < $5000 5,164 1,988
Small Hand Tools-Fac/Eq Maint 7,967 8,946 8,000 4,688 8,000
Other Materials- Gen & Adm 58,240 42,826 49,100 47,781 54,600
Other Materials- Fac/Eq Maint -341 10,775 9,000 7,174 11,600
Unreconciled Mastercard Expense 3,417 44 3,000 5,401 7,500
Postage - Gen & Admin 22,221 33,043 149,150 127,146 138,800
Default Expense 5,345
Computer Equip under $5,000 4,720 2,500
Doc Svcs Supplies 15,000 7,500 15,100
Safety Supplies - Fac/Eq Maint 9,716 9,784 7,000 7,557 8,000
Obsolete Inventory 13,015
Maint Matl Fare Equip 243,366 188,805 325,500 301,654 332,400

FA-26
Fare Revenue & Administrative Services Department-Materials & Services
Expense Category FY2018 FY2019 FY2020 FY2020 FY2021
Actual Actual Budget Estimate Budget
Maint Materials Comm/Video 115,637 46,449 62,000 33,440 3,700
Telephone 36,405 47,426 15,000 20,665 15,100
NU-Dues & Subscriptions 3,925 2,025 2,000 1,000 2,000
NU-Local Travel & Meetings 41 61
NU-Education & Training - Gen & Adm 8,471 7,214 14,000 12,625 16,600
CDL Renewals 139 1,000 500 1,000
Employee Recognition 217
Rental 1,008 7,000 3,994 8,500
Total $4,613,161 $4,211,835 $4,465,700 $5,119,739 $6,235,100

HR-1
LABOR RELATIONS & HUMAN RESOURCES DIVISION
Summary FY2018 FY2019 FY2020 FY2021
Actual Actual Budget Estimate Proposed Approved Adopted
Personnel Services 2,955,485 3,828,693 3,919,296 3,686,434 4,079,919
Materials & Services 1,326,674 1,303,465 1,755,440 1,414,933 2,207,600
Total $4,282,159 $5,132,158 $5,674,736 $5,101,367 $6,287,519
Labor Relations & Human Resoures Division PageDivision Summary ....................................................................................... HR-1Human Resources Administration ............................................................... HR-2Benefits & HRIS .......................................................................................... HR-6Talent Management ..................................................................................... HR-10Labor Relations ............................................................................................ HR-14Compensation ............................................................................................... HR-18

HR-2
Human Resources Administration Department
Summary FY2018 FY2019 FY2020 FY2021
Actual Actual Budget Estimate Proposed Approved Adopted
Personnel Services 544,173 804,214 476,697 398,298 518,515
Materials & Services 159,030 211,173 589,300 414,528 630,800
Total $703,203 $1,015,387 $1,065,997 $812,826 $1,149,315
Responsibilities: Business Plan:The Administration Department of the Labor Relations & Human Resources Internal Business PracticesDivision is responsible for aligning the division on strategy, objectives and Goal #3 Business Practices that Create Value and Spur Innovationproject ownership to establish TriMet as a place where diverse and talented and Continuous Improvementpeople want to come, stay, and thrive. The department also is responsible for Objective #25 Develop and pursue strategic partnerships to developing the division staff's professional competencies, ensuring alignment optimize and innovate practices and processes.with TriMet;s values, ensuring division employees work safely and providing People & Innovationadministrative support to the division as a whole. Goal #2 TriMet is Where Diverse and Talented People Want to
Come, Stay, and Thrive Goals and Objectives: Objective #29 Invest Wisely in People1) Develop and oversee the division strategic planning efforts and monitoring Goal #2: Foster Service Excellence and Innovation
implementation progress. Objective #35 Foster employee innovation2) Represent the division perspective on TriMet's executive team. Coordinate Financial Category
budget preparation and monitoring budget performance for the division. Goal #1 Fiscally Sound and Compliant3) Provide administrative support and records management for the division. Objective #36 Manage Financial Performance with4) Provide support for manager and employee self-service use of the Human Strategic Financial Plan guidelines
Resources Information System (HRIS).5) Respond to reference check and employee information requests, such as Performance Measures:
unemployment compensation and Bureau of Labor and Industries (BOLI) 1) Engagement Survey.inquiries. 2) The division has capable talent.
3) Jobs included in succession plans having candidates identified as"ready now" or "ready soon."
4) Recognition process.5) Budget targets are met for the division.

HR-3
Human Resources Administration Department-Personnel Services
Expense Category FY2018 FY2019 FY2020 FY2020 FY2021
Actual Actual Budget Estimate Budget
Labor 424,273 360,674 381,835 337,278 407,439
Fringe 119,900 443,540 94,862 61,020 111,076
Total $544,173 $804,214 $476,697 $398,298 $518,515

Human Resources Administration Department-Personnel Profile
Position Title Total FTE Base Salary Expense Grade Min Max
Executive Director, Labor Relations & Human Res. 1.00 206,100 25 178,485 267,728
Executive Administrative Assistant 1.00 72,821 11 56,173 84,261
Total 2.00 278,921
HR-4

HR-5
Human Resources Administration-Materials & Services
Expense Category FY2018 FY2019 FY2020 FY2020 FY2021
Actual Actual Budget Estimate Budget
Legal 175,069 120,320 146,500 109,010 124,800
Professional & Technical-Gen & Adm 3,490 8,376
Recruitment Expense 147 189 79
Other Services- Gen & Adm 4,600 8,723 2,000 4,301 2,000
Office Supplies 3,218 5,694 5,700 4,796 5,000
Other Materials- Gen & Adm 271 4,437 2,100 13,253 10,000
Unreconciled Mastercard Expense 17,908
Postage - Gen & Admin 1,000 500 1,000
Telephone 3,794 3,188 6,700 5,303 6,000
NU-Dues & Subscriptions 936 877 3,500 2,075 3,000
NU-Local Travel & Meetings 246 1,505 1,300 752 1,000
NU-Education & Training - Gen & Adm 1,619 2,352 35,500 19,880 30,000
NU-Out-Of-Town Travel 2,411 13,000 6,500 10,000
Union Contractural Services -37,071 54,413 345,000 215,967 430,000
Employee Recognition 300 1,099 704 3,000
Employee Awards 12,000 6,000 5,000
Awards & Banquets 15,000 7,500
Total $159,030 $211,173 $589,300 $414,528 $630,800

HR-6
Benefits & HRIS Department
Summary FY2018 FY2019 FY2020 FY2021
Actual Actual Budget Estimate Proposed Approved Adopted
Personnel Services 837,198 1,133,999 841,248 836,491 831,109
Materials & Services 555,720 499,453 607,640 568,174 847,600
Total $1,392,918 $1,633,452 $1,448,888 $1,404,665 $1,678,709
Responsibilities: Business Plan:The Benefits & HRIS Department of the Labor Relations & Human Resources Financial CategoryDivision is responsible for ensuring a competitive benefits package, enhancing Goal #1 Fiscally Sound and CompliantHR technology solutions, and designing flexibility in the HR policies and Objective 36 Manage financial performance within Strategic procedures. Financial Plan guidelines
People & Innovation CategoryGoals and Objectives: Goal #2 People & Innovation 1) Enhance the HR technology platform to increase manager and employee Objective 29 Invest Wisely in people
productivity and access to information. Streamline, refine and enhance Objective 33 Recruit a talented workforcereporting capabilities. Goal #3 Foster Service Excellence and Innovation
2) Negotiate favorable benefits contracts with carriers and vendors. Objective 35 Foster employee innovation3) Administer the health & welfare programs according to contracts.4) Provide health, welfare, and retirement programs education & resources to Performance Measures:
employees and retirees. 1) TriMet's benefits costs meet budget.5) Manage annual benefits open enrollment process. 2) TriMet's net medical benefits cost per covered employee increases at a6) Conduct benefits eligibility audits. rate no greater than the Federal Employment Cost Index.7) Administer defined benefit plans and oversee defined contribution plans. 3) The HRIS system is deployed effectively, including manager and
employee self-service.4) HR transactions are handled efficiently, accurately and timely.5) Healthcare & Retirement vendors meet their commitments to TriMet
and its employees.6) Controls over pension payments implemented and operating effectively,
accurately and timely.7) Accurate reporting of District defined benefit pension plan assets,
liabilities, and oversight of plans.8) Employees and retirees have access to tools, information and resources to
make educated health, welfare, and retirement decisions.

HR-7
Benefits & HRIS Department-Personnel Services
Expense Category FY2018 FY2019 FY2020 FY2020 FY2021
Actual Actual Budget Estimate Budget
Labor 600,027 815,424 604,381 621,859 629,803
Fringe 237,171 318,575 236,867 214,632 201,306
Total $837,198 $1,133,999 $841,248 $836,491 $831,109
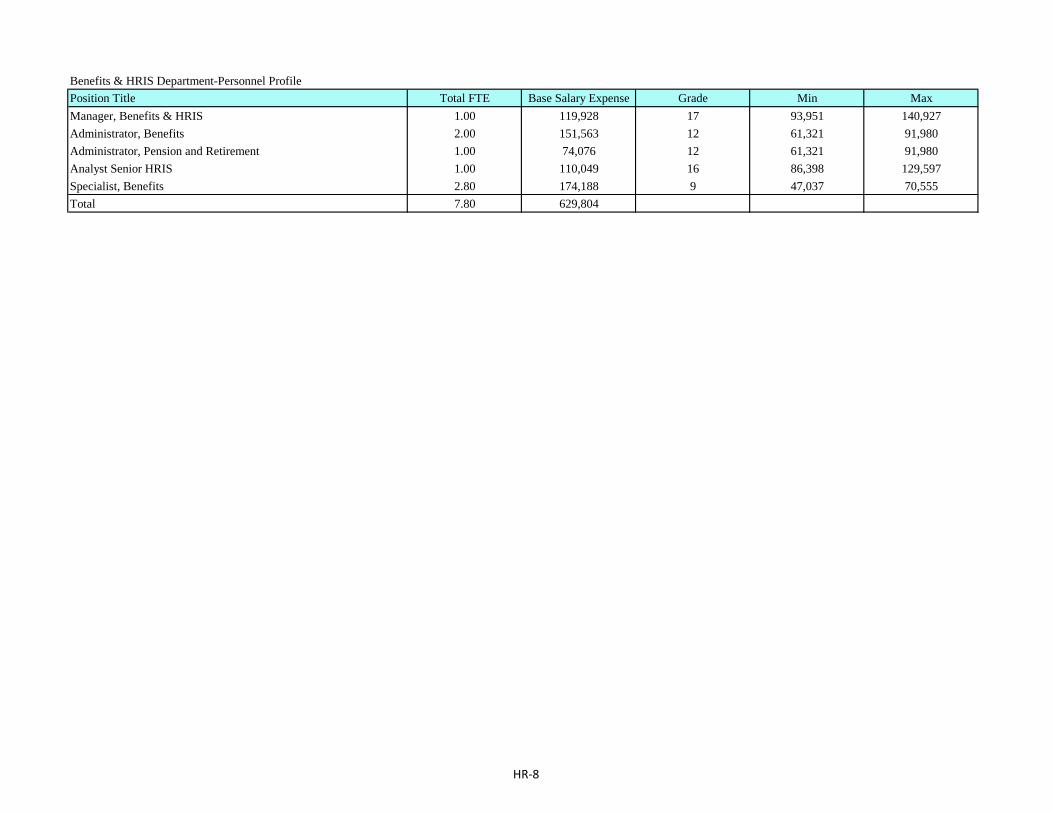
Benefits & HRIS Department-Personnel Profile
Position Title Total FTE Base Salary Expense Grade Min Max
Manager, Benefits & HRIS 1.00 119,928 17 93,951 140,927
Administrator, Benefits 2.00 151,563 12 61,321 91,980
Administrator, Pension and Retirement 1.00 74,076 12 61,321 91,980
Analyst Senior HRIS 1.00 110,049 16 86,398 129,597
Specialist, Benefits 2.80 174,188 9 47,037 70,555
Total 7.80 629,804
HR-8
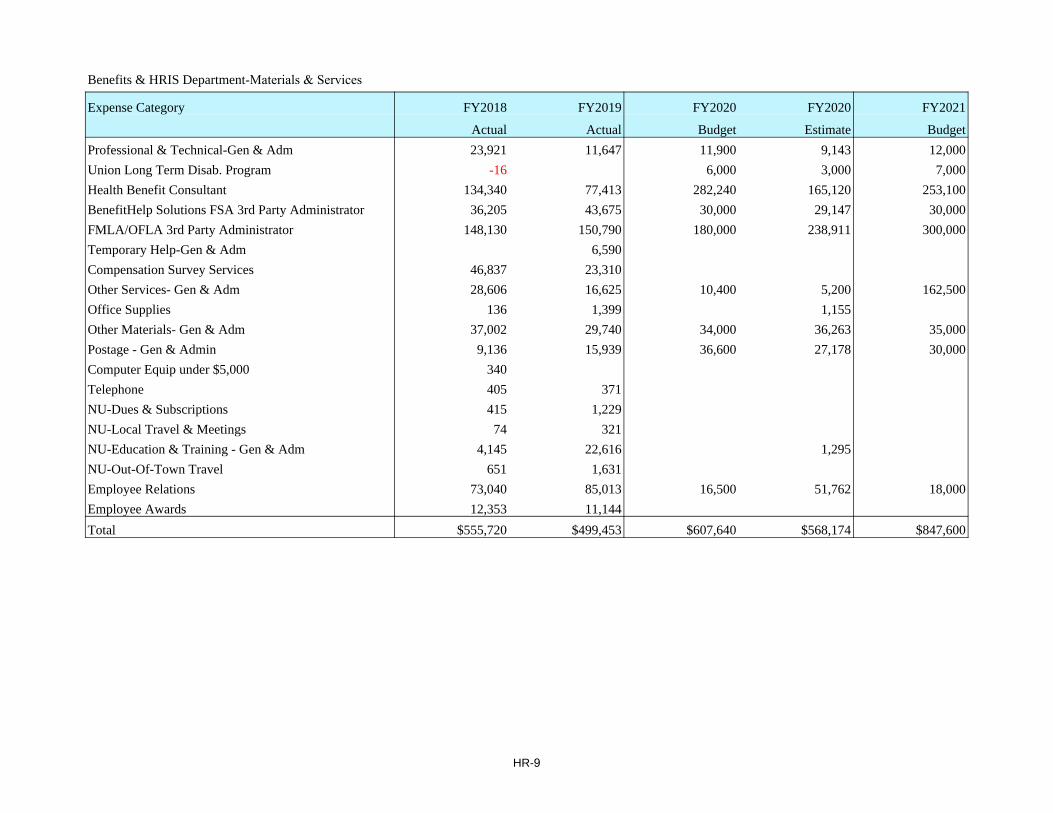
HR-9
Benefits & HRIS Department-Materials & Services
Expense Category FY2018 FY2019 FY2020 FY2020 FY2021
Actual Actual Budget Estimate Budget
Professional & Technical-Gen & Adm 23,921 11,647 11,900 9,143 12,000
Union Long Term Disab. Program -16 6,000 3,000 7,000
Health Benefit Consultant 134,340 77,413 282,240 165,120 253,100
BenefitHelp Solutions FSA 3rd Party Administrator 36,205 43,675 30,000 29,147 30,000
FMLA/OFLA 3rd Party Administrator 148,130 150,790 180,000 238,911 300,000
Temporary Help-Gen & Adm 6,590
Compensation Survey Services 46,837 23,310
Other Services- Gen & Adm 28,606 16,625 10,400 5,200 162,500
Office Supplies 136 1,399 1,155
Other Materials- Gen & Adm 37,002 29,740 34,000 36,263 35,000
Postage - Gen & Admin 9,136 15,939 36,600 27,178 30,000
Computer Equip under $5,000 340
Telephone 405 371
NU-Dues & Subscriptions 415 1,229
NU-Local Travel & Meetings 74 321
NU-Education & Training - Gen & Adm 4,145 22,616 1,295
NU-Out-Of-Town Travel 651 1,631
Employee Relations 73,040 85,013 16,500 51,762 18,000
Employee Awards 12,353 11,144
Total $555,720 $499,453 $607,640 $568,174 $847,600

HR-10
Talent Management Department
Summary FY2018 FY2019 FY2020 FY2021
Actual Actual Budget Estimate Proposed Approved Adopted
Personnel Services 761,437 1,003,237 1,157,580 1,186,471 1,493,633
Materials & Services 573,731 540,300 514,400 376,605 660,800
Total $1,335,168 $1,543,537 $1,671,980 $1,563,076 $2,154,433
Responsibilities: Business Plan:The Talent Management Department of the Labor Relations & Human People & Innovation CategoryResources Division is responsible for talent acquisition, succession planning, Goal #2 TriMet is Where Diverse and Talented People Want to training and development, performance management, employee engagement Come, Stay and Thriveand affirmative action. Objective #29 Invest wisely in people
Objective #32 Achieve agency Affirmative Action goalsGoals and Objectives: Objective #33 Recruit a talented workforce1) Investing wisely in people action efforts.2) Recruit a diverse and talented workforce. Performance Measures:3) Plan for succession for key positions. 1) Offer/interview, acceptance/offer and time-to-fill targets are met.4) Develop and oversee training and development program/activities, 2) Manage turnover to acceptable levels.
including more structure to its management certification program. 3) Affirmative action goals and sufficient diversity in the applicant pooland application process is achieved.
4) Employees are trained and developed for succession opportunities5) Enhance and implement succession readiness plan.6) Employee engagement trends are favorable.

HR-11
Talent Management Department-Personnel Services
Expense Category FY2018 FY2019 FY2020 FY2020 FY2021
Actual Actual Budget Estimate Budget
Labor 520,766 727,169 828,187 839,058 1,097,325
Fringe 240,671 276,068 329,393 347,413 396,308
Total $761,437 $1,003,237 $1,157,580 $1,186,471 $1,493,633

Talent Management Department-Personnel Profile
Position Title Total FTE Base Salary Expense Grade Min Max
Director, Talent Management 1.00 143,058 19 110,833 166,251
Program Manager, Training & Development 1.00 98,089 14 72,900 109,351
Supervisor, Recruiting 1.00 81,233 13 66,884 100,327
Assistant, Administrative 1.00 39,250 7 39,262 58,894
Coordinator, Training and Development 1.00 68,500 11 56,173 84,261
HR Business Partner 1.00 124,091 17 93,951 140,927
HR Generalist 3.00 225,521 12 61,321 91,980
Management Recruiter 1.00 71,000 12 61,321 91,980
Recruiter, Operations-Maintenance 2.00 138,853 11 56,173 84,261
Recruiter, Operations-Transportation 1.00 56,000 11 56,173 84,261
Specialist, Recruiting 1.00 51,730 8 42,994 64,491
Total 14.00 1,097,325
HR-12

HR-13
Talent Management Department-Materials & Services
Expense Category FY2018 FY2019 FY2020 FY2020 FY2021
Actual Actual Budget Estimate Budget
Professional & Technical-Gen & Adm 117,689 40,632 49,500 25,222 39,600
Recruitment Expense 152,323 95,089 109,300 58,037 218,600
Other Services- Gen & Adm 65,589 79,515 26,000 26,096 40,000
Office Supplies 80
Other Materials- Gen & Adm 4,318 871 5,000
Unreconciled Mastercard Expense 5,035 12,025
Telephone 253 318
NU-Dues & Subscriptions 483 499
NU-Education & Training - Gen & Adm 2,609 10,595 988
Education Reimbursement 70,363 87,503 81,800 62,126 107,600
Agency Training 156,602 214,326 247,800 190,964 250,000
NU-Out-Of-Town Travel 2,705 7,474 276
Employee Recognition 31
Total $573,731 $540,300 $514,400 $376,605 $660,800

HR-14
Labor Relations Department
Summary FY2018 FY2019 FY2020 FY2021
Actual Actual Budget Estimate Proposed Approved Adopted
Personnel Services 812,677 887,243 1,052,817 887,481 843,706
Materials & Services 38,193 52,539 9,500 5,492 10,000
Total $850,870 $939,782 $1,062,317 $892,973 $853,706
Responsibilities: Business Plan:The Labor Relations Department of the Labor Relations & Human Resources Internal Business Practices CategoryDivsion is responsible for administering the collective bargaining agreement Goal #1 Deliver Safe, Efficient, and Equitable Servicefairly, bargaining labor agreements, managing grievance processing, and Objective #17 Ensure cost-effective servicetraining operations' managers on the effective handling of labor and Goal #3 Business Practices that Create Value and Spur Innovation and employee relations issues. Continuous Improvement
Objective #25 Develop and pursue strategic partnerships to optimize Goals and Objectives: and innovate practices and processes1) Coach managers in handling labor matters with the represented workforce.2) Facilitate labor management meetings between labor and operating Performance Measures:
managers. 1) Labor contract provisions in support of TriMet's strategic financial plan3) Manage the collective bargaining process, including successor contract are bargained.
and mid-term bargaining. 2) Effective and respectful labor and employee relations with the ATU4) Process, hear, and arbitrate grievances. leadership are pursued.5) Process and represent the District in advancing or defending unfair labor 3) Discipline imposed upon represented employees meets just cause.
practice charges. 4) ATU is timely notified employment relations matters and changes to6) Train managers on changes in the law and the labor contract that affect TriMet's HR policies.
management of the workforce. 5) Managers with represented employees are trained to consistently applythe labor agreement and District policy and to comply with applicablelabor and employment laws.
6) TriMet achieves regulatory and statutory compliance on labor andemployment matters.

HR-15
Labor Relations Department-Personnel Services
Expense Category FY2018 FY2019 FY2020 FY2020 FY2021
Actual Actual Budget Estimate Budget
Labor 537,992 665,327 776,787 656,670 643,128
Fringe 274,685 221,916 276,030 230,811 200,578
Total $812,677 $887,243 $1,052,817 $887,481 $843,706

Labor Relations Department-Personnel Profile
Position Title Total FTE Base Salary Expense Grade Min Max
Director, Labor & Employee Relations 1.00 150,100 20 120,234 180,349
Analyst, Labor 1.00 83,153 12 61,321 91,980
HR Generalist 1.00 72,000 12 61,321 91,980
Deputy General Counsel (Emp Law & Labor Relations) 1.00 127,000 19 110,833 166,251
Program Manager, Labor Relations 2.00 210,875 17 93,951 140,927
Total 6.00 643,128
HR-16

HR-17
Labor Relations Department-Materials & Services
Expense Category FY2018 FY2019 FY2020 FY2020 FY2021
Actual Actual Budget Estimate Budget
Other Services- Gen & Adm 26,873 38,620 9,500 4,762 10,000
Office Supplies 342 317 35
Other Materials- Gen & Adm 304 4,244
Unreconciled Mastercard Expense 3,709
Computer Equip under $5,000 170
Telephone 1,425 2,748 695
NU-Dues & Subscriptions 752 824
NU-Local Travel & Meetings 412 80
NU-Education & Training - Gen & Adm 1,742 3,168
NU-Out-Of-Town Travel 2,464 2,538
Total $38,193 $52,539 $9,500 $5,492 $10,000

HR-18
Compensation Department
Summary FY2018 FY2019 FY2020 FY2021
Actual Actual Budget Estimate Proposed Approved Adopted
Personnel Services 390,954 377,693 392,956
Materials & Services 34,600 50,134 58,400
Total $425,554 $427,827 $451,356
Responsibilities: Business Plan:The Compensation Department of the Labor Relations & Human Resources People & InnovationDivision is responsible for managing the agency's pay program by offering Goal #2 TriMet is Where Diverse and Talented People Want to competitive and compliant programs. These goals support TriMet's business Come, Stay and Thrive. plan goal to recruit, retain and engage a talented workforce. Objective #29 Invest Wisely in People
Goals and Objectives:1) Classify jobs competitively and in compliance with federal and state Performance Measures:
regulations. 1) Pay Administration is compliant with external federal and state2) Develop and administer the Predicted Compensation Model (PCM), which regulations and internal policies, guidelines and budget.
serves as the primary tool to comply with the Pay Equity Law. 2) Business Plan metrics (SPF) are reported and sustained by a3) Administer the annual salary program (Merit/PCM) and year round salary systematic process.
actions. 3) Job Descriptions accurately reflect the job's knowledge, skill, effort,4) Establish TriMet's grade structure and job family matrix. responsibility and working conditions.5) Maintain current Job Descriptions and Position Descriptions, which serve 4) Grade Structures reflect the market value for assigned grades.
as a Market Pricing, Career Development & Performance Management Tool.

HR-19
Compensation Department-Personnel Services
Expense Category FY2018 FY2019 FY2020 FY2020 FY2021
Actual Actual Budget Estimate Budget
Labor 284,750 280,171 295,047
Fringe 106,204 97,522 97,909
Total $390,954 $377,693 $392,956

Compensation Department-Personnel Profile
Position Title Total FTE Base Salary Expense Grade Min Max
Manager, Compensation 1.00 130,124 17 93,951 140,927
Analyst, Compensation 1.00 71,000 13 66,884 100,327
Analyst, Sr. Compensation 1.00 93,923 15 79,406 119,110
Total 3.00 295,047
HR-20

HR-21
Compensation Department-Materials & Services
Expense Category FY2018 FY2019 FY2020 FY2020 FY2021
Actual Actual Budget Estimate Budget
Professional & Technical-Gen & Adm 6,000 8,400 6,100
Temporary Help-Gen & Adm 1,000 500
Compensation Survey Services 25,700 40,240 50,400
Other Materials- Gen & Adm 1,900 994 1,900
Total $34,600 $50,134 $58,400

HR-22
[This Page Left Intentionally Blank]

LS-1
LEGAL SERVICES DIVISION
Summary FY2018 FY2019 FY2020 FY2021
Actual Actual Budget Estimate Proposed Approved Adopted
Personnel Services 2,001,974 2,024,646 2,440,454 2,412,392 2,657,508Materials & Services 227,383 251,684 2,577,970 2,227,132 3,619,600
Total $2,229,357 $2,276,330 $5,018,424 $4,639,524 $6,277,108
Legal Services Division PageDivision Summary ........................................................................................ LS-1Legal Services Administration ..................................................................... LS-2Litigation ...................................................................................................... LS-6Real Estate & Transit Oriented Development .............................................. LS-10

LS-2
Legal Services Administration Department
Summary FY2018 FY2019 FY2020 FY2021
Actual Actual Budget Estimate Proposed Approved Adopted
Personnel Services 2,001,974 2,024,646 1,208,409 1,127,453 1,305,908
Materials & Services 227,383 251,684 262,800 234,824 249,900
Total $2,229,357 $2,276,330 $1,471,209 $1,362,277 $1,555,808
Responsibility: Business Plan:The Administration Department provides professional, competent, highly Financialresponsive and cost-effective legal assistance to the TriMet Board, Executive Goal #2: Manage Assets to Ensure Safety and Optimize Value, Team, and staff. It works with all TriMet divisions to accomplish TriMet's Performance, and Resiliencymission and goals within legal, ethical, financial, and business parameters. The Internal Business Practices Legal Services Division has three departments: Administration, Litigation and Goal #3: Business Practices that Create Value Real Estate and Transit Oriented Development. and Spur Innovation and Continuous Improvement
People and Innovation Goals & Objectives: Goal #1: Ensure a Culture of Safety1) Agency Operations and Objectives. Goal #2: TriMet is Where Diverse and Talented 2) Municipal/Public Law. People Want to Come, Stay and Thrive3) Employment/Labor Law. Goal #3: Foster Service Excellence and Innovation4) Contracts, including Intergovernmental Agreements. Customers5) Board Governance and Public Meetings. Goal #2: Satisfied Community Stakeholders and Employers6) Records Governance, including Enterprise Content Management and
Public Records Laws. Performance Measures:1) Demonstrate a comprehensive understanding of Agency initiatives,
policies, and TriMet code.2) Provide accurate and effective analysis of federal, state and local laws.3) Successfully defend litigation.4) Provide practical, useful advice on a wide range of Agency issues.5) Help minimize potential project development and implementation
problems.6) Advance the Agency's Records Governance Initiatives, including
Enterprise Content Management.
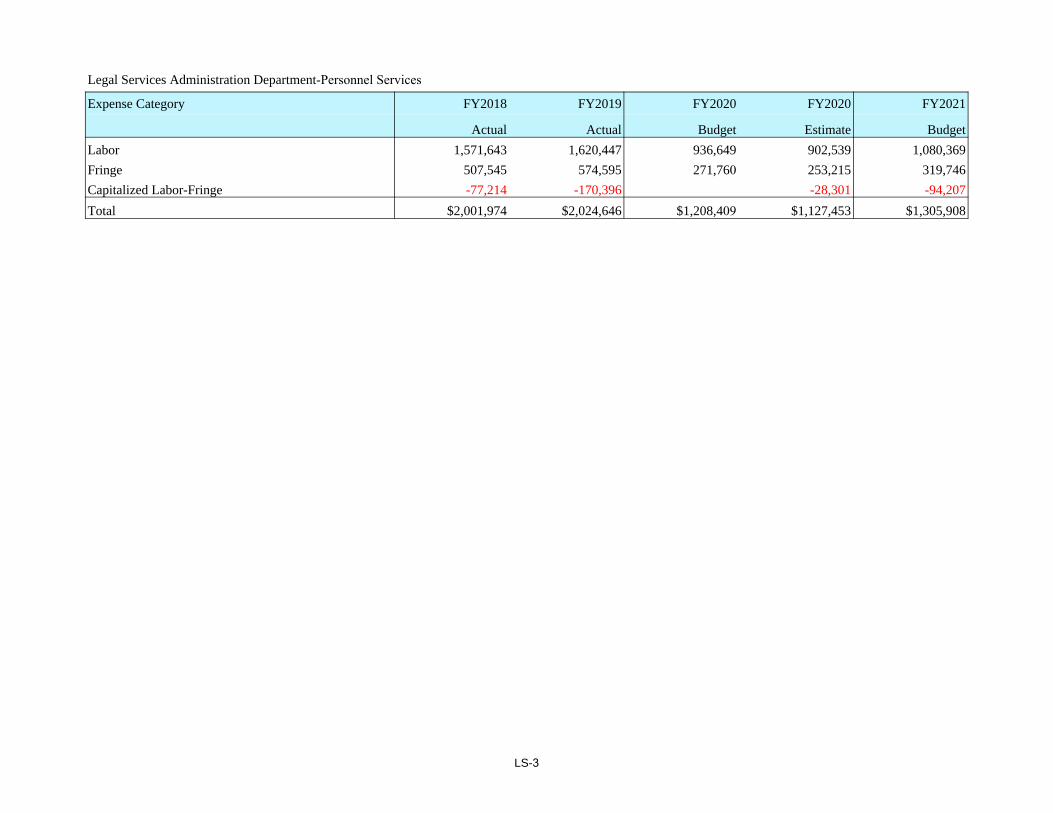
LS-3
Legal Services Administration Department-Personnel Services
Expense Category FY2018 FY2019 FY2020 FY2020 FY2021
Actual Actual Budget Estimate Budget
Labor 1,571,643 1,620,447 936,649 902,539 1,080,369
Fringe 507,545 574,595 271,760 253,215 319,746
Capitalized Labor-Fringe -77,214 -170,396 -28,301 -94,207
Total $2,001,974 $2,024,646 $1,208,409 $1,127,453 $1,305,908

Legal Services Admin-Personnel Profile
Position Title Total FTE Base Salary Expense Grade Min Max
Exec Dir, Legal Services (General Counsel) 1.00 234,399 26 192,765 289,147
Manager, Records Governance 1.00 95,242 14 72,900 109,351
Analyst, Records 1.00 74,000 11 56,173 84,261
Analyst, Records Governance Liaison 1.00 74,000 11 56,173 84,261
Assistant, Legal 1.00 66,997 11 56,173 84,261
Business Analyst, ECM Systems 1.00 91,126 14 72,900 109,351
Deputy General Counsel, Senior (Governance) 1.00 164,322 20 120,234 180,349
Deputy General Counsel (Worker's Compensation) 1.00 104,605 18 102,080 153,120
Paralegal I 1.00 69,202 9 47,037 70,555
Total 9.00 973,893
LS-4

LS-5
Legal Services Administration Department-Materials & Services
Expense Category FY2018 FY2019 FY2020 FY2020 FY2021
Actual Actual Budget Estimate Budget
Legal 101,323 120,557 74,800 70,964 65,000
Professional & Technical-Gen & Adm 13,769 7,504 3,000 5,032 3,200
Temporary Help-Gen & Adm 719
Other Services- Gen & Adm 4,021 13,480 20,000 12,915 10,000
Office Supplies 1,134 3,414 3,000 2,501 3,000
Other Materials- Gen & Adm 4,360 5,036 15,000 12,050 20,200
Telephone 792 1,055 637
NU-Dues & Subscriptions 73,953 66,736 85,000 82,009 85,900
NU-Local Travel & Meetings 1,978 764 2,000 1,185 2,000
NU-Education & Training - Gen & Adm 13,618 10,846 30,000 22,668 30,300
NU-Out-Of-Town Travel 12,269 21,123 30,000 24,843 30,300
Employee Recognition 166 450 20
Total $227,383 $251,684 $262,800 $234,824 $249,900

LS-6
Litigation Department
Summary FY2018 FY2019 FY2020 FY2021
Actual Actual Budget Estimate Proposed Approved Adopted
Personnel Services 922,851 912,118 942,485Materials & Services 20,000 10,484 20,000
Total $942,851 $922,602 $962,485
Responsibility: Business Plan:The Litigation Department provides professional, competent, highly Financialresponsive and cost-effective legal assistance to the TriMet Board, Executive Goal #1 Fiscally Sound and Compliant Team, and staff. It works with all TriMet divisions to accomplish TriMet's Internal Business Practices mission and goals within legal, ethical, financial, and business parameters. Goal #1 Deliver Safe, Efficient and Equitable Service
People and InnovationGoals & Objectives: Goal #1 Ensure a Culture of Safety1) Agency Operations and Objectives. Goal #2 TriMet is Where Diverse and Talented 2) Municipal/Public Law. People Want to Come, Stay and Thrive3) Employment/Labor Law. Goal #3 Foster Service Excellence and Innovation4) Complex Business Litigation and Tort Defense. Customers5) Risk Assessment. Goal #2 Satisfied Community Stakeholders and Employers
Performance Measures:1) Demonstrate a comprehensive understanding of Agency initiatives,
policies, and TriMet code.2) Provide accurate and effective analysis of federal, state and local laws.3) Provide practical, useful advice on a wide range of Agency issues.4) Successfully defend litigation and administrative proceedings.

LS-7
Litigation Department-Personnel Services
Expense Category FY2018 FY2019 FY2020 FY2020 FY2021
Actual Actual Budget Estimate Budget
Labor 680,655 698,033 703,802
Fringe 242,196 214,085 238,683
Total $922,851 $912,118 $942,485

Litigation Department-Personnel Profile
Position Title Total FTE Base Salary Expense Grade Min Max
Director, Legal Services 1.00 161,404 22 141,179 211,771
Deputy General Counsel 1.00 103,173 18 102,080 153,120
Deputy General Counsel, Senior 2.00 269,351 20 120,234 180,349
Paralegal Investigator 1.00 82,098 13 66,884 100,327
Specialist, Litigation 1.00 87,776 13 66,884 100,327
Total 6.00 703,802
LS-8

LS-9
Litigation Department-Materials & Services
Expense Category FY2018 FY2019 FY2020 FY2020 FY2021
Actual Actual Budget Estimate Budget
Legal 20,000 10,359 20,000
Other Services- Gen & Adm 125
Total $20,000 $10,484 $20,000

LS-10
Real Estate & Transit Oriented Development Department
Summary FY2018 FY2019 FY2020 FY2021
Actual Actual Budget Estimate Proposed Approved Adopted
Personnel Services 309,194 372,821 409,115
Materials & Services 2,295,170 1,981,824 3,349,700
Total $2,604,364 $2,354,645 $3,758,815
Responsibility: Business Plan:The Real Estate and Transit Oriented Development Department provides Financialprofessional, competent, highly responsive and cost-effective legal assistance to Goal #2 Manage Assets to Ensure Safety and Optimize Value, the TriMet Board, Executive Team, and staff regarding TriMet's real estate and Performance, and Resiliencydevelopment needs. It works with all TriMet divisions to accomplish TriMet's Internal Business Practices mission and goals within legal, ethical, financial and business parameters. Goal #2 Design and Deliver Successful Projects
Goal #3 Business Practices that Create Value and Spur Innovation and Continuous Improvement
Goals & Objectives: Objective #27 Innovatively increase finanical resources1) Agency Operations and Objectives. People and Innovation2) Municipal/Public Law. Goal #1 Ensure a Culture of Safety3) Contracts, including Intergovernmental Agreements. Goal #2 TriMet is Where Diverse and Talented People4) Real Estate/Land Use/Construction/Transit Oriented Development Want to Come, Stay and Thrive5) Complex Transactions. Goal #3 Foster Service Excellence and Innovation6) Risk Assessment. Customers
Goal #2 Satisfied Stakeholders and Employees Objective #7 Help shape the future of cities and our region in line with Metro 2040 Growth Concept
Performance Measures:1) Demonstrate a comprehensive understanding of Agency initiatives,
policies, and TriMet code.2) Provide accurate and effective analysis of federal, state and local laws.3) Provide practical, useful advice on a wide range of Agency issues.4) Advance the Agency's capital and transit-oriented development
projects, including management of TriMet's real estate needs.

LS-11
Real Estate & Transit Oriented Development Department-Personnel Services
Expense Category FY2018 FY2019 FY2020 FY2020 FY2021
Actual Actual Budget Estimate Budget
Labor 676,990 605,713 908,825
Fringe 226,366 197,860 310,199Capitalized Labor-Fringe -594,162 -430,752 -809,909
Total $309,194 $372,821 $409,115

Real Estate & Transit Oriented Development Department-Personnel Profile
Position Title Total FTE Base Salary Expense Grade Min Max
Manager, Real Estate 1.00 111,234 16 86,398 129,597
Deputy General Counsel 1.00 127,600 18 102,080 153,120
Right-of-Way Surveyor 1.00 89,779 14 72,900 109,351
Specialist, Property Acquisition & Relocation 2.00 173,306 13 66,884 100,327
TOD Commercial Developer 1.00 130,000 18 102,080 153,120
Agency Architect - Transit Oriented Development 1.00 122,526 16 86,398 129,597
Director, Real Estate & Transit Oriented Devel 1.00 154,380 21 130,346 195,520
Total 8.00 908,825
LS-12

LS-13
Real Estate & Transit Oriented Development Department-Materials & Services
Expense Category FY2018 FY2019 FY2020 FY2020 FY2021
Actual Actual Budget Estimate Budget
Legal 100,000 74,030 10,700
Professional & Technical-Gen & Adm 235,800
Other Services- Gen & Adm 100,000
Other Materials- Gen & Adm 28 15,000
Property Taxes 54,400 39,032 54,900
Lease Agreements 97,920
Office Leases 2,140,770 1,770,814 2,933,300
Total $2,295,170 $1,981,824 $3,349,700

LS-14
[This Page Left Intentionally Blank]

EC-1
ENGINEERING & CONSTRUCTION DIVISION
Summary FY2018 FY2019 FY2020 FY2021
Actual Actual Budget Estimate Proposed Approved Adopted
Personnel Services 2,427,266 2,153,349 3,372,395 2,698,638 3,513,848
Materials & Services 2,187,846 2,231,221 662,000 605,307 650,100
Total $4,615,112 $4,384,570 $4,034,395 $3,303,945 $4,163,948
Engineering & Construction Division PageDivision Summary ....................................................................................... EC-1Engineering & Construction Administration ............................................... EC-2Design & Construction ................................................................................ EC-6Major Projects .............................................................................................. EC-10Project Development & Permitting .............................................................. EC-14

EC-2
Engineering & Construction Administration Department
Summary FY2018 FY2019 FY2020 FY2021
Actual Actual Budget Estimate Proposed Approved Adopted
Personnel Services 329,766 347,595 1,016,430 867,531 1,133,499
Materials & Services 253,394 202,117 447,000 447,126 450,700
Total $583,160 $549,712 $1,463,430 $1,314,657 $1,584,199
Responsibility: Business Plan:The Engineering & Construction Administration Department is responsible Customers Goal Categoryfor managing project cost and budgets, ensuring compliance with federal Goal #1 Satisfied Community Stakeholders and Employersrequirements and establishing sound business practices for the Engineering & Objective #1 Ease congestion by providing attractive travel options during peak periodsConstruction Division. Internal Business Practices Category
Goal #1 Design and Deliver Successful Projects Goals & Objectives: Objective #1 Develop higher capacity bus service1) Develop and manage division and project budgets; prepare cost estimates Objective #2 Meet milestones for successful development of SW Corridor
for all phases of projects. Goal #2 Business Practices that Create Value and Spur Innvovation and2) Maintain project cost databases; review and approve invoices for payment; continuous improvement
develop cash flow and other tools to monitor and manage project revenue Objective #1 Develop and pursue strategic partnerships to optimize andand expenditures. innovate practices and processes
3) Prepare monthly reports for all projects; prepare division quarterly reports.4) Coordinate project insurance programs. Performance Measures:5) Manage certified payroll compliance for projects. 1) Implement, track, and complete state of good repair, leverage, and major6) Create and manage division project schedules. projects on time and within budget.7) Provide guidelines for `best practices' included in the Business 2) Prepare monthly and quarterly reports.
Procedures Manual. 3) Comply with federal grant requirements for federally funded major projects.4) Track construction activities for the Division Transit Project to ensure
compliance with the FTA's single Year Grant Agreement.5) Track Federal Transit Administration (FTA) project development activities
for the SW Corridor and Redline Extension & Reliability Improvements Projects.6) Support development of capital budget for design and construction projects.

EC-3
Engineering & Construction Administration Department-Personnel Services
Expense Category FY2018 FY2019 FY2020 FY2020 FY2021
Actual Actual Budget Estimate Budget
Labor 240,318 257,578 1,609,084 1,424,290 1,779,711
Fringe 89,448 90,017 505,643 435,560 499,715
Capitalized Labor-Fringe -1,098,297 -992,319 -1,145,927
Total $329,766 $347,595 $1,016,430 $867,531 $1,133,499

Engineering & Construction Administration Department-Personnel Profile
Position Title Total FTE Base Salary Expense Grade Min Max
Executive Director, Engineering & Construction 1.00 192,969 24 165,265 247,899
Director, Program Management 1.00 139,002 20 120,234 180,349
Manager, Cost Estimating 1.00 113,435 17 93,951 140,927
Manager, Quality Assurance 1.00 118,230 17 93,951 140,927
Program Manager, FTA & Eng & Const Programs 1.00 108,006 15 79,406 119,110
Supervisor, Cost 1.00 85,887 13 66,884 100,327
Administrator, Public Arts 1.00 95,421 14 72,900 109,351
Coordinator, Quality Assurance 1.00 101,629 15 79,406 119,110
Cost Estimator 1.00 77,900 12 61,321 91,980
Cost Estimator II 1.00 84,369 14 72,900 109,351
Executive Administrative Assistant 1.00 74,069 11 56,173 84,261
Program Scheduler, Senior 1.00 122,235 17 93,951 140,927
Coordinator, Compliance 1.00 62,349 11 56,173 84,261
Total 13.00 1,375,501
EC-4

EC-5
Engineering & Construction Administration Department-Materials & Services
Expense Category FY2018 FY2019 FY2020 FY2020 FY2021
Actual Actual Budget Estimate Budget
Rail Volution Conference 15,000 16,045
Professional & Technical-Gen & Adm 70,000 83,170 90,000
Contracted Conservation - ROW Art 100,000 95,348 100,000
Printing/Bindery Services 12,110 11,323 16,000 18,906 18,000
Other Services- Gen & Adm 773 1,524 10,000 9,588 10,000
Office Supplies 30,980 29,366 32,000 38,799 42,000
Other Materials- Gen & Adm 7,925 53 676
Unreconciled Mastercard Expense 10 590
Telephone 1,572 445 28,200 29,341 35,000
NU-Dues & Subscriptions 43,054 42,378 32,300 31,554 32,000
NU-Local Travel & Meetings 4,628 1,458 29,700 30,953 32,000
NU-Education & Training - Gen & Adm 45,147 38,626 48,300 33,891 34,000
NU-Out-Of-Town Travel 91,857 60,120 78,000 72,673 55,200
Employee Recognition 338 779 2,500 1,637 2,500
Total $253,394 $202,117 $447,000 $447,126 $450,700

EC-6
Design and Construction Department
Summary FY2018 FY2019 FY2020 FY2021
Actual Actual Budget Estimate Proposed Approved Adopted
Personnel Services 2,097,500 1,805,754 1,537,923 1,067,521 1,798,827
Materials & Services 1,934,452 2,029,104 32,500 26,762 38,000
Total $4,031,952 $3,834,858 $1,570,423 $1,094,283 $1,836,827
Responsibility: Business Plan:The Design & Construction Department provides responsive, cost-effective Internal Business Practices Categoryand comprehensive planning, design, construction and management of projects Goal #1 Deliver Safe, Efficient, and Equitable Serviceto maintain district facilities in a state of good repair and implement system Objective#1 Provide reliable performanceenhancements to increase reliability and capacity. It provides technical support Goal #2 Design and Deliver Successful Projectsto Rail Maintenance of Way, Rail Equipment Maintenance, Commuter Rail, Objective #2 Improve existing MAX infrastructure for reliability Facilities Maintenance and Safety and Security Departments. and capacity
Goal #3 Business Practices that Create Value and Spur Innovation and Goals & Objectives: Continuous Improvement 1) Manage planning, design, construction and turnover of new transit Objective #3 Innovatively increase financial resources
facilities and improvements.2) Manage renovation of existing transit facilities, plan, prioritize, design,
permit, construct and turn over improvements. Performance Measures:3) Assist TriMet's Transportation and Maintenance divisions with service 1) Deliver assigned capital program projects per agency budget, schedule,
improvements. minority business and safety objectives.4) Provide engineering, scheduling and general technical support for 2) Assist other divisions by providing requested engineering, project
Capital Improvement Program (CIP) projects. management and technical support.5) Advance remaining elements of the Portland-Milwaukie Light Rail Project. 3) Maximize capital program utilization (CIP).6) Continue with procurement of Type VI light rail vehicles.

EC-7
Design and Construction Department-Personnel Services
Expense Category FY2018 FY2019 FY2020 FY2020 FY2021
Actual Actual Budget Estimate Budget
Labor 7,526,758 8,153,778 4,428,764 4,139,105 4,701,815
Fringe 2,887,139 2,787,314 1,692,929 1,397,406 1,692,800
Capitalized Labor-Fringe -8,316,397 -9,135,338 -4,583,770 -4,468,990 -4,595,788
Total $2,097,500 $1,805,754 $1,537,923 $1,067,521 $1,798,827
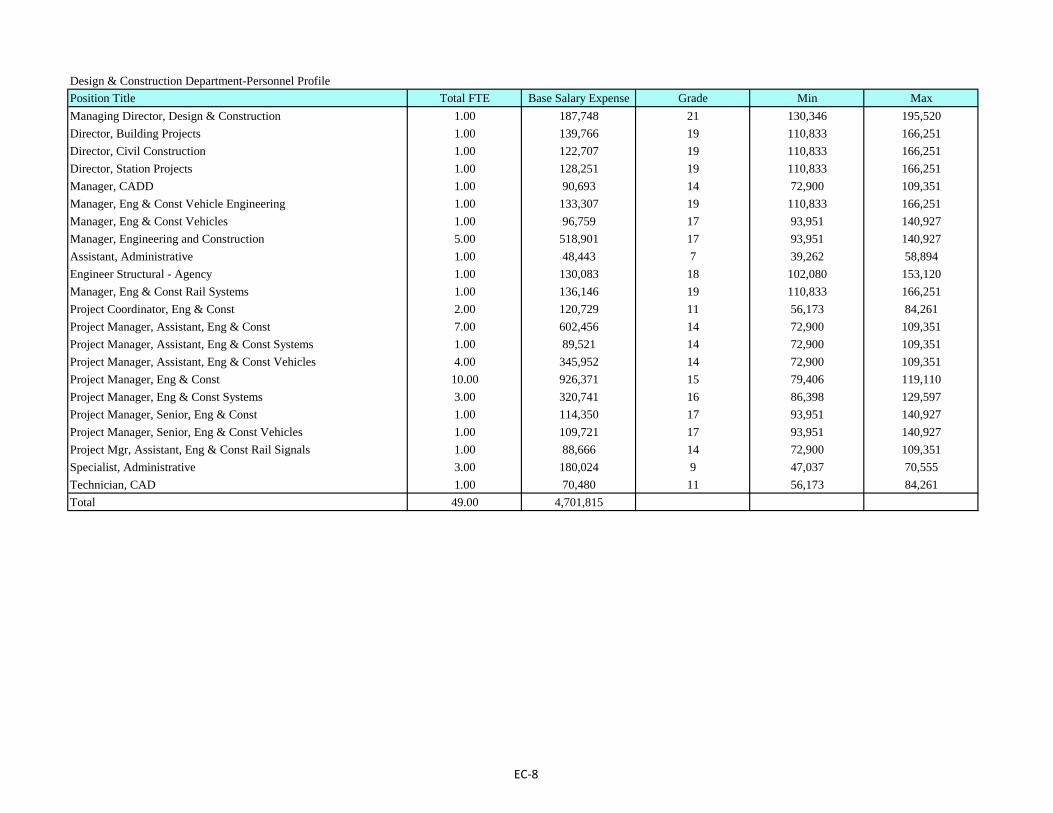
Design & Construction Department-Personnel Profile
Position Title Total FTE Base Salary Expense Grade Min Max
Managing Director, Design & Construction 1.00 187,748 21 130,346 195,520
Director, Building Projects 1.00 139,766 19 110,833 166,251
Director, Civil Construction 1.00 122,707 19 110,833 166,251
Director, Station Projects 1.00 128,251 19 110,833 166,251
Manager, CADD 1.00 90,693 14 72,900 109,351
Manager, Eng & Const Vehicle Engineering 1.00 133,307 19 110,833 166,251
Manager, Eng & Const Vehicles 1.00 96,759 17 93,951 140,927
Manager, Engineering and Construction 5.00 518,901 17 93,951 140,927
Assistant, Administrative 1.00 48,443 7 39,262 58,894
Engineer Structural - Agency 1.00 130,083 18 102,080 153,120
Manager, Eng & Const Rail Systems 1.00 136,146 19 110,833 166,251
Project Coordinator, Eng & Const 2.00 120,729 11 56,173 84,261
Project Manager, Assistant, Eng & Const 7.00 602,456 14 72,900 109,351
Project Manager, Assistant, Eng & Const Systems 1.00 89,521 14 72,900 109,351
Project Manager, Assistant, Eng & Const Vehicles 4.00 345,952 14 72,900 109,351
Project Manager, Eng & Const 10.00 926,371 15 79,406 119,110
Project Manager, Eng & Const Systems 3.00 320,741 16 86,398 129,597
Project Manager, Senior, Eng & Const 1.00 114,350 17 93,951 140,927
Project Manager, Senior, Eng & Const Vehicles 1.00 109,721 17 93,951 140,927
Project Mgr, Assistant, Eng & Const Rail Signals 1.00 88,666 14 72,900 109,351
Specialist, Administrative 3.00 180,024 9 47,037 70,555
Technician, CAD 1.00 70,480 11 56,173 84,261
Total 49.00 4,701,815
EC-8

EC-9
Design and Construction Department-Materials & Services
Expense Category FY2018 FY2019 FY2020 FY2020 FY2021
Actual Actual Budget Estimate Budget
Professional & Technical-Gen & Adm 160,015 103,149 30,000 22,731 30,300
Willamette Shore Line 30,000 65,130
Contracted Conservation - ROW Art 92,513 72,021
Shelter Services 90,110 135,962
Printing/Bindery Services 1,200 5,320
Other Services- Gen & Adm 10,632 11,803
Office Supplies 22,220 12,387 2,359
Equip/Furn < $5,000-Gen & Adm 6,973
Shelter Materials 58,231 90,917
Bus Stop Poles/Signage 5,326
Other Materials- Gen & Adm 16,529 5,869 150 5,200
Unreconciled Mastercard Expense 6
Computer Equip under $5,000 340 1,898
Telephone 34,237 34,030
Property Taxes 43,942 38,162
NU-Dues & Subscriptions 220 210
NU-Local Travel & Meetings 35,786 36,012
NU-Education & Training - Gen & Adm 80 9
Fines & Penalties 4,897
Bid Advertising 1,697 814 2,500 1,522 2,500
Special Event Expenses 15,174 17,191
Lease Agreements 32,400 9,220
Office Leases 1,277,256 1,383,668
Total $1,934,452 $2,029,104 $32,500 $26,762 $38,000

EC-10
Major Projects Department
Summary FY2018 FY2019 FY2020 FY2021
Actual Actual Budget Estimate Proposed Approved Adopted
Personnel Services 595,654 418,944 382,549
Materials & Services 67,500 51,554 45,500
Total $663,154 $470,498 $428,049
Responsibility: Business Plan:The Major Projects Department plans, designs, remodels and constructs high Customers Goal Categoryvalue transit projects. Work includes federally funded in-street (bus) facilities, Goal #1 Safisfied Community Stakeholders and Employersrapid bus systems, operations and administrative facilities, bus garages, light Objective #1 Ease congestion by providing attractive travel options duringrail operations bases, rail reliability improvements and extensions to light rail. peak periods
Objective #2 Increase funding for regional mobility expansionGoals & Objectives: Internal Business Practices Category1) Perform scoping, direct preliminary and final design of capital projects Goal #1 Design and Deliver Successful Projects
performed by staff and consultants, manage construction and safety Objective #1 Develop higher capacity bus servicescertifications. Objective #2 Meet milestones for successful development of SW Corridor Project
2) Advance construction activities for the Division Transit Projectto maintain scope, schedule, and budget. Performance Measures:
3) Achieve project readiness for MAX Redline Extension and Reliability 1) Advance DTP construction and milestones to deliver Project by Fall 2022Improvements Project (Red Line Project) and apply for a federally funded in support of agency goals for high capacity bus service.Small Starts Grant Agreement. 2) Complete the Red Line Project design and receive Small Starts Grant
4) Complete the environmental phase of the WS Corridor Project; with Agreement (SSGA) to allow construction to begin in Spring 2021.published Final Environmental Impact Statement (FEIS) and Record of 3) Complete the FEIS for Southwest Corridor Project in Summer 2020 submitDecision (ROD). Complete Project Development (30%) design. Complete application for Project Engineering in Fall 2020.and submit required elements to the Federal Transit Administration (FTA)to request entry into the Project Engineering phase.

EC-11
Major Projects Department-Personnel Services
Expense Category FY2018 FY2019 FY2020 FY2020 FY2021
Actual Actual Budget Estimate Budget
Labor 1,961,313 1,711,914 2,364,788
Fringe 720,444 572,367 788,441
Capitalized Labor-Fringe -2,086,103 -1,865,337 -2,770,680
Total $595,654 $418,944 $382,549

Major Projects Department-Personnel Profile
Position Title Total FTE Base Salary Expense Grade Min Max
Director, Southwest Corridor 1.00 167,641 21 130,346 195,520
Manager, Design-Southwest Corridor 1.00 120,691 19 110,833 166,251
Manager, Division Transit Project 1.00 108,582 17 93,951 140,927
Manager, Programs - Southwest Corridor 1.00 118,493 19 110,833 166,251
Assistant, Administrative 1.00 46,509 7 39,262 58,894
Project Manager, Assistant, Eng & Const 3.00 264,057 14 72,900 109,351
Project Manager, Assistant, SW Corridor 1.00 88,019 14 72,900 109,351
Project Manager, Eng & Const 10.00 948,098 15 79,406 119,110
Project Manager, Senior, Design 1.00 113,435 17 93,951 140,927
Project Manager, Senior, Eng & Const 3.00 328,153 17 93,951 140,927
Senior Administrative Assistant 1.00 61,110 9 47,037 70,555
Total 24.00 2,364,788
EC-12

EC-13
Major Projects Department-Materials & Services
Expense Category FY2018 FY2019 FY2020 FY2020 FY2021
Actual Actual Budget Estimate Budget
Professional & Technical-Gen & Adm 10,000 8,000 10,100
Other Materials- Gen & Adm 22,500 11,645
Special Event Expenses 35,000 31,909 35,400
Total $67,500 $51,554 $45,500

EC-14
Project Development & Permitting Department
Summary FY2018 FY2019 FY2020 FY2021
Actual Actual Budget Estimate Proposed Approved Adopted
Personnel Services 222,388 344,642 198,973
Materials & Services 115,000 79,865 115,900
Total $337,388 $424,507 $314,873
Responsibility: Business Plan:The Project Development & Permitting Department provides responsive Internal Business Practices Categoryproject planning and development of project's scope, cost estimate, schedule Goal #1 Satisfied Community Stakeholders and Employeesand development of risk necessary for the consideration by decision makers. Objective #1 Help shape the future of cities and our region in line with Metro Projects include both internal projects that address maintenance and operations 2040 growth conceptand external projects that include Small and New Starts projects that affect new Goal #2 Deliver Safe, Efficient, and Equitable Servicebus and light rail lines. The department is also the interface with outside parties Objective #2 Develop partnerships to support faster and more reliable bus service that could affect TriMet property, operations or facilities. Objective #3 Meet Milestones for successful development of SW Corridor
The department is responsible for securing federal, state and local approvals and permits, developing strategies and forwarding Small and New Starts Performance Measures:projects, in addition to coordinating and developing local partnerships 1) Complete project development activities on all projects submitted throughand strategies to help buses move more quickly through the system. the project development process in manner that is consistent with the
Capital Project Committee timeline.Goals & Objectives: 2) Move Small and New Starts Projects forward in the FTA Project1) Conduct project development activities to ensure that quality information Development process. This includes securing the Red Line Project into
is available for executive management to make critical decisions related to Project Development and New Starts Rating materials and preparing themoving projects forward. Southwest Corridor Project for entry into Engineering.
2) Provide quality service to project implementation staff in the development 3) Secure local land use approvals and permits in a timely manner throughof full project descriptions. coordination with local jurisdictions.
3) Move Small and New Starts projects forward through the Federal Transit 4) Narrow the list of and ready projects for inclusion into the 2020 regionalAdministration (FTA) process while ensuring local approvals. funding measure.
4) Support TriMet projects through advising and securing land use approvalsand permits.
5) Provide coordination through all divisions related to third party projectsthat affect our facilities.

EC-15
Project Development & Permitting Department-Personnel Services
Expense Category FY2018 FY2019 FY2020 FY2020 FY2021
Actual Actual Budget Estimate Budget
Labor 720,894 727,551 745,211
Fringe 247,620 217,156 224,161Capitalized Labor-Fringe -746,126 -600,065 -770,399
Total $222,388 $344,642 $198,973

Project Development and Permitting Department-Personnel Profile
Position Title Total FTE Base Salary Expense Grade Min Max
Director, Project Development & Permitting 1.00 164,663 21 130,346 195,520
Manager, Capital Planning 1.00 104,315 16 86,398 129,597
Coordinator, Environmental Permits 1.00 91,261 14 72,900 109,351
Designer, Senior, Transit Corridor 1.00 100,821 14 72,900 109,351
Planner III 1.00 86,648 13 66,884 100,327
Project Manager, Eng & Const 2.00 197,502 15 79,406 119,110
Total 7.00 745,210
EC-16

EC-17
Project Development & Permitting Department-Materials & Services
Expense Category FY2018 FY2019 FY2020 FY2020 FY2021
Actual Actual Budget Estimate Budget
Rail Volution Conference 15,000 22,500 15,000
Professional & Technical-Gen & Adm 70,000 42,365 70,900
Willamette Shore Line 30,000 15,000 30,000
Total $115,000 $79,865 $115,900

EC-18
[This Page Left Intentionally Blank]
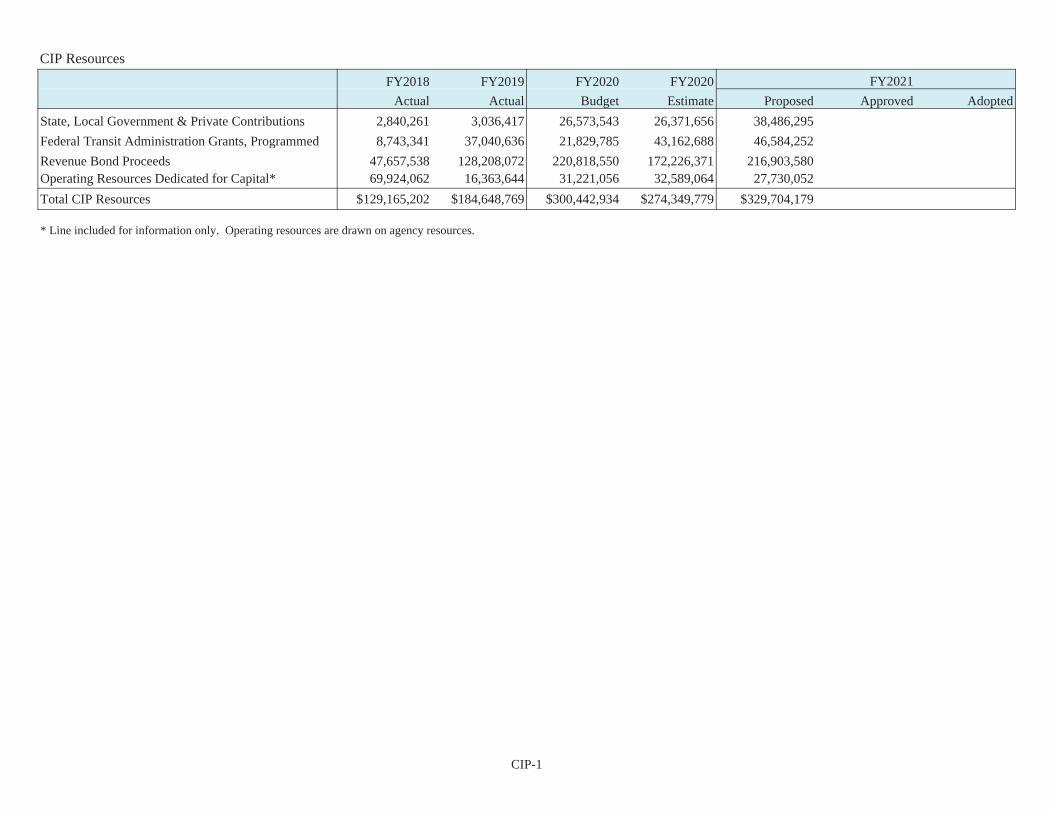
CIP Resources
CIP-1
FY2018 FY2019 FY2020 FY2020 FY2021Actual Actual Budget Estimate Proposed Approved Adopted
State, Local Government & Private Contributions 2,840,261 3,036,417 26,573,543 26,371,656 38,486,295Federal Transit Administration Grants, Programmed 8,743,341 37,040,636 21,829,785 43,162,688 46,584,252Revenue Bond Proceeds 47,657,538 128,208,072 220,818,550 172,226,371 216,903,580Operating Resources Dedicated for Capital* 69,924,062 16,363,644 31,221,056 32,589,064 27,730,052Total CIP Resources $129,165,202 $184,648,769 $300,442,934 $274,349,779 $329,704,179
* Line included for information only. Operating resources are drawn on agency resources.

CIP Requirements
CIP-2
Operating FY2018 FY2019 FY2020 FY2020 FY2021
Actual Actual Budget Estimate Proposed Approved Adopted
Chief Operating Officer Division 1,139,749 1,139,749 4,026,150
Transportation Division 3,879,949 2,794,646 4,093,227 4,158,135 4,138,111
Safety & Security Division 13,583,028 4,617,611 9,839,601 11,382,182 5,507,745
Maintenance Division 58,618,398 85,577,597 143,296,964 136,964,760 132,257,412
Information Technology Division 8,770,527 6,252,473 2,687,776 2,623,579 7,783,749
Public Affairs Division 1,934,320 591,559 5,583,669 5,562,504 4,697,749
Finance & Administrative Services Division 2,492,734 2,395,210 11,414,650 8,981,657 11,242,192
Labor Relations & Human Resources Divison 47,500
Legal Services Division 233,205 629,815 1,898,267 1,717,472 824,086
Engineering & Construction Division 39,605,541 81,789,858 120,489,031 101,819,741 159,226,985Total CIP Requirements $129,165,202 $184,648,769 $300,442,934 $274,349,779 $329,704,179

CIP-3
Project ExternalContribution
ExternalCarryover
TriMetContribution
TriMet Carryover
RevenueBonds Total FY2021 Comments
Chief Operating Officer DivisionPRJ_1139 Operator Training Equipment 123,000 123,000PRJ_1500 Enterprise Asset Management System 3,903,150 3,903,150 2018 & 2019 Bonds
Total Chief Operating Officer Division $123,000 $3,903,150 $4,026,150
Transportation Division
PRJ_4049 ATP Fleet Expansion / Replacement 3,758,111 3,758,111 2019 BondsPRJ_7585 WES Vehicle & Shop Equipment Replacement 380,000 380,000
Total Transportation Division $380,000 $3,758,111 $4,138,111
Safety & Security DivisionPRJ_1112 Security Fencing 200,000 200,000PRJ_1124 Operator Safety & Rider Awareness 151,052 57,763 208,815 Fed GrantPRJ_1129 Network CCTV Systems 498,000 498,000PRJ_1130 Vehicle Borne CCTV Systems 2,185,468 2,185,468PRJ_1151 Security Funds for Transit Enhancement 626,000 626,000 STIF FundsPRJ_1154 Access Control Equipment & Mapping 158,030 158,030PRJ_2507 Bus Operator Protective Barriers 527,165 527,165PRJ_5606 Rail Pedestrian Safety Enhancements 1,104,267 1,104,267
Total Safety & Securty Division $777,052 $4,730,693 $5,507,745

CIP-4
Project ExternalContribution
ExternalCarryover
TriMetContribution
TriMet Carryover
RevenueBonds Total FY2021 Comments
Maintenance DivisionPRJ_3687 LRV Fleet Replacement/Expansion 25,843,737 25,843,737 2018 & 2019 BondsPRJ_4001 Non-Revenue Vehicle Replacement 25,000 250,000 275,000 2019 BondsPRJ_4006 Bus Shop Equipment - Center 295,079 295,079PRJ_4058 Diesel Bus Purchases & Rebuilds 5,691,800 16,898,132 22,589,932 Fed Sec 5339a/2018 & 2019 Bonds/STIFPRJ_4059 Bus Refurbishments - Diesel to Diesel 6,310,000 6,310,000 2019 BondsPRJ_4060 Bus Refurbishments - Diesel to Electric 3,722,000 3,722,000 2019 BondsPRJ_4076 Powell Maintenance Facility 35,650,300 35,650,300 GARVEE 2018 & 2019 BondsPRJ_4604 HVAC Systems 463,000 463,000PRJ_4613 Type 1 Substation Replacement 610,835 610,835PRJ_4652 Building Area/Components Replacement 480,000 480,000PRJ_4653 Electrical Equipment & Systems Replacement 385,000 385,000PRJ_4654 Lifting Equipment & Systems Replacement 275,000 275,000PRJ_4655 Other Building Systems & Equipment 325,000 325,000PRJ_4657 Bldg. Area & Components - Layover 150,000 150,000PRJ_4658 Safety-Hazmat Systems 30,000 30,000PRJ_4659 Site-Property Systems 529,492 529,492PRJ_4676 Cleveland Crew Room Renovation 1,044,748 1,044,748 2019 BondsPRJ_4684 Blue & Red Line Stations Tactile Pavers Replacement (ADA) 792,304 792,304PRJ_4805 Facilities System Masterplan 494,305 494,305PRJ_5508 Bus Stop Development 1,700,000 184,000 1,884,000 STIF FundsPRJ_5615 Electric Vehicle Charging Infrastructure-Powell 6,609,440 6,609,440 STIF FundsPRJ_5626 Electric Bus Purchases & Rebuilds 4,789,585 415,420 5,205,005 Fed Grant/2019 Bonds/STIF FundsPRJ_5628 Electric Vehicle Charging Infrastructure-Merlo 230,000 230,000PRJ_6402 Signal System Relay to PLC 75,000 75,000PRJ_6403 Track Rehab Program 2,300,000 2,300,000PRJ_6404 Arc Flash Implementation Program 352,000 352,000PRJ_6406 Platform Water Svc Restoration - Parkrose & 102nd 176,333 176,333PRJ_7503 Light Rail Shop Equipment Repl. 265,593 3,110,000 3,375,593 2019 BondsPRJ_7508 Type 1 LRV Decommissioning 125,000 125,000PRJ_7535 Light Rail Electrification & Signaling Systems 1,755,000 1,755,000PRJ_7559 Light Rail Track and Structures 1,137,000 1,137,000PRJ_7592 Ruby Junction Expansion 8,767,309 8,767,309 2019 Bonds
Total Maintenance Division $18,790,825 $11,454,941 $102,011,646 $132,257,412

CIP-5
Project ExternalContribution
ExternalCarryover
TriMetContribution
TriMet Carryover
RevenueBonds Total FY2021 Comments
Information Technology DivisionPRJ_1042 Mobile Router Replacement 1,346,667 1,346,667 2019 BondsPRJ_1070 Servers Replacement 770,000 770,000PRJ_1091 Desktop Computing Replacement 528,582 528,582PRJ_1095 Data Communications System Replacement 1,289,500 1,289,500PRJ_1131 Communication Environment Replacement - capital 265,000 265,000PRJ_1152 Radio & Microwave Communication Systems 444,000 444,000 2019 BondsPRJ_1174 NextGen Transit Signal Priority 1,339,509 1,800,491 3,140,000 STIF Funds
Total Information Technology Division $1,339,509 $4,653,573 $1,790,667 $7,783,749Public Affairs Division
PRJ_2045 MAX Station Optimization 373,800 373,800PRJ_2048 Garage, Layover, and TC Expansion 1,381,300 1,381,300 STIF FundsPRJ_5622 HWY 8 Corridor Safety & Access to Transit 95,000 95,000PRJ_5623 Powell-Division Corridor Safety & Access to Transit 54,764 1,479,723 46,326 103,836 1,684,649 Fed STBG/LocalPRJ_6021 Transit Tracker Project 1,163,000 1,163,000 STIF Funds
Total Public Affairs Division $2,599,064 $1,479,723 $515,126 $103,836 $4,697,749
Finance & Administrative Services Division
PRJ_1166 TVM Refurbishment or Replacement 5,101,775 5,101,775 2019 BondsPRJ_1175 Fixed Route Bus Farebox Replacement 3,034,792 3,034,792
PRJ_1176 Hop Fastpass 2.0 600,500 600,500
PRJ_7544 eFare 2,505,125 2,505,125 2018 BondsTotal Finance & Administrative Services Division $3,635,292 $7,606,900 $11,242,192
Legal Services DivisionPRJ_1147 Information Governance Initiative 824,086 824,086
Total Legal Services Division $824,086 $824,086

CIP-6
Project ExternalContribution
ExternalCarryover
TriMetContribution
TriMet Carryover
RevenueBonds Total FY2021 Comments
Engineering & Construction DivisionPRJ_1146 Division Transit Project 44,643,841 12,168,778 56,812,619 Fed Sec 5309/Local/GARVEE BondsPRJ_3651 Portland-Milwaukie Light Rail Project 5,435,353 5,435,353 Fed Sec 5309 New StartsPRJ_3673 162nd Ave Pedestrian Access Improvements 577,180 577,180 Fed 5307 FTA FundsPRJ_4638 Red Line Extension and Reliability Improvements 4,000,000 6,398,663 10,398,663 2019 BondsPRJ_4639 Steel Bridge Transit Improvements 17,550,321 17,550,321 2019 BondsPRJ_5025 Rail Reliability 1,309,505 1,309,505PRJ_5624 Southwest Corridor 36,400,000 36,400,000 GARVEE & 2019 BondsPRJ_7201 Third Party Recovery 125,000 125,000 LocalPRJ_7215 Enhanced Transit Concepts - Other Projects 5,303,000 5,303,000 STIF FundsPRJ_7218 Enhanced Transit Concepts 905,000 905,000 GARVEE BondsPRJ_7591 Columbia Bus Base 24,410,344 24,410,344 2018 & 2019 Bonds
Total Engineering & Construction Division $60,084,374 $1,309,505 $97,833,106 $159,226,985
Total Capital Improvement Program (CIP) Requirements $83,590,824 $1,479,723 $26,802,130 $927,922 $216,903,580 $329,704,179

CIP-7
CIP - Chief Operating Officer
Expense Category FY2018 FY2019 FY2020 FY2020 FY2021
Actual Actual Budget Estimate Budget
PRJ_1139 Operator Training Equipment 639,749 639,749 123,000
PRJ_1500 Enterprise Asset Management System 500,000 500,000 3,903,150
Total Chief Operating Officer $1,139,749 $1,139,749 $4,026,150

CIP-8
CIP - Transportation
Expense Category FY2018 FY2019 FY2020 FY2020 FY2021Actual Actual Budget Estimate Budget
PRJ_4049 ATP Fleet Expansion / Replacement 1,000,355 2,425,331 3,808,829 3,808,829 3,758,111
PRJ_4095 LIFT Shop Equipment Replacement 29,675 4,500
PRJ_4671 WES ROW Maintenance Project (Track) 2,358,292
PRJ_4689 LIFT Automated Customer Information 207,533 3,186 279,898 284,514
PRJ_4707 WES Facility Stormwater Quality Compliance 1,438
PRJ_6206 Back-up OCC 157,964 2,034
PRJ_7585 WES Vehicle & Shop Equipment Replacement 312,332 178,490 62,758 380,000
Total Transportation $3,879,949 $2,794,646 $4,093,227 $4,158,135 $4,138,111

CIP-9
CIP - Safety & SecurityExpense Category FY2018 FY2019 FY2020 FY2020 FY2021
Actual Actual Budget Estimate Budget
PRJ_1112 Security Fencing 200,000
PRJ_1124 Operator Safety & Rider Awareness 208,815
PRJ_1129 Network CCTV Systems 693,544 1,096,838 963,618 498,000
PRJ_1130 Vehicle Borne CCTV Systems 1,478,493 1,742,487 419,074 994,074 2,185,468
PRJ_1136 E-Citation 79,722 182,155 95,015 95,015
PRJ_1139 Operator Training Equipment 114,424 16,599
PRJ_1149 MAX Intrusion Dectection System 21,990 1,977
PRJ_1150 Mobile Command Center-Elmonica 113,239
PRJ_1151 Security Funds for Transit Enhancement 200,700 200,700 626,000
PRJ_1154 Access Control Equipment & Mapping 158,030
PRJ_2504 Safety & Security Facility Relocation 9,145,363 498,941 7,128,562 7,128,562
PRJ_2505 Roadway Workers Protection Plan - Technology 7,594 17,761
PRJ_2506 Transit Police South Precinct Expansion 95,985 8,978
PRJ_2507 Bus Operator Protective Barriers 409,066 527,165 527,165 527,165
PRJ_4557 Environmental Capital Maintenance 6,898
PRJ_5606 Rail Pedestrian Safety Enhancements 1,886,190 463,336 1,256,710 1,089,976 1,104,267
PRJ_7563 Positive Train Control 212,375 379,584
PRJ_7589 Vehicle Intrusions 52,825 66,234 3,488
Total Safety & Security $13,583,028 $4,617,611 $9,839,601 $11,382,182 $5,507,745

CIP-10
CIP - MaintenanceExpense Category FY2018 FY2019 FY2020 FY2020 FY2021
Actual Actual Budget Estimate Budget
PRJ_3687 LRV Fleet Replacement/Expansion 302,872 18,706,273 17,534,306 25,843,737PRJ_4001 Non-Revenue Vehicle Replacement 1,363,479 713,731 655,000 1,394,971 275,000PRJ_4006 Bus Shop Equipment - Center 672,531 510,260 829,029 829,029 295,079PRJ_4058 Diesel Bus Purchases & Rebuilds 28,261,343 33,888,782 41,382,594 39,882,594 22,589,932PRJ_4059 Bus Refurbishments - Diesel to Diesel 1,500,000 6,310,000PRJ_4060 Bus Refurbishments - Diesel to Electric 3,630,863 3,722,000PRJ_4071 Hybrid Fixed Route Bus 134,700 137,096PRJ_4076 Powell Maintenance Facility 5,383,037 31,060,979 40,811,769 33,631,227 35,650,300PRJ_4518 Workstations 51,675PRJ_4547 Hoist Equipment Rebuild/Refurbish 1,362,379 5,106 500,000 500,041PRJ_4581 Operator Layover Facilities 107,430PRJ_4604 HVAC Systems -22,864 82,205 16 463,000PRJ_4605 Merlo Maint - Operations Projects 407,965PRJ_4613 Type 1 Substation Replacement 610,835PRJ_4623 Light Rail Stations P&R TC (Park & Ride) 270PRJ_4651 Washington park - Station Finishes & Landscaping 1,129,023 7,306PRJ_4652 Building Area/Components Replacement 72,936 286,709 40,167 480,000PRJ_4653 Electrical Equipment & Systems Replacement 87,036 255,360 23,743 385,000PRJ_4654 Lifting Equipment & Systems Replacement 59,788 20,232 16,920 275,000PRJ_4655 Other Building Systems & Equipment 97,899 591,872 222,383 37,779 325,000PRJ_4657 Bldg. Area & Components - Layover 125,667 3,300 150,000PRJ_4658 Safety-Hazmat Systems 40,069 30,000PRJ_4659 Site-Property Systems 375,561 379,059 100,459 529,492PRJ_4662 Elevator End of Life Replacement/Refurbishment 1,718,942 4,070,085 5,233,212 5,233,212PRJ_4663 Facility System Remodel 25,116 2,543 44PRJ_4664 Jackson Terminus Landscape Rehab 5,054PRJ_4667 Mt Scott Antenna Backup Power Supply & Building Rehab -1,989PRJ_4668 Nela Tenant Improvements 475PRJ_4669 MAX System Improvement Project 10,615PRJ_4670 Steel Bridge Electrical Rehabilitation (UPRR Project) 51,081PRJ_4671 WES ROW Maintenance Project (Track) 20,726PRJ_4672 Hollywood Transit Center Paving & Stormwater 9,018PRJ_4674 Center St Bike Shelter Replacement 562PRJ_4676 Cleveland Crew Room Renovation 1,025,046 2,082,762 4,538,123 5,573,496 1,044,748

CIP-11
CIP - MaintenanceExpense Category FY2018 FY2019 FY2020 FY2020 FY2021
Actual Actual Budget Estimate Budget
PRJ_4677 Center Admin Cooling Tower/Reserve Replacement 320,769 7,585PRJ_4678 Center Admin Money Room & Spotter Shack 34,847PRJ_4680 Gateway ATC Vehicle Access Gate Replacement 2,853PRJ_4682 Powell LIFT Relocation 7,424,144 1,059,250PRJ_4684 Blue & Red Line Stations Tactile Pavers Replacement (ADA) 262,209 1,167,665 119 792,304PRJ_4685 Bus Maintenance Window System Replacements 1,240,728PRJ_4686 MAX Platform RP Valve Retrofits 1,606 17,956 26PRJ_4687 Platform Non-Skid Vault Lids Replacement 38,060 2,538PRJ_4688 Storeroom Master Plan, Renovation and Equipment 108,090 61,261PRJ_4690 Nela HVAC Control Replacement 59,688PRJ_4691 Bus Maintenance Bath/Lunch Rooms Refurbishments 28,820 80,593PRJ_4694 RJ Exterior Lighting Improvement 11,799 37,787 166,222 167,401PRJ_4695 Powell TEI Trailer Replacement 54,956PRJ_4696 Elmonica Maint. - Restroom 21,784 26,279PRJ_4697 HVAC Elmonica East Shop Air 149,723PRJ_4698 HVAC Elmonica Shop Welding Area 112,759 2,203PRJ_4699 Building Exterior Painting 584,751 15,289PRJ_4700 Building Interior Painting 27,894 58,249PRJ_4701 Elmonica Shop Railing Repainting 26,292PRJ_4702 Gateway Garage Stairwell Enclosure 46,145 1,348PRJ_4703 Heavy Concrete Maintenance Program 30,989 241,590PRJ_4705 TriMet Ticket Office Upgrades 6,339PRJ_4706 Water Intrusion Analysis 15,572 128,755 112,222PRJ_4708 Bus Hoist Units Replacement [Merlo 29, 30] 93,268 1,300,914 1,230,448PRJ_4709 Center Vacuum Replacement 10,098PRJ_4710 Center & Merlo Bus Garage Steam Bay Lift Replacement 500,274 500,274PRJ_4801 Merlo Yard Lighting Replacement 26,436PRJ_4802 Nela LIFT Parking Lot Lighting 133,495 101PRJ_4803 West Portal Lighting 51,485 26PRJ_4804 Vintage Trolley Barn Lot Security & Lighting 21,500PRJ_4805 Facilities System Masterplan 19,963 112,121 1,975,869 494,305PRJ_5507 MOW Central Shop - Trolley Barn 16,792PRJ_5508 Bus Stop Development 1,884,334 1,884,334 1,884,000PRJ_5614 End-Of-Route Permanent Operator Restrooms 115,394 139,563 19,378 18,056PRJ_5615 Electric Vehicle Charging Infrastructure-Powell 206,856 5,700,112 5,700,112 6,609,440

CIP-12
CIP - MaintenanceExpense Category FY2018 FY2019 FY2020 FY2020 FY2021
Actual Actual Budget Estimate Budget
PRJ_5626 Electric Bus Purchases & Rebuilds 5,978,363 1,091,938 5,205,005
PRJ_5628 Electric Vehicle Charging Infrastructure-Merlo 512,842 438,077 230,000
PRJ_5629 Electric Vehicle Charging Infrastructure-Sunset 625,000
PRJ_5630 Electric Vehicle Charging Infrastructure-Other 297,553 -1,150
PRJ_6205 LRV Overhaul - Travel Only 43,930
PRJ_6402 Signal System Relay to PLC 55,681 156,600 144,656 75,000
PRJ_6403 Track Rehab Program 2,854,433 2,596,771 2,346,771 2,300,000
PRJ_6404 Arc Flash Implementation Program 43,218 100,000 100,000 352,000
PRJ_6405 185th/Willow Creek P&R Repair 7,779 22,665 1,125
PRJ_6406 Platform Water Svc Restoration - Parkrose & 102nd 82,912 17,371 21,329 176,333
PRJ_7503 Light Rail Shop Equipment Repl. 2,078,759 72,822 2,902,457 2,729,757 3,375,593
PRJ_7504 Rail Maintenance Equipment 212,708 435,813 168,087
PRJ_7508 Type 1 LRV Decommissioning 125,000
PRJ_7535 Light Rail Electrification & Signaling Systems 327,003 267,958 1,365,242 1,034,549 1,755,000
PRJ_7559 Light Rail Track and Structures 2,663,770 471,576 1,575,075 1,291,164 1,137,000
PRJ_7561 MOW Equipment Replacement 13,427 20,344 20,000 30,319
PRJ_7587 Rail MOW Equipment Acquisition 328,760 357,657
PRJ_7588 Ruby Junction Truck Shop Expansion 186,787 192,934 10,218 12,945
PRJ_7590 Track Geometry & Testing 151,295PRJ_7592 Ruby Junction Expansion 12,914 514,345 5,661,704 5,574,113 8,767,309
PRJ_7593 WES Maintenance Pit Fall Protection 31,043 58,338
Total Maintenance $58,618,398 $85,577,597 $143,296,964 $136,964,760 $132,257,412
737,536

CIP-13
CIP - Information Technology
Expense Category FY2018 FY2019 FY2020 FY2020 FY2021
Actual Actual Budget Estimate Budget
PRJ_1014 Data communication - Cable Plant 273,782 59,110 2,337
PRJ_1017 Voice Systems Replacement 60,297 50,619
PRJ_1022 Lift Data Com Upgrade 3G to 4G 185,214 343,968 343,968
PRJ_1042 Mobile Router Replacement 1,346,667
PRJ_1054 Bus Dispatch Replacement 2,517,358 259,611 259,611
PRJ_1070 Servers Replacement 1,177,015 509,352 157,500 167,555 770,000
PRJ_1091 Desktop Computing Replacement 617,068 945,924 1,637 528,582
PRJ_1094 IT Security Systems Replacement 70,000 25,634
PRJ_1095 Data Communications System Replacement 215,466 264,589 1,289,500
PRJ_1104 Inventory Management 142,789 73,932
PRJ_1107 Open Source Multi-Modal Trip Planner 523,931 397,705
PRJ_1108 FMIS / MMIS System 65,332 56,079 2,111
PRJ_1131 Communication Environment Replacement - capital 15,351 162,538 265,000
PRJ_1152 Radio & Microwave Communication Systems 11,169 79,799 759,778 706,539 444,000
PRJ_1153 ROOT 245,782 228,917 69,842 52,744
PRJ_1163 Office 2016 Upgrade 5,370
PRJ_1165 Field Operations Coordinators Event Planning 141
PRJ_1167 Alerts 82,454
PRJ_1168 Control Technology Toolset 23,357 25,089
PRJ_1169 Radio Tower Batter Back-up Replacement 63,184
PRJ_1170 Turn by Turn Navigation 281,981
PRJ_1171 Network ReDesign 2,660,822 2,731,087 550,000 540,000
PRJ_1173 Fare Enforcement Administration Process-Technology Upgrades 150,849
PRJ_1174 NextGen Transit Signal Priority 23,914 547,077 547,077 3,140,000
Total Information Technology $8,770,527 $6,252,473 $2,687,776 $2,623,579 $7,783,749

CIP-14
CIP - Public Affairs
Expense Category FY2018 FY2019 FY2020 FY2020 FY2021
Actual Actual Budget Estimate Budget
PRJ_2009 Customer Support Facilities & Equipment 25,363
PRJ_2044 Bike & Ride eFare Integration 46,085 67,265 594
PRJ_2045 MAX Station Optimization 46,765 994,055 373,800
PRJ_2046 Bus On-Street Layover Investments 59,256 6,964
PRJ_2047 Downtown Layover Facility 14,225
PRJ_2048 Garage, Layover, and TC Expansion 2,618,700 2,618,700 1,381,300
PRJ_2902 Bike to Transit Facilities 20,856 35,349 -11,000
PRJ_5012 Bike Stations 336,202 52,275
PRJ_5023 Westside Bike & Rides : Access to Jobs 1,426,253 369,242
PRJ_5024 Orenco Bike & Ride 1,215PRJ_5621 Barber-99W Corridor Safety & Access to Transit 39,505 559,454
PRJ_5622 HWY 8 Corridor Safety & Access to Transit 80,000 80,000 95,000
PRJ_5623 Powell-Division Corridor Safety & Access to Transit 1,788,883 264,120 1,684,649
PRJ_6021 Transit Tracker Project 4,865 13,699 1,056,581 1,056,581 1,163,000
Total Public Affairs $1,934,320 $591,559 $5,583,669 $5,562,504 $4,697,749

CIP-15
CIP - Finance & Administrative Services
Expense Category FY2018 FY2019 FY2020 FY2020 FY2021
Actual Actual Budget Estimate Budget
PRJ_1011 Finance Software Purchases 11,314
PRJ_1104 Inventory Management 175,522 114,842
PRJ_1156 Fare Revenue Equipment Replacement 23,535
PRJ_1160 Asset Management 274,464 140,118 185,000 185,000
PRJ_1166 TVM Refurbishment or Replacement 1,115,950 5,101,775
PRJ_1172 Low Income Fare Program Startup 61,569 7,292
PRJ_1175 Fixed Route Bus Farebox Replacement 3,034,792
PRJ_1176 Hop Fastpass 2.0 189,500 189,500 600,500
PRJ_2028 Copier Equipment 56,358
PRJ_4688 Storeroom Master Plan, Renovation and Equipment 25,000 25,000
PRJ_4705 TriMet Ticket Office Upgrades 1,360,970 1,360,970
PRJ_7544 eFare 2,089,029 2,224,265 9,478,658 5,990,395 2,505,125
Total Finance & Administrative Services $2,492,734 $2,395,210 $11,414,650 $8,981,657 $11,242,192

CIP-16
CIP - Labor Relations & Human ResourcesExpense Category FY2018 FY2019 FY2020 FY2020 FY2021
Actual Actual Budget Estimate Budget
PRJ_1006 HR/Payroll Software 47,500
Total Labor Relations & Human Resources $47,500

CIP-17
CIP - Legal ServicesFY2018 FY2019 FY2020 FY2020 FY2021
Actual Actual Budget Estimate Budget
PRJ_1147 Information Governance Initiative 233,205 629,815 1,898,267 1,717,472 824,086
Total Legal Services $233,205 $629,815 $1,898,267 $1,717,472 $824,086

CIP-18
CIP - Engineering & Construction
Expense Category FY2018 FY2019 FY2020 FY2020 FY2021
Actual Actual Budget Estimate Budget
PRJ_1146 Division Transit Project 5,481,995 7,384,915 27,165,358 27,165,358 56,812,619PRJ_3651 Portland-Milwaukie Light Rail Project 9,371,661 16,237,656 13,156,107 12,690,432 5,435,353PRJ_3673 162nd Ave Pedestrian Access Improvements 309,409 307,109 577,180PRJ_4073 Eastside MAX Projects -2,046,706PRJ_4075 Blue Line Station Rehab 5,565,664 1,802,452 268,367 226,073PRJ_4638 Red Line Extension and Reliability Improvements 950,850 2,508,599 13,932,022 13,932,022 10,398,663PRJ_4639 Steel Bridge Transit Improvements 1,275,485 1,051,252 6,638,413 7,375,912 17,550,321PRJ_5025 Rail Reliability 1,650,165 1,058,013 1,420,750 1,044,779 1,309,505PRJ_5026 Center Street Campus Master Plan 27,956PRJ_5508 Bus Stop Development 513,037 462,513PRJ_5563 Bus Stop Street Maint 132,219PRJ_5581 Willamette Shore Trolley 566,012 34,638PRJ_5588 Park & Ride Signage & Shared Use Support 2,126PRJ_5593 Neighborhood Shelter Refurb 3,800PRJ_5599 Lloyd District Transit Hub 6,226 7,182 11,563PRJ_5616 Land Aquisition 2,946PRJ_5618 Automatic Train Stop (ATS) 0PRJ_5619 ADA Requirements/Enhancements 78,669 256,079PRJ_5621 Barber-99W Corridor Safety & Access to Transit 25,268 26,307PRJ_5622 HWY 8 Corridor Safety & Access to Transit 14,307 25,053PRJ_5623 Powell-Division Corridor Safety & Access to Transit 22,188 205,325PRJ_5624 Southwest Corridor 10,661,298 15,690,442 16,950,796 22,867,904 36,400,000PRJ_5625 Hogan Operations Facility 77,783 36,269PRJ_5626 Electric Bus Purchases & Rebuilds 417,319 3,200,264PRJ_5627 Hollywood Transit Center Memorial 207,986 13,523PRJ_7201 Third Party Recovery 44,242 125,000PRJ_7215 Enhanced Transit Concepts - Other Projects 4,450,000 4,450,000 5,303,000PRJ_7218 Enhanced Transit Concepts 1,218,800 2,780,000 2,780,000 905,000PRJ_7563 Positive Train Control 3,300,070 1,309,093PRJ_7581 WES DMU Fleet 1,142,257 314,877 -3,690PRJ_7590 Track Geometry & Testing 49,174 572PRJ_7591 Columbia Bus Base 157,906 28,524,700 33,285,057 8,874,713 24,410,344PRJ_7594 Rail Reliability Vehicle Engineering 369,786 52,752 52,752
Total Engineering & Construction $39,605,541 $81,789,858 $120,489,031 $101,819,741 $159,226,985
80,000

Exhibit 1. Ridership and Service (Fixed Route)1
Fiscal Boarding Rides Percent Boarding Percent Originating Rides Percent Fixed Route Percent Fixed Route Veh Hrs Percent Fixed Route Veh Hrs PercentYear (Bus, Rail, WES) Change Rides/Capita Change (Bus, Rail, WES) Change Vehicle Hrs Change (In Bus Equivalents) Change In Bus Equiv/Capita Change75 28,360,000 11.3% 30.12 10.1% 22,690,000 10.4% 1,122,000 26.5% 1,122,000 26.5% 1.19 25.1%76 35,210,000 24.2% 36.88 22.5% 28,170,000 24.2% 1,287,000 14.7% 1,287,000 14.7% 1.35 13.1%77 38,080,000 8.2% 39.33 6.7% 30,460,000 8.1% 1,360,000 5.7% 1,360,000 5.7% 1.40 4.2%78 41,570,000 9.2% 41.03 4.3% 32,630,000 7.1% 1,432,000 5.3% 1,432,000 5.3% 1.41 0.6%79 42,250,000 1.6% 40.88 ‐0.4% 33,160,000 1.6% 1,443,000 0.8% 1,443,000 0.8% 1.40 ‐1.2%80 50,670,000 19.9% 48.12 17.7% 39,760,000 19.9% 1,544,000 7.0% 1,544,000 7.0% 1.47 5.0%81 48,090,000 ‐5.1% 45.28 ‐5.9% 37,740,000 ‐5.1% 1,560,000 1.0% 1,560,000 1.0% 1.47 0.2%82 46,930,000 ‐2.4% 43.89 ‐3.1% 36,960,000 ‐2.1% 1,615,000 3.5% 1,615,000 3.5% 1.51 2.8%83 49,360,000 5.2% 46.66 6.3% 36,520,000 ‐1.2% 1,747,000 8.2% 1,747,000 8.2% 1.65 9.3%84 49,680,000 0.6% 46.48 ‐0.4% 36,720,000 0.5% 1,723,000 ‐1.4% 1,723,000 ‐1.4% 1.61 ‐2.4%85 47,400,000 ‐4.6% 43.97 ‐5.4% 35,640,000 ‐2.9% 1,522,632 ‐11.6% 1,522,632 ‐11.6% 1.41 ‐12.4%86 45,120,000 ‐4.8% 41.49 ‐5.6% 33,720,000 ‐5.4% 1,515,504 ‐0.5% 1,515,504 ‐0.5% 1.39 ‐1.3%87 47,880,000 6.1% 43.64 5.2% 35,400,000 5.0% 1,529,136 0.9% 1,529,136 0.9% 1.39 0.0%88 46,560,000 ‐2.8% 41.58 ‐4.7% 35,520,000 0.3% 1,545,456 1.1% 1,545,456 1.1% 1.38 ‐1.0%89 48,600,000 4.4% 42.58 2.4% 37,440,000 5.4% 1,544,772 0.0% 1,709,741 10.6% 1.50 8.5%90 51,541,000 6.1% 43.57 2.3% 39,661,200 5.9% 1,570,078 1.6% 1,730,507 1.2% 1.46 ‐2.3%91 55,031,000 6.8% 45.20 3.7% 42,311,100 6.7% 1,602,204 2.0% 1,776,251 2.6% 1.46 ‐0.3%92 57,172,000 3.9% 45.83 1.4% 43,996,200 4.0% 1,643,218 2.6% 1,823,345 2.7% 1.46 0.2%93 57,198,000 0.0% 44.76 ‐2.3% 44,021,600 0.1% 1,700,126 3.5% 1,889,049 3.6% 1.48 1.2%94 59,148,000 3.4% 45.41 1.5% 45,612,000 3.6% 1,793,292 5.5% 1,985,216 5.1% 1.52 3.1%95 61,188,000 3.4% 46.04 1.4% 47,184,000 3.4% 1,837,836 2.5% 2,025,927 2.1% 1.52 0.0%96 63,912,000 4.5% 46.98 2.0% 49,248,000 4.4% 1,880,664 2.3% 2,076,897 2.5% 1.53 0.1%97 66,780,000 4.5% 48.13 2.4% 51,432,000 4.4% 1,879,068 ‐0.1% 2,074,515 ‐0.1% 1.50 ‐2.1%98 68,952,000 3.3% 48.90 1.6% 53,100,000 3.2% 1,936,044 3.0% 2,170,528 4.6% 1.54 3.0%99 76,309,200 10.7% 53.34 9.1% 59,647,200 12.3% 2,068,284 6.8% 2,573,776 18.6% 1.80 16.9%00 81,237,600 6.5% 55.96 4.9% 63,608,400 6.6% 2,152,248 4.1% 2,707,670 5.2% 1.87 3.7%01 84,946,800 4.6% 57.89 3.5% 66,484,800 4.5% 2,177,616 1.2% 2,739,140 1.2% 1.87 0.1%02 88,633,200 4.3% 59.72 3.2% 69,367,200 4.3% 2,232,132 2.5% 2,850,808 4.1% 1.92 2.9%03 88,863,600 0.3% 59.09 ‐1.1% 69,591,600 0.3% 2,241,672 0.4% 2,880,825 1.1% 1.92 ‐0.3%04 91,071,600 2.5% 59.82 1.2% 71,284,800 2.4% 2,249,172 0.3% 2,877,996 ‐0.1% 1.89 ‐1.3%05 95,826,000 5.2% 62.07 3.8% 75,014,400 5.2% 2,278,800 1.3% 3,033,191 5.4% 1.96 3.9%06 95,736,000 ‐0.1% 61.01 ‐1.7% 74,947,200 ‐0.1% 2,192,124 ‐3.8% 2,938,013 ‐3.1% 1.87 ‐4.7%07 96,918,000 1.2% 60.83 ‐0.3% 75,870,000 1.2% 2,206,416 0.7% 2,966,166 1.0% 1.86 ‐0.6%08 99,098,400 2.2% 61.38 0.9% 77,582,400 2.3% 2,231,064 1.1% 3,019,375 1.8% 1.87 0.5%09 101,466,746 2.4% 62.19 1.3% 79,437,580 2.4% 2,268,049 1.7% 3,110,749 3.0% 1.91 1.9%10 99,337,044 ‐2.1% 60.40 ‐2.9% 77,769,119 ‐2.1% 2,195,934 ‐3.2% 3,213,873 3.3% 1.95 2.5%11 100,002,660 0.7% 60.36 ‐0.1% 78,286,380 0.7% 2,038,392 ‐7.2% 3,064,379 ‐4.7% 1.85 ‐5.4%12 102,238,070 2.2% 61.11 1.2% 80,042,810 2.2% 2,032,908 ‐0.3% 3,080,025 0.5% 1.84 ‐0.5%13 99,246,930 ‐2.9% 58.60 ‐4.1% 78,205,110 ‐2.3% 2,026,056 ‐0.3% 3,066,028 ‐0.5% 1.81 ‐1.7%14 98,775,270 ‐0.5% 57.50 ‐1.9% 75,779,560 ‐3.1% 2,083,680 2.8% 3,141,247 2.5% 1.83 1.0%15 100,711,776 2.0% 57.70 0.3% 77,260,430 2.0% 2,175,552 4.4% 3,234,376 3.0% 1.85 1.3%16 100,478,770 ‐0.2% 56.47 ‐2.1% 77,179,120 ‐0.1% 2,304,516 5.9% 3,515,164 8.7% 1.98 6.6%17 97,968,810 ‐2.5% 54.07 ‐4.3% 76,493,520 ‐0.9% 2,351,724 2.0% 3,565,883 1.4% 1.97 ‐0.4%18 96,058,592 ‐1.9% 52.23 ‐3.4% 75,005,268 ‐1.9% 2,424,432 3.1% 3,672,919 3.0% 2.00 1.5%19 95,687,824 ‐0.4% 51.48 ‐1.4% 74,724,012 ‐0.4% 2,549,652 5.2% 3,825,507 4.2% 2.06 3.1%20* 96,680,580 1.0% 51.45 ‐0.1% 75,499,270 1.0% 2,615,288 2.6% 3,851,236 0.7% 2.05 ‐0.4%
1) Excludes Streetcar* Data based on Adopted Budget. General-1

Exhibit 2. Fares and Passenger Revenue (Fixed Route)Fiscal US City Avg Percent Passenger Rev 1 Percent Pass Rev/Veh Hr Percent Average Fare Percent Base Fare All‐Zone Pass Rev/Sys Cst PercentYear CPI‐W Change (Unadj. CPI) Change (Unadj. CPI) Change (Unadj. CPI) Change All Zone Monthly Pass (Unadj. CPI) Change75 52.09 11.1% $7,291,000 6.1% $6.50 ‐16.1% $0.32 ‐3.9% 39.02% ‐24.5%76 55.79 7.1% $8,191,000 12.3% $6.36 ‐2.1% $0.29 ‐9.5% 31.92% ‐18.2%77 59.01 5.8% $9,545,000 16.5% $7.02 10.3% $0.31 7.8% 30.81% ‐3.5%78 62.98 6.7% $10,315,000 8.1% $7.20 2.6% $0.32 0.9% 28.29% ‐8.2%79 68.89 9.4% $12,457,000 20.8% $8.63 19.8% $0.38 18.8% 29.44% 4.1%80 78.13 13.4% $15,538,000 24.7% $10.06 16.6% $0.39 4.0% 29.96% 1.8%81 87.17 11.6% $19,029,000 22.5% $12.20 21.2% $0.50 29.0% 32.56% 8.7%82 94.53 8.4% $18,671,000 ‐1.9% $11.56 ‐5.2% $0.51 0.2% 28.76% ‐11.7%83 98.53 4.2% $18,659,000 ‐0.1% $10.68 ‐7.6% $0.51 1.1% 26.69% ‐7.2%84 101.48 3.0% $18,011,913 ‐3.5% $10.45 ‐2.1% $0.49 ‐4.0% 24.62% ‐7.8%85 105.23 3.7% $18,088,617 0.4% $11.88 13.6% $0.51 3.5% 25.70% 4.4%86 108.00 2.6% $18,380,676 1.6% $12.13 2.1% $0.55 7.4% 27.07% 5.3%87 110.09 1.9% $19,532,670 6.3% $12.77 5.3% $0.55 1.2% $1.10 $40 28.42% 5.0%88 114.61 4.1% $21,224,604 8.7% $13.73 7.5% $0.60 8.3% $1.15 $44 28.65% 0.8%89 119.86 4.6% $21,420,339 0.9% $13.87 1.0% $0.57 ‐4.3% $1.15 $37 27.00% ‐5.7%90 125.48 4.7% $22,272,167 4.0% $14.19 2.3% $0.56 ‐1.7% $1.20 $37 26.16% ‐3.1%91 132.15 5.3% $25,591,723 14.9% $15.97 12.6% $0.61 7.7% $1.20 $39 28.62% 9.4%92 136.13 3.0% $26,281,298 2.7% $15.99 0.1% $0.60 ‐1.3% $1.20 $39 27.12% ‐5.2%93 140.26 3.0% $27,387,384 4.2% $16.11 0.7% $0.62 4.2% $1.25 $41 25.45% ‐6.2%94 143.68 2.4% $27,905,335 1.9% $15.56 ‐3.4% $0.61 ‐1.8% $1.25 $41 24.34% ‐4.4%95 147.86 2.9% $30,228,148 8.3% $16.45 5.7% $0.64 4.8% $1.30 $43 23.90% ‐1.8%96 151.83 2.7% $31,843,133 5.3% $16.93 2.9% $0.65 0.8% $1.30 $43 24.63% 3.1%97 156.09 2.8% $34,627,104 8.7% $18.43 8.8% $0.67 3.7% $1.35 $46 24.10% ‐2.2%98 158.56 1.6% $35,518,635 2.6% $18.35 ‐0.4% $0.67 ‐0.2% $1.35 $46 23.33% ‐3.2%99 161.15 1.6% $40,611,332 14.3% $19.64 7.0% $0.68 1.8% $1.40 $49 24.31% 4.2%00 166.03 3.0% $45,907,371 13.0% $21.33 8.6% $0.72 6.0% $1.45 $52 24.49% 0.7%01 171.71 3.4% $51,164,532 11.5% $23.50 10.2% $0.77 6.6% $1.50 $54 25.96% 6.0%02 174.34 1.5% $52,628,203 2.9% $23.58 0.3% $0.76 ‐1.4% $1.55 $56 25.08% ‐3.4%03 178.12 2.2% $52,093,296 ‐1.0% $23.24 ‐1.4% $0.75 ‐1.3% $1.55 $56 23.79% ‐5.2%04 181.74 2.0% $54,978,689 5.5% $24.44 5.2% $0.77 3.0% $1.60 $58 24.12% 1.4%05 187.26 3.0% $58,740,216 6.8% $25.78 5.5% $0.78 1.5% $1.70 $61 23.15% ‐4.0%06 194.73 4.0% $67,542,814 15.0% $30.81 19.5% $0.90 15.1% $1.95 $69 25.63% 10.7%07 199.551 2.5% $74,765,119 10.7% $33.89 10.0% $0.99 9.3% $2.00 $74 27.67% 8.0%08 207.387 3.9% $79,638,881 6.5% $35.70 5.3% $1.03 4.2% $2.05 $76 27.63% ‐0.1%09 209.840 1.2% $88,726,972 11.4% $39.12 9.6% $1.12 8.8% $2.30 $86 28.50% 3.1%10 212.401 1.2% $92,414,344 4.2% $42.08 7.6% $1.19 6.4% $2.30 $86 28.61% 0.4%11 217.352 2.3% $95,529,230 3.4% $46.86 11.4% $1.22 2.7% $2.35 $88 30.28% 5.8%12 224.267 3.2% $100,587,848 5.3% $49.48 5.6% $1.26 3.0% $2.40 $92 30.23% ‐0.2%13 227.845 1.6% $110,793,086 10.1% $54.68 10.5% $1.42 12.7% $2.50 $100 31.81% 5.2%14 231.238 1.5% $113,229,366 2.2% $54.34 ‐0.6% $1.49 5.5% $2.50 $100 31.79% ‐0.1%15 232.035 0.3% $115,466,638 2.0% $53.07 ‐2.3% $1.49 0.0% $2.50 $100 32.40% 1.9%16 232.677 0.3% $116,941,160 1.3% $50.74 ‐4.4% $1.52 1.4% $2.50 $100 30.01% ‐7.4%17 236.612 1.7% $115,781,791 ‐1.0% $49.23 ‐3.0% $1.51 ‐0.1% $2.50 $100 27.99% ‐6.7%18 242.143 2.3% $112,743,033 ‐2.6% $46.50 ‐5.5% $1.50 ‐0.7% $2.50 $100 24.99% ‐10.7%19 247.074 2.0% $113,619,068 0.8% $44.56 ‐4.2% $1.52 1.2% $2.50 $100 23.47% ‐6.1%20* 251.768 1.9% $108,800,000 ‐4.2% $41.60 ‐6.6% $1.44 ‐5.2% $2.50 $100 21.15% ‐9.9%
1) Does not include ATP passenger revenue.* Data based on projection and Adopted Budget General-2

Exhibit 3. Employer Taxes (Unadjusted CPI‐W)
Fiscal Employer Tax Percent Employer Tax / 0.10%2 Percent Employer Tax Percent Employer Tax Percent Self‐Employment Percent State‐In‐Lieu PercentYear Rate1 Point Diff. Change (Municipal & Private) Change Per Capita Change Tax Change Tax Change75 0.3500% 0.050% $2,573,909 5.3% $9,008,681 22.8% $9.57 21.5%76 0.4500% 0.100% $2,759,626 7.2% $12,418,315 37.8% $13.01 36.0%77 0.5000% 0.050% $3,409,760 23.6% $17,048,800 37.3% $17.61 35.4%78 0.5000% 0.000% $3,996,941 17.2% $19,984,707 17.2% $19.73 12.0%79 0.6000% 0.100% $4,546,086 13.7% $27,276,514 36.5% $26.39 33.8%80 0.6000% 0.000% $5,479,011 20.5% $32,874,065 20.5% $31.22 18.3%81 0.6000% 0.000% $5,827,542 6.4% $34,965,250 6.4% $32.92 5.5%82 0.6000% 0.000% $6,262,419 7.5% $37,574,511 7.5% $35.14 6.7% $906,00083 0.6000% 0.000% $6,297,167 0.6% $36,123,000 ‐3.9% $34.15 ‐2.8% $1,660,000 $1,000,000 10.4%84 0.6000% 0.000% $6,687,850 6.2% $38,052,838 5.3% $35.60 4.3% $2,074,264 25.0% $1,478,000 47.8%85 0.6000% 0.000% $7,364,778 10.1% $41,654,862 9.5% $38.64 8.5% $2,533,807 22.2% $1,403,573 ‐5.0%86 0.6000% 0.000% $7,789,362 5.8% $44,022,185 5.7% $40.48 4.8% $2,713,989 7.1% $1,169,561 ‐16.7%87 0.6000% 0.000% $8,179,553 5.0% $46,176,152 4.9% $42.09 4.0% $2,901,166 6.9% $1,479,073 26.5%88 0.6000% 0.000% $8,811,772 7.7% $49,542,391 7.3% $44.25 5.1% $3,328,239 14.7% $1,481,419 0.2%89 0.6125% 0.013% $9,606,641 9.0% $54,818,707 10.7% $48.02 8.5% $4,021,969 20.8% $1,556,562 5.1%90 0.6176% 0.005% $10,538,980 9.7% $60,452,960 10.3% $51.10 6.4% $4,635,782 15.3% $1,698,887 9.1%91 0.6176% 0.000% $11,504,067 9.2% $66,181,424 9.5% $54.36 6.4% $4,867,695 5.0% $1,923,287 13.2%92 0.6176% 0.000% $12,108,364 5.3% $69,780,185 5.4% $55.93 2.9% $5,001,074 2.7% $2,068,403 7.5%93 0.6176% 0.000% $13,232,123 9.3% $76,438,757 9.5% $59.82 7.0% $5,282,833 5.6% $2,226,765 7.7%94 0.6176% 0.000% $14,135,693 6.8% $81,948,251 7.2% $62.92 5.2% $5,353,787 1.3% $2,233,274 0.3%95 0.6176% 0.000% $15,487,585 9.6% $90,006,140 9.8% $67.72 7.6% $5,645,185 5.4% $2,342,733 4.9%96 0.6176% 0.000% $17,209,840 11.1% $100,477,571 11.6% $73.85 9.1% $5,810,399 2.9% $1,968,097 ‐16.0%97 0.6176% 0.000% $19,444,683 13.0% $113,734,961 13.2% $81.97 11.0% $6,355,404 9.4% $1,390,597 ‐29.3%98 0.6176% 0.000% $20,979,186 7.9% $122,866,495 8.0% $87.14 6.3% $6,700,960 5.4% $1,407,539 1.2%99 0.6176% 0.000% $22,141,171 5.5% $130,309,622 6.1% $91.08 4.5% $6,434,248 ‐4.0% $1,470,637 4.5%00 0.6176% 0.000% $23,315,527 5.3% $137,859,468 5.8% $94.97 4.3% $6,137,228 ‐4.6% $1,513,914 2.9%01 0.6195% 0.002% $25,546,971 9.6% $151,015,559 9.5% $102.92 8.4% $7,247,929 18.1% $1,548,939 2.3%02 0.6218% 0.002% $24,753,592 ‐3.1% $146,531,906 ‐3.0% $98.73 ‐4.1% $7,385,930 1.9% $1,924,266 24.2%03 0.6218% 0.000% $24,562,627 ‐0.8% $145,478,005 ‐0.7% $96.73 ‐2.0% $7,252,407 ‐1.8% $1,869,316 ‐2.9%04 0.6218% 0.000% $24,713,167 0.6% $146,124,768 0.4% $95.98 ‐0.8% $7,541,705 4.0% $1,855,350 ‐0.7%05 0.6243% 0.002% $26,254,190 6.2% $155,987,324 6.7% $101.03 5.3% $7,917,586 5.0% $1,970,868 6.2%06 0.6343% 0.010% $28,893,633 10.1% $173,786,460 11.4% $110.75 9.6% $9,485,857 19.8% $1,990,090 1.0%07 0.6443% 0.010% $30,892,774 6.9% $187,531,204 7.9% $117.69 6.3% $11,510,937 21.3% $2,259,404 13.5%08 0.6543% 0.010% $32,286,213 4.5% $200,048,477 6.7% $123.91 5.3% $11,200,216 ‐2.7% $2,254,669 ‐0.2%09 0.6643% 0.010% $31,690,073 ‐1.8% $200,176,901 0.1% $122.68 ‐1.0% $10,340,256 ‐7.7% $2,482,251 10.1%10 0.6743% 0.010% $30,479,770 ‐3.8% $195,006,681 ‐2.6% $118.57 ‐3.4% $10,518,411 1.7% $2,676,196 7.8%11 0.6843% 0.010% $31,905,358 4.7% $207,882,398 6.6% $125.47 5.8% $10,445,965 ‐0.7% $2,659,117 ‐0.6%12 0.6943% 0.010% $34,300,301 7.5% $226,832,349 9.1% $135.59 8.1% $11,314,638 8.3% $2,871,517 8.0%13 0.7048% 0.010% $35,526,091 3.6% $237,979,473 4.9% $140.52 3.6% $12,400,424 9.6% $2,706,462 ‐5.7%14 0.7162% 0.011% $37,400,804 5.3% $254,805,010 7.1% $148.34 5.6% $13,063,291 5.3% $2,694,896 ‐0.4%15 0.7237% 0.007% $39,637,167 6.0% $273,078,978 7.2% $156.46 5.5% $13,779,166 5.5% $3,202,371 18.8%16 0.7262% 0.002% $43,009,967 8.5% $297,006,493 8.8% $166.93 6.7% $15,336,186 11.3% $1,974,632 ‐38.3%17 0.7362% 0.010% $45,389,749 5.5% $317,874,612 7.0% $175.44 5.1% $16,284,718 6.2% $1,971,323 ‐0.2%18 0.7462% 0.010% $47,839,709 5.4% $340,352,472 7.1% $185.07 5.5% $16,627,433 2.1% $2,063,286 4.7%19 0.7562% 0.010% $49,026,929 2.5% $354,486,790 4.2% $190.73 3.1% $16,254,849 ‐2.2% $2,009,113 ‐2.6%20* 0.7662% 0.010% $53,399,243 8.9% $389,650,000 9.9% $207.37 8.7% $19,495,000 19.9% $2,265,000 12.7%
1) Based on Fiscal Year (July‐June)2) Includes Employer and Self‐Employment Tax, effective FY00 based on cash receipts.* Data based on Adopted Budget.
General-3

Exhibit 4. Expenses (Fixed Route)
Fiscal Operations Costs 1 Percent Ops Costs/Veh Hr Percent Bus Ops Costs/Veh Hr Percent Rail Ops Costs/Veh Hr Percent WES Ops Costs/Veh Hr Percent Year (Adj. CPI 20) Change (Unadj. CPI) Change (Unadj. CPI) Change (Unadj. CPI) Change (Unadj. CPI) Change75 $67,407,044 25.6% $12.68 10.3%76 $95,782,824 42.1% $16.83 32.7%77 $109,835,722 14.7% $19.31 14.8%78 $121,553,034 10.7% $21.67 12.2%79 $127,580,306 5.0% $24.68 13.9%80 $135,254,326 6.0% $27.74 12.4%81 $142,454,121 5.3% $32.26 16.3%82 $142,735,560 0.2% $33.86 5.0%83 $144,289,856 1.1% $32.98 ‐2.6%84 $148,013,226 2.6% $35.33 7.1%85 $140,113,963 ‐5.3% $39.24 11.1%86 $133,238,918 ‐4.9% $38.48 ‐1.9%87 $130,943,645 ‐1.7% $38.21 ‐0.7% $36.41 $100.6988 $134,582,809 2.8% $40.45 5.9% $38.30 5.2% $98.17 ‐2.5%89 $136,554,867 1.5% $42.94 6.2% $40.59 6.0% $105.53 7.5%90 $136,739,207 0.1% $44.29 3.1% $41.40 2.0% $120.72 14.4%91 $137,136,179 0.3% $45.84 3.5% $42.61 2.9% $133.39 10.5%92 $142,418,075 3.9% $47.82 4.3% $44.27 3.9% $143.79 7.8%93 $150,363,079 5.6% $50.27 5.1% $46.45 4.9% $156.58 8.9%94 $155,986,573 3.7% $50.65 0.7% $46.66 0.5% $167.78 7.2%95 $165,840,978 6.3% $54.07 6.8% $50.13 7.4% $172.55 2.8%96 $167,093,054 0.8% $54.67 1.1% $50.13 0.0% $193.43 12.1%97 $172,702,839 3.4% $58.14 6.3% $53.44 6.6% $201.38 4.1%98 $177,576,003 2.8% $58.94 1.4% $53.09 ‐0.6% $222.89 10.7%99 $216,701,650 22.0% $68.43 16.1% $55.76 5.0% $256.91 15.3%00 $236,309,996 9.0% $73.88 8.0% $60.80 9.0% $257.60 0.3%01 $239,896,999 1.5% $76.66 3.8% $62.83 3.3% $271.04 5.2%02 $245,501,430 2.3% $77.71 1.4% $63.63 1.3% $234.75 ‐13.4%03 $253,368,977 3.2% $81.59 5.0% $67.42 5.9% $232.47 ‐1.0%04 $257,927,131 1.8% $84.47 3.5% $70.07 3.9% $230.93 ‐0.7%05 $281,425,949 9.1% $93.73 11.0% $77.66 10.8% $226.96 ‐1.7%06 $279,970,595 ‐0.5% $100.79 7.5% $84.47 8.8% $234.35 3.3%07 $279,969,932 0.0% $102.62 1.8% $86.35 2.2% $236.33 0.8%08 $286,697,722 2.4% $108.01 5.2% $90.25 4.5% $250.97 6.2%09 $286,522,830 ‐0.1% $107.44 ‐0.5% $88.20 ‐2.3% $248.15 ‐1.1%10 $289,903,540 1.2% $113.64 5.8% $92.20 4.5% $245.91 ‐0.9% $1,091.4511 $271,627,798 ‐6.3% $117.38 3.3% $94.41 2.4% $251.36 2.2% $1,068.95 ‐2.1%12 $276,398,946 1.8% $123.58 5.3% $98.27 4.1% $269.25 7.1% $1,113.20 4.1%13 $284,297,746 2.9% $129.57 4.9% $104.35 6.2% $273.23 1.5% $1,220.24 9.6%14 $275,233,503 ‐3.2% $123.79 ‐4.5% $97.10 ‐7.0% $280.80 2.8% $1,149.65 ‐5.8%15 $281,205,463 2.2% $121.55 ‐1.8% $93.27 ‐3.9% $297.83 6.1% $1,179.17 2.6%16 $303,004,080 7.8% $123.99 2.0% $92.79 ‐0.5% $303.19 1.8% $1,253.91 6.3%17 $322,797,331 6.5% $131.62 6.2% $97.47 5.0% $332.39 9.6% $1,391.89 11.0%18 $351,577,916 6.7% $139.47 6.0% $102.79 5.5% $358.42 7.8% $1,377.01 ‐1.1%19 $373,956,653 6.4% $143.93 3.2% $104.81 2.0% $388.20 8.3% $1,366.43 ‐0.8%20* $388,331,180 3.8% $148.49 3.2% $106.54 1.7% $429.99 10.8% $1,446.25 5.8%
1) Does not include General Admin, DMAP, ATP, Streetcar cost, Intergovernmental Transfers, and Medical Plans‐Retired/Disabled.* Data based on Adopted Budget. General-4

Exhibit 5. Fixed Route Financial Indicators
FiscalOperation
Costs1/Boarding RidePercent Change
Operation Costs/Boarding Ride
Percent Change
System Costs2/Boarding ride
Percent Change
System Costs/Boarding Ride
Year (Adj. CPI 20) (Adj. CPI 20)75 $0.50 25.4% $2.38 12.9% $0.66 26.2% $3.1276 $0.62 22.6% $2.72 14.5% $0.73 10.6% $3.2277 $0.69 12.1% $2.88 6.0% $0.81 11.6% $3.4078 $0.75 8.2% $2.92 1.4% $0.88 7.8% $3.4479 $0.84 13.0% $3.02 3.3% $1.00 14.2% $3.5980 $0.85 0.3% $2.67 ‐11.6% $1.02 2.2% $3.2381 $1.05 23.8% $2.96 11.0% $1.22 18.8% $3.4482 $1.17 11.3% $3.04 2.7% $1.38 13.8% $3.6183 $1.17 0.2% $2.92 ‐3.9% $1.42 2.4% $3.5584 $1.23 5.0% $2.98 1.9% $1.47 4.0% $3.5885 $1.26 2.9% $2.96 ‐0.8% $1.48 0.8% $3.4886 $1.29 2.5% $2.95 ‐0.1% $1.50 1.3% $3.4487 $1.22 ‐5.6% $2.73 ‐7.4% $1.44 ‐4.6% $3.2288 $1.34 10.0% $2.89 5.7% $1.59 10.9% $3.4389 $1.36 1.7% $2.81 ‐2.8% $1.63 2.6% $3.3690 $1.35 ‐1.2% $2.65 ‐5.6% $1.65 1.2% $3.2591 $1.33 ‐1.1% $2.49 ‐6.1% $1.62 ‐1.6% $3.0392 $1.37 3.0% $2.49 0.0% $1.69 4.3% $3.0793 $1.49 8.7% $2.63 5.5% $1.88 11.0% $3.3194 $1.54 2.8% $2.64 0.3% $1.94 3.0% $3.3395 $1.62 5.8% $2.71 2.8% $2.07 6.6% $3.4596 $1.61 ‐0.9% $2.61 ‐3.5% $2.02 ‐2.1% $3.2997 $1.64 1.7% $2.59 ‐1.1% $2.15 6.4% $3.4098 $1.65 1.2% $2.58 ‐0.4% $2.21 2.6% $3.4499 $1.85 12.1% $2.84 10.3% $2.19 ‐0.9% $3.3500 $1.96 5.5% $2.91 2.4% $2.31 5.4% $3.4301 $1.97 0.4% $2.82 ‐2.9% $2.32 0.5% $3.3302 $1.96 ‐0.4% $2.77 ‐1.9% $2.37 2.0% $3.3503 $2.06 5.2% $2.85 2.9% $2.46 4.1% $3.4104 $2.09 1.3% $2.83 ‐0.7% $2.50 1.6% $3.4005 $2.23 6.8% $2.94 3.7% $2.65 5.8% $3.4906 $2.31 3.5% $2.92 ‐0.4% $2.75 3.9% $3.4907 $2.34 1.2% $2.89 ‐1.2% $2.79 1.3% $3.4508 $2.43 4.1% $2.89 0.1% $2.91 4.3% $3.4609 $2.40 ‐1.2% $2.82 ‐2.4% $3.07 5.5% $3.6110 $2.51 4.6% $2.92 3.3% $3.25 6.0% $3.7811 $2.39 ‐4.8% $2.72 ‐6.9% $3.15 ‐3.0% $3.5812 $2.46 2.7% $2.70 ‐0.5% $3.25 3.2% $3.5813 $2.65 7.6% $2.86 6.0% $3.51 7.8% $3.8014 $2.61 ‐1.3% $2.79 ‐2.7% $3.61 2.8% $3.8515 $2.63 0.6% $2.79 0.2% $3.54 ‐1.9% $3.7616 $2.84 8.3% $3.02 8.0% $3.88 9.6% $4.1117 $3.16 11.1% $3.29 9.3% $4.22 8.9% $4.4018 $3.52 11.4% $3.66 8.9% $4.70 11.2% $4.8819 $3.84 9.0% $3.91 6.8% $5.06 7.7% $5.1620* $4.02 4.7% $4.02 2.8% $5.32 5.1% $5.32
1) Does not includes G&A, ATP, DMAP, Streetcar, Intergovernmental Transfers costs and Medical Plans‐Retired/Disabled2) Does not includes ATP, DMAP, Streetcar, and Intergorvernmental Transfers costs.* Data based on Adopted Budget.
General-5

Exhibit 6. LIFT Revenue, Ridership, and Service*Fiscal LIFT and Cab Percent LIFT and Cab Percent LIFT and Cab Percent LIFT and Cab Operating Percent LIFT and Cab PercentYear Vehicle Hours Change Ridership Change Operating Costs Change Costs per Ride Change Revenue** Change878889909192 150,474 400,963 $5,639,847 $14.07 $78,41593 180,569 20.0% 415,814 3.7% $6,391,020 13.3% $15.37 9.3% $81,751 4.3%94 210,003 16.3% 462,053 11.1% $7,322,590 14.6% $15.85 3.1% $83,526 2.2%95 236,986 12.8% 501,894 8.6% $8,486,412 15.9% $16.91 6.7% $125,322 50.0%96 274,201 15.7% 553,874 10.4% $8,778,547 3.4% $15.85 ‐6.3% $141,085 12.6%97 308,798 12.6% 613,755 10.8% $9,655,316 10.0% $15.73 ‐0.7% $215,607 52.8%98 335,754 8.7% 649,996 5.9% $11,050,808 14.5% $17.00 8.1% $272,025 26.2%99 366,902 9.3% 680,374 4.7% $11,913,345 7.8% $17.51 3.0% $380,257 39.8%00 397,216 8.3% 735,792 8.1% $15,573,346 30.7% $21.17 20.9% $447,156 17.6%01 422,812 6.4% 781,956 6.3% $14,979,168 ‐3.8% $19.16 ‐9.5% $541,761 21.2%02 456,389 7.9% 845,496 8.1% $16,481,644 10.0% $19.49 1.8% $564,327 4.2%03 485,659 6.4% 918,948 8.7% $17,797,497 8.0% $19.37 ‐0.6% $653,846 15.9%04 513,625 5.8% 958,248 4.3% $21,395,262 20.2% $22.33 15.3% $686,825 5.0%05 554,507 8.0% 1,026,156 7.1% $24,050,336 12.4% $23.44 5.0% $747,073 8.8%06 578,184 4.3% 1,050,144 2.3% $26,236,840 9.1% $24.98 6.6% $971,326 30.0%07 601,674 4.1% 1,084,056 3.2% $28,257,625 7.7% $26.07 4.3% $1,090,835 12.3%08 623,150 3.6% 1,122,036 3.5% $30,890,457 9.3% $27.53 5.6% $1,171,184 7.4%09 619,204 ‐0.6% 1,088,446 ‐3.0% $31,020,152 0.4% $28.50 3.5% $1,289,801 10.1%10 593,030 ‐4.2% 1,072,704 ‐1.4% $30,700,651 ‐1.0% $28.62 0.4% $1,314,673 1.9%11 582,804 ‐1.7% 1,063,942 ‐0.8% $30,887,658 0.6% $29.03 1.4% $1,360,396 3.5%12 577,709 ‐0.9% 1,062,874 ‐0.1% $31,744,160 2.8% $29.87 2.9% $1,652,790 21.5%13 567,202 ‐1.8% 1,037,700 ‐2.4% $32,094,099 1.1% $30.93 3.6% $1,707,337 3.3%14 572,866 1.0% 1,036,824 ‐0.1% $33,173,764 3.4% $32.00 3.5% $1,365,613 ‐20.0%15 580,777 1.4% 1,042,272 0.5% $33,861,160 2.1% $32.49 1.5% $1,220,757 ‐10.6%16 612,565 5.5% 1,064,568 2.1% $35,271,600 4.2% $33.13 2.0% $1,127,992 ‐7.6%17 605,422 ‐1.2% 1,017,647 ‐4.4% $36,561,928 3.7% $35.93 8.4% $1,112,992 ‐1.3%18 593,280 ‐2.0% 1,009,080 ‐0.8% $37,919,472 3.7% $37.58 4.6% $1,093,141 ‐1.8%19 599,213 1.0% 962,220 ‐4.6% $37,717,269 ‐0.5% $39.20 4.3% $9,336,664 754.1%
20*** 605,205 1.0% 981,464 2.0% $40,300,623 6.8% $41.06 4.8% $9,349,664 0.1%
* Service provided prior to 1992 are not included.** Effective FY19 LIFT and Cab Revenue including contract revenue*** Data is based on Adopted Budget.
General-6

Exhibit 7. Local Economic TrendsFiscal Tri‐County Percent Tri‐County Percent Tri‐County Avg Pay Wage Tri‐County Property Value Percent Private Tri‐County PercentYear Population Change Employment1 Change (Earn/Employee) Inflation Real Market Value (RMV) Change Payroll1 Change75 941,700 1.1% 328,245 ‐1.5% $10,256 7.1% $10,205,290,497 11.0% $3,366,613,990 5.5%76 954,800 1.4% 341,909 4.2% $11,111 8.3% $11,419,557,678 11.9% $3,798,781,214 12.8%77 968,200 1.4% 362,973 6.2% $11,859 6.7% $12,612,056,645 10.4% $4,304,633,028 13.3%78 1,013,050 4.6% 398,591 9.8% $12,791 7.9% $14,027,212,577 11.2% $5,098,305,257 18.4%79 1,033,550 2.0% 422,956 6.1% $13,959 9.1% $15,897,003,000 13.3% $5,904,152,731 15.8%80 1,053,100 1.9% 425,451 0.6% $15,302 9.6% $18,620,927,000 17.1% $6,510,203,094 10.3%81 1,062,000 0.8% 415,451 ‐2.4% $16,488 7.8% $23,637,223,000 26.9% $6,850,078,234 5.2%82 1,069,300 0.7% 392,771 ‐5.5% $17,413 5.6% $26,136,442,000 10.6% $6,839,449,188 ‐0.2%83 1,057,900 ‐1.1% 390,499 ‐0.6% $18,001 3.4% $28,624,740,000 9.5% $7,029,388,727 2.8%84 1,068,800 1.0% 411,798 5.5% $18,687 3.8% $30,559,105,000 6.8% $7,695,130,126 9.5%85 1,078,000 0.9% 422,852 2.7% $19,193 2.7% $32,953,204,000 7.8% $8,115,896,617 5.5%86 1,087,500 0.9% 434,908 2.9% $19,876 3.6% $34,835,587,000 5.7% $8,644,381,696 6.5%87 1,097,100 0.9% 450,699 3.6% $20,541 3.3% $36,354,973,000 4.4% $9,258,031,450 7.1%88 1,119,700 2.1% 479,317 6.3% $21,469 4.5% $36,811,010,000 1.3% $10,290,273,686 11.1%89 1,141,500 1.9% 506,533 5.7% $22,301 3.9% $37,535,437,000 2.0% $11,296,147,453 9.8%90 1,183,000 3.6% 524,279 3.5% $23,642 6.0% $38,864,890,000 3.5% $12,394,797,852 9.7%91 1,217,560 2.9% 523,498 ‐0.1% $24,815 5.0% $42,338,116,000 8.9% $12,990,643,800 4.8%92 1,247,610 2.5% 528,286 0.9% $26,310 6.0% $50,366,176,000 19.0% $13,899,105,282 7.0%93 1,277,820 2.4% 547,625 3.7% $26,968 2.5% $54,907,907,000 9.0% $14,768,176,686 6.3%94 1,302,460 1.9% 574,868 5.0% $27,809 3.1% $59,984,969,000 9.2% $15,986,609,610 8.3%95 1,329,090 2.0% 605,542 5.3% $29,200 5.0% $67,435,101,000 12.4% $17,681,895,017 10.6%96 1,360,530 2.4% 625,313 3.3% $30,965 6.0% $76,091,671,000 12.8% $19,362,980,399 9.5%97 1,387,590 2.0% 658,099 5.2% $32,752 5.8% $86,216,900,000 13.3% $21,553,852,346 11.3%98 1,409,930 1.6% 668,091 1.5% $34,140 4.2% $96,630,942,000 12.1% $22,808,631,870 5.8%99 1,430,650 1.5% 675,109 1.1% $35,939 5.3% $106,703,310,000 10.4% $24,262,566,598 6.4%00 1,451,650 1.5% 691,551 2.4% $39,169 9.0% $115,941,283,000 8.7% $27,087,525,558 11.6%01 1,467,300 1.1% 685,125 ‐0.9% $39,217 0.1% $124,350,639,000 7.3% $26,868,806,752 ‐0.8%02 1,484,150 1.1% 675,208 ‐1.4% $38,856 ‐0.9% $134,835,692,000 8.4% $26,236,081,103 ‐2.4%03 1,503,900 1.3% 662,175 ‐1.9% $39,216 0.9% $140,814,040,000 4.4% $25,967,644,770 ‐1.0%04 1,522,400 1.2% 657,585 ‐0.7% $40,887 4.3% $151,236,678,000 7.4% $26,886,371,724 3.5%05 1,543,910 1.4% 678,527 3.2% $42,023 2.8% $160,154,351,000 5.9% $28,514,060,498 6.1%06 1,569,170 1.6% 704,116 3.8% $43,762 4.1% $171,753,908,000 7.2% $30,813,829,928 8.1%07 1,593,370 1.5% 722,409 2.6% $45,092 3.0% $199,710,358,000 16.3% $32,574,995,021 5.7%08 1,614,465 1.3% 729,416 1.0% $46,938 4.1% $228,449,246,000 14.4% $34,237,622,643 5.1%09 1,631,665 1.1% 696,879 ‐4.5% $46,961 0.0% $229,798,303,000 0.6% $32,725,984,271 ‐4.4%10 1,644,635 0.8% 661,375 ‐5.1% $47,760 1.7% $228,377,751,000 ‐0.6% $31,586,944,751 ‐3.5%11 1,656,775 0.7% 675,633 2.2% $49,968 4.6% $215,824,787,000 ‐5.5% $33,760,095,046 6.9%12 1,672,970 1.0% 695,275 2.9% $52,042 4.1% $203,907,401,000 ‐5.5% $36,183,167,936 7.2%13 1,693,600 1.2% 715,282 2.9% $52,111 0.1% $198,870,622,000 ‐2.5% $37,274,222,331 3.0%14 1,717,765 1.4% 738,449 3.2% $53,824 3.3% $208,548,342,000 4.9% $39,746,082,480 6.6%15 1,745,385 1.6% 761,568 3.1% $55,690 3.5% $230,675,518,000 10.6% $42,411,757,952 6.7%16 1,779,245 1.9% 786,364 3.3% $58,077 4.3% $253,349,513,000 9.8% $45,669,997,254 7.7%17 1,811,860 1.8% 805,443 2.4% $59,489 2.4% $288,930,656,000 14.0% $47,915,109,330 4.9%18 1,839,005 1.5% 825,655 2.5% $61,523 3.4% $323,999,604,000 12.1% $50,796,611,148 6.0%19 1,858,560 1.1% 841,773 2.0% $63,669 3.5% $353,470,370,000 9.1% $53,594,868,242 5.5%20* 1,879,004 1.1% 858,608 2.0% $65,542 2.9% $388,817,407,000 10.0% $56,274,611,654 5.0%
1) Excludes: social services, membership of organization, federal and local governments.* Data based on projection.
General-7

Exhibit 8. Debt and Capital Investment
Fiscal Debt Service Percent Debt Service Percent Capital and PercentYear (Senior Lien)/Capita Change (Senior Lien) Change Operating Projects1 Change787980818283 $3.23 $3,416,00084 $3.49 8.0% $3,728,000 9.1%85 $3.58 2.6% $3,859,000 3.5%86 $2.03 ‐43.3% $2,206,000 ‐42.8%87 $2.53 24.7% $2,775,000 25.8%88 $2.25 ‐11.0% $2,522,000 ‐9.1%89 $2.20 ‐2.1% $2,517,000 ‐0.2%90 $2.09 ‐5.2% $2,473,000 ‐1.7%91 $2.14 2.5% $2,610,000 5.5% $18,801,93992 $2.07 ‐3.3% $2,586,000 ‐0.9% $18,390,434 ‐2.2%93 $1.90 ‐8.5% $2,424,000 ‐6.3% $23,499,396 27.8%94 $2.40 26.6% $3,127,000 29.0% $27,258,006 16.0%95 $2.32 ‐3.4% $3,084,000 ‐1.4% $44,485,453 63.2%96 $3.33 43.6% $4,534,000 47.0% $34,362,130 ‐22.8%97 $3.77 13.2% $5,235,000 15.5% $16,660,115 ‐51.5%98 $3.65 ‐3.2% $5,150,000 ‐1.6% $45,786,810 174.8%99 $5.91 61.7% $8,450,000 64.1% $53,210,726 16.2%00 $4.72 ‐20.1% $6,850,000 ‐18.9% $21,380,647 ‐59.8%01 $6.42 36.0% $9,417,000 37.5% $37,185,338 73.9%02 $7.06 10.0% $10,479,000 11.3% $20,221,624 ‐45.6%03 $6.22 ‐11.9% $9,357,000 ‐10.7% $33,139,524 63.9%04 $6.82 9.7% $10,389,000 11.0% $14,912,151 ‐55.0%05 $9.86 44.5% $15,228,859 46.6% $6,305,572 ‐57.7%06 $8.45 ‐14.4% $13,254,132 ‐13.0% $25,516,713 304.7%07 $8.47 0.2% $13,489,360 1.8% $9,917,641 ‐61.1%08 $8.01 ‐5.3% $12,938,500 ‐4.1% $14,294,793 44.1%09 $8.00 ‐0.1% $13,060,226 0.9% $35,353,851 147.3%10 $9.10 13.7% $14,969,558 14.6% $37,178,882 5.2%11 $10.21 12.2% $16,917,055 13.0% $37,179,659 0.0%12 $9.57 ‐6.3% $16,004,207 ‐5.4% $30,950,289 ‐16.8%13 $21.12 120.8% $35,768,181 123.5% $58,702,367 89.7%14 $20.99 ‐0.6% $36,063,555 0.8% $64,571,529 10.0%15 $12.83 ‐38.9% $22,390,805 ‐37.9% $73,100,563 13.2%16 $12.98 1.2% $23,093,366 3.1% $100,152,053 37.0%17 $13.74 5.8% $24,886,307 7.8% $77,186,702 ‐22.9%18 $13.75 0.1% $25,293,681 1.6% $103,702,929 34.4%19 $16.80 22.1% $31,224,130 23.4% $86,619,333 ‐16.5%20* $20.01 19.1% $37,601,657 20.4% $79,624,384 ‐8.1%
1) Excludes Rail, and Construction Projects.* Data based on Adopted Budget.
General-8

Local Economic Trends
0.0
0.4
0.8
1.2
1.6
2.0
FY78
FY81
FY84
FY87
FY90
FY93
FY96
FY99
FY02
FY05
FY08
FY11
FY14
FY17
FY20
Millions
Tri‐County Population and Employment
Population Employment
$0
$10
$20
$30
$40
$50
$60
FY78
FY81
FY84
FY87
FY90
FY93
FY96
FY99
FY02
FY05
FY08
FY11
FY14
FY17
FY20
Billion
s
Tri‐County Private Payrolls
$5,000
$15,000
$25,000
$35,000
$45,000
$55,000
$65,000
$75,000
FY78
FY81
FY84
FY87
FY90
FY93
FY96
FY99
FY02
FY05
FY08
FY11
FY14
FY17
FY20
Tri‐County Average Yearly Earnings
General-9

Ridership
0
30
60
90
120
FY78
FY81
FY84
FY87
FY90
FY93
FY96
FY99
FY02
FY05
FY08
FY11
FY14
FY17
FY20
Millions
Fixed Route Boarding Rides
0.0
0.4
0.8
1.2
1.6
FY92
FY94
FY96
FY98
FY00
FY02
FY04
FY06
FY08
FY10
FY12
FY14
FY16
FY18
FY20
Millions
LIFT and Cab Boarding Rides
0
30
60
90
120
FY78
FY81
FY84
FY87
FY90
FY93
FY96
FY99
FY02
FY05
FY08
FY11
FY14
FY17
FY20
Fixed Route Boarding Rides per Capita
General-10

Service
0.0
1.0
2.0
3.0
4.0
5.0
FY78
FY81
FY84
FY87
FY90
FY93
FY96
FY99
FY02
FY05
FY08
FY11
FY14
FY17
FY20
Millions
Total Fixed Route Service Hours in Bus Equivalents and Total Fixed Route Service Hours
Fixed Route Service Hrs in Bus Equivalent Fixed Route Service Hours
50,000
200,000
350,000
500,000
650,000
800,000
FY92
FY93
FY94
FY95
FY96
FY97
FY98
FY99
FY00
FY01
FY02
FY03
FY04
FY05
FY06
FY07
FY08
FY09
FY10
FY11
FY12
FY13
FY14
FY15
FY16
FY17
FY18
FY19
FY20
LIFT and Cab Service Vehicle Hours
General-11

Expense
7.8%
3.8%
‐1.7%
2.8%
1.5% 0.1% 0.3% 3.9% 5.6% 3.7% 6.3% 0.8% 3.4% 2.8%22
.0%
9.0% 1.5% 2.3% 3.2% 1.8% 9.1%
‐0.5%
0.0% 2.4%
‐0.1%
1.2%
‐6.3%
1.8% 2.9%
‐3.2%
6.5%
2.2%
6.4%
6.7%
$0
$50
$100
$150
$200
$250
$300
$350
$400
$450
FY87 FY90 FY93 FY96 FY99 FY02 FY05 FY08 FY11 FY14 FY17 FY20
Millions
Fixed Route Operations Cost
6.8%
14.6%
15.9%
3.4% 10.0%
14.5%
7.8%
30.7%
‐3.8%
10.0%
8.0%20
.2%
12.4%
9.1% 7.
7% 9.3% 0.4%
‐1.0%
0.6% 2.8%
3.7%
1.1% 3.4% 2.1% 4.2% 3.
7%
‐0.5%
$0
$5
$10
$15
$20
$25
$30
$35
$40
$45
FY94 FY96 FY98 FY00 FY02 FY04 FY06 FY08 FY10 FY12 FY14 FY16 FY18 FY20
Millions
LIFT and Cab Operations Costs
0.6% 8.
3%
4.7%
‐5.6%
10.0%
1.7%
‐1.2%
‐1.1%
3.0% 8.7% 2.8% 5.8%
‐0.9%
1.7%
1.2% 12
.1%
5.5%
0.4% ‐0.4%
5.2% 1.3% 6.8% 3.5% 1.2% 4.1%
‐1.2%
4.6%
‐4.8%
2.7% 7.
6%‐1.3%
11.4% 9.0%
11.1%
$0.0
$0.5
$1.0
$1.5
$2.0
$2.5
$3.0
$3.5
$4.0
$4.5
FY87 FY90 FY93 FY96 FY99 FY02 FY05 FY08 FY11 FY14 FY17 FY20
Fixed Route Operations Cost per Ride
2.9%
4.8%
3.1% 6.7%
‐6.3%
‐0.7%
8.1% 3.0%
20.9%
‐9.5%
1.8% ‐0.6% 15.3%
5.0% 6.6% 4.3% 5.6% 3.5% 0.4% 1.4%
8.4%
3.6% 3.5% 1.5% 2.0%
4.6% 4.3%
$0
$5
$10
$15
$20
$25
$30
$35
$40
$45
FY94 FY96 FY98 FY00 FY02 FY04 FY06 FY08 FY10 FY12 FY14 FY16 FY18 FY20
LIFT and Cab Operations Costs per Ride
General-12

Revenue
$0
$20
$40
$60
$80
$100
$120
$140
FY87 FY90 FY93 FY96 FY99 FY02 FY05 FY08 FY11 FY14 FY17 FY20
Millions
Fixed Route Passenger Revenue
$0
$50
$100
$150
$200
$250
$300
$350
$400
$450
FY87 FY90 FY93 FY96 FY99 FY02 FY05 FY08 FY11 FY14 FY17 FY20
Millions
Total Payroll Tax Revenues(Includes Payroll, Self‐Employment, and State‐In‐Lieu)
$0
$50
$100
$150
$200
$250
FY87 FY90 FY93 FY96 FY99 FY02 FY05 FY08 FY11 FY14 FY17 FY20
Employer Tax per Capita
0.0%
10.0%
20.0%
30.0%
40.0%
FY87 FY90 FY93 FY96 FY99 FY02 FY05 FY08 FY11 FY14 FY17 FY20
Fixed Route Fare Recovery Ratio
General-13
General-14
[This Page Left Intentionally Blank]

Agency Personnel Profile
Position Title Grade Total FTE Base Salary Expense Min Max
Accountant 10 3.00 $172,769 $51,431 $77,145
Accountant 11 1.00 $56,219 $56,173 $84,261
Accountant 12 1.00 $80,317 $61,321 $91,980
Accountant 13 2.00 $171,292 $66,884 $100,327
Administrator 11 5.00 $344,330 $56,173 $84,261
Administrator 12 3.00 $225,639 $61,321 $91,980
Administrator 13 6.00 $487,803 $66,884 $100,327
Administrator 14 2.00 $190,175 $72,900 $109,351
Administrator 15 1.00 $91,033 $79,406 $119,110
Agency Architect 16 1.00 $122,526 $86,398 $129,597
Analyst 11 7.00 $454,057 $56,173 $84,261
Analyst 12 6.00 $448,567 $61,321 $91,980
Analyst 13 6.00 $459,106 $66,884 $100,327
Analyst 14 2.00 $136,165 $72,900 $109,351
Analyst 15 6.00 $574,449 $79,406 $119,110
Analyst, Senior 13 2.00 $176,993 $66,884 $100,327
Analyst, Senior 14 6.00 $561,401 $72,900 $109,351
Analyst, Senior 15 3.00 $288,307 $79,406 $119,110
Analyst, Senior 16 1.00 $110,049 $86,398 $129,597
Analyst, Senior 17 3.00 $285,365 $93,951 $140,927
Apprentice Mechanic 0934 21.00 $1,332,692 $46,259 $64,834
Apprentice Plant Maint Mech 0572 10.00 $637,773 $46,259 $64,834
Assistant Manager 12 2.00 $150,450 $61,321 $91,980
Assistant Manager 13 1.00 $84,938 $66,884 $100,327
Assistant Manager 14 4.00 $351,761 $72,900 $109,351
Assistant Manager 15 21.00 $1,974,025 $79,406 $119,110
Assistant Storekeeper 0371 5.00 $384,884 $72,946 $72,946
Assistant Supervisor 0736 1.00 $76,420 $55,827 $74,443
Assistant Supervisor 0872 3.00 $258,498 $79,830 $79,830
Assistant Supervisor 0964 3.00 $251,308 $79,830 $79,830
Assistant Supervisor 0529 6.00 $488,862 $79,830 $79,830
Assistant Supervisor 0564 2.00 $172,973 $83,574 $83,574
Assistant Supervisor 0556 3.00 $259,224 $83,574 $83,574
Assistant Supervisor 0566 14.00 $1,205,302 $87,547 $87,547
Assistant Supervisor 0590 2.00 $183,830 $87,547 $87,547
Personnel Profile- 1

Agency Personnel Profile
Position Title Grade Total FTE Base Salary Expense Min Max
Assistant, Administrative 7 17.55 $825,226 $39,262 $58,894
Assistant, Administrative 8 1.00 $44,595 $42,994 $64,491
Assistant, Administrative 9 9.00 $524,014 $47,037 $70,555
Assistant, Administrative 11 1.00 $66,997 $56,173 $84,261
Business Analyst 12 1.00 $83,901 $61,321 $91,980
Business Analyst 14 1.00 $91,126 $72,900 $109,351
Business Analyst 16 1.00 $129,297 $86,398 $129,597
Business Process Analyst 16 1.00 $107,842 $86,398 $129,597
Business Systems Analyst 14 1.00 $45,039 $72,900 $109,351
Buyer 0432 4.00 $310,066 $57,450 $76,606
Chief Fare Inspector 0341 2.00 $171,766 $64,418 $85,883
Chief Information Officer 26 1.00 $222,688 $192,765 $289,147
Chief Operating Officer 26 1.00 $225,689 $192,765 $289,147
Chief Station Agent 0830 4.00 $355,057 $64,418 $85,883
Claims Adjuster 11 2.00 $158,641 $56,173 $84,261
Cleaner 0940 4.00 $169,728 $31,616 $49,421
Commuter Rail Vehicle Maint. Technician 0875 1.00 $69,410 $69,410 $69,410
Commuter Rail Vehicle Maint. Technician 0888 7.00 $505,210 $69,410 $69,410
Coordinator 8 1.00 $50,627 $42,994 $64,491
Coordinator 9 2.00 $103,397 $47,037 $70,555
Coordinator 10 5.00 $326,269 $51,431 $77,145
Coordinator 11 21.00 $1,313,766 $56,173 $84,261
Coordinator 0437 1.00 $71,049 $58,947 $78,582
Coordinator 12 3.00 $245,719 $61,321 $91,980
Coordinator 0819 4.00 $350,605 $64,418 $85,883
Coordinator 13 5.00 $407,149 $66,884 $100,327
Coordinator 14 3.00 $257,177 $72,900 $109,351
Coordinator 15 1.00 $101,629 $79,406 $119,110
Cost Estimator 12 1.00 $77,900 $61,321 $91,980
Cost Estimator II 14 1.00 $84,369 $72,900 $109,351
Customer Experience Agent 0714 11.00 $525,096 $38,355 $50,752
Customer Service Representative 0731 5.00 $344,344 $51,563 $68,744
Database Architect 18 2.00 $236,398 $102,080 $153,120
Deputy General Counsel 18 3.00 $335,378 $102,080 $153,120
Deputy General Counsel 19 1.00 $127,000 $110,833 $166,251
Personnel Profile- 2

Agency Personnel Profile
Position Title Grade Total FTE Base Salary Expense Min Max
Deputy General Counsel, Senior 20 3.00 $433,673 $120,234 $180,349
Designer, Graphics 10 1.00 $66,560 $51,431 $77,145
Designer, Senior, Transit Corridor 14 1.00 $100,821 $72,900 $109,351
Designer, Web/Developer 11 2.00 $138,876 $56,173 $84,261
Director 18 3.00 $389,798 $102,080 $153,120
Director 19 14.00 $1,875,324 $110,833 $166,251
Director 20 8.00 $1,122,768 $120,234 $180,349
Director 21 9.00 $1,476,020 $130,346 $195,520
Director 22 2.00 $317,163 $141,179 $211,771
Dispatcher 0836 20.00 $1,658,235 $61,360 $81,806
Document Svcs Operator/Mail Svcs Clerk 4 1.00 $35,901 $29,768 $44,652
Electronic Survey Developer & Analyst 14 1.00 $84,795 $72,900 $109,351
Engineer 17 3.00 $326,036 $93,951 $140,927
Engineer Structural - Agency 18 1.00 $130,083 $102,080 $153,120
Enterprise Architect 16 1.00 $80,687 $86,398 $129,597
Executive Administrative Assistant 11 7.00 $512,319 $56,173 $84,261
Executive Administrative Assistant 13 1.00 $88,026 $66,884 $100,327
Executive Director 22 2.00 $372,339 $141,179 $211,771
Executive Director 23 1.00 $200,230 $152,812 $229,219
Executive Director 24 2.00 $411,172 $165,265 $247,899
Executive Director 25 1.00 $206,100 $178,485 $267,728
Executive Director 26 2.00 $475,820 $192,765 $289,147
Facilities Maintenance Trainer 0915 2.00 $168,456 $79,830 $79,830
Fare Inspector 0342 18.00 $1,477,938 $61,360 $81,806
Fare Revenue Specialist 0733 9.00 $614,644 $51,022 $68,037
Field Technician 0591 18.00 $1,419,737 $76,128 $76,128
Field Technician Apprentice 0592 5.00 $386,139 $46,259 $64,834
Finance Clerk 0323 6.00 $392,606 $51,272 $68,349
General Manager 30 1.00 $313,425 $269,614 $404,424
Graphics Designer 10 2.00 $127,843 $51,431 $77,145
Helper 0533 21.00 $1,396,297 $64,834 $64,834
HR Business Partner 17 1.00 $124,091 $93,951 $140,927
Human Resources Generalist 12 4.00 $297,521 $61,321 $91,980
Inspector 14 1.00 $89,779 $72,900 $109,351
Internal Auditor, Senior 15 1.00 $91,000 $79,406 $119,110
Personnel Profile- 3

Agency Personnel Profile
Position Title Grade Total FTE Base Salary Expense Min Max
Journeyman Mechanic 0931 195.00 $13,907,006 $69,410 $69,410
Landscaper 0974 5.00 $350,002 $49,587 $66,123
Lead Supervisor 0489 6.00 $519,979 $64,418 $85,883
LRV Apprentice 0573 19.00 $1,083,243 $46,259 $64,834
LRV Mechanic 0551 115.00 $8,203,874 $69,410 $69,410
LRV Vehicle Body & Paint Technician 0553 4.00 $268,392 $52,770 $67,392
Mail Services Clerk 0356 1.00 $58,656 $42,973 $57,304
Maintenance Mechanic 0532 11.00 $727,979 $37,627 $66,123
Maintenance of Way Laborer 0561 11.00 $696,428 $38,771 $68,058
Maintenance Technician 0965 5.00 $337,741 $66,123 $66,123
Maintenance Trainer 0918 8.00 $663,395 $79,830 $79,830
Manager 13 2.00 $162,757 $66,884 $100,327
Manager 14 3.00 $280,799 $72,900 $109,351
Manager 15 12.00 $1,156,924 $79,406 $119,110
Manager 16 40.00 $4,203,691 $86,398 $129,597
Manager 17 14.00 $1,531,964 $93,951 $140,927
Manager 18 6.00 $675,264 $102,080 $153,120
Manager 19 10.00 $1,183,594 $110,833 $166,251
Manager, Senior 16 2.00 $199,475 $86,398 $129,597
Manager, Senior 18 1.00 $110,000 $102,080 $153,120
Managing Director 20 1.00 $160,761 $120,234 $180,349
Managing Director 21 1.00 $187,748 $130,346 $195,520
Mini Run Operator 0881 238.50 $13,743,793 $31,533 $64,834
MMIS Clerk 0543 12.00 $757,910 $34,403 $63,690
Mobile Device Engineer 14 2.00 $136,165 $72,900 $109,351
Moneyroom Clerk 0331 3.80 $314,792 $61,360 $81,806
Moneyroom Supervisor 0330 1.20 $99,699 $63,253 $84,344
Network Engineer 14 3.00 $296,456 $72,900 $109,351
Network Engineer 16 1.00 $93,994 $86,398 $129,597
Network Engineer, Senior 18 3.00 $364,931 $102,080 $153,120
Operator 0880 1104.00 $68,855,734 $35,693 $64,834
Oracle Developer 17 6.00 $774,180 $93,951 $140,927
Overhead Traction Apprentice 0569 2.00 $129,667 $46,467 $64,834
Paralegal I 9 1.00 $69,202 $47,037 $70,555
Paralegal Investigator 13 1.00 $82,098 $66,884 $100,327
Personnel Profile- 4

Agency Personnel Profile
Position Title Grade Total FTE Base Salary Expense Min Max
Partsman 0376 19.00 $1,249,827 $64,834 $69,472
Planner I 9 1.00 $52,603 $47,037 $70,555
Planner II 12 3.00 $206,639 $61,321 $91,980
Planner III 13 4.00 $336,554 $66,884 $100,327
Plant Maintenance Mechanic 0557 27.00 $1,914,398 $69,410 $69,410
Power Maintainer 0531 21.00 $1,629,142 $76,128 $76,128
Production Coordinator 10 1.00 $66,325 $51,431 $77,145
Program Administrator 12 1.00 $80,696 $61,321 $91,980
Program Manager 14 2.00 $188,409 $72,900 $109,351
Program Manager 15 1.00 $108,006 $79,406 $119,110
Program Manager 17 2.00 $210,875 $93,951 $140,927
Program Scheduler, Senior 17 1.00 $122,235 $93,951 $140,927
Project Coordinator 11 3.00 $195,771 $56,173 $84,261
Project Manager 15 23.00 $2,174,311 $79,406 $119,110
Project Manager 16 3.00 $320,741 $86,398 $129,597
Project Manager 17 3.00 $353,402 $93,951 $140,927
Project Manager, Assistant 14 19.00 $1,667,379 $72,900 $109,351
Project Manager, Senior 17 6.00 $665,659 $93,951 $140,927
Public Information Officer 13 2.00 $161,745 $66,884 $100,327
Rail Controller 0538 32.00 $2,635,525 $81,806 $81,806
Rail Operator 0580 196.00 $13,239,636 $50,294 $67,142
Rail Supervisor 0536 35.00 $2,887,626 $81,806 $81,806
Receptionist 4 1.00 $40,893 $29,768 $44,652
Recruiter 11 3.00 $194,853 $56,173 $84,261
Recruiter 12 1.00 $71,000 $61,321 $91,980
Representative 0715 8.25 $300,880 $33,280 $41,600
Representative 10 2.00 $129,724 $51,431 $77,145
Representative 12 6.00 $423,101 $61,321 $91,980
Right-of-Way Surveyor 14 1.00 $89,779 $72,900 $109,351
Road Supervisor 0834 32.00 $2,635,113 $61,360 $81,806
Schedule Data Technician 0867 3.00 $251,451 $61,360 $81,806
Schedule Writer II 0874 5.00 $419,224 $61,360 $81,806
Security Access Control Specialist/Coordinator 9 1.00 $29,060 $47,037 $70,555
Senior Accounts Payable Clerk 0322 1.00 $77,875 $57,387 $76,523
Senior Administrative Assistant 9 3.00 $165,893 $47,037 $70,555
Personnel Profile- 5

Agency Personnel Profile
Position Title Grade Total FTE Base Salary Expense Min Max
Senior Administrator 13 1.00 $86,479 $66,884 $100,327
Senior Analyst, Business Process 16 1.00 $103,283 $86,398 $129,597
Senior Buyer 0373 2.00 $170,685 $80,246 $80,246
Senior Partsman 0372 5.00 $376,409 $69,472 $69,472
Senior Payroll Clerk 0340 2.00 $153,046 $57,387 $76,523
Senior Storekeeper 0368 1.00 $76,606 $76,606 $76,606
Service Worker 0944 150.50 $7,510,960 $37,482 $54,267
Service Worker 0947 4.00 $229,549 $40,706 $57,491
Service Worker 0946 4.00 $229,549 $40,706 $57,491
Signal Maintainer Apprentice 0568 7.00 $435,261 $46,259 $64,834
Signals Maintainer 0541 25.00 $1,841,389 $72,675 $72,675
Software Engineer 15 7.00 $711,254 $79,406 $119,110
Software Engineer, Senior 18 7.00 $873,434 $102,080 $153,120
Specialist 8 1.00 $51,730 $42,994 $64,491
Specialist 9 16.80 $998,929 $47,037 $70,555
Specialist 10 1.00 $57,582 $51,431 $77,145
Specialist 11 1.00 $55,343 $56,173 $84,261
Specialist 0732 5.00 $391,636 $58,427 $77,896
Specialist 12 5.00 $340,986 $61,321 $91,980
Specialist 13 9.00 $757,453 $66,884 $100,327
Specialist, Senior 12 2.00 $146,536 $61,321 $91,980
Specialist, Senior 15 1.00 $100,585 $79,406 $119,110
Spotter 0936 4.00 $273,333 $66,123 $66,123
Station Agent 0835 26.00 $2,117,544 $61,360 $81,806
Streetcar Journeyman Mechanic 0451 10.00 $716,196 $69,410 $69,410
Streetcar Maintenance Training Technician 0182 1.00 $72,530 $72,530 $72,530
Streetcar Operator 0488 56.00 $3,770,433 $50,294 $67,142
Streetcar Superintendent 0146 2.00 $195,187 $97,594 $97,594
Supervisor 9 1.00 $55,744 $47,037 $70,555
Supervisor 0716 1.00 $80,350 $60,258 $80,350
Supervisor 0710 2.00 $162,677 $60,258 $80,350
Supervisor 12 5.00 $402,576 $61,321 $91,980
Supervisor 0837 3.00 $244,941 $61,360 $81,806
Supervisor 0840 3.00 $238,888 $64,418 $85,883
Supervisor 13 19.00 $1,646,702 $66,884 $100,327
Personnel Profile- 6

Agency Personnel Profile
Position Title Grade Total FTE Base Salary Expense Min Max
Supervisor 14 50.00 $4,332,051 $72,900 $109,351
Supervisor 0535 2.00 $163,613 $81,806 $81,806
Systems Engineer 15 1.00 $92,087 $79,406 $119,110
Systems Engineer 16 5.00 $410,237 $86,398 $129,597
Systems Engineer 18 2.00 $250,331 $102,080 $153,120
Systems Engineer, Senior 13 1.00 $82,144 $66,884 $100,327
Systems Engineer, Senior 16 4.00 $406,414 $86,398 $129,597
Systems Engineer, Senior 18 6.00 $697,456 $102,080 $153,120
Technical Support Assistant 11 1.00 $88,019 $56,173 $84,261
Technical Writer 14 1.00 $88,019 $72,900 $109,351
Technician 9 1.00 $60,590 $47,037 $70,555
Technician 10 1.00 $68,226 $51,431 $77,145
Technician 11 2.00 $140,909 $56,173 $84,261
Telecommunications Engineer 16 2.00 $188,394 $86,398 $129,597
Timekeeper 0336 1.50 $117,250 $63,253 $84,344
Tireman 0941 5.00 $419,994 $68,536 $68,536
TOD Commercial Developer 18 1.00 $130,000 $102,080 $153,120
Track Maintainer 0540 18.00 $1,336,056 $72,675 $72,675
Traction Substation Technician 0779 10.00 $788,478 $76,128 $76,128
Traction Substation Technician Apprentice 0570 2.00 $129,667 $46,467 $64,834
Training Supervisor 0832 27.00 $2,245,477 $61,360 $81,806
Training Supervisor 0775 12.00 $985,005 $61,360 $81,806
Virtual Desktop Engineer 13 1.00 $41,323 $66,884 $100,327
Wayside Cleaner 0537 6.00 $404,023 $66,123 $66,123
Wheel True Technician 0552 8.00 $590,137 $69,846 $69,846
Total 3,354.10 $237,332,216
Personnel Profile- 7

Personnel Profile- 8
[This Page Left Intentionally Blank]

Appendix-1
Glossary
ACCOUNT: The classification of appropriation by type of expenditure or revenue.
ACCOUNTING PERIOD: The Agency’s fiscal year is divided into 12 accounting periods. Each accounting period is one month long.
ACCRUAL An entry which records an expense for which no cash disbursement has occurred at the end of the fiscal year, although the expense was incurred in that fiscal year. Accruals are used to ensure expenses are recorded in the fiscal year in which they are incurred, regardless of when payment actually takes place.
APPROPRIATION: The legal authority to spend funds designed for a specific purpose.
BALANCED BUDGET: Oregon Administrative Rule 150-294.532(1)-(b), relating to Local Budget Law, states that the Agency “must construct its budget in a manner that the total resources in a fund equal the total of expenditures and requirements for that fund” and “the total of all resources of the district must equal the total of all expenditures for all requirements for the Agency.” A budget that meets these specifications is considered balanced.
BEGINNING FUND BALANCE: Net resources (cash and noncash) available in a fund at the beginning of a fiscal year, carried over from the prior fiscal year.
BOND SALE PROCEEDS: Money received from bond sales.
BUDGET: A financial, operating and management plan for the provision of services. A budget provides for the receipt of revenues and establishes legal appropriations for the fiscal year or period.
BUDGET CALENDAR: The schedule of major events in the budget process.
BUDGET COMMITTEE: A special committee required under Oregon Local Budget Law. The committee, which in TriMet’s case is identical in composition to the TriMet Board of Directors, reviews the General Manager’s Proposed Budget and votes to approve the budget.
BUDGET MESSAGE: A written explanation of the budget and the Agency’s financial plan and priorities presented to the Budget Committee (Board of Directors) by the General Manager. The budget message is a requirement of Oregon Local Budget Law.
BUDGET PHASES: The following are the major versions of the budget. Each corresponds with a different phase of the budget process.

Appendix-2
• PROPOSED: The General Manager’s recommended budget as presented to the Budget Committee.
• APPROVED: The budget as approved by the Budget Committee and subsequently reviewed and certified by the Multnomah Tax Supervising andConservation Commission. The Approved Budget occurs after the release of the General Manager’s Proposed Budget and before the final AdoptedBudget.
• ADOPTED: The budget as adopted by the Budget committee. It is the Adopted Budget from which TriMet operates during the fiscal year.
• REVISED: The budget as amended by resolution, typically during a monthly review of actual to budget variances; and can occur throughout the fiscalyear.
BUDGETARY FUND BALANCE: Restricted funds include funds held in trust to pay debt service, plus bond proceeds and other resources designated for specific purposes.
CAPITAL BUDGET: The expenditures scheduled for the first year of the five-year Capital Improvement Plan.
CAPITAL EQUIPMENT: Machinery, vehicles, furniture, etc. with a unit cost in excess of $5,000 and an expected life of at least one year.
CAPITAL IMPROVEMENT: An expenditure of at least $10,000 that extends an asset’s useful life and/or improves its efficiency, capacity or usability. The life expectancy of a capital improvement must be at least ten years.
CAPITAL OUTLAY: A major expenditure category that includes land, buildings (purchase or construction), improvements other than buildings (purchase or construction) and equipment and furniture with a unit cost in excess of $5,000.
CAPITALIZED LABOR: All direct costs of labor that can be identified or associated with and are properly allocable to the construction, modification, or installation of specific items of capital assets and, as such, can thereby be written down over time via a depreciation or amortization schedule as capitalized.
CONTINGENCY: Estimates for expenditure which cannot be foreseen and planned for in the budget either because of the occurrence of some unplanned event or because of insufficient data at the time the budget is compiled.
ENDING FUND BALANCE: The amount that remains unspent in a fund after subtracting budgeted expenses, including contingency.
EQUIPMENT FUEL AND LUBRICANTS: Expenses for fuel or lubricants used in the operation of equipment.

Appendix-3
EXPENDITURE: The actual outlay or, or obligation to pay, cash. This does not include encumbrances. Expenditures exclude fund-level requirements, such as contingency and cash transfers.
FEDERAL FINANCIAL ASSISTANCE: Assistance provided by a federal agency in the form of grants, contracts, cooperative agreements, loans, loan guarantees, property, interest subsidies, insurance or direct appropriation to individuals. It includes funding awarded directly from federal agencies or indirectly through other units of state and local government.
FISCAL YEAR (FY): A twelve-month period beginning July 1 and ending June 30.
FUND: A budgetary and accounting mechanism for designating a sum of money or other resources for a particular purpose. Each fund constitutes an independent budgetary, fiscal, and accounting entity. Fund categories include governmental, proprietary and fiduciary. Funds are established in accordance with state and local laws, regulations and other limitations.
• DEBT SERVICE FUND: Funds that account for the payment of debt service on general obligation, revenue, assessment, improvement, and otherbonds.
• GENERAL FUND: The General Fund includes resources for all general purpose activities of the Agency that are supported by payroll tax and otherdiscretionary resources.
FULL-TIME EQUIVALENT POSITION (FTE): One FTE equates to 2,080 working hours in a year; excluded overtime hours.
GENERAL OBLIGATION (GO) BONDS: Voter-approved bonds backed by the full faith and credit and taxing authority of the Agency. These bonds are typically paid from a property tax levied upon all taxable property within the Agency’s service district. GO bonds are used to finance a wide range of capital projects.
GRANT: Donated financial assistance received from federal, state and other third-party sources or similar assistance to non-Agency entities from Agency revenues.
INTERGOVERNMENTAL AGREEMENT (IGA): An agreement for provision and receipt of services between agencies in the tri-county metropolitan area. IGAs establish a mutually agreed upon budget amount for anticipated services to be provided and received.
INTEREST ON INVESTMENTS: Interest earned through investment of cash balances.
LAND SALE PROCEEDS: Revenues generated by land sales.

Appendix-4
LIMITED TERM EMPLOYMENT: Employees hired for 6 months or more, work 20 hours or more per week, and have a predetermined end date.
LINE ITEM: The lowest level expenditure classification. Line items are detail accounts within major object codes. For example, office supplies and other materials are line items within the external materials and supplies consumed object category.
LOCAL BUDGET LAW: Oregon Revised Statutes, Chapter 294, which prescribes budgeting practices for municipalities, counties and special districts within Oregon.
MAJOR OBJECT CATEGORIES: Broad categories of expenditures. Major object categories include personnel services, external and internal material and services, capital outlay, contingency and debt service. (see Account or Line Item).
MANAGEMENT AND TRAVEL EXPENSES: Expenses for memberships, dues, subscriptions, promotional, employee education, local and out-of-town travel, and miscellaneous management activities.
MATERIALS AND SUPPLIES: Purchase of materials and supplies which have a short life and are usually low in cost.
MISCELLANEOUS EXPENSE: Expenses not account for elsewhere, including bad debts.
ONE-TIME EXPENDITURES: These are expenditures for one-time projects or services. At the end of each fiscal year expenditures are terminated and funds are no longer appropriated. One-time expenditures are not considered part of normal capital or operating costs.
ONE-TIME REVENUES: Revenues that are either non-recurring (such as certain grant awards, legal settlements, etc.) or which represent discretionary General Fund resources in excess of current ongoing requirements.
ONGOING EXPENDITURES: Continuing expenditures that maintain established levels of services (as compared to one-time expenditures).
ONGOING REVENUES: Discretionary General Fund revenues that are sufficient to fund services.
OPERATING DIVISIONS: The operating divisions are Transportation and Maintenance.
OREGON REVISED STATUTES (ORS): The laws of the State of Oregon.
OTHER REVENUE: Miscellaneous operating revenue not specifically defined.

Appendix-5
PERFORMANCE MEASURE: An indicator that measures the degree of accomplishment of an objective. The major types are as follows:
• WORKLOAD MEASURE: Describes a quantity of work performed.
• OUTCOME MEASURE: A qualitative consequence associated with a program/service (i.e. the ultimate benefit to the customer) and communicatethe policy intent of service provision.
• KEY PERFORMANCE MEASURE: An outcome indicated of core service delivery that provide Agency directors and the Board of Directors withinformation to guide decision-making.
PERSONNEL SERVICES: Salaries, wages, benefits and other payroll expenses paid to Agency employees.
REQUIREMENTS: Budgeted expenditures plus ending fund balance. Requirements include bureau expenditures, contingencies, debt service and ending fund balance.
RESOURCES: Revenue and other monies that the Agency has or expects to receive. Resources include estimated revenues and beginning fund balance.
SALARIES AND WAGES: Base compensation for all non-temporary positions, including training pay, student training cost, and union employee wage premiums based on years of service.
SCHEDULED OVERTIME: Overtime that has been built in upon operator shifts.
SERVICE REVENUE: Revenue generated by performing a specific service, generally equipment oriented, including rental.
TAX SUPERVISING & CONSERVATION COMMISSION (TSCC): The state-authorized body that reviews the budgets of all government entities within Multnomah County prior to adoption by those entities’ elected officials. TSCC certifies that each local government’s budget is in compliance with Local Budget Law.
TOTAL PROJECT COST: Total cost of a project.
UNAPPROPRIATED ENDING BALANCE: The estimated intended to provide working capital or cash balance to finance activities for the period between July 1 of the ensuing fiscal year and the time when sufficient new revenues become available to meet cash flow needs of the fund.
UNPAID ABSENCE: All excused and unexcused time loss for which employees are not paid.

Appendix-6
UNRESTRICTED FUNDS: Resources maintained to cover cash flow until tax and grant revenues are collected.
UNSCHEDULED OVERTIME: All other overtime except scheduled overtime.
UTILITIES: Cost of electricity, water, telephone, natural gas, sewer, etc.
WORKERS’ COMPENSATION: Medical and time loss payments to employees injured in work related accidents.

Appendix-7
Acronyms
The following are acronyms and terms commonly used by TriMet. ADA .................Americans with Disabilities Act ATU .................Amalgamated Transit Union BOD .................Board of Directors BOLI ................Bureau of Labor and Industries BRT .................Bus Rapid Transit CCTV ................Closed Circuit Television CIP ...................Capital Improvement Program CMAQ ..............Congestion Mitigation & Air Quality Program CMMS .............Computerized Maintenance Management System CPTED ..............Crime Prevention Through Environmental Design DB ...................Defined Benefit DC ...................Defined Contribution DBE .................Disadvantaged Business Enterprise DTP .................Division Transit Project EAMS ...............Enterprise Asset Management System FAST ................Fixing America’s Surface Transportation FEIS .................Final Environmental Impact Statement FTA ..................Federal Transit Administration FTE ..................Full-Time Equivalent FY ....................Fiscal Year GAAP ...............Generally Accepted Accounting Principles GASB ...............Government Accounting Standards Board GED .................General Education Development GIS ..................Geographic Information System HB2017 ............House Bill 2017 HRIS ................Human Resources Information System IGA ..................Intergovernmental Agreement IT .....................Information Technology ITS ...................Intelligent Transportation Systems ITSM ................Information Technology Service Management KPI ...................Key Performance Indicators LMR .................Land Mobile Radio LRV ..................Light Rail Vehicle MaaS ...............Mobility as a Service

Appendix-8
MAX ................. Metropolitan Area Express MOW...............Maintenance of Way MRP ................Material Requisition Planning MTIP ................Metropolitan Transportation Improvement Program MWESB ...........Minority, Women & Emerging Small Business NTD .................National Transit Database ODOT ..............Oregon Department of Transportation PCM ................Predicted Compensation Model PMO ................Project Management Office PPO .................Preferred Provider Organization P&W ................Portland & Western Railroad REM ................Rail Equipment Maintenance SIP ...................Service Improvement Process SMS .................Safety Management System SOAR ...............Security Operations Automation Response SPF ..................Salary Placement Form SSGA ...............Small Starts Grant Agreement STBG ................Surface Transportation Block Grant STIP .................State Transportation Improvement Program TAM ................Transit Asset Management TEAC ................Transit Equity Advisory Committee TSCC ................. Tax Supervising & Conservation Commission TSP ..................Transit Signal Priority TTO .................TriMet’s Ticket Office TVM ................Ticket Vending Machine WES .................Westside Express Service
