m o r g a n s t a n l e y r e s e a r c h global march 2009 morgan stanley & co. incorporated...
TRANSCRIPT

M O R G A N S T A N L E Y R E S E A R C H
GLOBAL
March 2009
Morgan Stanley & Co. Incorporated
Jason E. [email protected]+1 212 761 7991
Equity Research
U.S. Equity
Strategy
U.S
. S
trat
egy
Morgan Stanley does and seeks to do business with companies covered in its research reports. As a result, investors should be aware that the firm may have a conflict of interest that could affect the objectivity of this report. Investors should consider this report as only a single factor in making their investment decision. Customers of Morgan Stanley in the United States can receive independent, third-party research on the company or companies covered in this report, at no cost to them, where such research is available. Customers can access this independent research at www.morganstanley.com/equityresearch or can call 800-624-2063 to request a copy of this research.
For analyst certification and other important disclosures, refer to the Disclosure Section.
U.S. Equity StrategyBear Market Still Intact

M O R G A N S T A N L E Y R E S E A R C H
March 2009U.S. Equity Strategy
2Jason Todd +1 212 761 7991 (for enquiries or requests please email [email protected])
Key Global Economic Themes
Critical global issues:
Global growth risks are now more balanced, but around a contracting baseline in 2009. A record global recession and weakness in commodity prices should persist, while the dollar should show renewed weakness later in 2009.
How deep and how long? The answer will hinge on policy actions taken to break the ‘adverse feedback loop’ from credit to the economy and back and whether those policies get traction soon.
Massive stimulus helps China recover first. But China is better positioned than most in the developing world. A severe global downturn and tepid recovery are still likely.
Aggressive (in some cases quantitative) easing, new financing facilities, tools to fix financial systems, and fiscal stimulus are now weapons of choice to fight credit crunch, deep slump and deflation risks.
What’s Next?
Look for others to follow the US with more aggressive monetary ease, fiscal stimulus, and backstops for financial institutions and markets. Look for weaker exports and commodity prices to confirm weaker global growth, especially in EM. Falling inflation could fuel the deflation scare. Look for signs of thawing in funding and credit, and a less-intense rate of decline in output.
Where we differ
Growth: Below consensus in both the industrial and developing economies
Inflation: Deflation scare may intensify, but reflation will ultimately prevail
Rates: Curves rangebound for now, TIPS still attractive, given inflation and policy uncertainty
Equities: More bearish than consensus on growth and margins. Lower inflation unlikely to help stocks; seen as lost pricing power. Overweight EM over developed markets.
Credit: More bullish than consensus on investment grade globally
Currencies: Modestly more bearish on the USD than consensus, and selectively more bearish on EM currencies

M O R G A N S T A N L E Y R E S E A R C H
March 2009U.S. Equity Strategy
3Jason Todd +1 212 761 7991 (for enquiries or requests please email [email protected])
Key US Equity Recommendations 2009 S&P 500 Outlook
-825 target on $57 dollars of earnings and 14.5x P/E
Key Recommendations
- Buy Corporate Credit – IG (Financials/cash rich Tech over Industrial and Materials)
- Buy Consumers over Producers (Retail, Healthcare, Food & Beverage, Personal Products over Cap Goods, Metals, Energy)
- Buy Brand, Content and Franchise value (CSCO, NKE, MCD, PM, LO, MSFT) over Distribution
Sector Weightings
- Overweight Healthcare, Telecoms
- Neutral Financials, Discretionary, Staples, Energy
- Underweight Materials, Industrials, Tech
Stock & Sector Recommendations:
-Buy healthcare with earnings visibility, yield and strong cash flow - JNJ, ABT, AMGN, BAX
-Buy domestic food and beverage - GIS, CL, K
-Buy custodians (STT, BK) as money markets normalize; WFC and JPM as industry consolidation winners.
-Buy Energy Equipment & Services for long term structural upside – SLB, HAL, BHI, WFT, SII
-Sell - Metals into strength - FCX, X, AKS, CLF
-Sell - Construction machinery, power gen, transportation equipment (FAST, ITW, GWW, EMR, CAT, ROK)

M O R G A N S T A N L E Y R E S E A R C H
March 2009U.S. Equity Strategy
4Jason Todd +1 212 761 7991 (for enquiries or requests please email [email protected])
A Slow Path to Global Recovery – Asia/EM’s to Lead Rebound
-6
-5
-4
-3
-2
-1
0
1
2
3
4
2008E 2009E 2010E
Japan
Real GDP (Year-over-Year Percent Change)
US
Europe
-4
-2
0
2
4
6
8
10
12
2008E 2009E 2010E
Real GDP (Year-over-Year Percent Change)
ChinaAsia ex-Japan and China
Latin America
Source: IMF Staff Estimates, Morgan Stanley
Despite aggressive stimulus… … lingering headwinds imply a sub-par global recovery
G-20
Turkey
Italy
Brazil
Mexico
France
Argentina
U.K.
Russia
India
Japan
Indonesia
South Africa
Korea
Canada
Germany
China
Australia
Spain
U.S.
Saudi Arabia
0 1 2 3 4 5 6 7 8 9 10
Discretionary Measures in Percent of GDP, 2008-2010
E = Morgan Stanley Research estimatesSource: Morgan Stanley
3.4%
0.0%
1.3%
0.5%
1.0%
0.3%
1.3%
1.5%
1.7%
1.7%
2.2%
2.4%
2.6%
2.8%
2.8%
3.5%
4.4%
4.5%
5.0%
5.9%
9.2%
M O R G A N S T A N L E Y R E S E A R C H
March 2009U.S. Equity Strategy
5Jason Todd +1 212 761 7991 (for enquiries or requests please email [email protected])
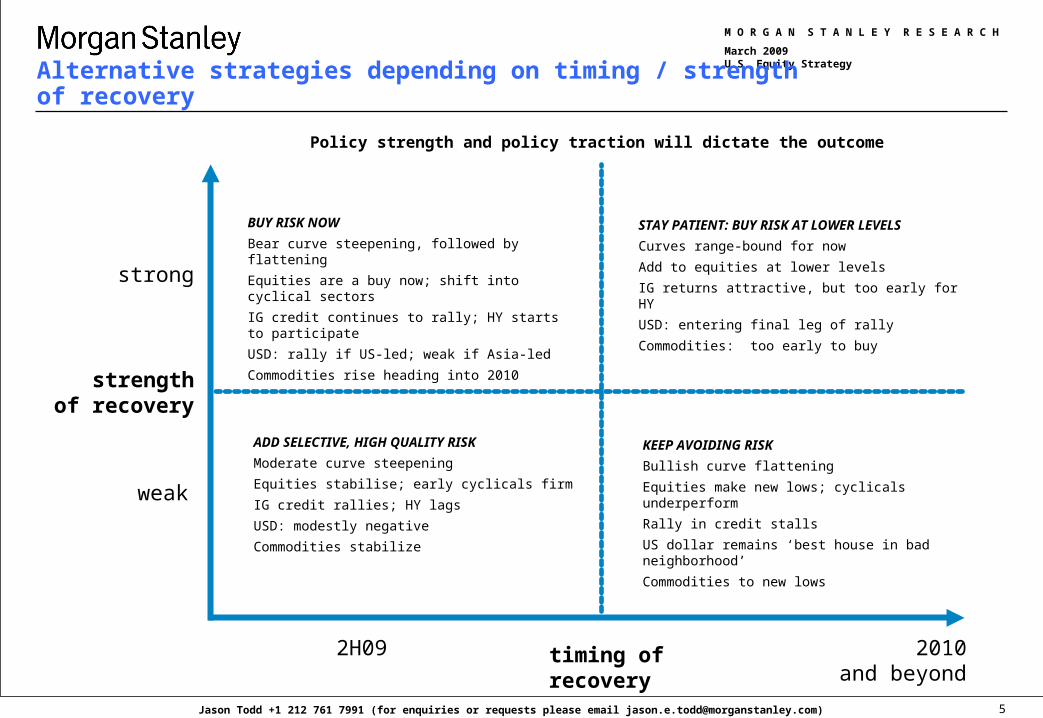
BUY RISK NOW
Bear curve steepening, followed by flattening
Equities are a buy now; shift into cyclical sectors
IG credit continues to rally; HY starts to participate
USD: rally if US-led; weak if Asia-led
Commodities rise heading into 2010
timing ofrecovery
2H09 2010and beyond
weak
strong
strengthof recovery
Alternative strategies depending on timing / strength of recovery
Policy strength and policy traction will dictate the outcome
STAY PATIENT: BUY RISK AT LOWER LEVELS
Curves range-bound for now
Add to equities at lower levels
IG returns attractive, but too early for HY
USD: entering final leg of rally
Commodities: too early to buy
ADD SELECTIVE, HIGH QUALITY RISK
Moderate curve steepening
Equities stabilise; early cyclicals firm
IG credit rallies; HY lags
USD: modestly negative
Commodities stabilize
KEEP AVOIDING RISK
Bullish curve flattening
Equities make new lows; cyclicals underperform
Rally in credit stalls
US dollar remains ‘best house in bad neighborhood’
Commodities to new lows
M O R G A N S T A N L E Y R E S E A R C H
March 2009U.S. Equity Strategy
6Jason Todd +1 212 761 7991 (for enquiries or requests please email [email protected])
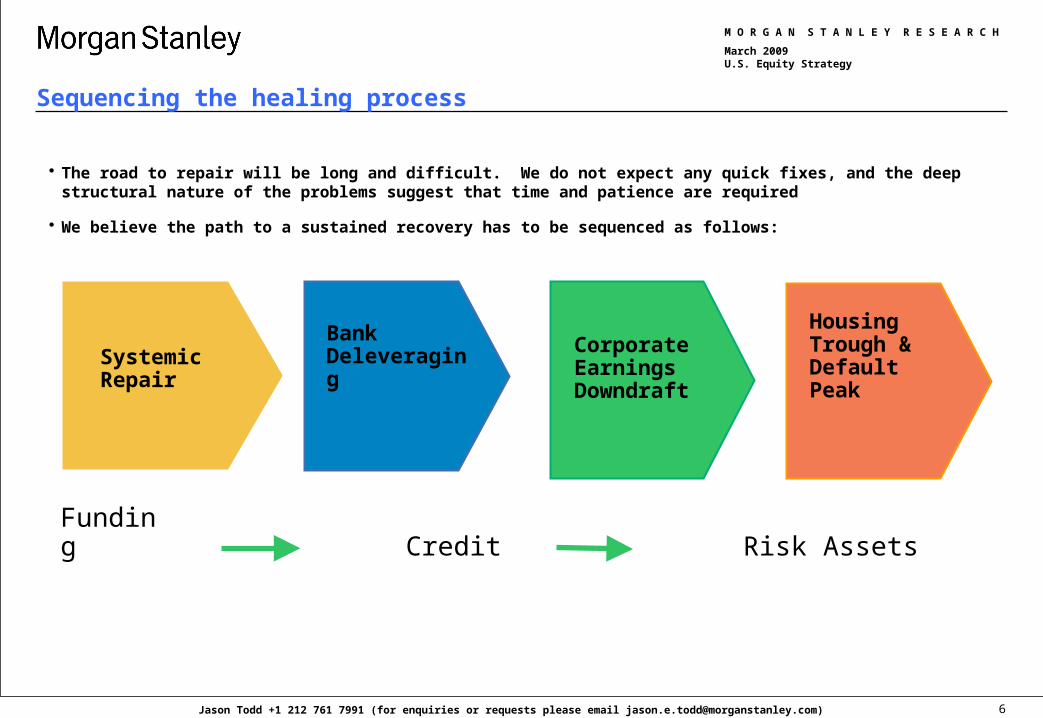
Sequencing the healing process
Housing Trough & Default Peak
Corporate Earnings Downdraft
Bank Deleveraging
Systemic Repair
The road to repair will be long and difficult. We do not expect any quick fixes, and the deep structural nature of the problems suggest that time and patience are required
We believe the path to a sustained recovery has to be sequenced as follows:
Funding Credit Risk Assets

M O R G A N S T A N L E Y R E S E A R C H
March 2009U.S. Equity Strategy
7Jason Todd +1 212 761 7991 (for enquiries or requests please email [email protected])
Credit Market – Further Healing Still Necessary
LIBOR-OIS spread still hasn’t stabilized
Corporate and HY spreads rose again this month
TED spread still elevated
95
-
50
100
150
200
250
300
350
400
450
500
1985 1987 1989 1991 1993 1995 1997 1999 2001 2003 2005 2007 2009
LTCM
10/20/87Post '87 Stock Market
Crash308
364
107
0
50
100
150
200
250
300
350
400
Oct-04 Apr-05 Oct-05 Apr-06 Oct-06 Apr-07 Oct-07 Apr-08 Oct-08 Apr-09
2/25/20091838
50
150
250
350
450
550
2002 2003 2004 2005 2006 2007 2008 2009
200
700
1200
1700
2200
Corporate Bond Option Adjusted Spread - LHS
High Yield Spread to Worst
11/30/2006 34
-
5
10
15
20
25
30
35
Jan
-02
Ma
y-0
2
Se
p-0
2
Jan
-03
Ma
y-0
3
Se
p-0
3
Jan
-04
Ma
y-0
4
Se
p-0
4
Jan
-05
Ma
y-0
5
Se
p-0
5
Jan
-06
Ma
y-0
6
Se
p-0
6
Jan
-07
Ma
y-0
7
Se
p-0
7
Jan
-08
Ma
y-0
8
Se
p-0
8
Jan
-09
HY issuance on a monthly basis ($bn)
HY issuance near all time lows!
Source: Datastream, Robert Schiller, FactSet and Morgan Stanley Research
M O R G A N S T A N L E Y R E S E A R C H
March 2009U.S. Equity Strategy
8Jason Todd +1 212 761 7991 (for enquiries or requests please email [email protected])
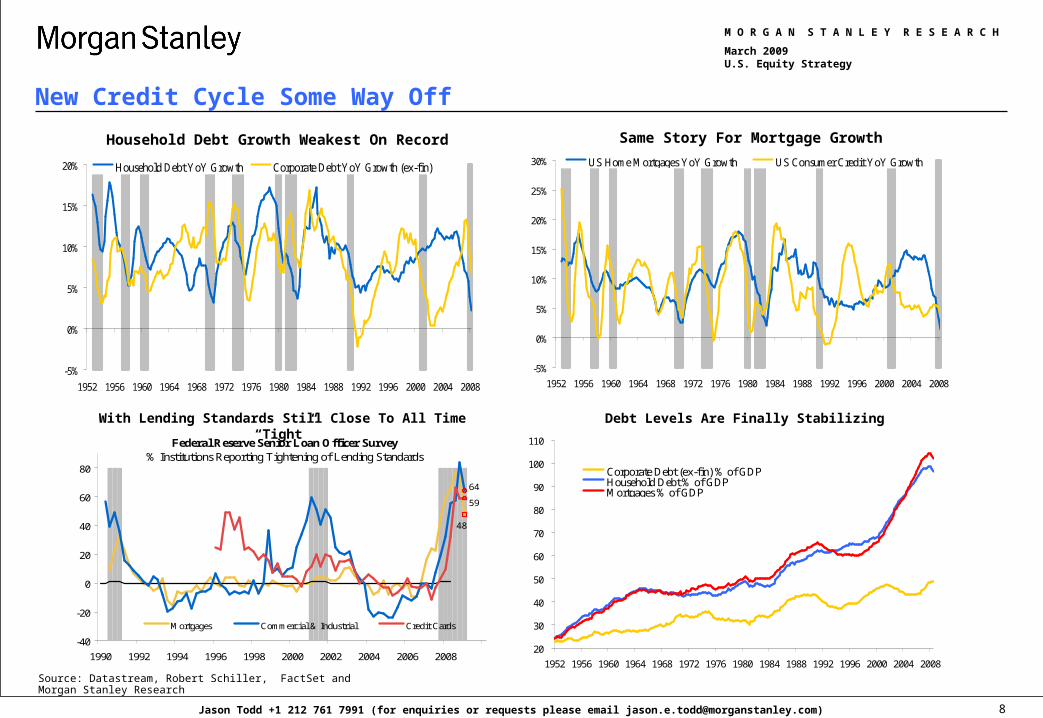
New Credit Cycle Some Way Off
Debt Levels Are Finally Stabilizing
20
30
40
50
60
70
80
90
100
110
1952 1956 1960 1964 1968 1972 1976 1980 1984 1988 1992 1996 2000 2004 2008
Corporate Debt (ex-fin) % of GDPHousehold Debt % of GDPMortgages % of GDP
-5%
0%
5%
10%
15%
20%
1952 1956 1960 1964 1968 1972 1976 1980 1984 1988 1992 1996 2000 2004 2008
Household Debt YoY Growth Corporate Debt YoY Growth (ex-fin)
-5%
0%
5%
10%
15%
20%
25%
30%
1952 1956 1960 1964 1968 1972 1976 1980 1984 1988 1992 1996 2000 2004 2008
US Home Mortgages YoY Growth US Consumer Credit YoY Growth
Household Debt Growth Weakest On Record Same Story For Mortgage Growth
Federal Reserve Senior Loan Officer Survey % Institutions Reporting Tightening of Lending Standards
48
64
59
-40
-20
0
20
40
60
80
1990 1992 1994 1996 1998 2000 2002 2004 2006 2008
Mortgages Commercial & Industrial Credit Cards
With Lending Standards Still Close To All Time “Tight”
Source: Datastream, Robert Schiller, FactSet and Morgan Stanley Research

M O R G A N S T A N L E Y R E S E A R C H
March 2009U.S. Equity Strategy
9Jason Todd +1 212 761 7991 (for enquiries or requests please email [email protected])
US Housing Market – No Sign Of Bottom 3 Years After Peak
House Prices Continue To Fall From Peak…
US Established House Prices
-22
-18
-14
-10
-6
-2
2
6
10
14
18
1988 1992 1996 2000 2004 2008
12M
%
REPEAT SALES*OFHEO PRICES**
* Case-Shiller Index (3MMA) **OFHEO Purchase-Only Index
… With The Futures market pricing in a 30-40% peak to trough decline
100
120
140
160
180
200
220
240
260
280
300
2000 2001 2002 2003 2004 2005 2006 2007 2008 2009 2010 2011 2012
US House Prices & Futures Index
Index Levels Implied by Futures Market
36%
* RPX 28 City Composite & Latest Implied Prices From Futures Contracts
Inventory levels remain high in part due to rising foreclosures
0.8
2.8
4.8
6.8
8.8
10.8
12.8
14.8
16.8
18.8
90 91 92 93 94 95 96 97 98 99 00 01 02 03 04 05 06 07 08 09
Months Supply of New Single Family Houses
Months Supply of Existing Homes
Months Supply of Condos and Coops
Delinquencies still rising…
18.5%
22.1%
3.6%
8.4%
0%
5%
10%
15%
20%
25%
98 99 00 01 02 03 04 05 06 07 08
Subprime FRMs
Subprime ARMs
Prime FRMs
Prime ARMs
MBA Mortgage Delinquencies: % Past Due
Adjustable rate mortgages are most at risk
Source: Datastream, Robert Schiller, FactSet and Morgan Stanley Research

M O R G A N S T A N L E Y R E S E A R C H
March 2009U.S. Equity Strategy
10Jason Todd +1 212 761 7991 (for enquiries or requests please email [email protected])
Breaking the Bear...
3 Ways to Break the Bear Market:
1. Policy Action – QE + Fiscal Policy Support (banks recapitalize and remove toxic assets from balance sheets)
2. Market Trades Lower – Market becomes outright cheap – valuations compensate for poor fundamentals
3. Debt/Deflation Spiral – Japanese Scenario Revisited
Requirements for Sustainable Bottom:
1. Stabilization in House Prices & Inventory Levels (look for lead from Homebuilders)
2. Market moves closer to trough in Earnings – Incl Financials, trough in 3Q09; Excl Financials, Trough in 2Q10
3. Link between Credit and Economy Broken – negative feedback loop from credit markets to economy broken
2Q07 3Q07 4Q07 1Q08 2Q08 3Q08 4Q08 1Q09 2Q09 3Q09 4Q09 1Q10 2Q10
S&P500 S&P500Earnings Earnings
Peak Trough
$92 $27S&P500 S&P500
Ex Fin Ex FinEarnings Earnings
Peak Trough
$73 $42
Down 70%
Down 42%
M O R G A N S T A N L E Y R E S E A R C H
March 2009U.S. Equity Strategy
11Jason Todd +1 212 761 7991 (for enquiries or requests please email [email protected])
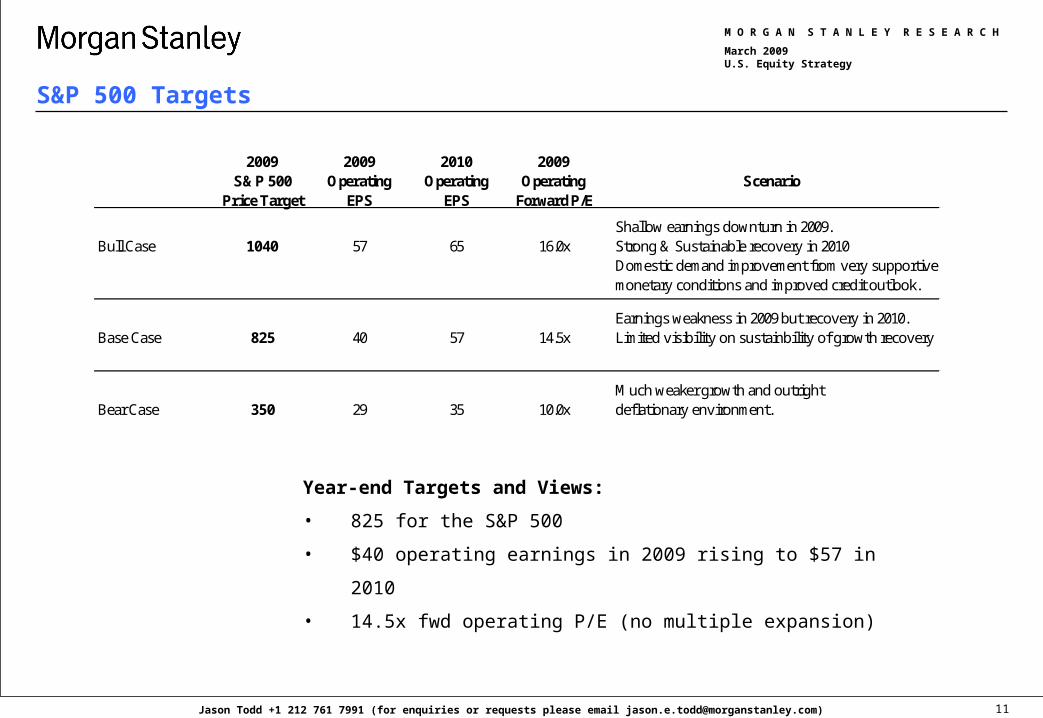
S&P 500 Targets
Year-end Targets and Views:
• 825 for the S&P 500
• $40 operating earnings in 2009 rising to $57 in 2010
• 14.5x fwd operating P/E (no multiple expansion)
2009 2009 2010 2009S&P 500 Operating Operating Operating Scenario
Price Target EPS EPS Forward P/E
Shallow earnings downturn in 2009.Bull Case 1040 57 65 16.0x Strong & Sustainable recovery in 2010
Domestic demand improvement from very supportive monetary conditions and improved credit outlook.
Earnings weakness in 2009 but recovery in 2010.Base Case 825 40 57 14.5x Limited visibility on sustainbility of growth recovery
Much weaker growth and outrightBear Case 350 29 35 10.0x deflationary environment.

M O R G A N S T A N L E Y R E S E A R C H
March 2009U.S. Equity Strategy
12Jason Todd +1 212 761 7991 (for enquiries or requests please email [email protected])
S&P 500 Outlook
Bullish Drivers Risk measures on the rise again (VIX nearing 50)
Massive policy intervention
Valuations discounting earnings recession/corporate cash levels building
Yield curve steepening
Stronger USD
Lower energy and commodity prices
Improved inflation readings
Asset deleveraging in financials has made significant progress
Bearish Drivers Still weak housing
Significant earnings disappointments ahead
– Slowdown in revenue growth
– Margins vulnerable
– Provisioning cycle to intensify
Weakening external demand
Substantial deterioration in labor market conditions
Severe credit crunch still unfolding
Rising risk of protectionist policies

M O R G A N S T A N L E Y R E S E A R C H
March 2009U.S. Equity Strategy
13Jason Todd +1 212 761 7991 (for enquiries or requests please email [email protected])
Earnings – Rising Risk to Optimistic Consensus Estimates
US Trade Weighted Dollar, volatile but Stronger
Source: Haver, Datastream, Factset, Morgan Stanley Research.
4
6
8
10
12
14
16
18
70 73 76 79 82 85 88 91 94 97 00 03 06
After-tax corporate profitsw/ IVA & CCAdj as apercentage of corporate GDP
After-tax corporateprofits as a percentageof corporate GDP
Corporate Profits as a percentage of GDP
10
15
20
25
30
35
40
1975 1978 1981 1984 1987 1990 1993 1996 1999 2002 2005 2008
10
15
20
25
30
35
40% Foreign share of US corporate profits
…A powerful headwind to foreign earnings…
83.1
60
70
80
90
100
110
120
130
140
150
Jan-73 Jan-78 Jan-83 Jan-88 Jan-93 Jan-98 Jan-03 Jan-08
…And profit marginsNegative Earnings Drivers:
Stronger USD
All time high foreign earnings contribution
Slowing non-US growth
Higher funding costs/equity dilution
Rising pension plan requirements
Inventory revaluation drag
Positive Earnings Drivers:
Falling input prices
Limited wage pressures, unit labor costs contained
Steepening yield curve
M O R G A N S T A N L E Y R E S E A R C H
March 2009U.S. Equity Strategy
14Jason Todd +1 212 761 7991 (for enquiries or requests please email [email protected])
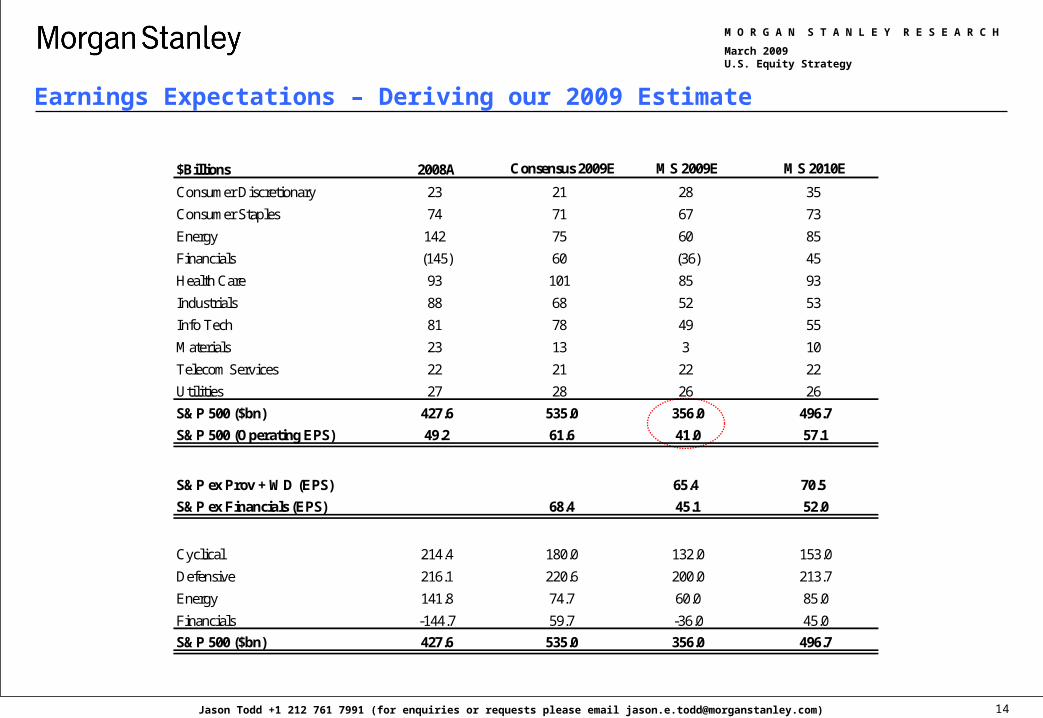
Earnings Expectations – Deriving our 2009 Estimate
$Billions 2008A Consensus 2009E MS 2009E MS 2010E
Consumer Discretionary 23 21 28 35
Consumer Staples 74 71 67 73
Energy 142 75 60 85
Financials (145) 60 (36) 45
Health Care 93 101 85 93
Industrials 88 68 52 53
Info Tech 81 78 49 55
Materials 23 13 3 10
Telecom Services 22 21 22 22
Utilities 27 28 26 26
S&P 500 ($bn) 427.6 535.0 356.0 496.7
S&P 500 (Operating EPS) 49.2 61.6 41.0 57.1
S&P ex Prov + WD (EPS) 65.4 70.5
S&P ex Financials (EPS) 68.4 45.1 52.0
Cyclical 214.4 180.0 132.0 153.0
Defensive 216.1 220.6 200.0 213.7
Energy 141.8 74.7 60.0 85.0
Financials -144.7 59.7 -36.0 45.0
S&P 500 ($bn) 427.6 535.0 356.0 496.7

M O R G A N S T A N L E Y R E S E A R C H
March 2009U.S. Equity Strategy
15Jason Todd +1 212 761 7991 (for enquiries or requests please email [email protected])
2009 Earnings – How Much Downside to Bear Case?
$Billions MS Bear MS Base MS Bull
Consumer Discretionary 12 28 38
Consumer Staples 60 67 73
Energy 50 60 90
Financials (90) (52) 0
Health Care 80 85 95
Industrials 45 52 72
Info Tech 43 49 68
Materials (2) 3 15
Telecom Services 20 22 24
Utilities 24 26 28
S&P 500 ($bn) 242.0 340.0 503.0
S&P 500 (Operating EPS) 27.8 39.1 57.9
Probability 20% 65% 15%
Source: Morgan Stanley Research

M O R G A N S T A N L E Y R E S E A R C H
March 2009U.S. Equity Strategy
16Jason Todd +1 212 761 7991 (for enquiries or requests please email [email protected])
2009-10 Earnings Revisions – A New Record in Progress....
Earnings expectations falling off a cliffRevisions To S&P 500 Consensus Forecasts
10
20
30
40
50
60
70
80
90
100
110
120
130
1985 1987 1989 1991 1993 1995 1997 1999 2001 2003 2005 2007 2009
$ Pe
r S
hare
1994
Based On IBES Consensus Estimates
2008
2007
20062005
2004
2003
20022001
2000
19991998
19961995
19931992199119901989
19871988
1985 1986
1997
2009
2010
Rolling 12 mo Forward EPS
Largest Downgrades on Record
2009 non-financials consensus earnings remain elevated Cyclicals’ earnings have fallen the most on YoY basis*…
-65% -62%-57%
-20% -17%-5%
8% 10%
-100%
-75%
-50%
-25%
0%
25%
S&
P 5
00
Con
s D
isc
Mat
eria
ls
Ene
rgy
Tec
h
Indu
stri
als
Tel
ecom
Con
sS
tapl
es
Hea
lth
Car
e
Uti
liti
es
4Q08 Earnmings YoY%
-45
45
131
60
84
-145
2007
2008e
2009e
2010e
MS
Consensus
Financial Earnings $bn
392
451
601
475
552
572
2007
2008e
2009e
2010e
Non Financial Earnings $bn Earnings
Source: Datastream, FactSet and Morgan Stanley Research

M O R G A N S T A N L E Y R E S E A R C H
March 2009U.S. Equity Strategy
17Jason Todd +1 212 761 7991 (for enquiries or requests please email [email protected])
Earnings vs. Performance – Markets Can Move Ahead of Earnings
Year (t)Earnings Growth
S&P Return(t+1) Earnings
Growth
1908 -12.1 37.4 31.01911 -19.2 0.7 18.61918 -22.7 16.2 -6.11921 -63.8 7.3 137.91927 -10.5 30.9 24.31938 -43.4 25.2 40.61942 -11.2 12.4 -8.71951 -14.1 16.5 -1.61958 -14.2 38.1 17.31970 -10.9 0.1 12.41975 -11.5 31.5 24.71982 -16.2 14.8 12.01991 -14.8 26.3 8.1
Average -20.3 19.8 23.9
…But equity performance leads earnings growth
Instances of >10% EPS decline and Positive S&P Returns
-50%
-40%
-30%
-20%
-10%
0%
10%
20%
30%
40%
50%
1985 1987 1989 1991 1993 1995 1997 1999 2001 2003 2005 2007 2009
S&P 500 %YoY Chg vs %Chg in 12mo Forward Estimates
Grey shading represents US Recession
S&P 500
12mo Forward Estimate
s2/28/09-31.6%
1/31/87, -18.5%
12/31/01-25.2%
12/31/91, -25.0%
-35%
-30%
-25%
-20%
-15%
-10%
-5%
0%
5%
10%
15%
1985 1987 1989 1991 1993 1995 1997 1999 2001 2003 2005 2007 2009
S&P 500 Rolling Earnings Surprise %12mo Forward Estimates vs. Actuals
Grey shading represents US Recession
Under-estimate Earnings
Over-estimate Earnings Growth
Earnings down 32% on estimates made 12 months ago....
Source: Datastream, Robert Schiller, FactSet and Morgan Stanley Research
YearEarnings Growth
S&P Price Return
YearEarnings Growth
S&P Price Return
1956 -5.8 2.6 2007 -2.4 3.51957 -1.2 -14.3 2008E -40.6 -38.51958 -14.2 38.1 2009E -18.5 ?1959 17.3 8.5
Earnings ConsecutiveDecline Yrs of -ve EPS 'g'
1917-1921 -81% 51930-1932 -75% 31956-1958 -20% 32007-2009 -55% ? 3 ?

M O R G A N S T A N L E Y R E S E A R C H
March 2009U.S. Equity Strategy
18Jason Todd +1 212 761 7991 (for enquiries or requests please email [email protected])
Source: Morgan Stanley Research
Yield Curve Positive for Growth and Financials
Yield Curve: Fed Funds less UST 10 Year Yield
-4
-3
-2
-1
0
1
2
3
4
5
6
7
1960 1963 1966 1969 1972 1975 1978 1981 1984 1987 1990 1993 1996 1999 2002 2005 2008
NBER-Dated Recessions Fed Funds Rate Target Less 10-Year Treasury Yield average
Inverted Curve Indicates that Fed Policy is Tight
Upward-Sloping Yield Curve Indicates that Fed Policy is Accomodative
LR Average = -0.88

M O R G A N S T A N L E Y R E S E A R C H
March 2009U.S. Equity Strategy
19Jason Todd +1 212 761 7991 (for enquiries or requests please email [email protected])
Financial Sector Scorecard
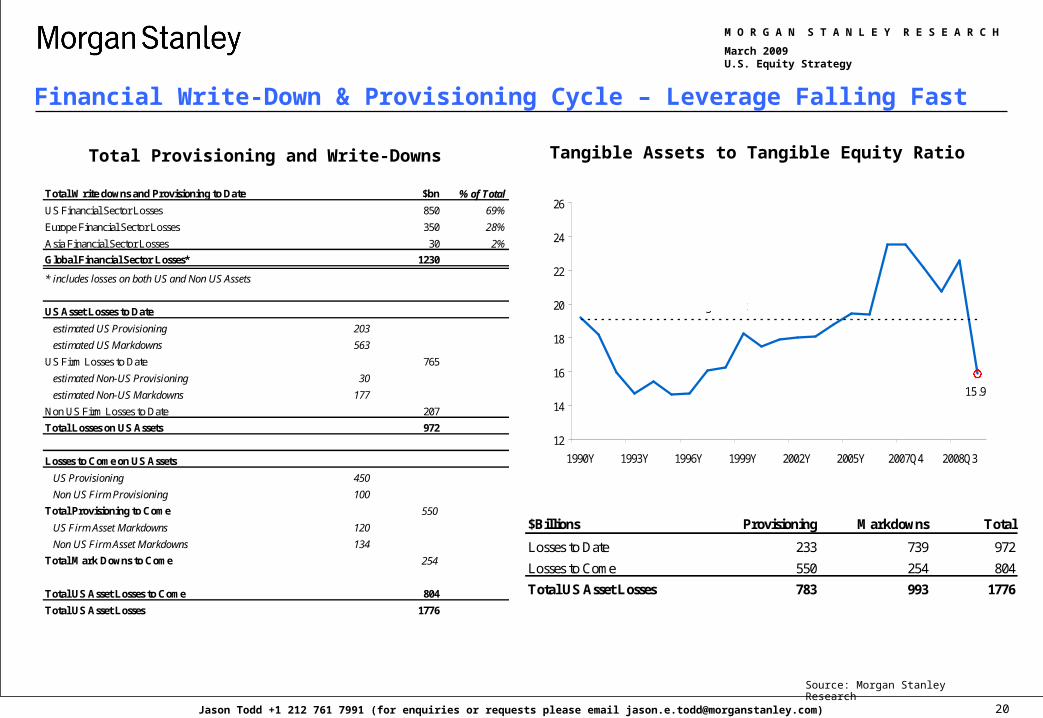
1. Provisioning and markdowns - 60% through the cycle, with listed and unlisted financials globally writing down $1200bn. Final cumulative loss estimate of $1.8tn, split evenly between markdowns and provisioning.
2. Earnings – S&P Financials posted a loss of -$145bn in 2008 and will likely post a further loss of -$36bn in 2009 (peak pre-tax, pre-provisioning earnings were $340bn).
3. Sustainable earnings – Sustainable ROE of 12% (versus 18% historically) on a book value of around $1.2tn. Alternatively, 1% ROA on 15x Tangible Assets/Tangible Equity (TA/TE) ratio ($12tn of assets).
4. Valuation – Using an implied ROE of 12%, S&P 500 Financial sector on a sustainable P/E of 3.9x. Using a 1% sustainable ROA we estimate that our selection of Financial stocks are trading on a P/E of 4.5x.
5. Deleveraging – Progress is slow due to difficult asset markets and poor pricing transparency. TA/TE down from 24x to 16x for the bulk of BKX members, already well below the long-term average of 19x.
M O R G A N S T A N L E Y R E S E A R C H
March 2009U.S. Equity Strategy
20Jason Todd +1 212 761 7991 (for enquiries or requests please email [email protected])
Financial Write-Down & Provisioning Cycle – Leverage Falling Fast
Total Provisioning and Write-Downs
Source: Morgan Stanley Research
Tangible Assets to Tangible Equity Ratio
15.9
12
14
16
18
20
22
24
26
1990Y 1993Y 1996Y 1999Y 2002Y 2005Y 2007Q4 2008Q3
15 Year Average = 19x
$bn % of Total
US Financial Sector Losses 850 69%
Europe Financial Sector Losses 350 28%
Asia Financial Sector Losses 30 2%
Global Financial Sector Losses* 1230
* includes losses on both US and Non US Assets
US Asset Losses to Date
estimated US Provisioning 203
estimated US Markdowns 563
US Firm Losses to Date 765
estimated Non-US Provisioning 30
estimated Non-US Markdowns 177
Non US Firm Losses to Date 207
Total Losses on US Assets 972
Losses to Come on US Assets
US Provisioning 450
Non US Firm Provisioning 100
Total Provisioning to Come 550
US Firm Asset Markdowns 120
Non US Firm Asset Markdowns 134
Total Mark Downs to Come 254
Total US Asset Losses to Come 804
Total US Asset Losses 1776
Total Write downs and Provisioning to Date
$Billions Provisioning Markdowns Total
Losses to Date 233 739 972
Losses to Come 550 254 804
Total US Asset Losses 783 993 1776

M O R G A N S T A N L E Y R E S E A R C H
March 2009U.S. Equity Strategy
21Jason Todd +1 212 761 7991 (for enquiries or requests please email [email protected])
Source: Morgan Stanley Research
Drivers of Delinquency Cycle – Claims & Capacity Utilization
Capacity Utilization a Good Indicator of C&I DelinquenciesClaims and Residential Mortgage Delinquencies Closely Correlated
-10%
-8%
-6%
-4%
-2%
0%
2%
4%
6%Q2 1988 Q2 1990 Q2 1992 Q2 1994 Q2 1996 Q2 1998 Q2 2000 Q2 2002 Q2 2004 Q2 2006 Q2 2008
-60%
-40%
-20%
0%
20%
40%
60%
80%
100%US capacity utilisation - All industry sadj(inverted yoy%) (LH)
US Delinquency Rates - Commercial andIndustrial Loans (yoy%)
-30%
-20%
-10%
0%
10%
20%
30%
40%
50%
60%
Q2 1984 Q2 1987 Q2 1990 Q2 1993 Q2 1996 Q2 1999 Q2 2002 Q2 2005 Q2 2008-15%
-10%
-5%
0%
5%
10%
15%
20%
25%
30%
35%US Initial claims for unemployment insurance (%yoy, sadj)US residential mortgage delinquencies (% of loans, %yoy, sadj, RHS)

M O R G A N S T A N L E Y R E S E A R C H
March 2009U.S. Equity Strategy
22Jason Todd +1 212 761 7991 (for enquiries or requests please email [email protected])
Valuation – Equities Not Yet Cheap
Markets Have More Than Halved In The Current Bear Market
Decline from peak*
-60-68
-81
-63
-100
-90
-80
-70
-60
-50
-40
-30
-20
-10
0
1870
1880
1890
1900
1910
1920
1930
1940
1950
1960
1970
1980
1990
2000
2010
%
* Decline from inflation-adjusted peak for S&P 500. Calculated from monthly data that may under-state the exact peak
…But Valuations Haven’t Yet Reached “Cheap” Territory
S&P Trough-the-Cycle PE Ratio*
4.9 5.5 6.8
46.1
12.9
0
5
10
15
20
25
30
35
40
45
50
1880
1890
1900
1910
1920
1930
1940
1950
1960
1970
1980
1990
2000
2010
PE R
atio
* Graham-Dodd Price-Earnings, based on 10Yr real average earnings
Long Term Average: 16.4
12M Trailing PE
S&P 500 ROE Multiple Expansion to be driven by Declining Inflation
12.6
13.8
18.317.2 17.1
15.4 15.2
9.610.8
8.49.0
8.1
0
2
4
6
8
10
12
14
16
18
20
<0% 0-1% 1-2% 2-3% 3-4% 4-5% 5-6% 6-7% 7-8% 8-9% 9-10% >10%
Level of Y/Y Headline CPI Inflation
Med
ian
S&
P 5
00 L
TM
P/E
S&P 500's Median Trailing P/E Multiple in Different Inflation Environments, Apr '53 to Dec '08
Key Inflection PointsSweet Spot
Source: FactSet and Morgan Stanley Research
11.4%
13.0%
2%
6%
10%
14%
18%
22%
1970 1974 1978 1982 1986 1990 1994 1998 2002 2006
S&P 500 S&P 500 (Ex-Financials)
M O R G A N S T A N L E Y R E S E A R C H
March 2009U.S. Equity Strategy
23Jason Todd +1 212 761 7991 (for enquiries or requests please email [email protected])
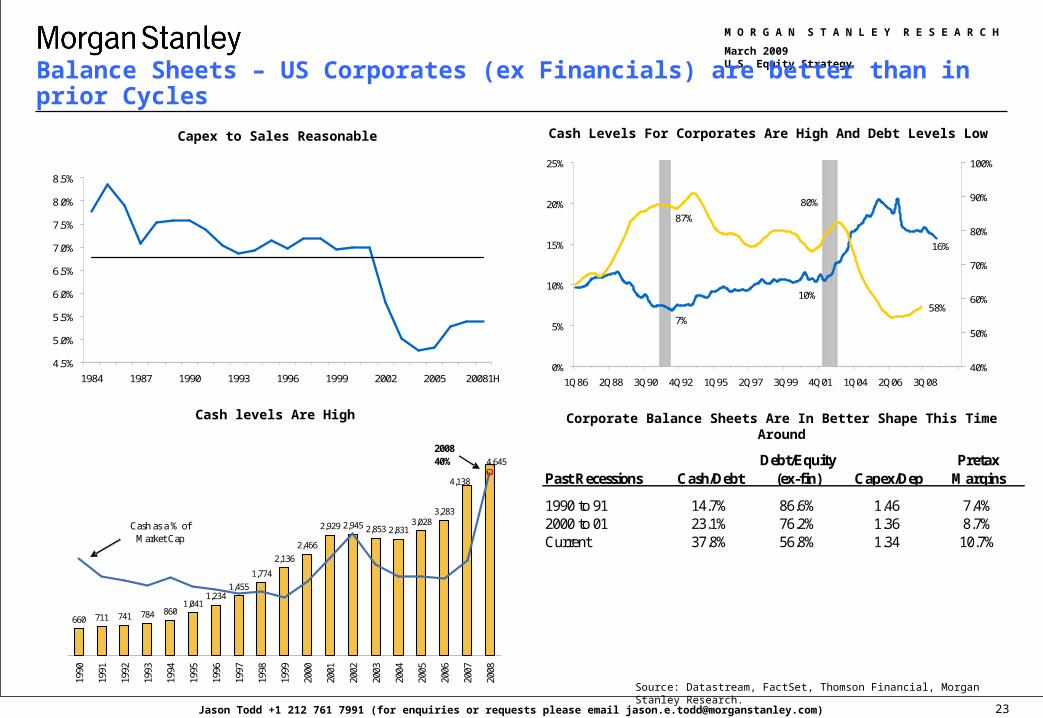
Capex to Sales Reasonable
Balance Sheets – US Corporates (ex Financials) are better than in prior Cycles
Source: Datastream, FactSet, Thomson Financial, Morgan Stanley Research.
4.5%
5.0%
5.5%
6.0%
6.5%
7.0%
7.5%
8.0%
8.5%
1984 1987 1990 1993 1996 1999 2002 2005 20081H
Capex to Sales - S&P 500
Average = 6.8
Past Recessions Cash/DebtDebt/Equity
(ex-fin) Capex/DepPretax
Margins
1990 to 91 14.7% 86.6% 1.46 7.4%2000 to 01 23.1% 76.2% 1.36 8.7%Current 37.8% 56.8% 1.34 10.7%
Corporate Balance Sheets Are In Better Shape This Time Around
16%
7%
10%58%
87%
80%
0%
5%
10%
15%
20%
25%
1Q86 2Q88 3Q90 4Q92 1Q95 2Q97 3Q99 4Q01 1Q04 2Q06 3Q08
40%
50%
60%
70%
80%
90%
100%Cash to Total Capital Employed (ex Fin)
Debt to Equity (ex Fin) - rhs
Cash Levels For Corporates Are High And Debt Levels Low
Cash levels Are High
660 711 741 784 8601,041
1,2341,455
1,774
2,136
2,466
2,929 2,945 2,853 2,8313,028
3,283
4,645
4,138
200840%
1990
1991
1992
1993
1994
1995
1996
1997
1998
1999
2000
2001
2002
2003
2004
2005
2006
2007
2008
Cash as a % of Market Cap
US-Based Cash as percentage of Market Cap
Market cap includes total market cap of NYSE, Amex and NASDAQ (World Federation of Exchanges)-updated till Nov 08; Cash in $ bn includes MMF assets, S&P 500, ex fin cash and cash with equity MFs

M O R G A N S T A N L E Y R E S E A R C H
March 2009U.S. Equity Strategy
24Jason Todd +1 212 761 7991 (for enquiries or requests please email [email protected])
Recession Analysis – How does 2008 Compare?
Acknowledgement Capitulation Full Impact Recovery
S&P 500 Peak
Start of Recession
S&P 500 Trough
End of Recession
Recession Duration (months)
Peak to Start of
Recession (months)
Peak to Start of Recession
(%)
Start of Recession to
Trough (months)
Start of Recession to Trough (%)
Peak to Trough
(months)
Peak to Trough
(%)
Trough to End of
Recession (%)
1/5/53 7/31/53 9/14/53 5/28/54 10 7 -7.1% 2 -8.2% 8 -14.8% 28.5%
7/15/57 8/30/57 10/22/57 4/30/58 8 2 -8.0% 2 -13.8% 3 -20.7% 11.4%
1/5/60 4/29/60 10/25/60 2/28/61 10 4 -10.0% 6 -3.8% 10 -13.4% 21.3%
5/16/69 12/31/69 5/26/70 11/30/70 11 8 -13.1% 5 -24.7% 13 -34.6% 25.8%
1/11/73 10/31/73 10/4/74 3/31/75 17 10 -9.9% 11 -42.4% 21 -48.2% 33.7%
2/13/80 1/31/80 3/27/80 7/31/80 6 -3.6% 2 -14.0% 1 -17.1% 23.9%
11/28/80 7/31/81 8/12/82 11/30/82 16 8 -6.8% 13 -21.8% 21 -27.1% 35.3%
7/17/90 7/31/90 10/11/90 3/28/91 8 0.5 -3.1% 2 -17.0% 3 -19.6% 27.0%
3/27/00 3/30/01 9/21/01 11/30/01 8 12 -23.9% 6 -16.8% 18 -36.6% 18.0%
10/9/07 12/3/07 11/20/08 2 -5.9% 12 -48.9% 14 -51.9%
Average 11 6 -9.1% 6 -21.1% 11 -28.4% 25.0%
Median 10 7 -7.5% 5 -16.9% 11 -23.9% 25.8%
ROE Corporate profits/GDP S&P 500 Peak to Trough
ROE Peak ROE Trough Peak Trough Peak TroughDuration (Months) ROE Decline
Profit Margin Decline
Sep-57 Sep-58 13.2% 9.8% 10.9% 8.8% 12 -3.4% -2.1%Sep-59 Jun-61 11.2% 9.0% 10.6% 9.0% 21 -2.2% -1.6%Sep-69 Dec-70 11.7% 9.8% 9.1% 7.4% 15 -2.0% -1.7%Sep-74 Dec-75 14.6% 11.2% 11.5% 8.9% 15 -3.4% -2.6%Feb-80 Sep-80 16.4% 14.7% 11.5% 9.5% 7 -1.7% -2.0%Jun-81 Mar-83 14.6% 11.0% 8.3% 6.5% 21 -3.7% -1.8%Aug-90 Dec-91 13.4% 10.6% 8.3% 8.1% 16 -2.8% -0.2%Aug-00 Mar-02 19.9% 13.0% 8.8% 7.8% 19 -6.9% -0.9%Apr-07 Dec-08 18.1% 13.6% 17.8% 14.0% 20 -4.4% -3.8%
Average 14.4% 11.1% 9.9% 8.3% 16 -3.3% -1.6%Median 14.0% 10.8% 9.9% 8.5% 16 -3.1% -1.8%
Source: FactSet and Morgan Stanley Research
M O R G A N S T A N L E Y R E S E A R C H
March 2009U.S. Equity Strategy
25Jason Todd +1 212 761 7991 (for enquiries or requests please email [email protected])
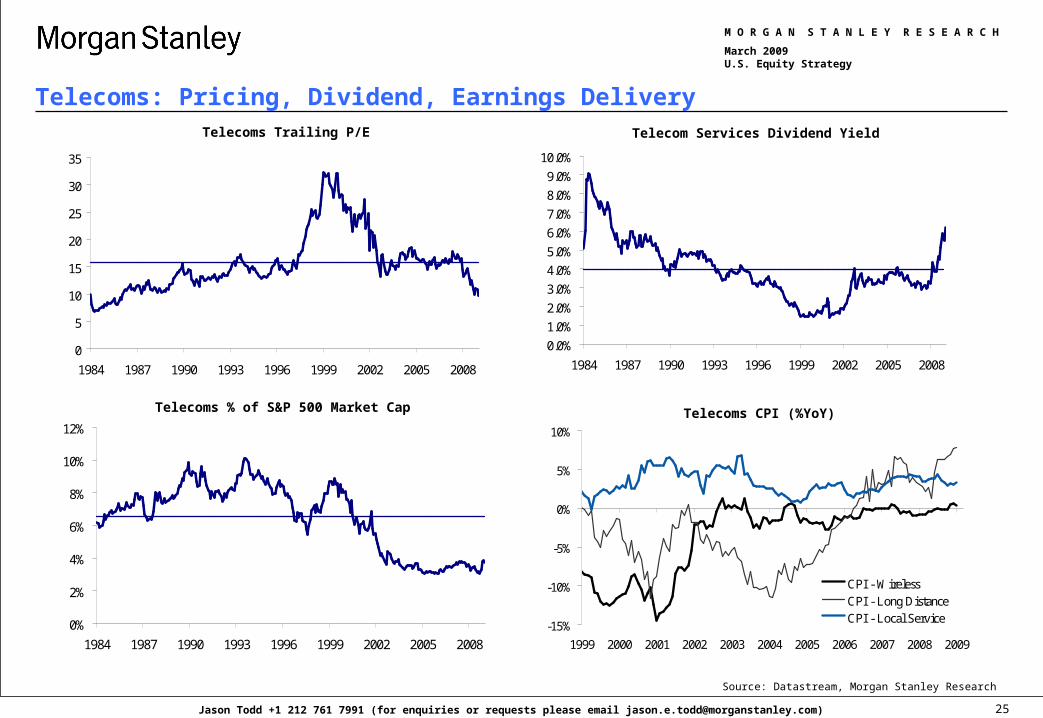
Telecoms: Pricing, Dividend, Earnings Delivery
0
5
10
15
20
25
30
35
1984 1987 1990 1993 1996 1999 2002 2005 2008
-15%
-10%
-5%
0%
5%
10%
1999 2000 2001 2002 2003 2004 2005 2006 2007 2008 2009
CPI - Wireless
CPI - Long Distance
CPI - Local Service
0.0%
1.0%
2.0%
3.0%
4.0%
5.0%
6.0%
7.0%
8.0%
9.0%
10.0%
1984 1987 1990 1993 1996 1999 2002 2005 2008
Telecom Services Dividend Yield
0%
2%
4%
6%
8%
10%
12%
1984 1987 1990 1993 1996 1999 2002 2005 2008
Telecoms % of S&P 500 Market Cap
Telecoms Trailing P/E
Telecoms CPI (%YoY)
Source: Datastream, Morgan Stanley Research

M O R G A N S T A N L E Y R E S E A R C H
March 2009U.S. Equity Strategy
26Jason Todd +1 212 761 7991 (for enquiries or requests please email [email protected])
Healthcare – Dividend + Earnings Delivery
Healthcare Relative Trailing P/E
0.7
0.8
0.9
1.0
1.1
1.2
1.3
1.4
1.5
1.6
1984 1987 1990 1993 1996 1999 2002 2005 2008
New relative multiple range
(patent, price, pipeline risk)
Ave 1984-2001 = 1.4xAve 2002-2008 = 1.1x
-0.6
-0.4
-0.2
0
0.2
0.4
0.6
Jan-77 Jan-80 Jan-83 Jan-86 Jan-89 Jan-92 Jan-95 Jan-98 Jan-01 Jan-04 Jan-07
-40%
-30%
-20%
-10%
0%
10%
20%
30%
40%
50%
Relative EPS Relative performance (RHS)
US DS Pharamceuticals Relative EPS vs Relative performance
0.0
1.0
2.0
3.0
4.0
5.0
6.0
7.0
Jan-73 Jan-77 Jan-81 Jan-85 Jan-89 Jan-93 Jan-97 Jan-01 Jan-05
Rising DY corresponds
with falling LTG
Pharma
S&P 500
Dividend Yield - S&P 500 vs. US Pharma
Source: Morgan Stanley Research
Earnings certainty, attractive and safe dividend/buyback yield and decade low valuations;
Downside risks well recognized and priced (patent cliff) with upside risk (product pipeline expectations, restructuring) underappreciated;

M O R G A N S T A N L E Y R E S E A R C H
March 2009U.S. Equity Strategy
27Jason Todd +1 212 761 7991 (for enquiries or requests please email [email protected])
Global Construction Activity Rapidly Deteriorating
Global Construction Activity Rapidly Deteriorating(%)
%YoY11 Year Low
(%)11 year High
(%)Current (%)
Australia -5.8 24.7 12.1
Brazil -2.1 23.1 16.3
China 10.2 25.7 12.4
France -2.5 13.8 11.0
Germany -6.3 8.5 7.7
India 8.2 27.9 24.5
Japan -7.3 1.3 -7.3
Spain -0.7 16.6 -0.7
UK 0.0 12.5 0.0
US -8.6 11.1 -8.6
Composite 3.3 11.0 3.3
Global Construction Composite
0%
2%
4%
6%
8%
10%
12%
1996 1998 2000 2002 2004 2006 2008 2010
-40%
-30%
-20%
-10%
0%
10%
20%
30%
40%
50%
Jan-74 Jan-78 Jan-82 Jan-86 Jan-90 Jan-94 Jan-98 Jan-02 Jan-06
%YoY Industrials Earnings
Source: FactSet and Morgan Stanley Research

M O R G A N S T A N L E Y R E S E A R C H
March 2009U.S. Equity Strategy
28Jason Todd +1 212 761 7991 (for enquiries or requests please email [email protected])
• The top 15 US industrial companies get 66% of revenues from the US
• Even excluding the rails, the percentage of revenues from the US is around 60%
• Most of the US exposure is concentrated in construction, transportation equipment and industrial equipment, all vulnerable to the unfolding US recession
•Biggest threat is current global financial market conditions and rising cost of funding, causing EM project related spending to slow. Project cancellation has already increased exponentially
Industrial Earnings Trough after Recession, but They Always Decline...
-40%
-30%
-20%
-10%
0%
10%
20%
30%
40%
50%
Jan-74 Jan-78 Jan-82 Jan-86 Jan-90 Jan-94 Jan-98 Jan-02 Jan-06
%YoY Industrials Earnings
-10%
-5%
0%
5%
10%
15%
Oct-95 Oct-97 Oct-99 Oct-01 Oct-03 Oct-05 Oct-07
-10%
-5%
0%
5%
10%
15%
20%
China IP YoY India IP YoY
Brazil IP YoY Russia IP YoY
%YoY Industrial Production Growth (6 mo. avg)
Source: Datastream, FactSet and Morgan Stanley Research
M O R G A N S T A N L E Y R E S E A R C H
March 2009U.S. Equity Strategy
29Jason Todd +1 212 761 7991 (for enquiries or requests please email [email protected])
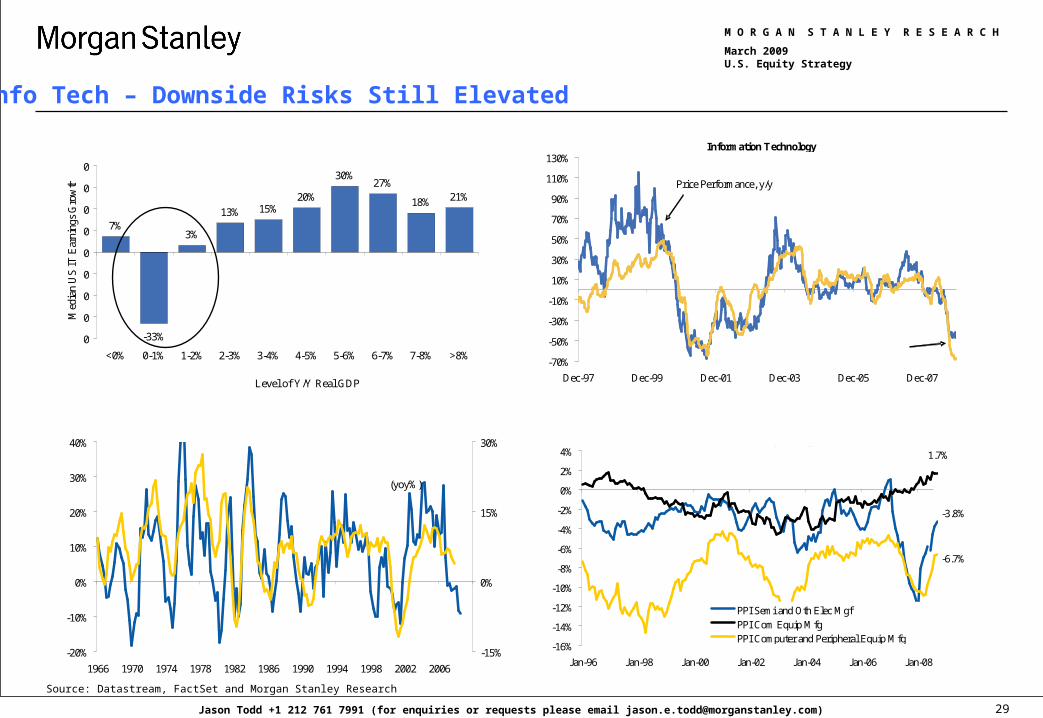
Info Tech – Downside Risks Still Elevated
-70%
-50%
-30%
-10%
10%
30%
50%
70%
90%
110%
130%
Dec-97 Dec-99 Dec-01 Dec-03 Dec-05 Dec-07
Three Month Earnings Revision Factor
[(#Up - #Down) / Total # Estimates]
Price Performance, y/y
Information Technology
7%
-33%
3%
13% 15%20%
30%27%
18% 21%
0
0
0
0
0
0
0
0
0
<0% 0-1% 1-2% 2-3% 3-4% 4-5% 5-6% 6-7% 7-8% >8%
Level of Y/Y Real GDP
Med
ian
US
IT
Ear
ning
s G
row
th
US IT Earnings Growth During Different GDP Growth Environments
2008/2009 GDP Growth Range
-20%
-10%
0%
10%
20%
30%
40%
1966 1970 1974 1978 1982 1986 1990 1994 1998 2002 2006
-15%
0%
15%
30%US corporate
profits (yoy%)
US nom business fixed investment (yoy% 3qtr lag)
US Profits vs IT Capex Growth
-3.8%
1.7%
-6.7%
-16%
-14%
-12%
-10%
-8%
-6%
-4%
-2%
0%
2%
4%
Jan-96 Jan-98 Jan-00 Jan-02 Jan-04 Jan-06 Jan-08
PPI Semi and Oth Elec Mgf PPI Com Equip MfgPPI Computer and Peripheral Equip Mfg
Tech Sector PPI (%YoY)
Source: Datastream, FactSet and Morgan Stanley Research
M O R G A N S T A N L E Y R E S E A R C H
March 2009U.S. Equity Strategy
30Jason Todd +1 212 761 7991 (for enquiries or requests please email [email protected])
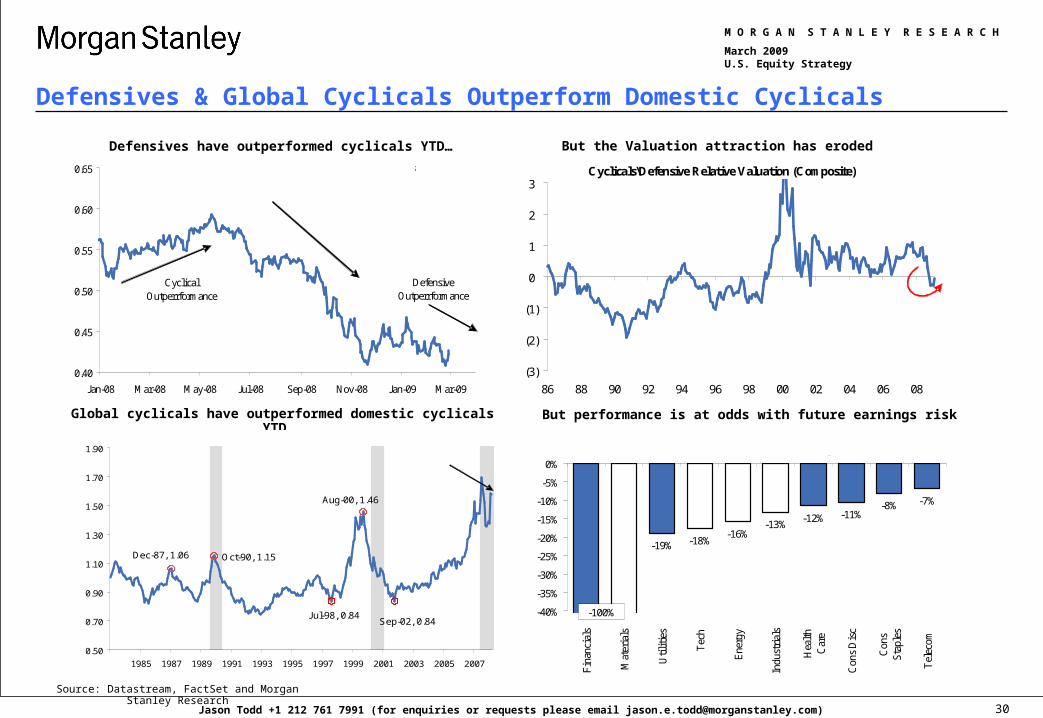
Defensives & Global Cyclicals Outperform Domestic Cyclicals
Defensives have outperformed cyclicals YTD… But the Valuation attraction has eroded
0.40
0.45
0.50
0.55
0.60
0.65
Jan-08 Mar-08 May-08 Jul-08 Sep-08 Nov-08 Jan-09 Mar-09
Performance of US Cyclicals relative to US Defensives
Defensive Outperformance
Cyclical Outperrformance
DefensiveOutperrformance
Global cyclicals have outperformed domestic cyclicals YTD..
-19% -18%-16%
-13%-12% -11%
-8% -7%
-40%
-35%
-30%
-25%
-20%
-15%
-10%
-5%
0%
Fin
anci
als
Mat
eria
ls
Uti
liti
es
Tec
h
Ene
rgy
Indu
stri
als
Hea
lth
Car
e
Con
s D
isc
Con
sS
tapl
es
Tel
ecom
% Difference MS vs. Consensus 2009 Earnings Estimates
-100%
Aug-00, 1.46
Dec-87, 1.06 Oct-90, 1.15
Sep-02, 0.84Jul-98, 0.84
0.50
0.70
0.90
1.10
1.30
1.50
1.70
1.90
1985 1987 1989 1991 1993 1995 1997 1999 2001 2003 2005 2007
Grey shading represents US recession
Head Fake?
But performance is at odds with future earnings risk
Cyclicals\Defensive Relative Valuation (Composite)
(3)
(2)
(1)
0
1
2
3
86 88 90 92 94 96 98 00 02 04 06 08
Cyclicals Relatively Attractive
Defensives Relatively Attractive
Composite Indicator is an average of relative p/sales, p/e, and p/book z-scores.
Source: Datastream, FactSet and Morgan Stanley Research
M O R G A N S T A N L E Y R E S E A R C H
March 2009U.S. Equity Strategy
31Jason Todd +1 212 761 7991 (for enquiries or requests please email [email protected])
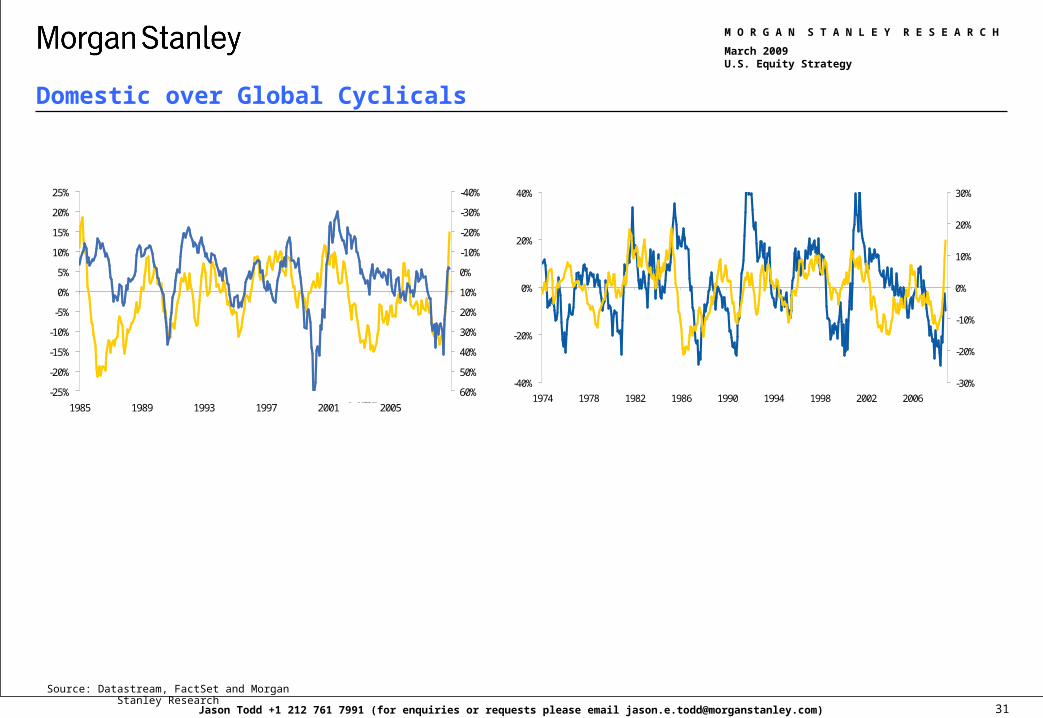
Domestic over Global Cyclicals
-40%
-20%
0%
20%
40%
1974 1978 1982 1986 1990 1994 1998 2002 2006
-30%
-20%
-10%
0%
10%
20%
30%
US Banks vs SPX
TWD %YoY (rhs)
US Bank Relative to SPX vs TWD
-25%
-20%
-15%
-10%
-5%
0%
5%
10%
15%
20%
25%
1985 1989 1993 1997 2001 2005
-40%
-30%
-20%
-10%
0%
10%
20%
30%
40%
50%
60%
Global Cyclicals Relative to US Domestic Cyclicals vs TWD
Trade-Weighted Dollar
Source: Datastream, FactSet and Morgan Stanley Research
M O R G A N S T A N L E Y R E S E A R C H
March 2009U.S. Equity Strategy
32Jason Todd +1 212 761 7991 (for enquiries or requests please email [email protected])
Strongest Consensus Calls
1. Economy weak in 1H09 but recovers in 2H09
2. The US is not Japan
3. Global decoupling is Dead
4. Underweight US Treasuries
5. Equities will end 2009 modestly higher after a 1H09 sell down
6. Buy Corporate Bonds
M O R G A N S T A N L E Y R E S E A R C H
March 2009U.S. Equity Strategy
33Jason Todd +1 212 761 7991 (for enquiries or requests please email [email protected])
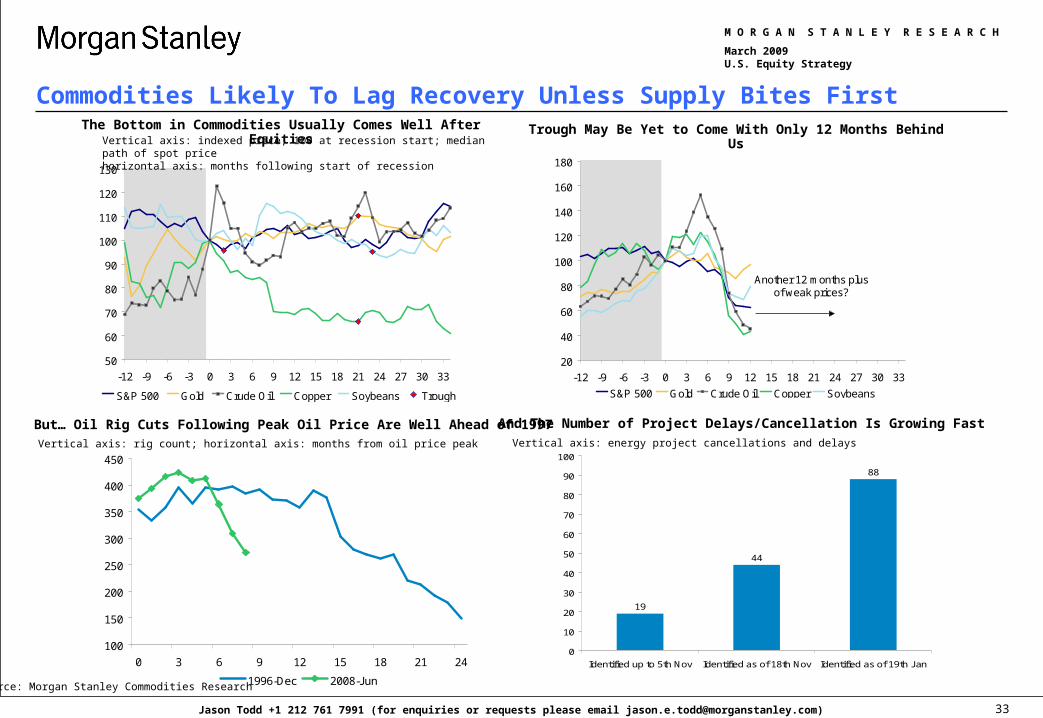
Commodities Likely To Lag Recovery Unless Supply Bites First
50
60
70
80
90
100
110
120
130
-12 -9 -6 -3 0 3 6 9 12 15 18 21 24 27 30 33
S&P 500 Gold Crude Oil Copper Soybeans Trough
20
40
60
80
100
120
140
160
180
-12 -9 -6 -3 0 3 6 9 12 15 18 21 24 27 30 33
S&P 500 Gold Crude Oil Copper Soybeans
Another 12 months plus of weak prices?
The Bottom in Commodities Usually Comes Well After Equities Trough May Be Yet to Come With Only 12 Months Behind Us
100
150
200
250
300
350
400
450
0 3 6 9 12 15 18 21 24
1996-Dec 2008-Jun
But… Oil Rig Cuts Following Peak Oil Price Are Well Ahead of 1997Vertical axis: rig count; horizontal axis: months from oil price peak
And The Number of Project Delays/Cancellation Is Growing Fast
19
44
88
0
10
20
30
40
50
60
70
80
90
100
Identified up to 5th Nov Identified as of 18th Nov Identified as of 19th Jan
Vertical axis: energy project cancellations and delays
Vertical axis: indexed price, 100 at recession start; median path of spot pricehorizontal axis: months following start of recession
Source: Morgan Stanley Commodities Research

M O R G A N S T A N L E Y R E S E A R C H
March 2009U.S. Equity Strategy
34Jason Todd +1 212 761 7991 (for enquiries or requests please email [email protected])
Core US Equity PortfolioMarket Ann. Weight Performance Price
Price MS Value Div 2009e MS Rec vs from Date atTicker Name Industry Group/ Industry 3/12/2009 Rating ($ Mil) Yield P/E Weight S&P 500 Inclusion % Added Inclusion
S&P 500 Index 750.74 100.0 0.0
Consumer Discretionary 141.53 11.0 2.6 -41.9NKE Nike Inc. (Cl B) Consumer Durables & Apparel 44.59 NC 17,039 2.24 9.08 3.5 -27.8 1/4/08 61.74MCD McDonald's Corp. Consumer Services 52.17 O / I 56,875 3.83 13.35 3.5 -8.6 1/4/08 57.05LOW Lowe's Cos. Retailing 15.61 O / I 22,132 2.18 14.46 2.0 -30.1 12/5/08 22.34COH Coach Inc. Consumer Durables & Apparel 14.46 O / C 4,574 0.00 7.65 2.0 -49.3 9/18/08 28.52
Consumer Staples 209.09 14.5 1.5 -28.6MO Altria Group Inc. Food Beverage & Tobacco 16.30 E / A 33,770 7.85 9.39 3.0 -29.4 1/4/08 23.10PM Philip Morris Int Food Beverage & Tobacco 34.64 O / A 68,075 6.24 11.88 3.5 -32.2 3/28/08 51.06KR Kroger Co. Food & Staples Retailing 21.30 O / A 13,585 1.69 10.30 2.5 -22.3 12/5/08 27.42WMT Wal-Mart Stores Inc. Food & Staples Retailing 48.94 O / I 106,114 1.94 8.15 3.0 -1.4 2/6/09 49.63CL Colgate-Palmolive Household & Personal Products 56.51 NC 28,456 2.83 13.34 2.5 -28.3 1/4/08 78.78
Energy 332.48 11.0 -2.7 -44.0CVX Chevron Corp. Oil Gas & Consumable Fuels 63.40 NC 124,386 4.10 12.52 3.0 -14.8 12/5/08 74.42MRO Marathon Oil Corp. Oil Gas & Consumable Fuels 23.57 NC 15,939 4.07 8.31 2.0 -55.9 5/19/08 53.44COP ConocoPhillips Oil Gas & Consumable Fuels 37.39 NC 56,621 5.03 10.19 3.0 -56.3 1/4/08 85.56VLO Valero Energy Corp. Oil Gas & Consumable Fuels 17.58 NC 8,808 3.41 5.79 3.0 -72.6 1/4/08 64.14
Financials 109.07 9.5 -0.9 -70.4BK Bank of New York Mellon Diversified Financials 24.66 O / I 25,855 3.89 8.17 1.5 -44.4 5/7/08 44.37STT State Street Corp. Diversified Financials 23.85 O / I 9,486 4.03 7.39 1.5 -70.9 1/4/08 81.82JPM JPMorgan Chase & Co. Diversified Financials 23.20 O / I 76,140 6.55 11.27 2.0 -37.5 6/11/08 37.13WFC Wells Fargo & Co. Banks 13.95 O / I 50,133 9.75 12.93 1.5 -48.9 11/12/08 27.30MET MetLife Inc. Insurance 17.30 O / I 12,118 4.28 4.16 1.5 -71.7 5/7/08 61.10CB Chubb Corp. Insurance 37.13 NC 12,684 3.56 6.91 1.5 -28.4 12/5/08 51.85
Health Care 270.89 18.7 3.2 -33.0BDX Becton Dickinson Health Care Equip & Srvs 63.95 O / A 14,969 2.06 12.65 2.5 -27.1 1/4/08 87.76AET Aetna Inc. Health Care Equip & Srvs 23.42 NC 9,881 0.17 5.58 1.5 -58.2 1/4/08 55.97AMGN Amgen Inc. Biotechnology 50.27 O / I 50,084 0.00 10.55 3.0 -16.9 7/26/08 60.48ABT Abbott Laboratories Pharmaceuticals 46.65 O / A 68,999 3.09 12.07 3.0 -16.4 1/4/08 55.79JNJ Johnson & Johnson Pharmaceuticals 49.00 O / A 132,902 3.76 10.78 2.5 -25.6 1/4/08 65.84BMY Bristol-Myers Squibb Co. Pharmaceuticals 20.78 NC 41,124 5.97 10.76 2.5 -6.5 7/18/08 22.23TEVA Teva Pharmaceutical Pharmaceuticals 44.30 E / A 34,465 1.17 15.05 1.7 -7.4 1/4/08 47.83WYE Wyeth Pharmaceuticals 42.78 NC 56,964 2.81 11.82 2.0 25.1 12/8/08 34.20
Industrials 150.89 8.0 -1.7 -55.8DHR Danaher Corp. Capital Goods 54.42 E / C 13,326 0.22 11.30 2.0 -35.8 1/4/08 84.74UTX United Technologies Corp. Capital Goods 41.80 E / C 39,032 3.68 9.61 2.0 -14.7 12/5/08 49.01BA Boeing Co. Capital Goods 33.63 O / C 24,381 5.00 6.46 2.0 -14.9 12/5/08 39.53LMT Lockheed Martin Corp. Capital Goods 61.02 O / C 19,370 3.74 6.71 2.0 -45.4 9/15/08 111.69
Information Technology 224.95 14.5 -3.3 -41.4TXN Texas Instruments Inc. Semis & Semi Equip 15.94 O / I 20,367 2.76 45.81 2.5 9.5 12/5/08 14.56ACN Accenture Ltd. Software & Services 30.05 NC 18,235 1.66 10.48 2.0 -13.9 1/4/08 34.91ORCL Oracle Corp. Software & Services 15.63 O / A 60,093 0.00 8.39 2.5 -23.9 1/31/08 20.55CSCO Cisco Systems Inc. Tech Hardware & Equip 15.51 O / I 90,640 0.00 15.04 2.0 -9.0 2/6/09 17.04NOK Nokia Corp. (ADR) Tech Hardware & Equip 11.04 O / I 47,630 7.56 12.03 3.0 -45.0 9/18/08 20.07IBM IBM Tech Hardware & Equip 90.40 O / I 119,057 2.21 10.52 2.5 -10.6 1/4/08 101.13
Materials 121.97 1.5 -1.7 -52.0DD DuPont Chemicals 19.06 NC 16,558 8.60 9.09 1.5 -21.0 12/5/08 24.12
Telecom Services 97.74 7.3 3.3 -40.5WIN Windstream Corp. Diversified Telecom 7.18 O / A 3,058 13.93 8.22 2.3 -40.0 3/12/09 11.97T AT&T Inc. Diversified Telecom 24.35 O / A 137,602 6.74 11.73 2.5 -40.5 1/4/08 40.89VOD Vodafone Group PLC (ADS) Diversified Telecom 16.44 E / A 87,142 8.23 4.44 2.5 -14.6 12/5/08 19.250.0
Utilities 117.60 4.0 -0.1 -45.2AEP American Electric Power Electric Utilities 25.02 NC 9,972 6.55 7.73 2.0 -45.9 1/4/08 46.29EXC Exelon Corp. Electric Utilities 41.38 NC 26,416 5.07 2.0 -49.6 1/4/08 82.03
Portfolio Performance since Inception -47.26
Average 43,839 4.01 10.76
S&P 500 3.22 11.50 -45.18Relative Return -2.08
M O R G A N S T A N L E Y R E S E A R C H
March 2009U.S. Equity Strategy
35Jason Todd +1 212 761 7991 (for enquiries or requests please email [email protected])
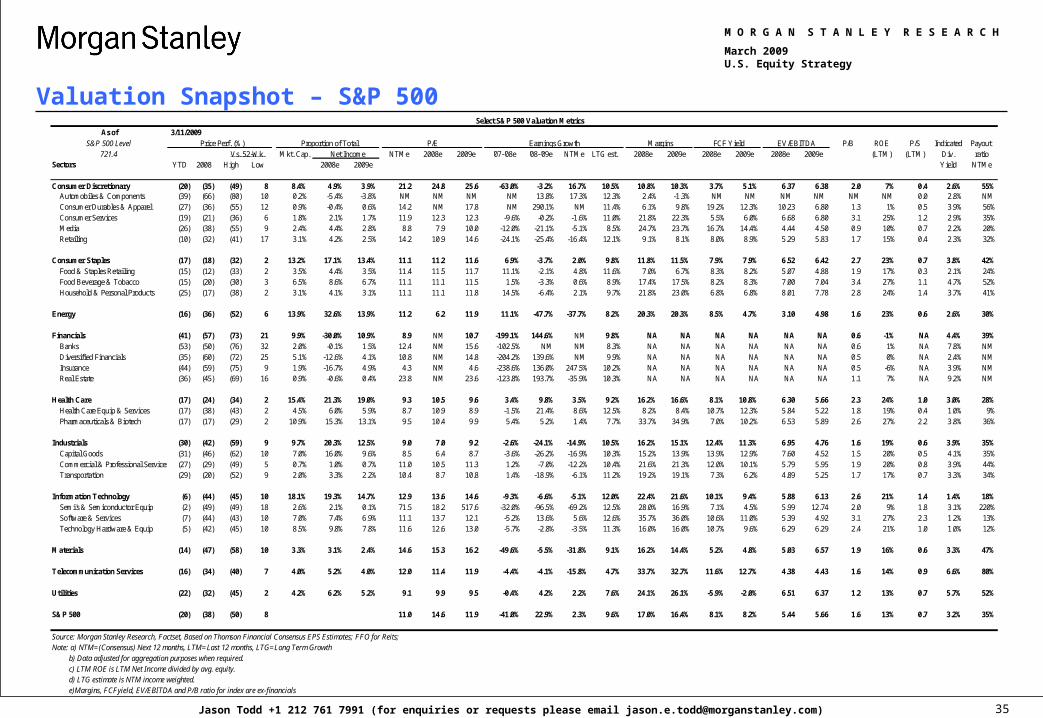
Valuation Snapshot – S&P 500Select S&P 500 Valuation Metrics
As of 3/11/2009S&P 500 Level Price Perf. (%) Proportion of Total P/E Earnings Growth Margins FCF Yield EV/EBITDA P/B ROE P/S Indicated Payout
721.4 Vs. 52-Wk. Mkt. Cap. Net Income NTMe 2008e 2009e '07-'08e '08-'09e NTMe LTG est. 2008e 2009e 2008e 2009e 2008e 2009e (LTM) (LTM) Div. ratioSectors YTD 2008 High Low 2008e 2009e Yield NTMe
Consumer Discretionary (20) (35) (49) 8 8.4% 4.9% 3.9% 21.2 24.8 25.6 -63.0% -3.2% 16.7% 10.5% 10.8% 10.3% 3.7% 5.1% 6.37 6.38 2.0 7% 0.4 2.6% 55%Automobiles & Components (39) (66) (80) 10 0.2% -5.4% -3.8% NM NM NM NM 13.8% 17.3% 12.3% 2.4% -1.3% NM NM NM NM NM NM 0.0 2.8% NMConsumer Durables & Apparel (27) (36) (55) 12 0.9% -0.4% 0.6% 14.2 NM 17.8 NM 290.1% NM 11.4% 6.1% 9.8% 19.2% 12.3% 10.23 6.80 1.3 1% 0.5 3.9% 56%Consumer Services (19) (21) (36) 6 1.8% 2.1% 1.7% 11.9 12.3 12.3 -9.6% -0.2% -1.6% 11.0% 21.8% 22.3% 5.5% 6.0% 6.68 6.80 3.1 25% 1.2 2.9% 35%Media (26) (38) (55) 9 2.4% 4.4% 2.8% 8.8 7.9 10.0 -12.0% -21.1% -5.1% 8.5% 24.7% 23.7% 16.7% 14.4% 4.44 4.50 0.9 10% 0.7 2.2% 20%Retailing (10) (32) (41) 17 3.1% 4.2% 2.5% 14.2 10.9 14.6 -24.1% -25.4% -16.4% 12.1% 9.1% 8.1% 8.0% 8.9% 5.29 5.83 1.7 15% 0.4 2.3% 32%
Consumer Staples (17) (18) (32) 2 13.2% 17.1% 13.4% 11.1 11.2 11.6 6.9% -3.7% 2.0% 9.8% 11.8% 11.5% 7.9% 7.9% 6.52 6.42 2.7 23% 0.7 3.8% 42%Food & Staples Retailing (15) (12) (33) 2 3.5% 4.4% 3.5% 11.4 11.5 11.7 11.1% -2.1% 4.8% 11.6% 7.0% 6.7% 8.3% 8.2% 5.07 4.88 1.9 17% 0.3 2.1% 24%Food Beverage & Tobacco (15) (20) (30) 3 6.5% 8.6% 6.7% 11.1 11.1 11.5 1.5% -3.3% 0.6% 8.9% 17.4% 17.5% 8.2% 8.3% 7.00 7.04 3.4 27% 1.1 4.7% 52%Household & Personal Products (25) (17) (38) 2 3.1% 4.1% 3.1% 11.1 11.1 11.8 14.5% -6.4% 2.1% 9.7% 21.8% 23.0% 6.8% 6.8% 8.01 7.78 2.8 24% 1.4 3.7% 41%
Energy (16) (36) (52) 6 13.9% 32.6% 13.9% 11.2 6.2 11.9 11.1% -47.7% -37.7% 8.2% 20.3% 20.3% 8.5% 4.7% 3.10 4.98 1.6 23% 0.6 2.6% 30%
Financials (41) (57) (73) 21 9.9% -30.0% 10.9% 8.9 NM 10.7 -199.1% 144.6% NM 9.8% NA NA NA NA NA NA 0.6 -1% NA 4.4% 39%Banks (53) (50) (76) 32 2.0% -0.1% 1.5% 12.4 NM 15.6 -102.5% NM NM 8.3% NA NA NA NA NA NA 0.6 1% NA 7.8% NMDiversified Financials (35) (60) (72) 25 5.1% -12.6% 4.1% 10.8 NM 14.8 -204.2% 139.6% NM 9.9% NA NA NA NA NA NA 0.5 0% NA 2.4% NMInsurance (44) (59) (75) 9 1.9% -16.7% 4.9% 4.3 NM 4.6 -238.6% 136.0% 247.5% 10.2% NA NA NA NA NA NA 0.5 -6% NA 3.9% NMReal Estate (36) (45) (69) 16 0.9% -0.6% 0.4% 23.8 NM 23.6 -123.8% 193.7% -35.9% 10.3% NA NA NA NA NA NA 1.1 7% NA 9.2% NM
Health Care (17) (24) (34) 2 15.4% 21.3% 19.0% 9.3 10.5 9.6 3.4% 9.8% 3.5% 9.2% 16.2% 16.6% 8.1% 10.8% 6.30 5.66 2.3 24% 1.0 3.0% 28%Health Care Equip & Services (17) (38) (43) 2 4.5% 6.0% 5.9% 8.7 10.9 8.9 -1.5% 21.4% 8.6% 12.5% 8.2% 8.4% 10.7% 12.3% 5.84 5.22 1.8 19% 0.4 1.0% 9%Pharmaceuticals & Biotech (17) (17) (29) 2 10.9% 15.3% 13.1% 9.5 10.4 9.9 5.4% 5.2% 1.4% 7.7% 33.7% 34.9% 7.0% 10.2% 6.53 5.89 2.6 27% 2.2 3.8% 36%
Industrials (30) (42) (59) 9 9.7% 20.3% 12.5% 9.0 7.0 9.2 -2.6% -24.1% -14.9% 10.5% 16.2% 15.1% 12.4% 11.3% 6.95 4.76 1.6 19% 0.6 3.9% 35%Capital Goods (31) (46) (62) 10 7.0% 16.0% 9.6% 8.5 6.4 8.7 -3.6% -26.2% -16.9% 10.3% 15.2% 13.9% 13.9% 12.9% 7.60 4.52 1.5 20% 0.5 4.1% 35%Commercial & Professional Services (27) (29) (49) 5 0.7% 1.0% 0.7% 11.0 10.5 11.3 1.2% -7.0% -12.2% 10.4% 21.6% 21.3% 12.0% 10.1% 5.79 5.95 1.9 20% 0.8 3.9% 44%Transportation (29) (20) (52) 9 2.0% 3.3% 2.2% 10.4 8.7 10.8 1.4% -18.9% -6.1% 11.2% 19.2% 19.1% 7.3% 6.2% 4.89 5.25 1.7 17% 0.7 3.3% 34%
Information Technology (6) (44) (45) 10 18.1% 19.3% 14.7% 12.9 13.6 14.6 -9.3% -6.6% -5.1% 12.0% 22.4% 21.6% 10.1% 9.4% 5.88 6.13 2.6 21% 1.4 1.4% 18%Semi's & Semiconductor Equip (2) (49) (49) 18 2.6% 2.1% 0.1% 71.5 18.2 517.6 -32.0% -96.5% -69.2% 12.5% 28.0% 16.9% 7.1% 4.5% 5.99 12.74 2.0 9% 1.8 3.1% 220%Software & Services (7) (44) (43) 10 7.0% 7.4% 6.9% 11.1 13.7 12.1 -5.2% 13.6% 5.6% 12.6% 35.7% 36.0% 10.6% 11.0% 5.39 4.92 3.1 27% 2.3 1.2% 13%Technology Hardware & Equip (5) (42) (45) 10 8.5% 9.8% 7.8% 11.6 12.6 13.0 -5.7% -2.8% -3.5% 11.3% 16.0% 16.0% 10.7% 9.6% 6.29 6.29 2.4 21% 1.0 1.0% 12%
Materials (14) (47) (58) 10 3.3% 3.1% 2.4% 14.6 15.3 16.2 -49.6% -5.5% -31.8% 9.1% 16.2% 14.4% 5.2% 4.8% 5.03 6.57 1.9 16% 0.6 3.3% 47%
Telecommunication Services (16) (34) (40) 7 4.0% 5.2% 4.0% 12.0 11.4 11.9 -4.4% -4.1% -15.8% 4.7% 33.7% 32.7% 11.6% 12.7% 4.38 4.43 1.6 14% 0.9 6.6% 80%
Utilities (22) (32) (45) 2 4.2% 6.2% 5.2% 9.1 9.9 9.5 -0.4% 4.2% 2.2% 7.6% 24.1% 26.1% -5.9% -2.0% 6.51 6.37 1.2 13% 0.7 5.7% 52%
S&P 500 (20) (38) (50) 8 11.0 14.6 11.9 -41.0% 22.9% 2.3% 9.6% 17.0% 16.4% 8.1% 8.2% 5.44 5.66 1.6 13% 0.7 3.2% 35%
Source: Morgan Stanley Research, Factset, Based on Thomson Financial Consensus EPS Estimates; FFO for Reits; Note: a) NTM=(Consensus) Next 12 months, LTM=Last 12 months, LTG=Long Term Growth b) Data adjusted for aggregation purposes when required. c) LTM ROE is LTM Net Income divided by avg. equity. d) LTG estimate is NTM income weighted. e)Margins, FCFyield, EV/EBITDA and P/B ratio for index are ex-financials

M O R G A N S T A N L E Y R E S E A R C H
March 2009U.S. Equity Strategy
36Jason Todd +1 212 761 7991 (for enquiries or requests please email [email protected])
Valuation Snapshot – OthersRussell MidCap Russell 2000
P/E Rel. P/E Earnings Growth ROE Ind. P/E Rel. P/E Earnings Growth ROE Ind.
LTM NTMe 2009e NTMe 2009e NTMe '08-'09e LTG est. (LTM) Div. LTM NTMe 2009e NTMe 2009e NTMe '08-'09e LTG est. (LTM) Div.
Sectors Yield Sectors Yield
Consumer Discretionary 21.0 17.1 16.4 1.5 1.4 NM 242.0% 12.5% -3% 2.0% Consumer Discretionary NM NM NM NM NM 149.7% 166.6% 14.5% -5% 1.4%
Consumer Staples 10.3 10.3 10.1 0.9 0.9 8.8% 10.7% 8.6% 16% 3.2% Consumer Staples 15.3 16.5 15.2 0.9 0.9 13.9% 17.8% 11.5% 10% 1.9%
Energy 5.0 8.5 8.4 0.7 0.7 -37.7% -37.1% 13.1% 21% 1.8% Energy 6.9 12.6 12.3 0.7 0.7 -48.2% -47.2% 12.8% 9% 2.6%
Financials 10.9 9.9 9.9 0.8 0.9 55.9% 58.9% 9.1% 4% 5.2% Financials 16.9 12.6 12.7 0.7 0.7 NM NM 8.2% -1% 5.7%
Health Care 13.3 11.9 11.9 1.0 1.0 5.7% 5.8% 12.8% 16% 0.3% Health Care NM NM NM NM NM 107.9% 114.8% 18.3% -4% 0.3%
Industrials 8.0 10.2 10.2 0.9 0.9 -17.7% -17.5% 12.2% 16% 2.4% Industrials 8.7 15.2 15.0 0.9 0.9 8.5% 11.0% 13.1% 9% 1.5%
Information Technology 12.7 16.8 16.7 1.4 1.4 -37.8% -37.0% 13.8% 13% 0.9% Information Technology 18.3 23.1 22.6 1.3 1.3 -30.9% -26.6% 15.3% 6% 0.3%
Materials 7.5 11.8 11.7 1.0 1.0 -39.1% -38.8% 8.2% 17% 3.0% Materials 8.6 14.2 14.0 0.8 0.8 -27.6% -26.2% 6.5% 6% 2.4%
Telecommunication Services 33.3 20.5 20.1 1.8 1.7 31.8% 17.9% 7.9% 7% 3.7% Telecommunication Services NM NM NM NM NM NM NM 13.0% -37% 2.7%
Utilities 8.9 9.4 9.3 0.8 0.8 -5.2% -3.8% 7.6% 11% 5.4% Utilities 14.5 13.0 13.0 0.7 0.8 19.3% 19.4% 7.2% 8% 5.1%
Index 10.5 11.7 11.6 1.0 1.0 -9.8% -7.2% 10.9% 10% 2.7% Index 16.4 17.8 17.2 1.0 1.0 97.4% 106.5% 12.2% 2% 2.2%
Dow Jones Industrial Average Nasdaq 100
P/E Rel. P/E Earnings Growth ROE Ind. P/E Rel. P/E Earnings Growth ROE Ind.
LTM NTMe 2009e NTMe 2009e NTMe '08-'09e LTG est. (LTM) Div. LTM NTMe 2009e NTMe 2009e NTMe '08-'09e LTG est. (LTM) Div.
Sectors Yield Sectors Yield
Consumer Discretionary NM NM NM NM NM 11.0% 1.0% 9.1% NM 3.6% Consumer Discretionary 13.6 13.6 13.5 1.0 1.0 0.0% 1.4% 10.7% 11% 0.9%
Consumer Staples 12.2 12.6 12.6 1.0 1.0 -3.7% -3.3% 9.9% 21% 3.3% Consumer Staples 15.6 15.4 15.8 1.1 1.1 1.2% -7.4% 12.4% 14% 1.4%
Energy 6.9 13.1 13.8 1.1 1.1 -47.1% -49.9% 7.9% 34% 2.9% Energy
Financials NM NM NM NM NM 152.7% 134.9% 7.4% -4% 1.4% Financials
Health Care 7.3 8.2 8.0 0.7 0.6 -10.9% -8.1% 4.4% 30% 6.4% Health Care 14.9 13.4 13.4 0.9 0.9 10.9% 10.5% 15.1% 20% 0.2%
Industrials 6.0 8.3 8.3 0.7 0.7 -27.1% -26.9% 9.2% 22% 4.6% Industrials 13.7 14.1 13.9 1.0 1.0 -2.8% -1.5% 17.8% 23% 1.4%
Information Technology 9.8 10.7 10.6 0.9 0.9 -8.9% -7.8% 10.4% 32% 2.7% Information Technology 12.1 14.7 14.6 1.0 1.0 -18.1% -17.6% 13.0% 24% 1.3%
Materials 6.1 19.9 17.1 1.6 1.4 -69.1% -64.2% 4.4% 15% 9.6% Materials 7.6 9.4 9.6 0.7 0.7 -18.6% -22.0% 8.3% 25% 2.5%
Telecommunication Services 9.1 11.4 11.0 0.9 0.9 -20.4% -2.1% 4.6% 16% 6.9% Telecommunication Services 7.5 7.0 7.3 0.5 0.5 6.9% 2.7% 11.6% 25% 0.0%
Utilities Utilities
Index 10.3 12.1 12.3 1.0 1.0 -15.3% -14.8% 8.0% 16% 3.9% Index 12.6 14.2 14.2 1.0 1.0 -11.3% -10.9% 13.2% 20% 1.1%
Source: Morgan Stanley Research, Factset, Based on Thomson Financial Consensus EPS Estimates
Note: a) NTM=(Consensus) Next 12 months, LTM=Last 12 months, LTG=Long Term Growth, NM = Not Meaningful
b) Data adjusted for aggregation purposes when required.
c) LTM ROE is LTM Net Income divided by avg. equity.
d) LTG estimate is NTM income weighted.

M O R G A N S T A N L E Y R E S E A R C H
March 2009U.S. Equity Strategy
37Jason Todd +1 212 761 7991 (for enquiries or requests please email [email protected])
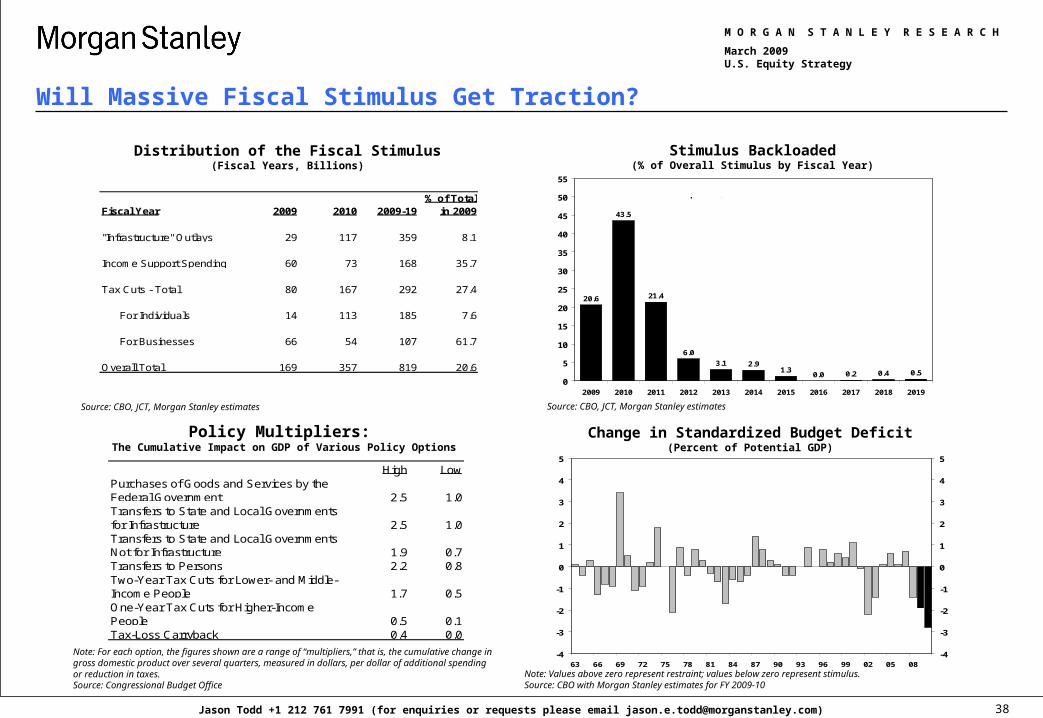
Will Massive Fiscal Stimulus Get Traction?
American Recovery and Reinvestment Act Stimulus “back-loaded” into F2010 Shovel ready? Infrastructure outlays come slowly Assume that consumers save ½ to ¾ of tax cuts “Multiplier” effects muted until credit crunch abates
M O R G A N S T A N L E Y R E S E A R C H
March 2009U.S. Equity Strategy
38Jason Todd +1 212 761 7991 (for enquiries or requests please email [email protected])
Will Massive Fiscal Stimulus Get Traction?
Source: CBO, JCT, Morgan Stanley estimates Source: CBO, JCT, Morgan Stanley estimates
Note: For each option, the figures shown are a range of “multipliers,” that is, the cumulative change in gross domestic product over several quarters, measured in dollars, per dollar of additional spending or reduction in taxes.Source: Congressional Budget Office
Note: Values above zero represent restraint; values below zero represent stimulus.Source: CBO with Morgan Stanley estimates for FY 2009-10
Stimulus Backloaded(% of Overall Stimulus by Fiscal Year)
Policy Multipliers: The Cumulative Impact on GDP of Various Policy Options
Change in Standardized Budget Deficit(Percent of Potential GDP)
Distribution of the Fiscal Stimulus(Fiscal Years, Billions)
High LowPurchases of Goods and Services by the Federal Government 2.5 1.0Transfers to State and Local Governments for Infrastructure 2.5 1.0Transfers to State and Local Governments Not for Infrastructure 1.9 0.7Transfers to Persons 2.2 0.8Two-Year Tax Cuts for Lower- and Middle-Income People 1.7 0.5One-Year Tax Cuts for Higher-Income People 0.5 0.1Tax-Loss Carryback 0.4 0.0
Fiscal Year 2009 2010 2009-19% of Total
in 2009
"Infrastructure" Outlays 29 117 359 8.1
Income Support Spending 60 73 168 35.7
Tax Cuts - Total 80 167 292 27.4
For Individuals 14 113 185 7.6
For Businesses 66 54 107 61.7
Overall Total 169 357 819 20.6
20.6
43.5
21.4
6.0
3.1 2.91.3
0.0 0.2 0.4 0.50
5
10
15
20
25
30
35
40
45
50
55
2009 2010 2011 2012 2013 2014 2015 2016 2017 2018 2019
Tax and Spending Stimulus in the House Bill as a % of the Overall 10-Year Impact of $819 bil.
-4
-3
-2
-1
0
1
2
3
4
5
-4
-3
-2
-1
0
1
2
3
4
5
63 66 69 72 75 78 81 84 87 90 93 96 99 02 05 08
Actual
Change in standardized budget deficit (percent of potential GDP)
MS estimates

M O R G A N S T A N L E Y R E S E A R C H
March 2009U.S. Equity Strategy
39Jason Todd +1 212 761 7991 (for enquiries or requests please email [email protected])
Source: Census Bureau, National Association of Realtors
Inventories of Unsold Homes Plunging, But Still High
Construction Employment: More Declines ComingNonfarm Payrolls, Year-over-Year Percent Change
Affordability Soaring but Pent-Up Demand Unfavorable
Equity Extraction Is Collapsing
Source: Census Bureau
Source: Bureau of Labor Statistics
Updated estimates of the mortgage system provided by Jim Kennedy, presented in “Estimates of Home Mortgage Originations, Repayments, and Debt On One-to-Four-Family Residences," Alan Greenspan and James Kennedy, Federal Reserve Board FEDS working paper no. 2005-41.
US Housing Recession at Least Through 2009
0
2
4
6
8
10
12
Active
Passive
Mortgage equity withdrawal,as a % of disposable income,4-quarter moving average
60
80
100
120
140
160
180
200
80 82 84 86 88 90 92 94 96 98 00 02 04 06 08
63
64
65
66
67
68
69
70
Composite housingaffordability index(left scale)
US homeownershiprate (right scale)
250
300
350
400
450
500
550
600
96 97 98 99 00 01 02 03 04 05 06 07 08 09
3
5
7
9
11
13
15
New single-family homes for sale,months supply(right scale)
New single-family homes for sale,thousands of units (left scale)
-16
-12
-8
-4
0
4
8
12
86 88 90 92 94 96 98 00 02 04 06 08
-16
-12
-8
-4
0
4
8
12
Specialty trade contractors: residential
Residentialbuilding construction
M O R G A N S T A N L E Y R E S E A R C H
March 2009U.S. Equity Strategy
40Jason Todd +1 212 761 7991 (for enquiries or requests please email [email protected])
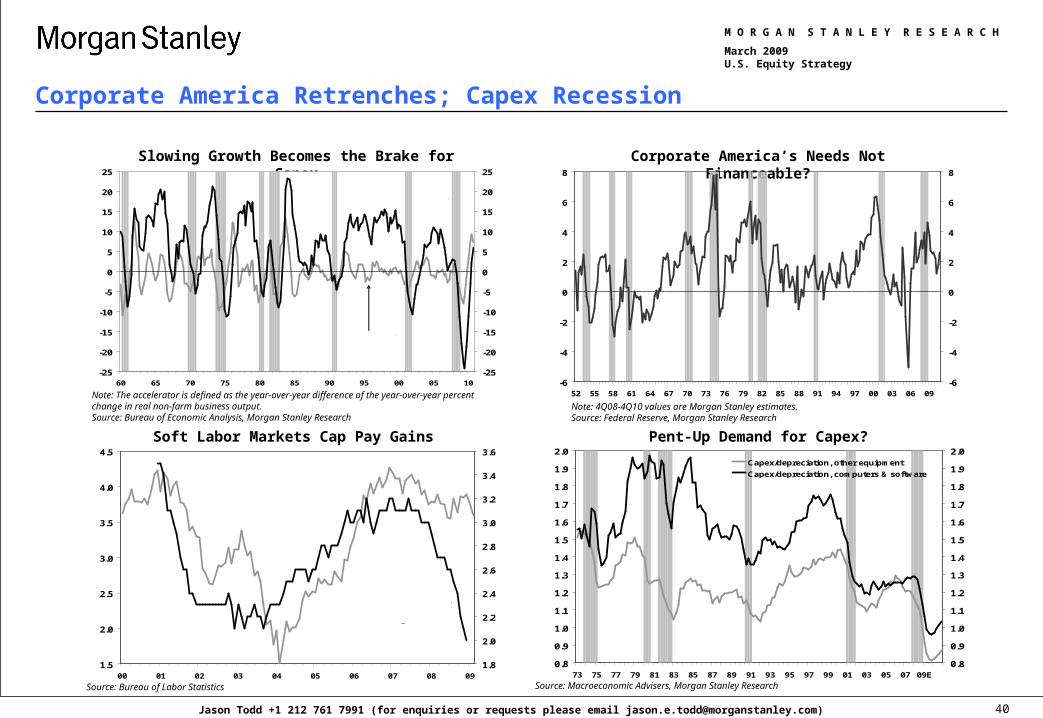
Corporate America Retrenches; Capex Recession
Source: Bureau of Labor Statistics
Note: 4Q08-4Q10 values are Morgan Stanley estimates.Source: Federal Reserve, Morgan Stanley Research
Note: The accelerator is defined as the year-over-year difference of the year-over-year percent change in real non-farm business output. Source: Bureau of Economic Analysis, Morgan Stanley Research
Source: Macroeconomic Advisers, Morgan Stanley Research
Soft Labor Markets Cap Pay Gains
Slowing Growth Becomes the Brake for Capex
Pent-Up Demand for Capex?
Corporate America’s Needs Not Financeable?
-6
-4
-2
0
2
4
6
8
52 55 58 61 64 67 70 73 76 79 82 85 88 91 94 97 00 03 06 09
-6
-4
-2
0
2
4
6
8Financing gap as a percentage of nonfinancialcorporate GDP
0.8
0.9
1.0
1.1
1.2
1.3
1.4
1.5
1.6
1.7
1.8
1.9
2.0
73 75 77 79 81 83 85 87 89 91 93 95 97 99 01 03 05 07 09E
0.8
0.9
1.0
1.1
1.2
1.3
1.4
1.5
1.6
1.7
1.8
1.9
2.0Capex/depreciation, other equipment
Capex/depreciation, computers & software
1.5
2.0
2.5
3.0
3.5
4.0
4.5
00 01 02 03 04 05 06 07 08 09
1.8
2.0
2.2
2.4
2.6
2.8
3.0
3.2
3.4
3.6
JOLTS jobopenings rate,total private(right scale)
Average hourly earnings,total private industries,year-over-year percentchange (left scale)
-25
-20
-15
-10
-5
0
5
10
15
20
25
60 65 70 75 80 85 90 95 00 05 10
-25
-20
-15
-10
-5
0
5
10
15
20
25
Private nonresidential investment in equipment & software,year-over-year percent change
Accelerator*

M O R G A N S T A N L E Y R E S E A R C H
March 2009U.S. Equity Strategy
41Jason Todd +1 212 761 7991 (for enquiries or requests please email [email protected])
Global Forecast at a Glance
2008E 2009E 2010E 2008E 2009E 2010E
Global Economy 3.3 -0.5 3.0 6.2 2.0 3.5Industrial World 0.8 -2.5 1.2 3.3 -0.5 1.8Developing World 5.9 1.5 4.6 9.1 4.5 5.0
US 1.1 -3.3 1.8 3.8 -1.4 2.4
Europe 0.8 -1.5 1.2 3.3 0.5 1.7EMU 0.9 -1.6 1.1 3.3 0.5 1.6UK 0.7 -1.3 2.0 3.6 0.7 2.2
CEEMEA 4.2 -1.7 2.5 11.6 8.3 8.2
Japan -0.7 -4.0 -0.3 1.5 -1.2 -0.1Asia ex-Japan 7.0 3.0 6.4 6.4 1.1 2.7China 9.0 5.5 8.0 5.9 -0.8 1.5
Latin America 4.3 -0.4 2.4 8.0 8.3 7.6
Source: Morgan Stanley Research
REAL GDP GROWTH CPI INFLATION

M O R G A N S T A N L E Y R E S E A R C H
March 2009U.S. Equity Strategy
42Jason Todd +1 212 761 7991 (for enquiries or requests please email [email protected])
Source: Morgan Stanley Research, E = Morgan Stanley Estimates
Winners and Losers in the Global Economy?
Note: 1Q09-4Q10 values are Morgan Stanley estimates.Source: Bureau of Economic Analysis, Macroeconomic Advisers LLC, Morgan Stanley Research
…While Inflation Risks Tilt Higher
Growth Outside the US and China Matters More
Source: Morgan Stanley Research, E = Morgan Stanley Estimates
Source: IMF, E = Morgan Stanley Estimates
Growth Risks Now More Balanced…
Recoupling Risks
-6
-4
-2
0
2
4
6
8
10
12
14
16
2007 2008E 2009E 2010E
World
EuropeJapan US
Other DollarBloc
Latin America
Non-JapanAsia
Annual percentchange in real GDP
China
-1.4
3.3
-0.5
3.0
4.3
0.4
3.3
1.3
3.3
-2
-1
0
1
2
3
4
5
6
2006 2007 2008E 2009E 2010E
Global Economy: Real GDP (%)
BullBaseBear
6.2
2.0
3.5
1.8
6.2
0.0
4.8
3.0
6.2
-1
0
1
2
3
4
5
6
7
2006 2007 2008E 2009E 2010E
Global Economy: CPI Inflation (%)
BullBaseBear
-6
-4
-2
0
2
4
6
8
10
74 76 78 80 82 84 86 88 90 92 94 96 98 00 02 04 06 08 10
-6
-4
-2
0
2
4
6
8
10
Non-US
US
Real GDP, YoY % chg

M O R G A N S T A N L E Y R E S E A R C H
March 2009U.S. Equity Strategy
43Jason Todd +1 212 761 7991 (for enquiries or requests please email [email protected])
US Economic Outlook
US Economic Outlook4th Qtr/4th Qtr Percent Change
Year over Year Percent Change from Prior Quarter*
2008A 2009E 2010E 2008A 2009E 2010E 3Q08A 4Q08A 1Q09E 2Q09E 3Q09E 4Q09E 1Q10E 2Q10E 3Q10E 4Q10E
Real GDP 1.1 -3.3 1.8 -0.8 -2.3 3.1 -0.5 -6.2 -5.5 -4.0 -1.0 1.5 2.5 3.4 3.3 3.4Final Sales+ 1.4 -2.9 1.5 -0.7 -1.9 2.6 -1.3 -6.4 -4.4 -3.2 -1.0 1.0 2.3 2.8 2.6 2.7Personal Consumption Expenditures 0.2 -0.8 2.1 -1.5 1.1 2.3 -3.8 -4.3 0.4 0.0 1.6 2.3 2.5 2.1 2.1 2.4Business Fixed Investment 1.7 -17.7 -2.7 -5.0 -17.9 4.2 -1.7 -21.1 -26.4 -24.9 -12.1 -6.4 0.6 4.1 5.3 6.7 -- Structures 11.5 -11.7 -4.1 7.3 -16.7 1.6 9.7 -5.9 -24.6 -22.0 -10.0 -9.0 -3.0 4.4 2.9 2.4 -- Equipment -3.0 -21.0 -1.8 -11.2 -18.6 5.8 -7.5 -28.8 -27.5 -26.7 -13.4 -4.7 3.0 4.0 7.0 9.6Residential Investment -20.7 -21.4 8.9 -19.3 -16.0 15.7 -16.0 -22.2 -31.7 -27.3 -10.3 11.4 19.7 17.8 14.1 11.4Exports 6.2 -13.4 -0.4 -1.8 -12.3 4.1 3.0 -23.6 -23.3 -12.9 -7.4 -4.3 2.5 4.0 4.9 5.0Imports -3.3 -10.4 2.3 -7.1 -7.1 5.0 -3.5 -16.0 -16.6 -10.6 -1.2 1.2 4.9 4.1 4.6 6.2Federal Government 6.0 5.2 1.8 8.2 2.5 1.4 13.8 6.7 3.5 4.4 0.7 1.5 1.3 4.1 0.5 -0.1State & Local Government 1.2 -0.9 1.9 0.5 -0.8 3.0 1.3 -1.4 -3.7 -0.8 -0.1 1.6 2.4 2.3 3.4 3.8
Business Indicators++Net Exports of Goods & Services -$392.3 -$398.5 -$443.4 -$353.1 -$372.9 -$385.1 -$383.2 -$403.3 -$422.3 -$435.1 -$439.9 -$443.9 -$454.8Current Account as a % of GDP -4.6 -4.1 -4.6 -4.8 -3.7 -3.7 -3.4 -4.3 -5.0 -4.9 -3.9 -4.5 -5.1Change in Real Nonfarm Inventories -32.8 -67.6 -30.7 -33.3 -25.0 -53.7 -75.8 -77.7 -63.2 -56.8 -41.3 -22.1 -2.6
Housing Starts (Thous) 904 476 670 876 661 462 422 474 549 609 654 694 724Light Vehicle Sales (Millions) 13.1 9.8 11.4 12.9 10.3 9.2 9.7 10.1 10.3 10.7 11.2 11.6 12.1Industrial Production (Pct Chg) -1.8 -10.0 1.7 -8.9 -12.1 -17.5 -7.8 -3.0 0.0 3.0 5.0 5.1 5.1Civilian Unemployment Rate (Percent) 5.8 9.2 9.7 6.0 6.9 8.0 9.0 9.6 9.9 9.9 9.8 9.7 9.6
After-Tax "Economic" Profits** $1,098.4 $735.6 $820.6 $1,121.3 $955.2 $862.0 $759.4 $681.5 $639.6 $707.2 $866.0 $865.2 $844.0 -- Percent Change from Prior Year -7.9 -33.0 11.5 -7.9 -18.9 -27.6 -32.6 -39.2 -33.0 -18.0 14.0 27.0 32.0After-Tax "Book" Profits $1,219.4 $923.4 $1,039.2 $1,300.2 $886.3 $1,009.9 $939.6 $887.5 $856.8 $915.7 $1,093.2 $1,085.1 $1,062.9 -- Percent Change from Prior Year -15.1 -24.3 12.5 -10.1 -39.3 -25.1 -30.1 -31.7 -3.3 -9.3 16.4 22.3 24.1Real Disposable Personal Income (Pct Chg) 1.3 2.5 2.3 -8.5 3.4 7.4 3.2 -0.7 0.9 1.0 7.6 2.1 2.3Personal Saving Rate 1.8 5.2 5.6 1.3 3.2 4.9 5.7 5.2 4.9 4.6 5.9 5.9 5.9
Prices and Costs (Percent Change)GDP Chain Price Index 2.2 1.5 1.5 2.0 0.9 1.8 3.9 0.5 2.8 0.4 0.2 0.4 1.2 4.9 0.6 0.7Consumer Price Index 3.8 -1.4 2.4 1.5 -0.3 2.9 6.2 -8.3 -2.4 -3.1 2.0 2.6 2.9 3.0 3.0 2.9CPI ex Food & Energy 2.3 1.2 1.1 2.0 0.9 1.2 2.8 0.6 1.0 1.0 0.8 0.9 1.1 1.1 1.3 1.5PCEPI ex Food & Energy 2.2 1.1 0.9 1.9 0.7 1.1 2.4 0.8 0.9 0.8 0.6 0.7 0.9 1.0 1.2 1.4Market-Based PCEPI ex Food & Energy 1.9 1.0 0.8 1.8 0.7 1.0 2.5 1.0 0.8 0.7 0.5 0.6 0.8 0.9 1.1 1.3Producer Price Index 6.4 -2.7 4.3 1.3 1.3 4.7 9.7 -19.1 -4.5 -2.2 4.5 8.0 7.6 -5.1 8.5 8.4Compensation Per Hour 3.7 3.8 3.1 4.1 3.0 3.5 5.7 5.3 4.4 2.4 2.4 2.8 3.2 3.4 3.6 3.8Productivity 2.8 0.7 1.9 2.2 0.7 2.4 2.1 -0.4 0.5 -0.7 0.8 2.2 1.6 2.7 2.7 2.8Unit Labor Costs 0.9 3.1 1.2 1.8 2.3 1.0 3.5 5.7 3.9 3.1 1.6 0.6 1.6 0.7 0.9 0.9
*Annualized percent change from prior period, unless noted +GDP less inventory change**Including inventory valuation & capital consumption adjustments ++Billions of dollars; real in billions of chain-type 2000 dollarsE = Morgan Stanley estimatesForecast as of March 9, 2009

M O R G A N S T A N L E Y R E S E A R C H
March 2009U.S. Equity Strategy
44Jason Todd +1 212 761 7991 (for enquiries or requests please email [email protected])
Morgan Stanley does and seeks to do business with companies covered in Morgan Stanley Research. As a result, investors should be aware that the firm may have a conflict of interest that could affect the objectivity of Morgan Stanley Research. Investors should consider Morgan Stanley Research as only a single factor in making their investment decision. Customers of Morgan Stanley in the US can receive independent, third-party research on companies covered in Morgan Stanley Research, at no cost to them, where such research is available. Customers can access this independent research at www.morganstanley.com/equityresearch or can call 1-800-624-2063 to request a copy of this research.
Morgan Stanley & Co. International plc, authorized and regulated by Financial Services Authority, disseminates in the UK research that it has prepared, and approves solely for the purposes of section 21 of the Financial Services and Markets Act 2000, research which has been prepared by any of its affiliates. As used in this disclosure section, Morgan Stanley includes RMB Morgan Stanley (Proprietary) Limited, Morgan Stanley & Co International plc and its affiliates.
For important disclosures, stock price charts and rating histories regarding companies that are the subject of this report, please see the Morgan Stanley Research Disclosure Website at www.morganstanley.com/researchdisclosures, or contact your investment representative or Morgan Stanley Research at 1585 Broadway, (Attention: Equity Research Management), New York, NY, 10036 USA.
Analyst CertificationThe following analysts hereby certify that their views about the companies and their securities discussed in this report are accurately expressed and that they have not received and will not receive direct or indirect compensation in exchange for expressing specific recommendations or views in this report: Jonathan Garner, Vinicius Silva, Michael Wang.Unless otherwise stated, the individuals listed on the cover page of this report are research analysts.Global Research Conflict Management PolicyMorgan Stanley Research has been published in accordance with our conflict management policy, which is available at www.morganstanley.com/institutional/research/conflictpolicies.Important US Regulatory Disclosures on Subject Companies
As of February 29, 2008, Morgan Stanley beneficially owned 1% or more of a class of common equity securities of the following companies covered in Morgan Stanley Research: Acer Inc., America Movil, Arabtec Holdings, China Steel Corp., Companhia Vale do Rio Doce, Corporacion GEO, Ctrip.com, Garanti Bank, Gazprom, Grupo Financiero Banorte, Grupo Televisa, Hon Hai Precision, Hurriyet, Hyflux Ltd, Hyundai Heavy Industries Co. Ltd., Lonmin Plc, Millicom, NHN Corp, Petrobras, Samsung Electronics, Satyam Computer Services, TSMC, Vimpelcom, Yang Ming Marine, Abbott Laboratories, Amgen, Cisco Systems, Coach Inc, J.P.Morgan Chase & Co., Lowe's Companies, MetLife Inc., Nokia, Philip Morris International Inc, Wells Fargo & Co BRISTOL MYERS SQUIBB... .
As of February 29, 2008, Morgan Stanley held a net long or short position of US$1 million or more of the debt securities of the following issuers covered in Morgan Stanley Research (including where guarantor of the securities): Companhia Vale do Rio Doce, Garanti Bank, Gazprom, Grupo Televisa, Hon Hai Precision, Isbank, Kazkommertsbank, Kookmin Bank, Millicom, Mobile TeleSystems, Petrobras, Samsung Electronics, Telekom Malaysia, Tenaga Nasional Bhd, TIM Participacoes, TPSA, NIKE, INC., CHEVRON CORPORATION, CONOCOPHILLIPS, UNITED TECHNOLOGIES CORPORATION, EXELON CORPORATIONAbbott Laboratories, Altria Group, Inc., Amgen, AT&T, Inc., Boeing Company, Cisco Systems, Coach Inc, Danaher Corp., IBM, J.P.Morgan Chase & Co., Kroger Co., Lockheed Martin Corp., Lowe's Companies, McDonald's Corporation, MetLife Inc., Nokia, Oracle Corporation, Philip Morris International Inc, State Street Corporation, Teva Pharmaceutical Industries Ltd., Texas Instruments, Vodafone Group, Wal-Mart, Wells Fargo & Co.. .
Within the last 12 months, Morgan Stanley managed or co-managed a public offering of securities of BIM, China Mobile Limited Amgen, AT&T, Inc., Cisco Systems, IBM, J.P.Morgan Chase & Co., McDonald's Corporation, MetLife Inc., Oracle Corporation, State Street Corporation, Wal-Mart, Wells Fargo & Co.. .
Within the last 12 months, Morgan Stanley has received compensation for investment banking services from America Movil, Companhia Vale do Rio Doce, Gazprom, Implats Limited, MMK, Norilsk Nickel, Petrobras, Tenaris S.A, TPSA from Abbott Laboratories, Altria Group, Inc., Amgen, AT&T, Inc., Boeing Company, Cisco Systems, Danaher Corp., IBM, J.P.Morgan Chase & Co., Kroger Co., Lockheed Martin Corp., McDonald's Corporation, MetLife Inc., Nokia, Oracle Corporation, State Street Corporation, Texas Instruments, Vodafone Group, Wal-Mart, Wells Fargo & Co.. .
Disclosure SectionMorgan Stanley ModelWare is a proprietary analytic framework that helps clients uncover value, adjusting for distortions and ambiguities created by local accounting regulations. For example, ModelWare EPS adjusts for one-time events, capitalizes operating leases (where their use is significant), and converts inventory from LIFO costing to a FIFO basis. ModelWare also emphasizes the separation of operating performance of a company from its financing for a more complete view of how a company generates earnings.

M O R G A N S T A N L E Y R E S E A R C H
March 2009U.S. Equity Strategy
45Jason Todd +1 212 761 7991 (for enquiries or requests please email [email protected])
Disclosure SectionIn the next 3 months, Morgan Stanley expects to receive or intends to seek compensation for investment banking services from America Movil, Bangkok Bank, BIM, China Mobile Limited, China Steel Corp., Companhia Vale do Rio Doce, Embraer, Garanti Bank, Gazprom, Grupo Financiero Banorte, Grupo Televisa, Hon Hai Precision, Hurriyet, Implats Limited, Isbank, Kazakhmys, Kookmin Bank, Lonmin Plc, LUKOIL, Mediatek, Millicom, MMK, Mobile TeleSystems, Naspers, Norilsk Nickel, Petrobras, Sasol, Satyam Computer Services, Telekom Malaysia, Tenaga Nasional Bhd, Tenaris S.A, TPSA, Vimpelcom from Abbott Laboratories, Altria Group, Inc., Amgen, AT&T, Inc., Becton Dickinson, Boeing Company, Cisco Systems, Coach Inc, Danaher Corp., IBM, Lockheed Martin Corp., Lowe's Companies, McDonald's Corporation, MetLife Inc., Nokia, Oracle Corporation, State Street Corporation, Teva Pharmaceutical Industries Ltd., Texas Instruments, Vodafone Group, Wal-Mart, Wells Fargo & Co.. .Within the last 12 months, Morgan Stanley & Co. Incorporated has received compensation for products and services other than investment banking services from Bangkok Bank, Companhia Vale do Rio Doce, Gazprom, Grupo Financiero Banorte, Isbank, Kookmin Bank, LUKOIL, Petrobras, Samsung Electronics, Sasol.Within the last 12 months, Morgan Stanley has provided or is providing investment banking services to, or has an investment banking client relationship with, the following company: America Movil, Bangkok Bank, BIM, China Mobile Limited, China Steel Corp., Companhia Vale do Rio Doce, Embraer, Garanti Bank, Gazprom, Grupo Financiero Banorte, Grupo Televisa, Hon Hai Precision, Hurriyet, Implats Limited, Isbank, Kazakhmys, Kookmin Bank, Lonmin Plc, LUKOIL, Mediatek, Millicom, MMK, Mobile TeleSystems, Naspers, Norilsk Nickel, Petrobras, Sasol, Satyam Computer Services, Telekom Malaysia, Tenaga Nasional Bhd, Tenaris S.A, TPSA, Vimpelcom.
Within the last 12 months, Morgan Stanley has either provided or is providing non-investment banking, securities-related services to and/or in the past has entered into an agreement to provide services or has a client relationship with the following company: Acer Inc., America Movil, Bangkok Bank, Companhia Vale do Rio Doce, Garanti Bank, Gazprom, Grupo Financiero Banorte, Grupo Televisa, Hon Hai Precision, Isbank, Kazkommertsbank, Kookmin Bank, LUKOIL, Norilsk Nickel, Petrobras, Samsung Electronics, Sasol, Telekom Malaysia, Tenaris S.A, TPSA, Yang Ming Marine Abbott Laboratories, Altria Group, Inc., CHEVRON CORPORATION, MARATHON OIL, CONOCOPHILLIPS, VALERO ENERGY, BANK OF NEW YORK MELLON, CHUBB, ACCENTURE, DUPONT CAPITAL MANAGEMENT. AT&T, Inc., Boeing Company, Cisco Systems, IBM, J.P.Morgan Chase & Co., McDonald's Corporation, MetLife Inc., Oracle Corporation, State Street Corporation, Texas Instruments, Vodafone Group, Wal-Mart, Wells Fargo & Co..J.P.Morgan Chase & Co., MetLife Inc.
The research analysts, strategists, or research associates principally responsible for the preparation of Morgan Stanley Research have received compensation based upon various factors, including quality of research, investor client feedback, stock picking, competitive factors, firm revenues and overall investment banking revenues.
Morgan Stanley & Co. Incorporated makes a market in the securities of Ctrip.com, Millicom Abbott Laboratories, Altria Group, Inc., Amgen, AT&T, Inc., Becton Dickinson, Boeing Company, Cisco Systems, Coach Inc, Danaher Corp., IBM, J.P.Morgan Chase & Co., Kroger Co., Lockheed Martin Corp., Lowe's Companies, McDonald's Corporation, MetLife Inc., Oracle Corporation, Philip Morris International Inc, State Street Corporation, Teva Pharmaceutical Industries Ltd., Texas Instruments, Wal-Mart, Wells Fargo & Co CONOCOPHILLIPS, VALERO ENERGY, BANK OF NEW YORK MELLON, BRISTOL MYERS SQUIBB..
Certain disclosures listed above are also for compliance with applicable regulations in non-US jurisdictions.
Global Stock Ratings Distribution(as of March 31, 2008)For disclosure purposes only (in accordance with NASD and NYSE requirements), we include the category headings of Buy, Hold, and Sell alongside our ratings of Overweight, Equal-weight and Underweight. Morgan Stanley does not assign ratings of Buy, Hold or Sell to the stocks we cover. Overweight, Equal-weight, and Underweight are not the equivalent of buy, hold, and sell but represent recommended relative weightings (see definitions below). To satisfy regulatory requirements, we correspond Overweight, our most positive stock rating, with a buy recommendation; we correspond Equal-weight to hold and Underweight to sell recommendations, respectively.

M O R G A N S T A N L E Y R E S E A R C H
March 2009U.S. Equity Strategy
46Jason Todd +1 212 761 7991 (for enquiries or requests please email [email protected])
Disclosures
Stock Rating Category Count
% of Total Count
% of Total IBC
% of Rating Category
Overweight/Buy 714 32% 216 38% 30%Equal-weight/Hold 1003 44% 246 43% 25%
Not-Rated/Hold 33 1.50% 9 1.60% 27.30%Underweight/Sell 507 22% 100 18% 20%Total 2,257 571
Coverage Universe Investment Banking Clients (IBC)
Global Stock Ratings Distribution(as of February 28, 2008)For disclosure purposes only (in accordance with NASD and NYSE requirements), we include the category headings of Buy, Hold, and Sell alongside our ratings of Overweight, Equal-weight and Underweight. Morgan Stanley does not assign ratings of Buy, Hold or Sell to the stocks we cover. Overweight, Equal-weight, and Underweight are not the equivalent of buy, hold, and sell but represent recommended relative weightings (see definitions below). To satisfy regulatory requirements, we correspond Overweight, our most positive stock rating, with a buy recommendation; we correspond Equal-weight to hold and Underweight to sell recommendations, respectively.

M O R G A N S T A N L E Y R E S E A R C H
March 2009U.S. Equity Strategy
47Jason Todd +1 212 761 7991 (for enquiries or requests please email [email protected])
Disclosure SectionData include common stock and ADRs currently assigned ratings. An investor's decision to buy or sell a stock should depend on individual circumstances (such as the investor's existing holdings) and other considerations. Investment Banking Clients are companies from whom Morgan Stanley or an affiliate received investment banking compensation in the last 12 months.
Analyst Stock Ratings
Overweight (O). The stock's total return is expected to exceed the average total return of the analyst's industry (or industry team's) coverage universe, on a risk-adjusted basis, over the next 12-18 months.Equal-weight (E). The stock's total return is expected to be in line with the average total return of the analyst's industry (or industry team's) coverage universe, on a risk-adjusted basis, over the next 12-18 months.Underweight (U). The stock's total return is expected to be below the average total return of the analyst's industry (or industry team's) coverage universe, on a risk-adjusted basis, over the next 12-18 months.
More volatile (V). We estimate that this stock has more than a 25% chance of a price move (up or down) of more than 25% in a month, based on a quantitative assessment of historical data, or in the analyst's view, it is likely to become materially more volatile over the next 1-12 months compared with the past three years. Stocks with less than one year of trading history are automatically rated as more volatile (unless otherwise noted). We note that securities that we do not currently consider "more volatile" can still perform in that manner.
Unless otherwise specified, the time frame for price targets included in Morgan Stanley Research is 12 to 18 months.
Analyst Industry ViewsAttractive (A): The analyst expects the performance of his or her industry coverage universe over the next 12-18 months to be attractive vs. the relevant broad market benchmark, as indicated below.In-Line (I): The analyst expects the performance of his or her industry coverage universe over the next 12-18 months to be in line with the relevant broad market benchmark, as indicated below.Cautious (C): The analyst views the performance of his or her industry coverage universe over the next 12-18 months with caution vs. the relevant broad market benchmark, as indicated below.Benchmarks for each region are as follows: North America - S&P 500; Latin America - relevant MSCI country index or MSCI Latin America Index; Europe - MSCI Europe; Japan - TOPIX; Asia - relevant MSCI country index.
Stock Price, Price Target and Rating History (See Rating Definitions)
Other Important DisclosuresMorgan Stanley produces a research product called a "Tactical Idea." Views contained in a "Tactical Idea" on a particular stock may be contrary to the recommendations or views expressed in this or other research on the same stock. This may be the result of differing time horizons, methodologies, market events, or other factors. For all research available on a particular stock, please contact your sales representative or go to Client Link at www.morganstanley.com.
For a discussion, if applicable, of the valuation methods used to determine the price targets included in this summary and the risks related to achieving these targets, please refer to the latest relevant published research on these stocks.
Morgan Stanley Research does not provide individually tailored investment advice. Morgan Stanley Research has been prepared without regard to the individual financial circumstances and objectives of persons who receive it. The securities/instruments discussed in Morgan Stanley Research may not be suitable for all investors. Morgan Stanley recommends that investors independently evaluate particular investments and strategies, and encourages investors to seek the advice of a financial adviser. The appropriateness of a particular investment or strategy will depend on an investor's individual circumstances and objectives. The securities, instruments, or strategies discussed in Morgan Stanley Research may not be suitable for all investors, and certain investors may not be eligible to purchase or participate in some or all of them.
Morgan Stanley Research is not an offer to buy or sell or the solicitation of an offer to buy or sell any security/instrument or to participate in any particular trading strategy. The "Important US Regulatory Disclosures on Subject Companies" section in Morgan Stanley Research lists all companies mentioned where Morgan Stanley owns 1% or more of a class of common securities of the companies. For all other companies mentioned in Morgan Stanley Research, Morgan Stanley may have an investment of less than 1% in securities or derivatives of securities of companies and may trade them in ways different from those discussed in Morgan Stanley Research. Employees of Morgan Stanley not involved in the preparation of Morgan Stanley Research may have investments in securities or derivatives of securities of companies mentioned and may trade them in ways different from those discussed in Morgan Stanley Research. Derivatives may be issued by Morgan Stanley or associated persons
Morgan Stanley and its affiliate companies do business that relates to companies/instruments covered in Morgan Stanley Research, including market making and specialized trading, risk arbitrage and other proprietary trading, fund management, commercial banking, extension of credit, investment services and investment banking. Morgan Stanley sells to and buys from customers the securities/instruments of companies covered in Morgan Stanley Research on a principal basis.

M O R G A N S T A N L E Y R E S E A R C H
March 2009U.S. Equity Strategy
48Jason Todd +1 212 761 7991 (for enquiries or requests please email [email protected])
Disclosure SectionWith the exception of information regarding Morgan Stanley, research prepared by Morgan Stanley Research personnel are based on public information. Morgan Stanley makes every effort to use reliable, comprehensive information, but we make no representation that it is accurate or complete. We have no obligation to tell you when opinions or information in Morgan Stanley Research change apart from when we intend to discontinue research coverage of a subject company. Facts and views presented in Morgan Stanley Research have not been reviewed by, and may not reflect information known to, professionals in other Morgan Stanley business areas, including investment banking personnel.
Morgan Stanley Research personnel conduct site visits from time to time but are prohibited from accepting payment or reimbursement by the company of travel expenses for such visits.
The value of and income from your investments may vary because of changes in interest rates or foreign exchange rates, securities prices or market indexes, operational or financial conditions of companies or other factors. There may be time limitations on the exercise of options or other rights in your securities transactions. Past performance is not necessarily a guide to future performance. Estimates of future performance are based on assumptions that may not be realized. Unless otherwise stated, the cover page provides the closing price on the primary exchange for the subject company's securities/instruments.
To our readers in Taiwan: Information on securities/instruments that trade in Taiwan is distributed by Morgan Stanley Taiwan Limited ("MSTL"). Such information is for your reference only. The reader should independently evaluate the investment risks and is solely responsible for their investment decisions. Morgan Stanley Research may not be distributed to the public media or quoted or used by the public media without the express written consent of Morgan Stanley. Information on securities/instruments that do not trade in Taiwan is for informational purposes only and is not to be construed as a recommendation or a solicitation to trade in such securities/instruments. MSTL may not execute transactions for clients in these securities/instruments.
To our readers in Hong Kong: Information is distributed in Hong Kong by and on behalf of, and is attributable to, Morgan Stanley Asia Limited as part of its regulated activities in Hong Kong. If you have any queries concerning Morgan Stanley Research, please contact our Hong Kong sales representatives.
Morgan Stanley Research is disseminated in Japan by Morgan Stanley Japan Securities Co., Ltd.; in Hong Kong by Morgan Stanley Asia Limited (which accepts responsibility for its contents); in Singapore by Morgan Stanley Asia (Singapore) Pte. (Registration number 199206298Z) and/or Morgan Stanley Asia (Singapore) Securities Pte Ltd (Registration number 200008434H), regulated by the Monetary Authority of Singapore, which accepts responsibility for its contents; in Australia by Morgan Stanley Australia Limited A.B.N. 67 003 734 576, holder of Australian financial services licence No. 233742, which accepts responsibility for its contents; in Korea by Morgan Stanley & Co International plc, Seoul Branch; in India by Morgan Stanley India Company Private Limited; in Canada by Morgan Stanley Canada Limited, which has approved of, and has agreed to take responsibility for, the contents of Morgan Stanley Research in Canada; in Germany by Morgan Stanley Bank AG, Frankfurt am Main, regulated by Bundesanstalt fuer Finanzdienstleistungsaufsicht (BaFin); in Spain by Morgan Stanley, S.V., S.A., a Morgan Stanley group company, which is supervised by the Spanish Securities Markets Commission (CNMV) and states that Morgan Stanley Research has been written and distributed in accordance with the rules of conduct applicable to financial research as established under Spanish regulations; in the United States by Morgan Stanley & Co. Incorporated, which accepts responsibility for its contents. Morgan Stanley & Co. International plc, authorized and regulated by Financial Services Authority, disseminates in the UK research that it has prepared, and approves solely for the purposes of section 21 of the Financial Services and Markets Act 2000, research which has been prepared by any of its affiliates. Private U.K. investors should obtain the advice of their Morgan Stanley & Co. International plc representative about the investments concerned. In Australia, Morgan Stanley Research, and any access to it, is intended only for "wholesale clients" within the meaning of the Australian Corporations Act. RMB Morgan Stanley (Proprietary) Limited is a member of the JSE Limited and regulated by the Financial Services Board in South Africa. RMB Morgan Stanley (Proprietary) Limited is a joint venture owned equally by Morgan Stanley International Holdings Inc. and FirstRand Investment Holdings Limited, which is wholly owned by FirstRand Limited.
The information in Morgan Stanley Research is being communicated by Morgan Stanley & Co. International plc (DIFC Branch), regulated by the Dubai Financial Services Authority (the DFSA), and is directed at wholesale customers only, as defined by the DFSA. This research will only be made available to a wholesale customer who we are satisfied meets the regulatory criteria to be a client.
The information in Morgan Stanley Research is being communicated by Morgan Stanley & Co. International plc (QFC Branch), regulated by the Qatar Financial Centre Regulatory Authority (the QFCRA), and is directed at business customers and market counterparties only and is not intended for Retail Customers as defined by the QFCRA.
The trademarks and service marks contained in Morgan Stanley Research are the property of their respective owners. Third-party data providers make no warranties or representations of any kind relating to the accuracy, completeness, or timeliness of the data they provide and shall not have liability for any damages of any kind relating to such data. The Global Industry Classification Standard ("GICS") was developed by and is the exclusive property of MSCI and S&P.
Morgan Stanley Research, or any portion hereof may not be reprinted, sold or redistributed without the written consent of Morgan Stanley.
Morgan Stanley Research is disseminated and available primarily electronically, and, in some cases, in printed form.
Additional information on recommended securities/instruments is available on request.

M O R G A N S T A N L E Y R E S E A R C H
March 2009U.S. Equity Strategy
49Jason Todd +1 212 761 7991 (for enquiries or requests please email [email protected])
The Americas
1585 Broadway
New York, NY 10036-8293
United States
Tel: +1 (1) 212 761 4000
Europe
25 Cabot Square, Canary Wharf
London E14 4QA
United Kingdom
Tel: +44 (0)20 7425 8000
Japan
4-20-3 Ebisu, Shibuya-ku
Tokyo 150-6008
Japan
Tel: +81 (0)3 5424 5000
Asia/Pacific
Three Exchange Square
Central
Hong Kong
Tel: +852 2848 5200
© 2008 Morgan Stanley