m. gautham machaiah - media habits of legislators: a case study of
TRANSCRIPT
MEDIA HABITS OF LEGISLATORS:
A CASE STUDY OF KARNATAKA MLAs AND MLCs
A thesis submitted to the University of Mysore
for the award of the Degree of
Doctor of Philosophy
in Communication and Journalism
By
M. Gautham Machaiah
Department of Journalism and Communication
University of Mysore
(May, 2006)

ABSTRACT
This study is entitled, Media Habits of Legislators: A Case Study of Karnataka
MLAs and MLCs. The primary objective of the study is to explore the habits and
preferences of the legislators of Karnataka across six dimensions of the media�
newspapers, magazines, television, radio, internet and mobile downloads�in terms of
consumption, treatment and effect.
The media and the legislature are vital cogs in the wheels of democracy. Media
and politics are two inseparable entities, which exert an undeniable influence over each
other. However, the media habits of the legislators remain a mystery as no serious
attempt has been made in the past to study their pattern and level of consumption.
The interview schedule was employed to obtain the required data from over half
of the 297 members of the legislature, through a structured questionnaire. The researcher
adopted the proportionate random sampling method in order to provide due
representation to various demographic groups including, MLAs and MLCs, political
parties, regions, gender, age group, economic level, education and communities like
Scheduled Castes and Tribes.
The data is analysed using appropriate statistical techniques. In addition to
studying the pattern of media habits of the legislators, the credibility perception and the
impact of the media on the performance of the legislators is also analysed.
A major finding of the study is that the consumption of the media is extremely
high among the legislators, which in some cases exceeds the national average of media

usage. Across all media, the dependence of the legislators on newspapers is the highest.
Similarly, the highest number regards newspapers as the most credible medium.
Politics is the first news priority among all legislators across print, electronic and
new media, while all other news factors fade into oblivion.
All the respondents agree that the media impacts their performance as legislators
in one way or the other. They also concur that the media is fair in its coverage of them as
legislators.
However, the dependence on local newspapers, magazines, radio and cable
channels is extremely low among the respondents, who prefer the State level media for
news about their districts and constituencies.
Though Bangalore has established its leadership as the software capital of India,
Information Technology does not evoke any interest among the legislators. Virtually all
legislators are allotted a computer by the government, but a majority of them do not surf
the internet.
The legislators are also yet to discover the efficacy of e-mail and short messaging
service (SMS), as they prefer traditional modes of communication.
(Dr K.J. Joseph) (M. Gautham Machaiah) Guide and Reader Department of Communication and Journalism Mysore University Mysore

DECLARATION
I, M. Gautham Machaiah, do hereby declare that this thesis entitled, Media Habits
of Legislators: A Case Study of Karnataka MLAs and MLCs, submitted to the University
of Mysore, for the award of the Degree of Doctor of Philosophy in Communication and
Journalism is a record of original and independent research work conducted by me during
the period 2003-2006, under the supervision and guidance of Dr K.J. Joseph, Reader of
Communication and Journalism, University of Mysore. This thesis in whole or part has
not been previously submitted for any Degree, Diploma, Associateship, Fellowship or
other similar degree of this or any other University. Material obtained from other sources
is duly acknowledged in this thesis.
(M. Gautham Machaiah)
Mysore
May 15, 2006
CERTIFICATE Dr K.J. Joseph
Reader and Guide
Department of Communication and Journalisms
Manasa Gangotri
Mysore
This is to certify that the thesis entitled, Media Habits of Legislators: A Case
Study of Karnataka MLAs and MLCs, is a record of original research work conducted by
M. Gautham Machaiah, during the period 2003-2006 under my guidance and supervision,
for the award of the Degree of Doctor of Philosophy in Communication and Journalism.
This thesis in whole or part has not been previously submitted for any Degree, Diploma,
Associateship, Fellowship or other similar degree of this or any other University.
Material obtained from other sources is duly acknowledged in this thesis.
(Dr K.J. Joseph)
Mysore
May 15, 2006

ACKNOWLEGEMENT
One can pay back the loan of gold,
but one lives forever in debt to those who are kind.
� Malayan Proverb
I owe an enormous debt of gratitude to Dr K.J. Joseph, Reader, Department of
Communication and Journalism, Mysore University, who has very ably guided me
through this research project. He was a source of continuous strength to me as a friend,
philosopher and guide. Dr Joseph�s firm belief in the Bhagawad Gita�s famed adage, �Let
noble thoughts flow from all directions,� enabled me to benefit from the knowledge of a
galaxy of academicians.
I am immensely thankful to Dr N. Usha Rani, Chairperson, Department of
Communication and Journalism, Mysore University, from whose vast experience this
work has gained enormously. I acknowledge with gratitude the support rendered by Dr
Usha Rani at every stage of the study.
I express my sincere gratitude to Dr Kushal Kumar, Professor, Manipal Institute
of Communication; Dr N.S. Ashok Kumar, Head, Department of Electronic Media
Studies, Bangalore University; and Dr M.K. Sridhar, Reader, Canara Bank School of
Management Studies, Bangalore University; who have very kindly shared their time and
expertise. A special thanks to the members of my Doctoral Committee.
I am deeply indebted to Dr H.S. Ashok, Reader, Department of Psychology,
Bangalore University, for enriching this study through his abundant knowledge of
research methods and statistical applications.

I am extremely obliged to my friend, Mr Gabriel Vaz, Deputy Political Editor,
The Economic Times, Bangalore, with whose unstinted support it was possible to
complete the process of data collection in a record period.
The legislators of Karnataka, who are the subjects of this study were not only
accommodative, but also envisaged a keen personal interest in this project. I sincerely
appreciate their patience and consideration.
I very thankfully acknowledge the invaluable contribution of my colleague, Ms
Akshata Pai, in the execution of this work. It is rare to find people who are as selfless and
thoughtful as her.
I wish to profusely thank my company, the Zee Group, and it�s Chairman Mr
Subhash Chandra for affording me the time to undertake this extensive study.
My gratitude is due to my friend, Mr S. Umesh, who uncomplainingly
accompanied me on my numerous trips to Mysore in connection with this project. I am
also grateful to my colleagues Mr Ramzan and Mr Arun for all their assistance.
Dr Chiranjeev Singh, IAS, former Additional Chief Secretary, Government of
Karnataka, motivated me to pursue an academic programme such as this. I am thankful to
him.
I am overwhelmed by the support I have received from various quarters in the
course of this study. I shall forever remain indebted to them.
(M. Gautham Machaiah)
Mysore
May 15, 2006
CONTENTS
Title iAbstract iiDeclaration ivCertificate vAcknowledgement vi Chapter I INTRODUCTION 1The gamut of politics 1Forms of government 2Types of government 3Patterns of government 3Brief history of Karnataka 6Origin and growth of the media 8History of newspapers 8Newspapers in India 11Kannada Press 14News agencies 15History of radio 16Radio in India 17History of television 18Television in India 20New media 21Media scene in Karnataka 23Significance of the study 24Review of literature 28 Chapter II METHODOLOGY 50Objectives 50General objective 50Specific objectives 50Method of study 50Research tool 52Sampling method 52Socio-demographic profile of the universe 53Socio-demographic and economic profile of the respondents 56Summary 66

Chapter III ANALYSIS AND INTERPRETATION 67Newspaper reading habits and preferences 67Preference for international newspapers 76Preference for local newspapers among legislators 77News priorities in newspapers 78Comparative analysis of news priorities of legislators in newspapers 88Preference for cartoons 90Magazine reading habits and preferences 93Preference for international magazines among the legislators 102Preference for local magazines 103News priorities in magazines 104Analysis of news priorities in magazines 118Television viewing habits and preferences 120Preference for international channels among the legislators 129Preference for local cable channels 130Analysis of news priorities in television 131Comparative analysis of news priorities across newspapers, magazines and television
145
Radio listening habits and preferences 151Preference for international radio stations 157Preference for local radio stations 158Analysis of news priorities of legislators in radio 160Comparative analysis of news priorities between MLAs and MLCs across print and electronic media
173
Comparative analysis of news priorities of legislators across print and electronic media
176
Internet using habits and preferences 182Analysis of mobile phone usage 199Analysis of media utility and credibility 206Analysis of media credibility 216 Chapter IV FINDINGS AND INFERENCES 226Suggestions 258 REFERENCES 259 APPENDIX Interview schedule

INDEX OF TABLES Table 1 Composition of Assembly and Council 54Table 2 Gender distribution in the Assembly and Council 55Table 3 Distribution of respondents in the Assembly and Council 56Table 4 Respondents according to their gender 57Table 5 Respondents according to their party 57Table 6 Respondents in each age group 58Table 7 Respondents according to their region 59Table 8 Respondents according to their educational qualification 59Table 9 A cross tabulation of respondents� age group and education level 60Table 10 A cross tabulation of respondents� age group and gender 60Table 11 A cross tabulation of respondents� age group and party 61Table 12 A cross tabulation of respondents� age group and region 61Table 13 A cross tabulation of respondents� education and party 62Table 14 A cross tabulation of respondents� education and region 62Table 15 A cross tabulation of respondents� gender and education 63Table 16 A cross tabulation of respondents� gender and their party affiliation 63Table 17 A cross tabulation of respondents� gender and region 64Table 18 A cross tabulation of MLAs and MLCs, and their education 64Table 19 A cross tabulation of MLAs and MLCs, and their gender 64Table 20 A cross tabulation of the age group of MLAs and MLCs 65Table 21 A cross tabulation of party affiliation of MLAs and MLCs 65Table 22 A cross tabulation of MLAs and MLCs from different regions 66Table 23 Respondents who subscribe to and read newspapers 67Table 24 Respondents who read newspapers regularly 68Table 25 Time spent with newspapers by the respondents 68Table 26 Time spent with newspapers and education of the respondents 69Table 27 Number of newspapers read by respondents across age group 71Table 28 Number of newspapers read and the education of the legislators 73Table 29 Legislators who read international newspapers 76Table 30 Newspaper relied on for local news by MLAs and MLCs 77Table 31 First news priority in newspapers between gender 78Table 32 Second news priority in newspapers between gender 79Table 33 Third news priority in newspapers between gender 81Table 34 First news priority of MLAs and MLCs in newspapers 83Table 35 Second news priority of MLAs and MLCs in newspapers 84Table 36 Third news priority of MLAs and MLCs in newspapers 86Table 37 Legislators who read cartoons and their age group 90Table 38 Gender of respondents who read cartoons 92Table 39 MLAs and MLCs who read cartoons 92Table 40 Respondents who read magazines 93Table 41 Respondents who read magazines and their age group 94Table 42 Time spent with magazines by the respondents 95
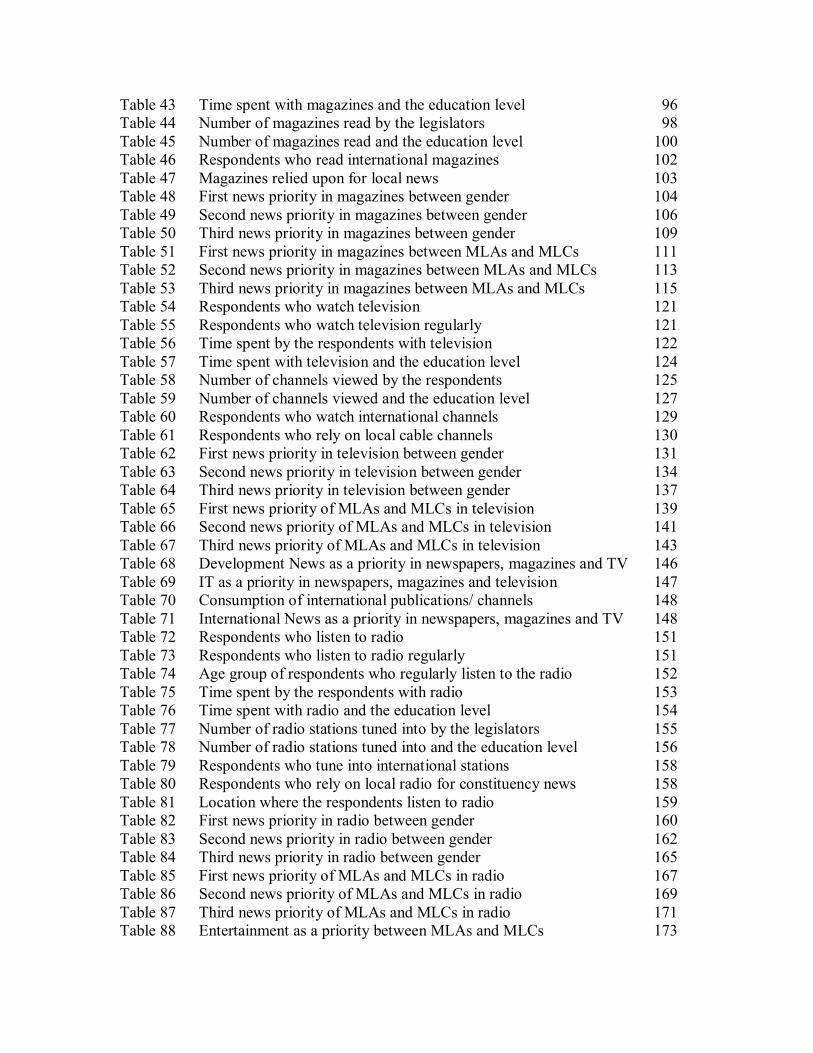
Table 43 Time spent with magazines and the education level 96Table 44 Number of magazines read by the legislators 98Table 45 Number of magazines read and the education level 100Table 46 Respondents who read international magazines 102Table 47 Magazines relied upon for local news 103Table 48 First news priority in magazines between gender 104Table 49 Second news priority in magazines between gender 106Table 50 Third news priority in magazines between gender 109Table 51 First news priority in magazines between MLAs and MLCs 111Table 52 Second news priority in magazines between MLAs and MLCs 113Table 53 Third news priority in magazines between MLAs and MLCs 115Table 54 Respondents who watch television 121Table 55 Respondents who watch television regularly 121Table 56 Time spent by the respondents with television 122Table 57 Time spent with television and the education level 124Table 58 Number of channels viewed by the respondents 125Table 59 Number of channels viewed and the education level 127Table 60 Respondents who watch international channels 129Table 61 Respondents who rely on local cable channels 130Table 62 First news priority in television between gender 131Table 63 Second news priority in television between gender 134Table 64 Third news priority in television between gender 137Table 65 First news priority of MLAs and MLCs in television 139Table 66 Second news priority of MLAs and MLCs in television 141Table 67 Third news priority of MLAs and MLCs in television 143Table 68 Development News as a priority in newspapers, magazines and TV 146Table 69 IT as a priority in newspapers, magazines and television 147Table 70 Consumption of international publications/ channels 148Table 71 International News as a priority in newspapers, magazines and TV 148Table 72 Respondents who listen to radio 151Table 73 Respondents who listen to radio regularly 151Table 74 Age group of respondents who regularly listen to the radio 152Table 75 Time spent by the respondents with radio 153Table 76 Time spent with radio and the education level 154Table 77 Number of radio stations tuned into by the legislators 155Table 78 Number of radio stations tuned into and the education level 156Table 79 Respondents who tune into international stations 158Table 80 Respondents who rely on local radio for constituency news 158Table 81 Location where the respondents listen to radio 159Table 82 First news priority in radio between gender 160Table 83 Second news priority in radio between gender 162Table 84 Third news priority in radio between gender 165Table 85 First news priority of MLAs and MLCs in radio 167Table 86 Second news priority of MLAs and MLCs in radio 169Table 87 Third news priority of MLAs and MLCs in radio 171Table 88 Entertainment as a priority between MLAs and MLCs 173

Table 89 Women Issues as a priority between MLAs and MLCs 173Table 90 Sports as a priority between MLAs and MLCs 174Table 91 Crime News as a priority between MLAs and MLCs 174Table 92 Development News as a priority between MLAs and MLCs 175Table 93 Agriculture News as a priority between MLAs and MLCs 175Table 94 Entertainment as a priority across print and electronic media 176Table 95 Development News as a priority across print and electronic media 176Table 96 Preference for international media 178Table 97 Comparison of International News as a priority across media 178Table 98 IT as a priority across print and electronic media 179Table 99 Crime News as a priority across print and electronic media 180Table 100 Business News as a priority across print and electronic media 180Table 101 Environment News as a priority across print and electronic media 181Table 102 Talk Shows as a priority across television and radio 181Table 103 Respondents who have a computer at home/ office 186Table 104 Respondents who surf the net 187Table 105 Respondents who surf the net among political parties 189Table 106 Number of MLAs and MLCs who surf the net 190Table 107 Gender of the respondents who surf the internet 191Table 108 Respondents who use the net regularly 192Table 109 Time spent on the net by the respondents 192Table 110 Time spent with internet and the education level 193Table 111 Number of sites visited by the respondents 194Table 112 First news priority of the respondents in internet 195Table 113 Second news priority of the respondents in internet 196Table 114 Third news priority of the respondents in internet 197Table 115 Use of e-mail by the legislators 198Table 116 Respondents who own a mobile phone 202Table 117 Respondents who download news through the mobile 202Table 118 Respondents who regularly download news through the mobile 203Table 119 Use of SMS within political parties 203Table 120 Media relied on by the legislators to communicate with the people 211Table 121 Use of media to collate background information for debates 212Table 122 Respondents who formulate their views based on media reports 212Table 123 The single most important way that the media impacts performance 213Table 124 Respondents who convene press conferences/ issue press notes 214Table 125 News medium to which respondents attach the most credibility 218Table 126 Credibility perception and the region of the legislators 219Table 127 Perception of credibility among respondents of different parties 220Table 128 Respondents who regard the media as fair in its coverage 225

INDEX OF CHARTS Chart 1 Depiction of gender distribution in the legislature 56Chart 2 Consumption of newspapers across education level 74Chart 3 Language of newspapers read by the legislators 75Chart 4 Comparison of first news priorities in newspapers 88Chart 5 Comparison of the time spent with newspapers and magazines 95Chart 6 Education of legislators reading magazines for one hour and above 97Chart 7 Comparison of number of newspapers and magazines read 99Chart 8 Language of the magazines read by the respondents 101Chart 9 Depiction of legislators who read international magazines 102Chart 10 Comparison of first priorities in newspapers and magazines 105Chart 11 Comparison of regular users of newspapers, magazines and television 122Chart 12 Time spent with newspapers, magazines and television 123Chart 13 Comparison of consumption of newspapers, magazines and television 126Chart 14 Language of television programmes viewed by the respondents 128Chart 15 Readers/ viewers of international newspapers/ magazines/ television 129Chart 16 Depiction of respondents who depend on local cable channels 130Chart 17 Depiction of first priority among legislators in television 133Chart 18 Comparison of first priority in newspapers, magazines and television 145Chart 19 Entertainment as a priority in newspapers, magazines and television 147Chart 20 Women Issues as a priority in newspapers, magazines and television 149Chart 21 Sports as a priority in newspapers, magazines and television 150Chart 22 Language of radio programmes listened to by the respondents 157Chart 23 Depiction of first priority in radio among legislators 161Chart 24 Women Issues as a priority across print and electronic media 177Chart 25 Sports as a priority across print and electronic media 179Chart 26 Depiction of respondents who have a computer at home or office 186Chart 27 Respondents who surf the net and their party affiliation 189Chart 28 Usage of SMS facility by respondents across party 204Chart 29 Usage of print, electronic and new media by the respondents 206Chart 30 Media consumption by the respondents 207Chart 31 Regularity of usage of different media 208Chart 32 Depiction of time spent on different media 209Chart 33 Comparison of Politics as the first priority across media 210Chart 34 Respondents who convene press conferences/ issue press notes 214Chart 35 Comparison of media utility 215Chart 36 Comparison of credibility attached to different media 218Chart 37 Comparison of regularity of media usage and credibility perception 221Chart 38 Comparison of media relied on for Politics, and credibility perception 222Chart 39 Media consumption and perception of credibility 223Chart 40 Dependence on local media by the respondents 224Chart 41 Respondents who regard the media as fair in its coverage 225

CHAPTER I
INTRODUCTION
Were it left to me to decide whether we should
have a government without newspapers, or
newspapers without a government, I should not
hesitate a moment to prefer the latter.
Thomas Jefferson, 1787
Politics and Media have been an intrinsic part of the society from time
immemorial. Even before man could write, news spread by word of mouth at crossroads,
campfires, markets, through messengers or by the beat of drums. Politics and Media
have, and forever shall, remain inseparable. In order to understand the subject matter of
this work in the right perspective, a study of the history of politics and the media, is
imperative.
THE GAMUT OF POLITICS
The term Politics was first used by Aristotle, who called it the master science.
Politics is derived from the Greek word Polis, which means city, though today the term is
more popularly associated with politicians or party politics. For politics to exist, there

should first be a State. The State must possess Population, Territory, Government and
Sovereignty.
Forms of Government
Absolute Monarchy: Here all authority is vested with a supreme ruler. As Louis
XIV of France remarked, �I am the State.� 1
Limited Monarchy: In this system, the monarch is limited by a written
Constitution or some fundamental conventions, as in Britain.
Democracy: The term democracy is derived from the Greek words, demos
(people) and kratos (power). It thus flows that democracy is the power of the people. It is
a form of government where people rule themselves either directly, or indirectly, or
through their representatives. As Abraham Lincoln remarked, �Democracy is the
government of the people, by the people, for the people.�
Direct Democracy: Here, the government is run directly by the people, who
gather periodically to levy taxes, approve budgets and make policy decisions. The Swiss
Landsgemeinde still follows this system at the cantonal level.
Indirect Democracy: Under this system, the will of the people is formulated not
directly by the people, but by their representatives to whom they delegate the power, as in
India.
1. Kapur, A.C. Principles of Political Science. 15 ed. S. Chand and Company, 1986. 55.

Types of Government
Unitary: Here, all powers are exercised by a single central government. Local
administrations enjoy only delegated power. This type of government is prevalent in
Britain, France, Italy, Japan and Iran.
Federal Government: The word Federation is derived from the Latin word,
feodus, which means treaty or agreement. Unlike a Unitary government, here the powers
are clearly demarcated between the Union and the States. The United States is the best
example of a Federal government.
The question whether India is a Unitary or Federal State has been a topic of
intense debate among political scientists for long. One widely accepted view is that India
is Federal in nature, but Unitary in spirit. As Durga Das Basu, notes in his book,
Commentary on the Constitution of India, �The Constitution of India is neither Federal
nor purely Unitary, but a combination of both.� 2
Patterns of Government
Presidential System: Under the Presidential system which had its origins in the
United States, the legislature and executive are two distinct arms of the government. The
President is the real executive and draws his powers directly from the Constitution.
Non-Constitutional Regimes: These include totalitarianism, dictatorship and military
regimes.
2. Das Basu, Durga. Commentary on the Constitution of India. 6 ed. Calcutta: S.C. Sarkar, 1965. 40.

Parliamentary system: In a Parliamentary system, a clear demarcation is made
between the head of State and head of government. Here, the head of State, King/Queen
in Britain and President in India, possesses nominal or titular authority while the real
power vests with the government, headed by the Prime Minister.
India has adopted the Parliamentary system, where the three pillars of the
government are Legislature, Executive and Judiciary, while the media is often described
as the fourth.
Chapter II of the Indian Constitution provides for a bicameral legislature at the
Centre, namely, the Council of States (Rajya Sabha) and the House of the People (Lok
Sabha). Part IV of the Constitution provides for a uniform structure in all States except
Jammu and Kashmir which has its own Constitution. The Parliamentary system of
government is applicable to the States also. Here, the Chief Minister is the head of
Government, while the Governor is the titular head.
The States may be unicameral or bicameral in nature. Karnataka, whose
legislators are the subject of this study, has a bicameral legislature with a Legislative
Council and a Legislative Assembly. The presiding officers of the Council and Assembly
are called Chairman and Speaker respectively.
The Legislative Council in Karnataka comprises 75 members of whom 25 are
elected by Legislative Assembly members, 25 are elected by local authorities, seven each
are elected by graduates and teachers and 11 members are nominated by the Governor.
The Assembly has a total strength of 225. While 224 members are elected directly
by the people, one is nominated by the Governor from among the Anglo-Indian
community.

While the Legislative Council is a continuous body which cannot be dissolved,
the Assembly has a term of five years, unless earlier dissolved. The minimum age to
become a member of the Council is 30 years and that of the Assembly is 21 years.
In this context, it might be interesting to note that the then Mysore was the first
province in India to have elected representatives. The institution of a Representative
Assembly took shape as early as 1881, with 144 members. The Legislative Council came
into existence in 1907.
In his foreword to the book, History of Legislature, the then Governor, P.
Venkatasubbiah, noted:
The former Mysore State was a pioneer in many fields of human activity.
The State was the forerunner in India in the matter of creating and
successfully steering a democratic institution. 3
Before narrowing down to the subject matter specific, it would be prudent to
briefly study the history of Karnataka, as the legislators are impacted by the social,
political and economic factors of their region.
Hence, any attempt to understand the mindset and behaviour of the legislators of
the State without first taking the historic perspective into consideration, will not do
justice to this study.
3. Te, Hanumanthaiah. History of Karnataka Legislature. Vol. 1. Bangalore: Government Printing Press

Brief History of Karnataka
There are varied interpretations of the word, Karnataka, but the most acceptable
explanation comes from famed historian Dr Suryanath U. Kamath, in his book History of
Karnataka:
One view is that the original name was Kannada, which was Sanskritised
as Karnata. A popular view is that the name is derived from black soil
(kari-nadu). But the most accepted view is that the word Karnata is
derived from karu and nadu, the elevated land, as major parts of the State
are situated in the Deccan Plateau.4
The first major royal dynasty in recorded history is the Shatavahanas, who are
said to have ruled the region from 30 BC. Other well known rulers of Karnataka are
Kadambas, Gangas, Chalukyas, Hoysalas, Vijayanagar Empire, Bahman Shahis,
Adhilshahis and more recently Hyder Ali, Tippu Sultan and Wodeyars of Mysore, not to
mention the British.
It would not be wrong to surmise that the Wodeyars who ruled the region after the
fall of Tippu Sultan in 1700, laid the foundation for modern Karnataka. The contribution
of Diwans of Mysore, particularly Purnayya, Seshadri Iyer (who constructed the first
hydro-electric plant in Asia at Shivanasamudram), Sir M. Visvesvaraiah and Sir Mirza
Ismail, is recalled even to this day.
Kamath, Suryanath U. History of Karnataka. Bangalore: Archana Prakashana, 1982. 1.
Visvesvaraiah who spearheaded the movement for industrialisation by his slogan
�industrialise or perish� is regarded as the architect of modern Mysore. He was
responsible for the Krishna Raja Sagar dam, Mysore Economic Conference, Mysore
Bank, Chamber of Commerce, Mysore University, Kannada Sahitya Parishat and
Bhadravathi Iron and Steel Factory, among others.
When Sir Arcot Ramaswamy Mudaliar was the Diwan, Jayachamarajendra
Wodeyar acceded Mysore to the Indian Union in 1947. With this, K.C. Reddy assumed
office as the Chief Minister of the State on October 25, 1947. This was followed by the
movement for unification and on November 1, 1956, a unified Mysore State came into
existence. The New Mysore State had S. Nijalingappa as the Chief Minister, while
Jayachamarajendra, the erstwhile ruler, was appointed as the Governor. In November,
1973, Mysore was renamed as Karnataka.
Thanks to the patronage industrialisation received during the time of the
Maharajas and successive governments thereafter, Karnataka is today home to several
public and private sector units like BEML, BHEL, BEL, HAL, Wheel and Axle Plant,
ITI, Infosys, Tata Consultancy Services, Intel, Wipro, Toyota and Volvo, to mention a
few.
Karnataka has become the Information Technology (IT) powerhouse of India,
leading all other States in software exports. It is bidding to retain its pre-eminent position
as the second most important global centre after Silicon Valley, California.
Bangalore, Karnataka�s capital founded by Magadi Kempegowda over 300 years ago,
with its salubrious climate and excellent working conditions, has become the preferred
destination for investors from across the globe.

No doubt, right from the time of the Maharajas, Karnataka has been referred to as
a model State.
Karnataka is the eighth largest State in the country, with a population of 52.73
million people according to the 2001 census. Karnataka�s literacy rate stands at 67.04 per
cent, which is slightly higher than the national average of 65.38 per cent. Among women,
the literacy rate is 57.45 per cent, while among men it is 76.29 per cent.
Karnataka is regarded as a cosmopolitan State due to the prominent presence of
several linguistic sub-groups. However, the majority of the population speaks Kannada,
which is the official language of the State.
ORIGIN AND GROWTH OF MEDIA
History of Newspapers
The history of newspapers is often described as a romance, for the story is truly
passionate.
Human beings are considered precursors of newspapers, as they exchanged news
long before they could write. However, it was with the arrival of writing and literacy that
news reports gained added reliability and, in advanced societies like that of Rome and
China, became more formal. Rome had a particularly sophisticated system for circulating
written news, centered on the acta -- daily handwritten news sheets, which were posted
by the government in the Roman Forum from the year 59 B.C. to at least A.D. 222. They
were filled with news of political happenings, trials, scandals, military campaigns and
executions. The word Journalism has its origin in a French derivation from the Latin term
�diurnalis� meaning, a daily.
China, too, had early government-produced news sheets, called the tipao, which
were first circulated among officials during the Han dynasty (202 B.C. to A.D. 221) and
were printed at some point during the T�ang dynasty (618 to 906).
The invention of the letter press by Johann Gutenberg employing movable type,
in the 1450s, led to a proliferation of printed weeklies in Europe during the sixteenth and
seventeenth centuries. The first newspaper which was actually printed in England on
September 24, 1621, had an unusually long title with atrocious spelling, Corante, or
weekely newes from Italy, Germany, Hungary, Poland, Bohemia, France and the Low
Countreys. Its publisher gave only his initials, N.B., and unfortunately for the history of
English journalism, there were two active printers in London with those initials --
Nathaniel Butter and Nicholas Bourne. Cases have been made for both of them as
England�s first newspaper journalist.
But the first successful English daily was the Daily Courant, which appeared in
London in 1702. Britain�s American colonies, because of their sparse populations and
strict governments, entered the world of the newspaper relatively late. �Public
Occurrences, Both FORREIGN and DOMESTICK� was printed in Boston by Benjamin
Harris on September 25, 1690. But the sensational news carried by the newspaper
ensured that the first publication was also the last. It was not until 14 years that another
newspaper was published in the colonies.
America�s second printed newspaper, The Boston News-Letter which first
appeared in 1704 and survived for 72 years, was distributed by the town�s postmaster

John Campbell. But Campbell refused to give up the newspaper even after he lost his
position, which forced his successor William Brooker to launch his own newspaper,
Boston Gazette, on December 21, 1719.
American journalism also saw an era of crime, sex and sensationalism with the
birth of the Penny Press in the 1830s. It was during this period that the word �yellow
journalism� emerged out of a battle between William Randolf Hearst of San Francisco
Examiner and Joseph Pulitzer of New York World, for the rights to a cartoon character
known as the �Yellow Kid�.
Sensationalism, notwithstanding, simultaneous efforts at serious newsgathering
were made by American editors like Benjamin Russell who visited the docks to obtain
news early from recently arrived ships. Soon they were rowing out to meet the ships in
the harbour, and then racing out in fast boats. One of the first ventures in cooperative
news gathering came when most of the major New York newspapers joined together to
send a boat out into the harbour in search of European newspapers and news.
In London, news gathering efforts were more advanced. The first major
breakthrough, which is of much academic value to this study, came in the late eighteenth
century, when newspapers gained the right to send observers to the Parliament gallery.
But they were not permitted to take notes until 1783.
However, the most dramatic improvement in the speed, breadth and reliability of
news coverage came with the advancement of technology which began with Samuel
Morse�s invention of the telegraph.
But journalism�s rapid strides through history would not have been possible, but
for the heroic struggle of its forerunners, for the freedom of the Press. Among the first

journalists to go to jail was James Franklin, the printer of The New England Courant
(1721), who carried on a political crusade against the colonial government. In order to
evade a court verdict which forbade him from printing the newspaper, James Franklin
appointed his younger brother Benjamin Franklin, whose scientific exploits are better
known, as the publisher. The Press saw several such limitations in the coming days in the
form of the Stamp Act in Britain, its colony America, and the Sedition Act in America
when John Adam was President, which led to fifteen convictions.
One of the most significant landmarks in the struggle for Press freedom was the
first amendment to the American Constitution in 1789, which stated, �The Congress shall
make no law�abridging the freedom of speech or of the Press.�
Newspapers in India
The beginning of Indian journalism may be traced to the setting up of the printing
press by Christian missionaries to propagate their religion in the country. The first
printing press was established in Goa in 1556, which led to the printing of the first book
in India, Doutrina Christa. This was followed by several other initiatives including the
setting up of a press in Bombay by Bhimji Parekh and another by Danish Missionaries in
Tanjore district.
But it was not until 1780, that India had its first newspaper, The Bengal Gazette
or the Calcutta Advertiser which was owned, edited, printed and published from
Calcutta by James Augustus Hicky.

Bengal Gazette or Hicky�s Gazette as it was popularly called, pioneered the
struggle for the freedom of the Press with its fight against the rulers. Even when Hicky
was imprisoned, his paper continued to appear. When efforts to gag Hicky failed, his
press was seized. This led to the death of the Gazette and soon of Hicky himself.
The second newspaper to be started in November, 1780, was India Gazette, an
initiative of two Calcutta based businessmen, Bernard Messink and Peter Reed. In
September, 1784, the Calcutta Gazette and Oriental Adviser was published. It had the
direct patronage of the government and later became the official gazette. The other
newspapers which followed were: Bengal Journal (February, 1785), Oriental Magazine of
Calcutta Amusement (April, 1785) and the Calcutta Chronicle (January, 1786).
Madras had its first brush with journalism in 1785 with the launch of Madras Courier,
which enjoyed the patronage of the administration. In 1795, Robert Williams published
the Weekly Madras Gazette, which was also regarded as a government mouthpiece. The
same year, Humphreys, an Englishman launched the India Herald, despite being denied
permission by the government. He was subsequently arrested and put aboard a ship to be
deported to Britain, but he escaped from the ship in Calcutta and disappeared.
Censorship in its official form first came into existence in Madras, when on
December 12, 1795, the administration ordered that all government orders before being
published in the Weekly Madras Gazette had to be sent to the Military Secretary for
scrutiny.
Bombay�s first newspaper, Bombay Herald appeared in 1789. This was followed
by the Bombay Courier (1790), which changed its name to Bombay Times in 1838,
before becoming the present The Times of India; and the Bombay Gazette (1791).

The Serampore missionaries also made immense contribution to Indian
journalism with three journals, the first Bengali monthly magazine Dig Darshan (1818),
which was later converted into a weekly, Samachar Darpan, and Friend of India (1835).
The year 1857 is considered a dark period in the history of Indian journalism. The
Sepoy Mutiny prompted the government to introduce the Gagging Act of 1857, to
prevent the seeds of sedition from being sown by the Press in the minds of the people.
This led to the arrest of several editors.
The establishment of the Indian National Congress in 1885 gave rise to a new
wave of nationalism in the Indian Press. And the close of the nineteenth century saw the
birth of several newspapers like The Times of India of Bombay (1861), the Pioneer of
Allahabad (1865), Madras Mail of Madras, the Statesman of Calcutta, The Hindu of
Madras and Amrita Bazar Patrika of Calcutta (1868).
The cry for freedom of the Press intensified during the First World War, leading
to the launch of New India by Annie Besant and B.P. Wadia. Among the nationalistic
papers were Young India, Navajivan and Harijan, started by Gandhiji, which were used
to launch a vitriolic attack against the British, and Sambad Kaumudi of Raja Ram Mohan
Roy.
But with the declaration of war, an ordinance was promulgated to control the flow
of news, through the Press Act, which required newspapers to obtain a license and
deposit a sum, which could be forfeited.
During this period, a daily Hindi newspaper, Aj, appeared in 1920, as also
Swarajya (1922) in Madras, The Hindustan Times (1923) started by Sardar K.M.
Panikkar and The Forward (1923) in Calcutta.

The Indian Press played a valiant part during the freedom struggle by espousing
the cause of nationalism and openly attacking the British. India�s freedom in 1947 opened
a new era in journalism.
The Press in India draws its freedom from Article 19 (1) (a) of the Constitution.
Though there have been many attempts to suppress the media, the Indian Press has
largely remained free and fearless.
Kannada Press
The history of printing in Kannada dates back to 1834 when three German
missionaries came to Mangalore. They printed Jaimani Bharata in 1848, Basavapurana in
1850, Dasaparava Bharata and Channabasava Purana in 1851.
Printing came to Mysore in 1840 and the first newspaper to originate here was
Khasim-ul-Akhbar in 1863. The first Kannada weekly newspaper Karnataka Prakasika
was published in 1865, which was followed by the Mysore Gazette (1866) published by
the Government of Mysore to carry official news. In 1874, the Karnataka Prakasika
which had ceased to exist was relaunched by T.C. Srinivasachar. The Grand Old Man of
Mysore M. Venkatakrishnaiah, better known as Tataiah, is regarded as the Father of
Kannada journalism. He is credited with laying the foundation for modern Kannada
journalism. Another great contributor to Kannada journalism was D.V. Gundappa who
started a Kannada daily, Samachar Sangraha in 1907. Prominent among the newspapers
which played a crucial role in Kannada journalism are: Vruttantha Chintamani (1885),
Vruttantha Patrike (1887), Sarvodaya Prakasika (1888), Viswakarma (1921), Karmaveera
(1921), Tainadu (1926), Samyukta Karnataka (1929), Prajamatha (1931), Janavani
(1934), Navabharata (1941), Navayuga (1947), Vishwakarnataka (1947), Prajavani
(1948) and Shakti (1957).
News Agencies
The first news agency in the real sense of the term was Reuters, which was
established by Paul Julius Reuter of Cassay, Germany, in 1850. Initially, he employed the
services of pigeons and steamships to carry news bulletins. Soon, he shifted to London,
where the Central Press Agency was already in existence. With the establishment of
telegraphic news service, Reuters was successful in attracting several Indian newspapers,
the first among them being The Bombay Times, the forerunner of The Times of India.
But the high cost of transmission, prompted the Indian media to launch a local
agency. The result was the establishment of the Associated Press of India (API) in 1910,
largely due to the efforts of K.C. Roy, a Calcutta based correspondent for several
newspapers.
But soon Roy had to withdraw from API following a conflict with his partners
and start the Indian News Bureau. In 1919, Reuters took over the Associated Press of
India, the Indian News Agency and Indian News Bureau to launch the Eastern News
Agency, with Roy as the Chief Editor. In 1925, the Free Press of India came into
existence as a competition to existing news agencies which had refrained from reporting
nationalistic news. Lack of support from Indian newspapers and harsh measures by the
government saw the death of this agency in 1933. The gap was filled by the United Press

of India (UPI), which was started in 1933, but it collapsed in 1956. Incidentally, UPI was
the first agency to flash the news about the assassination of Mahatma Gandhi.
In 1941, the Orient Press was started to serve the interests of the Muslim League
and the Urdu Press, but it closed down in 1947.
The establishment of Press Trust of India (PTI) in 1948, in association with
Reuters is considered as the landmark in the history of news agencies in the country. The
entire business of Reuters in India was transferred to PTI, which was managed by a board
headed by the editor of The Hindu, Kasturi Srinivasan. The country saw the birth and
death of many news agencies during this period. In 1961, the United News of India (UNI)
was launched in association with the Associated Press of America. The recent past has
seen the establishment of many agencies including India Abroad News Service.
Karnataka also has its share of local agencies, prominent among them being, Kannada
News Net.
History of Radio
Radio owes its birth to Guglielmo Marconi, a self taught 21-year-old from
Bologna. Though Marconi had already performed simple experiments, it was on the
twelfth hour of the twelfth day of the twelfth month of 1901, that he received the first
transatlantic radio signal on Signal Hill.
Initial broadcasting attempts were limited to experiments and some public service
transmissions by government stations, but by the end of 1922, when the United States
witnessed a broadcasting boom, there were 500 radio stations.
The foundation for commercial broadcasting was laid by AT&T, which in 1922,
announced its plans to establish a national radio network and sell airtime, which it called
toll broadcasting, for programmes supported by advertisements. The public outcry over
this decision soon died down, with more and more radio stations being forced to sell
airtime, faced with an acute lack of resources.
Radio in India
Broadcasting was introduced in India by amateur radio clubs in Calcutta,
Bombay, Madras and Lahore. The first among them was the Madras Presidency Radio
Club, formed on May 16, 1924. It began broadcasting on July 31, the same year.
However, the first broadcast on an experimental basis took place from the roof of The
Times of India building in Mumbai on August 20, 1921.
The Madras Presidency Radio was short-lived as financial difficulties forced it to
close down in October 1927 and bequeath its transmitter to the Corporation of Madras. A
regular broadcasting service began the same year with the setting up of the Indian
Broadcasting Company Ltd, by a group of Indian businessmen who built two weak
stations at Calcutta and Bombay.
In the next three years they had gathered over 7000 listeners, but lost a great deal
of money in the process. The company was liquidated and taken over by the government,
which had set up its own service, Indian State Broadcasting Service (ISBS) in 1927, with
Lionel Fieldon as its Controller. However, an import duty of 50 per cent imposed on
radio sets proved to be an impediment in the growth of the industry.

On June 8, 1936, ISBS was renamed as All India Radio (AIR). It was World War
II that gave an impetus to broadcasting, with all news bulletins being broadcast from one
central newsroom and the introduction of 27 bulletins every day, mainly to counter Nazi
propaganda. Today, AIR broadcasts to about 155 countries and is accessible in remote
corners of India.
A new chapter has begun in the history of the radio, with the Indian government
de-regulating the airwaves, thereby paving the way for private operations in the FM radio
segment.
History of Television
Electronic television was first successfully demonstrated in San Francisco on
Sept. 7, 1927, by Philo Taylor Farnsworth, a 21-year-old inventor who had lived in a
house without electricity until he was 14. Though some experiments were conducted
even earlier in Russia and the United States, Farnsworth's invention, which scanned
images with a beam of electrons, is considered the direct ancestor of modern television.
The first image he transmitted on it was a simple line. Soon he aimed his
primitive camera at a dollar sign because an investor had asked, �When are we going to
see some dollars in this thing, Farnsworth?�
RCA, the company that dominated the radio business in the United States with its
two NBC networks, invested $50 million in the development of electronic television. In
1939, RCA televised the opening of the New York World Fair, including a speech by
President Franklin Delano Roosevelt, who was the first President to appear on television.

By 1941 the Columbia Broadcasting System (CBS), RCA's main competition in radio,
was broadcasting two 15-minute newscasts a day, to a small audience, on its New York
television station.
No new invention entered American homes faster than black and white television
sets and by 1955, half the homes had one. In the nineties, 98 per cent of the houses had at
least one TV set.
During the golden age of television between 1953 and 1955, programming began
to take some steps away from radio and theatre formats, towards big money quiz shows
like the $64,000 Question. Soon, television began competing with newspapers as the
country�s primary source of news. In 1964, colour broadcasting began on prime-time
television, giving a new dimension to broadcasting. In 1967, the Public Broadcasting
System, a non-commercial public television network, the fourth in the US, was created on
the recommendations of the Carnegie Commission.
Television�s development followed different patterns in other countries. In Great
Britain, the British Broadcasting Corporation, the country's major radio broadcaster,
established and retained dominance over television. The BBC, funded by a tax on the sale
of television sets, established a worldwide reputation for producing quality programming.
The Canadian Broadcasting Corporation also came to be known for its news and public
affairs programming.
France�s major television networks were supported by the government, leading to
a tilt in news coverage towards the party in power. By the late 1980s and 1990s, as cable
and direct-satellite television systems increased the number of channels, the hold of these
government-funded networks began to weaken. Most countries around the world began

moving towards the US model of privately owned, advertiser-supported television
networks.
Television in India
The ten year demand for television by educational institutions was realised in
1959 when Philips offered a transmitter to the government at a reduced cost. A UNESCO
grant of $20,000 for the purchase of community receivers and a United States grant of
some equipment led to the setting up of the Delhi Television Centre on September 15,
1959.
The range of the transmitter was 40 Km. Soon, 20 minute programmes were
beamed twice a week and the viewers comprised members of the 180 teleclubs which
were provided free sets by UNESCO. Entertainment and information programmes were
introduced from August 1965, with Germany helping in setting up a studio.
By 1970, the duration of the service was increased to three hours which in
addition to news and entertainment included Krishi Darshan. The transmitter range was
increased to 60 Km and the number of TV sets, all of which were imported, stood at
22,000.
In 1972, the Bombay centre was set up, followed by Srinagar, Amritsar and Pune,
the next year. In 1975, Calcutta, Madras and Lucknow were put on the television map.
Another significant development was the separation of television from All India Radio in
1976, with the formation of Doordarshan.

In 1977, terrestrial transmitters were set up at Jaipur, Hyderabad, Raipur,
Gulbarga, Shamalpur and Muzaffarpur to extend television coverage to a population of
about 100 million. In 1977, for the first time in the history of broadcasting in India,
political parties shared an equal ratio of time with the ruling party during the election.
There have been two ignition points in the history of Indian television. The first
was in 1982, when colour TV was introduced by Doordarshan during the Asian Games. It
then proceeded to install transmitters nationwide rapidly for terrestrial broadcasting. In
this period, no private enterprise was allowed to set up television stations or to transmit
TV signals.
The second spark came in the early nineties with the broadcast of satellite TV by
foreign programmers like CNN followed by Star TV and a little later by domestic
channels such as Zee TV and Sun TV, into Indian homes.
Though prior to the satellite invasion, Doordarshan offered a dull fare, it
nevertheless succeeded in attracting millions of viewers through soaps like Hum Log
(1984), and mythological dramas, Ramayan (1987-88) and Mahabharata (1988-89). In
1990, Doordarshan and AIR were brought under the autonomous Prasar Bharati
Corporation, with a view to freeing them from government shackles.
Today, Indian homes have access to over a hundred channels.
New Media
In 1973, the US Defense Advanced Research Projects Agency (DARPA) initiated
a research programme to investigate techniques and technologies for interlinking packet

networks of various kinds. The objective was to develop communication protocols which
allow networked computers to communicate transparently across multiple, linked packet
networks. This was called the Internetting project and the system of networks which
emerged from the research was called the �internet�. The system of protocols which was
developed over the course of this research effort became known as the TCP/IP Protocol
Suite, after the two initial protocols developed: Transmission Control Protocol (TCP) and
Internet Protocol (IP).
In 1986, the US National Science Foundation (NSF) initiated the development of
the NSFNET which, today, provides a major backbone communication service for the
internet. The National Aeronautics and Space Administration (NASA) and the US
Department of Energy contributed additional backbone facilities in the form of the
NSINET and ESNET respectively. In Europe, major international backbones such as
NORDUNET and others provide connectivity to over one hundred thousand computers
on a large number of networks.
A great deal of support for the internet community has come from the US
government, since the internet was originally part of a federally-funded research
programme and, subsequently, has become a major part of the US research infrastructure.
During the late 1980s, however, the population of internet users and network constituents
expanded internationally and began to include commercial facilities, news being one of
them.
Websites have also played a major role in politics, with the 2000 presidential
campaign in the US demonstrating the power of the internet to raise funds for candidates
by collecting contributions through the net.

Internet was brought to India in March 1986, by Overseas Communications
Service (OCS) the precursor of Videsh Sanchar Nigam Limited (VSNL).
The beginning of this century saw the dotcom boom in India, when hundreds of
websites including news portals mushroomed across the country, with Bangalore being
the hub. But with e-commerce failing to take off, dotcoms lost their sustainability,
leading to an inevitable meltdown.
The advent of mobile telephones has brought about a new revolution, with
consumers being able to download the latest news through Short Messaging Service
(SMS) on their instruments.
Media Scene in Karnataka
Prominent among the newspapers in the State are: The Times of India, Deccan
Herald, The Hindu, The New Indian Express, The Asian Age, Vijay Times, The
Economic Times, The Hindu Business Line, Vijaya Karnataka, Prajavani, Samyukta
Karnataka, Kannada Prabha, Udayavani and Sanjevani.
All national and prominent international magazines are available in Karnataka. In
addition, prominent magazines published from Karnataka include Taranga, Tushara,
Roopatara, Mayura and Sudha.
Karnataka has access to all major television networks including CNN, BBC, Fox,
Sky, Star, Zee, Headlines Today, Doordarshan, NDTV, Udaya, ETV, Siticable and
Chandana.

Besides AIR, the other stations available in the State are Radio City FM 91 and
Worldspace. However, news continues to be the domain of AIR.
There are also several portals devoted to Karnataka.
Subscribers to Spice, Airtel, Hutch, Tata Indicom, Reliance and BSNL mobile
services also have access to the latest news through their handsets.
SIGNIFICANCE OF THE STUDY
The media and the legislature are vital cogs in the wheels of democracy. Media
and politics are two inseparable entities, which exert an undeniable influence over each
other. However, the media habits of the legislators are a mystery in the absence of a
comprehensive study in the past to explore their pattern and level of consumption. This
study is pioneering in nature as it maps the media habits of the legislators in considerable
detail.
There have been innumerable studies across the world, on media and politics, the
most common among them being agenda-setting. Almost all these studies are motivated
by the pioneering works of Maxwell E. McCombs and Donald L. Shaw, who are widely
viewed as the intellectual godfathers of the agenda-setting research approach.
Another source of inspiration is Walter Lippman, who began his 1922 classic,
Public Opinion, with a chapter, �The World Outside and the Pictures in Our Heads�,
where he argues that the result of this mediated view of the world is that priorities of the
media strongly affect the priorities of the public.

As McCombs argues:
The power of the news media to set a nation�s agenda, to focus public
attention on a few public issues, is an immense and well-documented
influence. Not only do people acquire factual information about public
affairs from the news media, readers and viewers also learn how much
importance to attach to a topic on the basis of the emphasis placed on it in
the news.� 5
Yet, there is also an equally strong school of thought which questions the agenda-
setting role of the media. In his book, Public Opinion, The Press, and Public Policy, Dan
Berkowitz, states that news agenda is not set in the same way that the agenda-setting
tradition considers the transferal of a set of issue priorities from the mass media to the
public mind. Instead, the creation of a news agenda is the result of a process that depends
on much more than loosely linked transferal of one group�s priorities to another.
The author argues that the news sources exert stronger influence over the news
agenda than do journalists. But it is policy makers who have been found to be even more
influential in setting the news agenda than the overall group of news sources that
journalists rely upon, the book surmises.
In their book, Manufacturing Consent: The Political Economy of Mass Media,
Edward S. Herman and Noam Chomsky, provide an analysis of the ways in which
respondents and organisations of the media are influenced to shape the social agendas of
5. McCombs, Maxwell. The Agenda-Setting Role of the Mass Media in Shaping of Public Opinion, sourced from the internet.
knowledge and, therefore, belief. Contrary to the popular perception of members of the
press as hard-bitten realists doggedly pursuing unpopular truths, the book proves
conclusively that free market economics model of media leads inevitably to normative
and narrow reporting. The authors argue that contrary to the usual image of the news
media as cantankerous, obstinate, and ubiquitous in their search for truth and defence of
justice, in their actual practice, they defend the economic, social, and political agendas of
the privileged groups that dominate the society, the State and the global order.
Arguably, there seems to be no unanimity among scholars about the concept of
agenda-setting. Who sets the agenda for whom? Does the media set the agenda for
politicians or is it vice-versa? A veritable chicken and egg situation.
Amidst these conflicting versions, no significant attempt seems to have been
made to address the basic question in the Indian context: Do our policy makers, in the
first place, read newspapers or watch television? What is the level of media consumption
among the law makers? Their media habits remain virtually unknown.
This holds good for legislators in Karnataka too, in the absence of any in-depth
study in the past to understand their media habits. Views are diverse. Though some may
perceive politicians to be uninformed, it is not uncommon to find legislators who quote
liberally from newspapers and books, with élan, in their debates. Where lays the truth?
Are the legislators of Karnataka worldly unwise or are they made of intellectual stuff?
The study presents a complete pattern of media habits of the legislators with
regard to consumption, treatment and effects, across six dimensions: newspapers,
magazines, television, radio, internet and mobile downloads. The study also aims to
understand the news priorities of the respondents.

As an off-shoot of Herman and Chomsky�s work, the level of credibility attached
by the legislators to the news media is also examined. Which media do they attach more
credibility to � print or electronic? Do they perceive the media as carriers of truth or do
they look at it with cynicism?
An evaluation of the use of new media like internet by legislators forms an
integral part of this study, against the backdrop of Karnataka seeking to become the first
fully e-governed State in the country. The study provides vital insights into the exposure
of the respondents to technology. An understanding of their preference towards the new
media is significant in the light of the State�s objective to remain as the leader in the
Information Technology sector.
The acts of the legislators impact millions of people, either directly or indirectly.
The structure of democracy rests on them. In a free society like ours, the media can play a
crucial role in conveying the minds of the people to the leaders. It is thus imperative to
establish the media habits of legislators so that the tools of public opinion can be put to
best use. The study also analyses in detail the manner in which the legislators utilise the
media in the discharge of their official responsibilities.
As such, the results of this study are expected to be of immense value to
researchers, students, media planners, journalists, politicians, NGOs, pressure groups and
the legislators themselves. It is also significant that for the first time, the study explores
the complete ambit of media habits and preferences of the legislators of Karnataka, with
particular reference to consumption, utility, impact and the credibility perception.

REVIEW OF LITERATURE
Newspapers
Beyond Books. Newspapers in Politics. 06 Jan. 2005. Apex Learning Inc. 08 Feb. 2005
<http://www.beyondbooks.com/gop00/4a.asp>.
Americans have read newspapers to follow important political issues right from
the colonial era. Newspapers also played a major role in elucidating the arguments in
favour of and opposed to the ratification of the Constitution.
Presidents continue to receive daily briefings on, and often read major
newspapers. They even keep up with political cartoons and comic strips such as
�Doonesbury� to see which way the political winds are blowing. Despite brutal
competition from newer forms of mass media, the old-fashioned daily paper retains its
influence.
Israel, Milton. Communications and Power: Propaganda and the Press in the Indian
National Struggle, 1920-1947. Cambridge: Cambridge University Press, 1994.
At the end of the First World War, India�s government officials and nationalist
politicians began to recognise the need for an organised communications network. The
challenge for government and nationalists alike was to create a propaganda machine that
could disseminate news to a large and diverse population, at the same time eliciting the
desired political response. This book describes the role of the press in the last stage of the
nationalist struggle in India on the eve of the British departure.

Jeffrey, Robin. India�s Newspaper Revolution: Capitalism, Politics and the Indian
Language Press, 1977-1999. Palgrave Macmillan, 2000.
This book shines a light into a black hole: the revolution in India�s newspapers,
and the reading habits of its people, since the late 1970s. Indian daily circulations have
increased by close to 500 per cent in twenty years.
The book pinpoints the role of advertising in propelling a print boom in ten major
Indian languages; analyses the role of capitalism and technology in shaping identity �
national or otherwise; and examines patterns of ownership, the recruitment of journalists
and the forces striving to control the Indian-language press. By charting the immense
changes in the production and consumption of print, the book contributes to a more
precise understanding of events in India in the 1980s and 1990s.
Television
Beyond Books. Television in Politics. 06 Jan 2005. Apex Learning Inc. 08 Feb. 2005
< http://www.beyondbooks.com/gop00/4c.asp>.
The American political landscape was forever changed by the television.
Although the technology had been available before World War II, many Americans
finally put televisions in their living rooms in the 1950s. The medium of television has
the power to make or break political careers. The first campaign to take advantage of the
TV advertisement was Dwight Eisenhower�s successful 1952 bid. Piecing together
snappy music, lively animation, and short clips from Eisenhower�s speeches that later

journalists would call sound bites, the ads helped him steamroll the colourless rival
campaign.
Television has greatly influenced how politicians are perceived via the sound bite
and negative campaigning. Television images can prove powerful, enduring, and a
catalyst for social or political change. The most successful politicians have mastered the
television�s potential, as did Ronald Reagan, during his election campaign.
Graber, Doris A. Processing Politics: Learning from Television in the Internet Age.
University of Chicago P, 2001.
The media is often blamed for doing a dismal job of informing the public. The
study aimed to find out which media was favoured by the public, especially with regard
to political information.
The book shows that more and more people rely on information from television
and the internet to make important decisions. It integrates a broad range of current
research on how people learn to show that televised presentations - at their best - actually
excel at transmitting information and facilitating learning.
Hoerrner, Keisha L. �Symbolic Politics: Congressional Interest in Television Violence
from 1950 to 1996.� Journalism and Mass Communication Quarterly. Winter
(1999).
Drawing from sociological research, this study tested the relationship between
social, economic, and political factors and congressional actions regarding television
violence over forty-six years, and advanced a political science theory, symbolic politics,
as an explanation for the relationship.
Empirical analysis revealed Congress� actions are more symbolic than
substantive. Taken together, the actions correlate with political and social factors.
Significantly, congressional interest in television violence has no relationship to the
amount of violence on television, suggesting legislators� moral outrage is questionable.
Jones, Jeffrey P. Entertaining Politics: New Political Television and Civic Culture
(Communication, Media, and Politics). Rowman & Littlefield, Inc., 2004.
The book challenges the assumption that satirical television talk shows do not
influence politics. It explores the role of new political television in shaping a changing
civic culture.
The study demonstrates how viewers understand and make use of the increasingly
blurred lines between �serious� and �entertainment� programming and argues that critics
who predict the end of politics in the age of television have misconstrued the role of the
medium and the commitment of audiences to both TV and public life. It explores how
commentators have revived political humour as an accessible means of political critique.
Rajgopal, Arvind. Politics After Television: Hindu Nationalism and the Reshaping of
Public Opinion in India. Cambridge University Press, 2001.
In January 1987, Doordarshan, the Indian state-run television, began broadcasting
a Hindu epic � the Ramayan, in serial form, to nationwide audiences. The book argues
that what resulted was the largest political campaign in post-Independence times, around

the symbol of Lord Rama, led by Hindu nationalists. The complexion of Indian politics
irrevocably changed thereafter.
The book analyses this series of events. While audiences may have thought they
were harking back to an epic golden age, Hindu nationalist leaders were embracing the
prospects of neoliberalism and globalisation. Television was the device that hinged these
movements together, symbolising the new possibilities of politics, at once more inclusive
and authoritarian, the author argues.
Agenda Setting
Chomsky, Naom. Necessary Illusions: Thought Control in Democratic Societies. South
End Press, 1989.
This is an essential introduction to the �propaganda model� of media analysis. It
gives an excellent look at mind and thought control at the society level.
Chomsky�s argument centres on the �framing� of public discussion. If those in
power �frame� the debate on issues within bounds acceptable to their interests, then the
debate is controlled. By �framing�, the thoughts of the public are also controlled through
limited information or misinformation.
Chomsky reminds us that the majority of the populace rely on various media
institutions for their information about political affairs; both domestic and foreign. For
example, the popular myth of the �persistent Soviet veto� at the UN during the Cold War.
People believed the USSR was constantly vetoing all Security Council resolutions simply
because when USSR did veto, it generated front page condemnation. When the USA or

the UK exercised their right of veto, there was no noise. As Chomsky notes, during the
years of 1970 and 1989 the former Soviet Union vetoed eight resolutions. The US vetoed
56. This is what Chomsky refers to as Thought Control.
Herman, Edward S, and Naom Chomsky. Manufacturing Consent: The Political
Economy of the Mass Media. Pantheon Books, 2002.
The book is an analysis of the ways in which individuals and organisations of the
media are influenced to shape the social agendas of knowledge and, therefore, belief.
This path-breaking work shows that contrary to the usual image of the news
media as cantankerous, obstinate, and ubiquitous in their search for truth and defence of
justice, in their actual practice they defend the economic, social, and political agendas of
the privileged groups that dominate domestic society, the State, and the global order.
What emerges from this work is a powerful assessment of how propagandistic the
US mass media is, how it systematically fails to live up to its self-image as a provider of
the kind of information that people need to make sense of the world, and how we can
understand its function in a radically new way.
Kelly, Jean, Jan Knight, Jason Nedley, Lee Peck, and Guy Reel. �On the Straight and
Narrative: The Effect of Writing Style on Readers� Perceptions of News Story
Quality.� Newspaper Research Journal. (Fall 2003).
Few studies have empirically examined whether narratives work or whether the
straight-news approach is unappealing to readers as has been suggested. This exploratory
study examined these issues, and it also investigated whether the subject matter of a

story, separate from writing style, had an effect on reader assessment of story traits and
whether writing style influenced readers� assessment of the importance of the news
subject.
The results of this experiment show that straight news and narrative stories often
did not differ in their ability to engage readers, and in some cases the narrative may have
actually been more effective. Secondary analyses revealed that story subject matter did
not influence readers� assessments of story traits and that story style did not influence
salience. Some communication professionals suggest that the inverted pyramid is
ineffective and call for a narrative approach to news.
McCombs, Maxwell, and David L Protess. Agenda Setting: Readings on Media, Public
Opinion and Policy Making. Hillsdale, New Jersey: Lawrence Erlbaum
Associates, 1991.
The media is constantly influencing our lives in a variety of ways. It sets
standards for voters and citizens. Candidates go before the people through the mass
media rather than in person. The information in the mass media becomes the only contact
many have with politics. The pledges, promises, and rhetoric encapsulated in news
stories, columns, and editorials constitute much of the information upon which a voting
decision is made.
However, people vary greatly in their attention to mass media political
information. The educated and most politically interested (and those least likely to
change political beliefs), actively seek information; but most seem to acquire it, if at all,
without much effort. It just comes in. On any single subject many �hear� but few �listen�.

Soroka, Stuart N. Agenda-Setting Dynamics in Canada. University of British Colombia,
2002.
The book investigates the relationship between media, the public, and policy
makers as a means of understanding political systems.
It examines why media, public, and policy agendas move together on certain
issues, but not on others; the degree to which these trends can be explained by real-world
factors; and the extent to which they are the product of media effects, public concern, or
attention from policymakers.
The text explores eight issues in Canada from 1985 to 1995: AIDS, crime,
debt/deficit, environment, inflation, national unity, taxes, and unemployment to explore
how the salience of issues changes over time, and to examine why these changes are
important to our understanding of everyday politics.
New Media
Bernt, Joseph P., Guido H. Stempel III, and Thomas Hargrove. �Relation of
Growth of Use of the Internet to Changes in Media Use from 1995 to 1999.�
Journalism and Mass Communication Quarterly. Spring (2000).
This national survey of media use examines the rise of the internet as a media tool
and the corresponding decline of the use of other media.
The survey shows a huge gain for internet use and a decline for both local and
network television news and for newspapers. A comparison of those who use the internet
and those who do not, shows that internet users are more likely than non-users to be
newspaper readers and radio news listeners.

For both local and network television news viewing, there is no significant
difference between users and non-users of the internet. Clearly, the internet is not the
cause of the decline in use of the other media.
Beyond Books. The Internet in Politics. 06 Jan 2005. Apex Learning Inc. 08 Feb. 2005
<http://www.beyondbooks.com/gop00/4d.asp>.
Since the advent of television, no innovation has had the potential to impact
politics greater than the internet. With more and more people getting connected, the
ability to reach millions of voters will be a lure which no politician can resist.
In 1996, all major presidential candidates developed web sites to support their
campaigns. In the year 2000, the internet did not eclipse the influence of newspapers,
radio, or television. However, cyberspace has an advantage over the older news sources.
The internet is an interactive medium, allowing citizens to send information as well as
receive it � in real time.
The key word for the internet and politics, however, is potential. The 2000
presidential campaign demonstrated the power of the internet to raise funds for
candidates by collecting contributions via the web. Regardless, the internet is already a
powerful tool for delving into political issues.
Bimber, Bruce A., and Richard Davis. Campaigning Online: The Internet in US
Elections. N.p.: Oxford UP, 2003.
Many claim that the internet will be the latest medium to revolutionise electoral
politics. Candidates invest heavily in web and e-mail campaigns to reach prospective

voters, as well as to communicate with journalists, potential donors, and political
activists. Do these efforts influence voters, expand democracy, increase the coverage of
political issues, or mobilise a shrinking and apathetic electorate?
The book answers these questions by looking at how candidates present
themselves online and how voters respond to their efforts � including whether voters
learn from candidates� web sites and whether voters� views are affected by what they see.
Although the internet will not lead to a revolution in democracy, it will have
consequences: reinforcing messages, mobilising activists, and strengthening partisans�
views.
Cornfield, Michael, ed. Commentary on the impact of the internet on the 2004 election.
<http://www.pewinternet.org/PPF/r/151/report_display.asp>.
During the American election cycle in 2003-04, the internet was a key force in
politics as 75 million Americans used it to get news, discuss candidates in emails, and
participate directly in the political process
The internet made a difference in the 2004 presidential race as campaigners
learned a great deal about how to use the internet to attract and aggregate viewers,
donors, message forwards, volunteers, and voters. The most successful campaigns relied
on it to gain advantages over their competitors. A large number of adult Americans relied
on the internet to learn about the campaigns, to help make up their minds, to help others
make up theirs, and to register and vote
Davis Richard, and Diana Owen. New Media and American Politics. New York: Oxford
University Press. 1998.
This is the first book to examine the effect of the new media, which include
tabloid journalism, television talk shows, entertainment media, and computer networks,
on modern politics. It discusses the new media�s cultural environment, audience, and
content, before going on to evaluate its impact on everything from elections to policy
making to the old media itself.
While no consensus has been reached about the wide ranging implications of the
new media�s political presence, it is fair to say that the new media has substantially
altered the way that journalists operate, politics is conducted, the way the public relates to
media, politicians, institutions, and political processes. In the debate over the new
media�s role, significance, and implications for democratic governance, some argue that
new media has the potential to be a positive force in society. New media is the people�s
media. It also acts as a check on the mainstream press, which an increasing number of
ordinary people perceive to be an elite domain too closely aligned with politicians and
government to play a legitimate watchdog role.
Lee Kaid, Lynda. �Political Advertising and Information Seeking: Comparing Exposure
via Traditional and Internet Channels.� Journal of Advertising 31 (2002)
The 2000 campaigns were heralded as a high point in new communication
technologies, the campaign in which the internet would replace traditional media
channels for communicating with the electorate. The significance of this new medium
suggests the need to compare its effectiveness with that of more traditional media

channels as a means of disseminating the current dominant form of candidate
communication and political television advertising. This experimental research compares
exposure to presidential ads via the internet versus traditional channels in the 2000
presidential campaign.
The results indicate that undecided voters exposed to internet political advertising
changed their vote choice to Al Gore, whereas �undecideds� who viewed the same spots
on television changed their preferences in favour of George Bush. The political cynicism
level of neither group was affected by exposure, but there were significant differences in
the types of information seeking and political activity intentions between the two groups.
Micheal, Parenti J. Inventing Reality: The Politics of News Media. 2nd ed. Wadsworth,
1992.
This passionate, controversial critique of the news media examines the subtle but
profound ways in which the media influences and manipulates the public�s perception of
reality. It dissects news coverage of the most recent world events.
The book demonstrates how the media shapes public awareness and attitudes
through distortion or suppression of specific information. It attacks the widely held belief
that the news media is controlled by liberals and liberal opinion � and depicts the news
media as a controlling institution of the American capitalist system, an institution that
serves the interests of the rich and powerful while appearing to serve the community at
large.

Viquerie, Richard and Franke, David. America�s Right Turn: How Conservatives Used
New and Alternative Media to Take Power. Bonus Books, Inc. 2004
This book describes how, beginning in the 1950s, the American right wing began
to establish their own media as a means of building the movement. The authors describe
the impact of talk radio, direct mail, conservative-oriented cable news, the internet and
other �alternative� media on the political landscape, occasionally looking over the
political fence to report on how liberals are attempting to counter the conservative media
revolution.
Media and Politics
Beyond Books. The Media and Politics. 06 Jan. 2005. Apex Learning Inc. 08 Feb. 2005
<http://http://www.beyondbooks.com/gop00/4.asp>.
After the Congress, the President, the Supreme Court, and the federal
bureaucracy, no institution has an impact on the American government as large as the
media. Since colonial days, newspapers have shaped the views of American citizens, of
the political leaders and institutions. The twentieth century introduced radio and
television as powerful new players in politics. As the millennium came to a close,
politicians wrestled with the impact of the newest form of media � the internet.
Members of the media have acted as watchdogs on private enterprise and public
officials. Bob Woodward and Carl Bernstein of The Washington Post played crucial roles
in exposing the White House role in the Watergate cover-up. Throughout American
history, the most successful politicians were those who could manipulate the dominant
news medium of their time. Franklin Roosevelt successfully used the radio in his series of

Fireside Chats. Dubbed �The Great Communicator�, Ronald Reagan made his political
career with his television image. Although vilified by many, the American press has
asserted itself as a major player in shaping government policies � from the earliest days
to the present time.
Cook, Timothy E. Governing with the News: The News Media as a Political Institution.
2nd ed. University of Chicago P, 2005.
The ideal of a neutral, objective press has proven in recent years to be just that �
an ideal. But while everyone talks about the political biases and influences of the news,
no one has figured out whether and how the news media exerts power.
The book demonstrates not only how the media is structured as an institution that
exercises collective power but also how the role of the media has become
institutionalised within the political process, affecting policy and instigating, rather than
merely reflecting, political actions.
Craig, Geoffrey. The Media, Politics And Public Life. Allen & Unwin Pty., Limited,
2004.
The book examines the complex relationship between news media and politics
and its influence on public life. It focuses on the role of the news media in representing
politics while arguing that the media plays a central role in a functioning democracy, and
that public life is essentially mediated. It also discusses public opinion polls, the role of
the media in everyday life, and media representations of the nation

The book shows how politicians use the media, and points to constraints on the
media�s coverage of politics. It also provides a balanced evaluation of modern political
communication: exploring the loss of public trust in politicians and the media.
Edwards, Lee. Mediapolitik: How the Mass Media Have Transformed World Politics.
Catholic University of America P, 2001.
The book examines the burgeoning influence of the print and electronic media in
world politics and offers a theory of the role of twentieth century mass media and its
interconnectedness with politics.
The media plays a positive role when it supports liberal democracy but it can also
be misused to support illiberal regimes, such as that of Iraq�s Saddam Hussein. It raises
the question of how to assure that the media upholds liberty rather than authoritarianism.
Franklin, Bob. Packaging Politics: Political Communications in Britain�s Media
Democracy. 2nd ed. Hodder Headline Group, 2004.
Packaging politics has potentially troublesome implications for the political
process in a democracy. The book examines the changing character of political
communications in Britain since the election of New Labour in 1997.
This study examines the various ways in which politicians, spin doctors and
special advisers, in political parties, in central and local government and in Parliament
have become increasingly enthusiastic and effective in using mass media to present and
promote themselves and their policies to the public.
Graber, Doris A. A., Denis McQuail, and Pippa Norris. �Politics of News: The News of
Politics.� Congressional Quarterly, Inc (1998).
Citizens rely upon mass media as their principal source of information on
government and politics. But who decides what is reported and how? The selection of
stories to be covered on television news or in the newspaper, are subject to daily struggles
between journalists, politicians, and others who seek to influence public opinion.
The book explores who should, and who does, influence press coverage of politics
in democratic countries. It considers how the media operates as an intermediary for
communications between governments and citizens, between various political actors, and
even among citizens.
McChesney, Robert W. The Problem of the Media: U.S. Communication Politics in the
Twenty-First Century. Monthly Review Press, 2004
The symptoms of the crisis of the US media are well-known�a decline in hard
news, the growth of infotainment and advertorials, staff cuts and concentration of
ownership, increasing conformity of viewpoint and suppression of genuine debate.
The book explores the political economy of the media, illuminating its major
flashpoints and controversies by locating them in the political economy of US capitalism.
It deals with issues such as the declining quality of journalism, the question of bias, the
weakness of the public broadcasting sector, and the limits and possibilities of antitrust
legislation in regulating the media. It points out the ways in which the existing media
system has become a threat to democracy, and shows how it could be made to serve the
interests of the majority.

Richard, Gunther, and Anthony Mughan. Democracy and the Media: A Comparative
Perspective. Cambridge UP, 2000.
This book presents a unique perspective on the relationship between politics and
the media in different kinds of political regimes in Europe, North America and Asia. It
challenges conventional wisdom concerning the political roles and effects of the mass
media on regime support and change, on the political behaviour of citizens, and on the
quality of democracy.
The studies show that media effects on politics are the product of interactions
among media technologies, the structure of the media market, the legal and regulatory
framework, the nature of basic political institutions, and the characteristics of citizens.
Schultz, David A. Lights, Camera, Campaign!: Media, Politics, and Political Advertising.
Lang, Peter, Incorporated, 2005.
This anthology draws from case studies, interviews, and analysis of specific
campaigns and ads � mostly in the US but also in Canada � to explain how political
ads are constructed, why some work and some fail, and the factors about political ads that
allow them to make or break a campaign.
It explores the reality of political advertising in the media � the impact of
negative ads, what constitutes a good ad, new strategies, ads for specific audiences
(different ethnic groups) and campaigns, advertising for ballot initiatives � and
examines the role of the news in political campaigns.

Public Opinion
Berinsky, Adam J. Silent Voices: Public Opinion and Political Participation in America
Princeton University Press, 2006
Over the past century, opinion polls have come to pervade American politics.
Despite their shortcomings, the notion prevails that polls broadly represent public
sentiment.
In Silent Voices, the author argues that the very process of collecting information
on public preferences through surveys may bias our picture of those preferences.
Berinsky focuses on the many respondents who say they �don�t know� when asked for
their views on the political issues of the day.
The book concludes that �don�t know� responses are often the result of a
systematic process that serves to exclude particular interests from the realm of recognised
public opinion. Thus surveys may then echo the inegalitarian shortcomings of other
forms of political participation and even introduce new problems altogether.
Herbst Susan. Reading Public Opinion: How Political Actors View the Democratic
Process. University of Chicago Press, 1998
Public opinion is one of the most complex concepts in democratic theory, and its
role is not fully understood in the political process.
The author explores how legislative staffers, political activists and journalists
actually evaluate and assess public opinion. She concludes that many political actors

reject �the voice of the people� as uninformed and nebulous, relying instead on interest
groups and the media for representations of public opinion.
Kennamer, David J. Public Opinion, The Press, and Public Policy. Praeger Publishers,
1992.
The book examines the way in which public opinion affects public policy via the
news media. As far as the media represents or characterises the public, it frames policy
questions and decisions. It conveys the overall climate of public opinion to policymakers.
While considering the impact of policymakers on the news agenda, the focus is
actually on a portion of a larger group called news sources. News sources exert a stronger
influence over the news agenda than do journalists. Further, policymakers have been
found to be even more influential than the overall group of news sources.
Lance, Bennett W and Paletz, David L. Taken by Storm: The Media, Public Opinion, and
US Foreign Policy in the Gulf War. University of Chicago Press (Trd).1994.
This is the most comprehensive study of the media and foreign policy, which
explains the role played by the mass media and public opinion in the development of
United States foreign policy during the Gulf War.
It examines the pre-war media debate, news coverage during and after the war,
how the news-gathering process shaped the content of the coverage, and the media�s
effect on public opinion and decision makers. It also examines more general patterns in
post-Cold War journalism and foreign policy. At stake are the reactions of a vast media

audience and the decision of government officials who see both the press and the public
as key elements of the policy game.
Lippmann, Walter. Public Opinion. Touchstone Books, 1997.
The book is a fundamental treatise on the nature of human information and
communication. The classic text examines democratic theory, citizenship in a democratic
society and the role of the media in forming public perceptions, expectations, and actions.
The work covers varied issues like stereotypes, image making, and organised
intelligence.
The study begins with an analysis of �the world outside and the pictures in our
heads�, a leitmotif that starts with issues of censorship and privacy, speed, words, and
clarity, and ends with a careful survey of the modern newspaper.
Tang, Wenfang. Public Opinion and Political Change in China. Stanford UP, 2005.
Working from a dozen public opinion surveys conducted from the late 1980s to
the late 1990s, this study analyses the role of the media and intellectuals in political
change, how support for reform and legitimacy relate to each other, and the effect of
public opinion in an authoritarian state.
It finds that the Chinese political system during the period had less influence on
public opinion than traditional culture, the growth of the commercial and consumer
market, and industrialisation.

Truman, David B. The Governmental Process: Political Interests and Public Opinion.
Knopf, 1951
This study of political groups, their origins and manoeuvres, remains a leading
source of ideas that explain outcomes in the American political system.
Significant amounts of power are wielded in American politics by outfits usually
known as �pressure groups�. These groups are critically important elements in the
political process.
Media Credibility
Abdulla, Rasha A., Bruce Garrison, Michael Salwen, Paul Driscoll, and Denise Casey,
comps. The Credibility of Newspapers, Television News and Online News.
School of Communication, University of Miami.
<http://com.miami.edu/car/miamibeach1.htm>.
This study in Florida in 2002 analyses the components of credibility of news from
newspapers, television, and online sites.
The study revealed that respondents evaluated newspaper and television news
credibility more similarly than they did online news credibility. All three news media
were judged positively in terms of being up-to-date and timely and most negatively in
terms of bias and completeness. However, online users were less negative than
newspaper readers and television viewers.
Newspaper credibility was found to have balance and honesty, while television
news credibility was found to have fairness. Online news credibility, however, was built
upon trustworthiness, timeliness, and bias factors.

Crawford, Craig. Attack the Messenger: How Politicians Turn You against the Media.
Rowman & Littlefield, Inc., 2005.
Politicians and the media are natural enemies, but in recent times, the relationship
has exploded into an all-out war. In this impassioned dissection of the rapid devolution of
the media�s power in today�s political environment, the author asserts that the public�s
distrust of the news media has reached at a high point, an issue he considers one of �the
most hazardous political challenges now facing Americans�.
When politicians turn the public against the media, everyone loses - especially
unbiased and courageous news reporting. Worse, when traditional reporters and media
are displaced, the pundits and alternative media take over. They become opinion
merchants, bartering outrageous assertions for audience appeal with little attention to the
truth. If the press is not believed - or believable - because politicians have turned the
public against it, then the press is not free, but under the thumbs of politicians. Without a
free press, there is no democracy.
ggg

CHAPTER II
METHODOLOGY
OBJECTIVES
General Objective
To study the media habits of the members of the Legislative Assembly and the
members of the Legislative Council of Karnataka.
Specific Objectives
a) To analyse the media habits of the legislators in relation to print, electronic
and new media.
b) To assess what media the legislators attach credibility to.
c) To study the impact of the media on the performance of legislators.
METHOD OF STUDY
The researcher has adopted the Survey method considering the diverse nature of
the respondents. The members of the Karnataka Legislative Assembly and the Legislative
Council constitute the universe of this study. For the purpose of this research, members of
the Assembly from 2004�the year when the present House was constituted�to date,
have been taken into consideration. The same period holds good for the Council, which is
a continuous body without a fixed term. The sample was selected from the official list of
the legislators prepared by the Karnataka Legislature Secretariat.
An exploratory study was first conducted on a pre-defined segment of legislators
comprising different demographic groups in order to provide a better insight and purpose
to this research. Certain infirmities which came to light during the pre-test were corrected
before commencing this study. Prominent among them was the language of the
questionnaire. Following suggestions from the exploratory sample, questionnaires were
provided both in English and Kannada. Similarly, a pointed question on whether
legislators read newspapers to find out if their names appeared in print had to be deleted
as the �motivation to distortion� arising out of the social desirability factor among the
legislators was found to be very high.
The total population consists of 297 members across both the Houses of the
legislature. The selection of sample posed some dilemmas to the researcher as they had to
be selected from among this limited universe. Initially, the random sampling method was
employed but it was discovered that the sample so selected did not proportionately reflect
the various demographic groups within the population. Traditional random sampling
techniques like the lottery method or the selection of every alternate unit did not ensure a
fairly representative sample. The sample that emerged from this exercise was lopsided
and over represented certain demographic groups like party affiliation or region.
This was overcome by adopting the stratified random sampling method. The
random selection of units from a stratified list of different variables ensured a fairly
proportionate representation of various groups.
However, certain groups could not be satisfactorily represented due to reasons
beyond the control of the researcher. For instance, of the total population of 297
members, the number of women is only 14. Thus, the researcher had no option but to

choose only from among these 14 female members, as a result of which it may appear
that the male members are over- represented. Similarly, within age-group, the researcher
had no control over the low or high representation of some age-groups within the total
population. Thus, in some cases the sample may include 100 per cent of a particular sub-
group, or vary from 70 per cent to 100 per cent. Nevertheless, the sample is
representative and therefore the inferences drawn can be generalised.
Further, a fair representation has also been possible in the case of party affiliation,
members belonging to both the Assembly and Council, and their region.
RESEARCH TOOL
Chief tool of data collection: Interview Schedule.
Considering the nature of this study, a structured questionnaire was administered
on the respondents in person. This circumvented proxy sampling as there was no scope
for personal assistants to fill up the form on behalf of the legislators. While a structured
questionnaire ensured definitive responses from the units, personal interviews provided
qualitative inputs in the form of the various observations made by the respondents.
SAMPLING METHOD
The population consists of 297 legislators from both the Houses of the legislature.
The sample for this study comprising 151 legislators, including ten female respondents,
represents more than 50 per cent of the population. The size is as per established
statistical standards. The criteria for the selection of sample included: due representation

to different parties, gender, members from the Northern and Southern parts of the State,
MLAs and MLCs, Backward Communities, Scheduled Castes and Scheduled Tribes,
education level, age groups and economic level. Thus, it is a truly representative sample.
The data obtained by the researcher using the interview schedule is tabulated and
the major findings are examined using appropriate statistical techniques.
The researcher has adopted a descriptive statistical analysis in terms of the
number of respondents and the percentage of the sample across the different groups.
The results are analysed and presented by taking each dimension of the media
separately, that is, newspapers, magazines, radio, television, internet and mobile phones.
Further the party-wise differences, differences across the two Houses of legislature and
between the two gender on the several dimensions of media habits in terms of quantity,
duration, and nature of media related activities are also examined.
Findings of the study project the media habits both at the surface level and across
different sub-sets.
The descriptive statistical analysis adopted by the researcher has enabled drawing
up of meaningful inferences.
SOCIO-DEMOGRAPHIC PROFILE OF THE UNIVERSE
The Mysore State, came into being in 1947 with the then Maharaja of Mysore
acceding his kingdom to India. A unified State comprising Kannada speaking people
came into existence in 1956. The Mysore State was renamed as Karnataka in 1973.
Karnataka has a bicameral legislature, comprising the Legislative Council or the
Upper House and the Legislative Assembly or the Lower House. The Members of the

Legislative Assembly are referred to as MLAs, while the Members of the Legislative
Council are called MLCs.
The Assembly has a total strength of 225 members, of which one member is
nominated by the Governor, from among the Anglo-Indian community, as mandated by
the Constitution of India. The remaining members are directly elected by the people,
through a universal adult franchise.
The Council has a sanctioned strength of 75 members, of which three seats were
vacant at the time of conducting this study. The members of the Council are indirectly
elected by various constituencies including the Assembly, local authorities, graduates and
teachers. Besides, the Constitution also provides for nomination of personalities who
have rendered yeomen service in different fields.
Table 1 - Composition of Assembly and Council
House Congress JDS BJP Others Vacant Total Assembly 65 58 79 23 0 225 Council 46 11 10 5 3 72 Total 111 69 89 28 3 297
Of the 225 members in the Assembly, the Congress has 65, the Janata Dal
(Secular) has 58, while the BJP has 79.
Besides Independents, the Assembly includes members from smaller parties like
Janata Dal (United), Maharashtra Ekikaran Samithi (MES) and Karnataka Chaluvali
Vatal Paksha. These have been grouped under �Others�.

Of the 72 members in the Legislative Council, the Congress has 46 members, JDS
has eleven members, Bharatiya Janata Party (BJP) has ten and �Others� have five.
The combined strength of the Assembly and Council is 297 members. In the
Council, three seats are vacant.
The combined strength of the Congress in the Assembly and Council is 111
members. JDS has 69 members, BJP has 89 members, while `Others� have 28 members.
Table 2 - Gender distribution in the Assembly and Council
House Male Female Vacant Total Assembly 219 6 0 225 Council 64 8 3 72 Total 283 14 3 297
Men dominate the Karnataka legislature, with the number of women
representatives being negligible.
Of the 225 members in the Assembly, there are only six women members, as
against 219 male members.
The Council has 72 members, of whom eight are women.
Thus, in a 297 member legislature, the strength of the women is only 14,

Chart 1: Depiction of gender distribution in the legislature
0%
20%
40%
60%
80%
100%
Male 97.3% 88.9% 95.3%
Female 2.7% 11.1% 4.7%
Assembly Council Total
The overall percentage of female respondents in both the Houses of the legislature
is 4.7 per cent. In the Assembly, they constitute only 2.7 per cent, while in the Council it
is slightly higher at 11.1 per cent.
SOCIO DEMOGRAPHIC AND ECONOMIC PROFILE OF THE RESPONDENTS Table 3: Distribution of respondents in the Assembly and Council
Frequency Per cent Valid Per cent Cumulative Per cent MLA 116 76.8 76.8 76.8 MLC 35 23.2 23.2 100 Total 151 100 100
The sample of this study comprises 151 members from both the Houses of the
legislature. The sample includes 116 of the 225 members of the Legislative Assembly

and 35 of the 72 members of the Legislative Council. Thus, members of the Assembly
and the Council are proportionately represented in this survey. Of the total respondents,
MLAs constitute 76.8 per cent, while MLCs comprise 23.2 per cent.
Table 4: Respondents according to their gender
Frequency Per cent Valid Per cent Cumulative Per cent Male 141 93.4 93.4 93.4 Female 10 6.6 6.6 100 Total 151 100 100
Of the total sample, 93.4 per cent are men, while 6.6 per cent are women. The
researcher had no control over the small representation to women as their total number in
the legislature stands at only 14. Of them, ten have been interviewed.
Table 5: Respondents according to their party
Frequency Per cent Valid Per cent Cumulative Per cent Cong 57 37.7 37.7 37.7 JDS 39 25.8 25.8 63.6 BJP 46 30.5 30.5 94 Others 9 6 6 100 Total 151 100 100
Of the respondents, 37.7 per cent belong to the Congress, 25.8 per cent to the JDS
and 30.5 per cent to the BJP. �Others� constitute 6 per cent.

Adequate precautions have been adopted to ensure a fairly proportionate
representation to the members of each party.
Of the 111 Congress members in the legislature, 57 have been interviewed. Of the
69 JDS members, the sample comprises 39 members. The same holds good for BJP
where the questionnaire has been administered on 46 of the 89 members.
Table 6: Respondents in each age group
Frequency Per cent Valid Per cent Cumulative Per cent 25-35 9 6 6 6 36-45 35 23.2 23.2 29.1 46-55 70 46.4 46.4 75.5 56-65 31 20.5 20.5 96 66-75 5 3.3 3.3 99.3 > 75 1 .7 .7 100 Total 151 100 100
Of the respondents, 6 per cent are in the 25-35 age group, 23.2 per cent are in the
36-45 age group, 46.4 per cent are in the 46-55 age group, 20.5 per cent are in the 56-65
age group, 3.3 per cent are in the 66-75 age group and 0.7 per cent are in the above 75
age group.
A majority is in the 46-55 age-group. With regard to age-group too, the researcher
had no control over the distribution of units across different sub-sets in the total
population.

Table 7: Respondents according to their region
Frequency Per cent Valid Per cent Cumulative Per cent South 83 55 55 55 North 68 45 45 100 Total 151 100 100
The State of Karnataka has 27 districts. The respondents are bracketed into two
categories, South and North, depending on their geographical location. This is to ensure
proportionate representation to legislators from across the State. Of the respondents, 55
per cent are from the South and 45 per cent are from the North.
Table 8: Respondents according to their educational qualification Frequency Per cent Valid Per cent Cumulative Per cent Below SSLC level 4 2.6 2.6 2.6 SSLC & abv 38 25.2 25.2 27.8 Graduate 77 51 51 78.8 Postgraduate 17 11.3 11.3 90.1 Professional 15 9.9 9.9 100 Total 151 100 100
Those with an education level of below Secondary School Leaving Certificate
(SSLC) constitute 2.6 per cent of the respondents, while the SSLC and above level group
comprises 25.2 per cent. Graduates form 51 per cent, postgraduates 11.3 per cent and
those with professional degrees (lawyers, engineers and doctors) 9.9 per cent.

The sample is an indication of the overall profile of the legislature which has a
fairly large representation of graduates. Two respondents hold a PhD degree.
Table 9: A cross tabulation of respondents� age group and education level Count
Education Total Below
SSLC SSLC &
abv Graduate Postgraduate Professional
Age Gp 25-35 0 5 2 1 1 9 36-45 1 8 21 5 0 35 46-55 1 17 35 8 9 70 56-65 1 8 16 2 4 31 66-75 1 0 2 1 1 5 > 75 0 0 1 0 0 1 Total 4 38 77 17 15 151
The above table analyses the educational qualification of the respondents across
different age groups.
Table 10: A cross tabulation of respondents� age group and gender
Count Gender Total Male Female
Age Gp 25-35 9 0 9 36-45 34 1 35 46-55 64 6 70 56-65 28 3 31 66-75 5 0 5 > 75 1 0 1 Total 141 10 151
There are no women in the 25-35, 66-75 and the above 75 age groups, among the
respondents.

Table 11: A cross tabulation of respondents� age group and party Count
Party Total Cong JDS BJP Others
Age Gp 25-35 2 1 5 1 9 36-45 15 7 12 1 35 46-55 26 20 17 7 70 56-65 11 10 10 0 31 66-75 3 0 2 0 5 > 75 0 1 0 0 1 Total 57 39 46 9 151
This table provides a detailed break-up of the age group of the respondents across
different parties. The highest number of respondents in each party is from the 46-55 age
group.
Table 12: A cross tabulation of respondents� age group and region Count
Region Total South North
Age Gp 25-35 4 5 9 36-45 19 16 35 46-55 40 30 70 56-65 18 13 31 66-75 2 3 5 > 75 0 1 1 Total 83 68 151
The age group of the respondents in relation to the region which they hail from is
analysed here. In each age group, there is a proportionate representation from the South
and the North.

Table 13: A cross tabulation of respondents� education and party Count
Party Total Cong JDS BJP Others
Below SSLC level 1 1 2 0 4 SSLC & abv 10 6 19 3 38 Graduate 36 21 20 0 77 Postgraduate 7 6 1 3 17 Professional 3 5 4 3 15 Total 57 39 46 9 151 The highest number of graduates among the respondents is in the Congress,
followed by JDS and BJP. While the Congress has the highest number of postgraduates,
the JDS has the highest number of members holding a professional degree.
Table 14: A cross tabulation of respondents� education and region Count
Region Total South North
Education Below SSLC level 1 3 4 SSLC & abv 19 19 38 Graduate 42 35 77 Postgraduate 13 4 17 Professional 8 7 15 Total 83 68 151
Among the respondents, the South has 42 graduates while the North has 35. There
are 13 postgraduates from the South and four from the North. In both regions, there is an
equal number of respondents with an education level of SSLC and above. In the below
SSLC level, one is from the South while three are from the North.
.

Table 15: A cross tabulation of respondents� gender and education
Count
Education TotalBelow SSLC
SSLC & abv
Graduate Postgraduate Professional
Gender Male 4 33 73 16 15 141 Female 0 5 4 1 0 10 Total 4 38 77 17 15 151
This table provides an overview of the educational qualification across gender.
While there are no female respondents in the below SSLC category, there is none with a
professional degree either. A majority of the male respondents are graduates, while
among the female respondents, graduates and those with a qualification of SSLC and
above are almost identical. Those with a qualification of SSLC and below are in a
minority at four. This table gives an indicative picture of the educational level of the
members of the legislature as a whole.
Table 16: A cross tabulation of respondents� gender and their party affiliation Count
Party Total Cong JDS BJP Others
Gender Male 53 37 43 8 141 Female 4 2 3 1 10 Total 57 39 46 9 151 Among the male respondents, the highest are in the Congress, followed by the
BJP and the JDS. The same holds good for female respondents too. As detailed in the
table, of the total respondents, 141 are male and 10 are female.

Table 17 � A cross tabulation of respondents� gender and region Count
Region Total South North
Gender Male 75 66 141 Female 8 2 10 Total 83 68 151
Of the female respondents, eight are from the South and two are from the North.
Among the men, 75 are from the South and 66 are from the North.
Table 18: A cross tabulation of MLAs and MLCs, and their education Count
Education Total Below
SSLC SSLC &
abv Graduate Postgraduate Professional
House MLA 3 34 53 15 11 116 MLC 1 4 24 2 4 35 Total 4 38 77 17 15 151
Graduates are in the majority in both the Houses. Among the MLAs, there are 53
graduates, while among the MLCs there are 24.
Table 19: A cross tabulation of MLAs and MLCs and their gender Count
Gender Total Male Female
House MLA 111 5 116 MLC 30 5 35 Total 141 10 151
Of the 116 MLAs, 111 are male and five are female. Among the MLCs, 30 are
male and five are female.
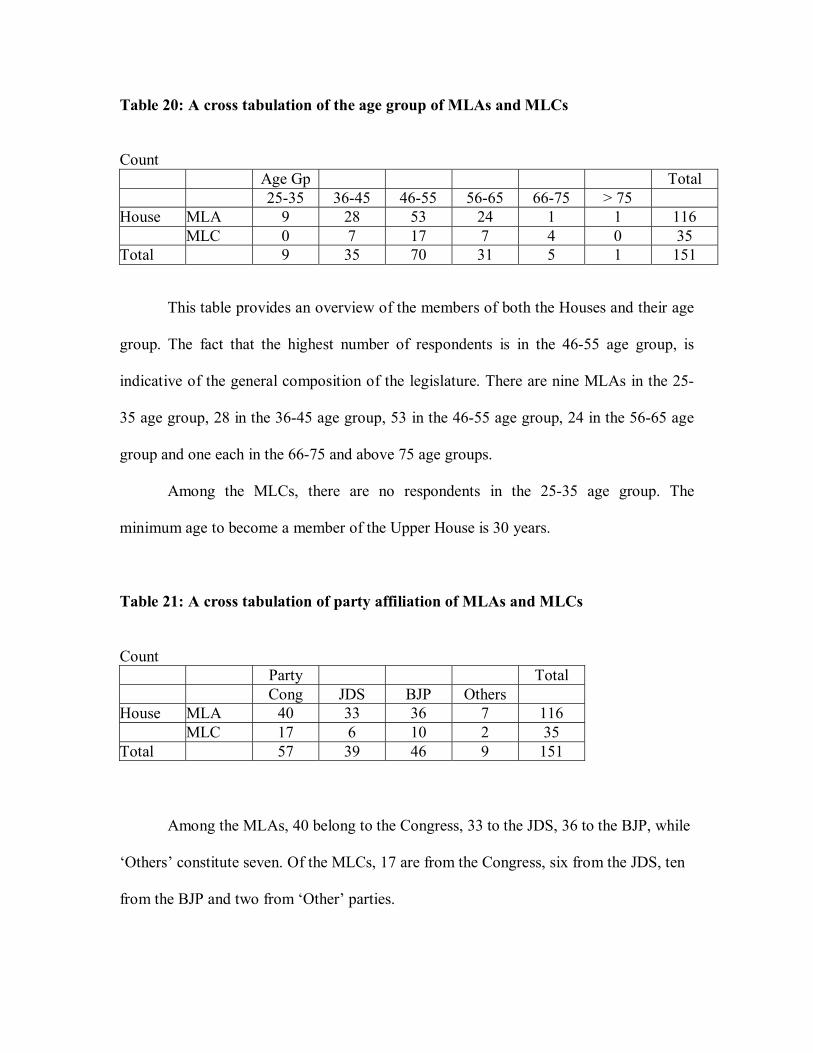
Table 20: A cross tabulation of the age group of MLAs and MLCs Count
Age Gp Total 25-35 36-45 46-55 56-65 66-75 > 75
House MLA 9 28 53 24 1 1 116 MLC 0 7 17 7 4 0 35 Total 9 35 70 31 5 1 151 This table provides an overview of the members of both the Houses and their age
group. The fact that the highest number of respondents is in the 46-55 age group, is
indicative of the general composition of the legislature. There are nine MLAs in the 25-
35 age group, 28 in the 36-45 age group, 53 in the 46-55 age group, 24 in the 56-65 age
group and one each in the 66-75 and above 75 age groups.
Among the MLCs, there are no respondents in the 25-35 age group. The
minimum age to become a member of the Upper House is 30 years.
Table 21: A cross tabulation of party affiliation of MLAs and MLCs Count
Party Total Cong JDS BJP Others
House MLA 40 33 36 7 116 MLC 17 6 10 2 35 Total 57 39 46 9 151
Among the MLAs, 40 belong to the Congress, 33 to the JDS, 36 to the BJP, while
�Others� constitute seven. Of the MLCs, 17 are from the Congress, six from the JDS, ten
from the BJP and two from �Other� parties.

Table 22: A cross tabulation of MLAs and MLCs from different regions Count
Region Total South North
House MLA 63 53 116 MLC 20 15 35 Total 83 68 151
Of the 116 MLAs interviewed, 63 are from the South while 53 are from the
North. Among the 35 MLCs, 20 are from the South, while 15 are from the North.
Economic Profile
The economic profile of the legislators presents a picture of homogeneity. All
legislators are paid a monthly compensation of Rs 27,000 inclusive of salary and other
allowances. They are also entitled to Rs 5000 to Rs 10,000 as pension depending on the
number of years of service as legislators, free road travel and medical treatment for self
and family, travel allowance of Rs 10 per km and a sitting fee of Rs 600 per day during
meetings. Thus, uniformity exists in the economic profile on this count.
Summary
The sample is a fair representation of all demographic groups: members of
different political parties, members of the Assembly and the Council, legislators across
different regions, Backward Classes, Scheduled Castes and Scheduled Tribes, gender, age
group, income group and education level. Considering that the primary objective of the
study is to analyse the media habits of the legislators as a whole across print, electronic
and new media, this sample enables the researcher to draw credible inferences.
ggg

CHAPTER III
ANALYSIS AND INTERPRETATION
NEWSPAPER READING HABITS AND PREFERENCES
This research project, �The Media Habits of Legislators: A case study of
Karnataka MLAs and MLCs,� attempts to map the habits and preferences of the elected
representatives across six dimensions of the media, namely, newspapers, magazines,
television, radio, internet and mobile phone.
Newspapers in India have come a long way from the time Christian missionaries
set up the first printing press in Goa in 1556. Having withstood several attempts to stifle
its voice, the media, particularly newspapers, has emerged as the watchdog of democracy.
Table 23: Respondents who subscribe to and read newspapers
Frequency Per cent Valid Per cent Cumulative Per cent Yes 151 100 100 100 No 0 0 0 0
Total 151 100 100 100
As a prelude to establishing the reading patterns of the legislators, the respondents
were first asked if they subscribed to newspapers. All the 151 respondents (100 per cent)
have replied in the affirmative. They subscribe to newspapers both at home and at office.

Table 24: Respondents who read newspapers regularly
Frequency Per cent Valid Per cent Cumulative Per cent Regularly 150 99.3 99.3 99.3 Occasionally 1 .7 .7 100 Total 151 100 100
Of the total respondents, 99.3 per cent read newspapers regularly, while only 0.7
per cent read them occasionally.
Table 25: Time spent with newspapers by the respondents
Frequency Per cent Valid Per cent Cumulative Per cent 1 hr & abv 75 49.7 49.7 49.7 30 mins to 1 hr 71 47 47 96.7 Below 30 mins 5 3.3 3.3 100 Total 151 100 100
The legislators not only read newspapers regularly, but also spend a considerable
amount of time with them. It is seen from the table that 49.7 per cent of the respondents
read newspapers for one hour and above every day, while 47 per cent spend 30 minutes
to one hour. Only 3.3 per cent of the respondents spend less than 30 minutes with
newspapers every day.
The cumulative figure of respondents reading newspapers for more than 30
minutes stands at 96.7 per cent.

According to the National Readership Survey (NRS 2005), the increase in India�s
literacy has led to a growth of one per cent in the reach of newspapers in three years,
from 23 per cent to 24 per cent. The growth is more predominant in rural areas. The time
spent reading newspapers has also gone up significantly from 30 minutes daily on an
average to 39 minutes per day.
Table 26: Time spent with newspapers and education of the respondents
1hr and abv
30 min to 1 hr
Below 30 mins
Education <SSLC Count 3 1 4 % within
education75% 25% 100%
SSLC & abv Count 15 20 3 38 % within
education39.4% 52.6% 8% 100%
Graduate Count 40 35 2 77 % within
education52% 45.4% 2.6% 100%
Postgraduate Count 8 9 17 % within
education47% 53% 100%
Professional Count 9 6 15 % within
education60% 40% 100%
Total 75 71 5 151 % within
total 49.7% 47% 3.3% 100%
This table explores the connection between the education level of the respondents
and their reading habits.

Among those with an education level of below SSLC, 75 per cent read
newspapers for one hour and above every day, while the remaining 25 per cent read it for
30 minutes to one hour. None in this group reads newspapers for less than 30 minutes.
In the SSLC and above age group, 39.4 per cent read newspapers for one hour and
above, 52.6 per cent for 30 minutes to one hour and 8 per cent for less than 30 minutes.
Among graduates, 52 per cent read newspapers for one hour and above, 45.4 per
cent for 30 minutes to one hour and 2.6 per cent for less than 30 minutes.
In the postgraduate group, 47 per cent read newspapers for one hour and above
and 53 per cent for 30 minutes to one hour. None in this group reads newspapers for less
than 30 minutes a day.
Among professionals, 60 per cent read newspapers for one hour and above and 40
per cent for 30 minutes to one hour.
It is seen from the table, that the number of respondents who read newspapers for
one hour and above is higher in the below SSLC group when compared to SSLC and
above, graduates, postgraduates and those with professional degrees.
The lowest number of respondents reading newspapers for one hour and above is
in the SSLC and above group (39.4 per cent). This group also has the highest number of
respondents reading newspapers for below 30 minutes. There are no respondents who
read newspapers for less than 30 minutes in the below SSLC, postgraduate and
professional groups.

Table 27: Number of newspapers read by respondents across age group
Age Total25-35 36-45 46-55 56-65 66-75 > 75
No of Papers
1 to 2 Count 2 3 2 7
% within no. of papers
28.6% 42.9% 28.6% 100%
% within age 5.7% 4.3% 6.5% 4.6%
3 to 4 Count 1 5 20 7 33 % within
no. of papers
3% 15.2% 60.6% 21.2% 100%
% within age 11.1% 14.3% 28.6% 22.6% 21.9%
5 to 6 Count 4 15 18 10 1 48 % within
no. of papers
8.3% 31.3% 37.5% 20.8% 2.1% 100%
% within age 44.4% 42.9% 25.7% 32.3% 100% 31.8%
7 & abv
Count 4 13 29 12 5 63
% within no. of papers
6.3% 20.6% 46% 19% 7.9% 100%
% within age 44.4% 37.1% 41.4% 38.7% 100% 41.7%
Total Count 9 35 70 31 5 1 151 % within
no. of papers
6% 23.2% 46.4% 20.5% 3.3% .7% 100%
% within age 100% 100% 100% 100% 100% 100% 100%
Among the respondents, 4.6 per cent read 1 to 2 newspapers, 21.9 per cent read 3
to 4 newspapers, 31.8 per cent read 5 to 6 newspapers and 41.7 per cent read 7 or more

newspapers. Thus, most respondents read 7 or more newspapers, while those who read 1
to 2 newspapers are in a minority.
Respondents reading 7 or more newspapers are significantly higher in the 66-75
age group (100 per cent), when compared to the 25-35 (44.4 per cent), 36-45 (37.1 per
cent), 46-55 (41.4 per cent) and the 56-65 age groups (38.7 per cent).
There are no legislators in the 25-35, 66-75 and above 75 age groups who read 1
to 2 newspapers. In the 36-45 age group, 28.6 per cent read 1 to 2 newspapers. It is 42.9
per cent in the 46-55 age group and 28.6 per cent in the 56-65 age group.
The respondents were provided with a list of mainline newspapers from which
they were told to indicate the ones that they subscribe to and read. The newspapers listed
were: Prajavani, Vijaya Karnataka, Samyukta Karnataka, Kannada Prabha, Suryodaya,
Udayavani, Sanjevani, E- Sanje, The Times of India, Deccan Herald, The Hindu, Vijay
Times, The New Indian Express, The Asian Age, The Economic Times, Financial Express,
Business Standard and The Hindu Business Line.
While the researcher assumed that an exhaustive list was provided, some
respondents volunteered to name newspapers that did not find a mention. Among them
were: Daily Thanti, Dinasudar, Daily Pasban, Daily Salar and E-Naadu, in addition to a
host of local dailies.
One MLA said he subscribed not only to the 17 newspapers listed, but to many
others. Another said he subscribed to the city and regional editions of national
newspapers. �The complement of district level news is not very high in the city edition,�
he explained.

Table 28: Number of newspapers read and the education level of the legislators
1 to 2 3 to 4 5 to 6 > 7 Total Education <SSLC Count 2 2 4 % within
education 50% 50% 100%
SSLC & abv Count 4 13 13 8 38 % within
education10.6% 34.2% 34.2% 21% 100%
Graduate Count 2 12 26 37 77 % within
education2.6% 15.6% 33.8% 48% 100%
Postgraduate Count 1 3 4 9 17 % within
education5.9% 17.6% 23.5% 53% 100%
Professional Count 5 3 7 15
% within education
33.3% 20% 46.7% 100%
Total Count 7 33 48 63 151 % of total 4.6% 21.9% 31.8% 41.7% 100%
In the below SSLC group, 50 per cent read 5 to 6 newspapers, while the
remaining 50 per cent read 7 or more newspapers. None in this group reads 1 to 2 or 3 to
4 newspapers.
Among those with an education level of SSLC and above, 10.6 per cent read 1 to
2 newspapers, 34.2 per cent read 3 to 4 newspapers, 34.2 per cent read 5 to 6 newspapers,
while 21 per cent read 7 or more newspapers.
Among graduates, 2.6 per cent read 1 to 2 newspapers, 15.6 per cent read 3 to 4
newspapers, 33.8 per cent read 5 to 6 newspapers, while 48 per cent read 7 or more
newspapers.

In the postgraduate group, 5.9 per cent read 1 to 2 newspapers, 17.6 per cent read
3 to 4 newspapers, 23.5 per cent read 5 to 6 newspapers and 53 per cent read 7 or more
newspapers.
Among professional degree holders, no respondent reads 1 to 2 newspapers, while
33.3 per cent read 3 to 4 newspapers, 20 per cent read 5 to 6 newspapers and 46.7 per
cent read 7 or more newspapers.
At least 50 per cent of the legislators with an education level of below SSLC or a
postgraduate degree read 7 or more newspapers. Respondents who read 5 to 6
newspapers and 7 or more newspapers are high in the below SSLC group.
Chart 2: Consumption of newspapers across education level
0%
10%
20%
30%
40%
50%
60%
% o
f res
pond
ents
1 to 2 0% 10.6% 2.6% 5.9% 0%
3 to 4 0% 34.2% 15.6% 17.6% 33.3%
5 to 6 50% 34.2% 33.8% 23.5% 20%
7 & abv 50% 21% 48% 53% 46.7%
< SSLC >SSLC Grad PG Prof
The highest number of respondents reading 5 to 6 (50 per cent), and 7 or more
newspapers (50 per cent), is in the below SSLC group.

Chart 3: Language of newspapers read by the legislators
1.3%
3.3%
4%
4.6%
7.9%
80.1%
100%
0% 20% 40% 60% 80% 100% 120%
Tamil
Telugu
Marathi
Urdu
Hindi
English
Kannada
% o
f res
pond
ents
All the 151 respondents (100 per cent) read Kannada newspapers. A large section
of 121 respondents (80.1 per cent) also reads English newspapers.
Hindi newspapers are read by 12 respondents (7.9 per cent), while Urdu
newspapers are read by 7 legislators (4.6 per cent). These newspapers are particularly
popular in North Karnataka region where the influence of Hindi and Urdu is high.
Marathi newspapers are read by six respondents (4 per cent), mainly in areas like
Belgaum which border Maharashtra. Karnataka has a significant population of Telugu
speaking people spread across the State, mainly in Bangalore and the border areas like
Kolar, Bellary and Tumkur. Telugu newspapers are read by five respondents (3.3 per
cent). Tamil speaking people also have a large presence in Karnataka, especially in
Bangalore, Kolar Gold Fields and Chamarajanagar regions, which accounts for two
respondents (1.3 per cent) reading Tamil newspapers.

Preference for International Newspapers Table 29: Legislators who read international newspapers
Frequency Per cent Valid Per cent Cumulative Per centYes 21 13.9 13.9 13.9 No 130 86.1 86.1 100 Total 151 100 100
While 86.1 per cent of the respondents do not read international newspapers, only
13.9 per cent have replied in the affirmative. Among those who read international
newspapers, only two subscribe to them. The rest read them at the legislature library or at
the party office.
A particular international newspaper is mentioned by a majority of the BJP
legislators. It was ascertained that these respondents were familiar with this newspaper as
their party office subscribed to it.
The legislators were provided with a list of major international papers, namely,
The Economist, The Washington Post, The International Herald Tribune, Sunday
Observer and Daily Mirror.
A major reason advanced by the legislators for not reading international
newspapers is their lack of availability and exorbitant cost. It is significant to note that
foreign newspapers are not allowed to be published from the country, following a
decision adopted at the first Cabinet meeting of free India, in 1947. However, the
government has now decided to allow limited foreign direct investment (FDI) in the
Indian news media.
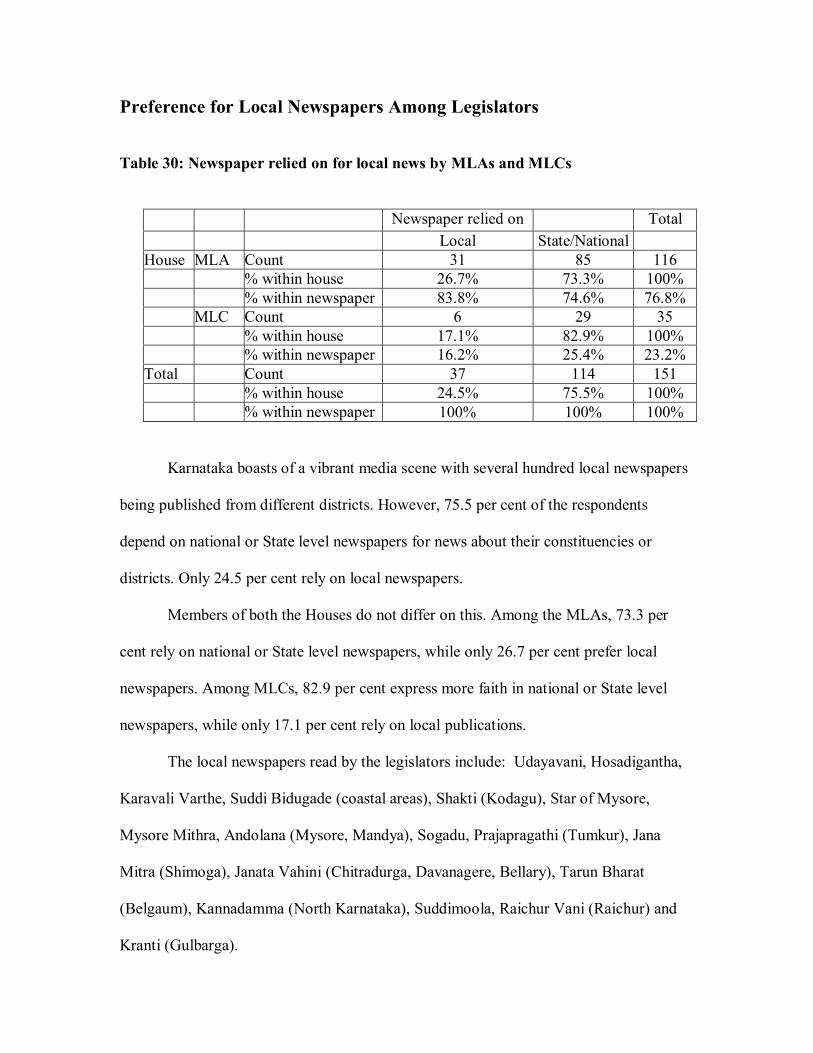
Preference for Local Newspapers Among Legislators Table 30: Newspaper relied on for local news by MLAs and MLCs
Newspaper relied on Total Local State/National
House MLA Count 31 85 116 % within house 26.7% 73.3% 100% % within newspaper 83.8% 74.6% 76.8% MLC Count 6 29 35 % within house 17.1% 82.9% 100% % within newspaper 16.2% 25.4% 23.2% Total Count 37 114 151 % within house 24.5% 75.5% 100%
% within newspaper 100% 100% 100%
Karnataka boasts of a vibrant media scene with several hundred local newspapers
being published from different districts. However, 75.5 per cent of the respondents
depend on national or State level newspapers for news about their constituencies or
districts. Only 24.5 per cent rely on local newspapers.
Members of both the Houses do not differ on this. Among the MLAs, 73.3 per
cent rely on national or State level newspapers, while only 26.7 per cent prefer local
newspapers. Among MLCs, 82.9 per cent express more faith in national or State level
newspapers, while only 17.1 per cent rely on local publications.
The local newspapers read by the legislators include: Udayavani, Hosadigantha,
Karavali Varthe, Suddi Bidugade (coastal areas), Shakti (Kodagu), Star of Mysore,
Mysore Mithra, Andolana (Mysore, Mandya), Sogadu, Prajapragathi (Tumkur), Jana
Mitra (Shimoga), Janata Vahini (Chitradurga, Davanagere, Bellary), Tarun Bharat
(Belgaum), Kannadamma (North Karnataka), Suddimoola, Raichur Vani (Raichur) and
Kranti (Gulbarga).

News Priorities in Newspapers Table 31: First news priority in newspapers between gender
News Total Politics Development International
Gender Male Count 136 4 1 141 % within
gender 96.5% 2.8% .7% 100%
% within news 93.2% 100% 100% 93.4%
Female Count 10 10 % within
gender 100% 100%
% within news 6.8% 6.6%
Total Count 146 4 1 151 % within
gender 96.7% 2.6% .7% 100%
% within news 100% 100% 100% 100%
With a view to ascertaining the news preference of the legislators, the respondents
were told to list three news factors in the order of priority. A list of 13 commonly read
news sections was set forth: Politics, Crime, Sports, Business News, Legal Issues,
Information Technology, Women Issues, Developmental News, International News,
Columns, Environmental Issues, Editorials and Entertainment.
Politics tops the list of priorities with 96.7 per cent of the respondents mentioning
it as their first priority. While 2.6 per cent have mentioned Development News, 0.7 per
cent have indicated International News.
Among the male respondents, 96.5 per cent have preferred Politics as the first
priority, followed by Development News (2.8 per cent) and International News (0.7 per
cent). Among the female legislators, Politics is the first priority among 100 per cent.
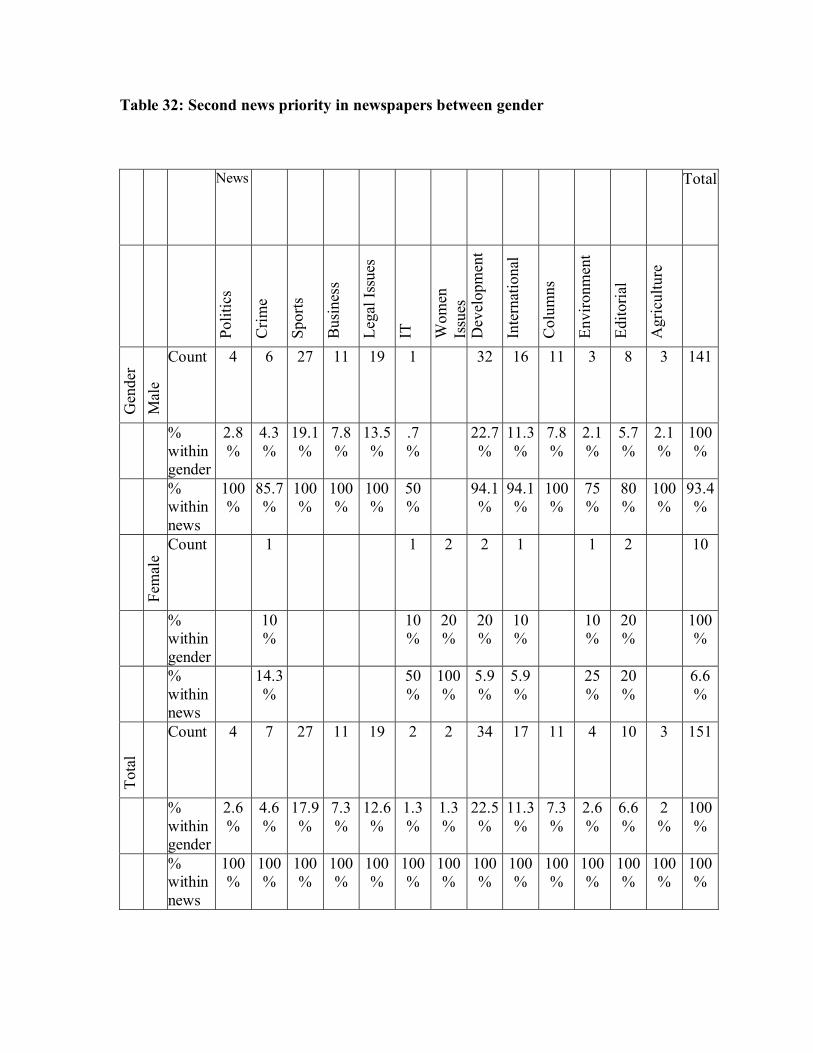
Table 32: Second news priority in newspapers between gender
News Total
Polit
ics
Crim
e
Spor
ts
Bus
ines
s
Lega
l Iss
ues
IT
Wom
en
Issu
es
Dev
elop
men
t
Inte
rnat
iona
l
Col
umns
Envi
ronm
ent
Edito
rial
Agr
icul
ture
Gen
der
Mal
e
Count 4 6 27 11 19 1 32 16 11 3 8 3 141
% within gender
2.8 %
4.3 %
19.1%
7.8 %
13.5%
.7 %
22.7%
11.3%
7.8 %
2.1 %
5.7 %
2.1 %
100%
% within news
100 %
85.7 %
100%
100%
100%
50 %
94.1%
94.1%
100%
75 %
80 %
100%
93.4%
Fem
ale
Count 1 1 2 2 1 1 2 10
% within gender
10 %
10 %
20 %
20 %
10 %
10 %
20 %
100%
% within news
14.3 %
50 %
100%
5.9 %
5.9 %
25 %
20 %
6.6 %
Tota
l
Count 4 7 27 11 19 2 2 34 17 11 4 10 3 151
% within gender
2.6 %
4.6 %
17.9%
7.3 %
12.6%
1.3 %
1.3 %
22.5%
11.3%
7.3 %
2.6 %
6.6 %
2 %
100%
% within news
100 %
100 %
100%
100%
100%
100%
100%
100%
100%
100%
100%
100 %
100%
100%
Among the second priorities indicated by the legislators, 22.5 per cent have
mentioned Development News. This is followed by Sports (17.9 per cent), Legal Issues
(12.6 per cent), International News (11.3 per cent), Columns (7.3 per cent), Business
News (7.3 per cent), Editorials (6.6 per cent), Crime News (4.6 per cent), Environmental
News (2.6 per cent), Politics (2.6 per cent), Agriculture News (2 per cent), Information
Technology (1.3 per cent) and Women Issues (1.3 per cent).
While Agriculture News is not the first priority of even a single legislator, it finds
a mention among the second priorities. Similarly, the table indicates that Environment
News, Information Technology and Women Issues are way down the priority list.
Among the male respondents, the highest number of 22.7 per cent has mentioned
Development News as the second priority and the lowest number of 0.7 per cent has
mentioned Information Technology. Women Issues is not mentioned by the male
respondents either as a first or second priority.
Among the female respondents, 20 per cent each have mentioned Women Issues,
Development News and Editorials as their second priority, while 10 per cent each have
mentioned Crime News, Information Technology, International News and Environment.
Politics, Sports, Business News, Legal Issues, Columns and Agriculture News do not find
favour with the female respondents as a second priority.
A comparison of the priorities among the male and female respondents shows that
the latter has a greater interest in Crime News, Information Technology, Environmental
News and Editorials. For instance, while 10 per cent of the female respondents have
indicated Crime News as their second priority, among male respondents it is 4.3 per cent.

Table 33: Third news priority in newspapers between gender
News Total
Crim
e
Spor
ts
Bus
ines
s
Lega
l
IT
Wom
en Is
sues
Dev
elop
men
t
Inte
rnat
iona
l
Col
umns
Envi
ronm
ent.
Edito
rial
Ente
rtain
men
t
Gen
der
Mal
e
Count 11 22 8 5 9 1 15 6 11 1 50 2 141
% within gender
7.8 %
15.6%
5.7 %
3.5 %
6.4 %
.7 %
10.6%
4.3 %
7.8 %
.7 %
35.5%
1.4 %
100%
% within news
100%
95.7%
88.9 %
100%
100%
25 %
93.8%
85.7%
100%
100%
96.2%
66.7%
93.4%
Fem
ale Count 1 1 3 1 1 2 1 10
% within gender
10 %
10 %
30 %
10 %
10 %
20 %
10 %
100%
% within news
4.3 %
11.1 %
75 %
6.3 %
14.3%
3.8 %
33.3%
6.6 %
Tota
l
Count 11 23 9 5 9 4 16 7 11 1 52 3 151
% within gender
7.3 %
15.2%
6 %
3.3 %
6 %
2.6 %
10.6%
4.6 %
7.3 %
.7 %
34.4%
2 %
100%
% within news
100%
100%
100 %
100%
100%
100%
100%
100%
100%
100%
100%
100%
100%

Editorials have a considerably high readership among the legislators as a third
priority, with 34.4 per cent of them mentioning it. This is followed by Sports (15.2 per
cent), Development News (10.6 per cent), Crime News (7.3 per cent), Columns (7.3 per
cent), Business News (6 per cent), Information Technology (6 per cent), International
News (4.6 per cent), Legal Issues (3.3 per cent), Women Issues (2.6 per cent),
Entertainment (2 per cent) and Environmental News (0.7 per cent).
The highest number of male respondents at 35.5 per cent has mentioned Editorials
as their third priority, while the lowest number has mentioned Women Issues and
Environment News (0.7 per cent each).
Among the female respondents, 30 per cent have mentioned Women Issues as
their third priority, followed by Editorials (20 per cent), Sports, Business, International
News, Development News and Entertainment (10 per cent each). Crime News, Legal
News, Information Technology, Columns and Environment News have not been
mentioned as a third priority by the female respondents.
While no female respondent has mentioned Sports among the first or second
priorities, 10 per cent have mentioned it as their third news priority. This also holds good
for Business News too, with 10 per cent mentioning it as their third priority.
Women also seem to be disinterested in Columns, with none of the respondents
citing it among their priorities.
Entertainment News appeals to 10 per cent of the women, who have mentioned it
as their third priority, as against 1.4 per cent of men.
In the case of Developmental News, both male and female respondents share an
almost equal interest.

Table 34: First news priority of MLAs and MLCs in newspapers
News Total Politics Development International House MLA Count 114 2 116 % within
house 98.3% 1.7% 100%
% within news 78.1% 50% 76.8%
MLC Count 32 2 1 35 % within
house 91.4% 5.7% 2.9% 100%
% within news 21.9% 50% 100% 23.2%
Total Count 146 4 1 151 % within
house 96.7% 2.6% .7% 100%
% within news 100% 100% 100% 100%
The news priorities of the MLAs and MLCs are analysed separately to examine if
a distinct pattern exists between the two. There does not appear to be a significant
deviation in the pattern of preference between the two Houses, where the first priority is
concerned. In both the Houses, a majority�98.3 per cent in the Assembly and 91.4 per
cent in the Council� have indicated that Politics is their first priority, as against other
issues.
The preference for Development News is slightly higher among MLCs at 5.7 per
cent, when compared to MLAs at 1.7 per cent.
Among MLCs, 2.9 per cent have mentioned International News as the first
priority. International News is not a first priority among the MLAs.

Table 35: Second news priority of MLAs and MLCs in newspapers
News Total
Polit
ics
Crim
e
Spor
ts
Bus
ines
s
Lega
l
IT
Wom
en
Issu
es
Dev
elop
men
t
Inte
rnat
iona
l
Col
umns
Envi
ronm
ent
Edito
rial
Agr
icul
ture
Hou
se
MLA Count
2 6 20 9 16 23 15 11 2 9 3 116
% within house
1.7 %
5.2 %
17.2%
7.8 %
13.8% 19.8
% 12.9%
9.5 %
1.7 %
7.8 %
2.6 %
100%
% within news
50 %
85.7%
74.1%
81.8%
84.2% 67.6
% 88.2%
100%
50 %
90 %
100%
76.8%
MLC Count
2 1 7 2 3 2 2 11 2 2 1 35
% within house
5.7 %
2.9 %
20 %
5.7 %
8.6 %
5.7 %
5.7 %
31.4%
5.7 % 5.7
% 2.9 % 100
%
% within news
50 %
14.3%
25.9%
18.2%
15.8%
100%
100%
32.4%
11.8% 50
% 10 % 23.2
%
Tota
l
Count
4 7 27 11 19 2 2 34 17 11 4 10 3 151
% within house
2.6 %
4.6 %
17.9%
7.3 %
12.6%
1.3 %
1.3 %
22.5%
11.3%
7.3 %
2.6 %
6.6 %
2 %
100%
% within news
100 %
100%
100%
100%
100%
100%
100%
100%
100%
100%
100%
100%
100%
100%

The highest number of MLAs (19.8 per cent) has mentioned Development News
as their second priority, while the lowest number has mentioned Politics and
Environmental News (1.7 per cent each).
Among the MLCs, 31.4 per cent have mentioned Development News, while 2.9
per cent each have mentioned Crime News and Editorials as their second priority.
It is observed from the table that Development News is a second priority with a
larger number of MLCs as compared to MLAs. Agriculture News is not a priority among
the MLCs, while it is mentioned by 2.6 per cent of the MLAs.
A comparison between the priorities of the two Houses indicates that a higher
number of MLCs has opted for Politics, Sports and Environmental News as a second
priority. On the other hand, a higher number of MLAs has chosen Crime News, Business
News, Legal Issues, International News and Editorials. However, the percentage swing is
not very significant.
Information Technology and Women Issues do not find favour with the MLAs,
even as a second priority. On the other hand, 5.7 per cent each of the MLCs have
mentioned Information Technology and Women Issues.
Editorials and Columns have a larger readership among the MLAs. As a second
priority, no MLC has indicated Columns. Among the MLAs, 9.5 per cent have mentioned
Columns, while 7.8 per cent vouched for Editorials. Only 2.9 per cent of the MLCs
mentioned Editorials.
. Though MLAs have not mentioned International News as the first priority, they
made up for it in the second priority list with 12.9 per cent. Among MLCs it is a second
priority with 5.7 per cent.

Table 36: Third news priority of MLAs and MLCs in newspapers
News Total
Crim
e
Spor
ts
Bus
ines
s
Lega
l Iss
ues
IT
Wom
en Is
sues
Dev
elop
men
t
Inte
rnat
iona
l
Col
umns
Envi
ronm
ent
Edito
rial
Ente
rtain
men
t
Hou
se MLA Count
8 20 8 5 9 4 14 4 8 1 34 1 116
% within house
6.9 %
17.2%
6.9 %
4.3 %
7.8 %
3.4 %
12.1%
3.4 %
6.9 %
.9 %
29.3%
.9 %
100%
% within news
72.7 %
87 %
88.9%
100%
100%
100%
87.5%
57.1%
72.7%
100%
65.4%
33.3%
76.8%
MLC Count
3 3 1 2 3 3 18 2 35
% within house
8.6 %
8.6 %
2.9 % 5.7
% 8.6 %
8.6 % 51.4
% 5.7 %
100%
% within news
27.3 %
13 %
11.1% 12.5
% 42.9%
27.3% 34.6
% 66.7%
23.2%
Tota
l
Count
11 23 9 5 9 4 16 7 11 1 52 3 151
% within house
7.3 %
15.2%
6 %
3.3 %
6 %
2.6 %
10.6%
4.6 %
7.3 %
.7 %
34.4%
2 %
100%
% within news
100 %
100%
100%
100%
100%
100%
100%
100%
100%
100%
100%
100%
100%

The highest number of MLAs (29.3 per cent) has mentioned Editorials as their
third priority, while the lowest number has mentioned Environment News and
Entertainment News (0.9 per cent each).
Among the MLCs, 51.4 per cent have mentioned Editorials, while 2.9 per cent
have mentioned Business News. Legal Issues, Women Issues, Information Technology
and Environmental News have not been mentioned as a third priority by the MLCs.
A perceptible difference is seen in the case of Sports, with 17.2 per cent of the
MLAs mentioning it as the third priority as against 8.6 per cent of the MLCs.
The preference for Business News and Development News as a third priority is
slightly higher among MLAs, while Crime, Columns and Editorials have a greater
number of readers among MLCs.
An analysis across all three priorities reveals a similar reading pattern among
members of both the Houses of the legislature. For instance, MLAs have not indicated
International News as their first priority, but they have made up for it in the second
priority with 12.9 per cent and in the third priority with 3.4 per cent.
With Editorials, MLCs have stolen a march. While 51.4 per cent of the MLCs
have mentioned Editorials as the third preference, among MLAs it is 29.3 per cent.
With regard to Information Technology and Women Issues, members of both the
Houses of the legislature are equally indifferent.
An analysis of the three priorities indicates that save for some minor deviations,
the reading habits and news preferences of both the MLAs and MLCs with regard to
newspapers are almost similar. Their concerns and apathies are also alike.
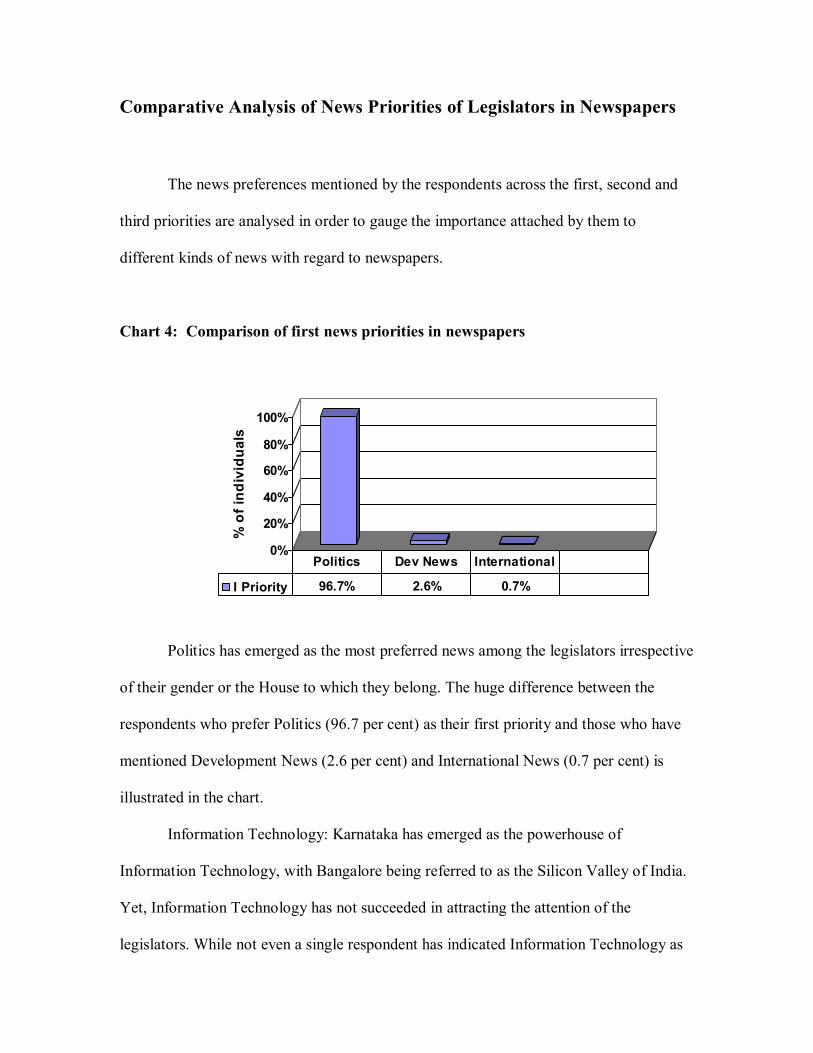
Comparative Analysis of News Priorities of Legislators in Newspapers
The news preferences mentioned by the respondents across the first, second and
third priorities are analysed in order to gauge the importance attached by them to
different kinds of news with regard to newspapers.
Chart 4: Comparison of first news priorities in newspapers
0%
20%
40%
60%
80%
100%
% o
f ind
ivid
uals
I Priority 96.7% 2.6% 0.7%
Politics Dev News International
Politics has emerged as the most preferred news among the legislators irrespective
of their gender or the House to which they belong. The huge difference between the
respondents who prefer Politics (96.7 per cent) as their first priority and those who have
mentioned Development News (2.6 per cent) and International News (0.7 per cent) is
illustrated in the chart.
Information Technology: Karnataka has emerged as the powerhouse of
Information Technology, with Bangalore being referred to as the Silicon Valley of India.
Yet, Information Technology has not succeeded in attracting the attention of the
legislators. While not even a single respondent has indicated Information Technology as
the first priority, it finds mention among a mere 1.3 per cent in the second priority and 6
per cent in the third priority.
Development News: In contrast to the poor response towards Information
Technology, Development News has found an appreciable audience. While 2.6 per cent
have said it is their first news priority, 22.5 per cent have mentioned it as their second
priority and 10.6 per cent as a third priority.
Agriculture News: Issues concerning farmers and agriculture dominate the
proceedings of the legislature. A majority of the legislators themselves are from an
agricultural background. Yet, Agriculture News does not find a mention in the list of first
priorities. Only two per cent of the respondents have preferred Agriculture News as their
second priority, while it is not mentioned by any legislator as a third priority.
Environment News: Environmental issues find a prominent place in the
newspapers of Karnataka. But among the legislators, Environmental News has virtually
no takers. Only 2.6 per cent have said that it is a second news priority for them, while for
0.7 per cent, it is a third news priority.
Women Issues: Issues like dowry harassment, female infanticide and rape are
reported with regular frequency by newspapers. However, the overall response to Women
Issues is dismal: 1.3 per cent as a second priority and 2.6 per cent as a third priority.
Among the male respondents, only 0.7 per cent have mentioned Women Issues, that too
as the third priority.
International News: International News has made it to the first priority list with
0.7 per cent. As a second priority, 11.3 per cent have indicated International News, while
4.6 per cent have said it is their third priority.

Preference for Cartoons
Table 37: Legislators who read cartoons and their age group
Options Total Yes No
Age 25-35 Count 1 8 9 % within age 11.1% 88.9% 100%
% within options 3.2% 6.7% 6%
36-45 Count 7 28 35 % within age 20% 80% 100%
% within options 22.6% 23.3% 23.2%
46-55 Count 15 55 70 % within age 21.4% 78.6% 100%
% within options 48.4% 45.8% 46.4%
56-65 Count 7 24 31 % within age 22.6% 77.4% 100%
% within options 22.6% 20% 20.5%
66-75 Count 1 4 5 % within age 20% 80% 100%
% within options 3.2% 3.3% 3.3%
> 75 Count 1 1 % within age 100% 100%
% within options .8% .7%
Total Count 31 120 151 % within age 20.5% 79.5% 100%
% within options 100% 100% 100%

Cartoons are today an integral part of every newspaper with most publications
featuring them on their front pages. Politicians make a favourite subject for cartoonists.
Cartoons, however, hold very little interest for the law makers of Karnataka.
A majority of 79.5 per cent of the respondents have said that they do not read
cartoons, as against 20.5 per cent who read them.
The highest number of respondents who do not read cartoons falls within the
above 75 age group (100 per cent), followed by 25-35 age group (88.9 per cent), 66-75
and 36-45 age groups (80 per cent each), 46-55 age group (78.6 per cent) and 56-65 age
group (77.4 per cent).
Political cartoons have a rich history. Cartoons have remained the mainstay of
newspapers, ever since Benjamin Franklin created the first American political cartoon in
1754, urging the British colonies to �Join, or Die� in defence against France and her
allies. The New York Daily Graphic published them from its first issue in 1873. With the
popularity of cartoons increasing, they became the victims of censorship Bills around the
turn of the nineteenth century. However, political cartoonists heaved a sigh of relief
following the ratification of the United States Constitution and the First Amendment,
which bestowed upon them unprecedented freedom to express their views protected by
the nation's courts from charges of libel or governmental persecution.
Studies in the United States indicate that cartoons reflect social change and the
American way of life. Strips like �Doonesbury� are keenly observed not only by the
readers but also by the political class.6
6. Spring, Tom. Comic Strip A Reflection of Society. 03 Jan. 1995. 1 June 2005 <http://www.osu.edu/osu/newsrel/Archive/95-01-03_Comics_Reflect_Society>.

Table 38: Gender of respondents who read cartoons
Options Total Yes No
Gender Male Count 28 113 141 % within gender 19.9% 80.1% 100% % within option 90.3% 94.2% 93.4% Female Count 3 7 10 % within gender 30% 70% 100% % within option 9.7% 5.8% 6.6% Total Count 31 120 151 % within gender 20.5% 79.5% 100%
% within option 100% 100% 100%
The preference for cartoons is higher among the female respondents as compared
to men. Among the female respondents, 30 per cent read cartoons, while 70 per cent do
not. Among the male respondents 19.9 per cent read cartoons, while 80.1 per cent do not.
Table 39: MLAs and MLCs who read cartoons
Options Total
Yes No House MLA Count 29 87 116 % within house 25% 75% 100% % within options 93.5% 72.5% 76.8% MLC Count 2 33 35 % within house 5.7% 94.3% 100% % within options 6.5% 27.5% 23.2% Total Count 31 120 151 % within house 20.5% 79.5% 100%
% within options 100% 100% 100%
Among the MLAs, 25 per cent read cartoons. Among the MLCs it is 5.7 per cent.

MAGAZINE READING HABITS AND PREFERENCES
India boasts of several hundred magazines, journals and periodicals covering
News, Current Affairs, Controversies, Politics, Business and Finance, Trade and Industry,
Sports, Women Issues, Music and Art, Entertainment, Film Reviews, Bollywood News,
Health and Fitness, Parenting and much more.
Though the National Readership Survey, 2005 (NRS 2005), speaks of an increase
in the readership across the country over the past three years, this growth is driven by
newspapers. Magazines have declined in reach from 13 per cent to 10 per cent during this
period.
Table 40: Respondents who read magazines Frequency Per cent Valid Per cent Cumulative Per cent Yes 149 98.7 98.7 98.7 No 2 1.3 1.3 100 Total 151 100 100
Among the respondents, 98.7 per cent read magazines. Only 1.3 per cent of the
legislators do not read them.
The respondents subscribe to all the magazines that they read. They subscribe to
magazines both at home and at office.
The number of respondents who read magazines is slightly less than that of
newspapers (100 per cent).

Table 41: Respondents who read magazines and their age group
Age Gp Total 25-35 36-45 46-55 56-65 66-75 > 75
Regularly Count 6 20 33 18 5 82 % within
mag 7.3% 24.4% 40.2% 22% 6.1% 100%
% within age group 66.7% 57.1% 48.5% 58.1% 100% 55%
Occasionally Count 3 15 35 13 1 67 % within
mag 4.5% 22.4% 52.2% 19.4% 1.5% 100%
% within age group 33.3% 42.9% 51.5% 41.9% 100% 45%
Total Count 9 35 68 31 5 1 149 % within
mag 6% 23.5% 45.6% 20.8% 3.4% .7% 100%
% within age group 100% 100% 100% 100% 100% 100% 100%
Though the number of legislators who subscribe to magazines is as high as 98.7
per cent, only 55 per cent read them regularly, while the remaining 45 per cent read them
occasionally. In newspapers, the number of regular readers stands at 99.3 per cent.
The highest number of regular magazine readers is in the 66-75 age group (100
per cent) followed by 25-35 age group (66.7 per cent), 56-65 age group (58.1 per cent),
36-45 age group (57.1 per cent), 46-55 age group (48.5 per cent) and above 75 years
(none).

Table 42: Time spent with magazines by the respondents
Frequency Per cent Valid Per cent Cumulative Per cent
1 hr and abv 66 43.7 44.3 44.3 30 mins to 1hr 55 36.4 36.9 81.2 Below 30 mins 28 18.5 18.8 100 Total 149 98.7 100 N/A 2 1.3
151 100
While 44.3 per cent of the respondents read magazines for one hour and above per
week, 36.9 per cent read magazines for 30 minutes to one hour and 18.8 per cent for less
than 30 minutes.
Chart 5: Comparison of the time spent with newspapers and magazines
0%
10%
20%
30%
40%
50%
% o
f res
pond
ents
Newspaper 49.7% 47% 3.3%
Magazine 44.3% 36.9% 18.8%
1 hr abv 30 mins-1 hr <30 mins
It is seen from the chart that the respondents spend more time on newspapers than
on magazines.

Table 43: Time spent with magazines and the education level
1hr and abv
30 min to 1 hr
Below 30 mins
Total
Education <SSLC Count 2 2 4 % within
education50% 50% 100%
SSLC & abv Count 9 18 10 37 % within
education24.3% 48.7% 27% 100%
Graduate Count 37 23 16 76 % within
education48.7% 30.3% 21% 100%
Postgraduate Count 10 5 2 17 % within
education58.8% 29.4% 11.8% 100%
Professional Count 8 7 15 % within
education53.3% 46.7% 100%
Total Count 66 55 28 149 % within
total 44.3% 36.9% 18.8% 100%
Among magazine readers, 50 per cent of the respondents in the below SSLC level
spend one hour and above, while the remaining read them for 30 minutes to one hour.
None in this group reads magazines for less than 30 minutes.
In the SSLC and above group, 24.3 per cent read magazines for one hour and
above, 48.7 per cent for 30 minutes to one hour and 27 per cent for below 30 minutes.
Among graduates, 48.7 per cent read magazines for one hour and above, 30.3 per
cent for 30 minutes to one hour and 21 per cent for below 30 minutes. With the
postgraduate group, 58.8 per cent read magazines for one hour and above, 29.4 per cent
for 30 minutes to one hour and 11.8 per cent for below 30 minutes.

Among professional degree holders, 53.3 per cent read magazines for one hour
and above, 46.7 per cent for 30 minutes to one hour and none for below 30 minutes.
The number of respondents reading magazines for one hour and above is the
highest in the postgraduate group, followed by professional degree holders, below SSLC,
graduates and above SSLC. In the case of newspapers, among those who spend one hour
and above, the highest number is within the below SSLC group at 75 per cent.
The number of respondents who read magazines for more than one hour is the
lowest among the SSLC and above group. This group also has the highest number of
respondents reading magazines for below 30 minutes. A similar trend is noticed in this
group in the case of newspapers too.
Chart 6: Education of legislators reading magazines for one hour and above
0%
10%
20%
30%
40%
50%
60%
% o
f res
pond
ents
1 hr abv 50% 24.3% 48.7% 58.8% 53.3%
<SSLC >SSLC Grad PG Prof
The highest number of respondents reading magazines for one hour and above is
within the postgraduate group (58.8 per cent) and the lowest is in the above SSLC group
(24.3 per cent).
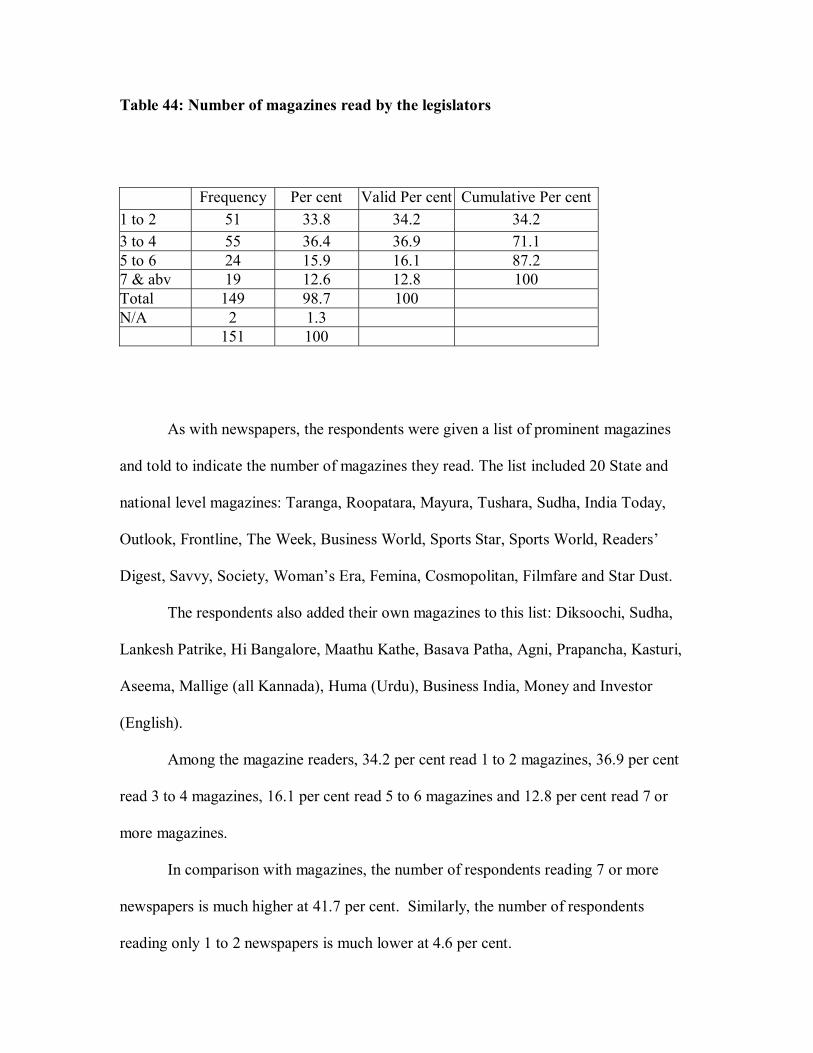
Table 44: Number of magazines read by the legislators Frequency Per cent Valid Per cent Cumulative Per cent 1 to 2 51 33.8 34.2 34.2 3 to 4 55 36.4 36.9 71.1 5 to 6 24 15.9 16.1 87.2 7 & abv 19 12.6 12.8 100 Total 149 98.7 100 N/A 2 1.3 151 100
As with newspapers, the respondents were given a list of prominent magazines
and told to indicate the number of magazines they read. The list included 20 State and
national level magazines: Taranga, Roopatara, Mayura, Tushara, Sudha, India Today,
Outlook, Frontline, The Week, Business World, Sports Star, Sports World, Readers�
Digest, Savvy, Society, Woman�s Era, Femina, Cosmopolitan, Filmfare and Star Dust.
The respondents also added their own magazines to this list: Diksoochi, Sudha,
Lankesh Patrike, Hi Bangalore, Maathu Kathe, Basava Patha, Agni, Prapancha, Kasturi,
Aseema, Mallige (all Kannada), Huma (Urdu), Business India, Money and Investor
(English).
Among the magazine readers, 34.2 per cent read 1 to 2 magazines, 36.9 per cent
read 3 to 4 magazines, 16.1 per cent read 5 to 6 magazines and 12.8 per cent read 7 or
more magazines.
In comparison with magazines, the number of respondents reading 7 or more
newspapers is much higher at 41.7 per cent. Similarly, the number of respondents
reading only 1 to 2 newspapers is much lower at 4.6 per cent.
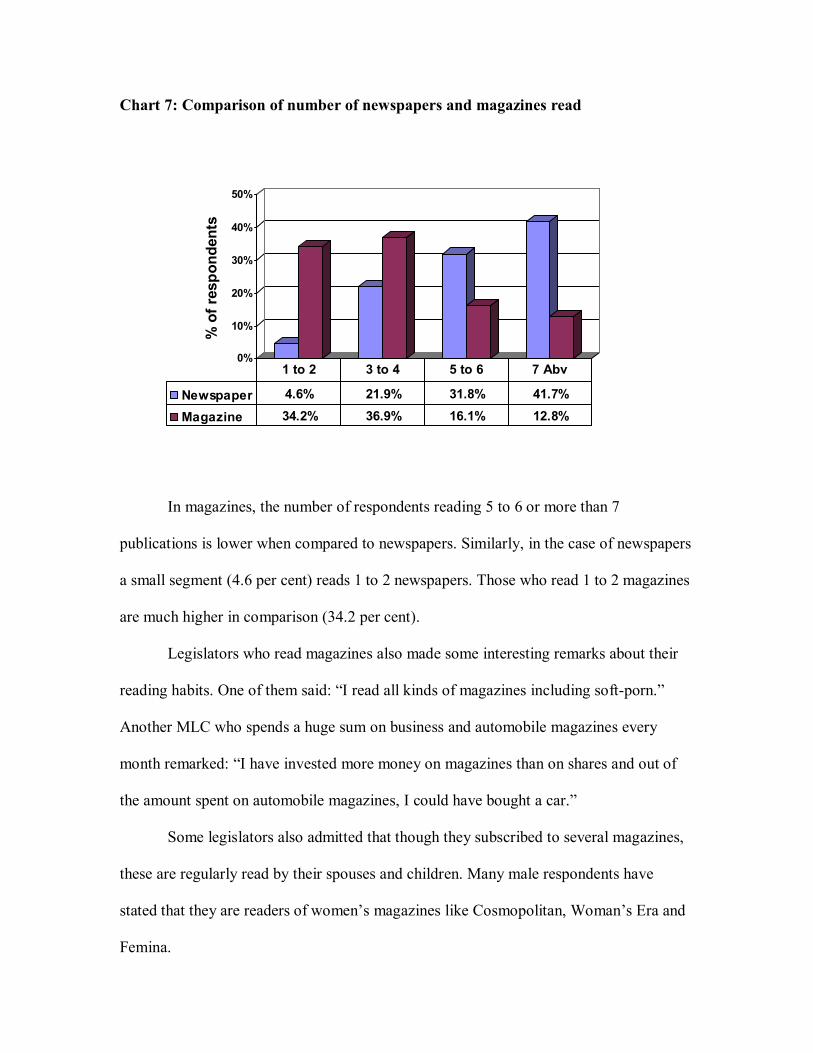
Chart 7: Comparison of number of newspapers and magazines read
0%
10%
20%
30%
40%
50%%
of r
espo
nden
ts
Newspaper 4.6% 21.9% 31.8% 41.7%
Magazine 34.2% 36.9% 16.1% 12.8%
1 to 2 3 to 4 5 to 6 7 Abv
In magazines, the number of respondents reading 5 to 6 or more than 7
publications is lower when compared to newspapers. Similarly, in the case of newspapers
a small segment (4.6 per cent) reads 1 to 2 newspapers. Those who read 1 to 2 magazines
are much higher in comparison (34.2 per cent).
Legislators who read magazines also made some interesting remarks about their
reading habits. One of them said: �I read all kinds of magazines including soft-porn.�
Another MLC who spends a huge sum on business and automobile magazines every
month remarked: �I have invested more money on magazines than on shares and out of
the amount spent on automobile magazines, I could have bought a car.�
Some legislators also admitted that though they subscribed to several magazines,
these are regularly read by their spouses and children. Many male respondents have
stated that they are readers of women�s magazines like Cosmopolitan, Woman�s Era and
Femina.

Table 45: Number of magazines read and the education level
1 to 2 3 to 4 5 to 6 > 7 Total Education <SSLC Count 1 3 4 % within
education25% 75% 100%
SSLC & abv Count 21 11 2 3 37 % within
education56.7% 29.7% 5.5% 8.1% 100%
Graduate Count 23 29 12 12 76 % within
education30.3% 38.1% 15.8% 15.8% 100%
Postgraduate Count 3 7 4 3 17 % within
education17.7% 41.1% 23.5% 17.7% 100%
Professional Count 3 5 6 1 15 % within
education20% 33.3% 40% 6.7% 100%
Total Count 51 55 24 19 149 % within
total 34.2% 36.9% 16.1% 12.8% 100%
Among the magazine readers in the below SSLC group, 25 per cent read 1 to 2
magazines, while 75 per cent read 3 to 4 magazines. None in this group reads 5 to 6 or 7
or more magazines. In the SSLC and above group, 56.7 per cent read 1 to 2 magazines,
29.7 per cent read 3 to 4 magazines, 5.5 per cent read 5 to 6 magazines and 8.1 per cent
read 7 or more magazines. Among graduates, 30.3 per cent read 1 to 2 magazines, 38.1
per cent read 3 to 4 magazines, 15.8 per cent read 5 to 6 magazines and 15.8 per cent read
7 or more magazines. In the postgraduate group, 17.7 per cent read 1 to 2 magazines,
41.1 per cent read 3 to 4 magazines, 23.5 per cent read 5 to 6 magazines and 17.7 per cent
read 7 or more magazines. Among professional degree holders, 20 per cent read 1 to 2

magazines, 33.3 per cent read 3 to 4 magazines, 40 per cent read 5 to 6 magazines and 6.7
per cent read 7 or more magazines.
The highest number of respondents who read 7 or more magazines is in the
postgraduate group followed by graduates, SSLC above and professional degree holders.
No respondent in the below SSLC group reads more than 7 magazines.
The number of respondents who read 1 to 2 magazines is the highest in the SSLC
and above group. This group also has the highest number of respondents who read
magazines for less than 30 minutes.
Chart 8: Language of the magazines read by the respondents
0.7%
2%
2%
2%
79.9%
77.2%
8.1%
0% 10% 20% 30% 40% 50% 60% 70% 80% 90%
Telugu
Marathi
Tamil
Urdu
Hindi
English
Kannada
% of respondents
Of the 149 respondents who read magazines, 119 (79.9 per cent) read Kannada
magazines. This indicates that Kannada magazines are not read by 30 respondents.
English magazines are read by 115 legislators (77.2 per cent), Hindi by 12 (8.1 per cent),
Urdu by 3 (2 per cent), Tamil by 3 (2 per cent), Marathi by 3 (2 per cent) and Telugu by 1
respondent (0.7 per cent).

Preference for International Magazines Among the Legislators
Table 46: Respondents who read international magazines
Frequency Per cent Valid Per cent Cumulative Per cent
Yes 35 23.2 23.5 23.5 No 114 75.5 76.5 100 Total 149 98.7 100 N/A 2 1.3 Total 151 100
International magazines are not read by 76.5 per cent of the respondents, while
23.5 per cent have replied in the affirmative. A perceptible difference is observed when
compared with newspapers where only 13.9 per cent read international publications.
The legislators mentioned prominent international magazines like Time,
Asiaweek and Newsweek. However, only two legislators subscribe to international
magazines. While some of them buy it off the shelf, a majority reads them at the party
office.
Chart 9: Depiction of legislators who read international magazines
0%
20%
40%
60%
80%
% o
f res
pond
ents
Int Magazines 23.5% 76.5%
Read Do not read

Preference for Local Magazines
Table 47: Magazines relied upon for local news
Frequency Per cent Valid Per cent Cumulative Per centState/National 1 .7 .7 .7 No Magazine 148 98 99.3 100 Total 149 98.7 100 N/A 2 1.3
Total 151 100
As in the case of newspapers, an attempt is made to analyse if legislators depend
on local magazines for news about their constituency. A majority of 99.3 per cent have
said that they do not rely on local magazines.
The respondents say that there are virtually no magazines which cater to the
constituency and as such, their depending on magazines for local news does not arise.
Most of Karnataka�s leading magazines and tabloids are published at the State level.
With newspapers too, a majority of 75.5 per cent have said that they do not rely
on local publications.

News Priorities in Magazines
Table 48: First news priority in magazines between gender
News Total Politics Women
Issues Development International Columns/
Editorials
Gender Male Count 127 6 4 2 139 % within
gender 91.4% 4.3% 2.9% 1.4% 100%
% within priority 94.1% 100% 100% 100% 93.3%
Female Count 8 2 10 % within
gender 80% 20% 100%
% within priority 5.9% 100% 6.7%
Total Count 135 2 6 4 2 149 % within
gender 90.6% 1.3% 4% 2.7% 1.3% 100%
% within priority 100% 100% 100% 100% 100% 100%
Politics is mentioned as the first priority in magazines by a majority of 90.6 per
cent of the respondents. This is followed by Development News (4 per cent),
International News (2.7 per cent), Women Issues (1.3 per cent) and Columns/Editorials
(1.3 per cent).
Politics is the first priority with a higher number of respondents (96.7 per cent) in
the case of newspapers. However, the underlying factor remains that the readers of both
newspapers and magazines attach the highest importance to Politics, when compared to
other issues.

Development News is the first priority among a lesser number of respondents (2.6
per cent) in newspapers. The number of respondents (0.7 per cent) mentioning
International News as their first priority in newspapers is lower compared to magazines.
Unlike in newspapers, Women Issues and Columns / Editorials have made an appearance
under first priorities in magazines.
Politics is the first priority with the highest number of male respondents (91.4 per
cent), while Editorials/ Columns are a priority with the lowest number (1.4 per cent).
Male respondents have not mentioned Women Issues as a first priority.
Among the female respondents, Politics is mentioned by 80 per cent and Women
Issues by 20 per cent. Female respondents have not mentioned Development News,
International News and Columns/Editorials as the first priority.
Chart 10: Comparison of first priorities in newspapers and magazines
0%
20%
40%
60%
80%
100%
% o
f res
pond
ents
Politics 96.7% 90.6%
Other Issues 3.3% 9.4%
Newspaper Magazine
In magazines, Politics sees a decline as the first priority against an increase in
other issues, when compared to newspapers.

Table 49: Second news priority in magazines between gender
Mag Total
Polit
ics
Crim
e
Spor
ts
Bus
ines
s
Lega
l
IT
Wom
en Is
sues
Dev
elop
men
t
Inte
rnat
iona
l
Col
umns
/ E
dito
rials
En
terta
inm
ent
Non
e
Gen
der
Male Count
1 5 29 28 9 4 2 33 6 9 7 6 139
% within gender
.7 %
3.6 %
20.9%
20.1%
6.5 %
2.9 %
1.4 %
23.7%
4.3 %
6.5 %
5 %
4.3 %
100%
% within mag
100%
83.3%
100%
100%
90 %
80 %
33.3%
91.7%
100%
100%
100%
100%
93.3%
Female Count
1 1 1 4 3 10
% within gender 10
% 10 %
10 %
40 %
30 % 100
%
% within mag 16.7
% 10 %
20 %
66.7%
8.3 % 6.7
%
Tota
l Count 1 6 29 28 10 5 6 36 6 9 7 6 149
% within gender
.7 %
4 %
19.5%
18.8%
6.7 %
3.4 %
4 %
24.2%
4 %
6 %
4.7 %
4 %
100%
% within mag
100%
100%
100%
100%
100%
100%
100%
100%
100%
100%
100%
100%
100%

In magazines, among the second priorities mentioned by the legislators,
Development News tops the list with 24.2 per cent, followed by Sports (19.5 per cent),
Business News (18.8 per cent), Legal (6.7 per cent), Columns/Editorials (6 per cent),
Entertainment (4.7 per cent), Crime News (4 per cent), Women Issues (4 per cent),
International News (4 per cent), Information Technology (3.4 per cent) and Politics (0.7
per cent). Among the respondents, 4 per cent have said they do not have a second
priority.
A similar trend is noticed in newspapers where Development News is the second
priority of 22.5 per cent of the respondents, while Sports is mentioned by 17.9 per cent.
While Legal News comes third in the list of second priorities in newspapers with
12.6 per cent, in magazines it is Business News with 18.8 per cent.
The respondents seem to prefer magazines for Entertainment News. While 4.7 per
cent have mentioned Entertainment News as their second priority in magazines, it has no
takers in newspapers as a first or second priority.
Similarly, Women Issues is mentioned by 4 per cent as a second priority in
magazines as against 1.3 per cent in newspapers.
The highest number of male respondents, that is, 23.7 per cent, has mentioned
Development News as the second priority, while the lowest number of 0.7 per cent has
mentioned Politics.
Among the female respondents, 40 per cent have mentioned Women Issues while
Crime News, Legal News and Information Technology are mentioned by 10 per cent
each. Female respondents have not mentioned Politics, Sports, Business, International
News, Columns/Editorials and Entertainment as a second priority.

In the case of magazines, Women Issues has a considerably high readership
among the female respondents. Among the female legislators, Women Issues has been
mentioned by 40 per cent as the second priority and 20 per cent as the first priority. In
newspapers, only 20 per cent of the female respondents have mentioned Women Issues as
their second priority. Only 1.4 per cent of the men have mentioned Women Issues as their
second priority, while none has mentioned it as the first priority in magazines.
Thus, it appears that female respondents depend more on magazines than on
newspapers for news on Women Issues.
The readership of Information Technology is also higher among female
respondents. While 10 per cent of the women have opted for Information Technology as
the second priority, among men it is 2.9 per cent. A similar trend is noticed with
newspapers too.
While 20.9 per cent of the men have mentioned Sports as a second priority, it has
not found a mention among the women. Business News is a second priority with 20.1 per
cent of the men as against none among the women. In the case of newspapers too, female
respondents show no interest in Sports and Business News.
Entertainment News too is not mentioned as a second priority by the female
respondents, while among the men it is 5 per cent.
Women, however, seem to be more interested in Crime News, compared to men.
While 10 per cent among the female respondents have mentioned Crime News as their
second priority, among men it is only 3.6 per cent. In newspapers too, 10 per cent of
women have mentioned Crime News as their second priority as against 4.3 per cent of
men.

Table 50: Third news priority in magazines between gender
Mag Total
Polit
ics
Crim
e
Spor
ts
Bus
ines
s
Lega
l
IT
Wom
en Is
sues
Dev
elop
men
t
Inte
rnat
iona
l
Col
umns
/ Ed
itoria
ls
Envi
ronm
ent
Ente
rtain
men
t
Non
e
Gen
der Male Count
6 5 3 1 9 8 1 18 20 14 13 27 14 139
% within gender
4.3 %
3.6 %
2.2 %
.7 %
6.5 %
5.8 %
.7 %
12.9%
14.4%
10.1%
9.4%
19.4%
10.1%
100%
% within mag
85.7%
100%
100%
100%
100%
88.9%
100%
100%
95.2%
93.3%
86.7%
93.1%
87.5%
93.3%
Female Count 1 1 1 1 2 2 2 10
% within gender
10 % 10
% 10 %
10 %
20 %
20%
20 %
100%
% within mag
14.3% 11.1
% 4.8 %
6.7 %
13.3%
6.9%
12.5%
6.7 %
Tota
l
Count 7 5 3 1 9 9 1 18 21 15 15 29 16 149
% within gender
4.7 %
3.4 %
2 %
.7 %
6 %
6 %
.7 %
12.1%
14.1%
10.1%
10.1%
19.5%
10.7%
100%
% within mag
100 %
100 %
100 %
100%
100%
100%
100%
100%
100%
100 %
100%
100%
100 %
100%

Among the third priorities, Entertainment News tops the list, with 19.5 per cent of
the respondents, followed by International News (14.1 per cent), Development News
(12.1 per cent), Columns/Editorial (10.1 per cent), Environment News (10.1 per cent),
Legal Issues (6 per cent), Information Technology (6 per cent), Politics (4.7 per cent),
Crime News (3.4 per cent), Sports (2 per cent), Business News (0.7 per cent) and Women
Issues (0.7 per cent). Among the respondents, 10.7 per cent have said they do not have a
third priority.
Among the male respondents, the highest number of 19.4 per cent has mentioned
Entertainment News as the third priority, while the lowest number has mentioned
Business News and Women Issues (0.7 per cent each).
Among the female respondents, 20 per cent each have mentioned Environment
News and Entertainment, while 10 per cent each have mentioned Politics, Information
Technology, International News and Columns/Editorial. Female respondents have not
mentioned Crime News, Sports, Business News, Legal, Women Issues and Development
News as a third priority.
In magazines, female respondents have not mentioned Sports and Business News
across the three priorities.
The female respondents do not appear to have a special preference between
newspapers and magazines for Crime News. In the case of both, 10 per cent of the
women have mentioned Crime News as their second priority. The overall priority level
for Crime News among women is higher than that of men.

Table 51: First news priority in magazines between MLAs and MLCs
Mag Total Politics Women
Issues Development International Columns/
Editorials
House MLA Count 103 2 4 3 2 114 % within
house 90.4% 1.8% 3.5% 2.6% 1.8% 100%
% within mag 76.3% 100% 66.7% 75% 100% 76.5%
MLC Count 32 2 1 35 % within
house 91.4% 5.7% 2.9% 100%
% within mag 23.7% 33.3% 25% 23.5%
Total Count 135 2 6 4 2 149 % within house 90.6% 1.3% 4% 2.7% 1.3% 100%
% within mag 100% 100% 100% 100% 100% 100%
Having understood the news priorities in magazines among the legislators, the
study now explores the reading pattern between the members of the Upper and Lower
Houses.
Politics is the first priority with a majority of 90.4 per cent of the MLAs, while
Women Issues and Columns/ Editorials are a priority with only 1.8 per cent each.
Among the MLCs, 91.4 per cent have mentioned Politics as their first priority,
while 2.9 per cent have mentioned International News. MLCs have not mentioned
Women Issues and Columns/Editorials as a first priority.
It may be observed that when it is comes to Politics as the first news priority in
magazines, there is not much of a difference between the MLAs and MLCs. In

newspapers, the difference between MLAs and MLCs who have indicated Politics as
their first priority is slightly wider at 98.3 per cent and 91.4 per cent respectively.
Development News is the first priority among 3.5 per cent of the MLAs and 5.7
per cent of the MLCs, who read magazines. In newspapers, 1.7 per cent of MLAs have
mentioned Development News as against 5.7 per cent of the MLCs. The number of
MLCs who have mentioned Development News as the first priority remains constant
between newspapers and magazines.
The preference for International News as the first priority is almost similar
between the two Houses: 2.6 per cent among MLAs and 2.9 per cent among MLCs. In
newspapers, no MLA has mentioned International News as the first priority. The number
of MLCs whose second priority is International News remains stable between
newspapers and magazines at 2.9 per cent.
Columns/Editorials have made an entry into the list of first priorities in
magazines. While 1.8 per cent of the MLAs have mentioned Columns/Editorials as their
first priority, it has no takers among MLCs.
With the Upper House being considered the House of Elders, there might be a
general perception that Columns and Editorials have a high percentage of readership
among them. But it needs to be noted that today, the composition of the Upper House
does not differ much from that of the Lower House in terms of age group, education level
or experience. Though in spirit the Upper House has to comprise representatives of
groups like teachers and graduates, in reality these seats are cornered by active
politicians. Thus, the Upper House does not enjoy any qualitative superiority over the
Assembly or the Lower House.

Table 52: Second news priority in magazines between MLAs and MLCs
Mag Total
Polit
ics
Crim
e
Spor
ts
Bus
ines
s
Lega
l
IT
Wom
en Is
sues
Dev
elop
men
t
Inte
rnat
iona
l
Col
umns
/ Ed
itoria
ls
Ente
rtain
men
t.
Non
e
Hou
se
MLA Count 5 22 23 8 2 3 28 4 8 5 6 114
% within house
4.4 %
19.3%
20.2%
7 %
1.8 %
2.6 %
24.6 %
3.5 %
7 %
4.4 %
5.3 %
100%
% within mag
83.3%
75.9%
82.1%
80 %
40 %
50 %
77.8 %
66.7%
88.9%
71.4%
100 %
76.5%
MLC Count 1 1 7 5 2 3 3 8 2 1 2 35
% within house
2.9 %
2.9 %
20 %
14.3%
5.7 %
8.6 %
8.6 %
22.9 %
5.7 %
2.9 %
5.7 %
100%
% within mag
100%
16.7%
24.1%
17.9%
20 %
60 %
50 %
22.2 %
33.3%
11.1%
28.6%
23.5%
Tota
l Count 1 6 29 28 10 5 6 36 6 9 7 6 149
% within house
.7 %
4 %
19.5%
18.8%
6.7 %
3.4 %
4 %
24.2 %
4 %
6 %
4.7 %
4 %
100%
% within mag
100%
100%
100%
100%
100%
100%
100%
100 %
100%
100 %
100%
100 %
100%

Among the second priorities, the highest number of MLAs (24.6 per cent) has
mentioned Development News, while the lowest number (1.8 per cent) has mentioned
Information Technology.
Among the MLCs, the highest number (22.9 per cent) has mentioned
Development News, while the lowest number (2.9 per cent each) has mentioned Politics,
Crime News and Columns/Editorials.
In the second priority, the reading habits of the members of both the Houses seem
to be only marginally different with regard to Crime News, Sports, Legal Issues,
Development News, International News and Entertainment News.
The MLAs (24.6 per cent) and MLCs (22.9 per cent) share an almost equal
concern for Development News as a second priority.
Women Issues has received more attention from the MLCs. While 8.6 per cent of
the MLCs mention it as the second priority, among MLAs it is 2.6 per cent. In
newspapers, while Women Issues is not mentioned as a second priority by any MLA, 5.7
per cent of the MLCs have opted for it.
Though the interest in Information Technology continues to be low among the
respondents, MLCs have fared slightly better. Only 1.8 per cent of the MLAs have
mentioned Information Technology as the second priority, while among the MLCs it is
8.6 per cent.
Environment News and Agriculture News do not figure among the first and
second priorities of either the MLAs or the MLCs.

Table 53: Third news priority in magazines between MLAs and MLCs
Mag Total
Polit
ics
Crim
e
Spor
ts
Bus
ines
s
Lega
l Iss
ues
IT
Wom
en Is
sues
Dev
elop
men
t
Inte
rnat
iona
l.
Col
umns
/E
dito
rials
En
viro
nmen
t
Ente
rtain
men
t
Non
e
Hou
se
MLA Count
6 5 2 9 7 16 13 10 12 20 14 114
% within house
5.3 %
4.4 %
1.8 % 7.9
% 6.1 % 14
% 11.4%
8.8 %
10.5 %
17.5%
12.3%
100%
% within mag
85.7%
100%
66.7% 100
% 77.8% 88.9
% 61.9%
66.7%
80 %
69 %
87.5%
76.5%
MLC Count 1 1 1 2 1 2 8 5 3 9 2 35
% within house
2.9 % 2.9
% 2.9 % 5.7
% 2.9 %
5.7 %
22.9%
14.3%
8.6 %
25.7%
5.7 %
100%
% within mag
14.3% 33.3
% 100% 22.2
% 100%
11.1%
38.1%
33.3%
20 %
31 %
12.5%
23.5%
Tota
l
Count
7 5 3 1 9 9 1 18 21 15 15 29 16 149
% within house
4.7 %
3.4 %
2 %
.7 %
6 %
6 %
.7 %
12.1%
14.1%
10.1%
10.1 %
19.5%
10.7%
100%
% within mag
100%
100%
100%
100%
100%
100%
100%
100%
100%
100%
100 %
100%
100%
100%

Entertainment News (17.5 per cent) is mentioned by the highest number of MLAs
as the third priority, while Sports is mentioned by the lowest number of MLAs (1.8 per
cent). Business News and Women Issues have not been mentioned by the MLAs as the
third priority.
The highest number of MLCs (25.7 per cent) has mentioned Entertainment News,
while the lowest number has mentioned Politics, Sports, Business News and Women
Issues (2.9 per cent each). Crime News and Legal Issues do not find a mention among
MLCs.
While the larger picture remains constant, there are some minor swings between
the two Houses, among the issues listed under third priorities. A larger number of MLCs
(25.7 per cent) has mentioned Entertainment News, when compared to MLAs (17.5 per
cent). In the second priority too, MLCs who have indicated Entertainment News are
slightly higher at 5.7 per cent, compared to 4.4 per cent of MLAs.
A higher number of MLCs (14.3 per cent) has mentioned Columns/Editorials as
the third priority, when compared to MLAs (8.8 per cent). While 7 per cent of the MLAs
have mentioned Columns/ Editorials as their second priority, among MLCs it is 2.9 per
cent. As a first priority, 1.8 per cent of the MLAs have mentioned Columns / Editorials as
against none of the MLCs.
In the case of newspapers, 17.3 per cent of MLAs and 2.9 per cent of MLCs have
mentioned Columns and Editorials as their second priority. In the third priority, the figure
stands at 36.2 per cent of MLAs and 60 per cent of MLCs. Though a swing is seen
between priorities and media, overall the spread with regard to Columns/ Editorials is
more or less equal.

Similarly, across priorities and media, the concern for Development News is
evenly distributed. Among the MLAs, 14 per cent have mentioned Development News as
their third priority, compared to 5.7 per cent of MLCs. In the second priority, it is 24.6
per cent of MLAs and 22.9 per cent of MLCs. In the first priority, 3.5 per cent of MLAs
and 5.7 per cent of MLCs have mentioned Development News.
In the case of newspapers, 1.7 per cent of MLAs and 5.7 per cent of MLCs have
mentioned Development News as their first priority, 19.8 per cent of MLAs and 31.4 per
cent of MLCs have said it is their second priority, while 12.1 per cent of MLAs and 5.7
per cent of MLCs have said it is their third priority.
Women Issues has found a mention among a higher number of MLCs. While 2.9
per cent of the MLCs have mentioned Women Issues as their third priority in magazines,
among MLAs it is zero. In the second priorities too, 8.6 per cent of MLCs have
mentioned Women Issues, while among MLAs it is 2.6 per cent.
In newspapers, legislators have envisaged little interest in Women Issues.
Women Issues is not a first priority among any of the legislators including the female
respondents. It is mentioned as a second priority by 5.7 per cent of the MLCs and by
none of the MLAs. As a third priority, 3.4 per cent of MLAs have mentioned Women
Issues as against none of the MLCs.
Though certain swings are visible between various news factors in relation to
newspapers and magazines, Politics continues to remain the first and the most important
priority for members of both the Houses of the legislature.
Politics is the first priority for over 90 per cent of the legislators, both in
newspapers and magazines.

Analysis of the News Priorities in Magazines
The passion for Politics continues in the case of magazines too. As observed, the
preference for Politics as the first priority has slightly come down when compared to
newspapers.
With newspapers, 96.7 per cent of the respondents have mentioned Politics as the
first priority, while with magazines it is 90.6 per cent. Thus, Politics continues to hold the
prime position with regard to both newspapers and magazines.
One noticeable factor is that a higher number of respondents rely on magazines,
than on newspapers for Entertainment News. Of the respondents who read magazines, 4.7
per cent have mentioned Entertainment News as their second priority, while 19.5 per cent
have said it is their third priority. With newspapers only 2 per cent have indicated
Entertainment News as their third priority. In newspapers and magazines, no respondent
has mentioned it as the first priority. Thus, between newspapers and magazines, the latter
is the preferred medium for Entertainment News.
Similarly, the dependence on magazines for Business News is also higher when
compared to newspapers. Business News accounts for 18.8 per cent as the second priority
and 0.7 per cent as the third priority in magazines. In newspapers, it is 7.3 per cent as the
second priority and 6 per cent as the third priority. No respondent has mentioned
Business News as a first priority, both in newspapers and magazines. During the
interview, many legislators said they subscribed to business magazines due to their
interest in the stock market.

As in newspapers, Development News continues to be considerably high on the
agenda of legislators, in magazines too. With magazines, 4 per cent of the respondents
have mentioned Development News as the first priority. It is the second priority with 24.2
per cent of the legislators and the third priority with 12.1 per cent. In the case of
newspapers, it is 2.6 per cent in first priority, 22.5 per cent in second priority and 10.6 per
cent in third priority.
A comparison between Information Technology and Development News as a
priority shows that Information Technology is way down the priority list. Though
Bangalore has emerged as the undisputed leader in the software sector, the number of
respondents who have expressed interest in Information Technology is not very high both
with newspapers and magazines.
In magazines, 3.4 per cent have mentioned Information Technology as their
second priority and 6 per cent as their third priority. With newspapers, it is 1.3 per cent in
second priority and 6 per cent in third priority. In both the cases, Information Technology
does not find a mention in the list of first priorities.
Women Issues also has not received much attention among the respondents. In
magazines, Women Issues has made it to the list of first priorities, though the number is
low at 1.3 per cent. In the second priority, it is 4 per cent and in the third priority it is 0.7
per cent.
Among the male respondents, Women Issues is the second priority among 1.4 per
cent in magazines. It is a first and third priority with none. In the case of newspapers too,
Women Issues is not high on the priority list of the men. It is mentioned by none as a first
and second priority and by 0.7 per cent as a third priority.

TELEVISION VIEWING HABITS AND PREFERENCES
Television made an entry to India in 1959 with the setting up of the Delhi
Television Centre, which beamed 20 minute programmes twice a week to viewers
comprising members of the 180 teleclubs provided free sets by the UNESCO.
Entertainment and information programmes were introduced from August 1965.
By 1970, the duration of the service was increased to three hours, which in
addition to news and entertainment included Krishi Darshan (Agriculture News). The
year 1976 saw the formation of the country�s national channel Doordarshan. In 1977, for
the first time in the history of broadcasting in India, political parties shared an equal ratio
of time with the ruling party during the election.
There have been two milestones in the history of Indian television. The first was
in 1982, when colour TV was introduced by Doordarshan during the Asian Games.
The second was in the early nineties with the broadcast of satellite TV by foreign
programmers like CNN followed by Star TV and a little later by domestic channels such
as Zee TV and Sun TV. Today, Indian homes have access to about 100 channels.
Karnataka has also latched on to the television explosion, with the launch of
several Kannada channels. Popular among them are ETV Kannada, Udaya TV, Ushe TV,
Chandana and C Bangalore.
Along with the rest of the country, Karnataka is now witnessing the third
revolution in television history, with the introduction of Direct-to-Home (DTH), which
offers a bouquet of over a 100 channels to viewers even in remote areas not connected by
cable television.
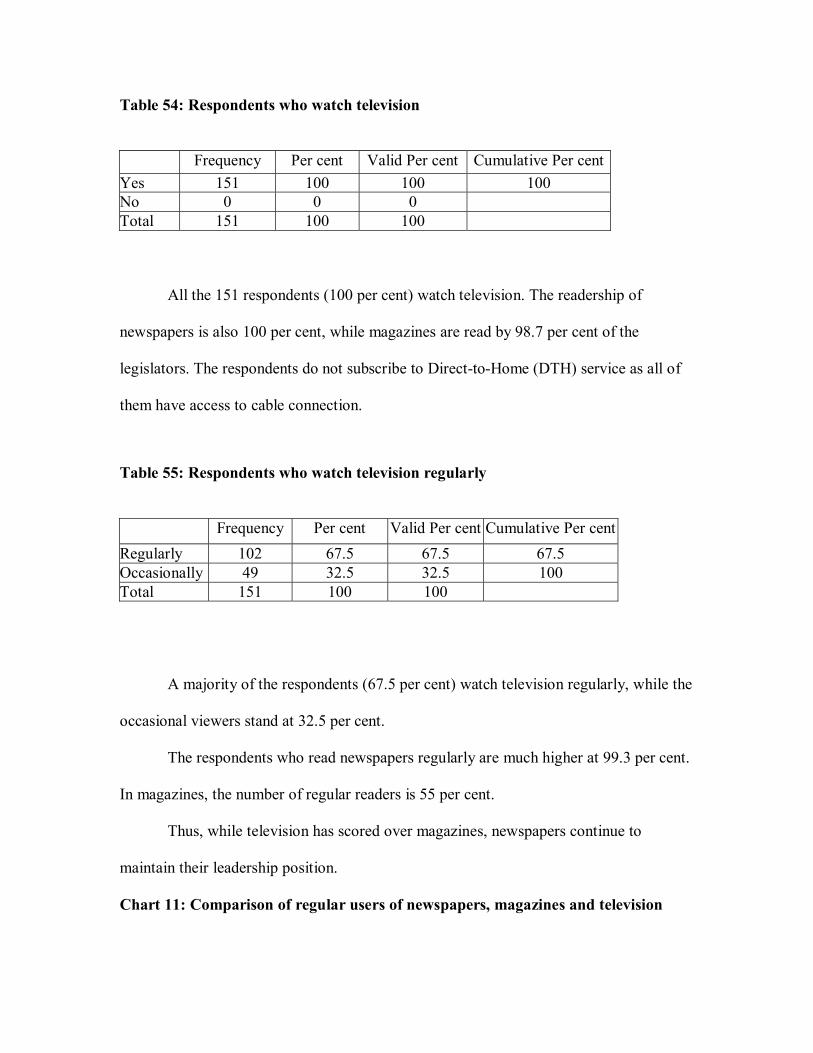
Table 54: Respondents who watch television
Frequency Per cent Valid Per cent Cumulative Per cent Yes 151 100 100 100 No 0 0 0 Total 151 100 100
All the 151 respondents (100 per cent) watch television. The readership of
newspapers is also 100 per cent, while magazines are read by 98.7 per cent of the
legislators. The respondents do not subscribe to Direct-to-Home (DTH) service as all of
them have access to cable connection.
Table 55: Respondents who watch television regularly
Frequency Per cent Valid Per cent Cumulative Per cent Regularly 102 67.5 67.5 67.5 Occasionally 49 32.5 32.5 100 Total 151 100 100
A majority of the respondents (67.5 per cent) watch television regularly, while the
occasional viewers stand at 32.5 per cent.
The respondents who read newspapers regularly are much higher at 99.3 per cent.
In magazines, the number of regular readers is 55 per cent.
Thus, while television has scored over magazines, newspapers continue to
maintain their leadership position.
Chart 11: Comparison of regular users of newspapers, magazines and television

0%
20%
40%
60%
80%
100%
% o
f res
pond
ents
Regular 99.3% 55% 67.5%
Occasional 0.7% 45% 32.5%
Np Mag TV
The chart shows that the highest number of regular users (99.3 per cent) is within
newspapers, which also has the lowest number of occasional users (0.7 per cent).
Table 56: Time spent by the respondents with television
Frequency Per cent Valid Per cent Cumulative Per cent 1 hr and above 61 40.4 40.4 40.4 30 mins to 1 hr 64 42.4 42.4 82.8 < 30 mins 26 17.2 17.2 100 Total 151 100 100
Among the respondents, 40.4 per cent watch television for one hour and above
everyday, 42.4 per cent spend 30 minutes to one hour, while 17.2 per cent devote less
than 30 minutes.
While 67.5 per cent have indicated that they watch television regularly, the
number of respondents spending more than one hour with television is 40.4 per cent. This
indicates that regular viewers do not necessarily watch television for a longer period.
Chart 12: Time spent with newspapers, magazines and television

0%
5%
10%
15%
20%
25%
30%
35%
40%
45%
50%
% o
f res
pond
ents
1 hr abv 49.7% 44.3% 40.4%
30 min to 1 hr 47% 36.9% 42.4%
< 30 mins 3.3% 18.8% 17.2%
Newspaper Magazine Television
The time spent on television is significantly lower than the time devoted to
newspapers everyday. With newspapers, 49.7 per cent spend one hour and above, 47 per
cent spend 30 minutes to one hour, while only 3.3 per cent spend less than 30 minutes.
Among magazine readers, 44.3 per cent devote one hour and above per week,
36.9 per cent spend 30 minutes to one hour, while 18.8 per cent spend less than 30
minutes.
With television, 40.4 per cent spend one hour and above, 42.4 per cent spend 30
minutes to one hour, while 17.2 per cent spend less than 30 minutes.

Table 57: Time spent with television and the education level
1 hr and abv
30 min to 1 hr
Below 30 mins
Total
Education <SSLC Count 1 2 1 4 % within
education25% 50% 25% 100%
SSLC and abv Count 11 20 7 38 % within
education29% 52.6% 18.4% 100%
Graduate Count 35 26 16 77 % within
education45.4% 33.8% 20.8% 100%
Postgraduate Count 4 11 2 17 % within
education23.5% 64.7% 11.8% 100%
Professional Count 10 5 15 % within
education66.7% 33.3% 100%
Total Count 61 64 26 151 % within
total 40.4% 42.4% 17.2% 100%
In the below SSLC education group, 25 per cent of the respondents watch
television for one hour and above, 50 per cent for 30 minutes to one hour and 25 per cent
for below 30 minutes.
In the SSLC and above age group, 29 per cent view television for one hour and
above, 52.6 per cent for 30 minutes to one hour and 18.4 per cent for below 30 minutes.
Among graduates, 45.4 per cent watch television for one hour and above, 33.8 per
cent for 30 minutes to one hour and 20.8 per cent for below 30 minutes.
In the postgraduate group, 23.5 per cent view television for one hour and more,
64.7 per cent for 30 minutes to one hour and 11.8 per cent for less than 30 minutes.
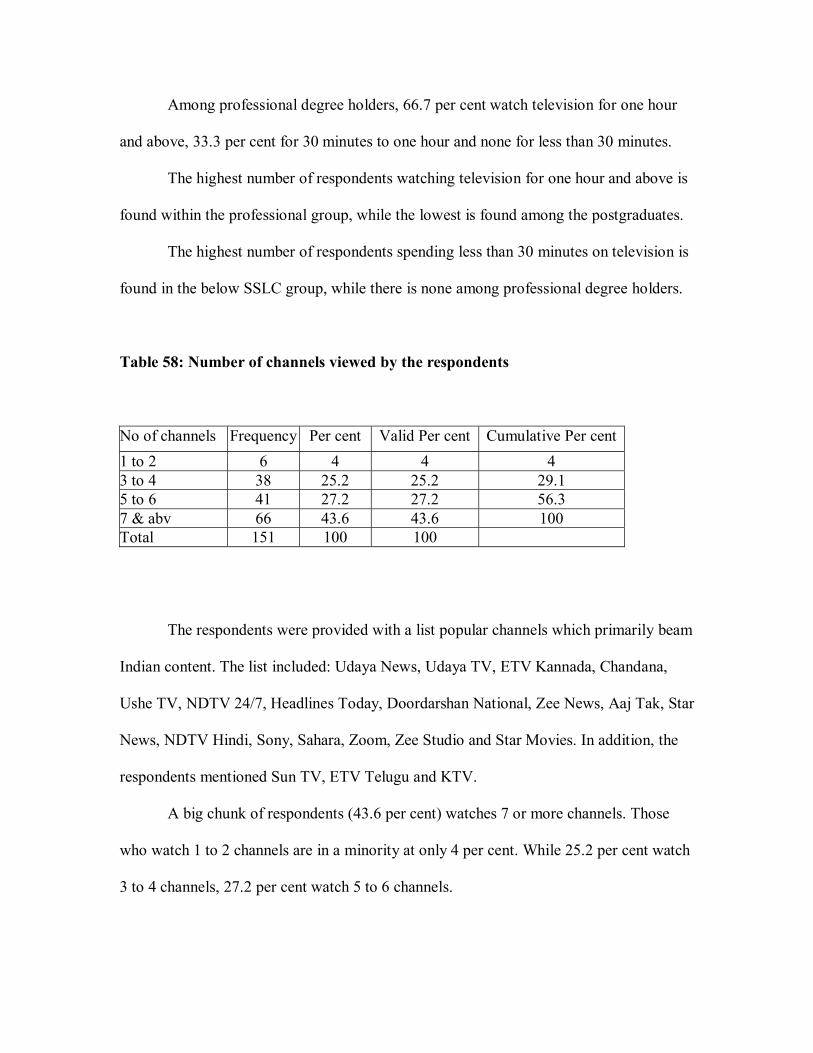
Among professional degree holders, 66.7 per cent watch television for one hour
and above, 33.3 per cent for 30 minutes to one hour and none for less than 30 minutes.
The highest number of respondents watching television for one hour and above is
found within the professional group, while the lowest is found among the postgraduates.
The highest number of respondents spending less than 30 minutes on television is
found in the below SSLC group, while there is none among professional degree holders.
Table 58: Number of channels viewed by the respondents No of channels Frequency Per cent Valid Per cent Cumulative Per cent 1 to 2 6 4 4 4 3 to 4 38 25.2 25.2 29.1 5 to 6 41 27.2 27.2 56.3 7 & abv 66 43.6 43.6 100 Total 151 100 100
The respondents were provided with a list popular channels which primarily beam
Indian content. The list included: Udaya News, Udaya TV, ETV Kannada, Chandana,
Ushe TV, NDTV 24/7, Headlines Today, Doordarshan National, Zee News, Aaj Tak, Star
News, NDTV Hindi, Sony, Sahara, Zoom, Zee Studio and Star Movies. In addition, the
respondents mentioned Sun TV, ETV Telugu and KTV.
A big chunk of respondents (43.6 per cent) watches 7 or more channels. Those
who watch 1 to 2 channels are in a minority at only 4 per cent. While 25.2 per cent watch
3 to 4 channels, 27.2 per cent watch 5 to 6 channels.

Chart 13: Comparison of consumption of newspapers, magazines and television
0%
5%10%
15%20%
25%30%
35%40%
45%
% o
f res
pond
ents
1 to 2 4.6% 34.2% 4%
3 to 4 21.9% 36.9% 25.2%
5 to 6 31.8% 16.1% 27.2%
Abv 7 41.7% 12.8% 43.6%
Newspaper Magazine Television
The pattern of usage appears to be similar between newspaper and television with
regard to the number of newspapers read and channels watched. Those who read only 1
to 2 newspapers are in the minority (4.6 per cent). Similarly, in television too the number
of respondents watching 1 to 2 channels is low (4 per cent).
A majority of the respondents (41.7 per cent) reads 7 or more newspapers. In
television too, a majority (43.6 per cent) watches 7 or more channels.
With magazines, a large section of 34.2 per cent reads 1 to 2 magazines, while
only 12.8 per cent read 7 or more magazines.

Table 59: Number of channels viewed and the education level
1 to 2 3 to 4 5 to 6 > 7 Total Education <SSLC Count 3 1 4 % within
education 75% 25% 100%
SSLC & abv Count 1 14 12 11 38 % within
education2.6% 36.8% 31.6% 29% 100%
Graduate Count 2 19 20 36 77 % within
education2.6% 24.7% 26% 46.7% 100%
Postgraduate Count 2 2 6 7 17 % within
education11.8% 11.8% 35.3% 41.1% 100%
Professional Count 1 3 11 15 % within
education6.7% 20% 73.3% 100%
Total Count 6 38 41 66 151 % within
total 4% 25.2% 27.2% 43.6% 100%
In the below SSLC group, 75 per cent watch 5 to 6 channels, while 25 per cent
watch 7 or more channels. No respondent watches 1 to 2 or 3 to 4 channels.
Among the SSLC and above group, 2.6 per cent watch 1 to 2 channels, 36.8 per
cent watch 3 to 4 channels, 31.6 per cent watch 5 to 6 channels and 29 per cent watch 7
or more channels.
Among the graduates, 2.6 per cent watch 1 to 2 channels, 24.7 per cent watch 3 to
4 channels, 26 per cent watch 5 to 6 channels and 46.7 per cent watch 7 or more
channels.
Among postgraduates, 11.8 per cent watch 1 to 2 channels, 11.8 per cent watch 3
to 4 channels, 35.3 per cent watch 5 to 6 channels and 41.1 per cent watch 7 or more
channels.
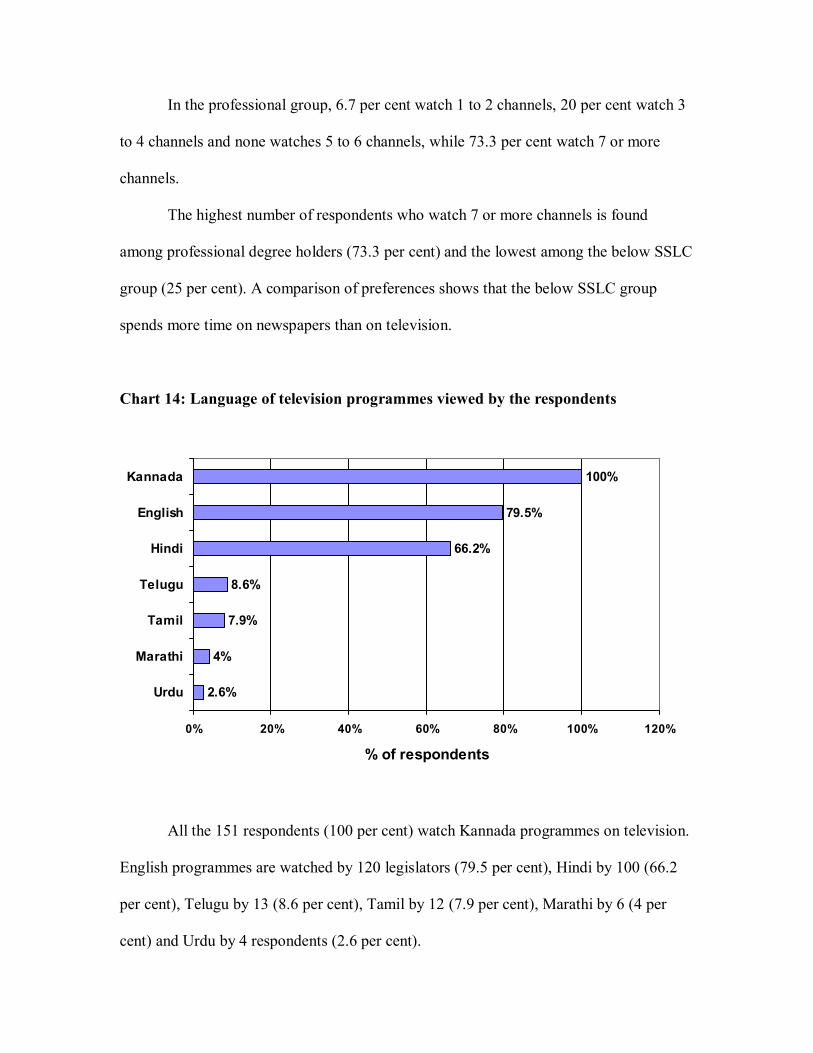
In the professional group, 6.7 per cent watch 1 to 2 channels, 20 per cent watch 3
to 4 channels and none watches 5 to 6 channels, while 73.3 per cent watch 7 or more
channels.
The highest number of respondents who watch 7 or more channels is found
among professional degree holders (73.3 per cent) and the lowest among the below SSLC
group (25 per cent). A comparison of preferences shows that the below SSLC group
spends more time on newspapers than on television.
Chart 14: Language of television programmes viewed by the respondents
2.6%
4%
7.9%
8.6%
66.2%
79.5%
100%
0% 20% 40% 60% 80% 100% 120%
Urdu
Marathi
Tamil
Telugu
Hindi
English
Kannada
% of respondents
All the 151 respondents (100 per cent) watch Kannada programmes on television.
English programmes are watched by 120 legislators (79.5 per cent), Hindi by 100 (66.2
per cent), Telugu by 13 (8.6 per cent), Tamil by 12 (7.9 per cent), Marathi by 6 (4 per
cent) and Urdu by 4 respondents (2.6 per cent).

Preference for International Channels Among the Legislators
Table 60: Respondents who watch international channels
Frequency Per cent Valid Per cent Cumulative Per centYes 113 74.8 74.8 74.8 No 38 25.2 25.2 100 Total 151 100 100
The number of respondents watching international channels is considerably high
when compared to those who read international newspapers and magazines. While 74.8
per cent of the legislators watch international channels, 25.2 per cent do not. On the other
hand, only 13.9 per cent read international newspapers and 23.5 per cent read
international magazines. The respondents were provided with a list of popular television
channels, to choose from, namely, CNN, BBC, CNBC, AXN, National Geographic,
Discovery, FTV, Trends, Cartoon Network and Pogo.
Chart 15: Readers / viewers of international newspapers/magazines/ television
0%
20%
40%
60%
80%
% o
f res
pond
ents
International 13.9% 23.5% 74.8%
Newspaper Magazine Television
Among the three media, the highest number of respondents watches international
channels compared to those who read international newspapers and magazines.
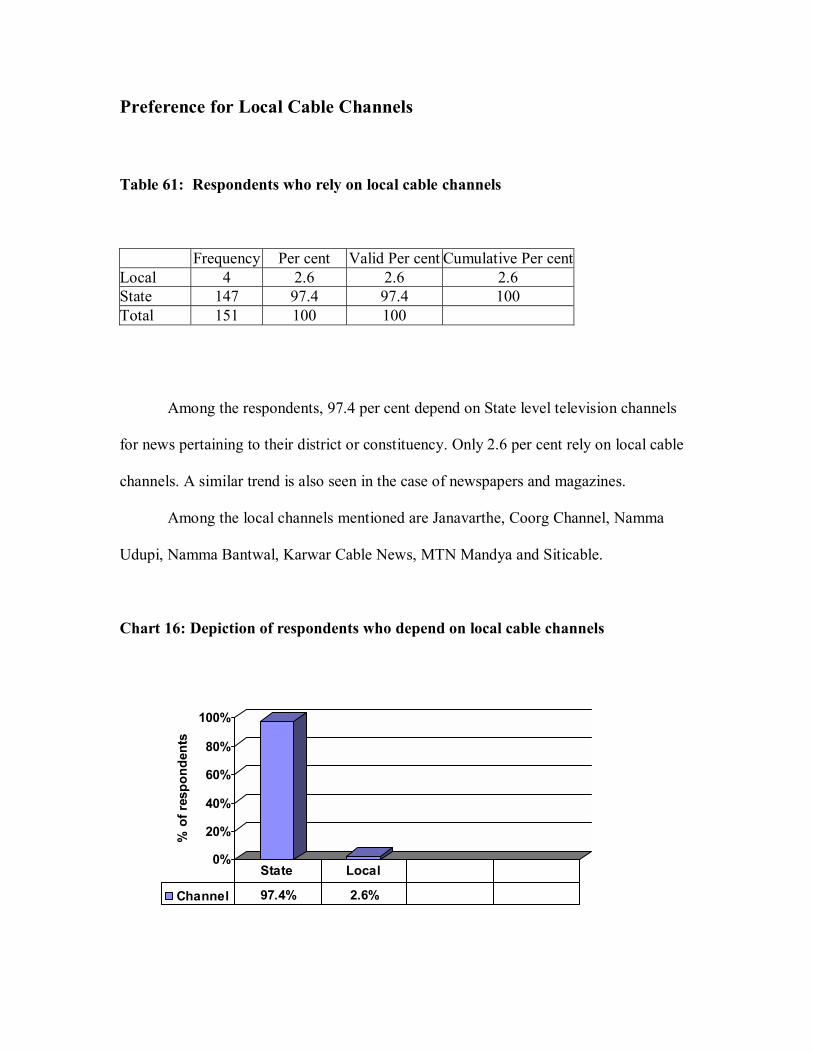
Preference for Local Cable Channels Table 61: Respondents who rely on local cable channels
Frequency Per cent Valid Per cent Cumulative Per cent Local 4 2.6 2.6 2.6 State 147 97.4 97.4 100 Total 151 100 100
Among the respondents, 97.4 per cent depend on State level television channels
for news pertaining to their district or constituency. Only 2.6 per cent rely on local cable
channels. A similar trend is also seen in the case of newspapers and magazines.
Among the local channels mentioned are Janavarthe, Coorg Channel, Namma
Udupi, Namma Bantwal, Karwar Cable News, MTN Mandya and Siticable.
Chart 16: Depiction of respondents who depend on local cable channels
0%
20%
40%
60%
80%
100%
% o
f res
pond
ents
Channel 97.4% 2.6%
State Local
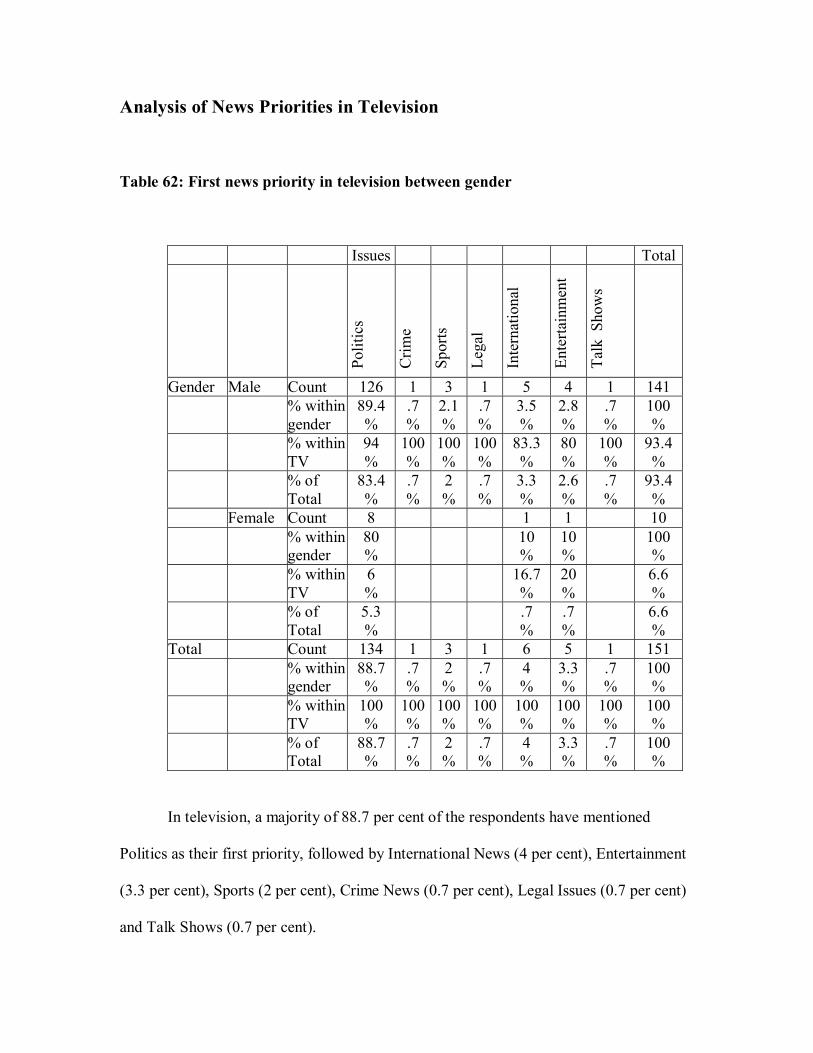
Analysis of News Priorities in Television Table 62: First news priority in television between gender
Issues Total
Polit
ics
Crim
e
Spor
ts
Lega
l
Inte
rnat
iona
l En
terta
inm
ent
Talk
Sho
ws
Gender Male Count 126 1 3 1 5 4 1 141 % within
gender 89.4 %
.7 %
2.1 %
.7 %
3.5 %
2.8 %
.7 %
100 %
% within TV
94 %
100%
100%
100%
83.3 %
80 %
100 %
93.4 %
% of Total
83.4 %
.7 %
2 %
.7 %
3.3 %
2.6 %
.7 %
93.4 %
Female Count 8 1 1 10 % within
gender 80 %
10 %
10 %
100 %
% within TV
6 %
16.7 %
20 %
6.6 %
% of Total
5.3 %
.7 %
.7 %
6.6 %
Total Count 134 1 3 1 6 5 1 151 % within
gender 88.7 %
.7 %
2 %
.7 %
4 %
3.3 %
.7 %
100 %
% within TV
100 %
100%
100%
100%
100 %
100 %
100 %
100 %
% of Total
88.7 %
.7 %
2 %
.7 %
4 %
3.3 %
.7 %
100 %
In television, a majority of 88.7 per cent of the respondents have mentioned
Politics as their first priority, followed by International News (4 per cent), Entertainment
(3.3 per cent), Sports (2 per cent), Crime News (0.7 per cent), Legal Issues (0.7 per cent)
and Talk Shows (0.7 per cent).
Politics as the first priority is slightly lower in television as compared to
newspapers and magazines where 96.7 per cent and 90.6 per cent respectively have
mentioned Politics as their first priority. Apart from Politics, only International News is
mentioned as the first priority across all three media.
Entertainment with 3.3 per cent also made it to the list of first priorities, due to the
high viewership of serials and films. Entertainment is not mentioned as a first priority
either by newspaper or magazine readers.
India is a country of die-hard cricket fans, who remain glued to the television set
every time a match is telecast. Sports is mentioned by two per cent as their first priority in
television. Sports is not a first priority with both newspaper and magazine readers.
Similarly, Crime News which is not indicated by newspaper or magazine readers
as a first priority, is mentioned by 0.7 per cent of television viewers. Legal Issues and
Talk Shows have also made a mark with 0.7 per cent each.
Development News which is mentioned as the first priority in both newspaper and
magazine, does not find a place in television.
The highest number of male respondents has mentioned Politics (89.4 per cent) as
the first priority, while the lowest number has mentioned Crime News, Legal Issues and
Talk Shows (0.7 per cent each).
Among the female respondents, 80 per cent have mentioned Politics, while 10 per
cent each have mentioned International News and Entertainment. Female respondents
have not mentioned Crime News, Sports, Legal Issues and Talks Shows as the first
priority. Thus, in the case of television, Politics is the first priority with a majority of both
men and women legislators.

International News is mentioned by 10 per cent of women and 3.5 per cent of the
men. This is a deviation from newspapers and magazines where no female respondent
has indicated International News as the first priority. While 10 per cent of the female
respondents vouch for Entertainment, among men it is 2.8 per cent.
While 2.1 per cent of the men have mentioned Sports as the first priority, among
women it is zero.
Chart 17: Depiction of first priority among legislators in television
0%
10%
20%
30%
40%
50%
60%
70%
80%
90%
% o
f res
pond
ents
I Priority 88.7% 4% 3.3% 2% 0.7% 0.7% 0.7%
Politics Int Ent Sports Legal Talk Show
Crime
In television, five new issues have made their entry into the first priority list:
Crime News, Sports, Legal Issues, Entertainment and Talks Shows. In newspapers, the
first priorities are Politics, Development News and International News. In magazines,
they are Politics, Women Issues, Development News, International News and Columns/
Editorials. With newspapers, the respondents are very definitive about their first
priorities, where as with magazines and television, it is spread across various issues.

Table 63: Second news priority in television between gender
Issues Total
Po
litic
s
Crim
e
Spor
ts
Bus
ines
s
Lega
l
IT
Wom
en Is
sues
Dev
elop
men
t
Inte
rnat
iona
l
Agr
icul
ture
Envi
ronm
ent
Ente
rtain
men
t
Talk
Sho
w
Wild
life
Gen
der Male Count 6 16 57 23 4 3 2 5 1 7 15 2 141
% within gender
4.3 %
11.3%
40.4%
16.3%
2.8 %
2.1 %
1.4 %
3.5 %
.7 %
5 %
10.6%
1.4 %
100%
% within TV
75 %
94.1%
96.6%
100%
100%
100%
100%
83.3%
100%
87.5%
100%
100%
93.4%
% of Total
4 %
10.6%
37.7%
15.2%
2.6 %
2 %
1.3 %
3.3 %
.7 %
4.6 %
9.9 %
1.3 %
93.4%
Female Count 2 1 2 2 1 1 1 10
% within gender
20 %
10 %
20 %
20%
10 %
10 %
10 %
100%
% within TV
25 %
5.9 %
3.4 %
100%
100%
16.7%
12.5%
6.6 %
% of Total
1.3 %
.7 %
1.3 %
1.3%
.7 %
.7 %
.7 %
6.6 %
Tota
l Count 8 17 59 23 4 2 1 3 2 6 1 8 15 2 151
% within gender
5.3 %
11.3%
39.1%
15.2%
2.6 %
1.3%
.7 %
2 %
1.3 %
4 %
.7 %
5.3 %
9.9 %
1.3 %
100%
% within TV
100%
100 %
100%
100%
100%
100%
100%
100%
100%
100%
100%
100%
100%
100%
100%

Sports is mentioned by 39.1 per cent of the respondents as the second priority,
followed by Business News (15.2 per cent), Crime News ( 11.3 per cent), Talk Shows
(9.9 per cent), Politics (5.3 per cent), Entertainment (5.3 per cent), Agriculture News (4
per cent), Legal Issues (2.6 per cent), Development News (2 per cent), Information
Technology (1.3 per cent), Wildlife (1.3 per cent), International News (1.3 per cent),
Women Issues (0.7 per cent) and Environment News (0.7 per cent).
Television appears to be the favourite medium among the legislators with regard
to Sports. While 2 per cent of the legislators have mentioned Sports as their first priority,
39.1 per cent have said it is their second priority. With newspapers, Sports is the second
priority with 17.9 per cent of the respondents, while in magazines, it is the second priority
with 19.5 per cent.
Development News which is mentioned by the highest number of respondents as
their second priority in newspapers, has lost out to Sports in television. Only 2 per cent of
the respondents have mentioned Development News as their second priority, while it is
the first priority among none. In newspapers, Development News is the first priority with
2.6 per cent and second priority with 22.5 per cent. In magazine, it is the first priority
among 4 per cent and second priority among 24.2 per cent.
Business News also is significantly high on the second priority list with 15.2 per
cent of the viewers. In newspapers, it is the second priority with 7.3 per cent, while in
magazines, it is with 18.8 per cent of the respondents.
Like Sports, television has scored in the case of Crime News too, with 11.3 per
cent mentioning it as their second priority. Crime News is also mentioned as a first
priority by 0.7 per cent. In newspapers and magazines, it is not the first priority with any

respondent. It is the second priority with 4.6 per cent in newspaper and 4 per cent in
magazines.
With regard to Entertainment too, television has scored over the print media with
5.3 per cent mentioning it as the second priority. Entertainment is also mentioned by 3.3
per cent as the first priority. With newspaper and magazines, it does not figure in the first
priority list. As a second priority, it is indicated by none in newspapers and by 4.7 per
cent in magazines.
Only 0.7 per cent of the viewers have mentioned Women Issues as the second
priority. In newspapers, 1.3 per cent have mentioned it as the second priority. The score
is slightly better in magazines, with 1.3 per cent indicating it as the first priority and 4 per
cent mentioning it as the second priority.
Among the male respondents, the highest number of 40.4 per cent has mentioned
Sports as their second priority, while the lowest number of 0.7 per cent has mentioned
Environment News. Information Technology and Women Issues have not found a
mention among the second priorities of men.
Among the female respondents, 20 per cent each have mentioned Politics, Sports
and Information Technology, while 10 per cent each have mentioned Crime News,
Women Issues, Agriculture News and Entertainment. Business News, Legal Issues,
Development News, International News, Environmental News, Talk Shows and Wildlife
are not mentioned by the female respondents as a second priority.
While 40.4 per cent of the male respondents have mentioned Sports as their
second priority, among women it is 20 per cent. With newspapers and magazines, no
female respondent has mentioned Sports either as a first or second priority.

Table 64: Third news priority in television between gender Issues Total
Polit
ics
Crim
e
Spor
ts
Bus
ines
s
Lega
l
Dev
elop
men
t
Inte
rnat
iona
l
Agr
icul
ture
Envi
ronm
ent
Ente
rtain
men
t
Talk
Sho
ws
Gen
der Male Count 1 2 15 1 9 17 27 8 13 45 3 141
% within gender
.7 %
1.4 %
10.6%
.7 %
6.4 %
12.1%
19.1%
5.7 %
9.2 %
31.9%
2.1 %
100%
% within TV
100 %
66.7%
100%
100%
100%
100%
96.4%
88.9%
92.9%
88.2%
100 %
93.4%
% of Total
.7 %
1.3 %
9.9 %
.7 %
6 %
11.3%
17.9%
5.3 %
8.6 %
29.8%
2 %
93.4%
Female Count 1 1 1 1 6 10
% within gender
10 %
10 %
10 %
10 %
60 %
100%
% within TV
33.3%
3.6 %
11.1%
7.1 %
11.8%
6.6 %
% of Total
.7 %
.7 %
.7 %
.7 %
4 %
6.6 %
Tota
l Count 1 3 15 1 9 17 28 9 14 51 3 151
% within gender
.7 %
2 %
9.9 %
.7 %
6 %
11.3%
18.5%
6 %
9.3 %
33.8%
2 %
100%
% within TV
100 %
100%
100%
100%
100%
100%
100%
100%
100 %
100 %
100 %
100%
% of Total
.7 %
2 %
9.9 %
.7 %
6 %
11.3%
18.5%
6 %
9.3 %
33.8%
2 %
100%

Among the third priorities, 33.8 per cent have mentioned Entertainment, followed
by International News (18.5 per cent), Development News (11.3 per cent), Sports (9.9 per
cent), Environment News (9.3 per cent), Agriculture News (6 per cent), Legal Issues (6
per cent), Crime News (2 per cent), Talk Shows (2 per cent), Politics (0.7 per cent) and
Business News (0.7 per cent)
Development News which has not found a place in the first priority, is a second
priority among 2 per cent of the viewers. Under the third priority, it is mentioned by 11.3
per cent. With newspapers and magazines, the readership of Development News is much
higher.
Among the male respondents, the highest number has mentioned Entertainment
(31.9 per cent) as the third priority, while the lowest number has mentioned Politics and
Business News (0.7 per cent each).
Among the female respondents, 60 per cent have mentioned Entertainment, while
10 per cent each have mentioned Crime News, International News, Agriculture News and
Environment News. Politics, Sports, Business News, Legal Issues, Development News
and Talk Shows are not mentioned as a third priority by the women.
As a third priority, Sports is not mentioned by women. However, 20 per cent of
the female respondents have mentioned Sports as their second priority.
Crime News is a third priority among 10 per cent of the women respondents.
Agriculture News which is not mentioned by any female respondent in newspapers and
magazines, is indicated by 10 per cent each in television as a second and third priority.
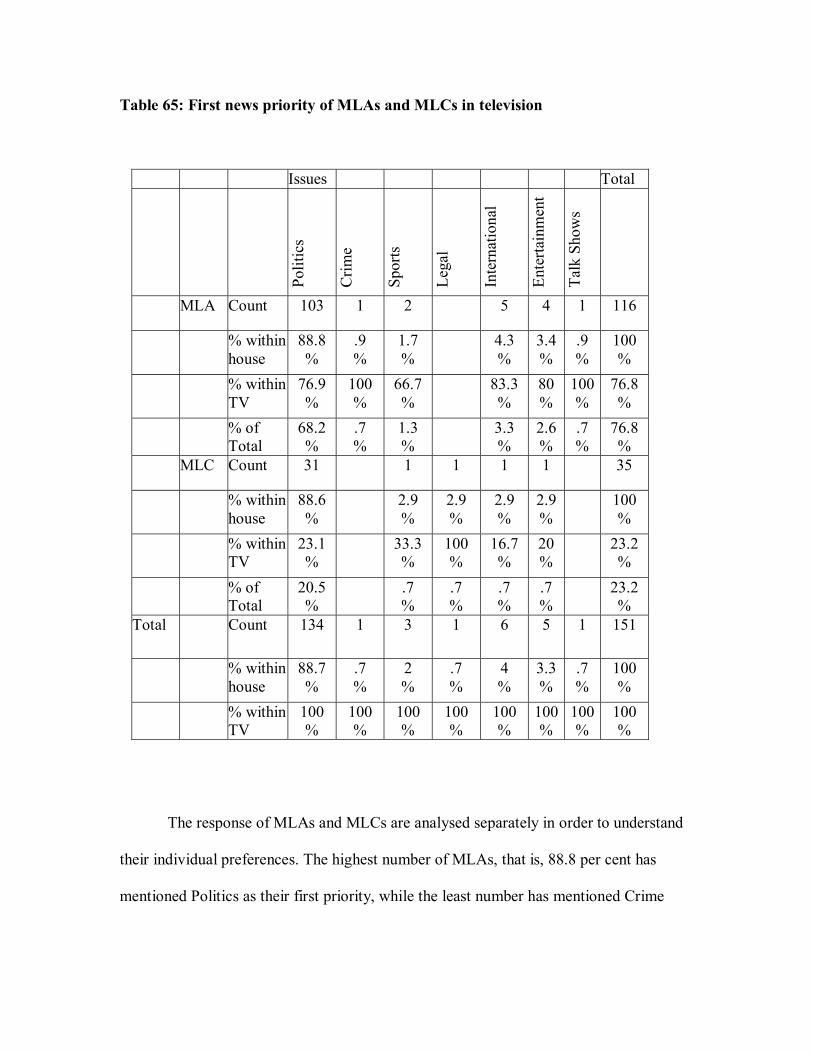
Table 65: First news priority of MLAs and MLCs in television
Issues Total
Polit
ics
Crim
e
Spor
ts
Lega
l
Inte
rnat
iona
l
Ente
rtain
men
t
Talk
Sho
ws
MLA Count 103 1 2 5 4 1 116
% within house
88.8 %
.9 %
1.7 %
4.3 %
3.4 %
.9 %
100 %
% within TV
76.9 %
100 %
66.7 %
83.3 %
80 %
100%
76.8 %
% of Total
68.2 %
.7 %
1.3 %
3.3 %
2.6 %
.7 %
76.8 %
MLC Count 31 1 1 1 1 35
% within house
88.6 %
2.9 %
2.9 %
2.9 %
2.9 %
100 %
% within TV
23.1 %
33.3 %
100 %
16.7 %
20 %
23.2 %
% of Total
20.5 %
.7 %
.7 %
.7 %
.7 %
23.2 %
Total Count 134 1 3 1 6 5 1 151
% within house
88.7 %
.7 %
2 %
.7 %
4 %
3.3 %
.7 %
100 %
% within TV
100 %
100 %
100 %
100 %
100 %
100%
100%
100 %
The response of MLAs and MLCs are analysed separately in order to understand
their individual preferences. The highest number of MLAs, that is, 88.8 per cent has
mentioned Politics as their first priority, while the least number has mentioned Crime

News and Talk Shows (0.9 per cent each). MLAs have not mentioned Legal Issues as
their first priority.
Among the MLCs too, the highest number has mentioned Politics (88.6 per cent),
while the lowest number has mentioned Sports, Legal Issues, International News and
Entertainment (2.9 per cent each). MLCs have not mentioned Crime News and Talk
Shows as a first priority.
Politics is the first priority with the highest number of MLAs and MLCs with
newspapers and magazines too.
A comparison of the preferences across media indicates that the media habits of
the legislators of both the Houses are largely similar.
As a first priority, International News is mentioned by 4.3 per cent of the MLAs
and 2.9 per cent of the MLCs. In the case of newspapers, 2.9 per cent of the MLCs have
said International News is their first priority, as against none of the MLAs. With
magazines, 2.6 per cent of MLAs and 2.9 per cent of MLCs have mentioned International
News as the first priority. Though a minor swing is seen across media, the overall
preference for International News among both MLAs and MLCs is equally low.
Entertainment which is not a first priority in newspapers and magazines, makes an
appearance with television. Here too, a significant difference is not observed. Among
MLAs, 3.4 per cent have said Entertainment is their first priority, while among MLCs it
is 2.9 per cent.
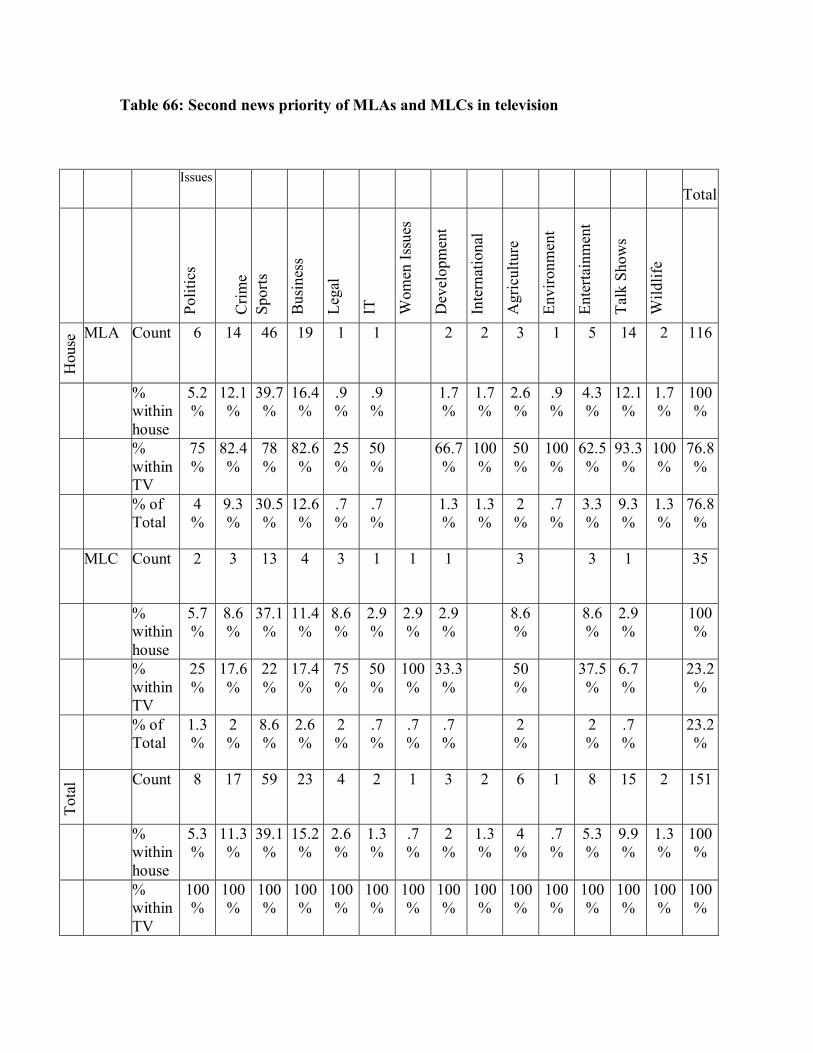
Table 66: Second news priority of MLAs and MLCs in television
Issues Total
Polit
ics
Crim
e Sp
orts
Bus
ines
s
Lega
l
IT
Wom
en Is
sues
Dev
elop
men
t
Inte
rnat
iona
l
Agr
icul
ture
Envi
ronm
ent
Ente
rtain
men
t
Talk
Sho
ws
Wild
life
Hou
se MLA Count 6 14 46 19 1 1 2 2 3 1 5 14 2 116
% within house
5.2 %
12.1%
39.7%
16.4%
.9 %
.9 %
1.7 %
1.7 %
2.6 %
.9 %
4.3 %
12.1%
1.7 %
100%
% within TV
75 %
82.4%
78 %
82.6%
25 %
50 %
66.7%
100%
50 %
100%
62.5%
93.3%
100%
76.8%
% of Total
4 %
9.3 %
30.5%
12.6%
.7 %
.7 %
1.3 %
1.3 %
2 %
.7 %
3.3 %
9.3 %
1.3 %
76.8%
MLC Count 2 3 13 4 3 1 1 1 3 3 1 35
% within house
5.7 %
8.6 %
37.1%
11.4%
8.6 %
2.9 %
2.9 %
2.9 %
8.6 %
8.6 %
2.9 %
100%
% within TV
25 %
17.6%
22 %
17.4%
75 %
50 %
100%
33.3%
50 %
37.5%
6.7 %
23.2%
% of Total
1.3 %
2 %
8.6 %
2.6 %
2 %
.7 %
.7 %
.7 %
2 %
2 %
.7 %
23.2%
Tota
l Count 8 17 59 23 4 2 1 3 2 6 1 8 15 2 151
% within house
5.3 %
11.3%
39.1%
15.2%
2.6 %
1.3 %
.7 %
2 %
1.3 %
4 %
.7 %
5.3 %
9.9 %
1.3 %
100%
% within TV
100%
100%
100%
100%
100%
100%
100%
100%
100%
100%
100%
100%
100%
100%
100%

The highest number of MLAs has mentioned Sports (39.7 per cent) as the second
priority, while the least number (0.9 per cent each) has mentioned Legal Issues,
Information Technology and Environment News. Women Issues is not mentioned as a
second priority by the MLAs.
Among the MLCs, the highest number (37.1 per cent) has mentioned Sports as the
second priority, and the least number (2.9 per cent each) has mentioned Information
Technology, Women Issues, Development News and Talk Shows. As a second priority,
no MLC has mentioned International News, Environment News and Wildlife.
The distribution among the MLAs and MLCs is almost similar with regard to
second priorities under television, particularly with reference to Politics, Sports, Business
News and Development News.
Members of the Lower House seem to have a greater interest in Crime News
compared to their counterparts in the Upper House. While Crime News is a second
priority among 12.1 per cent of the MLAs, among the MLCs it is 8.6 per cent. In the first
priority, Crime News has no takers among the MLCs, while among MLAs, it is 0.9 per
cent. In newspapers, Crime News as a second priority attracted 5.2 per cent of the MLAs
and 2.9 per cent of the MLCs. In magazines, Crime News is the second priority with 4.4
per cent of MLAs and 2.9 per cent of MLCs. This indicates that MLAs evince more
interest in Crime News as compared to the MLCs.
Of the MLCs, 8.6 per cent have mentioned Agriculture News as their second
priority, compared to 2.6 per cent of MLAs. In newspapers, 2.6 per cent of the MLAs
have mentioned Agriculture News as their second priority, as against none of the MLCs.

Table 67: Third news priority of MLAs and MLCs in television
Issues Total
Polit
ics
Crim
e
Spor
ts
Bus
ines
s
Lega
l
Dev
elop
men
t
Inte
rnat
iona
l
Agr
icul
ture
Envi
ronm
ent
Ente
rtain
men
t.
Talk
Sho
w
Hou
se MLA Count 1 3 12 1 9 14 22 5 12 36 1 116
% within house
.9 %
2.6 %
10.3%
.9 %
7.8 %
12.1%
19 %
4.3 %
10.3%
31 %
.9 %
100%
% within TV
100 %
100%
80 %
100%
100%
82.4%
78.6%
55.6%
85.7%
70.6%
33.3%
76.8%
% of Total
.7 %
2 %
7.9 %
.7 %
6 %
9.3 %
14.6%
3.3 %
7.9 %
23.8%
.7 %
76.8%
MLC Count 3 3 6 4 2 15 2 35
% within house
8.6 %
8.6 %
17.1%
11.4%
5.7 %
42.9%
5.7 %
100%
% within TV
20 %
17.6%
21.4%
44.4%
14.3%
29.4%
66.7%
23.2%
% of Total
2 %
2 %
4 %
2.6 %
1.3 %
9.9 %
1.3 %
23.2%
Tota
l Count 1 3 15 1 9 17 28 9 14 51 3 151
% within house
.7 %
2 %
9.9 %
.7% 6 %
11.3%
18.5%
6 %
9.3 %
33.8%
2 %
100%
% within TV
100 %
100%
100%
100%
100%
100%
100%
100%
100%
100%
100%
100%
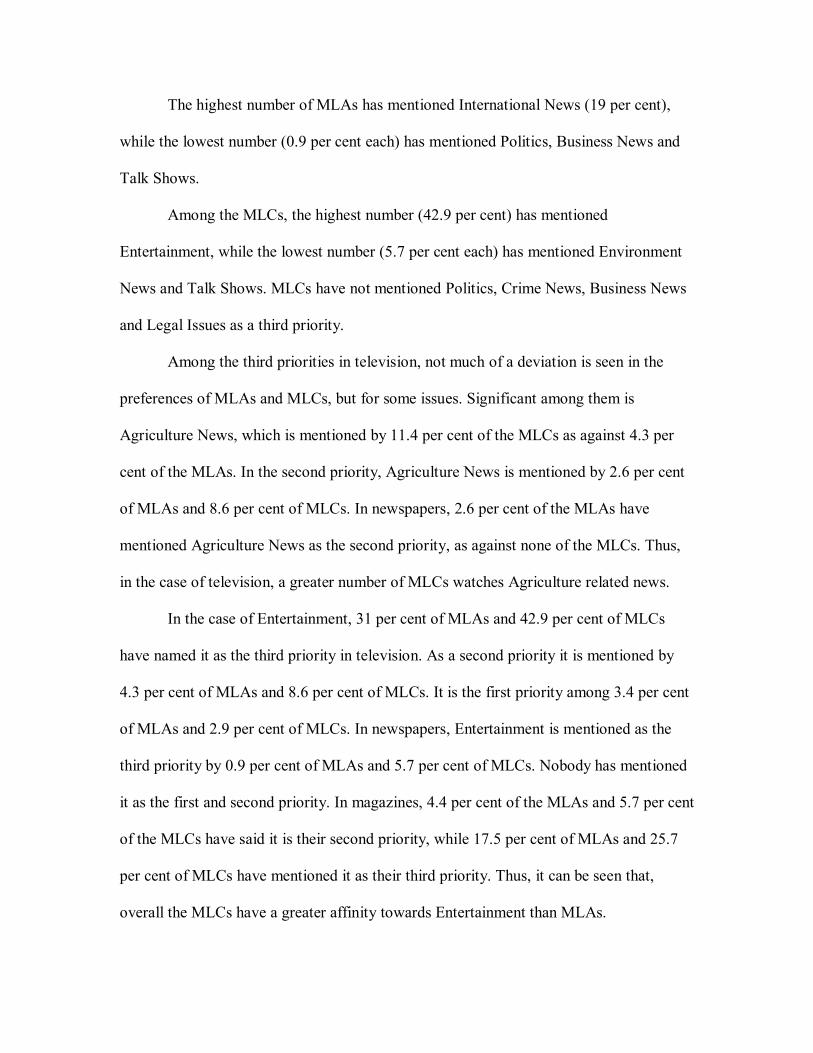
The highest number of MLAs has mentioned International News (19 per cent),
while the lowest number (0.9 per cent each) has mentioned Politics, Business News and
Talk Shows.
Among the MLCs, the highest number (42.9 per cent) has mentioned
Entertainment, while the lowest number (5.7 per cent each) has mentioned Environment
News and Talk Shows. MLCs have not mentioned Politics, Crime News, Business News
and Legal Issues as a third priority.
Among the third priorities in television, not much of a deviation is seen in the
preferences of MLAs and MLCs, but for some issues. Significant among them is
Agriculture News, which is mentioned by 11.4 per cent of the MLCs as against 4.3 per
cent of the MLAs. In the second priority, Agriculture News is mentioned by 2.6 per cent
of MLAs and 8.6 per cent of MLCs. In newspapers, 2.6 per cent of the MLAs have
mentioned Agriculture News as the second priority, as against none of the MLCs. Thus,
in the case of television, a greater number of MLCs watches Agriculture related news.
In the case of Entertainment, 31 per cent of MLAs and 42.9 per cent of MLCs
have named it as the third priority in television. As a second priority it is mentioned by
4.3 per cent of MLAs and 8.6 per cent of MLCs. It is the first priority among 3.4 per cent
of MLAs and 2.9 per cent of MLCs. In newspapers, Entertainment is mentioned as the
third priority by 0.9 per cent of MLAs and 5.7 per cent of MLCs. Nobody has mentioned
it as the first and second priority. In magazines, 4.4 per cent of the MLAs and 5.7 per cent
of the MLCs have said it is their second priority, while 17.5 per cent of MLAs and 25.7
per cent of MLCs have mentioned it as their third priority. Thus, it can be seen that,
overall the MLCs have a greater affinity towards Entertainment than MLAs.

Comparative Analysis of the News Priorities Across Newspapers,
Magazines and TV
As in newspapers and magazines, Politics is high on the priority list of the
respondents in the case of television too.
Chart 18: Comparison of first priority in newspapers, magazines and television
0%
20%
40%
60%
80%
100%
% o
f res
pond
ents
Politics 96.7% 90.6% 88.7%
Other issues 3.3% 9.4% 11.3%
Newspaper Magazine Television
As a first priority, Politics has seen a decline to 88.7 per cent with television in
contrast to 96.7 per cent in newspapers and 90.6 per cent in magazines. However, Politics
remains the first priority of a majority of the respondents across different demographic
sub-groups, with regard to newspapers, magazines and television.
Agriculture News: Though the priority for Development News is reasonably high,
Agriculture News has received a lukewarm response. In newspapers, Agriculture News is
the second priority among 2 per cent, while it is a first and third priority with none. In

magazines, it is not mentioned by a single respondent across priorities. In television, 4
per cent have mentioned it as the second priority and 6 per cent as the third priority.
Table 68: Development News as a priority in newspapers, magazines and TV
Newspaper Magazine Television I Priority 2.6% 4% 0% II Priority 22.5% 24.2% 2% III Priority 10.6% 12.1% 11.3%
In the case of television, there is a shift to other issues like Entertainment, Talk
Shows and Legal Issues, which could have resulted in a swing from Development News.
Talk Shows: Talks Shows and Legal Issues have a fair share of audience in
television. Talks Shows are the first priority among 0.7 per cent of the legislators, second
priority among 9.9 per cent and third priority among 2 per cent.
Legal Issues have also made it to the list of first priorities with 0.7 per cent. It is
the second priority for 2.6 per cent of the respondents and third priority for 6 per cent.
However, the reliance on newspapers and magazines for Legal News is much higher.
Environment News: In newspapers, Environment News is mentioned by 2.6 per
cent as their second priority and by 0.7 per cent as their third priority. In magazines, it is
a third priority with 10.1 per cent. In television, it is 0.7 per cent as the second priority
and 9.3 per cent as the third priority. The legislators rely upon newspapers the least for
Environment News. Their preference is almost equally divided between magazines and
television.

Chart 19: Entertainment as a priority in newspapers, magazines and television
0%
5%
10%
15%
20%
25%
30%
35%
% o
f res
pond
ents
I Priority 0% 0% 3.3%
II Priority 0% 4.7% 5.3%
III Priority 2% 19.5% 33.8%
Np Mag TV
The television is preferred the most by legislators for Entertainment based
programmes like films and music. Entertainment which is not the first priority in
newspapers and magazines, makes an entry in television with 3.3 per cent. Similarly, the
number of respondents opting for Entertainment as the second and third priority is
significantly higher with television when compared to newspapers and magazines.
Table 69: IT as a priority in newspapers, magazines and television
Newspaper Magazine Television I Priority 0% 0% 0% II Priority 1.3% 3.4% 1.3% III Priority 6% 6% 0%
Information Technology: Across media, the legislators have exhibited little
interest towards Information Technology. As a priority, Information Technology has

scored the lowest in television, with only 1.3 per cent of the respondents making a
mention of it.
International News: It needs to be examined if there is a direct relation between
the number of people who read international newspapers and magazines or watch
international television channels, and their priority for international news.
Table 70: Consumption of international publications / channels
Newspaper Magazine TelevisionYes 13.9% 23.5% 74.8% No 86.1% 76.5% 25.2%
Table 71: International News as a priority in newspapers, magazines and TV
Newspaper Magazine Television I Priority 0.7% 2.7% 4% II Priority 11.3% 4% 1.3% III Priority 4.6% 14.1% 18.5%
When the legislators were asked if they read international newspapers, only 13.9
per cent replied in the affirmative. The number of respondents who have mentioned
international news as their priority is also the lowest in newspapers. Among those who
read magazines, 23.5 per cent said they read international magazines. Accordingly, an

increase can be seen in the number of people mentioning international news as a priority
in magazines.
With television, those watching international channels are as high as 74.8 per
cent. However, the number of people listing international news as their priority has not
gone up correspondingly.
Chart 20: Women Issues as a priority in newspapers, magazines and television
0%
1%
1%
2%
2%
3%
3%
4%
4%
% o
f res
pond
ents
I Priority 0% 1.3% 0%
II Priority 1.3% 4% 0.7%
III Priority 2.6% 0.7% 0%
Np Mag TV
Women Issues is not the first priority among any of the respondents either in
newspapers or television. In the case of television, Women Issues is virtually
unrepresented, with only 0.7 per cent mentioning it as the second priority. The readership
of Women Issues is the highest in magazines.

Chart 21: Sports as a priority in newspapers, magazines and television
0%
5%
10%
15%
20%
25%
30%
35%
40%
% o
f res
pond
ents
I Priority 0% 0% 2%
II Priority 17.9% 19.5% 39.1%
III Priority 15.2% 2% 9.9%
Np Mag TV
Television has emerged as the most preferred medium among the legislators for
Sports. While 2 per cent have mentioned it as the first priority, it is the second priority
among 39.1 per cent and the third priority among 9.9 per cent.
In newspapers, 17.9 per cent have mentioned it as the second priority and 15.2 per
cent as the third priority.
In magazines, Sports is the second priority among 19.5 per cent and the third
priority among 2 per cent.

RADIO LISTENING HABITS AND PREFERENCES
Table 72: Respondents who listen to radio
Frequency Per cent Valid Per cent Cumulative Per cent Yes 102 67.5 67.5 67.5 No 49 32.5 32.5 100 Total 151 100 100
Among the respondents, 67.5 per cent listen to the radio, while 32.5 per cent do
not. The usage of radio is much lesser among the respondents when compared to
newspapers, magazines and television. All the respondents (100 per cent) read
newspapers and watch television, while 98.7 per cent read magazines.
Table 73: Respondents who listen to radio regularly
Frequency Per cent Valid Per cent Cumulative Per centTime Regularly 23 15.2 22.5 22.5 Occasionally 79 52.3 77.5 100 Total 102 67.5 100 N/A 49 32.5 Total 151 100
Among the 102 respondents who listen to the radio, only 22.5 per cent tune in
regularly, while 77.5 per cent listen to radio occasionally.
With newspapers, regular readers are the highest at 99.3 per cent. Television is
watched regularly by 67.5 per cent. In the case of magazines, the number of regular
readers is 55 per cent.

Table 74: Age group of respondents who regularly listen to the radio
Age Gp Total 25-35 36-45 46-55 56-65 66-75 > 75
Radio Regularly Count 4 5 8 4 2 23 % within
radio 17.4 %
21.7 %
34.8 %
17.4 %
8.7 % 100
% % within
age group 44.4 %
14.3 %
11.4 %
12.9 %
40 % 15.2
% Occasionally Count 5 17 39 15 2 1 79 % within
radio 6.3 %
21.5 %
49.4 %
19 %
2.5 %
1.3 %
100 %
% within age group
55.6 %
48.6 %
55.7 %
48.4 %
40 %
100 %
52.3 %
Never Count 13 23 12 1 49 % within
radio 26.5 %
46.9 %
24.5 %
2 % 100
% % within
age group 37.1 %
32.9 %
38.7 %
20 % 32.5
% Total Count 9 35 70 31 5 1 151 % within
radio 6 %
23.2 %
46.4 %
20.5 %
3.3 %
.7 %
100 %
% within age group
100 %
100 %
100 %
100 %
100 %
100 %
100 %
Of the total population, 44.4 per cent in the 25-35 age group, 14.3 per cent in the
36-45 age group, 11.4 per cent in the 46-55 age group, 12.9 per cent in the 56-65 age
group and 40 per cent in the 66-75 age group tune into radio regularly. There are no
regular radio users in the above 75 age group.
Among those who do not listen to radio, 37.1 per cent are in the 36-45 age group,
32.9 per cent are in the 46-55 age group, 38.7 per cent are in the 56-65 age group and 20
per cent are in the 66-75 age group. All respondents in the 25-35 age group and above 75
age group listen to the radio.

Table 75: Time spent by the respondents with radio
Frequency Per cent Valid Per cent Cumulative Per cent
Time Spent 1 hr and Above 9 6 8.9 8.9 30 mins to 1 hr 24 15.9 23.8 32.7 < 30 mins 69 45.6 67.3 100 Total 102 67.5 100 N/A 49 32.5 Total 151 100
The table details the amount of time spent by the respondents listening to radio.
Among the radio users, 8.9 per cent tune in for one hour and above, 23.8 per cent
for 30 minutes to one hour and 67.3 per cent for less than 30 minutes. It appears that most
respondents are casual radio listeners. Though 22.5 per cent listen to the radio regularly,
the number of respondents spending one hour and above, is only 8.9 per cent.
With newspapers, 49.7 per cent spend one hour and above every day, while 47 per
cent spend 30 minutes to one hour. Only 3.3 per cent spend less than 30 minutes on
newspapers. In the case of magazines, 44.3 per cent spend one hour and above, 36.9 per
cent spend 30 minutes to one hour and 18.8 per cent spend less than 30 minutes.
In the case of television, 40.4 per cent spend one hour and above, 42.4 per cent
spend 30 minutes to one hour and 17.2 per cent spend less than 30 minutes.
An analysis of newspapers, magazines and television indicates that the amount of
time spent by the respondents on radio is the least when compared to other media.

Table 76: Time spent with radio and the education level
1 hr and abv
30 min to 1 hr
Below 30 mins
Total
Education <SSLC Count 1 1 2 % within
education50% 50% 100%
SSLC & abv Count 4 3 15 22 % within
education18.2% 13.6% 68.2% 100%
Graduate Count 2 14 37 53 % within
education3.8% 26.4% 69.8% 100%
Postgraduate Count 2 3 9 14 % within
education14.3% 21.4% 64.3% 100%
Professional Count 4 7 11 % within
education 36.4% 63.6% 100%
Total 9 24 69 102 % within
total 8.9% 23.8% 67.3% 100%
Among radio listeners in the below SSLC group, 50 per cent tune in for one hour
and above every day and the remaining 50 per cent for below 30 minutes.
In the SSLC and above group, 18.2 per cent listen to radio for one hour and
above, 13.6 per cent for 30 minutes to one hour and 68.2 per cent for below 30 minutes.
Among graduates, 3.8 per cent tune in for one hour and above, 26.4 per cent for
30 minutes to one hour and 69.8 per cent for less than 30 minutes.
In the postgraduate group, 14.3 per cent listen to radio for one hour and above,
21.4 per cent for 30 minutes to one hour and 64.3 per cent for below 30 minutes.

Among professional degree holders, no respondent listens to radio for one hour
and above, while 36.4 per cent listen for 30 minutes to one hour and 63.6 per cent for
below 30 minutes.
Across age groups a majority of the respondents listen to the radio for less than 30
minutes. The number of respondents who listen to the radio for over one hour is the
highest in the below SSLC group and the lowest among the professional degree holders.
Table 77: Number of radio stations tuned into by the legislators
Frequency Per cent Valid Per cent Cumulative Per centNumber of Stations 1 to 2 78 51.7 76.5 76.5 3 to 4 24 15.9 23.5 100 Total 102 67.5 100 N/A 49 32.5 Total 151 100
Among the radio listeners, 76.5 per cent tune into only 1 to 2 stations, while 23.5
per cent tune into 3 to 4 stations. The maximum number of stations tuned into is four.
This is a pointer to the low interest level of the respondents towards radio when
compared with other media.
While 41.7 per cent read 7 or more newspapers, 43.6 per cent watch 7 or more
television channels. In the case of magazines, 12.8 per cent read 7 or more publications.

Table 78: Number of radio stations tuned into and the education level
1 to 2 3 to 4 Total Education <SSLC Count 1 1 2 % within
education 50% 50% 100%
SSLC & abv Count 21 1 22 % within
education 95.4% 4.6% 100%
Graduate Count 35 18 53 % within
education 66% 34% 100%
Postgraduate Count 10 4 14 % within
education 71.4% 28.6% 100%
Professional Count 11 11 % within
education 100% 100%
Total 78 24 102 % within
total 76.5% 23.5% 100%
Among the radio listeners in the below SSLC group, 50 per cent tune into 1 to 2
stations and the remaining 50 per cent listen to 3 to 4 stations. In the SSLC and above
group, 95.4 per cent listen to 1 to 2 stations and 4.6 per cent listen to 3 to 4 stations.
Among graduates, 66 per cent listen to 1 to 2 stations and 34 per cent to 3 to 4
stations. In the postgraduate group, 71.4 per cent listen to 1 to 2 stations, while 28.6 per
cent listen to 3 to 4 stations. Among professional degree holders, the entire 100 per cent
tune into 1 to 2 stations.
A common factor is that across education levels, no respondent listens to more
than four stations.

Chart 22: Language of radio programmes listened to by the respondents
1%
1%
2%
2%
55%
95.1%
38.2%
0% 10% 20% 30% 40% 50% 60% 70% 80% 90% 100%
Marathi
Tamil
Telugu
Urdu
Hindi
English
Kannada
% of respondents
Of the 102 respondents who tune into radio, 97 (95.1 per cent) listen to Kannada
programmes. English programmes are listened to by 56 (55 per cent), Hindi by 39 (38.2
per cent), Urdu by 2 (2 per cent), Telugu by 2 (2 per cent), Tamil by 1 (1 per cent) and
Marathi by 1 (1 per cent).
Preference for International Radio Stations
International radio stations had made a mark in India long before the advent of
television. With the Indian radio being controlled by the government, the BBC has for
long been considered one of the most reliable sources of news of the sub-continent.
Other international stations like Radio Moscow and Voice of America too were
particularly popular during the pre-television days. Entertainment programmes broadcast
by Radio Ceylon mesmerised the people for decades.

Table 79: Respondents who tune into international stations
Frequency Per cent Valid Per cent Cumulative Per cent Options Yes 46 30.5 45.1 45.1 No 56 37.1 54.9 100 Total 102 67.5 100 N/A 49 32.5 Total 151 100
Among the radio listeners, 54.9 per cent do not tune into international radio
stations, as against 45.1 per cent who do. Stations mentioned by the respondents include
BBC, Voice of America and Radio Moscow. This is a positive deviation when compared
to newspapers and magazines. While only 13.9 per cent of the respondents read
international newspapers, with international magazines it is 23.5 per cent.
Preference for Local Radio Stations Table 80: Respondents who rely on local radio for constituency news
Frequency Per cent Valid Per cent Cumulative Per centStation Local FM 39 25.8 38.2 38.2 Do not rely on radio 63 41.7 61.8 100 Total 102 67.5 100 N/A 49 32.5 Total 151 100
Among those who listen to radio, 38.2 per cent rely on local FM stations for news
about their districts and constituencies. However, 61.8 per cent have said they do not rely
on radio, local or State, for news about their constituencies.
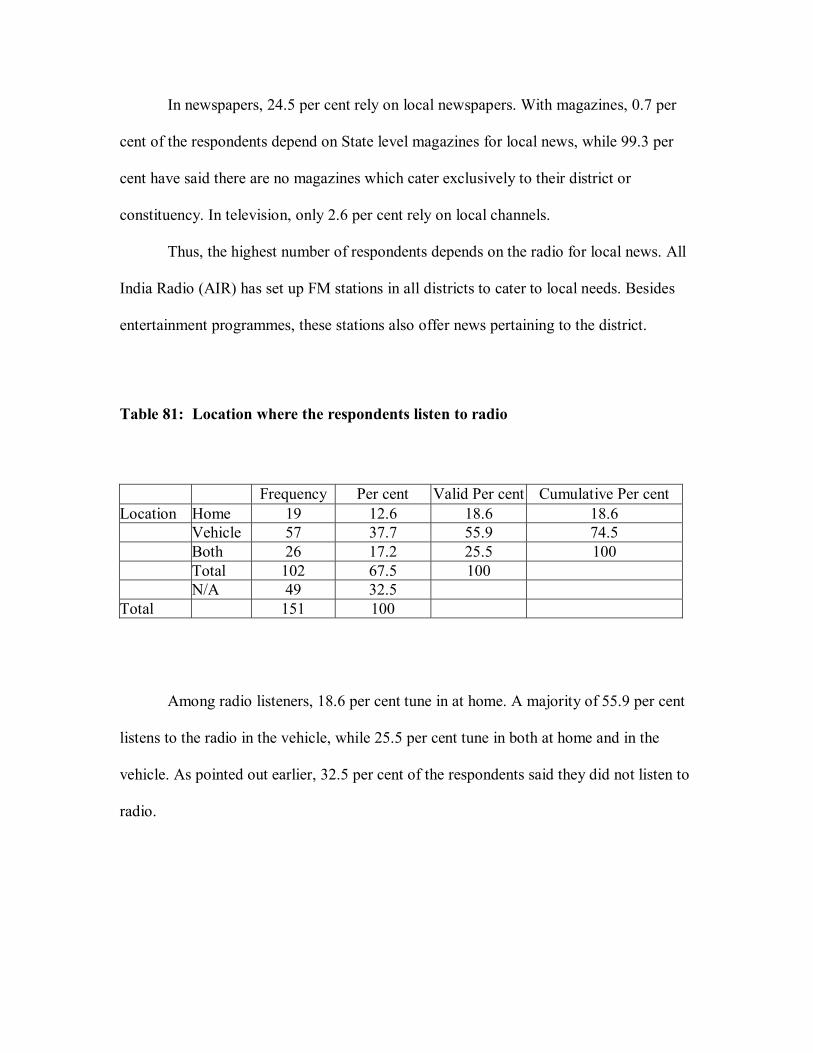
In newspapers, 24.5 per cent rely on local newspapers. With magazines, 0.7 per
cent of the respondents depend on State level magazines for local news, while 99.3 per
cent have said there are no magazines which cater exclusively to their district or
constituency. In television, only 2.6 per cent rely on local channels.
Thus, the highest number of respondents depends on the radio for local news. All
India Radio (AIR) has set up FM stations in all districts to cater to local needs. Besides
entertainment programmes, these stations also offer news pertaining to the district.
Table 81: Location where the respondents listen to radio
Frequency Per cent Valid Per cent Cumulative Per cent Location Home 19 12.6 18.6 18.6 Vehicle 57 37.7 55.9 74.5 Both 26 17.2 25.5 100 Total 102 67.5 100 N/A 49 32.5 Total 151 100
Among radio listeners, 18.6 per cent tune in at home. A majority of 55.9 per cent
listens to the radio in the vehicle, while 25.5 per cent tune in both at home and in the
vehicle. As pointed out earlier, 32.5 per cent of the respondents said they did not listen to
radio.

Analysis of News Priorities of Legislators in Radio Table 82: First news priority in radio between gender
Issues Total Politics Sports Dev
News Ent Talk
Shows
Gender Male Count 65 2 2 25 1 95 % within
gender 68.4% 2.1% 2.1% 26.3% 1.1% 100%
% within radio
94.2% 100% 100% 89.3% 100% 93.1%
% of Total
63.7% 2% 2% 24.5% 1% 93.1%
Female Count 4 3 7 % within
gender 57.1% 42.9% 100%
% within radio
5.8% 10.7% 6.9%
% of Total
3.9% 2.9% 6.9%
Total Count 69 2 2 28 1 102 % within
gender 67.6% 2% 2% 27.4% 1% 100%
% within radio
100% 100% 100% 100% 100% 100%
Politics is the first priority with 67.6 per cent of radio listeners, followed by
Entertainment (27.4 per cent), Sports (2 per cent), Development News (2 per cent) and
Talk Shows (1 per cent).
In radio, there is noticeable shift from Politics towards Entertainment.
Entertainment is not mentioned as a first priority in either newspapers or magazines. In
television, 3.3 per cent have mentioned it as the first priority.

In the case of newspapers, 96.7 per cent have mentioned Politics as their first
priority. In magazines, it is 90.6 per cent and in television it is 88.7 per cent.
The highest number of male respondents (68.4 per cent) has mentioned Politics as
their first priority, while the lowest number (1.1 per cent) has mentioned Talk Shows.
Female respondents have mentioned only Politics (57.1 per cent) and
Entertainment (42.9 per cent) as their first priority. They have not mentioned Sports,
Development News and Talk Shows.
Chart 23: Depiction of first priority in radio among legislators
0%
10%
20%
30%
40%
50%
60%
70%
% o
f rep
sond
ents
I Priorities 67.6% 27.4% 2% 2% 1%
Politics Ent Dev News Sports Talk Show
Though Politics is the first priority of most respondents, in radio two distinctive
blocks are visible in the list of first priorities: Politics (67.6 per cent) and Entertainment
(27.4 per cent). In the case of newspapers, magazines and television, the distribution is
heavily loaded towards Politics and thinly distributed among other factors.
Table 83: Second news priority in radio between gender
Issues Total
Polit
ics
Spor
ts
Bus
ines
s
Lega
l Iss
ues
Inte
rnat
iona
l
Agr
icul
ture
Ente
rtain
men
t
Talk
Sho
ws
Non
e
Gender Male Count 11 20 2 3 5 19 9 3 23 95 % within
gender 11.6 %
21.1%
2.1 %
3.2 %
5.3 %
20 %
9.5 %
3.2 %
24.2%
100%
% within radio
84.6 %
95.2%
100%
100%
83.3%
95 %
100%
75 %
95.8%
93.1%
% of Total
10.8 %
19.6%
2 %
2.9 %
4.9 %
18.6%
8.8 %
2.9 %
22.5%
93.1%
Female Count 2 1 1 1 1 1 7 % within
gender 28.6 %
14.3%
14.3%
14.3%
14.3%
14.3%
100%
% within radio
15.4 %
4.8 %
16.7%
5 %
25 %
4.2 %
6.9 %
% of Total
2 %
1 %
1 %
1 %
1 %
1 %
6.9 %
Total Count 13 21 2 3 6 20 9 4 24 102 % within
gender 12.7 %
20.6%
2 %
2.9 %
5.9 %
19.6%
8.8 %
3.9 %
23.5%
100%
% within radio
100 %
100%
100%
100%
100%
100%
100%
100%
100%
100%
% of Total
12.7 %
20.6%
2 %
2.9 %
5.9 %
19.6%
8.8 %
3.9 %
23.5%
100%

Sports is mentioned as a second priority by 20.6 per cent of the respondents,
followed by Agriculture News (19.6 per cent), Politics (12.7 per cent), Entertainment (8.8
per cent), International News (5.9 per cent), Talk Shows (3.9 per cent), Legal Issues (2.9
per cent) and Business News (2 per cent). Among the respondents, 23.5 per cent have
said they do not have a second priority.
In television, Sports is the second priority among 39.1 per cent of the respondents.
With newspapers, Sports is the second priority with 17.9 per cent of the respondents,
while in magazines, it is the second priority with 19.5 per cent.
Agriculture News which does not figure prominently in other media has made its
mark with radio, with 19.6 per cent mentioning it as their second priority. During the
interview, several respondents mentioned that they regularly tuned into Krishi Varthe, or
the agriculture news bulletin broadcast by All India Radio.
Among the radio listeners, 8.8 per cent have mentioned Entertainment as their
second priority. In television, 3.3 per cent have mentioned Entertainment as their first
priority, while 5.3 per cent say it is their second priority. With newspaper and magazines,
it does not figure in the first priority list, while in the second priority it is indicated by
none in newspapers and 4.7 per cent in magazines. As a third priority, Entertainment is
mentioned by 2 per cent in newspapers and 19.5 per cent in magazines.
International News is mentioned by 5.9 per cent as their second priority. It has
found no mention among the first priorities. In newspapers, 0.7 per cent mentioned
International News as the first priority, while 11.3 per cent have said it is their second
priority. In magazines, it is the first priority among 2.7 per cent and second priority

among 4 per cent. In television, it is the first priority among 4 per cent and second
priority among 1.3 per cent.
Business News is mentioned by 2 per cent of radio listeners as their second
priority. This is considerably low compared to television, where it is the second priority
with 15.2 per cent. In newspapers, it is the second priority with 7.3 per cent, while in
magazines it is 18.8 per cent.
The highest number of male respondents has mentioned Sports as a second
priority (21.1 per cent), while the least number has mentioned Business News (2.1 per
cent)
Among the female respondents, Politics is mentioned by 28.6 per cent, followed
by Sports, International News, Agriculture News and Talk Shows (14.3 per cent each).
Female respondents have not mentioned Business News, Legal Issues and Entertainment
as a second priority.
While the preference for Politics is noticeably lower among women in radio as a
first priority, in the second priority, 28.6 per cent of them have mentioned Politics.
In comparison with men, the female respondents show a lesser inclination towards
Sports in radio too. While 21.1 per cent of the men have mentioned Sports as their second
priority, among women it is 14.3 per cent. In television too, 20 per cent of the female
respondents have mentioned Sports, as the second priority as against 40.4 per cent of the
men.
In the case of Talk Shows as a second priority in radio, women scored slightly
better with 14.3 per cent, as against 3.2 per cent of the male respondents. With television,
women have not mentioned Talk Shows among any of the three priorities.

Table 84: Third news priority in radio between gender
Issues
Total
Polit
ics
Crim
e
Spor
ts
Bus
ines
s
Lega
l Iss
ues
IT
Wom
en Is
sues
Dev
. New
s
Inte
rnat
iona
l
Envi
ronm
ent
Ente
rtain
men
t.
Talk
Sho
ws
Non
e
Gen
der Male Count 4 1 5 3 3 17 5 1 12 2 42 95
% within gender
4.2 %
1.1 %
5.3 %
3.2 %
3.2 %
17.9%
5.3 %
1.1 %
12.6 %
2.1 %
44.2%
100%
% within radio
100%
100%
100%
100.%
100%
94.4%
100%
100%
100 %
100%
97.7%
93.1%
% of Total
3.9 %
1 %
4.9 %
2.9 %
2.9 %
16.7%
4.9 %
1 %
11.8 %
2 %
41.2%
93.1%
Female Count 1 4 1 1 7
% within gender
14.3%
57.1%
14.3%
14.3%
100%
% within radio
100%
100%
5.6 %
2.3 %
6.9 %
% of Total
1 %
3.9 %
1 %
1 %
6.9 %
Tota
l Count 4 1 1 5 3 3 4 18 5 1 12 2 43 102
% within gender
3.9 %
1 %
1 %
4.9 %
2.9 %
2.9 %
3.9 %
17.6%
4.9 %
1 %
11.8 %
2 %
42.2%
100%
% within radio
100%
100%
100%
100%
100%
100%
100%
100%
100%
100 %
100 %
100%
100%
100%

Development News is mentioned by 17.6 per cent as the third priority, followed
by Entertainment (11.8 per cent), Business News (4.9 per cent), International News (4.9
per cent), Politics (3.9 per cent), Women Issues (3.9 per cent), Legal Issues (2.9 per cent),
Information Technology (2.9 per cent), Talk Shows (2 per cent), Crime News (1 per
cent), Sports (1 per cent) and Environment News (1 per cent). Among the respondents,
42.2 per cent have said they do not have a third priority.
As a third priority, Entertainment based programmes like music attracted 11.8 per
cent of the listeners. Entertainment is mentioned by 27.4 per cent as the first priority and
by 8.8 per cent as the second priority. In television, 3.3 per cent have mentioned
Entertainment as the first priority, 5.3 per cent as the second priority and 33.8 as the third
priority.
Among the male respondents, the highest number has mentioned Development
News (17.9 per cent), while the lowest number has mentioned Sports and Environment
News (1.1 per cent each). Male respondents have not mentioned Crime News and
Women Issues.
Among the female respondents, a majority has mentioned Women Issues (57.1
per cent), while the lowest number has mentioned Crime News and Development News
(14.3 per cent each). Female respondents have not mentioned Politics, Sports, Business
News, Legal Issues, Information Technology, International News, Environment News,
Entertainment and Talk Shows as the third priority.

Table 85: First news priority of MLAs and MLCs in radio
Issues Total Politics Sports Development Entertainment Talk
Shows
House MLA Count 56 2 19 1 78 % within
house 71.8 %
2.6 %
24.4 %
1.3 %
100 %
% within radio
81.2 %
100 %
67.9 %
100 %
76.5 %
% of Total
54.9 %
2 %
18.6 %
1 %
76.5 %
MLC Count 13 2 9 24 % within
house 54.2 %
8.3 %
37.5 %
100 %
% within radio
18.8 %
100 %
32.1 %
23.5 %
% of Total
12.7 %
2 %
8.8 %
23.5 %
Total Count 69 2 2 28 1 102 % within
house 67.6 %
2 %
2 %
27.4 %
1 %
100 %
% within radio
100 %
100 %
100 %
100 %
100 %
100 %
% of Total
67.6 %
2 %
2 %
27.5 %
1 %
100 %
The highest number of MLAs has mentioned Politics (71.8 per cent), while the
least number of them has mentioned Talk Shows (1.3 per cent) as a first priority in radio.
MLAs have not mentioned Sports as a first priority.
The highest number of MLCs too has mentioned Politics (54.2 per cent), while
the least number of them has mentioned Sports (8.3 per cent). MLCs have not mentioned
Development News and Talk Shows as the first priority.

Among the first priorities, Politics tops the list of both Houses of the legislature.
With newspapers, 98.3 per cent of MLAs and 91.4 per cent of MLCs have mentioned
Politics as the first priority. In the case of magazines too, the pattern is similar, with 90.4
per cent of MLAs mentioning Politics as the first priority, as against 91.4 per cent of
MLCs. In television, 88.8 per cent of the MLAs have mentioned Politics as the first
priority, while among the MLCs it is 88.6 per cent.
In the case of the MLCs, the shift is seen towards Entertainment and Sports.
Entertainment is the first priority among 24.4 per cent of the MLAs and 37.5 per cent of
the MLCs, with regard to radio. In television, no significant pattern is observed with
Entertainment as the first priority. It is 3.4 per cent among MLAs and 2.9 per cent among
MLCs. Entertainment is not among the first priorities of MLAs and MLCs in newspapers
and magazines.
Sports is mentioned by 8.3 per cent of the MLCs as against none of the MLAs as
the first priority in radio. In television, 1.7 per cent of the MLAs and 2.9 per cent of the
MLCs have mentioned Sports as their first priority.
In radio, Development News is not mentioned as the first priority by any of the
MLCs, while among MLAs it is 2.6 per cent. With newspapers, Development News is the
first priority with 1.7 per cent of the MLAs and 5.7 per cent of the MLCs.
While Development News has a higher number of readers from the Upper House
in the case of newspapers and magazines under the first priority, MLAs have a slight
edge in radio.
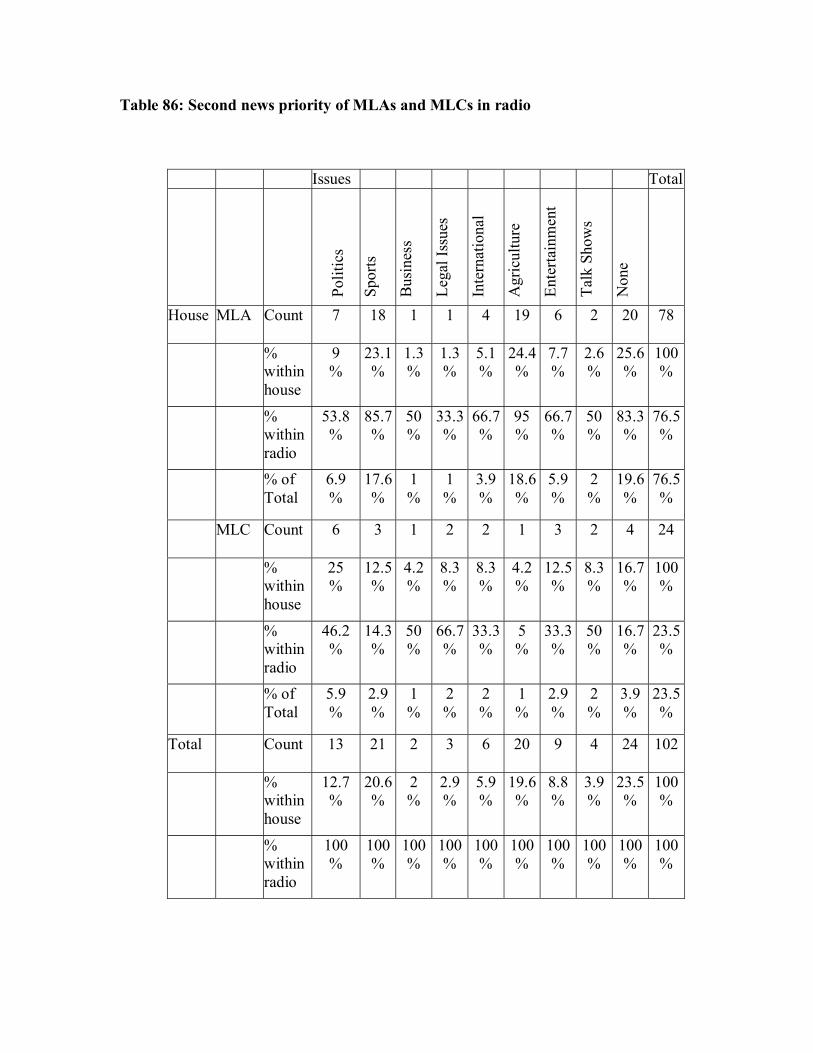
Table 86: Second news priority of MLAs and MLCs in radio
Issues Total
Polit
ics
Spor
ts
Bus
ines
s
Lega
l Iss
ues
Inte
rnat
iona
l
Agr
icul
ture
Ente
rtain
men
t
Talk
Sho
ws
Non
e
House MLA Count 7 18 1 1 4 19 6 2 20 78
% within house
9 %
23.1%
1.3 %
1.3 %
5.1 %
24.4%
7.7 %
2.6 %
25.6%
100%
% within radio
53.8 %
85.7%
50 %
33.3%
66.7%
95 %
66.7%
50 %
83.3%
76.5%
% of Total
6.9 %
17.6%
1 %
1 %
3.9 %
18.6%
5.9 %
2 %
19.6%
76.5%
MLC Count 6 3 1 2 2 1 3 2 4 24
% within house
25 %
12.5%
4.2 %
8.3 %
8.3 %
4.2 %
12.5%
8.3 %
16.7%
100%
% within radio
46.2 %
14.3%
50 %
66.7%
33.3%
5 %
33.3%
50 %
16.7%
23.5%
% of Total
5.9 %
2.9 %
1 %
2 %
2 %
1 %
2.9 %
2 %
3.9 %
23.5%
Total Count 13 21 2 3 6 20 9 4 24 102
% within house
12.7 %
20.6%
2 %
2.9 %
5.9 %
19.6%
8.8 %
3.9 %
23.5%
100%
% within radio
100 %
100%
100%
100%
100%
100%
100%
100%
100%
100%

As a second priority, the highest number of MLAs has mentioned Agriculture
News (24.4 per cent), while the least number has mentioned Business News and Legal
Issues (1.3 per cent each).
The highest number of MLCs has mentioned Politics (25 per cent), while the least
number has mentioned Business News and Agriculture News (4.2 per cent each) as a
second priority. Among the first priorities, 54.2 per cent of MLCs and 71.8 per cent of
MLAs have mentioned Politics. However, in the case of second priorities, it may be
observed that a larger number of MLCs has opted for Politics when compared with
MLAs.
Sports is mentioned as second priority by 23.1 per cent of MLAs and 12.5 per
cent of MLCs. In the first priority, no MLA has mentioned Sports, while among MLCs it
is 8.3 per cent.
As a second priority in radio, Agriculture News is mentioned by 24.4 per cent of
the MLAs as against 4.2 per cent of the MLCs. In newspapers, Agriculture News is the
second priority among 2.6 per cent of MLAs and none of the MLCs. In television, 2.6 per
cent of MLAs and 8.6 per cent of MLCs have mentioned Agriculture News as the second
priority.
Among radio listeners, Entertainment is a second priority with 7.7 per cent of the
MLAs and 12.5 per cent of the MLCs. In the first priority too, the number of MLCs who
have indicated Entertainment is higher at 37.5 per cent, as against 24.4 per cent of MLAs.
In Talk Shows as a second priority in radio, MLCs scored with 8.3 per cent
compared to 2.6 per cent of MLAs. In the first priority, 1.3 per cent of MLAs have
mentioned Talk Shows as against none of the MLCs.

Table 87: Third news priority of MLAs and MLCs in radio
Issues Total
Po
litic
s C
rime
Spor
ts
Bus
ines
s
Lega
l
IT
Wom
en Is
sues
Dev
elop
men
t
Inte
rnat
iona
l
Envi
ronm
ent
Ente
rtain
men
t
Talk
Sho
ws
Non
e
Hou
se
MLA Count 4 1 5 1 3 2 13 2 1 10 1 35 78
% within house
5.1 %
1.3 %
6.4 %
1.3 %
3.8 %
2.6 %
16.7%
2.6 %
1.3 %
12.8%
1.3 %
44.9%
100%
% within radio
100%
100%
100%
33.3%
100%
50 %
72.2%
40 %
100%
83.3%
50 %
81.4%
76.5%
% of Total
3.9 %
1 %
4.9 %
1 %
2.9% 2 %
12.7%
2 %
1 %
9.8 %
1 %
34.3%
76.5%
MLC Count 1 2 2 5 3 2 1 8 24
% within house
4.2 %
8.3 %
8.3 %
20.8%
12.5%
8.3 %
4.2 %
33.3%
100%
% within radio
100%
66.7%
50 %
27.8%
60 %
16.7%
50 %
18.6%
23.5%
% of Total
1 %
2 %
2 %
4.9 %
2.9 %
2 %
1 %
7.8 %
23.5%
Tota
l Count 4 1 1 5 3 3 4 18 5 1 12 2 43 102
% within house
3.9 %
1 %
1 %
4.9 %
2.9 %
2.9 %
3.9 %
17.6%
4.9 %
1 %
11.8%
2 %
42.2%
100%
% within radio
100%
100%
100%
100%
100%
100.0%
100%
100%
100%
100%
100%
100%
100%
100%
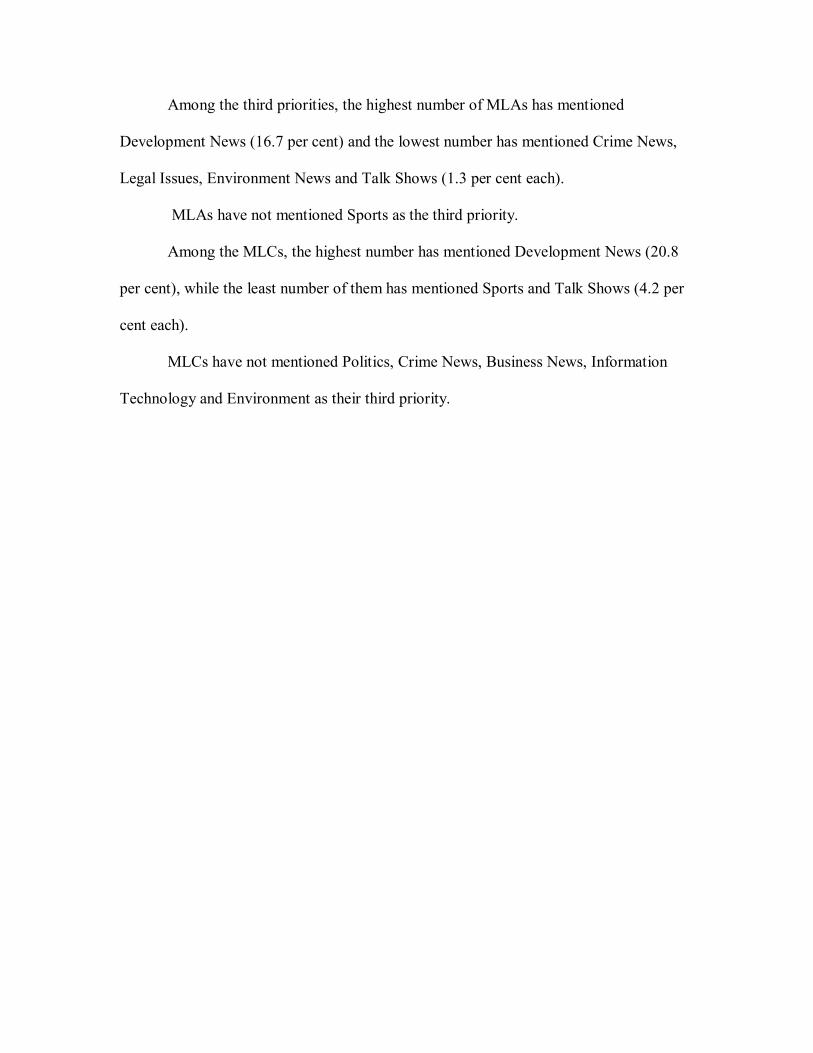
Among the third priorities, the highest number of MLAs has mentioned
Development News (16.7 per cent) and the lowest number has mentioned Crime News,
Legal Issues, Environment News and Talk Shows (1.3 per cent each).
MLAs have not mentioned Sports as the third priority.
Among the MLCs, the highest number has mentioned Development News (20.8
per cent), while the least number of them has mentioned Sports and Talk Shows (4.2 per
cent each).
MLCs have not mentioned Politics, Crime News, Business News, Information
Technology and Environment as their third priority.

Comparative Analysis of the News Priorities in Radio Between MLAs
and MLCs Across Print and Electronic Media
Politics is the first priority of MLAs and MLCs across newspapers, magazines,
television and radio. However, in the case of radio, there is a significant shift towards
entertainment based programmes.
Table 88: Entertainment as a priority between MLAs and MLCs
I Priority II Priority III Priority MLA MLC MLA MLC MLA MLC Newspaper 0% 0% 0% 0% 0.9% 5.7% Magazine 0% 0% 4.4% 5.7% 17.5% 25.7% Television 3.4% 2.9% 4.3% 8.6% 31% 42.9% Radio 24.4% 37.5% 7.7% 12.5% 12.8% 8.3%
A comparison of the preferences of the members of both Houses of the legislature
across print and electronic media shows that MLCs are more inclined towards
Entertainment. In most cases as it can be seen from the above table, a higher number of
MLCs has indicated Entertainment as a priority when compared to MLAs.
Table 89: Women Issues as a priority between MLAs and MLCs
I Priority II Priority III Priority MLA MLC MLA MLC MLA MLC Newspaper 0% 0% 0% 5.7% 3.4% 0% Magazine 1.8% 0% 2.6% 8.6% 0% 2.9% Television 0% 0% 0% 2.9% 0% 0% Radio 0% 0% 0% 0% 2.6% 8.3%

Women Issues is consistently low on the priority list of both MLAs and MLCs
across newspapers, magazines, television and radio. Except in magazines, no member has
mentioned Women Issues as the first priority.
Table 90: Sports as a priority between MLAs and MLCs
I Priority II Priority III Priority MLA MLC MLA MLC MLA MLC Newspaper 0% 0% 17.2% 20% 17.2% 8.6% Magazine 0% 0% 19.3% 20% 1.8% 2.9% Television 1.7% 2.9% 39.7% 37.1% 10.3% 8.6% Radio 0% 8.3% 23.1% 12.5% 0% 4.2%
There is no significant difference in Sports as a priority between MLAs and
MLCs. Members of both Houses share an almost equal amount of interest in Sports
across media and priorities.
Table 91: Crime News as a priority between MLAs and MLCs I Priority II Priority III Priority MLA MLC MLA MLC MLA MLC Newspaper 0% 0% 5.2% 2.9% 6.9% 8.6% Magazine 0% 0% 4.4% 2.9% 4.4% 0% Television 0.9% 0% 12.1% 8.6% 2.6% 0% Radio 0% 0% 0% 0% 1.3% 0%
A larger number of MLAs has mentioned Crime News as a priority across media.
Crime News does not figure as a first priority in any media, except among 0.9 per cent of
MLAs in television.

Table 92: Development News as a priority between MLAs and MLCs
I Priority II Priority III Priority MLA MLC MLA MLC MLA MLC Newspaper 1.7% 5.7% 19.8% 31.4% 12.1% 5.7% Magazine 3.5% 5.7% 24.6% 22.9% 14% 5.7% Television 0% 0% 1.7% 2.9% 12.1% 8.6% Radio 2.6% 0% 0% 0% 16.7% 20.8%
Overall, the deviation is not very significant with regard to Development News as
a priority among the MLAs and MLCs, though some minor swings are seen across
different media and priority levels.
Table 93: Agriculture News as a priority between MLAs and MLCs I Priority II Priority III Priority MLA MLC MLA MLC MLA MLC Newspaper 0% 0% 2.6% 0% 0% 0% Magazine 0% 0% 0% 0% 0% 0% Television 0% 0% 2.6% 8.6% 4.3% 11.4% Radio 0% 0% 24.4% 4.2% 0% 0%
Across media and priorities, the distribution is almost similar between the MLAs
and MLCs. In television, 4.3 per cent of the MLAs and 11.4 per cent of the MLCs have
mentioned Agriculture News as the third priority. MLAs have reduced this gap in radio
where 24.4 per cent of them have mentioned Agriculture News as the second priority as
against 4.2 per cent of the MLCs.

Comparative Analysis of News Priorities of the Respondents Across
Print and Electronic Media
Politics beats all other issues to the top slot. Respondents cutting across all
demographic groups have mentioned Politics as their first priority in newspapers,
magazines, television and radio.
Table 94: Entertainment as a priority across print and electronic media
Newspaper Magazine Television Radio I Priority 0% 0% 3.3% 27.4% II Priority 0% 4.7% 5.3% 8.8% III Priority 2% 19.5% 33.8% 11.8%
The number of respondents depending on newspapers for Entertainment is the
least. Radio has the highest number of respondents mentioning entertainment related
programmes as their first priority (27.4 per cent).
Table 95: Development News as a priority across print and electronic media
Newspaper Magazines Television Radio I Priority 2.6% 4% 0% 2% II Priority 22.5% 24.2% 2% 0% III Priority 10.6% 12.1% 11.3% 17.6%
In the case of Development News, a majority of the respondents prefer
magazines. Newspapers are a close second. The lowest number of respondents depends
on television for Development News.
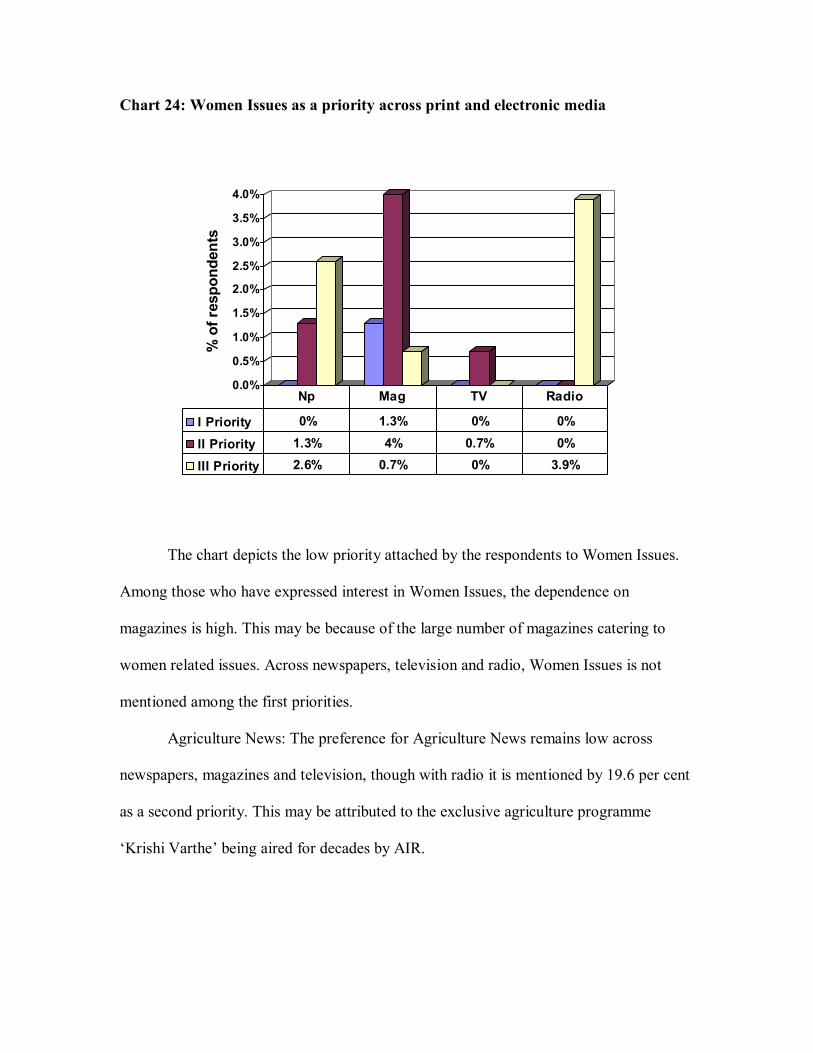
Chart 24: Women Issues as a priority across print and electronic media
0.0%
0.5%
1.0%
1.5%
2.0%
2.5%
3.0%
3.5%
4.0%%
of r
espo
nden
ts
I Priority 0% 1.3% 0% 0%
II Priority 1.3% 4% 0.7% 0%
III Priority 2.6% 0.7% 0% 3.9%
Np Mag TV Radio
The chart depicts the low priority attached by the respondents to Women Issues.
Among those who have expressed interest in Women Issues, the dependence on
magazines is high. This may be because of the large number of magazines catering to
women related issues. Across newspapers, television and radio, Women Issues is not
mentioned among the first priorities.
Agriculture News: The preference for Agriculture News remains low across
newspapers, magazines and television, though with radio it is mentioned by 19.6 per cent
as a second priority. This may be attributed to the exclusive agriculture programme
�Krishi Varthe� being aired for decades by AIR.

International News: The possible relationship between the preference of the
respondents for international media and their interest in international news is analysed
across four dimensions of the media in the following tables.
Table 96: Preference for international media
Newspaper Magazines Television Radio Yes 13.9% 23.5% 74.8% 45.1% No 86.1% 76.5% 25.2% 54.9%
Table 97: Comparison of International News as a priority across media
Newspaper Magazine Television Radio I Priority 0.7% 2.7% 4% 0% II Priority 11.3% 4% 1.3% 5.9% III Priority 4.6% 14.1% 18.5% 4.9%
In the case of television, 74.8 per cent watch international channels. However,
International News is mentioned as a first priority by 4 per cent of the television viewers.
It is mentioned as a second priority by 1.3 per cent and as a third priority by 18.5 per
cent.
Similarly with radio, 45.1 per cent tune into international stations, but none of the
listeners has mentioned international news as the first priority. While 5.9 per cent have
mentioned it as their second priority, 4.9 per cent have mentioned it as their third priority.
This indicates that there is no connection between the preference for international
media and the interest in international news.

Chart 25: Sports as a priority across print and electronic media
0%
10%
20%
30%
40%
% o
f ind
ivid
uals
I Priority 0% 0% 2% 2%
II Priority 17.9% 19.5% 39.1% 20.6%
III Priority 15.2% 2% 9.9% 1%
Np Mag TV Radio
Sports has a fair number of fans among the legislators. The chart above shows
that a majority of them prefer the television for Sports. Radio too has a high listenership
for Sports, which may be attributed to its mobility. As noted earlier, Sports has a larger
audience than International News, Agriculture News, Information Technology and
Women Issues.
Table 98: IT as a priority across print and electronic media
Newspaper Magazine Television Radio
I Priority 0% 0% 0% 0% II Priority 1.3% 3.4% 1.3% 0% III Priority 6% 6% 0% 2.9%
Information Technology is among the lowest in the priority list of the
respondents. The least number of respondents depends on the television for news related
to Information Technology.

Table 99: Crime News as a priority across print and electronic media
Newspaper Magazine Television Radio I Priority 0% 0% 0.7% 0% II Priority 4.6% 4% 11.3% 0% III Priority 7.3% 3.4% 2% 1%
Television has emerged as the most favourite medium for Crime News. The
dedicated crime slots being telecast by the national and local media account for the high
viewership of crime related news on television, compared to other media. The demand
for Crime News is the lowest in radio.
Table 100: Business News as a priority across print and electronic media
Newspaper Magazine Television Radio I Priority 0% 0% 0% 0% II Priority 7.3% 18.8% 15.2% 2% III Priority 6% 0.7% 0.7% 4.9%
Though no respondent has mentioned Business News as the first priority across
media, a significant number has indicated it as their second priority, particularly with
magazines and television.
The number of respondents depending on radio and newspapers for Business
News is comparatively low.

Table 101: Environment News as a priority across print and electronic media
Newspaper Magazine Television Radio I Priority 0% 0% 0% 0% II Priority 2.6% 0% 0.7% 0% III Priority 0.7% 10.1% 9.3% 1%
Environment News is a bigger priority with magazine readers and among
respondents who watch television. An insignificant number has mentioned Environment
News as a priority in newspapers and radio.
Table 102: Talk Shows as a priority across television and radio
Television Radio I Priority 0.7% 1% II Priority 9.9% 3.9% III Priority 2% 2%
Overall, Talk Shows as a priority is not very high, both in television and radio.
However, television appears to have scored slightly over radio.

INTERNET USING HABITS AND PREFERENCES
The internet is fast emerging as a popular tool among the political community in
the developed world, particularly the United States. Though Indian political parties too
have effectively employed the internet in recent elections, the World Wide Web has
evoked little or no interest among the law makers in Karnataka.
Various studies indicate that in the United States, the internet is set to become the
most potent instrument in election campaigning, with distinct capabilities surpassing
those offered by the traditional media. The 2000 US presidential election marked the first
full-fledged online election campaign, although the use of the internet for political
campaigns began earlier.
This is what the Journal of Advertising has to say:
After the 1996 campaign, for example, a professional campaign consultant
reported that exit polls provided evidence that �more than a quarter of all
voters are online and about 10 per cent made their voting decisions based
upon information collected primarily from the internet� (Connell 1997, p.
64). By the 2000 campaign, Rumbough and Tomlinson (2000) indicated
that 144 million Americans could view candidate web sites from their
homes. 7
7. Lee Kaid, Lynda . �Political Advertising and Information Seeking: Comparing Exposure via Traditional and Internet Channels.� Journal of Advertising 31 (2002): 1.

Through the 2000 presidential online campaigns, the web showed its potential as
an effective political campaign tool. It gave presidential candidates a multi-faceted form
of communication, primarily involving persuasion to vote for them. Practitioners not only
raised money online, but also attracted volunteers and involved people in political
campaigns through interactive web sites.
A study reported in the Public Relations Quarterly, elucidates the role of the
internet in American politics:
From the public relations perspective, presidential candidates can gain
almost unlimited access and visibility and maintain total control of the
message at less expense. Interactive web sites allow candidates to finely
target an audience and communicate with them directly through direct e-
mail. They involve real time interaction and a sense of community. They
are dynamic, not static. Step-by-step on the campaign trail, candidates
have been using the internet to build relationships with voters through
symmetric two-way communications, especially, with younger voters. 8
During the 2004 presidential polls, there were an estimated 3000 web sites
devoted to the elections. According to a post-election study conducted by The Pew
Internet and American Life Project, roughly 75 million Americans used the internet to
connect to politics in 2004. They sought election news, exchanged political e-mail, made
campaign contributions and blogged. This figure equals roughly 37 per cent of the adult
population, and 61 per cent of American internet users.
8. Choi Marina , Sejung , and Hyun Soon Park. �Focus Group Interviews: The Internet as a Political Campaign Medium.� Public Relations Quarterly 2002 (47): 1.

The 2000 campaign also demonstrated the power of the internet to raise funds for
candidates by collecting contributions via the web. As Cliff Angelo, E-Campaign
Coordinator, Bush Campaign for President 2000, put it:
Not only is the internet a message tool� but it is a coordination tool. It
allows you to coordinate a nationwide campaign from the headquarters. 9
Over the years, the internet�s impact on the American political system has been
profound.
The internet�a term that was not even in the public lexicon a decade
ago�has captured the attention of the media, the government, and many
of the public. It has changed the way many Americans receive information
and communicate. 10
While in the US, the internet�s influence was felt way back during the 1996
elections, in the United Kingdom it was not until 2001 that politicians discovered the
power of the web. The UK Hansard Society's report on the internet in UK elections,
described the 2001 general polls as the first internet elections of the country.
According to the report, though the 2001 election was not fought on the internet,
the web played a peripheral, but significant role�especially for younger voters.
9. Davis, Richard . The Web of Politics: The Internet�s Impact on the American Political System . New York: Oxford UP, 1999. 3.
10. Bimber, Bruce A., and Richard Davis. Campaigning Online: The Internet in U.S. Elections. N.p.: Oxford UP, 2003. 1.

While 18 per cent of the voters with internet access used the net as an information
resource, 21 per cent of online 18-24 year-olds used the net to find out what the parties
stood for. The websites of political parties on their part made use of the unmediated
nature of the internet and its multimedia functionalities, but failed to exploit the net�s
capacity for interactivity and personalisation. 11
While in the 2001 elections, none of the parties had an online strategy, during the
2005 polls, both the Tories and the Liberals embarked on a more systematic net campaign
which involved sending direct e-mails to voters.
In India too, politicians have over the years successfully harnessed the internet,
particularly to address the apathetic urban electorate. While the 1999 general elections
saw the application of internet to politics for the first time, the 2004 polls saw the
Congress and Bharatiya Janata Party (BJP) unleashing a full-fledged online campaign.
The Congress, for instance, hired a company to compile a database of 800,000 e-
mail addresses to send campaign slogans, letters and pictures of candidates, while the
BJP set up an exclusive unit to monitor e-campaigning.
Karnataka was among the States which pioneered the use of internet in politics,
with an MP from Bangalore (South), Mr Ananth Kumar, becoming the first
parliamentarian in the country to launch his personal website, in the mid-nineties.
Bangalore, the capital of Karnataka, prides itself as the Silicon Valley of India.
The approach of the legislators towards new media is analysed against the backdrop of
Karnataka emerging as the undisputed leader of Information Technology in the country.
11. S. Coleman. 2001: Cyber Space Odyssey. The Internet in the UK Election. 21 July 2001. Hansard Society. 1 June 2005 <http://www.eldis.org/static/DOC12032.htm>.

Table 103: Respondents who have a computer at home/office
Frequency Per cent Valid Per cent Cumulative Per cent Yes 138 91.4 91.4 91.4 No 13 8.6 8.6 100 Total 151 100 100
In keeping with the technology savvy image of the State, the government has
allotted computers to its legislators. Among the respondents, 91.4 per cent have a
computer at home or at the office. Only 8.6 per cent are yet to be allotted a computer.
Chart 26: Depiction of respondents who have a computer at home or office
Yes91.4%
No8.6%
The chart shows that the penetration of computers is extremely high among the
legislators. The study examines if this translates into a greater use of technology by them.

Table 104: Respondents who surf the net
Frequency Per cent Valid Per cent Cumulative Per cent Yes 36 23.8 23.8 23.8 No 115 76.2 76.2 100 Total 151 100 100
Though virtually every legislator has a computer, 76.2 per cent of them do not
surf the net, while only 23.8 per cent do.
Against this background, it is examined if the lack of interest in the World Wide
Web is due to the absence of connectivity. This does not appear to be true as the entire
State is today wired, as a result of which the internet is accessible even in small towns.
While private telephone companies have launched broadband services, cable
operators have made it possible to access the net through the television cable. The public
sector telecom company, Bharat Sanchar Nigam Limited (BSNL) provides internet
connection through the existing fixed telephone line. Private operators have also enabled
accessing the web through the mobile phone.
Of all the media analysed so far, the internet is used the least by the respondents.
The entire 100 per cent of respondents read newspapers and watch television, while in the
case of magazines it is 98.7 per cent. With radio, the listenership is 67.5 per cent.
The internet penetration in India is increasing, with the number of net users
predicted to reach 100 million by the year 2007. According to a DRS online survey in
2002, two-thirds of the internet users are in Delhi, Mumbai, Bangalore, Hyderabad,
Chennai and Pune.
The government of Karnataka also recognises the importance of Information
Technology. The website of the Karnataka government�s Information Technology
department proudly proclaims: Bangalore, The IT Capital of India.
The government has also released a policy statement on e-governance, which
states:
E-governance or electronic governance may be defined as delivery of
government services and information to the public using electronic means.
Such means of delivering information is often referred to as information
technology or �IT� in short. Use of IT in government facilitates an
efficient, speedy and transparent process for disseminating information to
the public and other agencies, and for performing government
administration activities. The government of Karnataka believes that
effective implementation of e-governance will take IT to the common
man. The government would like to be pro-active and responsive to all its
citizens, particularly the poor.
Though the interest level among the law makers is low, an honest effort is being
made by the administration, to exploit the power of Information Technology. A major
achievement of the government was the computerisation of the revenue department. The
government has also set up online kiosks which enable payment of utility bills and
accessing of information.

Table 105: Respondents who surf the net among political parties
Party Total Cong JDS BJP Others
Yes Count 20 4 10 2 36 % within internet 55.6% 11.1% 27.8% 5.6% 100% % within party 35.1% 10.3% 21.7% 22.2% 23.8% No Count 37 35 36 7 115 % within internet 32.2% 30.4% 31.3% 6.1% 100% % within party 64.9% 89.7% 78.3% 77.8% 76.2% Total Count 57 39 46 9 151 % within internet 37.7% 25.8% 30.5% 6% 100% % within party 100% 100% 100% 100% 100%
Among the Congress members in the legislature, 64.9 per cent do not surf the net,
while 35.1 per cent do. In the JDS, 89.7 per cent do not visit the web, as against 10.3 per
cent who do. Among BJP members, 78.3 per cent do not access the web, while 21.7 per
cent do. Among the �Others�, 77.8 per cent do not surf the internet, while 22.2 per cent
do.
Chart 27: Respondents who surf the net and their party affiliation
0%
20%
40%
60%
80%
100%
% o
f res
pond
ents
Yes 35.1% 10.3% 21.7% 22.2%
No 64.9% 89.7% 78.3% 77.8%
Cong JDS BJP Others
The number of surfers is the highest within the Congress and lowest in the JDS.

Table 106: Number of MLAs and MLCs who surf the net House Total MLA MLC Yes Count 21 15 36 % within
internet 58.3% 41.7% 100%
% within house
18.1% 42.9% 23.8%
% of Total
13.9% 9.9% 23.8%
No Count 95 20 115 % within
internet 82.6% 17.4% 100%
% within house
81.9% 57.1% 76.2%
% of Total
62.9% 13.2% 76.2%
Total Count 116 35 151 % within
internet 76.8% 23.2% 100%
% within house
100% 100% 100%
% of Total
76.8% 23.2% 100%
Among the MLAs, 81.9 per cent do not surf the net, while 18.1 per cent do.
Among MLCs, 57.1 per cent do not access the web, while 42.9 per cent do.
In the case of newspapers, magazines, television and radio, the usage pattern of
the members of both Houses of the legislature, is largely similar.
However, with internet a significant deviation is seen. The number of MLCs who
surf the internet is much higher than that of MLAs.

Table 107: Gender of the respondents who surf the internet
Gender Total Male Female
Yes
Count 35 1 36
% within internet
97.2% 2.8% 100%
% within gender
24.8% 10% 23.8%
% of Total
23.2% .7% 23.8%
No Count 106 9 115 % within
internet 92.2% 7.8% 100%
% within gender
75.2% 90% 76.2%
% of Total
70.2% 6% 76.2%
Total Count 141 10 151 % within
internet 93.4% 6.6% 100%
% within gender
100% 100% 100%
% of Total
93.4% 6.6% 100%
The number of men who surf the net is much higher than that of female
respondents.
Among the men, 24.8 per cent visit the web, while among the women, it is 10 per
cent.
The national average of internet penetration according to the Indian Readership
Survey (IRS 2005) is 70 per cent among the men.

Table 108: Respondents who use the net regularly
Frequency Per cent Valid Per cent Cumulative Per cent Regularly 5 3.3 13.9 13.9 Occasionally 31 20.5 86.1 100 Total 36 23.8 100 N/A 115 76.2 Total 151 100
Among the legislators who visit the web, 13.9 per cent surf the internet regularly,
while 86.1 per cent are occasional users. Of all the media analysed so far, the number of
regular users is the lowest with the internet. Newspapers are read regularly by 99.3 per
cent of the respondents. The regularity of usage is 55 per cent with magazines, 67.5 per
cent with television and 22.5 per cent with radio.
Table 109: Time spent on the net by the respondents
Frequency Per cent Valid Per cent Cumulative Per centTime Spent 1 hr and above 9 6 25 25 30 mins to 1 hr 14 9.3 38.9 63.9 Less than 30 mins 13 8.6 36.1 100 Total 36 23.8 100 N/A 115 76.2 Total 151 100
The amount of time spent by those who log onto the net is extremely low. Only
25 per cent among the surfers spend one hour and above on the net. While 38.9 per cent
surf the net for 30 minutes to one hour, 36.1 per cent hook on for less than 30 minutes.

Among all the media, the time spent by the respondents on the internet is the
lowest, while with newspapers it is the highest.
Table 110: Time spent with internet and the education level
1 hr and above
30 mins to 1 hr
Below 30 mins
Total
Education <SSLC Count 1 1 2 % within
education50% 50% 100%
SSLC & abv Count 4 4 % within
education 100% 100%
Graduate Count 6 3 10 19 % within
education31.6% 15.8% 52.6% 100%
Postgraduate Count 1 2 2 5 % within
education20% 40% 40% 100%
Professional Count 1 4 1 6 % within
education16.7% 66.6% 16.7% 100%
Total Count 9 14 13 36 % within
total 25% 38.9% 36.1% 100%
Among the internet users in the below SSLC group, 50 per cent surf the net for
one hour and above and the remaining 50 per cent for 30 minutes to one hour. The entire
100 per cent in the SSLC and above group surf the net for 30 minutes to one hour.
Among graduates, 31.6 per cent spend one hour and above, 15.8 per cent spend 30
minutes to one hour and 52.6 per cent spend less than 30 minutes.

In the postgraduate group, 20 per cent surf the net for one hour and above, 40 per
cent for 30 minutes to one hour and 40 per cent for less than 30 minutes.
Among professional degree holders, 16.7 per cent spend one hour and above, 66.6
per cent spend 30 minutes to one hour and 16.7 per cent spend below 30 minutes.
The highest number of respondents spending over one hour on the internet is in
the below SSLC group, followed by graduates, postgraduates and professional degree
holders.
Nationally, the average time spent on the internet by Indians has seen an increase.
According to the Indian Readership Survey, which tracks media consumption, the time
spent on the internet has increased from 58 minutes on weekdays in July-December, 2003
to 63 minutes in the same period during 2005.
Table 111: Number of sites visited by the respondents
Frequency Per cent Valid Per cent Cumulative Per cent
Sites visited 1 to 2 30 19.9 83.3 83.3 3 to 4 6 4 16.7 100 Total 36 23.8 100 N/A 115 76.2 Total 151 100
Of the internet surfers, 83.3 per cent visit 1 to 2 sites, while 16.7 per cent visit 3 to
4 sites. On the other hand, 41.7 per cent read 7 or more newspapers, 12.8 per cent read 7
or more magazines and 43.6 per cent watch 7 or more television channels.

Table 112: First news priority of the respondents in internet
Frequency Per cent Valid Per cent Cumulative Per cent News Politics 25 16.6 69.4 69.4 IT 2 1.3 5.6 75 Development 3 2 8.3 83.3 International 1 .7 2.8 86.1 Info for Debates 4 2.6 11.1 97.2 Religion 1 .7 2.8 100 Total 36 23.8 100 N/A 115 76.2 Total 151 100
As with the print and electronic media, the legislators were asked to indicate their
news priorities on the net. Though the number of respondents who surf the net is small,
Politics nevertheless tops the list of priorities with 69.4 per cent of the users.
Legislators also made a specific reference to �Information for Debates� (11.1 per
cent). An MLA from Bangalore explained:
I generally use the information available in newspapers during debates,
but the internet enables me to use search engines to obtain specific
information like urban traffic management in developed countries.
Development News is mentioned by 8.3 per cent, Information Technology by 5.6
per cent and International News by 2.8 per cent.
Religion made its entry to the list of first priorities with one respondent stating
that he surfs for information on Sufism.

Table 113: Second news priority of the respondents in internet
Frequency Per cent Valid Per cent Cumulative Per cent News Crime 2 1.3 5.6 5.6 Sports 7 4.6 19.4 25 Business 8 5.3 22.2 47.2 Legal issues 6 4 16.7 63.9 Development 7 4.6 19.4 83.3 International 2 1.3 5.6 88.9 Auction 1 .7 2.8 91.7 None 3 2 8.3 100 Total 36 23.8 100 N/A 115 76.2 Total 151 100
Among the second priorities, 22.2 per cent have mentioned Business News. In
both print and electronic media, Business News has attracted a sizeable number of
legislators with many of them expressing their interest in the share market.
Development News is also high on the agenda, with 19.4 per cent of the
respondents mentioning it. This trend was noticed in the case of newspapers and
magazines too.
The other issues mentioned by the respondents are: Sports (19.4 per cent), Legal
Issues (16.7 per cent), International News (5.6 per cent) and Crime News (5.6 per cent).
Auctions on the net have attracted 2.8 per cent. An MLC from North Karnataka
has claimed that he spends a considerable amount of time on auction sites.
Even among the small number which surfs the internet, 8.3 per cent have said
they do not have a second priority.

Table 114: Third news priority of the respondents in internet
Frequency Per cent Valid Per cent Cumulative Per cent News Legal Issues 1 .7 2.8 2.8 Development 15 9.9 41.7 44.4 International 9 6 25 69.4 Agriculture 2 1.3 5.6 75 Environment 1 .7 2.8 77.8 Games 1 .7 2.8 80.6 None 7 4.6 19.4 100 Total 36 23.8 100 N/A 115 76.2 Total 151 100
Among the third priorities, 41.7 per cent of the users have mentioned
Development News, followed by International News (25 per cent), Agriculture News (5.6
per cent), Environment News (2.8 per cent), Legal Issues (2.8 per cent) and internet based
games (2.8 per cent). Among the users, 19.4 per cent have said they do not have a second
priority.
Though the response towards the internet is generally lukewarm, there are some
legislators who have effectively exploited the web in the discharge of their duties. The
MLA from Basavanagudi, Bangalore, has set up a website which profiles his
constituency in detail.
Many respondents were forthright in their response. An MLC, who uses the
computer mainly to e-mail his children in the United States, said: �I dictate the letter and
my secretary types it out.�
Another respondent confided: �My wife and children spend more time on the net
than I do.�

Table 115: Use of e-mail by the legislators
Frequency Per cent Valid Per cent Cumulative Per cent Valid Correspond with
constituents 9 6 25 25
Correspond with party colleagues 11 7.3 30.6 55.6
Personal communication 9 6 25 80.6
Use only internet, not e-mail
7 4.6 19.4 100
Total 36 23.8 100 N/A 115 76.2 Total 151 100
E-mail does not appear to be a popular mode of communication among the
legislators. Even among those who surf the internet, 19.4 per cent do not use the e-mail.
Among the legislators who surf the internet, 30.6 per cent use the e-mail facility
to communicate with their party colleagues, 25 per cent use e-mail to correspond with
their constituents while another 25 per cent use it for personal communication.
Political parties and the business community in India have discovered the efficacy
of the internet and e-mail. According to a report in the Financial Express, the online
advertising market in India is set to touch Rs 1.62 billion by the end of 2005-2006
financial year and grow to Rs 2.8 billion by 2007-2008.
But the legislators in Karnataka say they prefer traditional methods like public
meetings and door-to-door visits, and not an impersonal medium like the internet.

ANALYSIS OF MOBILE PHONE USAGE
The mobile phone is no longer a mere talking device. It has today emerged as a
powerful communication tool, with wide-ranging applications. The mobile phone is
today an important medium for political campaigning in different parts of the world.
Short Messaging Service (SMS) through mobile phones has caught the fancy of
politicians, due to its inherent advantages over traditional media. While being cost-
effective, SMS affords an opportunity to reach the target audience directly.
Though mobile campaigning did not make its mark in the 2004 US presidential
election, it played a key role in some other countries. According to an AFP report,
political rivals relied heavily on SMS to seek votes in the hotly contested May 2005
Ethiopian elections.
Canada has designed a unique initiative aimed at engaging young voters in
various national issues. Canadian mobile phone users can now interact directly with the
country's political parties by sending and receiving text messages. Anyone with a mobile
phone can send a question to political party headquarters, which will in turn respond to
the question via text message, says The Edmonton Journal. 12
Indian politicians do not lag behind their counterparts elsewhere in the effective
utilisation of mobile phones and SMS for political communication. During the 2004
assembly elections in Delhi, Rajasthan, Chattisgarh and Madhya Pradesh, the Australian
12. �Canadian Politicians Look to Engage Young Voters with Text Messaging.� The Edmonton Journal 19 Apr. 2004. 30 May 2005 http://www.clickatell.com/brochure/sms_industry/politics.php.

Broadcasting Corporation Local Radio reported:
Political party heavyweights in Australia should be taking more than a
passing interest in what is happening in four provincial elections in India
this week. As usual, candidates are wooing voters with music, posters and
promises. Politicians are also using mobile telephones and SMS texting to
canvas political support. 13
During the 2004 parliamentary elections, political parties exploited the mobile
phone to the maximum possible extent. In keeping with India�s reputation as the hub of
world technology, the elections turned out to be the most tech-savvy in the independent
history of the country.
Thousands of people across the country received a call on their mobiles with a
recorded voice of the then Prime Minister A.B. Vajpayee listing the government�s
achievements. In addition, the BJP transmitted text messages to millions of mobile phone
users. BJP spokesman Siddarth Nath Singh said in an interview to the Voice of America:
You will be surprised that in the last one year, India has taken millions of
mobiles. It is a big number. And when you look at that number, you
decide that SMS can be a good campaign. 14
13. �Indian election campaigners target voters through their mobiles.� The World Today. ABC Local Radio. 4 Dec. 203. 18 May 2005 <http://www.abc.net.au/worldtoday/content/2003/s1003626.htm>. 14. �Cell phones Play Important Role in Upcoming Indian Elections.� English Worldwide. Voice of America. 24 Mar. 2004. 30 May 2005 <http://www1.voanews.com/article.cfm?objectID=58D3480A-4A4C-4CE9-93AD0F60F55135D7>.

Though the BJP took the lead in mobile phone utilisation, the Congress was not
far behind. �Emphasis has been laid on the use of new technology to campaign,� said the
Congress publicity committee chairman in Delhi, Vishwa Bandhu Gupta in an interview
to the BBC. 15
The BBC which used the phrase �new age election campaign�, said in its report:
As campaigning picks up in India�s elections, candidates are looking at
new ways to reach the voter. In these elections, political parties and
candidates are increasingly using new technology and media to make their
pitch. The growing number of mobile phone users and increasing use of
the internet have provided the parties a new campaign platform. 16
The world media has showered accolades on Indian politicians for heralding a
new era in hi-tech campaigning. With their vast potential, mobile phones have come as a
powerful tool of communication for the politicians. The usage of the mobile phone by
Karnataka legislators for political communication and to download news is being
analysed against this scenario.
15-16. �India�s new age election campaign.� BBC News World Edition. British Broadcasting Corporation. 23 Nov. 2003. 18 May 2005 <http://news.bbc.co.uk/2/hi/south_asia/3223646.stm>.

Table 116: Respondents who own a mobile phone
Frequency Per cent Valid Per cent Cumulative Per cent Yes 151 100 100 100 No 0 0 0 Total 151 100 100
All the 151 legislators (100 per cent) own a mobile phone. The respondents were
asked for what purpose they primarily use the mobile phone. The response across the
board is: �For conversation.� The usage is so high that jammers have now been installed
in both Houses of the legislature to prevent access to mobile phones during the session.
Table 117: Respondents who download news through the mobile
Frequency Per cent Valid Per cent Cumulative Per cent Yes 46 30.5 30.5 30.5 No 105 69.5 69.5 100 Total 151 100 100
In this era of convergence, the applications of the mobile phone are numerous.
One of the facilities offered by the service providers is news downloads. This enables the
subscriber to download the latest news on his mobile round the clock. Among the
legislators, 69.5 per cent do not use this service, against 30.5 per cent who do.
In the case of the internet too, though 91.4 per cent of the respondents have a
computer, only 23.8 per cent surf the net.

Table 118: Respondents who regularly download news through the mobile Frequency Per cent Valid Per cent Cumulative Per centMobile Regularly 11 23.9 23.9 23.9 Occasionally 35 76.1 76.1 100 Total 46 30.5 100 Never 105 69.5 Total 151 100
Among the respondents, 23.9 per cent download news on their mobile regularly,
while 76.1 per cent use this facility occasionally.
Table: 119: Use of SMS within political parties Party Total Cong JDS BJP Others SMS Political Count 4 1 7 1 13 % within use 30.8% 7.7% 53.8% 7.7% 100% % within party 7% 2.6% 15.2% 11.1% 8.6% Jokes Count 9 1 3 13 % within use 69.2% 7.7% 23.1% 100% % within party 15.8% 2.6% 6.5% 8.6% Personal Count 7 3 9 1 20 % within use 35% 15% 45% 5% 100% % within party 12.3% 7.7% 19.6% 11.1% 13.2% Do not Use Count 37 34 27 7 105 % within use 35.2% 32.4% 25.7% 6.7% 100% % within party 64.9% 87.2% 58.7% 77.8% 69.5% Total Count 57 39 46 9 151 % within use 37.7% 25.8% 30.5% 6% 100% % within party 100% 100% 100% 100% 100%

A significant addition to the increasing list of communication carriers is that of
SMS. It has become the fastest, easiest and the most convenient way to communicate
today. For reasons personal or professional, SMS works across purposes. Political parties
have also extensively adopted SMS to convey their message to the voters.
Among the respondents, 69.5 per cent do not use the SMS facility on their
phones, while 30.5 per cent do.
Among those who utilise this facility, 13.2 per cent use SMS for personal
communication with family and friends, 8.6 per cent use it for political communication
which includes interacting with their party colleagues and friends, while another 8.6 per
cent use the SMS to forward jokes that they receive from friends.
Chart 28: Usage of SMS facility by respondents across party
0%
20%
40%
60%
80%
100%
% o
f res
pond
ents
Yes 35.1% 12.8% 41.3% 22.2%
No 64.9% 87.2% 58.7% 77.8%
Cong JDS BJP Others
The highest number of respondents who do not use the SMS facility is within the
JDS (87.2 per cent), followed by �Others� (77.8 per cent), Congress (64.9 per cent) and
BJP (58.7 per cent).
The efficacy of the SMS is brilliantly recorded by the website,
exchange4media.com, in an aptly titled report, SMS-Selling Made Smarter:
Amongst the sea of communication channels hitting the consumer
constantly the actual message usually gets lost. Many a time, the
possibility of the right message reaching the right target is dwindled, not
ruling out the fact that this has a direct impact on the costs shelled out on
such activities. Unlike the mass media, SMS enables micro targeting,
which ensures that there is no spillover of the communication. SMS as a
medium is all pervasive, personal and direct as far as approaching the right
target is concerned. 17
While Karnataka legislators are yet to harness the power of SMS, its utility was
put to full use in the neighbouring State of Andhra Pradesh, where the then Chief
Minister, Chandrababu Naidu, used the mobile phone to ensure the attendance of his
legislators in the Assembly. Whenever the party required the strength of its MLAs in the
House to counter the opposition attack, they would be summoned through text messages.
A training camp was also held to teach the MLAs how to send and receive SMS,
according to the Hindustan Times.
In Australia, the government has allowed MPs to text constituents with everything
from electorate news to the latest government programmes, reports The Herald Sun. 18
17. Research & Technologies Unit of Initiative. �SMS: Selling Made Smarter?!� www.exchange4media.com. 06 Jan. 2006 <http://www.exchange4media.com/e4m/media_matter/matter_041203.asp>. 18. �MP Message Flood.� The Herald Sun 5 Dec. 2004. 30 May 2005 <http://www.clickatell.com/brochure/sms_industry/politics.php>.

ANALYSIS OF MEDIA UTILITY AND CREDIBILITY
Chart 29: Usage of print, electronic and new media by the respondents
0%
20%
40%
60%
80%
100%
% o
f res
pond
ents
Yes 100% 98.7% 100% 67.5% 23.8% 30.5%
No 0% 1.3% 0% 32.5% 76.2% 69.5%
Np Mag TV Radio Internet Mobile
The chart depicts the extent of usage of different media by the respondents. The
usage of newspaper and television is 100 per cent, with all respondents indicating that
they read newspapers and watch television. With magazines, the usage is slightly less.
While 98.7 per cent read magazines, 1.3 per cent do not read them.
While 67.5 per cent have said that they tune into radio, 32.5 per cent have replied
in the negative. While 76.2 per cent of the respondents do not surf the web, only 23.8 per
cent do. The mobile appears to be marginally popular than the internet, with 30.5 per cent
indicating that they download news through their handheld devices.

Chart 30: Media consumption by the respondents
0%
10%
20%
30%
40%
50%
60%
70%
80%
90%
1 to 2 4.6% 34.2% 4% 76.5% 83.3%
3 to 4 21.9% 36.9% 25.2% 23.5% 16.7%
5 to 6 31.8% 16.1% 27.2% 0% 0%
7 abv 41.7% 12.8% 43.6% 0% 0%
Np Mag TV Radio Internet
Respondents who read only 1 to 2 newspapers or watch 1 to 2 television channels
are in a minority, as the consumption of these two media by the legislators is high. While
41.7 per cent read 7 or more newspapers, 43.6 per cent watch 7 or more channels.
With radio, 76.5 per cent tune into 1 to 2 stations, while no respondent listens to
more than 5 stations. In the case of internet, 83.3 per cent visit only 1 to 2 web sites.
An analysis of the above chart indicates that the consumption of newspapers and
television is much higher when compared to magazines, radio and internet.

Chart 31: Regularity of usage of different media
0%10%20%30%40%50%60%70%80%90%
100%
Regular 99.3% 55% 67.5% 22.5% 13.9% 23.9%
Occasional 0.7% 45% 32.5% 77.5% 86.1% 76.1%
Np Mag TV Radio Internet Mobile
Among the respondents, 99.3 per cent read newspapers regularly. In the case of
television, the number of regular viewers is 67.5 per cent. Though the usage of
newspapers and television is 100 per cent among the respondents, the number of
respondents who read newspapers regularly is higher than that of those who watch
television regularly.
Among the radio users, 22.5 per cent tune in regularly. Of the small number of
respondents who visit the web, 13.9 per cent uses the internet regularly. In the case of
mobile phones, the facility to download news is used regularly by 23.9 per cent.
Thus, the newspaper establishes a lead over all other media in terms or regularity
of usage.

Chart 32: Depiction of time spent on different media
0%
10%
20%
30%
40%
50%
60%
70%
% o
f res
pond
ents
1 hr Abv 49.7% 44.3% 40.4% 8.9% 25%
30 min- I hr 47% 36.9% 42.4% 23.8% 38.9%
< 30 mins 3.3% 18.8% 17.2% 67.3% 36.1%
Np Mag TV Radio Internet
Newspapers are read by 49.7 per cent of the respondents for one hour and above,
while television is viewed for the corresponding period every day by 40.4 per cent.
Similarly, while only 3.3 per cent read newspapers for less than 30 minutes, the number
of respondents watching television for below 30 minutes is much higher at 17.2 per cent.
Among the radio users, only 8.9 per cent tune in for one hour and above, while
67.3 per cent listen for less than 30 minutes. Among the internet users, 25 per cent surf
the net for one hour and above. However, the overall usage of the radio is higher
compared to the internet.
Thus, in terms of the time spent on a medium, the maximum number spends one
hour and above on newspapers. Similarly, the number of respondents spending less than
30 minutes on a medium is the least with newspapers.

Chart 33: Comparison of Politics as the first priority across media
0%
20%
40%
60%
80%
100%%
of r
espo
nden
ts
Politics 96.7% 90.6% 88.7% 67.6% 69.4%
Other issues 3.3% 9.4% 11.3% 32.4% 30.6%
Np Mag TV Radio Internet
Across print, electronic and new media, a majority of the respondents have
mentioned Politics as their first priority.
The chart depicts that the dependence on newspapers (96.7 per cent) for political
news is the highest among the respondents, followed by magazines (90.6 per cent),
television (88.7 per cent), internet (69.4 per cent) and radio (67.6 per cent).
The number of legislators whose first priority is issues other than Politics is the
lowest with newspapers. This figure correspondingly increases with magazines,
television, internet and radio.
Thus, with newspapers, the respondents are more definitive about their news
priorities.

Table 120: Media relied upon by the legislators to communicate with the people
Frequency Per cent Valid Per cent
Cumulative Per cent
Valid Newspaper
90 59.6 61.2 61.2
TV 10 6.6 6.8 68 Newspaper
and TV 41 27.2 27.9 95.9
Newspaper, Radio and TV
6 4 4.1 100
Total 147 97.4 100 Not
Applicable 4 2.6
Total 151 100
A majority of 97.4 per cent relies on the media to communicate with the people,
while 2.6 per cent do not.
Among those who depend on the media, 61.2 per cent rely on newspapers, 27.9
per cent rely on both newspapers and television, while 4.1 per cent rely on newspapers,
television and radio. Only 6.8 per cent of the respondents depend exclusively on
television.
Thus, the newspaper is the most preferred medium among the respondents to
communicate with the people.
The regularity of usage of newspapers is also the highest when compared with
magazines, television, radio and internet (Chart 31).

Table 121: Use of media to collate background information for debates
Frequency Per cent Valid Per cent Cumulative Per cent Yes 133 88.1 88.1 88.1 No 18 11.9 11.9 100 Total 151 100 100
A majority of 88.1 per cent of the respondents utilise the media to collate
background information for debates in the legislature, while 11.9 per cent do not.
Table 122: Respondents who formulate their views based on media reports
Frequency Per cent Valid Per cent Cumulative Per cent
Yes 116 76.8 76.8 76.8 No 35 23.2 23.2 100 Total 151 100 100
Among the respondents, 76.8 per cent have indicated that they formulate their
views based on media reports, while 23.2 per cent have said they are not influenced by
the media.
However, the agenda setting role of the media is not analysed here because it does
not fall within the purview of this study. The agenda setting role of the media is a vast
and independent subject in itself, which demands a separate study.

Table 123: The single most important way that the media impacts performance
Frequency Per cent Valid Per cent Cumulative Per centIt helps me identify issues to be raised in the legislature
57 37.7 37.7 37.7
It helps me to convey my message to my constituents
39 25.8 25.8 63.5
It helps me to exert pressure on the government
17 11.3 11.3 74.8
It gives me a feedback on my performance
38 25.2 25.2 100
Total 151 100 100
The respondents were asked to identify the single most important way in which
the media impacts their performance as legislators.
While 37.7 per cent have said that the media helps them to identify issues to be
raised in the legislature, 25.8 per cent have said that the media helps them to convey their
message to their constituents. While 25.2 per cent have indicated that the media provides
them feedback on their performance, 11.3 per cent have said that it helps them exert
pressure on the government.
Thus, all the respondents agree that the media impacts their performance as
legislators in one way or the other.
Table 124: Respondents who convene press conferences/ issue press notes
Frequency Per cent Valid Per cent Cumulative Per cent Yes 146 96.7 96.7 96.7 No 5 3.3 3.3 100 Total 151 100 100
The number of respondents who convene press conferences and issues press notes
to communicate with the people is as high as 96.7 per cent.

Legislators call for press conferences both in their constituencies and in the State
capital. According to the respondents, they generally convene press conferences in
Bangalore to draw the attention of the government to long pending issues in their
constituencies or to convey their views on important political developments. However,
when the issue is purely local, press conferences are convened at the constituency level.
Chart 34: Respondents who convene press conferences/ issue press notes
Yes96.7%
No3.3%
It is seen from the graph that only 3.3 per cent of the respondents do not call a
press conference or issue press notes to communicate with the people.
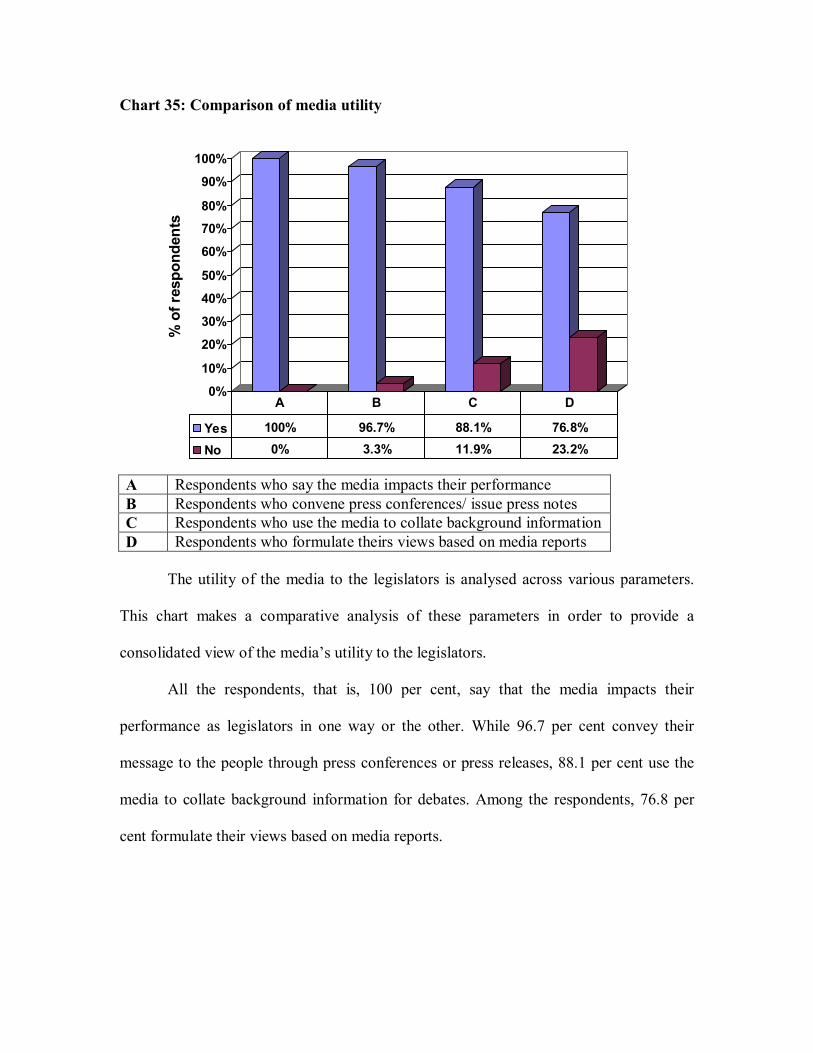
Chart 35: Comparison of media utility
0%
10%
20%
30%
40%
50%
60%
70%
80%
90%
100%%
of r
espo
nden
ts
Yes 100% 96.7% 88.1% 76.8%
No 0% 3.3% 11.9% 23.2%
A B C D
A Respondents who say the media impacts their performance B Respondents who convene press conferences/ issue press notes C Respondents who use the media to collate background information D Respondents who formulate theirs views based on media reports
The utility of the media to the legislators is analysed across various parameters.
This chart makes a comparative analysis of these parameters in order to provide a
consolidated view of the media�s utility to the legislators.
All the respondents, that is, 100 per cent, say that the media impacts their
performance as legislators in one way or the other. While 96.7 per cent convey their
message to the people through press conferences or press releases, 88.1 per cent use the
media to collate background information for debates. Among the respondents, 76.8 per
cent formulate their views based on media reports.

Analysis of Media Credibility
The credibility of the media has come under a scanner in recent years, with the
fourth estate being accused of bias. While studies both in India and abroad paint a dismal
picture of the current state of journalism, the law makers of Karnataka regard the media
as largely credible.
The idea of journalism as a profession devoted to public service is enshrined in
the first code of ethics developed in 1923 by the American Society of Newspaper Editors.
Known as the Canons of Journalism, the code stated that �the primary function of
newspapers is to communicate to the human race what its members do, feel, and think�.
With the Canons of Journalism being increasingly ignored, media credibility
appears to have taken a beating. In a Gallup Poll conducted in 2004, Americans rated the
trustworthiness of journalists at about the level of politicians and only slightly more
credible than used-car salesmen. The poll suggests that only 21 per cent of Americans
believed that journalists have high ethical standards, ranking them below auto mechanics,
but tied with members of Congress.
Another study in 2004, by the Project for Excellence in Journalism, of the
Columbia University's Graduate School of Journalism, underscores this observation:
Since 1985, believability of the daily newspaper has fallen by a quarter,
from 80 per cent in 1985 to 59 per cent in 2002. 19
19. Maier, Timothy W. News media's credibility crumbling. 08 May 2004. WorldNetDaily. 21 June 2005 <http://www.worldnetdaily.com/news/article.asp?ARTICLE_ID=38398>.

In their book, Manufacturing Consent: The Political Economy of Mass Media,
Edward S. Herman and Noam Chomsky argue that the free market economics model of
media leads inevitably to normative and narrow reporting. David Niven, in his book,
Tilt? The Search for Media Bias, observes:
Perhaps nowhere in society is an entity entrusted with as much
responsibility, while at the same time being subject to such widespread
distrust, as the media.
The growing distrust against the media in India was aptly summarised by the then
Union Minister for Information and Broadcasting, Jaipal Reddy, at a function organised
by the Karnataka Media Academy and the Mysore District Journalists� Association:
The influence of the media has been on the wane in the last few years.
Even if volumes have gone up, values have come down. In the case of
round-the-clock news channels, they are obliged to create and manufacture
news. The readers and viewers cannot figure out what is right and what is
wrong. 20
Prime Minister Manmohan Singh, has referred to this tendency as �hit and run�
journalism.
Against the backdrop of the growing cynicism against the media, this study makes
an attempt to ascertain the views of the legislators in Karnataka. While some responded
caustically, a majority of them agreed that the media is credible.
20. Staff Correspondent. �Govt. Planning to Set Up Media Commission, Says Jaipal Reddy.� The Hindu 2 July 2005. 25 July 2005 <http://www.hindu.com/2005/07/02/stories/2005070204860500.htm>.

Table 125: News medium to which respondents attach the most credibility
Media Total Newspaper TV Radio
Count 128 20 3 151 Per cent 84.8% 13.2% 2% 100%
The newspaper has emerged as the most credible medium with a majority of the
respondents (84.8 per cent), followed by television (13.2 per cent). Only 2 per cent of the
legislators find the radio credible. The respondents do not attach any credibility to the
internet and to mobile news downloads.
Chart 36: Comparison of credibility attached to different media
0%
10%
20%
30%
40%
50%
60%
70%
80%
90%
% o
f res
pond
ents
Media 84.8% 13.2% 2%
Np TV Radio

Table 126: Credibility perception and the region of the legislators
Media Total Newspaper Television Radio
Region South 72 9 2 83 Per cent 86.8% 10.8% 2.4% 100% North 56 11 1 68 Per cent 82.3% 16.2% 1.5% 100% Total 128 20 3 151
There is not much of a difference in the perception of credibility between the
respondents from the North and South of the State. Legislators from both regions regard
the newspaper as the most credible medium.
Among the respondents from the South, 86.8 per cent find the newspaper most
credible, followed by television at 10.8 per cent and radio at 2.4 per cent.
Among the respondents from the North, 82.3 per cent say the newspaper is the
most credible, followed by television at 16.2 per cent and radio at 1.5 per cent.
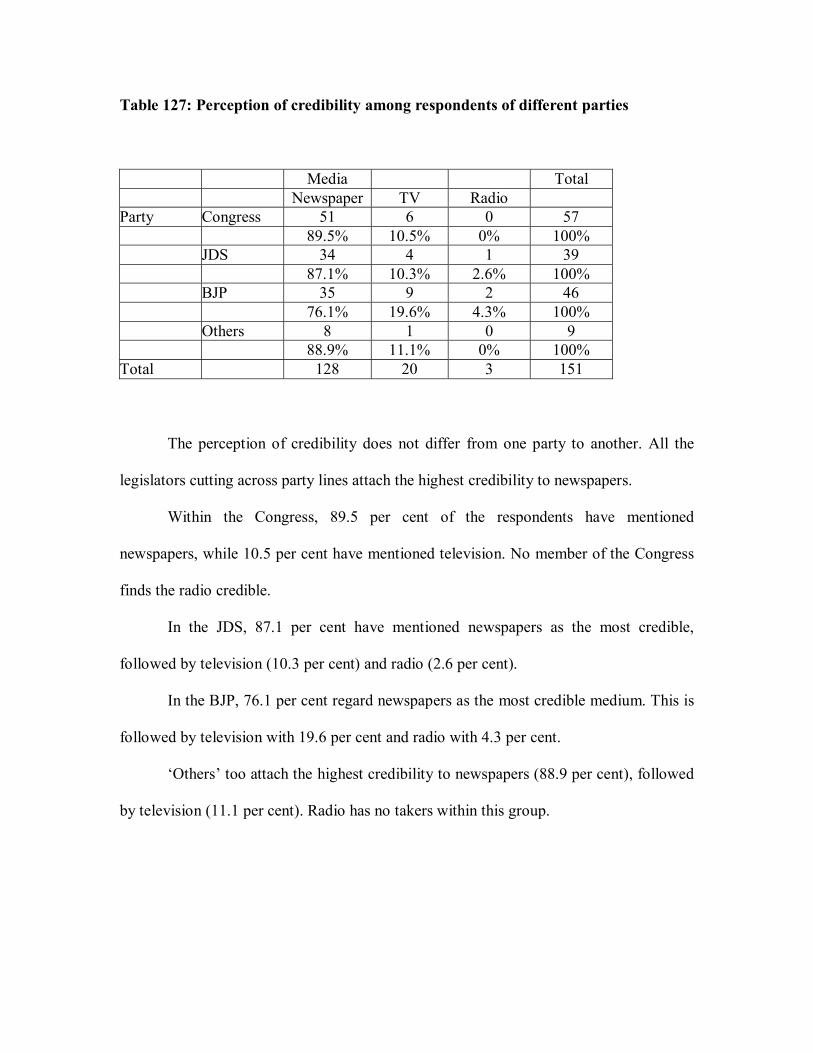
Table 127: Perception of credibility among respondents of different parties
Media Total Newspaper TV Radio
Party Congress 51 6 0 57 89.5% 10.5% 0% 100% JDS 34 4 1 39 87.1% 10.3% 2.6% 100% BJP 35 9 2 46 76.1% 19.6% 4.3% 100% Others 8 1 0 9 88.9% 11.1% 0% 100% Total 128 20 3 151
The perception of credibility does not differ from one party to another. All the
legislators cutting across party lines attach the highest credibility to newspapers.
Within the Congress, 89.5 per cent of the respondents have mentioned
newspapers, while 10.5 per cent have mentioned television. No member of the Congress
finds the radio credible.
In the JDS, 87.1 per cent have mentioned newspapers as the most credible,
followed by television (10.3 per cent) and radio (2.6 per cent).
In the BJP, 76.1 per cent regard newspapers as the most credible medium. This is
followed by television with 19.6 per cent and radio with 4.3 per cent.
�Others� too attach the highest credibility to newspapers (88.9 per cent), followed
by television (11.1 per cent). Radio has no takers within this group.

Chart 37: Comparison of regularity of media usage and credibility perception
0%10%20%30%40%50%60%70%80%90%
100%%
of r
espo
nden
ts
Regular 99.3% 67.5% 22.5% 25% 23.9%
Credibility 84.8% 13.2% 2% 0% 0%
Np TV Radio Internet Mobile
The chart analyses if there is a relation between the regularity of usage of a
particular media and the credibility attached to it. A majority of respondents, that is, 99.3
per cent read newspapers regularly. Similarly, the highest number (84.8 per cent) finds
the newspaper to be the most credible medium.
Among those who watch television, 67.5 per cent are regular viewers. Of the
respondents, 13.2 per cent have said that the television is the most reliable medium.
While 22.5 per cent of the respondents listen to the radio regularly, only 2 per
cent attach credibility to this medium. The total number of those using internet and
mobile downloads is low. No respondent attaches any credibility to these media.
The chart indicates that a relationship exists between the usage of a particular
medium and the credibility attached to it, though the credibility perception is not directly
proportionate to the extent of usage.

Chart 38: Comparison of media relied on for Politics and the credibility perception
0%10%20%30%40%50%60%70%80%90%
100%%
of r
espo
nden
ts
Politics 96.7% 88.7% 67.6% 69.4%
Credibility 84.8% 13.2% 2% 0%
Np TV Radio Internet
Politics has emerged as the single most important news factor across print,
electronic and the new media. The chart analyses if there is a relation between the
medium the individuals use for news about politics and the credibility attached to it.
The chart depicts that 96.7 per cent have indicated Politics as their first priority
with regard to newspapers. It is seen from the chart that 84.8 per cent consider the
newspaper as the most credible medium.
With television, though 88.7 per cent of the respondents have indicated Politics as
the first priority, only 13.2 per cent have said that they attach credibility to the television.
Among radio listeners, 67.6 per cent have mentioned Politics as the first priority.
Only 2 per cent regard the radio as a credible medium.
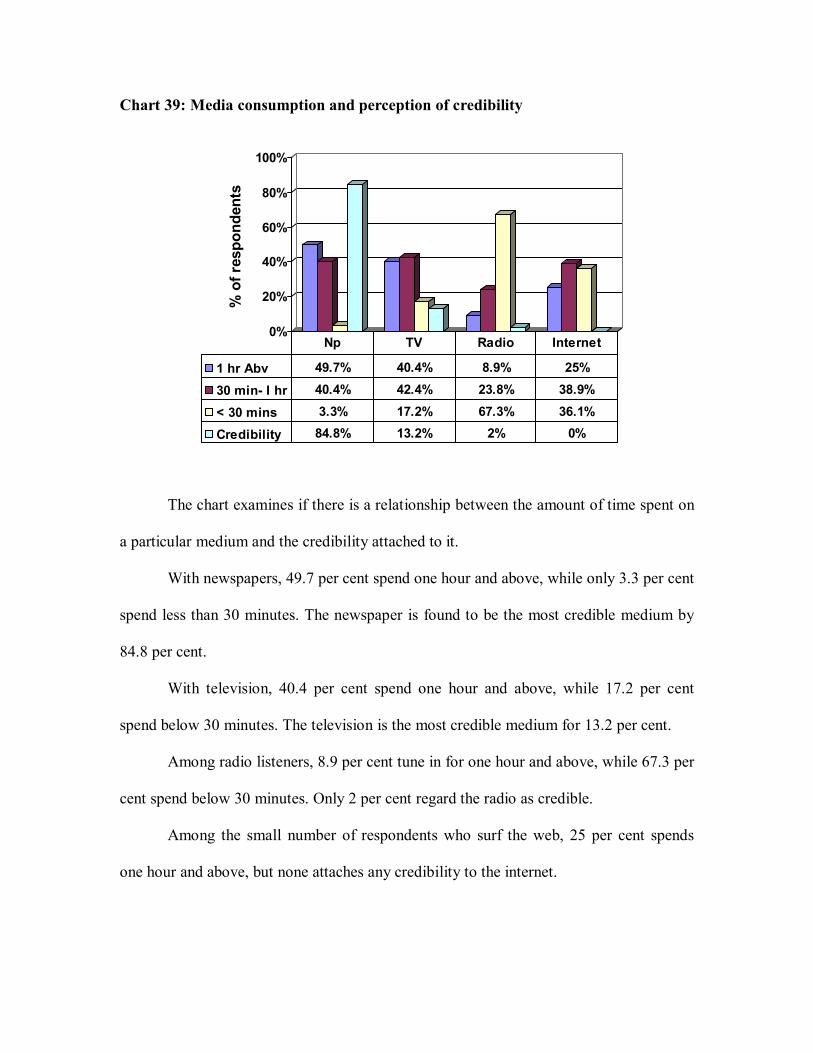
Chart 39: Media consumption and perception of credibility
0%
20%
40%
60%
80%
100%
% o
f res
pond
ents
1 hr Abv 49.7% 40.4% 8.9% 25%
30 min- I hr 40.4% 42.4% 23.8% 38.9%
< 30 mins 3.3% 17.2% 67.3% 36.1%
Credibility 84.8% 13.2% 2% 0%
Np TV Radio Internet
The chart examines if there is a relationship between the amount of time spent on
a particular medium and the credibility attached to it.
With newspapers, 49.7 per cent spend one hour and above, while only 3.3 per cent
spend less than 30 minutes. The newspaper is found to be the most credible medium by
84.8 per cent.
With television, 40.4 per cent spend one hour and above, while 17.2 per cent
spend below 30 minutes. The television is the most credible medium for 13.2 per cent.
Among radio listeners, 8.9 per cent tune in for one hour and above, while 67.3 per
cent spend below 30 minutes. Only 2 per cent regard the radio as credible.
Among the small number of respondents who surf the web, 25 per cent spends
one hour and above, but none attaches any credibility to the internet.

Chart 40: Dependence on local media by the respondents
0%
20%
40%
60%
80%
100%%
of r
espo
nden
ts
Yes 24.5% 0.7% 2.6% 38.2%
No 75.5% 99.3% 97.4% 61.8%
Np Mag TV Radio
The dependence on local media is extremely low across newspapers, magazines,
television and radio.
The dependence on the radio for local news is the highest at 38.2 per cent.
While 75.5 per cent of the respondents depend on State or national level
newspapers for news about their districts and constituencies, only 24.5 per cent rely on
local newspapers.
While 0.7 per cent depend on magazines for local news, the rest have said that
there are no magazines catering to local areas.
In the case of television, while 97.4 per cent depend on State level channels for
their complement of constituency news, only 2.6 per cent rely on local cable channels.

Table 128: Respondents who regard the media as fair in its coverage
Frequency Per cent Valid Per cent Cumulative Per centValid Yes 122 80.8 80.8 80.8 No 29 19.2 19.2 100 Total 151 100 100 While 80.8 per cent are satisfied with the media�s coverage of them, 19.2 per cent
have said that the media is not fair. Some legislators made comments like: �The media is
biased.� Such remarks were mostly directed against the local media.
Chart 41: Respondents who regard the media as fair in its coverage
Fair80.8%
Unfair19.2%
A majority of the respondents (80.8 per cent) consider the media to be fair in its
coverage of them as legislators.
ggg

CHAPTER IV
FINDINGS AND INFERENCES
This study pertains to the media habits of the legislators of Karnataka. The
preferences of the respondents are analysed across six dimensions of the media�
newspapers, magazines, television, radio, internet and mobile downloads�in terms of
consumption, treatment and effect.
The study covers different demographic groups including gender, income level,
education, region, members of the Assembly and the Council, age group and backward
classes.
The major findings of the study are listed below.
Newspapers
g The entire 100 per cent of the respondents read newspapers
The study reveals that the consumption of newspapers among the legislators is
extremely high at 100 per cent. While 99.3 per cent read newspapers regularly, 0.7 per
cent read them occasionally (Table 24).
Among the respondents, as many as 41.7 per cent read 7 or more newspapers.
Those who read only 1 to 2 newspapers are in a minority at 4.6 per cent (Table 27).
Similarly, the time spent with newspapers is also considerably high. While 49.7
per cent of the respondents read newspapers for one hour and above every day, only 3.3
per cent of the respondents spend less than 30 minutes on newspapers (Table 25).

The cumulative figure of respondents reading newspapers for above 30 minutes is
96.7 per cent. This is significantly higher than the national average of time spent reading
newspapers.
According to the National Readership Study, 2005 (NRS 2005), the time spent
reading has gone up quite significantly from 30 minutes daily on an average to 39
minutes per day over the last three years. The increase has been sharp both in urban India
(from 32 to 42 minutes daily) and in rural India (from 27 to 35 minutes daily). Dailies
have driven this growth in the press medium, their reach rising from 23 per cent to 24 per
cent. The study attributes this growth to the increase in literacy levels.
The National Readership Study, 2005, in India is the largest survey of its kind in
the world, with a sample size of over 2,61,212 house-to-house interviews to track the
media exposure and changing consumer trends in both urban and rural India, in addition
to the estimated readership of publications. The study covers 522 publications (221
dailies and 301 magazines).
As representatives of the people, it is imperative for the legislators to keep
themselves abreast of the developments around them. These occurrences often have a
personal bearing on the legislators. Newspapers, besides being mirrors of the society, also
provide a daily feedback on the performance of the legislators which they cannot afford
to ignore. This explains the insatiable appetite for news among the respondents.
Though television has invaded millions of Indian homes, the newspaper being a
traditional and dependent medium still continues to hold sway over the people. This was
appropriately summerised by a respondent from Belgaum district: �Though I watch
almost all news channels, my day does not begin without reading the newspaper.�
g All respondents read Kannada newspapers
All the 151 respondents (100 per cent) read Kannada newspapers (Chart 3). This
is expected as Kannada which is the official language of the State, is spoken by a
majority of the people.
The readership of English language newspapers is also significantly high at 80.1
per cent, which is an indication of the growing importance of this language among the
legislators. This is also a reflection of the general trend across the State, where English
newspapers have established a lead over Kannada publications. According to the Audit
Bureau of Circulation (ABC January-June 2005) report, The Times of India has a daily
circulation of about 340,000 copies in Karnataka, as against about 290,000 copies of the
highest selling Kannada daily, Vijaya Karnataka.
Hindi (7.9 per cent) and Urdu (4.6 per cent) are popular in North Karnataka
region, which accounts for respondents reading newspapers of these languages.
Marathi newspapers account for 4 per cent. Karnataka has a sizeable population
of Marathi speaking people, particularly in the border areas of Belgaum, which is
represented by members of the Maharashtra Ekikaran Samithi (MES) in the Assembly.
Telugu newspapers are read by 3.3 per cent of the legislators. The State has a
large Telugu population spread mainly across Bangalore, Kolar and Bellary. Telugu is
also the mother tongue of several legislators.
Tamil newspapers are read by 1.3 per cent of the legislators, particularly in
Bangalore, Kolar Gold Fields and Chamarajanagar districts. The fact that Tamil, Telugu
and other non-Kannada newspapers have launched their regional editions in Karnataka,
indicates their popularity among the people speaking these languages. These publications

lend a voice to the linguistic minorities in the State, who form a significant part of the
voter base. Thus, the legislators spare no effort in responding to their aspirations. This
explains the preference for newspapers of various languages among the respondents.
g Most respondents do not read international newspapers
Among the respondents, 86.1 per cent do not read international newspapers
(Table 29). A major contributing factor is that the government does not permit the
publication of foreign newspapers from the country, following a decision adopted at the
first Cabinet meeting of free India, in 1947. This has resulted in the cost of foreign
publications being exorbitant, as they have to be imported from their place of publication.
Besides, foreign newspapers do not arrive on the Indian shores on the same day of
their publication, which renders news stale. However, the situation may change in due
course with the government of late permitting limited foreign direct investment (FDI) in
the Indian news media.
g Legislators do not rely on local newspapers for local news
Among the respondents, 75.5 per cent do not rely on local newspapers for news
about their districts and constituencies. Instead, they prefer State level newspapers even
for local news. Only 24.5 per cent rely on local newspapers (Table 30).
Karnataka boasts of a vibrant media scene, with several hundred local newspapers
being published from different districts. These newspapers which have for long played an
influential role in the districts, appear to be steadily losing their sheen. This may be
attributed to two factors: credibility and the onslaught of national media.

The past few years have seen the mushrooming of �yellow press� at the district
level, which to quote an MLA, �thrive on blackmail journalism�. Thus, local newspapers
are accused of being biased and lacking in credibility.
An MLA from Kolar district remarked:
Local newspapers are vicious in their reporting. They are unfair not only
to me, but also to other politicians of the area.
Some respondents feel that while local newspapers are influenced by local factors,
State and national level newspapers serve as distant and dispassionate observers.
However, local newspapers have also come in for praise from some quarters. An
MLC from Kodagu district observed:
There are many local newspapers which fearlessly echo the views of the
people. Though the tendency to indulge in sensationalism is increasing, all
local newspapers cannot be painted with the same brush.
Another factor which has contributed to the steady decline in the consumption of
local newspapers is the launch of mofussil editions by national / State level newspapers.
All major newspapers have today launched local editions, which cater to different regions
of the State. With these publications providing a rich complement of local news, the
dependence on local newspapers has diminished.
Thus, the market dynamics appear to be working in favour of major publications
which offer a healthy staple of both national/ State and local news at the cost of a local
newspaper.

g Politics tops the news priorities of the respondents
The legislators were told to identify three news priorities from a list of commonly
read news factors: Politics, Crime News, Sports, Business News, Legal Issues,
Information Technology, Women Issues, Development News, Agriculture News,
International News, Editorials, Columns, Environmental News and Entertainment.
A majority of 96.7 per cent of the legislators mentioned Politics as their first
priority, followed by Development News (2.6 per cent) and International News (0.7 per
cent). When compared to Politics, other factors recede to the background (Table 31).
Considering that the respondents are in the business of politics, it is natural that
they are obsessed with news related to politics. Their interest in politics also stems from
the fact that they are personally impacted by the political developments at the national,
State or district level.
g Cartoons do not hold any interest for respondents
Among the respondents, 79.5 per cent do not read cartoons in newspapers, as
against 20.5 per cent who do (Table 37). Today, cartoons are the mainstay of
newspapers, with most publications carrying them on the front pages. Various studies
have amply demonstrated the enormous impact of �Doonesbury� on the American
political landscape.
But in Karnataka, cartoons are treated with disdain by the legislators. A politician
is a cartoonist�s favourite subject. Cartoons lampoon politicians every single day. That is
perhaps why politicians do not relish them. Or, the subtler side of life does not appeal to
the law makers.

Magazines
g The readership of magazines among legislators is high
Among the respondents, 98.7 per cent read magazines, while 1.3 per cent of them
do not (Table 40). However, among the magazine readers, only 55 per cent of the
respondents read them regularly (Table 41).
While 44.3 per cent of the respondents read magazines for one hour and above per
week, 36.9 per cent read them for 30 minutes to one hour and 18.8 per cent for less than
30 minutes (Table 42). Among those who read magazines, only 12.8 per cent read 7 or
more magazines (Table 44).
While the reach of dailies has increased from 23 per cent to 24 per cent in three
years, magazines have declined in reach from 13 per cent to 10 per cent (NRS 2005).
Magazines are considered a �weekly medium� and as such they do not satisfy the
demand for current news which is high among the legislators. Thus, though a large
number of respondents read magazines, the consumption in terms of regularity and time
spent are not correspondingly high when compared to newspapers.
g All respondents do not read Kannada magazines
Among magazine readers, 79.9 per cent read Kannada magazines. However,
Kannada magazines are not read by 20.1 per cent (Chart 8). Legislators also read English
(77.2 per cent), Hindi (8.1 per cent), Urdu (2 per cent), Tamil (2 per cent), Marathi (2 per
cent) and Telugu magazines (0.7 per cent)). The influence of languages other than
Kannada is evident in the case of magazines too. The large readership of English

magazines indicates the preference of the respondents for national magazines published
in English.
g International magazines have a higher readership than international newspapers
Among the respondents, 76.5 per cent do not read international magazines, as
against 23.5 per cent who do (Table 46). On the other hand, only 13.9 per cent of the
legislators read international newspapers. Among other factors, easy accessibility appears
to have played a role in a higher number of respondents reading international magazines.
Besides, unlike international newspapers, the content in magazines has a longer shelf-life.
g There are virtually no magazines in the State which cater to local areas
The study reveals that most respondents (99.3 per cent) do not rely on magazines
for news about their constituencies, because there are virtually no magazines in the State
which cater to local areas (Table 47). Only 0.7 per cent of the respondents have said that
they rely on magazines for local news and views. Most of Karnataka�s leading
magazines and tabloids are published at the State level. Publishing magazines at the
district level is an unviable proposition due to the poor circulation and revenue potential.
g Politics is the first news priority in magazines among respondents
In the case of magazines too, Politics is mentioned as the first priority by a
majority of 90.6 per cent (Table 48). This is followed by Development News (4 per
cent), International News (2.7 per cent), Women Issues (1.3 per cent) and
Columns/Editorials (1.3 per cent).

Television
g All respondents watch the television
The study indicates that the entire 100 per cent of the respondents watch
television (Table 54). Of them, 67.5 per cent are regular viewers, while 32.5 per cent are
occasional viewers (Table 55). While 40.4 per cent watch television for one hour and
above every day, 42.4 per cent spend 30 minutes to one hour and 17.2 per cent watch
television for less than 30 minutes (Table 56). A majority of 43.6 per cent watches 7 or
more channels (Table 58). Only 4 per cent of the respondents watch 1 to 2 channels.
This indicates that though all respondents watch television, the consumption in
terms of regularity of usage is not equally high. Thus, the fact that 7 or more channels are
watched by a majority of the legislators does not necessarily translate into higher
consumption.
Television affords the consumer the luxury of surfing about 100 channels from
the comfort of the living room at a fixed monthly subscription. On the other hand, the
consumer has to subscribe to each newspaper individually. Thus, a distinction may be
drawn between those who watch television regularly and those who merely surf channels.
However, the reach of the television cannot be under-estimated. Satellite TV has
grown explosively in reach�from 134 million individuals watching in an average week
in 2002 to as many as 190 million individuals in 2005� almost catching up with the
number of readers.
Though television is considered an entertainment medium, the 24-hour news and
business channels appear to have attracted the legislators.

This is aptly described by an MLA from Mysore:
Whenever I watch the television, I continuously switch from one news
channel to another. I watch almost all news bulletins in different
languages.
g English and Hindi programmes on television have a high viewership
Though 100 per cent of the respondents watch Kannada programmes on
television, the viewership for English (79.5 per cent) and Hindi programmes (66.2 per
cent) is also high (Chart 14). This is followed by Telugu (8.6 per cent), Tamil (7.9 per
cent), Marathi (4 per cent) and Urdu programmes (2.6 per cent). The 24-hour news and
business channels largely account for the respondents watching English programmes.
Hindi programmes include serials and movies, besides news bulletins.
g Viewership of international channels is high among the legislators
The study reveals that the number of respondents watching international channels
is considerably high at 74.8 per cent when compared to those who read international
newspapers and magazines.
However, the high viewership for international channels does not translate into a
greater interest in international news. While 74.8 per cent watch international channels,
only 4 per cent have mentioned International News as their first priority (Table 62),
followed by 1.3 per cent as the second priority (Table 63) and 18.5 per cent as the third
priority (Table 64).

This indicates that the respondents are essentially casual viewers of international
channels. Unlike newspapers, television enables the consumer to surf through a large
number of international channels without individually subscribing to them. Hence,
accessibility and convenience appear to have contributed to the large following for
international channels.
g Respondents do not rely on local cable channels for district news
Among the respondents, 97.4 per cent depend on State level channels for local
news, while only 2.6 per cent rely on local cable channels (Table 61).
Though community television is yet to take roots in Karnataka, an attempt in this
direction is being made by cable operators who record local news and telecast them.
However, their popularity remains low due to the poor credibility, lack of quality content
and absence of professionalism.
Besides, the legislators do not find the need for local channels, with State level
channels like Udaya News, ETV and Chandana exhaustively covering district and
constituency news.
g Politics is the first priority among television viewers
In television, 88.7 per cent of the respondents have mentioned Politics as their
first priority (Table 62). This shows that though the television offers a wide complement
of Entertainment, it is Politics that interests the respondents the most.
The other factors mentioned as the first priority are: International News (4 per
cent), Entertainment (3.3 per cent), Sports (2 per cent), Crime News (0.7 per cent), Legal
Issues (0.7 per cent) and Talk Shows (0.7 per cent).

Radio
g The usage of radio is the lowest across print and electronic media
Though a considerably high number of respondents at 67.5 per cent (Table 72)
listen to the radio, the consumption is the lowest when compared to newspapers,
magazines and television.
Among the respondents who listen to radio, only 22.5 per cent tune in regularly
(Table 73). Similarly, only 8.9 per cent tune in for one hour and above, 23.8 per cent for
30 minutes to one hour and 67.3 per cent for less than 30 minutes (Table 75).
While 76.5 per cent of the radio listeners tune into only 1 to 2 stations, 23.5 per
cent tune into 3 to 4 stations (Table 77). No respondent tunes into more than four stations.
This may be attributed to the fact that there are a lower number of radio stations available
when compared to television channels.
This indicates that the respondents who tune into radio are casual listeners, as the
regularity with which they listen to radio and the amount of time spent is very low.
According to the National Readership Survey 2005, (NRS 2005), radio�s reach
has stagnated at 23 per cent of the population listening to any station in the average week.
It has improved its performance in urban India where 23 per cent listen to radio, up from
20 per cent three years ago. This is primarily due to FM. With the government easing the
regulations of FM licensing, the listenership of radio is expected to witness an upward
swing in the coming years, particularly in urban areas.
In rural areas, the reach of the radio has dropped from 25 per cent three years ago
to 23 per cent now.
g Kannada is the most preferred language among radio listeners
Of the radio listeners, 95.1 per cent listen to Kannada programmes (Chart 22),
followed by English (55 per cent), Hindi (38.2 per cent), Urdu (2 per cent), Telugu (2 per
cent), Tamil (1 per cent) and Marathi (1 per cent).
g A large number tunes into international radio stations
Among the radio listeners, 45.1 per cent tune into international radio stations
(Table 79). Though radio has now lost its pre-eminent place with the advent of television,
international stations like BBC, Voice of America, Radio Moscow and Radio Ceylon
held sway over the people of the country for long. This explains the large listenership for
international stations.
g A significant number relies on local radio for district/ constituency news
When compared with newspapers, magazines and television, a larger segment of
38.2 per cent (Table 80) relies on local stations for news about their districts and
constituencies.
This may be attributed to the FM stations set up by All India Radio (AIR) in
virtually all districts. These stations broadcast local news, besides entertainment
programmes.
With newspapers and television, most respondents depend on State level
newspapers or channels for news about their constituencies.
However, 61.8 per cent of the respondents have said that they do not rely on
radio, be it local or State, for news about their constituencies.
g A majority listens to radio in the vehicle

A majority of 55.9 per cent listens to the radio in the vehicle (Table 81), while
25.5 per cent of the respondents tune in both at home and in the vehicle. Another 18.6 per
cent listen to the radio only at home. Being people�s representatives, the legislators are
constantly on the move. This explains why most respondents listen to the radio in the
vehicle.
g Politics is the first news priority among radio listeners
Though like television, radio is regarded as a medium of entertainment, Politics
remains the first priority with 67.6 per cent of the listeners (Table 82). This is followed
by Entertainment (27.4 per cent), Sports (2 per cent), Development News (2 per cent) and
Talk Shows (1 per cent). The study reveals that in the case of radio, a large chunk of 27.4
per cent has shifted from Politics to Entertainment.
Internet
g Usage of internet is low, though computer penetration is high
Among the respondents, 91.4 per cent have a computer at home or at office,
allotted by the government. Only 8.6 per cent are yet to be allotted a computer (Table
103). Though the penetration of computers is extremely high, only 23.8 per cent of the
legislators surf the internet (Table 104).
The usage of the internet is low though connectivity is available across the State,
through both public and private operators. The national average of internet usage at about

52 million users is also low when compared to the consumers of newspapers, magazines,
television and radio.
However, according to the National Association of Software and Service
Companies (NASSCOM), internet is the fastest expanding medium in India with the
growth expected to accelerate in the coming years.
Among the legislators who visit the web, 86.1 per cent are occasional users, while
13.9 per cent surf the internet regularly (Table 108). Only 25 per cent of the surfers spend
one hour and above on the net. While 38.9 per cent surf the net for 30 minutes to one
hour, 36.1 per cent hook on for less than 30 minutes (Table 109).
Though the web offers thousands of sites, 83.3 per cent of the net users visit only
1 to 2 sites while 16.7 per cent visit a maximum of 3 to 4 sites (Table 111).
This indicates that the interest in the internet is low not only among the total
respondents, but also among those who surf the web.
g Basavanagudi MLA sets an example in harnessing internet
While the response to internet is marked by a general lack of interest among the
respondents, there are some exceptions like Mr K. Chandrashekar, MLA from
Basavanagudi in Bangalore, who have exploited technology to the fullest. The MLA has
set up a website, which provides complete details of all households in his constituency.
The interactive site also enables the constituents to update information like pot holes on
roads or fused street lamps. This helps the legislator to receive feedback and initiate
corrective measures. The MLA also uses the internet to study the traffic management
system and infrastructure projects in different parts of the world.

g Politics is the first priority with internet users
Though the number of respondents who surf the net is small, Politics nevertheless
tops the list of priorities with 69.4 per cent of the users (Table 112). This is followed by
Information for Debates (11.1 per cent), Development News (8.3 per cent), Information
Technology (5.6 per cent), International News (2.8 per cent) and Religion (2.8 per cent).
g E-mail is not a popular mode of communication among the legislators
The legislators prefer traditional modes of communication, with most of them yet
to discover the efficacy of the e-mail, particularly in communicating with the urban
electorate.
Even among those who surf the internet, 19.4 per cent do not use the e-mail.
While 30.6 per cent of the respondents use the e-mail to communicate with their party
colleagues, 25 per cent correspond with their constituents and another 25 per cent use this
facility for personal communication (Table 115).
Besides the lack of interest among the legislators themselves, the low penetration
of internet in the country, especially in rural areas, explains the poor usage of e-mail.
Mobile Phones
g All respondents own a mobile phone, but only a small number downloads news
All the respondents (100 per cent) own a mobile phone (Table 116). They
primarily use the mobile for conversation. Among the respondents, 69.5 per cent do not
download news on the mobile (Table 117), as against 30.5 per cent who do.

Of the legislators who download news on the mobile phone, 76.1 per cent use
the facility occasionally, while 23.9 per cent use it regularly, (Table 118).
The fact that 30.5 per cent use the mobile for news downloads is another
indication of their unquenchable thirst for news. The mobile comes in handy especially
when the legislators are travelling.
g Use of SMS facility for political communication is low
Short Messaging Service (SMS) has become the fastest, easiest and the most
convenient way to communicate today. Political parties in India have extensively adopted
SMS to convey their message to the voters during all recent elections. However, 69.5 per
cent of the legislators do not use this facility, while only 30.5 per cent do (Table 119).
Among those who utilise this facility, a majority of 13.2 per cent uses SMS for
personal communication, mainly with family and friends, 8.6 per cent use it for political
communication which includes interacting with their party colleagues and constituents,
while another 8.6 per cent use SMS to forward jokes that they receive from friends.
Amongst the sea of communication channels hitting the people constantly, the
actual message usually gets lost. Unlike the mass media, SMS enables micro targeting,
which ensures that there is no spillover of the communication. SMS as a medium is all
pervasive, personal and direct as far as approaching the right target is concerned.
Though political parties in India have successfully employed the SMS to reach
out to their target audience, the legislators of Karnataka have displayed an apathy towards
this effective tool.
News Priorities Across Media
g Politics tops the list of news priorities of legislators across all media
Across print, electronic and new media, most respondents have mentioned Politics
as their first priority.
In newspapers, the highest number of respondents (96.7 per cent) has mentioned
Politics as their first priority, while the lowest number of 0.7 per cent has mentioned
International News (Table 31). While 22.5 per cent have mentioned Development News
as their second priority, the lowest number of legislators (1.3 per cent each) has
mentioned Women Issues and Information Technology (Table 32). A majority of 34.4 per
cent has mentioned Editorials as the third priority, while Environment News is indicated
by only 0.7 per cent (Table 33).
In the case of magazines too, a majority of 90.6 per cent has mentioned Politics as
their first priority, while the least number of respondents (1.3 per cent each), has
mentioned Women Issues and Columns/Editorials (Table 48). Development News tops
the list of second priorities with 24.2 per cent, while Politics is mentioned by 0.7 per cent
(Table 49). As a third priority, the highest number of respondents (19.5 per cent) has
opted for Entertainment, while the lowest number of legislators (0.7 per cent each) has
mentioned Women Issues and Business News (Table 50).
With television also, Politics is the first priority of 88.7 per cent of the legislators,
while Crime News, Legal Issues and Talk Shows are a priority with only 0.7 per cent
each (Table 62). While 39.1 per cent of the respondents have mentioned Sports as their
second priority, Women Issues and Environment Issues are mentioned by only 0.7 per
cent each (Table 63). Entertainment tops the list of third priorities with 33.8 per cent
mentioning it, while Politics and Business News come last with only 0.7 per cent each of
the respondents opting for them (Table 64).
In radio too, a majority of 67.6 per cent has mentioned Politics as their first
priority, while the lowest number of respondents (1 per cent) has mentioned Talk Shows
(Table 82). As a second priority, Sports is mentioned by 20.6 per cent, while only 2 per
cent have mentioned Business News (Table 83). Development News is mentioned by the
highest number of respondents (17.6 per cent), as a third priority while Crime News,
Sports and Environment News are mentioned by 1 per cent each (Table 84).
Even among the small number of internet users, Politics tops the list of first
priorities with 69.4 per cent.
g News regarding Information Technology does not interest the respondents
Though Bangalore is considered the Information Technology capital of the
country, news pertaining to this sector does not interest the legislators. Information
Technology is not mentioned as a first priority in any media. It is a second priority with
1.3 per cent in newspapers, 3.4 per cent in magazines, 1.3 per cent in television and none
in radio. It is a third priority with 6 per cent in newspapers, 6 per cent in magazines, none
in television and 2.9 per cent in radio (Table 98).
g Radio is the most favourite medium for entertainment
Among all media, the radio has emerged as the most favourite medium for
entertainment, with 27.4 per cent mentioning it as the first priority (Table 94). In
television, 3.3 per cent have mentioned Entertainment as the first priority, while it is none
in the case of newspapers and magazines.

The dependence of a large number of respondents on radio for entertainment may
be attributed to the launch of private FM channels in the country following the
deregulation of airwaves. The mobility offered by the radio has also contributed to this.
This is confirmed by the fact that a large number listens to the radio in their vehicle.
Media Utility
g Consumption of the newspaper by the legislators is the highest across all media
The usage of the newspaper is the highest across all media. All respondents read
newspapers and watch television (Chart 29). This is followed by magazines (98.7 per
cent), radio (67.5 per cent), mobile downloads (30.5 per cent) and internet (23.8 per cent).
Though 100 per cent of the respondents consume newspapers and television, the
regularity of usage of newspapers is the highest across all media (Chart 31). While 99.3
per cent of the respondents read newspapers regularly, 67.5 per cent watch television
regularly. The regularity of usage is comparatively low with magazines (55 per cent),
mobile downloads (23.9 per cent), radio (22.5 per cent) and internet (13.9 per cent).
In terms of the time spent on a medium too, newspapers top the list (Chart 32).
The number of respondents who read newspapers for one hour and above is 49.7 per cent,
while 44.3 per cent read magazines for one hour and above. While 40.4 per cent watch
television for one hour and above, 8.9 per cent tune into the radio for this period. Among
internet users, 25 per cent surf the web for one hour and above.
Similarly, only a small number spends less than 30 minutes on newspapers
compared to all other media.
Thus, newspapers score over magazines, radio, television, internet and mobile
downloads in terms of time spent on the medium and regularity of usage. The importance
attached to newspapers could be due to historical reasons, as radio and television are
recent entrants. Besides, the written word has always been regarded as the most credible.
Newspapers also offer the convenience of mobility. An MLA remarked: �I cannot
carry a 21-inch television with me.� As the legislators are constantly on the move, being
glued to the television is a luxury they cannot afford.
g Legislators rely on newspapers the most for news on Politics
It has emerged that news relating to Politics appeals to the legislators the most
across all media. Among them, the highest number (96.7 per cent) depends on newspaper
for Politics (Chart 33).
In the case of newspapers, the respondents are more defined in their first
priorities, with a majority mentioning Politics followed by Development News and
International News. In the case of magazines, television and radio, the first priority is
spread across several other news factors.
Thus, the usage of newspapers across all media as well as the dependence on
them for political news is the highest. Though 24-hour news and business channels are
available on the television, they have not succeeded in unsettling newspapers.
g Most respondents use the media to communicate with the people
Of the respondents, 97.4 per cent depend on the media to communicate with the
people. Only 2.6 per cent do not rely on the media (Table 120).
The legislators owe their existence to the people. With the voters being spread
across a large area, it is impossible for the legislators to keep in personal touch with their
constituents. Thus, the mass media facilitates effective communication with the voters.
The media is generally used by the legislators to protest against the lack of
developmental work in the region, to convey to the public the work undertaken by them
and to voice their views on various political developments. The media helps the
legislators to remain in the public mind.
g Legislators rely on newspapers the most to communicate with the people
A majority (59.6 per cent) relies on newspapers the most to communicate with the
people. While 27.2 per cent rely on both newspapers and television, 6.6 per cent depend
only on television and 4 per cent rely on newspapers, television and radio. Interestingly,
2.6 per cent do not rely on any medium to communicate with the people (Table 120).
As the consumption of newspapers is the highest among the respondents, it is
natural that they depend on this medium the most to communicate with the people.
g Respondents use the media to collate background information for debates
Of the respondents, 88.1 per cent utilise the media to collate background
information for debates in the legislature, while 11.9 per cent do not (Table 121).
Respondents liberally quote from media reports during debates in the legislature.
Background information and statistics sourced from the media add strength to the debate.
Besides the print and electronic media, a small number of respondents also surf the net
for background information.
g Respondents formulate their views based on media reports
The media plays a crucial role in moulding the views of the legislators. While
76.8 per cent have indicated that they formulate their views based on media reports, 23.2
per cent have said that they are not influenced by the media (Table 122).
g All respondents say that the media impacts their performance as legislators
The entire 100 per cent of the respondents say that the media impacts their
performance as legislators in one way or the other. From a set of four given factors, the
legislators were told to identify the single most important way in which the media helps
them to discharge their duties. While 37.7 per cent have said that the media helps them to
identify issues to be raised in the legislature, 25.8 per cent have said that the media helps
them to convey their message to their constituents. While 25.2 per cent have said that the
media provides them with feedback on their performance, 11.3 per cent have said that the
media helps them to exert pressure on the government (Table 123).
The proceedings of the legislature begin with the Question Hour, followed by the
Zero Hour. During the Zero Hour, the legislators are permitted to raise issues that have
appeared in the day�s newspapers. In addition, the media is also used to obtain
background information for debates. This explains the high dependence on the media.
As it is impossible for the legislators to be in personal touch with the constituents,
the media serves as a bridge between the two. While on the one hand, the media enables
the legislators to communicate with the people, on the other hand, it provides them with a
feedback on their performance.
The media is also used by the legislators regularly to wield pressure on the
government, particularly with regard to developmental works in their constituencies.

g Most legislators convene press conferences
The number of legislators who convene press conferences and issue press notes is
as high as 96.7 per cent (Table 124).
Though the legislators communicate with the people through various means like
public meetings and door-to-door campaigns, the media continues to remain the chief
tool. Convening press conferences or issuing press notes enable the legislators to address
the users of different media, be it newspapers, radio or television, at the same time.
Press conferences are convened at the district or constituency level, when local
issues need to be highlighted. However, when the legislators seek to draw the attention of
the government to long pending developmental work, press conferences are called at the
State capital.
Legislators also convene press conferences and issue press notes to convey their
views on various political developments.
g Most respondents do not rely on local media for constituency news
The dependence on local media is extremely low across newspapers, magazines,
television and radio (Chart 40). The dependence on the radio for local news is the highest
(38.2 per cent), among all media. This can be attributed to the All India Radio�s FM
stations at the district level.
While 75.5 per cent of the respondents depend on State or national level
newspapers for local news, only 24.5 per cent rely on local newspapers for news about
their districts and constituencies. While 0.7 per cent depend on magazines for district
news, the rest have said that there are no magazines catering to local regions.

In the case of television, a majority of 97.4 per cent depends on State level
channels for district or constituency news, while only 2.6 per cent rely on local cable
channels.
Thus, it is clear that the local media has lost its edge among the legislators.
Media Credibility
g Newspaper is the most credible medium across print, electronic and new media
Among the legislators, 84.8 per cent attach the most credibility to newspapers,
followed by television (13.2 per cent) and radio (2 per cent). No legislator has mentioned
internet and mobile downloads (Table 125).
Though all the respondents also watch television, their loyalty remains with a
traditional medium like the newspaper.
News on radio is not regarded as credible as it continues to remain in the clutches
of the government. Though the government has liberalised FM radio licensing, private
broadcasters can air only entertainment based programmes and not news.
Similarly, with the information available on the web being unreliable, the
legislators do not attach any credibility to it.
g The consumption level of a particular medium has a bearing on its credibility
The credibility perception of the legislators is influenced by the consumption
level of that particular medium.
Among the respondents, 99.3 per cent read newspaper regularly. Similarly, 84.8
per cent regard the newspaper as the most credible medium (Chart 37).

Among those who watch television, 67.5 per cent are regular viewers. Of the total
respondents, 13.2 per cent consider the television as the most reliable medium.
With only 22.5 per cent of regular users, radio is seen as credible by 2 per cent.
The total number of those using internet and mobile downloads is low. No
member attaches any credibility to these media.
Similarly, there appears to be a relation between the amount of time spent on a
medium and the credibility attached to it. With newspapers, 49.7 per cent spend one hour
and above, while only 3.3 per cent spend less than 30 minutes. The newspaper is found to
be the most credible medium by 84.8 per cent (Chart 39).
With television, 40.4 per cent spend one hour and above, while 17.2 per cent
spend below 30 minutes. The television is the most credible medium for 13.2 per cent.
Among radio listeners, 8.9 per cent tune in for one hour and above, while 67.3 per
cent spend below 30 minutes. Only 2 per cent regard the radio as credible.
Among the small number of respondents who surf the web, 25 per cent spend one
hour and above, but none of them attach any credibility to the internet.
g Most respondents regard the media as fair in its coverage of them
Most respondents consider the media to be fair in its coverage of them as
legislators (Table 128).
While 80.8 per cent are satisfied with the media�s coverage, 19.2 per cent feel that
the media is not fair in its coverage of them. Some respondents made sharp remarks like,
�The media is biased.� Such remarks were mostly directed against the local media.

Across Socio-Demographic and Economic Groups This study has taken into consideration various socio-demographic and economic
groups in order to ensure a fair representation to all sub-sets.
g Education level of the respondents and their media habits
The respondents fall into five education groups: below SSLC, SSLC and above,
graduates, postgraduates and professional degree holders. The findings indicate that the
media consumption among the lower education groups is as high as those with a higher
level of education.
In fact, with newspapers the largest segment of legislators reading 7 or more
newspapers is in the postgraduate group (53 per cent) and below SSLC group (50 per
cent). The remaining 50 per cent in the below SSLC group read 5 to 6 newspapers. In this
group, no respondent reads between 1 and 4 newspapers (Table 28).
The highest number of respondents reading 7 or more magazines (17.7 per cent) is
within the postgraduate group. Nobody in the below SSLC group reads 7 or more
magazines (Table 45).
In television, among those who watch 7 or more channels, 73.3 per cent are
within professional degree holders. All respondents in the below SSLC group watch
more than 5 channels (Table 59).
With radio, a majority listens to 1 to 2 stations across all educational groups
(Table 78).

The interest in news and current affairs transcends all barriers. As politicians are
public figures, it is inevitable but to keep themselves abreast of the latest developments.
Hence, the distribution is almost similar across various education groups.
g News Priorities of MLAs and MLCs
A common factor among the members of the Upper and Lower Houses of the
legislature is that Politics is the first priority for both. With newspapers, Politics is the
first priority among 98.3 per cent of MLAs and 91.4 per cent of MLCs (Table 34).
With magazines, Politics is the first priority with 90.4 per cent of the MLAs and
91.4 per cent of the MLCs (Table 51). In the case of television, Politics is mentioned by
88.8 per cent of MLAs and 88.6 per cent of MLCs (Table 65).
Though the Upper House is regarded as the House of Elders with representatives
from the teachers and graduates constituencies, most seats are cornered by active
politicians. As there is no qualitative difference between the members of the two Houses,
their pattern of media consumption and news priorities are similar.
g Media habits of legislators across different regions
Considering that there is no qualitative difference in the legislators belonging to
different regions, there is no significant variation in their pattern of media consumption.
For instance, a study of the credibility perception among legislators of the North
and the South of Karnataka does not reveal a major deviation, with both attaching the
most credibility to newspapers, followed by television and radio. Among legislators from

the South, 86.8 per cent attach the highest credibility to newspapers, while among those
from the North, 82.3 per cent rely on newspapers (Table 126).
g Media habits of legislators across different political parties
The study reveals that irrespective of their party affiliation, Politics is the first
news priority for a majority of the legislators.
The pattern of media consumption is similar among legislators belonging to
different parties. All members regard newspapers as the most credible medium followed
by television and radio (Table 127).
Within the Congress, 89.5 per cent of the respondents regard newspapers as the
most credible. It is 88.9 per cent within �Others�, 87.1 per cent within Janata Dal
(Secular) and 76.1 per cent within Bharatiya Janata Party.
In the case of the internet, most respondents across political parties do not surf the
net. The largest number of internet users is within the Congress at 35.1 per cent and the
lowest number is within the JDS at 10.3 per cent (Table 105).
Similarly, in all political parties, most respondents do not use the SMS facility on
their mobile phones. The highest number of respondents who do not use this facility is
within JDS at 87.2 per cent and the lowest is within BJP at 58.7 per cent (Table 119).
g Media habits of the legislators between gender
As all the legislators are in the business of politics, a certain degree of uniformity
is observed in their media habits. Irrespective of the gender, Politics is the first news
priority in print, electronic and new media, both with male and female respondents.

In newspapers, Politics is the first priority with 96.5 per cent of the male
respondents and 100 per cent of the female respondents (Table 31).
With magazines, it is 91.4 per cent with men and 80 per cent with women (Table
48). Here, a perceptible shift is seen towards Women Issues in the case of women. This is
due to the large number of magazines devoted to Women Issues.
In the case of television, 89.4 per cent of the men have mentioned Politics, while
among women it is 80 per cent (Table 62).
With radio, Politics is mentioned as the first news priority by 68.4 per cent of the
men and 57.1 per cent of the women (Table 82). Here, a shift towards Entertainment is
noticed both in the case of male (26.3 per cent) and female respondents (42.9 per cent).
The study reveals that most of the male (75.2 per cent) and female respondents
(90 per cent) do not surf the web (Table 107).
g Media habits of the legislators across age group
The highest media consumption is found within the 66-75 age group. This could
be because they are politically less active than the younger generation and as such have
more time at hand.
With newspapers, 100 per cent of respondents in the 66-75 age group read 7 or
more newspapers, while the distribution pattern among the other age groups is almost
similar (Table 27).
Magazines too are read regularly by 100 per cent of the respondents in the 66-75
age group (Table 41), while the lowest number of respondents reading magazines
regularly is in the 46-55 age group (48.5 per cent).
With radio, the highest number of respondents who tune regularly is in the 25-35
age group (44.4 per cent), while the lowest number is in the 46-55 age group at 11.4 per
cent (Table 74). With FM channels catering mainly to the youth, radio has attracted a
larger number of audiences in the younger generation.
g Media habits of the legislators across income groups
The economic profile of the legislators presents a picture of homogeneity. The
official emoluments of the legislators are governed by the Karnataka Legislature Salaries,
Pensions and Allowances Act, 1956, as amended in the year 2005.
All legislators are paid a monthly compensation of Rs 27,000 inclusive of salary
and other allowances. They are also entitled to Rs 5000 to Rs 10,000 as pension
depending on the number of years of service as legislators, free road travel by public
transport and medical treatment for self and family at designated hospitals, travel
allowance of Rs 10 per km and a sitting fee of Rs 600 per day during the legislature
session and other official meetings.
Thus, uniformity exists in the economic profile on this count. Considering this
uniformity, the question of analysing the media pattern across different income groups
does not arise.
As regards the other sources of income, the credibility of the information
provided could not be verified.
However, the study has revealed that the pattern of media habits is consistent
across various demographic groups as all the respondents are politicians.

Conclusion
The study reveals that the consumption of the media is extremely high among the
legislators of Karnataka. In terms of degree of consumption, the usage of newspapers is
the highest, followed by television, magazines and radio.
The study indicates that the respondents do not attach much importance to new
media like internet and news downloads through the mobile phone.
Though a majority of the respondents have been allotted a computer by the
government, the number of legislators surfing the net is insignificant. The usage of e-mail
as a tool of communication is abysmally low.
All the respondents use a mobile phone, but only a small number downloads news
through these devices. The number of respondents employing the Short Messaging
Service (SMS) as a mode of communication is also not high.
All the respondents agree that the media impacts their performance as legislators
in one way or the other, particularly with regard to communicating with the people,
exerting pressure on the government, receiving feedback from the public and collating
background information for debates.
Most respondents consider the media as credible. The respondents attach the most
credibility to newspapers, followed by television and radio.
Significantly, most respondents do not rely on local media for news about their
districts and constituencies. The legislators largely depend on State level media even for
local news.
The study indicates that a majority of the respondents also regard the media as fair
in its coverage of them as legislators.

SUGGESTIONS
1. The study clearly establishes the media habits of the legislators of Karnataka.
With this foundation, it will be appropriate to conduct a study on the agenda
setting role of the media vis-à-vis the MLAs and MLCs. Similarly, it also needs
to be examined if the legislators set the agenda for the media.
2. Karnataka and Andhra Pradesh have established themselves as hubs of
Information Technology. This study highlights the apathy of the Karnataka
legislators towards the internet as a medium of communication. Against this
background, the interest level of the legislators of Andhra Pradesh may be
explored.
3. A similar study may be conducted at a future date to understand if there is a
difference in the pattern of consumption of new media among the legislators, in
course of time.
4. Based on this work, a comparative study of media habits of legislators in other
States may be undertaken to understand the consumption pattern across different
regions of the country.
5. A comparative study of female legislators in different States will help understand
their pattern of media consumption and news priorities.
ggg

REFERENCES
Adnan, M H H, and K Kaur. �A Content Analysis of Business and Economic News
Coverage in Malaysian Newspapers.� Forum Komunikasi 2 (1991).
Ahuja, B.N. History of Press, Press Laws and Communications. Surjeet Publications,
1998.
Alger, Dean E. The Media in Politics. Prentice Hall Inc, 1989.
Alterman, Eric. What Liberal Media?: The Truth About Bias and the News. Reprint ed.
Basic Books, 2004.
Anderson, James A. Communication Research Issues and Methods. New York:
McGraw-Hill, Inc., 1987.
Arthikaje. Karnataka History, the Kadambas of Banavasi. Our Karnataka.com. 08 Feb.
2005 < http://www.ourkarnataka.com/states/history/historyofkarnataka10.htm>.
Awasthy, G.C. Broadcasting in India. Mumbai: Allied Publishers Pvt., Ltd., 1965.
Bae, Hyuhn-Suhck. �Product Differentiation in Cable Programming: The Case in the
Cable National All-News Networks.� Journal of Media Economics 12 (1999).
Barber, Phil. A Brief History of Newspapers. 01 Jan. 2005. Phil Barber. 09 Feb. 2005
<http://www.historicpages.com/nprhist.htm>.
Baruah, U.L. This is All India Radio. New Delhi: Publications Division, Ministry of
Information and Broadcasting, 1983.
Bennett, W L. �Toward a Theory of Press-State Relations in the United States.� Journal
of Communication 40 (1990).
Berkowitz, Dan. Who Sets the Media Agenda? The Ability of Policy Makers to
Determine News Decisions. Praeger Publishers, 1992.
Beyond Books. The Media and Politics. 06 Jan. 2005. Apex Learning Inc. 08 Feb. 2005
<http://http://www.beyondbooks.com/gop00/4.asp>.
Beyond Books. Newspapers in Politics. 06 Jan. 2005. Apex Learning Inc. 08 Feb. 2005
<http://www.beyondbooks.com/gop00/4a.asp>.
Beyond Books. Television in Politics. 06 Jan 2005. Apex Learning Inc. 08 Feb. 2005
< http://www.beyondbooks.com/gop00/4c.asp>.
Beyond Books. Radio in Politics. 06 Jan 2005. Apex Learning Inc. 08 Feb. 2005
<http://www.beyondbooks.com/gop00/4b.asp>.

Beyond Books. The Internet in Politics. 06 Jan 2005. Apex Learning Inc. 08 Feb. 2005
<http://www.beyondbooks.com/gop00/4d.asp>.
Bimber, Bruce A, and Richard Davis. Campaigning Online: The Internet in U.S.
Elections. Oxford UP, 2003.
Blain, Cameron. �Television News Crawls and Their Effects on Memory of Verbal
Message.� Journalism and Mass Communication Quarterly. (2002).
Boeyink, D E. �Analyzing Newspaper Editorials: Are the Arguments Consistent?�
Newspaper Research Journal 13/14 (1993/94).
Brass, Paul R., and Gordon Gordon Johnson. The Politics of India Since Independence.
2nd ed. Cambridge UP, 1994.
Brewer, M, and Marshall McCombs. �Setting the Community Agenda.� Journalism &
Mass Communication Quarterly 73 (1996).
Brosius, Hans-Bernd, and Hans Mathias Kepplinger. �Beyond Agenda Setting: The
Influence of Partisanships and Television Reporting on the Electorate�s Voting
Intentions.� Journalism Quarterly. (1992)

Brown, Carrie. The Challenges of Public Journalism: An Analysis of The Philadelphia
Inquirer�s Efforts to Better Connect with a Diverse Community. Doctoral Thesis.
University of Pennsylvania, 2001.
Brown, Robert J. Manipulating The Ether: The Power Of Broadcast Radio In Thirties
America. McFarland & Co Inc Pub, 2004.
Bernt , Joseph P., Guido H. Guido H. Stempel III, and Thomas Hargrove. �Relation of
Growth of Use of the Internet to Changes in Media Use from 1995 to 1999.�
Journalism and Mass Communication Quarterly. Spring (2000).
�Canadian Politicians Look to Engage Young Voters with Text Messaging.� The
Edmonton Journal 19 Apr. 2004. 30 May 2005.
<http://www.clickatell.com/brochure/sms_industry/politics.php>.
�Cell phones Play Important Role in Upcoming Indian Elections.� English Worldwide.
Voice of America. 24 Mar. 2004. 30 May 2005
<http://www1.voanews.com/article.cfm?objectID=58D3480A-4A4C-4CE9-93
AD0F60F55135D7>.
Choi Marina , Sejung , and Hyun Soon Park. �Focus Group Interviews: The Internet As
A Political Campaign Medium.� Public Relations Quarterly 2002 (47): 1.

Chomsky, Naom. Necessary Illusions: Thought Control in Democratic Societies. South
End Press, 1989.
Cook, F L, T R Tyler, E G Goetz, M T Gordon, D Leff, and H L Mulotch. �Media and
Agenda Setting: Effects on the Public, Interest Group Leaders, Policy Makers,
and Policy.� Public Opinion Quarterly 47 (1983).
�Credibility.� American Society of Newspaper Editors. 19 July 2002. 03 Jan. 2006
<http://www.asne.org/credibilityhandbook/introduction.htm>.
Das Basu, Durga. Law of the Press. 2end ed. Prentice-Hall of India Pvt Ltd, 1986.
Davie, W R, and J S Lee. �Television News Technology: Do More Sources Mean Less
Diversity?� Journal of Broadcasting and Electronic Media 37 (1993).
Davis, Richard. The Web of Politics: The Internet�s Impact on the American Political
System. New York: Oxford UP, 1999.
Davis, Richard, and Diana Owen. New Media and American Politics. New York: Oxford
University Press. 1998.
De Zengotita, Thomas. Mediated : How the Media Shapes Your World and the Way You
Live in It. Bloomsbury USA, 2005.
Donsbach, W. �Media Thrust in the German Bundestag Election.� Political
Communication 14 (1997).
Dwyer, Rachel, and Christopher Pinney. Pleasure and the Nation : The History, Politics
and Consumption of Public Culture in India. School of Oriental and African
Studies, 2001.
Ellen, Mickiewicz. �Split Signals: Television and Politics in the Soviet Union.� Canadian
Journal of Communication 17 (1991).
Fairley Raney, Rebecca. �Beyond Campaign Sites: Politicians Seek Support for
Legislation Online.� The New York Times 18 Apr. 1999. 16 May 2005
<http://www.politicsonline.com/coverage/nytimes3/>.
Folkerts, Jean, and Stephen Lacy. Media in Your Life, An Introduction to Mass
Communication. Allyn and Bacon. 2004
Franda, Marcus. China and India Online: The Politics of Information Technology in the
World�s Largest Nations. Rowman & Littlefield, Inc., 2002.
Graber, Doris A. Mass Media and American Politics. 6eth ed. CQ P, 2001.

Hacker, K L. �Uses of Computer-Mediated Political Communication in the 1992
Presidential Campaign: A Content Analysis of the Bush, Clinton and Perot
Computer Lists.� Communication Research Reports 13(2) (1996).
Hallin, D C. �Sound Bite News: Television Coverage of Elections, 1968-1988.� Journal
of Communication 42 (1992).
Hanumanthaiah, Te. History of Karnataka Legislature. Vol. 1. Bangalore: Government
Printing Press.
Hardt, Hanno. Teractions: Critical Studies in Communication, Media, and Journalism
Rowman & Littlefield, Inc., 1998.
Hegde, Ramakrishna. Hegde 75 Thoughts and Vision (Collection of Speeches and
Articles). Hegde 75 Felicitation Committee, 2001.
Herman, Edward S, and Naom Chomsky. Manufacturing Consent: The Political
Economy of the Mass Media. Pantheon Books, 2002.
Hoerrner, Keisha L. �Symbolic Politics: Congressional Interest in Television Violence
from 1950 to 1996.� Journalism and Mass Communication Quarterly. Winter
(1999).

Hess, Stephen. �Credibility: Does It Drive The Bottom Line.� Newspaper Association of
America. 4 Jan. 2006 <http://www.naa.org/presstime/9807/cred.html>.
�India's New Age Election Campaign.� BBC News World Edition. British Broadcasting
Corporation. 23 Nov. 2003. 18 May 2005
<http://news.bbc.co.uk/2/hi/south_asia/3223646.stm>.
�Indian Election Campaigners Target Voters Through Their Mobiles.� The World Today.
ABC Local Radio. 4 Dec. 203. 18 May 2005
<http://www.abc.net.au/worldtoday/content/2003/s1003626.htm>.
Indiantelevision.com. History of Indian Television, 08 Feb. 2005. Indian Television Dot
Com Pvt Ltd. 08 Feb. 2005
< http://www.indiantelevision.com/indianbrodcast/history/historyoftele.htm>
Israel, Milton. Communications and Power: Propaganda and the Press in the Indian
National Struggle, 1920-1947. Cambridge: Cambridge University Press, 1994.
James Fallows, James. Breaking The News : How the Media Undermine American
Democracy. Vintage, 1997.
Jeffrey, Robin. India�s Newspaper Revolution: Capitalism, Politics and the Indian
Language Press, 1977-1999. Palgrave Macmillan, 2000.

Johnston, Donald H. Journalism and the Media: An Introduction to Mass
Communications. 1st ed. Barnes & Noble Books, 1979.
Kapur, A.C. Principles of Political Science. S. Chand and Company. 15th ed. 1986.
Kennamer, David J. Public Opinion, The Press, and Public Policy. Praeger Publishers,
1992.
Khilnani, Sunil. The Idea of India. Farrar, Straus and Giroux, 1999.
Krishnamurthy, Nadig. Indian Journalism. Mysore: Prasaranga, 1966.
Kumar, Keval J. Mass Communication in India. 5th ed. Jaico House, 1993.
Kumar, Keval J. Mass Communication in India: A Comprehensive and Critical Look at
the Mass Media in India. 1st ed. Jaico, 1987.
Lambert, Richard D., and Alan W. Heston. The Annals. Cambridge: The American
Academy of Political and Social Science, 1976.
Lang, Gladys Engel, and Kurt K. Lang. Television and Politics. New Jersey: Transaction,
2001.

Lee Kaid, Lynda. �Political Advertising and Information Seeking: Comparing Exposure
via Traditional and Internet Channels.� Journal of Advertising 31 (2002): 1.
Ling, Rich. The Mobile Connection : The Cell Phone�s Impact on Society.
3rd ed. Morgan Kaufmann, 2004.
Lippmann, Walter. Public Opinion. Touchstone Books, 1997.
Lucht, Tracy. Media Cynicism and Political Efficacy during the 1992 and 1996
Presidential Campaigns: A Time-Ordered Model. Doctoral Thesis. Iowa State
University, 2001.
Mabry, Jennifer Elizabeth. Youth and Media. Television. Developmental
Communication, Perception, Media Use, Violence. Media Effects. Cultural
Studies. Framing. Audience Analysis. Doctoral Thesis. University of Maryland,
1997
Maier, Timothy W. News Media�s Credibility Crumbling. 08 May 2004. WorldNetDaily.
21 June 2005
<http://www.worldnetdaily.com/news/article.asp?ARTICLE_ID=38398>.
Mali, Kundan. Fundamentals of Research Methodology. DK Distributors, 1988.

Manmohan, Singh. Prime Minister�s Speech. 30th Anniversary of Business Standard.
New Delhi, Delhi. 24 Mar. 2005. 11 July 2005
<http://pmindia.nic.in/speech/content.asp?id=108>.
McChesney, Robert W. The Problem of the Media: U.S. Communication Politics in the
Twenty-First Century. Monthly Review P, 2004.
McCombs, Maxwell, and David L Protess. Agenda Setting: Readings on Media, Public
Opinion and Policy Making. Hillsdale, New Jersey: Lawrence Erlbaum
Associates, 1991.
McGann, Rob. ClickZ Network. 6 Mar. 2005. Jupiter Media Corporation. 1 June 2005
<http://www.clickz.com/stats/sectors/government/article.php/3487866>.
Mcluhan, Marshall, and Quentin Fiore. The Medium is the Message. Gingko P, 2005.
Marshall, Richard E. �The Century in Political Cartoons.� Columbia Journalism Review
May/June (1999).
Merrill, John C., and Ralph L. Lowenstein. Media Messages and Men. New York: David
McKay, 1971.

Mims Rowe, Sandra. �Leading the Way Out of the Credibility Crisis.� 4 Jan. 1998. The
Freedom Foundation. 15 Jan. 2006
<http://www.freedomforum.org/templates/document.asp?documentID=7668>.
�MP Message Flood.� The Herald Sun 5 Dec. 2004. 30 May 2005
<http://www.clickatell.com/brochure/sms_industry/politics.php>.
Mytton, Graham. Handbook on Radio and Television Audience Research. BBC World
Service Training Trust, UNESCO, and UNICEF (joint publication), 1999.
Nalwa, Vanit. Abc Of Research. DK Distributors, 1992.
Niven, David. Tilt? The Search for Media Bias. Westport, CT: Praeger, 2002.
Nimmo, Dan. Political Communication and Public Opinion in America. California:
Goodyear Company, 1978.
Norris, Pippa. Women, Media and Politics. New York: Oxford UP., 1997.
Parenti, Michael. Inventing Reality : The Politics of News Media. 2nd ed. Wadsworth,
1992.

Paletz, David. Media in American Politics: The Contents and Consequences. 2nd ed,
Longman, 2002.
Paletz, David L., Peggy Reichert, and Barbara McIntyre. �How the Media Support Local
Governmental Authority.� Public Opinion Quarterly (1971).
Perloff, Richard M. Political Communication: Politics, Press, and Public in America.
Mahwah, NJ.: Lawrence Erlbaum Associates. 1998.
Personalities Dominate Election Coverage . 21 June 2005. Indiantelevision.com. 21 June
2005 <http://www.indiantelevision.com/special/y2k4/electioncoverage.htm>.
Purvis, Hoyt. The Media, Politics, and Government. 1st ed. Wadsworth, 2000.
Rajgopal, Arvind. Politics After Television: Hindu Nationalism and the Reshaping of
Public Opinion in India. Cambridge University Press, 2001.
Rao, Bhaskara N., and G N S Raghavan. Social Effects of Mass Media in India. South
Asia Books, 1996.
RSGB Today. The Early History of Radio, 22 Jan. 2005. G4NJH Pages. 08 Feb. 2005
<http://homepage.ntlworld.com/g4njh2/index.html www.alpcom.it/hamradio/>.

S, Coleman. 2001: Cyber Space Odyssey. The Internet in the UK Election. 21 July 2001.
Hansard Society. 1 June 2005 <http://www.eldis.org/static/DOC12032.htm>.
Shetti, Pattan C C. Introduction to Research Methods in Social Science. DK Distributors,
1981.
Soroka, Stuart N. Agenda-Setting Dynamics in Canada. University of British Colombia,
2002.
Spring, Tom . Comic Strip A Reflection of Society. 03 Jan. 1995. 1 June 2005
<http://www.osu.edu/osu/newsrel/Archive/95-01-03_Comics_Reflect_Society>.
Srivastava, Siddharth. Indian Elections: The High-Tech Way. 8 Apr. 2004. Asia Times
Online. 18 May 2005
<http://www.atimes.com/atimes/South_Asia/FD08Df04.html>.
Staff Correspondent. �Govt Planning to Set Up Media Commission, says Jaipal Reddy.�
The Hindu 2 July 2005. 25 July 2005
<http://www.hindu.com/2005/07/02/stories/2005070204860500.htm>.
Stephens, Mitchell. �History of Newspapers.� Collier�s Encyclopedia. 08 Feb. 2005
<http://www.nyu.edu/classes/stephens/Collier's%20page.htm>.

Stephens, Mitchell. �History of Television.� Collier�s Encyclopedia. 08 Feb. 2005
<http://www.nyu.edu/classes/stephens/History%20of%20Television%20page.
htm>.
Sterling Christopher H, and John M. Kittross, Stay Tuned: A Concise History of
American Broadcasting, 2nd ed. Wadsworth, 1990
Tipton, L, Heney R, and J Baseheart. �Media Agenda Setting in City and State Election
Campaign.� Journalism Quarterly 52 (1975).
Truman, David B. The Governmental Process: Political Interests and Public Opinion.
Knopf, 1951
Viguerie, Richard A, David Franke, and Tim Lahaye. America�s Right Turn: How
Conservatives Used New and Alternative Media to Take Power. Chicago: Bonus
Books, 2004.
Wallace, Paul, and Ramashray Roy. India�s 1999 Elections and 20th Century Politics.
London: Sage Publications Ltd, 2003.
Woodward, Gary C. Perspectives on American Political Media, Allyn and Bacon, 1997.
ggg

UNIVERSITY OF MYSORE DEPARTMENT OF COMMUNICATION AND JOURNALISM
Name: ________________________________________________ Age Group:
€ 25-35 € 36-45 € 46-55
€ 56-65 € 66-75 € Above 75
Gender: € Male € Female Education: € Below SSLC level € SSLC level and above € Graduate
€ Postgraduate €Professional Course
Constituency and District: _____________________________
Party Affiliation: € Congress € JDS € JDU € BJP € Independent € Others

NEWSPAPER 1. Do you subscribe to newspapers? € Yes € No 2. How regularly do you read newspapers?
€ Regularly Occasionally Never read 3. How much time in a day do you spend on newspapers? € One hour and above € 30 minutes to one hour € Less than 30 minutes 4. What is the language of the newspaper that you read? € Kannada € English € Hindi € Urdu € Tamil € Telugu € Others ____________ 5. Name the newspapers that you read regularly? € Prajavani €Vijaya Karnataka € Samyukta Karnataka € Kannada Prabha € Suryodaya € Udayavani € Sanjevani € E Sanje € The Times of India € Deccan Herald € The Hindu € Vijay Times € The New Indian Express € The Asian Age € The Economic Times € Financial Express € Business Standard € The Hindu Business Line € Others ____________________

6. Do you read international newspapers? If yes, please name them. € The International Herald Tribune € The Washington Post € The Economist € Daily Mirror € Sunday Observor € Others ________________ 7. What do you generally read in a newspaper? List any three of the following in order of priority. € Politics € Crime News € Sports € Business News € Legal Issues € Information Technology € Women Issues € Development News € International News € Columns € Environmental Issues € Editorials € Entertainment € Others _____________________
1. __________________________________ 2. __________________________________ 3. __________________________________ 8. Name the newspaper that you rely on for local news. � Local newspaper: ________________________ � State level newspaper: ____________________ 9. Do you enjoy comic strips in newspapers? € Yes € No

MAGAZINES 10. Do you subscribe to magazines? € Yes € No 11. How often do you read magazines? € Regularly € Occasionally € Never 12. How much time in a week do you spend on magazines? € One hour or more € 30 minutes to one hour € Less than 30 minutes 13. What is the language of the magazine that you read? € Kannada € English € Hindi € Urdu € Tamil € Telugu € Others ____________ 14. What magazines do you read? € Taranga € Roopatara € Mayura € Tushara € Sudha € India Today € Outlook € Frontline € The Week € Business World € Sports Star € Sports World € Reader�s Digest € Savvy € Society € Woman�s Era € Femina € Cosmopolitan € Film Fare € Star Dust € Others ________ 15. Do you read international magazines? If yes, name them. € Time € Asiaweek € Newsweek € Others ___________

16. What do you generally read in a magazine? List any three of the following in order of priority.
€ Politics € Crime News € Sports € Business News € Legal Issues € Information Technology € Women Issues € Development News € International News € Columns € Environmental Issues € Entertainment € Others ___________________
1. __________________________________ 2. __________________________________ 3. __________________________________ 17. Name the magazine that you rely on for local news. � Local magazine: _________________________ � State level magazine: _____________________ TELEVISION 18. Do you have a television at home? € Yes € No 19. Do you have cable connection at home? € Yes € No

20. Do you subscribe to DTH service? € Yes € No 21. How regularly do you watch television? € Regularly € Occasionally € Never 22. How much time do you spend on television in a day? € One hour and above € 30 minutes to one hour € Less than 30 minutes 23. What is the language of the channel that you watch? € Kannada € English € Hindi € Urdu € Tamil € Telugu € Others _____________ 24. What channels do you watch regularly? € Udaya News € Udaya TV € ETV Kannada € Doordarshan Kannada € Chandana € Ushe € NDTV 24/7 € Headlines Today € Doordarshan National € Zee News € Aaj Tak € Star News € NDTV Hindi € Sony € Sahara € Zoom € ZMZ € Star Movies € Others _____________________

25. What international channels do you watch? € CNN € BBC € CNBC € AXN € National Geographic € Discovery € FTV € Trends € Cartoon Network € Pogo € Others ____________________ 26. What do you generally watch on Television? List any three of the following in order of priority.
€ Politics € Crime News € Sports € Business News € Legal Issues € Information Technology € Women Issues € Development News € International News € Talk Shows € Environmental Issues € Entertainment (Serials, etc) € Others _____________________
1. __________________________________ 2. __________________________________ 3. __________________________________ 27. What channel do you rely on for local news? � Local cable channel: ______________________ � State level channel: _______________________
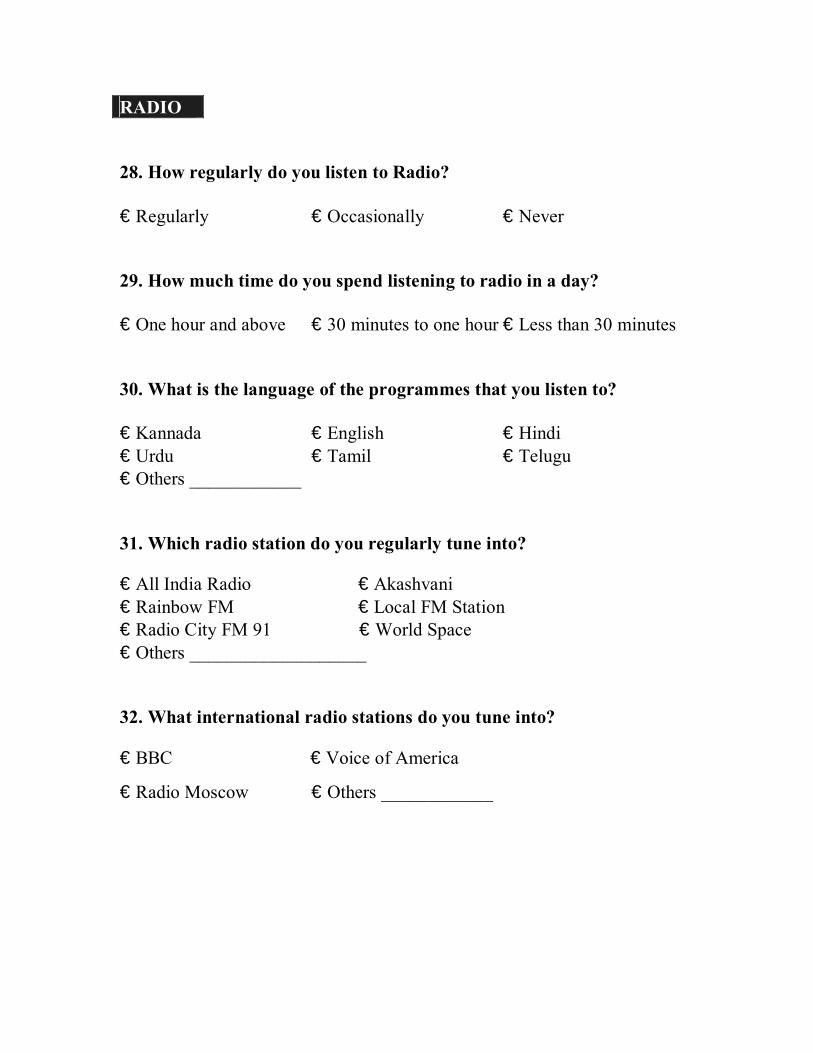
RADIO 28. How regularly do you listen to Radio? € Regularly € Occasionally € Never 29. How much time do you spend listening to radio in a day? € One hour and above € 30 minutes to one hour € Less than 30 minutes 30. What is the language of the programmes that you listen to? € Kannada € English € Hindi € Urdu € Tamil € Telugu € Others ____________ 31. Which radio station do you regularly tune into? € All India Radio € Akashvani € Rainbow FM € Local FM Station € Radio City FM 91 € World Space € Others ___________________ 32. What international radio stations do you tune into? € BBC € Voice of America
€ Radio Moscow € Others ____________

33. What do you regularly listen to on radio? List any three of the following in order of priority. € Politics € Crime News € Sports € Business News € Legal Issues € Information Technology € Women Issues € Development News € International News € Talk Shows € Environmental Issues € Entertainment (Music, etc) € Talks € Others _______________
1. __________________________________ 2. __________________________________ 3. __________________________________ 34. Name the radio station that you rely on most for local news. � Local FM station: ________________________ � State level station: ________________________ 35. Where do you listen to radio? € At home € In the vehicle € Others ___________

INTERNET 36. Do you have a computer at home/office? € Yes € No 37. Do you surf the Internet? € Yes € No 38. How often do you surf the Net? € Regularly € Occasionally € Never 39. How much time do you spend on the Net every day? € One hour and above € 30 minutes to one hour € Less than 30 minutes 40. What are the sites that you visit? € Rediff.com € Indiatimes.com € NDTV.com € BBC.com € CNN.com € Others _____________ 41. If you have an email ID what purpose do you use it for? € To enable my constituents to contact me € To communicate with bureaucrats and colleagues € I do not use this facility

42. What kind of news do you look for on the Net? List any three of the following in order of priority.
€ Politics € Crime News € Sports € Business News € Legal Issues € Information Technology € Women Issues € Development News € International News € Agriculture News € Environmental Issues € Entertainment News € Background news for debates in legislature € Others _______________
1. __________________________________ 2. __________________________________ 3. __________________________________ MOBILE PHONE 43. Do you use a mobile phone? € Yes € No 44. What do you generally use your mobile phone for? € For conversation € To download news

45. How often do you download news through your mobile? € Daily € Occasionally € Never 46. What do you use SMS for? € Political communication € To forward jokes € Others ________________ € Do not use this facility MEDIA UTILITY 47. Which news medium do you attach the most credibility to? € Newspapers € Television € Radio € Internet € Mobile downloads 48. Do you formulate your views based on media reports? € Yes € No 49. Do you convene press conferences / issue press notes to convey your views to the public? € Yes € No 50. Do you think the media is fair in its coverage of you as a legislator? € Yes € No

51. Which medium do you rely on most to communicate with the people? € Newspapers € Television € Radio € Internet € Mobile downloads 52. Do you utilise the media to collate information that you can use during debates in the legislature? € Yes € No 53. How does the media impact your performance as a legislator? € It helps me to identify issues to be raised in the legislature € It helps me to convey my message to my constituents € It helps me exert pressure on the government € It gives me a feedback on my performance
▪ ▪ ▪