Æm 2– 5.1 the area and distance problems mao-pei tsui
TRANSCRIPT

ÆM⌃2– 5.1 The Area and DistanceProblems
⇥˘ Mao-Pei Tsui
˙'xx˚
November 16, 2021

Plan of the this lecture
In this video, we will discuss the materials in 5.1 The Area andDistance Problems. The topics are:1. Area approximation
2. What is the area of the region under the curve of y = f (x)?
3. example
4. Distance problem.
¥417K "="tp{É ¥4417h2.

KA } 4% Tan 9117-114.0046=30
d- § 35% 12/2 , 1416, 12/30
fykq.to/bigFYnB.Yo2%eaihLf1&( Three offroadWebowurk Go
48517%+118 .

The first major problem in calculus was the tangent lineproblem.
We now turn to the second major problem in calculus, the areaproblem.
We saw that the derivative solved the tangent line problem andit turns out that the anti-derivative solves the area problem.

Let f (x) be a non-negative, continuous function on the interval[a, b]. The area problem asks us to find the area under thegraph of y = f (x) over the interval [a,b].
€130

Let us start with some simple regions first.
The area of a trapezoid can be found by the following formula.fig #}

Example: Let m > 0 and b > 0. Let R be the region boundedby t = 0, t = x , 0 y mt + b. What is the area of R?
y
.
• f-mttb
(b✗+⇒"
'"" 1/1/14, / )→
mx-ib-b-mx.ee?iArea=?fib-aj:Fo=XlzCbtmx-b) . ✗ III = b. F&£=mx+b
= bx + Imi→ anti- derivative of btmx

Example: Let R be the region bounded by x = �2, x = 2,0 y
p4 � x2. What is the area of R?
→f- F-*I
☒y2=4=5
fx.TK = ta r'
= £1.2429

Example: Let R be the region bounded by x = 0, x = 2,0 y x2. What is the area of R? How to estimate the area ofR?
C
yet← fix
4- 1height 22
: ☒ firs '¥k÷B¥s* i⇐i[É, Tina/ I 'a ⇒
E.EE ! ¥¥ik☒£i¥.
⑦I¥= ? ÷ i ÷
qq.qzi.p.ua ,☐↳⇒aa☒EnK*"☒ 4917%31=13 '¥_¥EÉ .
ZEPHFEEL Approximated area_- t.tt 1+1.9=+1-2.4

Approximated area using 4 rectangles¥4 + til + E- -9 + E- 4= -5-4=9+1.6= f- -- ¥"
Ess area"
< ¥
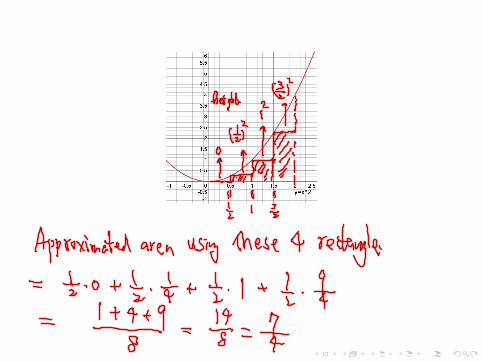
height p-4¥,
¥.÷i¥¥¥ i ÷
Approximated area using these 4 rectangle.= t.o-tg.ie + £ . I + £ . -9¢=
'
¥+9 = ¥ =¥

.¥¥*Aven
¥ < Areas ¥

We can use the area of 20 rectangles to give an lower andupper estimate of the area of the region R. This is a betterestimate than using 4 rectangles.
https://www.geogebra.org/m/Wa4zJdNd
We can use more and more smaller rectangles to give a betterapproximation of the area of the region R. Next we look at itmore systematically.
=§""

To find the exact area under the curve we will need to useinfinitely many rectangles. This will lead us into the next sectionon the Definite Integral. For now, we begin with a specialnotation that will allow us to write the sum of the areas of manyrectangles in a compact form.
Summation NotationIn mathematics, the symbol
Pis used to denote summation.
Definition: Summation NotationPni=1 ai = a1 + a2 + · · ·+ an. The parameter i is called the
index of summation and it begins at the indicated value, i = 1 inthis case; and it increments by one unit until it reaches theterminal value (in this case, n).
Arena III. ftreaotn approximatelyrectangle
-
Sigma.

Example:P4
i=1(i2 + 3)
= (1+3)+ (22 +3)+ (32 +3)+ (42 +3) = 4+7+12+19 = 42.
P7i=2(2i + 5)
= (2·2+5)+(2·3+5)+(2·4+5)+(2·5+5)+(2·6+5)+(2·7+5)= 9 + 11 + 13 + 15 + 17 + 19 = 84.

TheoremPni=1 1 = 1 + 1 + 1 + · · ·+ 1 = n.
Pni=1 i = 1 + 2 + 3 + · · ·+ n = n(n+1)
2 .
Pni=1 i2 = 12 + 22 + 32 + · · ·+ n2 = n(n+1)(2n+1)
6 .
Pni=1 i3 = 13 + 23 + 33 + · · ·+ n3 = n2(n+1)2
4 .
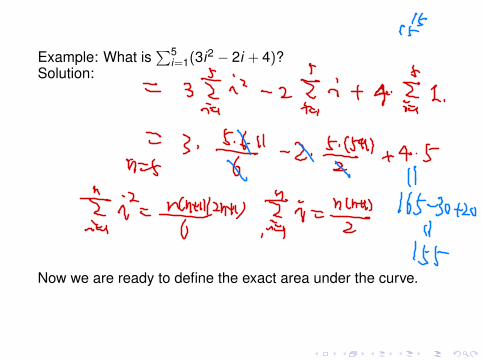
Example: What isP5
i=1(3i2 � 2i + 4)?Solution:
Now we are ready to define the exact area under the curve.
¥
1- t= 3£ i - z 2- it # ¥
,
2.
5=1 it,
= 3 . ¥-11- d. ¥541 +4-5n=f 61 "
E- ii.= ¥1112M ¥,ñ=¥" 165-30-120tell
1st

Suppose f is a positive and continuous function on [a, b]. Weare interested in finding the area of the region bounded byx = a, x = b, y = 0 and y = f (x). Given any positive integer n.We will use the area of n rectangles to approximate the area.1. Divide [a, b] into n subintervals of. equal length.2. The length of each subinterval is �x = b�a
n3. This division gives us n + 1 points on [a, b] with
{x0 = a, x1 = , x2 = , · · · , xn�1 = xn = }={x0 = a, x1 = , x2 = , · · · , xn�1 = xn = }
Total length of lab]"
a-3 b-q ,
b
oxox-eb.IN
i¥EH* ¥ Xny ¥n
a-inox-a-n.b-n-9-a-b-a-ba-oxa-zoxatcn.no/=ab-noXf

On each subinterval, we use the value of the function at theright hand end point as the height of the rectangle. Recall�x = b�1
n and xi = a + i�x .Subinterval [x0, x1] [x1, x2] · · · [xn�2, xn�1] [xn�1, xn]
width �x �x · · · �x �xheight f (x1) f (x2) · · · f (xn�1) f (xn)
area of f (x1)�x f (x2)�x · · · f (xn�1)�x f (xn)�xeach rectangle
Approximated area
=f (x1)�x + f (x2)�x + · · ·+ f (xn�1)�x + f (xn)�x =nX
i=1
f (xi)�x
If limn!1
nX
i=1
f (xi)�x exists then we define area limn!1
nX
i=1
f (xi)�x
Remark:Pn
i=1 f (xi)�x is also called the right-hand sum.
fan t
4-
±¥!i¥¥. In
a
height widthEtta T Tox
- ¥8 ni☒ K2Ty

On each subinterval, we use the value of the function at the lefthand end point as the height of the rectangle. Recall �x = b�1
nand xi = a + i�x .
Subinterval [x0, x1] [x1, x2] · · · [xn�2, xn�1] [xn�1, xn]width �x �x · · · �x �xheight f (x0) f (x1) · · · f (xn�2) f (xn�1)
area of f (x0)�x f (x1)�x · · · f (xn�2)�x f (xn�1)�xeach rectangle
Approximated area
=f (x0)�x + f (x1)�x + · · ·+ f (xn�1)�x =nX
i=1
f (xI�1)�x
If limn!1
nX
i=1
f (xI�1)�x exists then we define area limn!1
nX
i=1
f (xi�1)�x
Remark:Pn
i=1 f (xi�1)�x is also called the left-hand sum.
tix:-i I✗it Xn
i

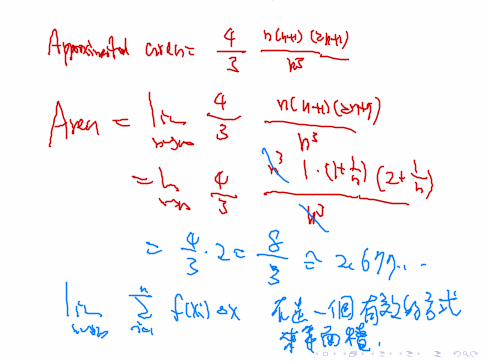
Example: Find the area of the under the graph of y = x2 where0 x 2.Solution: Now a = 0, b = 2, �x = 2�0
n = 2n ,
Yak
i
¥*;
Iim É fcxilox wherexi-o-iox-i.z-ni.mn5=1 Ta

0k¥,
Xie + iox = if = ¥Ifa
fat I. facile (¥I fc☐kÉ=<i÷.
h
Approximated area = _¥fcx⇒ox=¥¥i . ?H f
= ¥,÷ fan. ox
¥ % - ¥.iq#I-.h--kn+E-j.Mn-;wn fixed .
use Éi2=¥?
I
Approximated arene -43 Éh
↳•I i⇒Area = 1in
In ¥ ¥i"'
⇒
= -5.2=-38 I 2677 . . -
4¥,¥
,
fail ox 4%-4☒ Fish }Hi¥e§Bf&z .

Example: A car is moving with increasing velocity along astraight road. The following table shows the velocity every twoseconds:
Estimate the total distance traveled during the first ten seconds.
constant relay V0, elapsed time of
distance travelled = Vucotl
**TEETHAssn Velocity 20 3v 3J 44 14
Estimated E 20.2 -130.2×38.21-442448-2distr

The total distance traveled during the first ten seconds=
FEET.Velocity so 3s ¢4 Is ¥oupper estimate
.
= 230-1238 + Zi 44
+2.48+250
g-V41
Area under YeVH1 Wbu o Ete lo

É&BMkÉ = "
EE&HMk2"