m 1: an overview of d -blindness and instructional strategies
TRANSCRIPT

MODULE 1: AN OVERVIEW OF
DEAF-BLINDNESS AND
INSTRUCTIONAL STRATEGIES

MODULE 1 - IMPACT OF DEAF-BLINDNESS ON DEVELOPMENT
AND LEARNING AND OVERVIEW OF INSTRUCTIONAL
STRATEGIES
TEAM LEAD:
Robbie Blaha
Texas Deafblind Project, Deaf-Blind Education Specialist
Texas School for the Blind and Visually Impaired
TEAM CONTRIBUTORS:
Michelle Clyne
Project Coordinator, Illinois Deaf-Blind Services (Project Reach)
Vivecca Hartmann
Parent Leader, TX
Johanna Borg
Teacher of Deafblind, TX
Helen Keller Fellow
Barbara Martin
Educational Interpreter and Intervener, KY

1
OHOA July 2013
OPEN HANDS, OPEN ACCESS: DEAF-BLIND
INTERVENER LEARNING MODULES
MODULE 1: AN OVERVIEW OF DEAF-
BLINDNESS AND INSTRUCTIONAL
STRATEGIES
LEARNING OUTCOMES
● Identify important facts that can be learned from the National Child Count
of Children and Youth Who Are Deaf-Blind.
● Understand the importance of gathering information about a student's
etiology to guide the development of an effective educational plan.
● Recognize that deaf-blindness is a disability of access to information that
results in significant challenges in interactions and learning.
● Describe key instructional principals and strategies that are effective in
educating and interacting with these learners.
● Give examples of the array of supports and resources on deaf-blindness
that are available for families and school districts.
Intervener Journal Module 1(Appendix 1)
Module 1 Tipsheet (Appendix 2)
CEC & Professional Standards Document (Appendix 3)
Watch this introductory video: “How Would Being Deaf-Blind Affect Your Life?”
Video – Scenario with Credits
http://www.youtube.com/watch?feature=player_embedded&v=G9YuKs3Jitk
Watch the scenario of a student in a music class and respond to the Inquiry
Challenge Questions in your intervener journal as directed.
The young boy in this video is in a music class with classmates who are typical
learners. He does not have enough vision and hearing to get a complete picture
of what is happening around him. Once you have watched the video, start your
“Intervener Journal" (see the document "Intervener Journal Module 1" on moode in
the Learning Outcomes at the beginning of the module). Answer the following
questions:
What might the student’s perspective be about what is going on in this situation?
What behaviors may be misread by someone who did not understand the student or deaf-
blindness?
INQUIRY CHALLENGE (10 MINUTES)
INTRODUCTION (2 MINUTES)

2
OHOA July 2013
Write your answers and impressions in the journal. You will add to your
responses at the end of the module and make notes about what you learned.
Video – artyem_1.mov
http://www.youtube.com/watch?v=RTY80MbErZI&feature=youtu.be
Step 1: Watch the slide presentation "Children with Deaf-Blindness."
Step 2: Read the article "Children Who are Deaf-Blind
Step 3: Go to the Learning Activity 1 Discussion Board for the assignment for
this learning activity. Be sure to download the "National Deaf-Blind Child Count
Summar: December 1, 2011” document, you will need this for the activity. (Appendix
4)
Data from the National Child count indicate that deaf-blindness is rare
and yet diverse.
Having a child with deaf-blindness has a big impact on both families and
school districts.
Step 1: Watch this slide presentation, "Causes of Deaf-Blindness (Etiology)”
Step 2: Read the fact sheet, "Usher Syndrome"
Step 3: Watch the first four videos on the web page "Videos About Students
With Usher Syndrome." The first two videos are about Marissa and the third and
fourth videos are about Audrey.
http://wsdsonline.org/video-library/deaf-blind-videos/usher-syndrome/usher-
syndrome-videos
Step 4: Complete the assignment "Learn More About Your Student's Etiology”
(Appendix 5). If you don't have a student, you will use a case-study student (see
the Example Student Documents folder and the Example Student Videos 1 and
2).
Step 5: Be sure to save your completed assignment. You will be referring to it
again when you get to Module 2.
Understanding the etiology of a student's deaf-blindness is essential in order to
develop an educational program and support the student.
TTaakkeeaawwaayy::
LEARNING ACTIVITY 2: CAUSES (ETIOLOGIES) OF DEAF-
BLINDNESS (90 MINUTES)
TTaakkeeaawwaayyss::
LEARNING ACTIVITY 1: THE POPULATION OF STUDENTS WHO
ARE DEAF-BLIND (1-HOUR)
3
OHOA July 2013
Step 1: Read the fact sheet "Developing Concepts with Children Who Are Deaf-
Blind" located on the Moodle site.
Step 2: Watch the slide presentation "Impact of Deaf-Blindness on Learning &
Social Interactions."
Step 3: Watch the slide presentation "Strategies for Interacting and
Communicating with Students."
Step 4: Watch the slide presentation "Resources and Educational Personnel."
Step 5: Open the document "Think-Reflect-Pair and Share Activity Instructions" and
complete the activity. (Appendix 6)
Step 6: Take the Module 1 Review Quiz on Moodle. It covers content presented
for the whole module.
● Deaf-blindness is a disability of access to information.
● There is an array of effective instructional principles and strategies that
can be used to help learners with deaf-blindness acquire knowledge and
interact with others.
At the beginning of this module, in the Inquiry Challenge section, you viewed
the video of a young boy during a music activity and responded to some
questions in your journal. Please review those journal entries again, add to your
responses to the first two questions, and respond to the third question under
the heading "Revisiting the Inquiry Challenge Question."
Here is a list of the same questions that are in the journal:
1. What might the student’s perspective be about what is going on in this
situation?
2. What behaviors may be misread by someone who did not understand the
student or deaf-blindness?
3. How would you use the knowledge you have gained in this module to
help another person better understand the experience of the student in
this video?
1. Inquiry Challenge Pre and Post Journal Reflections
2. Vision Simulation
3. Learning Activity 1 Discussion Board
4. Learn More About Your Student's Etiology Assignment
5. Learning Activity 3 Think-Reflect-Pair and Share Activity
6. Module 1 Review Quiz
DOCUMENTED ACCOMPLISHMENTS
REVISITING THE INQUIRY CHALLENGE (20 MINUTES)
TTaakkeeaawwaayyss
:s:
LEARNING ACTIVITY 3: THE FOUNDATIONS OF LEARNING (2
HOURS)

4
OHOA July 2013
The goal of this module was to provide basic information about deaf-blindness
and beginning insight into how deaf-blindness affects learning. With this
understanding, an intervener can begin to interpret a student's responses to the
environment in new ways.
Please download and complete the self-evaluation. (Appendix 7)
Module 1 References (Appendix 8)
Module 1 Recommended Readings
If you need additional information about deaf-blindness contact the NCDB
Library
Web: nationaldb.org/library
Phone: 800-438-9376
TTY: 800-854-7013
Email: [email protected]
ADDITIONAL RESOURCES
REFERENCES
MMoodduullee TTaakkeeaawwaayy::
SELF-EVALUATION

(Appendix 1)
1
OHOA July 2013
Intervener Journal Module 1
This journal is a way for you to note ideas or thoughts that you have as you
proceed through the module. It also includes some questions that you will be
directed to from specific sections of the module.
Before you use this journal, save a copy to your computer or other location
outside of Moodle.
Inquiry Challenge Questions
(You will answer these questions after the Inquiry Challenge and again at the
end of the Module. You will also be directed to take some notes about your
thoughts as you move through the Module.)
1. What might the student’s perspective be about what is going on in this
situation?
2. What behaviors may be misread by someone who did not understand the
student or deaf-blindness?
Revisiting the Inquiry Challenge
Add to your responses to the two questions above, plus answer this third question.
3. How would you use the knowledge you have gained in this module to help
another person better understand the experience of the student in this video?

(Appendix 2)
Open Hands, Open Access: Deaf-Blind Intervener Learning Modules
Module 1:
Overview of Deaf-Blindness & Instructional Strategies Tip Sheet
Activities within this Module
I. Introduction 2 Minutes II. Inquiry Challenge 15 Minutes
III. Learning Activity 1 – The Population of Students Who are Deaf-Blind 60 Minutes IV. Learning Activity 2 – Causes of (Etiologies) of Deaf-Blindness 90 Minutes V. Learning Activity 3 – The Foundation of Learning 2 hours
VI. Revisiting the Inquiry Challenge 20 Minutes Under the “Learning Outcomes,” you will find an Intervener Journal that you can use to take notes as you go through the modules. (You will also need it for some assigned activities.) To track your progress through the modules:
Finished Activity Takeaways Got it!
Introduction
Inquiry Challenge
Learning Activity 1 Deaf-blindness is rare and yet diverse.
Having a child with deaf-blindness has a big impact on families and school districts.
Learning Activity 2 Understanding the etiology of a student's deaf-blindness is important for developing
an educational program.
Learning Activity 3 There are many effective instructional
principles and strategies for students with deaf-blindness.
If you need more information about deaf-blindness, visit nationaldb.org
OHOA April 2015
1

Module Development Crosswalk to CEC Standards
Initial Coding of Competencies – July, 2013 (Based on One Cycle of Field Testing and Alignment) (Appendix 3)
Module Title: An Overview of Deaf-Blindness and Instructional Strategies
Completed by:
Standards Knowledge Statement Skills Statement Where Addressed in the
Module Content
Standard 1: Foundations
SEP1K1 Purposes of programs for
individuals with exceptional learning
SEP1K2 Basic educational terminology
regarding individuals with
exceptional learning needs, programs, roles, and
instructional activities
DBI1K1 Definition of deaf-blindness
DBI1K2 Differences between congenital
and acquired deaf-blindness DBI1K3 Implications of the age of onset
of vision and hearing loss, the types and
degrees of loss, and the presence of
additional disabilities on development and
learning
None
SEP1K1 roles of state and national
DB projects in supporting local
educational programming DBI1K1: Learning Activity 1, slide 5
DBI1K2: Learning activity 1, slides,
18–19
DBI1K3: Learning activity 1, slide
20
ALL ABOVE: NCDB Fact Sheet
“Children Who Are Deaf-Blind”
Standard 2: Development and Characteristics
of Learners
SEP2K1Effects an exceptional condition(s)
can have on an individual’s life
DBI2K1 Impact of combined vision and
hearing loss on development and learning DBI2K4 Impact of deaf-blindness on
bonding, attachment, and social interaction
DBI2K5 Impact of deaf-blindness on
psychological development and on the
development of self-identity DBI2K6 Impact of deaf-blindness related
to isolation, stress, and vulnerability DBI2K8 Impact of additional disabilities
on individuals with deaf-blindness
None
DBI2K1: Learning Activity 2,
slides 3–13
DBI2K4: Learning Activity 2,
slides 16–20
DBI2K5: NCDB Fact Sheet
“Developing Concepts with
Children who are Deaf-Blind”
DBI2K6: Learning Activity 2,
slides 21–22; Usher information
at http://www.wsdsonline.org/
video-library/deaf-blind-
videos/usher-syndrome/
DBI2K8: Learning activity 1,
slide 20; NCDB Fact Sheet
“Children Who Are Deaf-Blind”
Standard 3: Individual Learning Differences
SEP3K1Rights and responsibilities of
families and children as they relate to individual
learning needs
DBI3K1 Specific causes of the deaf-
blindness DBI3K4 Learning style and
communication of the individual
SEP351 Demonstrate sensitivity to the
diversity of individuals and families DBI3S1 Facilitation of the individual's
understanding and development of concepts
DBI3K1: Learning Activity 1,
slides 18–20; NCDB Fact Sheet
“Children Who Are Deaf-
Blind”; Learning Activity 3,
Usher syndrome fact sheet,
Washington videos of persons
with Usher syndrome.
DBI3K4: Learning activity 1,
slide 22; Learning Activity 3,

Module Development Crosswalk to CEC Standards
Initial Coding of Competencies – July, 2013 (Based on One Cycle of Field Testing and Alignment) (Appendix 3)
slides 9–19; NCDB Fact Sheet
“Children Who Are Deaf-Blind”
DBI3S1: NCDB Fact Sheet
“Developing Concepts with
Children who are Deaf-Blind”
Standard 4: Instructional Strategies
SEP4K1 Basic instructional and remedial
strategies and materials DBI4K1 Strategies that promote visual
and auditory development DBI4K2 The use of calendar systems
SEP4S5 Use strategies as directed to
increase the individual's independence and
confidence DBI456
DBI4K1: Usher information at
http://www.wsdsonline.org/vide
o-library/deaf-blind-
videos/usher-syndrome/
DBI4K2; Learning activity 2,
part 2, slide 27
DBI4S3: Step 3, slide 7
SEP4S5, DBI4S2, & DBI4S4:
NCDB Fact Sheet “Developing
Concepts with Children who are
Deaf-Blind”
SEP4S5, DBI4S4, & DBI4S8:
Learning Activity 2, slides 23–
29 (wait and pace)
DBI4S4; Learning Activity Part
3, slides 20–24 (experience
books)
DBI4S11: Step 3, slide 7
Standard 5: Learning Environments/Social
Interactions None DBI5S1 Establish a trusting relationship
with the individual
Learning Activity 2, Step 3
(presentation called Part 3,
Strategies for Interacting and
Communicating with Students),
slides 3–8; NCDB Fact Sheet
“Developing Concepts with
Children who are Deaf-Blind”
Standard 6: Language
DBI6K2 Impact of deaf-blindness on
communication and interaction
DBI6K3 Modes/forms of communication
and devices used by individuals who are
deaf-blind
DBI6S3 Implement methods and strategies
for effectively conveying information to the
individual
Learning Activity 2, slides 23–
24
Multiple video interviews
describing calendar systems
DBI6S3 Intervener journal
reflection
Standard 7: Instructional Planning
None
None
Standard 8: Assessment
None
None

Module Development Crosswalk to CEC Standards
Initial Coding of Competencies – July, 2013 (Based on One Cycle of Field Testing and Alignment) (Appendix 3)
Standard 9: Professional and Ethical Practice
None
None
Standard 10: Collaboration None None

Total Number
Served by State
During Year
Number Eligible to
Receive Project
Services on 12-1-2013
12-1-13 Snap
Shot: Number on
Child Count (1)
Part C and/or Not Eligible
for Project Services as of
12-1-13
Alabama 177 157 155 22Alaska 27 24 24 3Arizona 224 224 207 17Arkansas 142 130 113 29California 1147 1098 1008 139Colorado 134 120 119 15Connecticut 56 55 53 3Delaware 74 74 74 0District of Columbia 14 14 13 1Florida 529 528 494 35Georgia 331 302 274 57Hawaii 65 60 58 7Idaho 66 63 61 5Illinois 429 414 402 27Indiana 219 219 189 30Iowa 91 78 72 19Kansas 161 147 138 23Kentucky 156 146 127 29Louisiana 79 77 76 3Maine 38 35 31 7Maryland 165 164 156 9Massachusetts 229 224 223 6Michigan 363 353 332 31Minnesota 347 334 334 13Mississippi 51 49 46 2Missouri 293 222 190 103Montana 41 40 40 1Nebraska 101 100 99 2Nevada 126 110 104 22New Hampshire 66 63 62 4New Jersey 198 198 194 4New Mexico 113 109 101 12New York 443 400 384 59North Carolina 281 277 270 11North Dakota 27 27 25 2Ohio 428 391 343 85Oklahoma 156 148 147 9Oregon 80 80 78 2Pacific Basin 59 50 49 10Pennsylvania 406 393 382 24Puerto Rico 76 70 70 6Rhode Island 50 47 46 4South Carolina 142 131 131 11South Dakota 32 32 32 0Tennessee 236 236 228 8Texas 877 831 807 70Utah 136 130 126 10Vermont 36 34 34 2Virgin Islands 23 23 16 7Virginia 192 187 180 12Washington 245 244 234 11West Virginia 107 105 104 3Wisconsin 160 153 151 9Wyoming 50 50 48 2
Total 10494 9970 9454 1037
(1) December 1 snapshot based on children/youth in Part C or Part B and eligible for project services.
National Deaf-Blind Child Count Summary December 1, 2013
(Ages birth through 21*)

0 thru 2 3 thru 5 6 thru 11 12 thru 17 18 thru 21 Over 21
Unknown/
Missing
Alabama 3 12 44 57 38 0 1 155
Alaska 0 4 10 2 8 0 0 24
Arizona 17 24 83 51 30 2 0 207
Arkansas 1 11 52 36 13 0 0 113
California 38 141 334 314 177 0 4 1008
Colorado 11 19 44 36 9 0 0 119
Connecticut 0 5 16 20 12 0 0 53
Delaware 8 6 30 26 4 0 0 74
District of Columbia 0 6 5 2 0 0 0 13
Florida 14 82 142 156 98 0 2 494
Georgia 19 45 108 69 33 0 0 274
Hawaii 4 14 14 19 7 0 0 58
Idaho 3 10 27 16 5 0 0 61
Illinois 13 47 118 139 84 1 0 402
Indiana 4 27 49 84 25 0 0 189
Iowa 3 6 27 26 10 0 0 72
Kansas 11 22 49 42 14 0 0 138
Kentucky 6 8 39 58 16 0 0 127
Louisiana 0 1 26 32 17 0 0 76
Maine 2 8 9 10 2 0 0 31
Maryland 2 24 61 46 20 0 3 156
Massachusetts 7 21 84 66 45 0 0 223
Michigan 10 31 105 101 62 23 0 332
Minnesota 29 45 108 118 34 0 0 334
Mississippi 3 9 13 12 9 0 0 46
Missouri 29 19 46 75 21 0 0 190
Montana 1 3 15 11 10 0 0 40
Nebraska 3 10 31 31 24 0 0 99
Nevada 10 29 37 18 10 0 0 104
New Hampshire 3 12 19 21 7 0 0 62
New Jersey 9 22 38 62 63 0 0 194
New Mexico 15 21 35 22 8 0 0 101
New York 10 26 110 99 133 0 6 384
North Carolina 21 25 88 91 45 0 0 270
North Dakota 1 7 9 7 1 0 0 25
Ohio 10 27 110 147 49 0 0 343
Oklahoma 3 9 39 61 35 0 0 147
Oregon 7 9 24 26 12 0 0 78
Pacific Basin 0 5 16 12 6 0 10 49
Pennsylvania 58 55 111 116 42 0 0 382
Puerto Rico 1 4 27 24 14 0 0 70
Rhode Island 0 0 21 11 14 0 0 46
South Carolina 20 17 40 44 10 0 0 131
South Dakota 5 3 13 9 2 0 0 32
Tennessee 37 38 69 69 15 0 0 228
Texas 45 118 291 239 114 0 0 807
Utah 13 17 39 33 24 0 0 126
Vermont 1 6 10 12 5 0 0 34
Virgin Islands 0 0 8 3 5 0 0 16
Virginia 10 20 73 56 21 0 0 180
Washington 20 28 70 84 32 0 0 234
West Virginia 2 13 37 36 16 0 0 104
Wisconsin 7 16 51 55 19 0 3 151
Wyoming 3 9 18 12 6 0 0 48
Total 552 1196 3092 3024 1535 26 29 9454
*Some states continue to provide services through the end of the school year in which the individual turns 22 years old
Total
National Deaf-Blind Child Count Summary
December 1, 2013
(Ages birth through 21*)
AGE OF CHILD (Respective Count Year)

American
Indian or
Alaska
Native Asian
Black or
African
American
Hispanic/
Latino White
Native
Hawaiian/
Pacific
Islander
Two or
More Races
Unknown/
Missing
Alabama 3 2 56 5 88 0 1 0 155
Alaska 13 1 0 1 8 0 0 1 24
Arizona 17 3 14 95 78 0 0 0 207
Arkansas 0 0 32 9 68 0 4 0 113
California 9 91 51 497 285 15 27 33 1008
Colorado 3 4 12 33 65 1 1 0 119
Connecticut 0 0 10 7 36 0 0 0 53
Delaware 1 3 17 22 31 0 0 0 74
District of Columbia 0 1 10 0 2 0 0 0 13
Florida 2 25 84 135 185 1 16 46 494
Georgia 0 9 82 37 130 0 12 4 274
Hawaii 0 33 2 0 6 8 2 7 58
Idaho 1 0 1 5 49 0 5 0 61
Illinois 1 21 83 73 223 0 1 0 402
Indiana 1 5 17 19 143 0 4 0 189
Iowa 0 2 1 4 64 0 1 0 72
Kansas 2 12 10 14 97 0 3 0 138
Kentucky 0 0 12 7 106 0 2 0 127
Louisiana 0 0 25 0 50 0 0 1 76
Maine 1 1 1 0 28 0 0 0 31
Maryland 1 7 51 15 80 0 0 2 156
Massachusetts 2 7 10 48 152 0 4 0 223
Michigan 1 15 49 23 239 0 5 0 332
Minnesota 12 24 30 31 225 0 12 0 334
Mississippi 0 0 18 0 27 0 1 0 46
Missouri 2 4 38 8 134 1 2 1 190
Montana 5 0 1 0 33 1 0 0 40
Nebraska 3 2 5 9 80 0 0 0 99
Nevada 2 4 14 33 42 4 5 0 104
New Hampshire 0 2 1 3 55 0 1 0 62
New Jersey 0 8 35 45 105 0 0 1 194
New Mexico 17 0 0 54 24 0 5 1 101
New York 4 14 62 67 169 6 0 62 384
North Carolina 6 9 87 24 134 0 10 0 270
North Dakota 3 0 0 0 21 0 1 0 25
Ohio 2 3 80 14 238 2 3 1 343
Oklahoma 23 5 12 15 92 0 0 0 147
Oregon 2 2 2 18 53 1 0 0 78
Pacific Basin 0 0 0 0 0 48 0 1 49
Pennsylvania 0 13 63 25 272 0 9 0 382
Puerto Rico 0 0 0 70 0 0 0 0 70
Rhode Island 2 2 5 12 25 0 0 0 46
South Carolina 1 1 50 7 70 0 1 1 131
South Dakota 6 0 0 0 26 0 0 0 32
Tennessee 0 9 50 17 145 0 7 0 228
Texas 8 28 93 328 336 1 13 0 807
Utah 3 2 1 17 96 2 3 2 126
Vermont 0 1 1 1 29 0 0 2 34
Virgin Islands 0 0 12 1 3 0 0 0 16
Virginia 1 9 37 21 107 0 0 5 180
Washington 6 9 8 44 150 2 15 0 234
West Virginia 0 0 8 0 91 5 0 0 104
Wisconsin 6 4 16 9 107 0 1 8 151
Wyoming 4 0 2 5 37 0 0 0 48
Total 176 397 1361 1927 5139 98 177 179 9454
*Some states continue to provide services through the end of the school year in which the individual turns 22 years old
National Deaf-Blind Child Count Summary December 1, 2013
(Ages birth through 21*)
Total
Race/Ethnicity

Male Female
UNKNOWN/
MISSING
Alabama 75 80 0 155
Alaska 13 11 0 24
Arizona 105 102 0 207
Arkansas 55 58 0 113
California 545 453 10 1008
Colorado 72 47 0 119
Connecticut 27 26 0 53
District of Columbia 43 31 0 74
Delaware 6 7 0 13
Florida 261 229 4 494
Georgia 143 128 3 274
Hawaii 35 22 1 58
Idaho 31 30 0 61
Illinois 212 189 1 402
Indiana 89 100 0 189
Iowa 37 35 0 72
Kansas 86 52 0 138
Kentucky 64 63 0 127
Louisiana 38 38 0 76
Maine 17 14 0 31
Maryland 83 72 1 156
Massachusetts 111 111 1 223
Michigan 179 153 0 332
Minnesota 171 163 0 334
Mississippi 23 23 0 46
Missouri 109 80 1 190
Montana 20 20 0 40
Nebraska 62 37 0 99
Nevada 59 45 0 104
New Hampshire 40 22 0 62
New Jersey 114 80 0 194
New Mexico 55 46 0 101
New York 211 173 0 384
North Carolina 139 130 1 270
North Dakota 10 15 0 25
Ohio 190 153 0 343
Oklahoma 70 77 0 147
Oregon 44 34 0 78
Pacific Basin 28 21 0 49
Pennsylvania 201 181 0 382
Puerto Rico 31 39 0 70
Rhode Island 22 24 0 46
South Carolina 73 58 0 131
South Dakota 15 17 0 32
Tennessee 113 115 0 228
Texas 450 357 0 807
Utah 70 56 0 126
Vermont 17 17 0 34
Virgin Islands 10 6 0 16
Virginia 87 93 0 180
Washington 116 118 0 234
West Virginia 59 45 0 104
Wisconsin 89 62 0 151
Wyoming 30 18 0 48
Total 5055 4376 23 9454
*Some states continue to provide services through the end of the school year in which the individual turns 22 years old
National Deaf-Blind Child Count Summary December 1, 2013
(Ages birth through 21*)
Total
Gender

Low Vision
Legally
Blind
Light
Perception
Only
Totally
Blind
Diagnosed
Progressive
Vision Loss
Further
Testing
Needed (1 year
only)
Documented
Functional
Vision Loss
Alabama 58 34 7 8 4 43 1 155
Alaska 9 5 0 2 3 2 3 24
Arizona 51 37 7 4 7 0 101 207
Arkansas 38 26 9 4 5 2 29 113
California 235 298 54 70 28 129 194 1008
Colorado 66 24 12 2 9 6 0 119
Connecticut 20 23 1 3 1 0 5 53
Delaware 24 15 1 1 5 3 25 74
District of Columbia 1 0 0 0 0 1 11 13
Florida 245 92 32 25 20 39 41 494
Georgia 55 84 28 19 6 14 68 274
Hawaii 7 13 4 7 3 3 21 58
Idaho 13 10 5 0 8 0 25 61
Illinois 135 90 35 20 30 3 89 402
Indiana 61 38 20 10 5 0 55 189
Iowa 21 18 8 3 4 0 18 72
Kansas 34 39 10 5 5 7 38 138
Kentucky 40 40 28 3 2 0 14 127
Louisiana 16 24 4 7 8 4 13 76
Maine 17 5 0 2 1 1 5 31
Maryland 36 30 6 4 5 21 54 156
Massachusetts 98 69 13 8 6 8 21 223
Michigan 95 90 20 27 7 7 86 332
Minnesota 166 49 14 12 27 0 66 334
Mississippi 12 17 8 4 1 1 3 46
Missouri 49 41 14 12 13 4 57 190
Montana 14 11 1 7 4 1 2 40
Nebraska 36 39 8 5 4 0 7 99
Nevada 21 21 10 4 4 12 32 104
New Hampshire 27 16 0 1 0 2 16 62
New Jersey 94 53 13 6 10 1 17 194
New Mexico 31 22 6 6 2 7 27 101
New York 59 111 23 29 6 135 21 384
North Carolina 86 65 15 27 3 7 67 270
North Dakota 13 3 2 0 0 0 7 25
Ohio 69 84 29 25 14 11 111 343
Oklahoma 45 26 12 7 7 2 48 147
Oregon 31 12 4 6 7 3 15 78
Pacific Basin 10 4 6 5 2 9 13 49
Pennsylvania 106 101 13 13 7 59 83 382
Puerto Rico 20 26 8 4 10 1 1 70
Rhode Island 11 16 5 0 1 3 10 46
South Carolina 44 27 5 6 6 1 42 131
South Dakota 6 5 0 5 1 1 14 32
Tennessee 74 46 15 12 9 16 56 228
Texas 253 353 41 36 14 10 100 807
Utah 61 29 6 4 5 3 18 126
Vermont 10 3 3 2 1 0 15 34
Virgin Islands 6 3 1 0 0 0 6 16
Virginia 54 43 11 9 13 1 49 180
Washington 76 49 11 20 13 8 57 234
West Virginia 51 16 9 4 3 0 21 104
Wisconsin 25 36 7 9 6 6 62 151
Wyoming 13 10 3 2 0 3 17 48
Total 2948 2441 607 516 365 600 1977 9454
*Some states continue to provide services through the end of the school year in which the individual turns 22 years old
National Deaf-Blind Child Count Summary December 1, 2013
(Ages birth through 21*)
Total
Primary Classification of Vision Impairment

No Yes
Unknown
Missing
Alabama 46 4 105 155
Alaska 19 5 0 24
Arizona 82 124 1 207
Arkansas 57 55 1 113
California 491 222 295 1008
Colorado 75 35 9 119
Connecticut 33 20 0 53
Delaware 38 36 0 74
District of Columbia 8 4 1 13
Florida 337 70 87 494
Georgia 165 89 20 274
Hawaii 37 17 4 58
Idaho 20 38 3 61
Illinois 257 121 24 402
Indiana 105 34 50 189
Iowa 55 17 0 72
Kansas 44 72 22 138
Kentucky 43 84 0 127
Louisiana 40 24 12 76
Maine 20 8 3 31
Maryland 113 42 1 156
Massachusetts 151 55 17 223
Michigan 188 98 46 332
Minnesota 247 87 0 334
Mississippi 34 12 0 46
Missouri 136 54 0 190
Montana 30 8 2 40
Nebraska 74 15 10 99
Nevada 43 21 40 104
New Hampshire 42 20 0 62
New Jersey 119 75 0 194
New Mexico 30 45 26 101
New York 377 3 4 384
North Carolina 127 116 27 270
North Dakota 19 4 2 25
Ohio 100 128 115 343
Oklahoma 88 51 8 147
Oregon 44 26 8 78
Pacific Basin 8 6 35 49
Pennsylvania 282 100 0 382
Puerto Rico 35 27 8 70
Rhode Island 24 20 2 46
South Carolina 56 38 37 131
South Dakota 23 8 1 32
Tennessee 153 71 4 228
Texas 480 242 85 807
Utah 65 51 10 126
Vermont 12 22 0 34
Virgin Islands 0 0 16 16
Virginia 129 51 0 180
Washington 94 79 61 234
West Virginia 34 70 0 104
Wisconsin 78 70 3 151
Wyoming 13 22 13 48
Total 5420 2816 1218 9454
*Some states continue to provide services through the end of the school year in which the individual turns 22 years old
National Deaf-Blind Child Count Summary December 1, 2013
(Ages birth through 21*)
Total
Cortical Visual Impairment

Mild Moderate
Moderately
Severe Severe Profound
Diagnosed
Progressive
Loss
Further Testing
Needed (1 year
only)
Documented
Functional
Hearing Loss
Alabama 26 21 12 21 36 0 36 3 155Alaska 0 4 8 2 7 1 0 2 24Arizona 23 47 38 26 56 0 1 16 207Arkansas 9 18 14 8 13 2 7 42 113
California 74 119 125 135 232 10 181 132 1008
Colorado 21 30 21 15 26 2 4 0 119Connecticut 10 15 9 2 14 0 1 2 53Delaware 17 17 10 8 11 0 6 5 74District of Columbia 0 4 3 0 1 0 1 4 13Florida 111 67 68 57 119 2 48 22 494Georgia 52 50 50 39 37 1 11 34 274Hawaii 4 9 4 2 10 0 7 22 58Idaho 17 9 11 11 7 0 0 6 61Illinois 135 74 36 42 55 8 4 48 402Indiana 29 38 27 25 38 1 0 31 189Iowa 13 16 12 10 18 0 1 2 72Kansas 20 25 15 12 30 2 7 27 138Kentucky 23 17 22 12 21 0 0 32 127Louisiana 13 12 10 8 13 1 6 13 76Maine 9 5 9 1 4 0 1 2 31Maryland 13 33 19 19 32 0 12 28 156Massachusetts 47 46 37 26 31 3 19 14 223Michigan 37 52 47 38 70 8 10 70 332Minnesota 34 99 62 39 74 4 5 17 334Mississippi 5 7 9 9 12 0 4 0 46Missouri 24 27 37 33 38 0 4 27 190Montana 4 4 10 5 5 1 5 6 40Nebraska 8 21 18 27 20 0 0 5 99Nevada 12 19 11 13 13 1 14 21 104New Hampshire 13 10 7 6 6 0 8 12 62New Jersey 24 57 32 28 41 0 1 11 194New Mexico 16 27 17 11 18 0 8 4 101New York 29 77 48 35 2 56 77 60 384North Carolina 48 53 33 21 54 4 6 51 270North Dakota 3 7 6 2 5 0 0 2 25Ohio 42 41 40 24 66 6 4 120 343Oklahoma 15 19 22 19 39 2 2 29 147Oregon 8 24 18 13 12 0 1 2 78
Pacific Basin 11 8 3 2 5 0 8 12 49
Pennsylvania 61 71 47 39 47 1 76 40 382
Puerto Rico 21 16 9 3 7 2 2 10 70
Rhode Island 6 12 8 5 3 0 5 7 46
South Carolina 19 19 26 20 21 1 9 16 131
South Dakota 4 6 5 0 12 0 2 3 32
Tennessee 37 29 33 29 41 8 21 30 228
Texas 87 171 150 138 197 4 23 37 807
Utah 17 32 31 10 23 0 6 7 126
Vermont 8 11 2 2 3 0 5 3 34
Virgin Islands 6 2 1 0 1 0 0 6 16
Virginia 25 35 28 21 44 2 10 15 180
Washington 31 41 40 22 66 5 4 25 234
West Virginia 26 19 13 5 10 2 2 27 104
Wisconsin 4 26 11 21 31 2 5 51 151
Wyoming 6 8 7 2 10 0 1 14 48
Total 1357 1726 1391 1123 1807 142 681 1227 9454
*Some states continue to provide services through the end of the school year in which the individual turns 22 years old
National Deaf-Blind Child Count Summary December 1, 2013
(Ages birth through 21*)
Total
Primary Classification of Hearing Impairment

No Yes
Unknown/
Missing No Yes
Unknown/
Missing No Yes
Unknown/
Missing
Alabama 117 7 31 32 3 120 132 14 9
Alaska 20 0 4 19 1 4 19 3 2
Arizona 197 3 7 197 0 10 187 19 1
Arkansas 47 5 61 56 3 54 103 3 7
California 378 90 540 292 32 684 677 49 282
Colorado 94 3 22 96 7 16 112 7 0
Connecticut 38 3 12 37 4 12 40 9 4
Delaware 51 0 23 45 6 23 50 2 22
District of Columbia 7 0 6 7 0 6 7 1 5
Florida 299 26 169 263 29 202 329 39 126
Georgia 180 40 54 189 22 63 254 16 4
Hawaii 40 2 16 18 1 39 47 2 9
Idaho 27 23 11 38 4 19 54 6 1
Illinois 349 6 47 349 14 39 345 50 7
Indiana 117 5 67 73 2 114 148 25 16
Iowa 41 4 27 17 1 54 59 12 1
Kansas 64 10 64 66 8 64 117 19 2
Kentucky 82 45 0 127 0 0 119 8 0
Louisiana 53 8 15 46 6 24 51 11 14
Maine 12 1 18 20 1 10 23 3 5
Maryland 131 2 23 129 13 14 120 19 17
Massachusetts 79 6 138 136 5 82 121 8 94
Michigan 236 37 59 255 19 58 282 32 18
Minnesota 236 3 95 111 8 215 278 51 5
Mississippi 30 2 14 22 0 24 42 4 0
Missouri 174 16 0 176 11 3 167 20 3
Montana 32 5 3 31 7 2 37 3 0
Nebraska 85 5 9 83 7 9 90 9 0
Nevada 44 7 53 37 7 60 93 6 5
New Hampshire 29 7 26 34 5 23 45 0 17
New Jersey 162 7 25 138 27 29 180 13 1
New Mexico 55 7 39 49 3 49 82 0 19
New York 225 13 146 46 10 328 87 26 271
North Carolina 178 32 60 173 33 64 232 31 7
North Dakota 24 0 1 23 1 1 20 5 0
Ohio 128 80 135 152 70 121 163 137 43
Oklahoma 122 7 18 78 6 63 130 15 2
Oregon 51 1 26 52 2 24 66 7 5
Pacific Basin 12 1 36 10 2 37 49 0 0
Pennsylvania 366 16 0 357 25 0 350 32 0
Puerto Rico 36 24 10 53 2 15 69 1 0
Rhode Island 42 0 4 45 1 0 46 0 0
South Carolina 10 2 119 74 6 51 98 8 25
South Dakota 31 0 1 31 1 0 27 5 0
Tennessee 180 20 28 185 7 36 196 19 13
Texas 0 52 755 0 37 770 0 87 720
Utah 122 0 4 115 2 9 111 12 3
Vermont 16 3 15 20 1 13 30 2 2
Virgin Islands 3 0 13 0 0 16 8 0 8
Virginia 63 3 114 66 7 107 121 17 42
Washington 120 32 82 139 14 81 194 26 14
West Virginia 59 5 40 60 1 43 77 5 22
Wisconsin 99 29 23 67 13 71 115 13 23
Wyoming 14 5 29 14 5 29 45 3 0
Total 5407 710 3337 4948 502 4004 6644 914 1896
*Some states continue to provide services through the end of the school year in which the individual turns 22 years old
National Deaf-Blind Child Count Summary December 1, 2013
(Ages birth through 21*)
Central Auditory Processing Disorder Auditory Neuropathy Cochlear Implant

CHARGE Syndrome 864
Usher Syndrome (I,II,III) 270
Down syndrome (Trisomy 21 syndrome) 248
Stickler Syndrome 111
Dandy Walker Syndrome 107
OTHER: Hereditary/ Syndrome Disorders 2345
Cytomegalo-virus (CMV) 329
Microcephaly 249
Hydrocephaly 218
OTHER: Pre-Natal/ Congenital Complications 668
Asphyxia 221
Severe Head Injury 180
Meningitis 178
OTHER: Post-Natal/ Non-Congenital 689
Complication of Prematurity 1050
No Determination of Etiology 1727
National Deaf-Blind Child Count Summary December 1, 2013
(Ages birth through 21*)
Post-Natal/ Non-Congenital
PRIMARY IDENTIFIED ETIOLOGY
Hereditary Syndromes/Disorders
Pre-Natal/Congenital Complications

CHARGE
Syndrome
Dandy
Walker
syndrome
Down
syndrome
Stickler
syndrome
Usher
Syndrome
(I,II,III)
OTHER:
Hereditary
Synd/
Disorders
Cytomegal
ovirus
(CMV)
Hydroceph
aly Microcephaly
Alabama 5 2 3 3 1 34 6 3 1
Alaska 1 0 3 0 2 6 0 0 1
Arizona 26 4 4 3 5 64 16 0 3
Arkansas 8 2 1 0 0 32 7 3 8
California 87 6 33 12 24 188 16 23 32
Colorado 6 6 4 1 4 40 4 4 2
Connecticut 10 1 1 0 1 17 3 0 0
Delaware 2 2 3 0 2 8 2 4 3
District of Columbia 1 0 0 0 0 2 1 1 0
Florida 49 2 14 6 16 101 10 9 7
Georgia 19 4 7 3 3 62 8 6 4
Hawaii 2 0 0 2 0 12 1 1 1
Idaho 6 0 3 1 4 11 3 1 1
Illinois 41 4 12 4 23 88 15 11 5
Indiana 29 3 3 4 8 33 11 4 5
Iowa 17 0 2 0 2 13 4 2 4
Kansas 4 1 4 1 3 57 5 9 1
Kentucky 16 0 2 2 3 18 9 1 0
Louisiana 5 1 0 2 9 13 3 5 3
Maine 7 0 0 0 0 9 0 1 1
Maryland 27 2 2 1 2 32 6 1 2
Massachusetts 19 2 9 2 6 90 8 4 10
Michigan 37 4 8 3 8 72 9 7 14
Minnesota 39 2 13 18 17 102 16 8 2
Mississippi 2 0 2 0 3 8 1 3 1
Missouri 17 1 7 3 5 47 11 6 7
Montana 2 1 2 0 2 19 1 1 0
Nebraska 7 0 2 1 3 23 2 4 1
Nevada 5 3 3 1 3 34 1 2 4
New Hampshire 5 1 1 0 2 22 7 0 3
New Jersey 25 3 5 0 7 47 4 0 3
New Mexico 5 0 5 2 1 29 4 4 2
New York 48 2 12 2 10 65 10 9 14
North Carolina 24 4 7 0 8 59 7 9 8
North Dakota 3 0 0 0 2 5 0 1 0
Ohio 25 5 3 6 13 93 12 11 17
Oklahoma 2 2 3 0 3 38 10 2 6
Oregon 11 2 0 3 3 30 7 1 2
Pacific Basin 1 0 2 0 0 1 0 0 1
Pennsylvania 19 2 5 2 4 98 5 4 3
Puerto Rico 6 3 0 0 3 15 0 5 1
Rhode Island 2 2 1 0 1 12 0 1 1
South Carolina 23 3 4 4 4 32 3 3 4
South Dakota 4 0 2 0 1 4 1 0 0
Tennessee 15 3 5 4 5 64 8 3 8
Texas 93 15 14 8 23 256 38 15 15
Utah 10 1 7 0 2 28 3 7 1
Vermont 1 0 3 0 0 8 2 1 5
Virgin Islands 0 0 1 0 0 5 0 0 0
Virginia 13 1 5 1 7 49 6 1 3
Washington 14 4 5 4 7 82 8 2 15
West Virginia 3 0 2 1 1 24 3 8 6
Wisconsin 13 0 3 1 3 26 8 6 6
Wyoming 3 1 6 0 1 18 4 1 2
Total 864 107 248 111 270 2345 329 218 249
State
Hereditary Syndromes/Disorders Prenatal/Congenital Complications
PRIMARY IDENTIFED ETIOLOGY
National Deaf-Blind Child Count Summary December 1, 2013
(Ages birth through 21*)

OTHER: Pre-
Natal
Congenital
Complications Asphyxia Meningitis
Severe
Head Injury
OTHER: Post-
Natal Non-
Congenital
Complication
of Prematurity
No
Determination of
Etiology Total
Alabama 12 0 3 0 11 18 53 155
Alaska 3 0 0 1 3 2 2 24
Arizona 17 1 4 3 12 11 34 207
Arkansas 9 4 2 8 10 13 6 113
California 55 19 20 15 64 86 328 1008
Colorado 8 3 3 0 16 5 13 119
Connecticut 2 3 2 0 3 6 4 53
Delaware 6 3 3 3 12 14 7 74
District of Columbia 3 1 1 0 2 1 0 13
Florida 33 2 4 2 41 57 141 494
Georgia 27 5 4 7 19 64 32 274
Hawaii 6 1 3 1 8 4 16 58
Idaho 5 0 0 2 2 10 12 61
Illinois 36 8 15 12 24 51 53 402
Indiana 8 2 6 4 2 27 40 189
Iowa 3 1 3 1 1 6 13 72
Kansas 6 3 3 5 16 8 12 138
Kentucky 12 6 2 5 12 19 20 127
Louisiana 4 1 0 2 4 12 12 76
Maine 0 2 0 0 4 2 5 31
Maryland 5 1 2 3 9 26 35 156
Massachusetts 8 5 1 3 10 15 31 223
Michigan 24 10 5 7 27 40 57 332
Minnesota 15 9 8 2 11 35 37 334
Mississippi 4 2 2 1 3 9 5 46
Missouri 13 3 5 2 17 18 28 190
Montana 2 0 0 1 2 3 4 40
Nebraska 18 1 5 4 3 15 10 99
Nevada 13 3 0 6 10 5 11 104
New Hampshire 4 2 1 1 2 5 6 62
New Jersey 25 6 2 3 13 19 32 194
New Mexico 9 8 1 4 8 8 11 101
New York 28 13 3 3 20 33 112 384
North Carolina 9 3 3 8 31 37 53 270
North Dakota 1 1 1 0 2 4 5 25
Ohio 19 10 4 7 25 34 59 343
Oklahoma 10 8 5 3 12 24 19 147
Oregon 7 1 0 1 3 4 3 78
Pacific Basin 6 0 4 2 1 0 31 49
Pennsylvania 61 2 5 7 52 32 81 382
Puerto Rico 6 0 0 7 5 10 9 70
Rhode Island 2 6 1 0 1 11 5 46
South Carolina 9 0 2 1 7 15 17 131
South Dakota 0 1 1 4 1 3 10 32
Tennessee 7 7 8 7 19 33 32 228
Texas 45 17 11 6 57 112 82 807
Utah 9 8 3 0 11 14 22 126
Vermont 3 0 0 0 2 4 5 34
Virgin Islands 0 0 0 0 0 0 10 16
Virginia 7 8 6 2 20 16 35 180
Washington 16 7 4 4 17 24 21 234
West Virginia 17 3 1 1 12 12 10 104
Wisconsin 11 9 5 8 7 13 32 151
Wyoming 0 2 1 1 3 1 4 48
668 221 178 180 689 1050 1727 9454
State
Postnatal Non-Congenital Complications
PRIMARY IDENTIFED ETIOLOGY

Orthopedic
Physical
Impairments
Cognitive
Impairments
Behavioral
Disorders
Complex Health
Care Needs
Speech
Language
Impairments
Other
Impair-
ments
Total with 1 or
More Additional
Disabilities
Alabama 42 103 34 52 132 17 150
Alaska 14 16 1 12 21 2 22
Arizona 114 138 6 82 180 36 190
Arkansas 94 110 13 85 107 40 111
California 447 630 168 483 605 321 844
Colorado 82 64 1 70 78 1 104
Connecticut 32 36 6 25 44 3 47
District of Columbia 49 44 4 36 48 0 54
Delaware 7 8 0 9 10 0 11
Florida 208 264 42 188 316 120 384
Georgia 189 210 19 159 240 139 263
Hawaii 35 42 4 38 35 3 54
Idaho 50 52 8 43 58 9 59
Illinois 279 259 16 160 261 24 365
Indiana 105 123 12 87 137 48 169
Iowa 42 44 6 42 55 1 63
Kansas 101 117 29 93 126 46 131
Kentucky 88 106 6 84 126 2 126
Louisiana 56 58 6 44 65 12 73
Maine 21 17 3 18 27 7 29
Maryland 99 105 13 75 125 25 140
Massachusetts 109 109 23 110 145 33 163
Michigan 227 262 54 192 275 48 308
Minnesota 220 235 64 201 268 18 308
Mississippi 33 30 7 27 23 10 42
Missouri 135 141 11 112 180 9 186
Montana 25 27 6 19 34 5 39
Nebraska 60 67 9 54 87 30 94
Nevada 77 82 18 73 96 8 100
New Hampshire 39 35 10 30 44 17 48
New Jersey 122 133 35 93 160 31 184
New Mexico 78 76 14 60 85 32 95
New York 196 196 34 128 9 106 272
North Carolina 189 213 42 151 217 0 254
North Dakota 12 13 0 18 25 5 25
Ohio 221 225 145 217 223 43 320
Oklahoma 101 126 17 62 144 8 147
Oregon 59 56 1 39 61 9 73
Pacific Basin 19 34 5 16 45 6 47
Pennsylvania 235 271 39 220 305 39 331
Puerto Rico 41 51 3 46 64 26 65
Rhode Island 34 40 4 27 45 3 45
South Carolina 83 90 5 75 95 17 116
South Dakota 16 17 1 12 29 0 29
Tennessee 156 149 10 123 195 47 217
Texas 507 540 35 411 676 138 754
Utah 88 115 9 77 119 2 122
Vermont 31 24 7 26 32 14 33
Virgin Islands 0 0 3 5 0 3 7
Virginia 95 118 12 99 136 22 153
Washington 185 192 16 165 220 104 231
West Virginia 62 55 6 54 78 11 82
Wisconsin 114 111 9 101 117 25 140
Wyoming 37 37 10 34 46 23 48
Total 5760 6416 1061 4962 7074 1748 8467
*Some states continue to provide services through the end of the school year in which the individual turns 22 years old
OTHER (ADDITIONAL) DISABILITIES
National Deaf-Blind Child Count Summary December 1, 2013
(Ages birth through 21*)

At-Risk
Developmentally
Delayed
Not Reported
Under Part C
Unknown/
Missing
Alabama 0 2 1 0 3
Alaska 0 0 0 0 0
Arizona 4 13 0 0 17
Arkansas 0 1 0 0 1
California 0 38 0 0 38
Colorado 0 11 0 0 11
Connecticut 0 0 0 0 0
Delaware 0 8 0 0 8
District of Columbia 0 0 0 0 0
Florida 0 14 0 0 14
Georgia 9 10 0 0 19
Hawaii 0 4 0 0 4
Idaho 0 3 0 0 3
Illinois 8 5 0 0 13
Indiana 0 4 0 0 4
Iowa 2 1 0 0 3
Kansas 0 11 0 0 11
Kentucky 0 6 0 0 6
Louisiana 0 0 0 0 0
Maine 1 1 0 0 2
Maryland 0 2 0 0 2
Massachusetts 4 3 0 0 7
Michigan 0 10 0 0 10
Minnesota 11 18 0 0 29
Mississippi 0 3 0 0 3
Missouri 2 27 0 0 29
Montana 1 0 0 0 1
Nebraska 0 3 0 0 3
Nevada 0 10 0 0 10
New Hampshire 2 1 0 0 3
New Jersey 0 9 0 0 9
New Mexico 1 14 0 0 15
New York 1 9 0 0 10
North Carolina 7 14 0 0 21
North Dakota 0 1 0 0 1
Ohio 0 10 0 0 10
Oklahoma 0 3 0 0 3
Oregon 1 6 0 0 7
Pacific Basin 0 0 0 0 0
Pennsylvania 0 57 0 0 57
Puerto Rico 1 0 0 0 1
Rhode Island 0 0 0 0 0
South Carolina 8 12 0 0 20
South Dakota 1 4 0 0 5
Tennessee 1 36 0 0 37
Texas 2 41 2 0 45
Utah 2 11 0 0 13
Vermont 0 1 0 0 1
Virgin Islands 0 0 0 0 0
Virginia 0 10 0 0 10
Washington 1 19 0 0 20
West Virginia 0 2 0 0 2
Wisconsin 2 3 1 1 7
Wyoming 0 3 0 0 3
Total 72 474 4 1 551
*Some states continue to provide services through the end of the school year in which the individual turns 22 years old
National Deaf-Blind Child Count Summary December 1, 2013
(Ages birth through 21*)
Total
IDEA Part C Reported Category

Intellectual
Disability
Hearing
Impairment
Speech
Language
Impairment
Visual
Impairment
Emotional
Disturbance
Orthopedic
Impairment
Other Health
Impairment
Specific
Learning
Disability
Deaf-
Blindness
Alabama 0 26 10 15 42 0 7 0 24
Alaska 0 2 0 2 1 0 2 0 5
Arizona 0 13 0 4 0 0 0 0 0
Arkansas 4 1 0 0 0 0 3 0 1
California 62 129 5 86 1 70 18 3 159
Colorado 0 6 0 1 1 5 1 0 47
Connecticut 0 0 0 1 0 0 0 0 13
Delaware 1 0 0 0 0 0 0 0 65
District of Columbia 0 0 0 0 0 0 0 0 2Florida 55 53 1 22 0 1 8 3 61Georgia 68 13 1 14 0 1 15 1 23Hawaii 1 3 1 1 0 0 1 0 7Idaho 1 2 0 0 0 0 0 0 6Illinois 68 53 2 25 0 4 37 1 24Indiana 4 18 2 19 0 4 3 1 27Iowa 0 1 0 0 0 0 0 0 0Kansas 3 5 0 5 0 1 5 1 26Kentucky 0 10 0 3 0 0 1 1 18Louisiana 6 9 0 3 0 1 2 0 8Maine 0 3 0 0 1 0 3 0 2Maryland 1 15 0 1 0 0 10 0 17Massachusetts 2 8 2 3 0 0 0 0 103Michigan 16 41 0 7 1 2 7 1 25Minnesota 13 28 0 10 1 2 13 0 86Mississippi 1 2 0 1 0 0 2 0 10Missouri 6 7 2 4 0 0 15 0 25Montana 3 6 0 2 0 1 3 1 9Nebraska 3 9 0 3 0 0 16 0 11Nevada 1 7 0 0 0 0 8 0 8New Hampshire 2 4 1 0 0 2 3 0 11New Jersey 1 11 0 3 0 0 0 0 11New Mexico 2 5 1 5 0 0 4 0 12New York 11 48 124 21 3 0 13 3 53North Carolina 14 13 0 5 0 1 10 0 33North Dakota 1 8 0 2 0 2 8 0 2Ohio 6 26 1 22 0 2 8 2 26Oklahoma 2 7 0 4 0 0 3 0 20Oregon 13 11 0 12 0 9 7 0 10Pacific Basin 0 1 0 2 0 0 0 0 11Pennsylvania 14 51 4 45 1 0 12 4 65Puerto Rico 0 1 0 7 0 0 4 0 32Rhode Island 0 4 0 0 0 0 0 0 4South Carolina 17 29 0 9 0 1 4 1 6South Dakota 0 6 2 3 0 0 0 0 2Tennessee 7 18 2 12 0 0 13 0 6Texas 72 110 3 89 0 14 120 1 297Utah 1 0 0 0 0 0 3 0 24Vermont 0 2 0 3 0 0 1 0 8Virgin Islands 0 0 0 0 0 0 0 0 0Virginia 14 12 1 9 1 0 9 0 27Washington 3 8 0 2 0 1 23 2 31West Virginia 19 13 0 16 0 1 7 0 25Wisconsin 29 20 2 7 0 4 14 0 18Wyoming 2 2 0 2 0 0 6 0 1
Total 549 880 167 512 53 129 452 26 1547
*Some states continue to provide services through the end of the school year in which the individual turns 22 years old
IDEA Part B Reported Category
National Deaf-Blind Child Count Summary December 1, 2013
(Ages birth through 21*)

Multiple
Disabilities Autism
Traumatic
Brain Injury
Developmentally
Delayed (optional
age 3 - 9)
Non-
Categorical
Unknown/ Not
Reported
Under Part B
Alabama 17 0 2 4 0 5 152
Alaska 8 1 0 2 0 1 24
Arizona 171 0 1 1 0 0 190
Arkansas 86 1 4 7 0 5 112
California 160 7 6 39 0 225 970
Colorado 40 0 0 0 0 7 108
Connecticut 27 1 0 11 0 0 53
Delaware 0 0 0 0 0 0 66
District of Columbia 10 0 0 1 0 0 13Florida 56 3 2 32 0 183 480Georgia 3 4 1 102 1 8 255Hawaii 36 0 0 0 0 4 54Idaho 24 0 1 24 0 0 58Illinois 133 3 3 22 0 13 388Indiana 103 1 1 1 0 1 185Iowa 0 0 0 0 67 1 69Kansas 58 2 2 14 0 5 127Kentucky 82 1 0 5 0 0 121Louisiana 41 0 1 5 0 0 76Maine 12 0 0 7 1 0 29Maryland 90 2 0 3 1 14 154Massachusetts 44 3 1 41 9 0 216Michigan 196 5 2 2 1 16 322Minnesota 116 2 1 33 0 0 305Mississippi 24 0 0 2 0 1 43Missouri 83 0 2 17 0 0 161Montana 10 0 0 3 1 0 39Nebraska 41 0 4 9 0 0 96Nevada 57 2 3 6 0 2 94New Hampshire 17 0 1 18 0 0 59New Jersey 138 0 1 19 1 0 185New Mexico 35 1 1 6 0 14 86New York 3 0 0 1 0 94 374North Carolina 151 4 3 15 0 0 249North Dakota 0 0 0 0 1 0 24Ohio 207 5 9 7 1 11 333Oklahoma 73 2 0 33 0 0 144Oregon 2 1 0 6 0 0 71Pacific Basin 28 0 0 0 0 7 49Pennsylvania 92 1 2 6 0 27 324Puerto Rico 24 0 0 0 1 0 69Rhode Island 36 1 0 1 0 0 46South Carolina 31 1 0 10 1 1 111South Dakota 11 0 1 0 1 1 27Tennessee 99 1 1 27 1 4 191Texas 31 2 4 5 3 11 762Utah 71 1 1 9 0 3 113Vermont 13 2 0 2 0 2 33Virgin Islands 0 0 0 0 0 16 16Virginia 81 2 1 11 1 1 170Washington 122 1 3 18 0 0 214West Virginia 17 0 0 4 0 0 102Wisconsin 31 0 4 8 0 7 144Wyoming 31 0 1 0 0 0 45
Total 3072 63 70 599 92 690 8901
*Some states continue to provide services through the end of the school year in which the individual turns 22 years old
Total
IDEA Part B Reported Category - Continued
National Deaf-Blind Child Count Summary December 1, 2013
(Ages birth through 21*)

Home
Community-
based Setting Other Setting
Unknown/
Missing
Alabama 2 0 0 0 2
Alaska 0 0 0 0 0
Arizona 17 0 0 0 17
Arkansas 1 0 0 0 1
California 28 2 2 6 38
Colorado 10 1 0 0 11
Connecticut 0 0 0 0 0
Delaware 8 0 0 0 8
District of Columbia 0 0 0 0 0
Florida 14 0 0 0 14
Georgia 17 1 0 1 19
Hawaii 4 0 0 0 4
Idaho 3 0 0 0 3
Illinois 12 0 1 0 13
Indiana 4 0 0 0 4
Iowa 3 0 0 0 3
Kansas 11 0 0 0 11
Kentucky 6 0 0 0 6
Louisiana 0 0 0 0 0
Maine 2 0 0 0 2
Maryland 2 0 0 0 2
Massachusetts 7 0 0 0 7
Michigan 9 1 0 0 10
Minnesota 25 3 1 0 29
Mississippi 2 1 0 0 3
Missouri 27 2 0 0 29
Montana 1 0 0 0 1
Nebraska 3 0 0 0 3
Nevada 10 0 0 0 10
New Hampshire 3 0 0 0 3
New Jersey 9 0 0 0 9
New Mexico 14 1 0 0 15
New York 0 0 0 10 10
North Carolina 17 4 0 0 21
North Dakota 1 0 0 0 1
Ohio 10 0 0 0 10
Oklahoma 3 0 0 0 3
Oregon 6 1 0 0 7
Pacific Basin 0 0 0 0 0
Pennsylvania 56 2 0 0 58
Puerto Rico 1 0 0 0 1
Rhode Island 0 0 0 0 0
South Carolina 18 2 0 0 20
South Dakota 5 0 0 0 5
Tennessee 37 0 0 0 37
Texas 41 2 2 0 45
Utah 12 0 1 0 13
Vermont 1 0 0 0 1
Virgin Islands 0 0 0 0 0
Virginia 7 0 3 0 10
Washington 19 0 1 0 20
West Virginia 1 0 1 0 2
Wisconsin 5 0 0 2 7
Wyoming 3 0 0 0 3
Total 497 23 12 19 551
*Some states continue to provide services through the end of the school year in which the individual turns 22 years old
National Deaf-Blind Child Count Summary December 1, 2013
(Ages birth through 21*)
Total
Early Intervention Setting - Birth through 2 years old

Regular
EC Setting
80% of
Time
Regular EC
Setting 40-
79% of Time
Regular
EC Setting
< 40% of
Time
Separate
Class
Separate
School
Residential
Facility
Service
Provider
Location Home
Unknown/
Missing
Alabama 1 0 0 3 4 0 1 3 0 12
Alaska 0 0 1 0 0 0 0 2 1 4
Arizona 0 0 5 5 14 0 0 0 0 24
Arkansas 1 0 1 0 5 1 1 2 0 11
California 9 5 4 34 11 0 1 8 69 141
Colorado 7 0 1 4 1 0 0 2 4 19
Connecticut 2 0 0 0 0 0 1 2 0 5
Delaware 0 1 0 0 4 1 0 0 0 6
District of Columbia 0 0 0 0 4 0 0 0 2 6
Florida 4 0 3 12 3 0 1 4 55 82
Georgia 3 1 1 18 2 1 2 7 9 44
Hawaii 1 1 0 9 0 0 0 1 2 14
Idaho 1 3 5 0 0 0 1 0 0 10
Illinois 6 3 7 17 8 0 0 1 5 47
Indiana 2 2 2 12 0 2 0 7 0 27
Iowa 1 0 0 4 0 0 0 0 1 6
Kansas 6 4 5 1 1 1 0 4 0 22
Kentucky 2 1 4 0 1 0 0 0 0 8
Louisiana 0 0 0 0 0 0 0 1 0 1
Maine 1 0 1 0 4 0 0 2 0 8
Maryland 0 1 2 1 8 0 0 6 6 24
Massachusetts 3 2 4 1 0 0 2 9 0 21
Michigan 1 4 4 5 15 1 1 0 0 31
Minnesota 2 10 2 14 9 0 0 8 0 45
Mississippi 2 1 1 4 0 0 0 1 0 9
Missouri 2 2 0 8 2 0 1 4 0 19
Montana 0 1 2 0 0 0 0 0 0 3
Nebraska 5 3 0 0 2 0 0 0 0 10
Nevada 0 0 4 19 3 0 0 3 0 29
New Hampshire 1 3 0 3 0 0 0 5 0 12
New Jersey 1 2 1 8 3 1 1 5 0 22
New Mexico 6 1 0 2 3 0 1 1 7 21
New York 0 0 2 1 1 6 0 0 16 26
North Carolina 3 2 0 5 9 0 1 5 0 25
North Dakota 2 0 0 2 1 0 0 0 2 7
Ohio 9 7 0 4 3 0 1 2 1 27
Oklahoma 0 2 3 2 0 0 0 0 2 9
Oregon 2 3 0 1 0 0 0 0 3 9
Pacific Basin 2 4 0 0 0 0 0 0 0 5
Pennsylvania 6 1 1 9 15 0 0 12 11 55
Puerto Rico 1 0 0 0 0 0 2 1 0 4
Rhode Island 0 0 0 0 0 0 0 0 0 0
South Carolina 0 3 3 0 0 3 0 6 2 17
South Dakota 3 0 0 0 0 0 0 0 0 3
Tennessee 4 1 0 15 5 0 2 9 2 38
Texas 41 11 16 16 5 2 5 12 10 118
Utah 1 0 0 7 6 0 0 2 1 17
Vermont 1 2 0 0 0 0 0 2 1 6
Virgin Islands 0 0 0 0 0 0 0 0 0 0
Virginia 1 3 2 6 1 0 0 1 6 20
Washington 2 0 6 16 0 0 1 3 0 28
West Virginia 1 2 2 0 0 0 0 2 6 13
Wisconsin 4 0 0 5 1 0 0 1 5 16
Wyoming 5 0 1 2 0 0 0 1 0 9
Total 158 92 96 275 154 19 26 147 229 1196
*Some states continue to provide services through the end of the school year in which the individual turns 22 years old
National Deaf-Blind Child Count Summary December 1, 2013
(Ages birth through 21*)
Total
Educational Setting ECSE (3-5) Settings

Regular
class >
80%
Regular
Class 40 -
79%
Regular
Class <
40%
Separate
School
Residential
Facility
Homebound
Hospital
Parentally
Placed Private
School
Unknown
/Missing
Alabama 8 2 76 22 31 1 0 0 140
Alaska 4 1 8 3 0 0 1 3 20
Arizona 17 16 85 43 0 4 1 0 166
Arkansas 4 4 51 4 17 19 0 2 101
California 149 38 331 141 20 32 20 98 829
Colorado 17 14 32 15 6 4 0 1 89
Connecticut 6 1 13 19 3 6 0 0 48
Delaware 6 1 11 33 1 8 0 0 60
District of Columbia 0 0 0 1 0 0 0 6 7
Florida 65 26 145 77 2 16 5 62 398
Georgia 32 9 125 23 0 17 2 2 210
Hawaii 2 2 23 5 1 1 1 5 40
Idaho 2 2 30 3 2 5 4 0 48
Illinois 34 22 175 63 18 16 13 1 342
Indiana 23 17 82 9 17 7 2 1 158
Iowa 8 9 33 11 0 1 1 0 63
Kansas 10 14 60 8 6 3 4 0 105
Kentucky 17 23 51 4 7 10 1 0 113
Louisiana 9 3 34 6 10 8 4 1 75
Maine 5 8 3 2 2 1 0 0 21
Maryland 8 2 11 22 1 2 7 77 130
Massachusetts 31 24 70 57 2 10 1 0 195
Michigan 35 22 45 161 14 11 3 0 291
Minnesota 49 41 117 20 17 14 2 0 260
Mississippi 0 3 21 2 1 7 0 0 34
Missouri 14 27 34 52 1 12 1 1 142
Montana 2 8 11 4 1 4 3 3 36
Nebraska 18 22 25 12 5 3 1 0 86
Nevada 3 2 27 17 0 12 1 3 65
New Hampshire 8 4 13 9 2 10 1 0 47
New Jersey 14 17 13 114 1 3 1 0 163
New Mexico 5 4 19 16 1 8 0 12 65
New York 38 6 121 50 20 3 49 61 348
North Carolina 18 15 69 49 60 10 2 1 224
North Dakota 2 4 4 0 6 1 0 0 17
Ohio 28 30 84 123 5 24 8 4 306
Oklahoma 6 23 94 2 2 5 2 1 135
Oregon 12 6 37 1 1 3 2 0 62
Pacific Basin 2 9 15 1 0 6 3 7 44
Pennsylvania 64 33 53 82 11 2 13 11 269
Puerto Rico 10 2 21 14 0 16 2 0 65
Rhode Island 2 5 20 17 0 2 0 0 46
South Carolina 8 2 42 12 20 8 2 0 94
South Dakota 7 2 6 1 5 1 2 0 24
Tennessee 28 14 54 25 7 21 4 0 153
Texas 113 67 351 23 28 54 7 1 644
Utah 6 5 33 51 0 1 0 0 96
Vermont 7 9 7 1 1 2 0 0 27
Virgin Islands 0 0 5 0 0 0 4 7 16
Virginia 13 5 60 19 7 0 2 44 150
Washington 29 15 117 4 6 3 12 0 186
West Virginia 10 10 30 0 19 6 0 14 89
Wisconsin 15 10 66 9 5 7 8 8 128
Wyoming 3 4 26 0 0 2 1 0 36
Total 1026 664 3089 1462 392 432 203 437 7706
*Some states continue to provide services through the end of the school year in which the individual turns 22 years old
National Deaf-Blind Child Count Summary December 1, 2013
(Ages birth through 21*)
Total
Educational Setting School aged (6-21) Settings
(Appendix 5)
1
OHOA July 2013
Module 1: An Overview of Deaf-Blindness and
Instructional Strategies
Assignment: Learn More About Your Student’s
Etiology
Directions:
A. Review what you know about your student’s deaf-blindness etiology. You
might want to talk to other team members or review assessment reports
or other records if they are available. (If you are not currently working
with a student, go the “Example Student Folder” for information).
B. Locate an article or other resource either about the etiology. Places to
get resources:
a. Use the document “Etiologies and Characteristics of Deaf-
Blindness.”
b. NCDB Library: nationaldb.org/library
i. Enter the name of the condition in the search box
ii. In the “Filter by” box, click on “Key Resource”
c. Another library
d. A team member or colleague
e. Internet
C. Respond to the following questions for a student you work with or the
example student.
*******
1. What is the etiology of the student’s deaf-blindness?
2. Is this one of the causes identified on the “List of Conditions, Syndromes,
and Disorders Associated with Combined Vision and Hearing Loss”?
3. Describe how this etiology is acquired (e.g., genetic, acquired during
pregnancy or labor and deliver, due to injury).
4. Is the condition progressive? That is, does vision or hearing loss get worse
over time?

(Appendix 5)
2
OHOA July 2013
5. What are the visual implications of this etiology?
6. What are the auditory (hearing) implications of this etiology?
7. Are there other implications (e.g., additional disabilities or challenges)?
8. Are there medical issues associated with this etiology?
9. What organizations provide information and resources about this etiology?
(Hint: www.rarediseases.org is a good place to look for organizations.)
This assignment was adapted by Kathee Scoggin from Carolyn Monaco’s
“Etiology Form for Intervenors.”

(Appendix 6)
1
OHOA July 2013
Module 1: An Overview of Deaf-Blindness and
Instructional Strategies
Think-Reflect-Pair and Share Activity Instructions
Directions:
Review the notes you’ve made so far in your intervener journal and think about
what you have learned so far. What mattered to you in the videos and readings?
What did you learn? Add to your notes and share them with an instructor,
colleague, or friend. Document the other person’s responses and thoughts.
Sample Think-Reflect-Pair and Share Form:
Idea that I will use: Idea that I will share: Thoughts from a
mentor/instructor/peer
or friend on what I
shared:
Giving the student
plenty of wait time to
listen.
The video link that
shows a student
thinking and then
responding.
A parent who has a
child who is deaf-blind
thanked me. She
mentioned how hard it
is to wait because her
schedule is so busy. She
wants to listen to her
daughter in a new way.
(Appendix 7)
1
OHOA July 2013
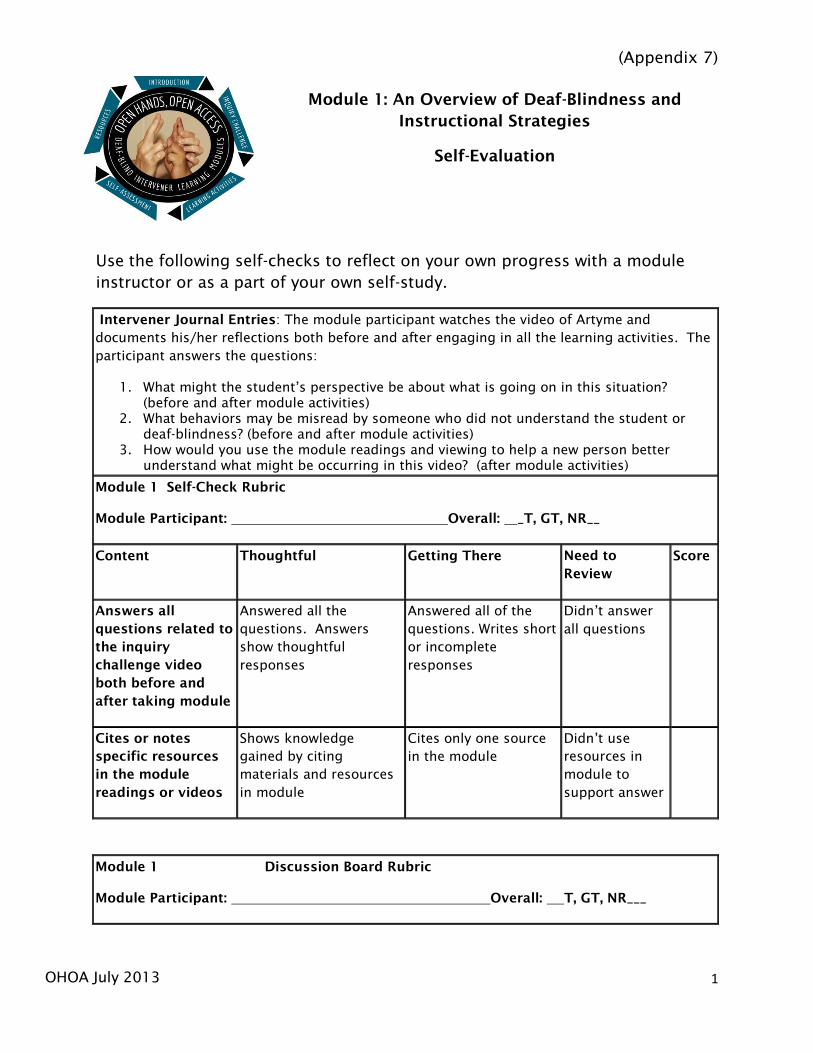
Module 1: An Overview of Deaf-Blindness and
Instructional Strategies
Self-Evaluation
Use the following self-checks to reflect on your own progress with a module
instructor or as a part of your own self-study.
Intervener Journal Entries: The module participant watches the video of Artyme and
documents his/her reflections both before and after engaging in all the learning activities. The
participant answers the questions:
1. What might the student’s perspective be about what is going on in this situation?
(before and after module activities)
2. What behaviors may be misread by someone who did not understand the student or
deaf-blindness? (before and after module activities)
3. How would you use the module readings and viewing to help a new person better
understand what might be occurring in this video? (after module activities)
Module 1 Self-Check Rubric
Module Participant: Overall: _T, GT, NR__
Content Thoughtful Getting There Need to
Review
Score
Answers all
questions related to
the inquiry
challenge video
both before and
after taking module
Answered all the
questions. Answers
show thoughtful
responses
Answered all of the
questions. Writes short
or incomplete
responses
Didn’t answer
all questions
Cites or notes
specific resources
in the module
readings or videos
Shows knowledge
gained by citing
materials and resources
in module
Cites only one source
in the module
Didn’t use
resources in
module to
support answer
Module 1 Discussion Board Rubric
Module Participant: Overall: T, GT, NR___

(Appendix 7)
2
OHOA July 2013
Content Thoughtful Getting There Needs Review Score
The participant
responds to the
prompt questions
and reflects
knowledge of state
census and
resources
offers correct
information on state
census and resources in
her own state as well as
4 additional states.
offers correct
information about her
state’s census but
shares info about less
than 4 other states.
responds to
less than
requested in
the prompts
and does not
reflect
knowledge.
The participant
reflects upon at least
two other
participants’ posts
thoughtfully.
comments upon at least
two other participants’
posts thoughtfully
posts comments on
one other participant’s
posts thoughtfully.
Does not post
on others’
responses
Module 1 Learn More About Your Student’s Etiology
Module Participant: Overall: T, GT, NR__
Content Thoughtful Getting There Needs Review Score
Participant
documents student’s
etiology from file
Evidence of use of the
student’s information or
case study info
States etiology but
doesn’t reference the
student’s file
Doesn’t
reference the
file or state
etiology
Participant
researches etiology
using recommended
sources
Documents 2 or more
reputable sources
Documents 1 source Doesn’t
reference
sources
Participant answers
all questions
Responds to all
questions on etiology
form for interveners
Responds to most
questions
Responds to
few or no
questions
Module 1 Think, Reflect, Pair & Share Form
Module Participant: Overall: T, GT, NR__

(Appendix 7)
3
OHOA July 2013
Content Thoughtful Getting There Needs Review Score
Participant documents
reflections from all or
multiple readings and
videos
Documents from all or
almost all sources
Documents from half
of the readings
Documents
from 2 or less
of the
readings
Participant 5 or more
concrete ideas to share
with another
Documents 5 or more
ideas to share
Documents 3 ideas to
share
Documents 1-
2 ideas to
share
Participant documents
several thoughts from an
instructor/peer/colleague
Documents 5 or more
thoughts from a peer
or instructor based on
sharing of ideas
Documents 2-3 ideas
from a peer or
instructor based on
sharing of ideas
Documents 1
idea from a
peer or
instructor
Module 1 Module Quiz
Participant: Quiz: / _10___
Content Thoughtful Getting There Needs Review Score
Multiple Choice Quiz
Using Module Notes
9-10 Correct 7 to 8 Correct Less than 6
Correct

(Appendix 8)
1
OHOA July 2013
Module 1: An Overview of Deaf-Blindness and
Instructional Strategies
References
Alsop, L., Blaha, R., & Kloos, E. (2000). Intervener in early intervention and
educational settings for children and youth with deafblindness.
Monmouth, OR: Western Oregon University, Teaching Research, National
Technical Assistance Consortium for Children and Young Adults Who Are
Deaf-Blind. Retrieved June 21, 2013 from
http://nationaldb.org/library/page/1320
Blaha, R., & Carlson, B. (2007). Assessment of deafblind access to manual
language systems (ADAMLS). Monmouth, OR: DB-LINK, Teaching Research
Institute, Western Oregon University. Retrieved June 21, 2013 from
http://nationaldb.org/library/page/88
McInnes, J. M. (1999). Deafblindness: A unique disability. In J. M. McInnes (Ed.),
A guide to planning and support for individuals who are deafblind, pp. 3-
33. Toronto: University of Toronto Press.
Miles, B. (2003, revised). Talking the language of the hands to the hands.
Retrieved from http://nationaldb.org/library/page/1930
Miles, B. (1999). Conversation: The essence of communication. In B. Miles & M.
Riggio (Eds.), Remarkable conversations: A guide to developing
meaningful communication with children and young adults who are
deafblind, pp. 54-75. Watertown, MA: Perkins School for the Blind.
National Consortium on Deaf-Blindness. (2012.) The 2011 national child count
of children and youth who are deaf-blind. Retrieved from:
http://nationaldb.org/library/page/2199
National Consortium on Deaf-Blindness. (2007). Practice Perspectives: Children
who are deaf-blind. Retrieved from
http://nationaldb.org/library/page/2064
Riggio, M. & McLetchie B. (Eds.) (2008). Deafblindness: Educational service
guidelines. Watertown, MA: Perkins School for the Blind. Retrieved June
24, 2013 from http://www.perkins.org/resources/educational-
publications/deafblindness-educational-service-guidelines/db-guidelines-
english.html

(Appendix 8)
2
OHOA July 2013
Rowland, C., Schweigert, P. D. , & Prickett, J. G. (1995). Communication
systems, devices, and modes. In K. M. Huebner, J. G. Prickett, T. R. Welch,
& E. Jofee (Eds.), pp. 219-257. Hand in hand: Essentials of communication
and orientation and mobility for your students who are deaf-blind. New
York AFB Press.
Washington Sensory Disability Services (WSDS). (2013). Usher syndrome.
Retrieved June 20, 2013 http://www.wsdsonline.org/video-library/deaf-
blind-videos/usher-syndrome
Texas Deafblind Outreach. (2003). IEP quality indicators for students with
deafblindness. Retrieved June 21, 2013 from
http://www.tsbvi.edu/attachments/1800_IEP_Indicators.pdf
Texas School for the Blind and Visually Impaired (TSBVI). 2010). Tactile symbols
directory to standard tactile symbol list. Retrieved June 21, 2103 from
http://www.tsbvi.edu/tactile-symbols