lysosomotropic drugs activate tfeb via lysosomal membrane … · lysosomotropic drugs activate tfeb...
TRANSCRIPT

Zhitomirsky et al. Cell Death and Disease (2018) 9:1191
https://doi.org/10.1038/s41419-018-1227-0 Cell Death & Disease
ART ICLE Open Ac ce s s
Lysosomotropic drugs activate TFEB vialysosomal membrane fluidization andconsequent inhibition of mTORC1 activityBenny Zhitomirsky1,2, Anna Yunaev1,2, Roman Kreiserman2, Ariel Kaplan2, Michal Stark1,2 and Yehuda G. Assaraf 1,2
AbstractTranscription factor EB (TFEB) is a master transcriptional regulator playing a key role in lysosomal biogenesis,autophagy and lysosomal exocytosis. TFEB activity is inhibited following its phosphorylation by mammalian target ofrapamycin complex 1 (mTORC1) on the surface of the lysosome. Phosphorylated TFEB is bound by 14-3-3 proteins,resulting in its cytoplasmic retention in an inactive state. It was suggested that the calcium-dependent phosphatasecalcineurin is responsible for dephosphorylation and subsequent activation of TFEB under conditions of lysosomalstress. We have recently demonstrated that TFEB is activated following exposure of cancer cells to lysosomotropicanticancer drugs, resulting in lysosome-mediated cancer drug resistance via increased lysosomal biogenesis, lysosomaldrug sequestration, and drug extrusion through lysosomal exocytosis. Herein, we studied the molecular mechanismunderlying lysosomotropic-drug-induced activation of TFEB. We demonstrate that accumulation of lysosomotropicdrugs results in membrane fluidization of lysosome-like liposomes, which is strictly dependent on the acidity of theliposomal lumen. Lysosomal accumulation of lysosomotropic drugs and the consequent fluidization of the lysosomalmembrane, facilitated the dissociation of mTOR from the lysosomal membrane and inhibited the kinase activity ofmTORC1, which is necessary and sufficient for the rapid translocation of TFEB to the nucleus. We further show thatwhile lysosomotropic drug sequestration induces Ca2+ release into the cytoplasm, facilitating calcineurin activation,chelation of cytosolic Ca2+, or direct inhibition of calcineurin activity, do not interfere with drug-induced nucleartranslocation of TFEB. We thus suggest that lysosomotropic drug-induced activation of TFEB is mediated by mTORC1inhibition due to lysosomal membrane fluidization and not by calcineurin activation. We further postulate that apartfrom calcineurin, other constitutively active phosphatase(s) partake in TFEB dephosphorylation and consequentactivation. Moreover, a rapid export of TFEB from the nucleus to the cytosol occurs upon relief of mTORC1 inhibition,suggesting that dephosphorylated TFEB constantly travels between the nucleus and the cytosol, acting as a rapidlyresponding sensor of mTORC1 activity.
IntroductionSmall molecules with hydrophobic weak base properties
markedly accumulate in lysosomes via a mechanismknown as ion trapping; due to their hydrophobic nature,
these compounds cross the plasma membrane and lyso-somal membrane via diffusion. However, upon encoun-tering the acidic lumen of the lysosome, the weakly basicresidues of these compounds become protonated, pre-venting them from crossing the lysosomal membraneback to the cytoplasm1–4. We have recently demonstratedthat lysosomal sequestration of anticancer drugs con-tributes to cancer drug resistance by reducing the con-centration of these drugs at their cellular target sites andby activating lysosomal exocytosis, resulting in the
© The Author(s) 2018OpenAccessThis article is licensedunder aCreativeCommonsAttribution 4.0 International License,whichpermits use, sharing, adaptation, distribution and reproductionin any medium or format, as long as you give appropriate credit to the original author(s) and the source, provide a link to the Creative Commons license, and indicate if
changesweremade. The images or other third partymaterial in this article are included in the article’s Creative Commons license, unless indicated otherwise in a credit line to thematerial. Ifmaterial is not included in the article’s Creative Commons license and your intended use is not permitted by statutory regulation or exceeds the permitted use, you will need to obtainpermission directly from the copyright holder. To view a copy of this license, visit http://creativecommons.org/licenses/by/4.0/.
Correspondence: Yehuda G. Assaraf ([email protected])1The Fred Wyszkowski Cancer Research Laboratory, Technion-Israel Institute ofTechnology, Haifa, Israel2Department of Biology, Technion-Israel Institute of Technology, Haifa, IsraelThese authors contributed equally: Benny Zhitomirsky, Anna YunaevEdited by A. Oberst
Official journal of the Cell Death Differentiation Association
1234
5678
90():,;
1234
5678
90():,;
1234567890():,;
1234
5678
90():,;

extrusion of the sequestered drugs from the cells2,5–7.Furthermore, lysosomal sequestration of anticancer drugstriggered lysosomal biogenesis via activation and nucleartranslocation of transcription factor EB (TFEB)5, themaster regulator of lysosomal biogenesis, and an activatorof autophagy and lysosomal exocytosis8–11. We haveshown that drug naïve cells with intrinsically higherlysosome number per cell, sequester lysosomotropicchemotherapeutics more efficiently away from their targetsites when compared to cells with low-lysosome numberper cell, which contributes to an enhanced intrinsicresistance to lysosomotropic chemotherapeutics. Basedon these collective findings, we have proposed a novelmodel for drug-induced lysosome-mediated acquireddrug resistance, in which lysosomal accumulation ofanticancer drugs induces TFEB-mediated lysosomal bio-genesis, an elevation in lysosome number per cell, andconsequent chemoresistance due to increased lysosomaldrug sequestration5.TFEB was shown to control lysosomal biogenesis via the
transcriptional activation of genes from the coordinatedlysosomal expression and regulation (CLEAR) pathway,upon its translocation into the nucleus10,12. The activity ofTFEB is inhibited via its phosphorylation on Ser211 bymammalian target of rapamycin complex 1 (mTORC1)13.mTORC1, a serine/threonine protein kinase whichresponds to cellular stress cues such as deprivation ofamino acids, low oxygen tension, changes in energyavailability and various growth factors, is responsible forthe promotion of cell growth by regulating anabolic andcatabolic processes. mTORC1 is one of two complexes inwhich mTOR is a core component, the other beingmTORC2, which regulates metabolism and cell survivaland was shown to effect the actin cytoskeleton, but has noeffect on TFEB phosphorylation and inactivation14,15. Thephosphorylation of TFEB by mTORC1 enables its bindingby 14-3-3 proteins to TFEB, resulting in its retention inthe cytoplasm. mTORC1 was shown to phosphorylateTFEB on the lysosomal surface, while TFEB was shown tobe recruited to the lysosomal surface via interaction withRag guanosine triphosphatases (GTPases)16,17. TFEBdephosphorylation and consequent activation is attrib-uted to the calmodulin-regulated calcium-dependentprotein phosphatase calcineurin. It was suggested thatcalcineurin dephosphorylates TFEB upon Ca2+ releasefrom the lysosome through the Ca2+ channel mucolipin 1(MCOLN1)9. It was postulated that cues inducing lyso-somal stress, including starvation and physical exercise,activate MCOLN1, resulting in an efflux of Ca2+ from thelysosome, a cytoplasmic increase in Ca2+ concentrationsand consequent activation of calcineurin. The latterdephosphorylates TFEB, leading to TFEB translocation tothe nucleus, and consequent activation of lysosomal bio-genesis and autophagy9.
The lysosomotropic drug (LD) siramesine exerts lyso-somal membrane permeabilization (LMP) and lysosomalleakage, and provokes reactive oxygen species generationvia a detergent-like activity18,19. However, the impact ofLD sequestration on the lysosomal membrane remainsunclear. Herein, we explored this impact and the mole-cular mechanism underlying drug-induced activation ofTFEB. We present the first evidence suggesting that LDsinhibit the kinase activity of mTORC1 via fluidization ofthe lysosomal membrane, and that this inhibitory effect isthe driving force behind the drug-induced activation ofTFEB that is independent of calcineurin, resulting inelevated lysosomal biogenesis, lysosomal exocytosis, andautophagy.
ResultsLDs induce lumen acidity-dependent membranefluidization of lysosome-like liposomes and inhibitmTORC1 kinase activityWe employed the fluorescence recovery after photo-
bleaching (FRAP) assay to explore the impact of LDs onmembrane fluidity of lysosomal-like liposomes. Lipo-somes that mimic the lipid composition of the lysosomalmembrane were prepared20 (see Materials and methods).Lissamine rhodamine-tagged lipids were integrated intothe liposomes, hence marking their membrane with redfluorescence. Liposomes were loaded with either an acidic(pH 5.0) or a neutral (pH 7.4) buffer solution. Liposomeswere preincubated for 30min with the LDs: sigma-2receptor ligand siramesine (10 μM) and the receptor tyr-osine kinase (RTK) inhibitor sunitinib (10 μM), currentlyused for the treatment of renal cell cancer. The localanesthetic membrane fluidizing agent dibucaine (2 mM)was used as a positive control. Following preincubationwith the drugs, a segment of the liposomal membrane wasphotobleached, and the fluorescence recovery time viadiffusion of rhodamine-tagged lipids from the unbleachedsegment into the bleached zone was determined (Fig. 1a);a rapid fluorescence recovery was observed in the pho-tobleached zone. A significant ~25% reduction in thefluorescence recovery time was observed after incubationwith siramesine and sunitinib in liposomes loaded with anacidic buffer solution, indicating liposome membranefluidization. Remarkably, no decrease in the fluorescencerecovery time was recorded after incubation with sir-amesine and sunitinib in liposomes loaded with a neutralbuffer solution. Expectedly, dibucaine markedly decreasedthe fluorescence recovery time independently of liposo-mal pH (Fig. 1b). These results demonstrate for the firsttime that hydrophobic weakly basic LDs induce a lumenpH-dependent membrane fluidization of acidic organelles.It is important to note that the lysosomal membrane israther complex as it contains multiple integral proteinsand various lipids when compared to the liposomes used
Zhitomirsky et al. Cell Death and Disease (2018) 9:1191 Page 2 of 15
Official journal of the Cell Death Differentiation Association
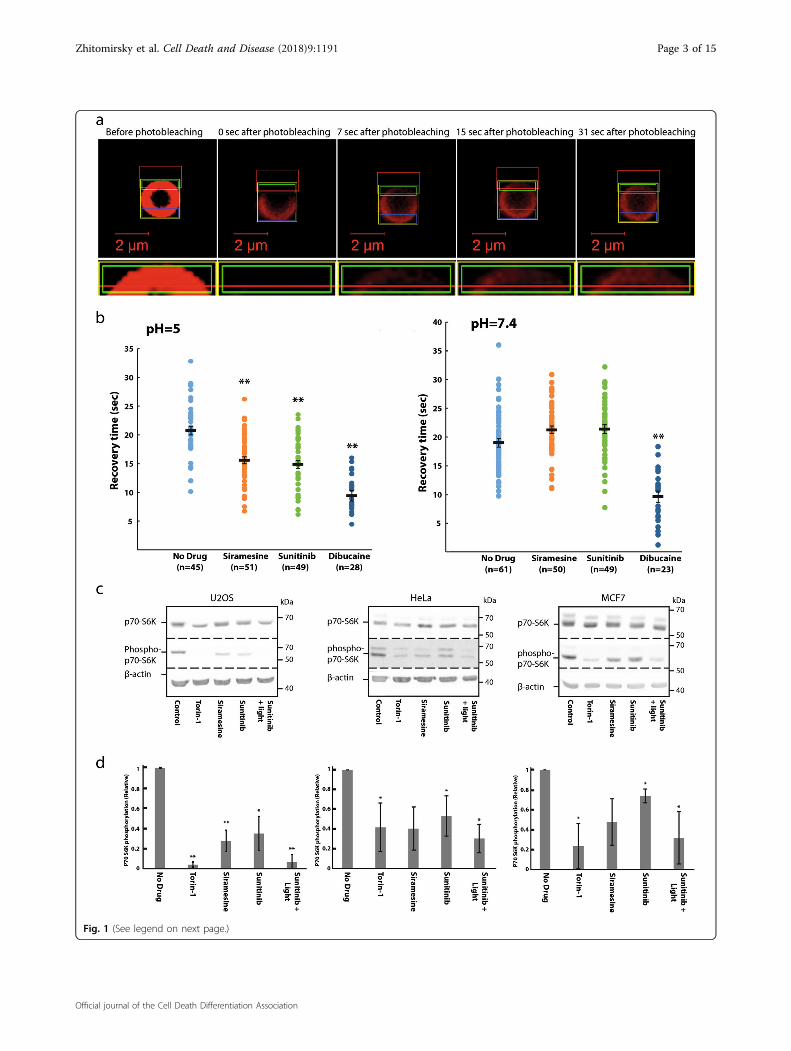
Fig. 1 (See legend on next page.)
Zhitomirsky et al. Cell Death and Disease (2018) 9:1191 Page 3 of 15
Official journal of the Cell Death Differentiation Association

in this FRAP analysis. As these differences might possiblyhave an effect on the extent of drug-induced membranefluidization, additional dedicated studies are warranted tofurther determine the extent and significance of drug-induced membrane fluidization on lysosomes.Since the lysosomal membrane was shown to act as a
hub for signal transduction from the lysosome into thenucleus10, we postulated that this drug-induced mem-brane fluidization might play a significant role in thepreviously reported drug-induced lysosomal signaling5,6.We specifically postulated that lysosomal accumulationof LDs and consequent membrane fluidization, mightdisrupt the kinase activity of mTORC1, which resideson the lysosomal membrane. We hence performedWestern Blot (WB) analysis to determine the phos-phorylation level of the established mTORC1 substratep70S6 kinase (p70-S6K), following exposure of humanosteosarcoma U2OS cells, breast cancer MCF-7 cells aswell as cervical cancer HeLa cells to siramesine andsunitinib. These LDs, as well as Torin-1, a potent mTORinhibitor, blocked mTORC1 kinase activity in all threehuman tumor cell lines as evident from the significantlyreduced levels of p70-S6K phosphorylation (Fig. 1c).When cells loaded with sunitinib were illuminated toinduce a lysosome-mediated photodynamic effect aspreviously reported21, inhibition of mTORC1 kinaseactivity was further enhanced. This result, which repre-sents the first indication of LD-induced inhibition ofmTORC1 activity, suggests that drug-induced activationof TFEB is presumably a result of inhibition of mTORC1-mediated TFEB phosphorylation.
LDs induce the release of mTOR from the surface oflysosomesIt was previously demonstrated that the recruitment of
mTORC1 to the lysosomal membrane is essential for itsactivation22,23. We thus postulated that the membranefluidization identified in our current study, might lead tothe dissociation of mTORC1 from the lysosomal mem-brane, resulting in inhibition of mTORC1 kinase activity.To explore this hypothesis, U2OS cells were treated with
either the vehicle (0.1% DMSO), Torin-1 (10 nM), sir-amesine (10 µM), sunitinib (10 µM), or sunitinib withillumination for 3 hr. An immunofluorescence assay wasused to follow mTOR and the lysosomal membrane pro-tein LAMP1. In control cells incubated in the absence ofdrugs, mTOR was highly localized on the lysosomalmembrane, as evident from its co-localization with LAMP1and its relatively low levels in the cytosol (Fig. 2a–d). ThemTOR inhibitor Torin-1, which directly and specificallyinhibits mTORC1 activity via an ATP-comparativemechanism24, did not modulate the lysosomal localiza-tion of mTOR (Fig. 2e–h). It is noteworthy, however, thatTorin-1 treatment resulted in an apparent increase in thetotal mTOR levels within the cells. We postulate that thismight be indicative of activation of a compensatorytranslational mechanism due to reduced mTOR activity.Remarkably, siramesine treatment resulted in a marked
release of mTORC1 from the lysosomal membrane asevident from the reduced co-localization between mTORand LAMP1 along with a significant increase in cytosolicmTOR levels (Fig. 2i–l). Sunitinib treatment also resultedin a significant increase in cytosolic mTOR levels, indi-cative of mTOR release from the lysosomal membrane.However, the sunitinib-induced effect on mTOR locali-zation seemed to be to a lesser extent when compared tothat of siramesine, as significant levels of mTOR were stillco-localized with LAMP-1 on the lysosomal membrane insunitinib-treated cells (Fig. 2m–p). Intriguingly, illumi-nation of sunitinib-treated cells resulted in the dissocia-tion of the remaining mTOR from the lysosomalmembrane (Fig. 2q–t). As siramesine was previouslyshown to induce LMP18 and illuminating sunitinib-loadedcells results in photodestruction of lysosomes21, we pos-tulate that the release of mTORC1 from the lysosomalmembrane was a result of the combined effect of lyso-somal membrane fluidization and LMP.
LDs induce a rapid translocation of TFEB into the nucleusand transcriptional activation of CLEAR pathway genesTo follow the subcellular localization of TFEB,
U2OS, and MCF-7 cells were stably transfected with
(see figure on previous page)Fig. 1 Siramesine and sunitinib induce lumen acidity-dependent membrane fluidization in liposomes and inhibit mTORC-1-mediatedphosphorylation of p70-S6 kinase. a, b For FRAP analysis, red fluorescent liposomes were loaded with an acidic buffer (pH 5.0) or a neutral buffer(pH 7.4), and incubated for 30 min with siramesine (10 µM), sunitinib (10 µM), dibucaine (2 mM), or without any drug. A segment of the liposome wasphotobleached by a Zeiss LSM 700 confocal microscope. The fluorescence intensity of the photobleached area and an unbleached area, used asreference, were followed for 2 min by the confocal microscope. Fluorescence recovery time was calculated using integrated settings in the confocalmicroscope software as described in Materials and methods. **p Value < 0.01—two-tailed student's t test. Error bars indicate standard error of themean. Representative early time-course points of fluorescence recovery snapshots are shown to exemplify the rapid red fluorescence recovery in thephotobleached zone. c U2OS, MCF7, and HeLa cells were treated for 4 hr with Torin-1 (10 nM), siramesine (10 µM), sunitinib (10 µM), as well assunitinib (10 µM) with 1 hr of illumination. Cytosolic proteins were extracted from the cells, and WB analysis was performed using, p70-S6K andphospho-p70-S6K antibodies. A β-actin antibody was used to assess actual protein loading. d Band intensity was quantified using ImageJ software.Phosphorylation levels were determined by dividing the level of phospho-p70-S6K by the levels of total p70-S6K for each treatment. *p value < 0.05,**p value < 0.01 using two-tailed Student's t test
Zhitomirsky et al. Cell Death and Disease (2018) 9:1191 Page 4 of 15
Official journal of the Cell Death Differentiation Association

TFEB-eGFP (U2OS-TFEB-eGFP and MCF-7-TFEB-eGFP, respectively). To determine the impact of LD-dependent lysosomal membrane fluidization on thesubcellular localization of TFEB, U2OS-TFEB-eGFP,
and MCF-7-TFEB-eGFP cells were exposed to variousLDs including siramesine, sunitinib, and the anti-malarial drugs chloroquine and mefloquine. Time-lapse fluorescence microscopy revealed that these
Fig. 2 Immunofluorescence microscopy exploring the association of mTOR to lysosomes, following drug exposure. U2OS cells wereincubated with the indicated drugs for 3 hr and then subjected to immunofluorescence microscopy as detailed under Materials and methods. Thelocalization of mTOR (green fluorescence) was followed together with LAMP1 (red fluorescence) which was used as a lysosomal marker. The rightrow depicts blow-ups of areas from the merged photos showing the (dis)association of mTOR and LAMP1. Nuclei were stained with the blue DNAdye Hoechst 33342. Cells were visualized by scanning confocal microscopy at a ×63 magnification. All fields are representative of at least threeindependent experiments
Zhitomirsky et al. Cell Death and Disease (2018) 9:1191 Page 5 of 15
Official journal of the Cell Death Differentiation Association

drugs induced a rapid nuclear translocation of TFEB inboth tumor cell lines, which was evident as early as 90min after drug exposure, and further increased duringthe following hours of incubation (Fig. 3a, b and Sup-plementary Fig. S1). The impact of this nuclear trans-location of TFEB on the transcription of CLEAR geneswas determined by quantitative real-time polymerasechain reaction (PCR) analysis for glucosamine (N-acetyl)-6-sulfatase (GNS), cathepsin-D (CTSD), and V-type proton ATPase subunit HATPV1H (ATP6V1H)(Fig. 3c). An increase in the expression levels of thesegenes (up to twofold) was observed after exposure ofU2OS cells to siramesine (10 μM), sunitinib (10 μM),and chloroquine (100 μM), indicating that drug-inducednuclear translocation of TFEB results in transcriptionalactivation of the CLEAR network (Fig. 3c). WB analysiswas used to confirm that, in agreement with previousstudies15, following drug treatment, TFEB was translo-cated to the nucleus in its unphosphorylated form(Supplementary Fig. S2). Following exposure to sir-amesine, TFEB levels were markedly increased in thenucleus and its molecular weight was slightly decreasedpresumably as a result of its dephosphorylation (Fig. S2,compare lane 4 to lanes 2 and 3, respectively). This wasaccompanied by a decrease in the cytosolic levels of TFEB.In concordance with the results of our time-lapse fluor-escence microscopy analyses, sunitinib displayed a lesspronounced effect on TFEB translocation to the nucleus,however, illuminating the cells intensified this nucleartranslocation (Fig. S2, compare lanes 6 and 8 to lane 2).
LD-induced activation of TFEB is independent ofcalcineurin activityActivation of TFEB was suggested to be induced via Ca2+
release from the lysosome, and consequent activation of theCa2+-dependent serine/threonine phosphatase calcineurin9.To determine whether LDs induce Ca2+ release into thecytoplasm, U2OS cells were preincubated with the cell-permeable fluorescent calcium-binding dye Fluo-8-AM,followed by treatment with siramesine or chloroquine for15min, during which Fluo-8-AM fluorescence was visua-lized by time-lapse fluorescence microscopy. Drug treat-ment induced pulses of Ca2+ release into the cytoplasmwhich was evident by rapid transient pulse increases inFluo-8-AM fluorescence (Supplementary Videos 1a–c).These results suggest that treatment with siramesineand chloroquine, provokes the release of Ca2+ from theCa2+-rich lysosomal lumen into the cytoplasm. Pretreat-ment with the cell permeable Ca2+ chelator BAPTA-AMwas successfully used to chelate the Ca2+ released into thecytoplasm, following treatment with siramesine and chlor-oquine (Supplementary Videos 1d, e).The phosphorylation state of the transcription factor
Elk-1, a bona fide substrate of calcineurin25, was examined
by WB analysis, to determine whether said release of Ca2+
into the cytoplasm leads to calcineurin activation. Con-sistent with the previous result, exposure of U2OS cells tosiramesine and sunitinib resulted in increased depho-sphorylation of Elk-1, suggesting that the above reportedincrease in cytosolic Ca2+ levels resulted in the activationof calcineurin phosphatase activity (Fig. 4). Expectedly,the calcineurin inhibitor cyclosporin A (CsA) elevatedElk-1 phosphorylation levels, due to inhibition of calci-neurin phosphatase activity (Fig. 4). We thus postulatedthat pretreating U2OS-TFEB cells with BAPTA-AM willprevent drug-induced nuclear translocation of TFEB, dueto chelation of Ca2+, and consequent retention of calci-neurin in an inactive state. Surprisingly, pretreatment ofU2OS-TFEB-eGFP cells with BAPTA-AM did not pre-vent nuclear translocation of TFEB following exposure tosiramesine, sunitinib, or chloroquine (Fig. 5a). To furtherdetermine whether or not calcineurin activity is requiredfor the drug-induced activation of TFEB, U2OS-TFEB-eGFP cells were co-treated with the LDs siramesine,sunitinib and chloroquine, along with the establishedcalcineurin inhibitors CsA and FK-506 (tacrolimus). Inagreement with the previous result, direct pharmacologicinhibition of calcineurin did not prevent LD-inducedtranslocation of TFEB into the nucleus (Fig. 5b). Theseresults suggest that calcineurin activity is not required forthe dephosphorylation and activation of TFEB, and that adifferent, Ca2+-independent phosphatase(s) may possiblydephosphorylate TFEB and facilitate its nuclear translo-cation under these conditions.
LD-induced activation of TFEB is caused by mTORC1inhibitionTo determine whether or not inhibition of mTORC1 is
sufficient to induce nuclear TFEB translocation, U2OS-TFEB-eGFP cells were exposed to increasing concentra-tions of Torin-1, an established mTOR inhibitor24.Nanomolar concentrations of Torin-1 were sufficient toinduce a marked nuclear TFEB translocation as early as12min after drug exposure (Supplementary Fig. S3). Wetherefore postulated that this rapid nuclear TFEB trans-location following inhibition of mTORC1 suggests aconstitutive dephosphorylation of TFEB, which, undernormal conditions, is balanced by the constitutive phos-phorylation of TFEB by mTORC1. Disrupting this equi-librium by inhibition of mTORC1, results in a rapid shifttowards an unphosphorylated TFEB state, resulting in itsrapid nuclear translocation.To determine whether this drug-induced nuclear TFEB
translocation is reversible, U2OS-TFEB-eGFP cells weretreated with siramesine, sunitinib and Torin-1 for 2 hr, toinduce nuclear TFEB translocation. Following 2 hr of drugexposure, cells were washed, and incubated in drug-freemedium for an additional period of 2 hr. During this 4 hr
Zhitomirsky et al. Cell Death and Disease (2018) 9:1191 Page 6 of 15
Official journal of the Cell Death Differentiation Association

Fig. 3 (See legend on next page.)
Zhitomirsky et al. Cell Death and Disease (2018) 9:1191 Page 7 of 15
Official journal of the Cell Death Differentiation Association

incubation, TFEB-eGFP localization was visualized usingtime-lapse fluorescence microscopy (Fig. 6). Removal ofthe mTOR inhibitor Torin-1 from the growth mediumresulted in a rapid export of TFEB from the nucleus to thecytoplasm; as early as 30min after Torin-1 removal from
the medium, a dominant cytoplasmic TFEB localizationwas restored. Siramesine-induced nuclear TFEB translo-cation was also reversible, however, the export time ofTFEB into the cytoplasm after siramesine removal fromthe growth medium was slower, and even after 2 hr ofdrug removal the nuclear TFEB levels were significantlyhigher compared to untreated cells. Intriguingly, not onlythat sunitinib removal from the growth medium did notresult in the export of TFEB to the cytoplasm, but TFEBcontinued accumulating in the nucleus even after 2 hr ofdrug removal.An isobologram analysis was performed to explore drug
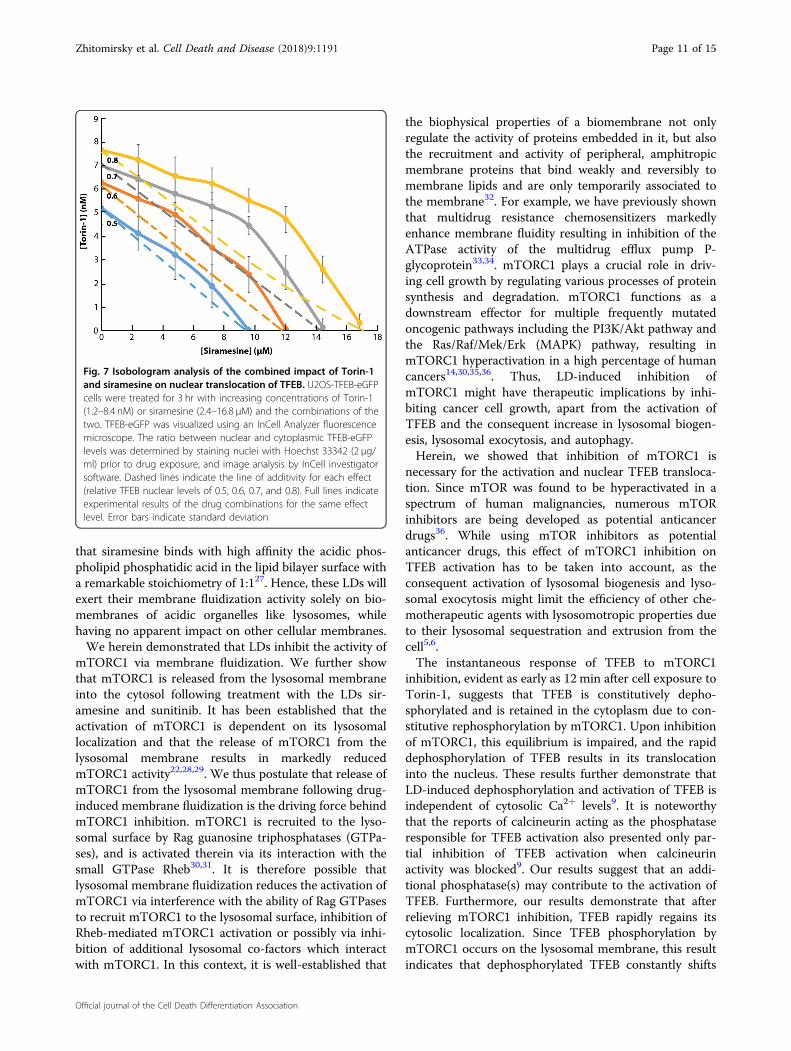
interaction between siramesine and Torin-1 by evaluatinginhibition of mTORC1, in regards to TFEB activation. Tothis end, U2OS-TFEB-eGFP cells were exposed toincreasing concentrations of siramesine alone, Torin-1alone, or combinations of the two compounds. Cells wereincubated for 3 hr with these drugs, followed by imagingof TFEB-eGFP localization using fluorescence microscopyand computational image quantification. This iso-bologram analysis demonstrated a slightly sub-additiveaffect between the two compounds, as evident from thelocation of the isoboles above the lines of additivity acrossthe different effect levels (Fig. 7). This result suggests thatboth siramesine and Torin-1 induce nuclear TFEBtranslocation via a similar mechanism, both inhibitingmTORC1 activity. We postulate that if siramesine was toactivate TFEB via a pathway unrelated to mTORC1inhibition, such as activation of TFEB dephosphorylation,a synergistic effect would be apparent in this analysis.
DiscussionOur current findings constitute the first demonstration
of lysosomal membrane fluidization by lysosomotropicanticancer drugs. Unlike the bona fide membrane fluidizerdibucaine, the LDs siramesine and sunitinib inducedmembrane fluidization only when the lumen of the lipo-somes was acidic, mimicking acidic lysosomes. From amechanistic perspective, we have previously suggestedthat due to their hydrophobic weakly basic nature, thesecompounds reside within the hydrocarbon core of thelipid bilayer via their multi-aromatic ring structure,whereas the basic amine residue(s) of the molecule ispresumably entrapped in a positively charged state withinthe acidic lumen of lysosomes7. Given the excessive
Fig. 4 Lysosomotropic drugs activate calcineurin, resulting indephosphorylation of its substrate Elk-1. a U2OS cells were treatedwith cyclosporin A (10 µM), siramesine (10 µM), or sunitinib (10 µM) for4 hr. Nuclear proteins were extracted from the cells, and WB analysiswas performed using Elk-1 and phospho-Elk-1 (Ser383)-specificantibodies. A β-actin-specific antibody was used to verify equalloading. b Band intensity was quantified using ImageJ software.Phosphorylation levels were determined by dividing the level ofphospho-Elk-1 by the levels of total Elk-1 for each treatment. *p value< 0.05, **p value < 0.01—two-tailed Student's t test
(see figure on previous page)Fig. 3 Lysosomotropic drugs induce a rapid translocation of TFEB into the nucleus and activation of the CLEAR network. a U2OS-TFEB-eGFPcells were incubated with siramesine (10 µM), sunitinib (10 µM), chloroquine (100 µM), or mefloquine (10 µM) for 3 hr. TFEB-eGFP was visualized by anInCell Analyzer fluorescence microscope every 30 min. b The ratio between nuclear and cytoplasmic TFEB-eGFP levels was determined by stainingnuclei with Hoechst 33342 prior to drug exposure (2 µg/ml, staining not shown), and image analysis by InCell investigator software. c U2OS cells wereincubated with siramesine (10 µM), sunitinib (10 µM), and chloroquine (100 µM) for 4, 8, or 16 hr, followed by RNA purification. Real-time PCR analysiswas performed to determine the levels of GNS, CTSD, and ATP6V1H mRNA. *p value < 0.05, **p value < 0.01—two-tailed Student's t test. Error barsindicate standard deviation
Zhitomirsky et al. Cell Death and Disease (2018) 9:1191 Page 8 of 15
Official journal of the Cell Death Differentiation Association

Fig. 5 Inhibition of calcineurin does not prevent drug-induced nuclear translocation of TFEB. a U2OS-TFEB-eGFP cells were preloaded withBAPTA-AM (10 µM, 30 min), washed and incubated with siramesine (10 µM), sunitinib (10 µM), or chloroquine (100 µM) for an additional 4 hr. b U2OS-TFEB-eGFP cells were co-treated with or without the calcineurin inhibitors CsA (10 µM), FK-506 (5 µM), or both, as well as with siramesine (10 µM),sunitinib (10 µM), or chloroquine (100 µM). TFEB-eGFP was visualized using an InCell Analyzer fluorescence microscope
Zhitomirsky et al. Cell Death and Disease (2018) 9:1191 Page 9 of 15
Official journal of the Cell Death Differentiation Association

accumulation of LDs in lysosomes2,4,5,26, they may exertmembrane fluidization, hence impairing the function ofcentral lysosomal membrane residents or protein com-plexes associated to the lysosomal membrane like
mTORC1. Our findings are in accord with previousresults with siramesine which was found to exert LMP,lysosomal leakage, and generation of reactive oxygenspecies18,19. Furthermore, previous studies have shown
Fig. 6 Cytoplasmic localization of TFEB is restored after removal of Torin-1 and siramesine, but not after removal of sunitinib from thegrowth medium. a U2OS-TFEB-eGFP cells were treated with Torin-1 (10 nM), siramesine (10 µM), or sunitinib (10 µM) for 2 hr. Following 2 hr ofincubation, cells were washed with fresh medium, and incubated with drug-free medium for an additional 2 hr. During these 4 hr of incubation TFEB-eGFP was visualized by an InCell Analyzer fluorescence microscope. b The ratio between nuclear and cytoplasmic TFEB-eGFP levels was determinedby staining nuclei with Hoechst 33342 (2 µg/ml) prior to drug exposure (nuclear staining is not shown), and image analysis by InCell investigatorsoftware. *p value < 0.05, **p value < 0.01—two-tailed Student's t test. Error bars denote standard deviation
Zhitomirsky et al. Cell Death and Disease (2018) 9:1191 Page 10 of 15
Official journal of the Cell Death Differentiation Association
that siramesine binds with high affinity the acidic phos-pholipid phosphatidic acid in the lipid bilayer surface witha remarkable stoichiometry of 1:127. Hence, these LDs willexert their membrane fluidization activity solely on bio-membranes of acidic organelles like lysosomes, whilehaving no apparent impact on other cellular membranes.We herein demonstrated that LDs inhibit the activity of
mTORC1 via membrane fluidization. We further showthat mTORC1 is released from the lysosomal membraneinto the cytosol following treatment with the LDs sir-amesine and sunitinib. It has been established that theactivation of mTORC1 is dependent on its lysosomallocalization and that the release of mTORC1 from thelysosomal membrane results in markedly reducedmTORC1 activity22,28,29. We thus postulate that release ofmTORC1 from the lysosomal membrane following drug-induced membrane fluidization is the driving force behindmTORC1 inhibition. mTORC1 is recruited to the lyso-somal surface by Rag guanosine triphosphatases (GTPa-ses), and is activated therein via its interaction with thesmall GTPase Rheb30,31. It is therefore possible thatlysosomal membrane fluidization reduces the activation ofmTORC1 via interference with the ability of Rag GTPasesto recruit mTORC1 to the lysosomal surface, inhibition ofRheb-mediated mTORC1 activation or possibly via inhi-bition of additional lysosomal co-factors which interactwith mTORC1. In this context, it is well-established that
the biophysical properties of a biomembrane not onlyregulate the activity of proteins embedded in it, but alsothe recruitment and activity of peripheral, amphitropicmembrane proteins that bind weakly and reversibly tomembrane lipids and are only temporarily associated tothe membrane32. For example, we have previously shownthat multidrug resistance chemosensitizers markedlyenhance membrane fluidity resulting in inhibition of theATPase activity of the multidrug efflux pump P-glycoprotein33,34. mTORC1 plays a crucial role in driv-ing cell growth by regulating various processes of proteinsynthesis and degradation. mTORC1 functions as adownstream effector for multiple frequently mutatedoncogenic pathways including the PI3K/Akt pathway andthe Ras/Raf/Mek/Erk (MAPK) pathway, resulting inmTORC1 hyperactivation in a high percentage of humancancers14,30,35,36. Thus, LD-induced inhibition ofmTORC1 might have therapeutic implications by inhi-biting cancer cell growth, apart from the activation ofTFEB and the consequent increase in lysosomal biogen-esis, lysosomal exocytosis, and autophagy.Herein, we showed that inhibition of mTORC1 is
necessary for the activation and nuclear TFEB transloca-tion. Since mTOR was found to be hyperactivated in aspectrum of human malignancies, numerous mTORinhibitors are being developed as potential anticancerdrugs36. While using mTOR inhibitors as potentialanticancer drugs, this effect of mTORC1 inhibition onTFEB activation has to be taken into account, as theconsequent activation of lysosomal biogenesis and lyso-somal exocytosis might limit the efficiency of other che-motherapeutic agents with lysosomotropic properties dueto their lysosomal sequestration and extrusion from thecell5,6.The instantaneous response of TFEB to mTORC1
inhibition, evident as early as 12 min after cell exposure toTorin-1, suggests that TFEB is constitutively depho-sphorylated and is retained in the cytoplasm due to con-stitutive rephosphorylation by mTORC1. Upon inhibitionof mTORC1, this equilibrium is impaired, and the rapiddephosphorylation of TFEB results in its translocationinto the nucleus. These results further demonstrate thatLD-induced dephosphorylation and activation of TFEB isindependent of cytosolic Ca2+ levels9. It is noteworthythat the reports of calcineurin acting as the phosphataseresponsible for TFEB activation also presented only par-tial inhibition of TFEB activation when calcineurinactivity was blocked9. Our results suggest that an addi-tional phosphatase(s) may contribute to the activation ofTFEB. Furthermore, our results demonstrate that afterrelieving mTORC1 inhibition, TFEB rapidly regains itscytosolic localization. Since TFEB phosphorylation bymTORC1 occurs on the lysosomal membrane, this resultindicates that dephosphorylated TFEB constantly shifts
Fig. 7 Isobologram analysis of the combined impact of Torin-1and siramesine on nuclear translocation of TFEB. U2OS-TFEB-eGFPcells were treated for 3 hr with increasing concentrations of Torin-1(1.2–8.4 nM) or siramesine (2.4–16.8 µM) and the combinations of thetwo. TFEB-eGFP was visualized using an InCell Analyzer fluorescencemicroscope. The ratio between nuclear and cytoplasmic TFEB-eGFPlevels was determined by staining nuclei with Hoechst 33342 (2 µg/ml) prior to drug exposure, and image analysis by InCell investigatorsoftware. Dashed lines indicate the line of additivity for each effect(relative TFEB nuclear levels of 0.5, 0.6, 0.7, and 0.8). Full lines indicateexperimental results of the drug combinations for the same effectlevel. Error bars indicate standard deviation
Zhitomirsky et al. Cell Death and Disease (2018) 9:1191 Page 11 of 15
Official journal of the Cell Death Differentiation Association

between the nucleus and the cytoplasm, and can thusrapidly respond to changes in the state of mTORC1activity.Based on the current cumulative findings and the data
from previous papers, we herein propose an integrativemodel for drug-induced lysosomal membrane fluidiza-tion, which leads to inhibition of mTORC1 kinase activity,resulting in a shift in the equilibrium of TFEB toward adephosphorylated state, thereby inducing TFEB translo-cation to the nucleus and consequent activation of theCLEAR gene network (Fig. 8).
Materials and methodsChemicalsSiramesine, chloroquine, cyclosporin A, FK-506 (tacro-
limus) and Hoechst 33342 were obtained from Sigma-Aldrich (St. Louis, MO, USA). BAPTA-AM was obtainedfrom Biotium, Inc. (Fremont, CA, USA). Torin-1 waspurchased from BioVision, Inc. (Milpitas, CA, USA).Sunitinib was a kind gift from Prof. A.W. Griffioen, VUMedical Center, Amsterdam, The Netherlands. 1,2-dio-leoyl-sn-glycero-3-phosphocholineall (DOPC), 1,2-dis-tearoyl-sn-glycero-3-phosphoethanolamine-N-[biotinyl(polyethylene glycol)-2000] (DSPE-PEG(2000) Biotin),1,2-dioleoyl-sn-glycero-3-phosphoethanolamine-N-(lissa-mine rhodamine B sulfonyl) (18:1 Liss-Rhod-PE) andcholesterol were obtained from Avanti Polar Lipids,(Alabaster, AL, USA). 1,2-Distearoyl-sn-glycero-3-phos-phoethanolamine (DSPE) were purchased from EchelonBiosciences Inc, (Salt Lake City, UT, USA). Streptavidin-coated 2 µm polystyrene microspheres were purchasedfrom Spherotech (Lake forest, Illinois, USA).
Liposome preparation and FRAP analysisUniform microsphere-supported bilayer membranes
were created via adsorption of liposomes to polystyrenemicrospheres37. The use of streptavidin-coated micro-spheres and biotin-labeled lipids with a PEG-2000 linker,results in a “hydration layer” that preserves the fluidity ofthe membrane38, and allows creating an interior envir-onment that differs from the surrounding one. In order tomimic the acidic lysosome lumen, we entrapped inside thesupported membrane an acidic solution (pH 5), while inthe extravesicular milieu we maintained a neutral pHsolution (pH 7.4) reflecting the cytoplasmic pH.Single unilamellar vesicles (SUVs) were prepared in a
glove box where the atmosphere containing O2 wasexchanged three times with N2. Totally, 300 nmol of lipidswith a composition that resembles that of lysosomes20
(molar ratio of DOPC:DSPE:Cholesterol:DSPE-PEG(2000)-Biotin:Liss-Rhod-PE 0.375:0.244:0.3505:0.02:0.005)were mixed in a clean glass vial from chloroform stocksolutions. The chloroform lipid mixture was dried under agentle stream of N2 for 30min while the glass vial was
slowly rotated, and further dried under vacuum (Speed-Vac, Labconco, USA) for 2 hr. The dry lipid film washydrated with 10mM Tris-HCl, 150mM NaCl at pH 7.4or, to mimic the lumen of the lysosome, at pH 5.0.Hydrated lipid films were then left at 4 °C overnight,vortexed (speed 8 in ZX3, VELP Scientifica, Italy) for 1 hrand sonicated in a bath sonicator (S10H elmasonic,ELMA, Germany) for an additional 1 hr. A homogeneouspopulation of small unilamellar vesicles was formed byrepeated (40 times) extrusion through 100 nm poly-carbonate filters using an extruder (Avanti Polar Lipids,USA).Coating of the microspheres was achieved by mixing
equal volumes (50 µL) of SUVs (0.6mM) and freshlycleaned 2 µm microspheres 0.6% (W/V) with 100 µL of10mM Tris-HCl, 150mM NaCl at pH 7.4 or pH 5.0 in a1.5ml Eppendorf test tube. The tube was placed in a bathsonicator for 15min sonication on ice, and then gentlymixed on a rocker (program F8 speed 50 in Intelli-MixerRM-2L, Elmi, Russia) for 2 hr. Excess vesicles were removed
Fig. 8 A proposed integrative model for drug-induced lysosomalmembrane fluidization and consequent activation of TFEB due tomTORC1 inhibition. LDs diffuse freely into the cell, when reachingthe lysosomal membrane these drugs intercalate into the lysosomemembrane via their hydrophobic polyromantic ring structure withtheir amine group(s) presumably exposed to the acidic lumen of thelysosomes. These lysosomotropic compounds undergo efficientprotonation, becoming positively charged and thus undergo highaffinity interaction with acidic phospholipids in the lysosomalmembrane including phosphatidic acid, thereby reaching aremarkable stoichiometry of 1:127. This accumulation of amphiphiliccompounds induces lysosomal membrane fluidization andconsequent disruption of mTORC1 kinase activity. This in turn leads toloss of TFEB phosphorylation. TFEB dephosphorylation by a yetunknown phosphatase(s) that is distinct of calcineurin results intranslocation of dephosphorylated TFEB to the nucleus. Thisculminates in CLEAR gene network induction and lysosomalbiogenesis
Zhitomirsky et al. Cell Death and Disease (2018) 9:1191 Page 12 of 15
Official journal of the Cell Death Differentiation Association
by washing three times with the same buffer using a cen-trifuge (5430R centrifuge, Eppendorf, Germany). At the lastwashing step, the microspheres were precipitated with10mM Tris-HCl, 150mM NaCl, at pH 7.4.The integrity of the microsphere’s membrane coverage
was verified using a confocal microscope (Confocal ZeissLSM 700) with a 63×, NA 1.4, PlanApo oil immersionobjective on an IX81 inverted microscope. Incorporationof 0.5% molar of Rhodamine head group labeled lipids(18:1 Liss-Rhod-PE) in the preparation of the SUVsenables imaging of the membrane on the microspheresusing excitation at 555 nm. Fluorescence images weretaken along with the corresponding bright field, diffusioninterference contrast image.For FRAP measurements, the integrated settings in the
Zeiss confocal software were utilized. In a typical proce-dure, a random microsphere was chosen and the imagewas centered on it and digitally zoomed in by ×10.Bleaching of a section of the liposome was performedusing a single iteration of a high intensity laser pulse(100%). The fluorescence intensity at the photobleachedarea was then recorded over time, as the fluorescent lipidsdiffuse on the surface of the sphere (Fig. 1a). For FRAPanalysis, a reference non-bleached area of the micro-sphere was chosen and compared to the bleached area.The fluorescence recovery time, Tf, was determined byfitting an exponential function to the fluorescence inten-sity, I, at the photobleached region over time:
I tð Þ ¼ I1 1� e� t
Tf
� �:
Cell culture and stable transfectionsU2OS human osteosarcoma, MCF-7 breast cancer and
HeLa cervical cancer cells used in this paper were main-tained in RPMI-1640 medium (Gibco, Paisley, UK), sup-plemented with 10% fetal bovine serum, 2 mM glutamine,100 μg/ml penicillin and streptomycin (Biological Indus-tries, Beit HaEmek, Israel) in a humid atmosphere con-taining 5% CO2 at 37 °C. U2OS and MCF-7 cells weretransfected with TFEB-eGFP using Linear Poly-ethylenimine (PEI, MW 25,000) transfection reagent(Polysciences, Pennsylvania, USA) at a ratio of 3 µg PEI: 1µg DNA. For stable transfections, 34 hr after transfection,cells were subjected to G-418 selection (700 μg/ml;Sigma-Aldrich, St. Louis, MO, USA) in the growth med-ium. pEGFP-N1-TFEB was a gift from Shawn Ferguson(Addgene plasmid # 38119)13.
Protein extraction and WB analysisFor WB analysis of the phosphorylation levels of the
various proteins, cells were plated on 100 mm plates, andallowed to attach for 48 hr. Cells were then treated withthe above described drugs for 3 hr. Illumination of
sunitinib-treated cells, where stated, was performed aspreviously described4. Cytosolic and nuclear proteinswere extracted as previously described39 and proteincontent was determined using the Bio-Rad protein assay(Bio-Rad, Hercules, CA, USA). All WB were performedusing 10% acrylamide gels. For evaluating the levels of p70S6K phosphorylation cytosolic (50 µg) and nuclear (30 µg)proteins were used, while cytosolic (30 µg) and nuclear(15 µg) proteins were used for the detection of Elk-1 andits phosphorylated form. The antibodies for Elk-1, phos-pho-Elk-1, p70-S6K, and phospho-p70-S6K were pur-chased from Cell Signaling (Danvers, MA, USA), and wereused at a dilution of 1:1000. A β-actin-specific antibodywas used to assess actual protein loading (Sigma-AldrichSt. Louis, MO, USA; dilution 1: 10,000). The membranewas then reacted with horseradish-peroxidase conjugatedsecondary antibodies (Jackson Immunoresearch Labs,West Grove, PA) and enhanced chemiluminescence(ECL) detection was performed according to the manu-facturer’s instructions (Biological Industries, Beit HaE-mek, Israel). Membranes were exposed for increasingtimes and the images chosen for band quantification byImageJ software were carefully verified for linear rangeband intensity. Phosphorylation levels were determinedby dividing the level of phosphorylated protein by thelevels of total protein for each treatment.For the detection of TFEB, U2OS cells were transiently
transfected with a TFEB-3xFLAG construct (kindly pro-vided by Prof. A. Ballabio, Telethon Institute of Geneticsand Medicine, Naples, Italy) as described above. 24 hrafter transfection, cells were exposed to the indicateddrugs for 3 hr followed by protein extraction. Cytosolic(30 µg) and nuclear (15 µg) proteins were loaded and ananti-FLAG antibody (Sigma Aldrich, St. Louis, MO, USA)was used. To ensure a good separation between cytosolicand nuclear proteins and to confirm equal protein load-ing, the membrane was stripped and reacted with anti-calreticulin (Sigma Aldrich) or anti-SP1 (Santa Cruz,Dallas, TX, USA) antibodies.
Immunofluorescence assaysImmunofluorescence assays were performed as follows:
U2OS cells were seeded in 24-well plates on sterile glasscoverslips. After 48 hr, cells were incubated with eithervehicle (0.1% DMSO), 10 nM Torin1, 10 µM siramesine or10 µM sunitinib for 3 hr. Cells treated with sunitinib, wereeither kept in the dark or exposed to light for 1 hr, aspreviously described4. Cells were then washed twice withPBS, fixed with a fresh solution of 4% formaldehyde inPBS for 15min and washed twice for 5 min in PBS. Per-meabilization was then performed using 0.1% Triton X-100 in PBS for 10 min followed by two washes with PBS.Cells were incubated for 1 hr at room temperature (RT) inTBS buffer (10mM Tris, 150 mM NaCl, pH 7.4)
Zhitomirsky et al. Cell Death and Disease (2018) 9:1191 Page 13 of 15
Official journal of the Cell Death Differentiation Association

containing 20% skim milk, and then incubated for 1 hr atRT with primary antibodies against LAMP1 (sc-20011,Santa Cruz Biotechnology, Dallas, TX, USA) and mTOR(#2972, Cell Signaling Technology, Danvers, MA, USA).Following three 5 min washes with PBS, cells were co-incubated with Rhodamine Red Donkey anti-mouse andAlexa Fluor-488 Donkey anti-rabbit secondary antibodies(Jackson Immunoresearch, West Grove, PA, USA) alongwith 1 µg/ml Hoechst 33342 (Sigma Aldrich, St. Louis,MO, USA) for 1 hr at RT in the dark. Cells were thenwashed three times in PBS for 5 min and the coverslipswere mounted onto microscope slides over fluoromount-G (Thermo Fisher Scientific, Waltham, MA, USA).Fluorescence was recorded using a confocal Zeiss LSM710 microscope (×63 magnification), using the same laserintensities and detector gain for all slides in the experi-ment. Image processing was performed using the ZeissBlack edition software.
Live cell imagingStably transfected U2OS-TFEB-eGFP and MCF-7-
TFEB-eGFP cells were plated at 40% confluence in 24-well glass bottom plates (In Vitro Scientific, CA, USA).For TFEB-eGFP subcellular localization studies, cells wereexposed to siramesine (10 µM), sunitinib (10 µM), chlor-oquine (100 µM), or mefloquine (10 µM) for the durationof the experiment. TFEB-eGFP fluorescence was followedwith a fluorescence microscope InCell analyzer 2000 (GEHealthcare Bio-Sciences, Pittsburgh, PA, USA). Compu-tational analysis of TFEB translocation into the nucleuswas determined using InCell investigator software. Toachieve nuclear staining prior to fluorescence imaging,cells were incubated with 2 μg/ml Hoechst 33342 ingrowth medium for 10min. In TFEB-eGFP localizationexperiments where BAPTA-AM was used, cells werepreincubated with BAPTA-AM (10 µM) for 30 min andwashed with fresh medium prior to drug exposure. InTFEB-eGFP localization experiments with calcineurininhibitors, cells were co-incubated with the stated drugswith or without CSA (10 µM), FK-506 (5 µM), or both forthe duration of the experiment.For Ca2+ release experiments, U2OS cells were plated in
24-well glass bottom plates, preincubated with the Ca2+-dependent stain Fluo-8-AM (3 µg/ml) (AAT Bioquest,Inc. Sunnyvale, CA, USA) for 30min, washed with freshmedium, and incubated with or without siramesine(10 µM) or chloroquine (100 µM) for 15min.For isobologram experiments, U2OS-TFEB-eGFP cells
were plated at 40% confluence in 96-well plates, and incu-bated overnight to allow attachment. Cells were incubatedwith increasing concentrations of siramesine (2.4–16.8 μM)or Torin-1 (1.2–8.4 nM) or combinations of the two com-pounds, and incubated for 3 hr. Following incubation,nuclei were stained by adding Hoechst 33342 (2 μg/ml) to
the growth medium. TFEB-eGFP and nuclei were visualizedby an InCell Analyzer 2000 fluorescence microscope.Computational analysis of TFEB translocation into thenucleus was determined using InCell investigator software.
RNA extraction and quantification of lysosomal geneexpression by real-time PCRU2OS cells were seeded in 6-well plates and incubated
for 48 hr at 37 °C. Cells were then treated with siramesine(10 μM), sunitinib (10 μM) or chloroquine (100 μM) for 4,8, or 16 hr. RNA extraction and cDNA synthesis werecarried out as previously described40. Gene expressionlevels of V-type proton ATPase subunit HATPV1H(ATP6V1H), glucosamine (N-Acetyl)-6-Sulfatase (GNS),and cathepsin D (CTSD) were determined using a quan-titative real-time PCR assay as previously described40.Gene expression levels were normalized using the β-glucuronidase (GUSB) gene as an internal control. Theprimers used for real-time PCR were: ATP6V1H—AGCCCTGAAGAGAAGCAAGAGA, CGATTCAACATTGGCAGAAAGT; GNS—CCCATTTTGAGAGGTGCCAGT,TGACGTTACGGCCTTCTCCTT; CTSD—TGCTCAAGAACTACATGGACGC, CGAAGACGACTGTGAAGCACT; GUSB—CCATTCCTATGCCATCGTG, ATGTCGGCCTCGAAGGG.
Statistical analysisThree or more biological repeats were performed for each
experiment described. Two-tailed student’s t test was usedto determine the significance of the results when comparingband intensity in WB and recovery time in FRAP experi-ments. In live cell imaging experiments the quantification ofnuclear translocation of TFEB was performed by samplingfields with at least 20 cells per field. The significance of thedifference in nuclear TFEB levels was determined at eachtime point by a two-tailed student’s t test.
Conflict of interestThe authors declare that they have no conflict of interest.
Publisher’s noteSpringer Nature remains neutral with regard to jurisdictional claims inpublished maps and institutional affiliations.
Supplementary Information accompanies this paper at (https://doi.org/10.1038/s41419-018-1227-0).
Received: 9 July 2018 Revised: 12 November 2018 Accepted: 16 November2018
References
1. Kaufmann, A. M. & Krise, J. P. Lysosomal sequestration of amine-containingdrugs: analysis and therapeutic implications. J. Pharm. Sci. 96, 729–746(2007).
Zhitomirsky et al. Cell Death and Disease (2018) 9:1191 Page 14 of 15
Official journal of the Cell Death Differentiation Association
2. Zhitomirsky, B. & Assaraf, Y. G. Lysosomes as mediators of drug resistance incancer. Drug Resist. Updat. 24, 23–33 (2016).
3. Kazmi, F. et al. Lysosomal sequestration (trapping) of lipophilic amine (cationicamphiphilic) drugs in immortalized human hepatocytes (Fa2N-4 cells). DrugMetab. Dispos. 41, 897–905 (2013).
4. Adar, Y. et al. Imidazoacridinone-dependent lysosomal photodestruction: apharmacological Trojan horse approach to eradicate multidrug-resistantcancers. Cell Death Dis. 3, e293 (2012).
5. Zhitomirsky, B. & Assaraf, Y. G. Lysosomal sequestration of hydrophobic weakbase chemotherapeutics triggers lysosomal biogenesis and lysosome-dependent cancer multidrug resistance. Oncotarget 6, 1143–1156 (2015).
6. Zhitomirsky, B. & Assaraf, Y. G. Lysosomal accumulation of anticancer drugstriggers lysosomal exocytosis. Oncotarget. https://doi.org/10.18632/oncotarget.15155 (2017)
7. Zhitomirsky, B. & Assaraf, Y. G. The role of cytoplasmic-to-lysosomal pH gra-dient in hydrophobic weak base drug sequestration in lysosomes. Cancer CellMicroenviron. 2, 3–9 (2015).
8. Sardiello, M. et al. A gene network regulating lysosomal biogenesis andfunction. Science. 325, 473–477 (2009).
9. Medina, D. L. et al. Lysosomal calcium signalling regulates autophagy throughcalcineurin and TFEB. Nat. Cell Biol. 17, 288–299 (2015).
10. Settembre, C., Fraldi, A., Medina, D. L. & Ballabio, A. Signals from the lysosome:a control centre for cellular clearance and energy metabolism. Nat. Rev. Mol.Cell Biol. 14, 283–296 (2013).
11. Medina, D. L. et al. Transcriptional activation of lysosomal exocytosis promotescellular clearance. Dev. Cell. 21, 421–430 (2011).
12. Palmieri, M. et al. Characterization of the CLEAR network reveals anintegrated control of cellular clearance pathways. Hum. Mol. Genet. 20,3852–3866 (2011).
13. Roczniak-Ferguson, A. et al. The transcription factor TFEB links mTORC1 signalingto transcriptional control of lysosome homeostasis. Sci. Signal. https://doi.org/10.1126/scisignal.2002790 (2012)
14. Laplate, M. & Sabatini, D. M. mTOR signaling in growth control and disease.Cell 168, 274–293 (2012).
15. Settembre, C. et al. A lysosome-to-nucleus signalling mechanism sensesand regulates the lysosome via mTOR and TFEB. EMBO J. 31, 1095–1108(2012).
16. Martina, J. A. & Puertollano, R. Rag GTPases mediate amino acid-dependent recruitment of TFEB and MITF to lysosomes. J. Cell Biol. 200,475–491 (2013).
17. Martina, J. A., Chen, Y., Gucek, M. & Puertollano, R. MTORC1 functions as atranscriptional regulator of autophagy by preventing nuclear transport ofTFEB. Autophagy 8, 903–914 (2012).
18. Ostenfeld, M. S. et al. Effective tumor cell death by σ-2 receptor ligand sir-amesine involves lysosomal leakage and oxidative stress. Cancer Res. 65,8975–8983 (2005).
19. Ostenfeld, M. S. et al. Anti-cancer agent siramesine is a lysosomotropicdetergent that induces cytoprotective autophagosome accumulation.Autophagy 4, 487–499 (2008).
20. Olsson, J. M. & Daliner, G. Lipid compositions of intracellularmembranes isolated from rat liver nodules in Wistar rats. Cancer Res. 51,3774–3780 (1991).
21. Nowak-Sliwinska, P. et al. Photoactivation of lysosomally sequestered sunitinibafter angiostatic treatment causes vascular occlusion and enhances tumorgrowth inhibition. Cell Death Dis. 6, e1641 (2015).
22. Sancak, Y. et al. The rag GTPases bind raptor and mediate amino acid sig-naling to mTORC1. Science 320, 1496–1501 (2008).
23. Sancak, Y. et al. Ragulator-rag complex targets mTORC1 to the lysosomalsurface and is necessary for its activation by amino acids. Cell 141, 290–303(2010).
24. Thoreen, C. C. et al. An ATP-competitive mammalian target of rapamycininhibitor reveals rapamycin-resistant functions of mTORC1. J. Biol. Chem. 284,8023–8032 (2009).
25. Sugimoto, T., Stewart, S. & Guan, K. L. The calcium/calmodulin-dependentprotein phosphatase calcineurin is the major Elk-1 phosphatase. J. Biol. Chem.272, 29415–29418 (1997).
26. Gotink, K. J. et al. Lysosomal sequestration of sunitinib: a novel mechanism ofdrug resistance. Clin. Cancer Res. 17, 7337–7346 (2011).
27. Parry, M. J. et al. High-affinity small molecule-phospholipid complex formation:binding of siramesine to phosphatidic acid. J. Am. Chem. Soc. 130,12953–12960 (2008).
28. Li, Z. et al. Ammonia induces autophagy through Dopamine receptor D3 andMTOR. PLoS One 11, e0153526 (2016).
29. Betz, C. & Hall, M. N. Where is mTOR and what is it doing there? J. Cell Biol. 203,563–574 (2013).
30. Zoncu, R., Sabatini, D. M. & Efeyan, A. mTOR: from growth signal to diabetesand cancer. Nat. Rev. Mol. Cell Biol. 12, 21–35 (2012).
31. Zoncu, R. et al. mTORC1 senses lysosomal amino acids through an inside-outmechanism that requires the vacuolar H+–ATPase. Science 334, 678–683(2011).
32. Mouritsen, O. G. Lipidology and lipidomics––quo vadis? A new era for thephysical chemistry of lipids. Phys. Chem. Chem. Phys. 13, 19195 (2011).
33. Drori, S., Eytan, G. D. & Assaraf, Y. G. Potentiation of anticancer‐drug cytotoxicityby multidrug‐resistance chemosensitizers involves alterationsin membranefluidity leading to increased membrane permeability. Eur. J. Biochem. 228,1020–1029 (1995).
34. Regev, R., Assaraf, Y. G. & Eytan, G. D. Membrane fluidization by ether, otheranesthetics, and certain agents abolishes P-glycoprotein ATPase activity andmodulates efflux from multidrug- resistant cells. Eur. J. Biochem. 259, 18–24(1999).
35. Guertin, D. A. & Sabatini, D. M. Defining the role of mTOR in cancer. Cancer Cell.12, 9–22 (2007).
36. Xie, J., Wang, X. & Proud, C. G. mTOR inhibitors in cancer therapy.F1000Research 5, 2078 (2016).
37. Gopalakrishnan, G., Rouiller, I., Colman, D. R. & Lennox, R. B. Supported bilayersformed from different phospholipids on spherical silica substrates. Langmuir25, 5455–5458 (2009).
38. Rädler, J., Strey, H. & Sackmann, E. Phenomenology and kinetics of lipid bilayerspreading on hydrophilic surfaces. Langmuir 11, 4539–4548 (1995).
39. Schreiber, E., Matthias, P., Müller, M. M. & Schaffner, W. Rapid detection ofoctamer binding proteins with “mini extracts”, prepared from a small numberof cells. Nucleic Acids Res. 17, 6419 (1989).
40. Raz, S. et al. Severe hypoxia induces complete antifolate resistance in carci-noma cells due to cell cycle arrest. Cell Death Dis. 5, e1067 (2014).
Zhitomirsky et al. Cell Death and Disease (2018) 9:1191 Page 15 of 15
Official journal of the Cell Death Differentiation Association