lyons, terry and skitmore, martin (2004) project risk ...eprints.qut.edu.au/3439/1/3439_1.pdf ·...
TRANSCRIPT
Lyons, Terry and Skitmore, Martin (2004) Project risk management in the Queensland engineering construction industry: a survey. International Journal of Project Management 22(1):pp. 51-61. Copyright 2004 Elsevier PROJECT RISK MANAGEMENT IN THE QUEENSLAND
ENGINEERING CONSTRUCTION INDUSTRY: A SURVEY
Terry Lyons and Martin Skitmore
School of Construction Management and Property
Queensland University of Technology
Corresponding address:
Professor Martin Skitmore
School of Construction Management and Property
Queensland University of Technology
Gardens Point
Brisbane Q4001
Australia
Tel: (07) 3864 2234; Fax: (07) 3864 1170
5 November 2002 (version 2)
PROJECT RISK MANAGEMENT IN THE QUEENSLAND
ENGINEERING CONSTRUCTION INDUSTRY: A SURVEY
ABSTRACT
This paper provides the results of a survey of senior management involved in the
Queensland engineering construction industry, concerning the usage of risk
management techniques. These are described in comparison with four earlier surveys
conducted around the world and indicate that: the use of risk management is moderate
to high, with very little differences between the types, sizes and risk tolerance of the
organisations, and experience and risk tolerance of the individual respondents; risk
management usage in the execution and planning stages of the project life cycle is
higher than in the conceptual or termination phases; risk identification and risk
assessment are the most often used risk management elements ahead of risk response
and risk documentation; brainstorming is the most common risk identification
technique used; qualitative methods of risk assessment are used most frequently; risk
reduction is the most frequently used risk response method, with the use of
contingencies and contractual transfer preferred over insurance; and project teams are
the most frequent group used for risk analysis, ahead of in-house specialists and
consultants.
Key Words: Risk Management, Project Management
2
INTRODUCTION
Risk management is a critical part of project management as ‘unmanaged or
unmitigated risks are one of the primary causes of project failure’ [1]. While
numerous papers have been written on the subject of risk management, little current
information exists on the actual use of risk management in practice [2]. Surveys have
been conducted between 1987 and 1997 in several countries, including the United
States, the United Kingdom, Saudi Arabia, Australia, Canada and Israel [3-12]. Of
these, Uher and Toakley 1996 survey [11] is the latest Australian work.
In addition to the problems associated with the different times and locations of these
surveys, each have sought different types of information – making comparisons
between them all, and identification of trends, difficult, if not impossible. In view of
this, together with the six years lapse in time since the Uher and Toakley study, a
survey was undertaken in Queensland aimed at incorporating many of the features of
the previous work. To do this, four of the previous studies were selected to provide a
basis, comprising:
• Akintoye and MacLeod’s 1994 UK survey entitled ‘Risk analysis and
management in construction’;
• Uher and Toakley’s 1996 Australian survey entitled ‘Risk management in the
conceptual phase of a project’;
• Baker et al’s 1995 UK survey entitled ‘Risk response techniques employed
currently for major projects’ and
• Raz and Michael’s Israel 2001 survey entitled ‘Use and benefits of tools for
project risk management’
3
Analysis of these four previous studies provided the main aims and objectives of the
research, which was obtain feedback from practitioners on the following aspects of
risk management:
• Perceived risk tolerance of individuals and companies
• Frequency of use of risk management
• Factors limiting the implementation of risk management
• Risk management techniques used
• Risk management usage in each of the project life cycle phases
• The recording and use of historical risk data
By examining the commonality between the four surveys and considering the
objectives and findings, a draft questionnaire was developed using a multiple-choice
format. Additional questions on the degree of training respondents had had and the
benefits obtained were included with the aim of identifying effective risk management
training methods. Answers were solicited on a 5-point bipolar Likert scale.
Following a small piloting study, the final version of the questionnaire was developed
and which comprises four sections. In the first section, background information, such
as business category, annual turnover, years of experience, and respondent’s risk
tolerance was sought. The second section investigates the risk management training
respondents have had and the benefits obtained. The third section sought the
frequency of use of risk management techniques and factors limiting the
implementation of risk management. The final section focused on organisational
experience with the application of risk management. Factors investigated include risk
4
management methods and techniques, usage of computers, project life cycle phase
impact and the use of historical risk data.
The survey questionnaire was administered by mail in March 2002 to a random
sample of 200 organisations involved in the Queensland engineering construction
industry. The survey sample comprised owners, property developers, consultants
(project managers, quantity surveyors and engineers) and contractors.
RESULTS
Managers in each organisation completed the questionnaires, including directors and
general managers. Tables 1 and 2 summarise the results. In total, 44 useable
responses were received, representing a response rate of 23%. Based on employment
position and work experience, it was inferred that the respondents have adequate
knowledge of the activities associated with construction and associated risk. The
figures for turnover also indicate that the survey covered a representative sample of
small, medium and large firms in the Queensland engineering construction industry.
All the responses to the questions were statistically analysed for significant
differences between the groups: type of organisation (contractor, consultant, owner
and developer), turnover, years spent in the engineering/construction industry,
personal risk tolerance and organisational risk tolerance. There being 62 questions
involved, the usual the significant level of p=0.05 was thought to be overly stringent
5
(with 60 questions, the expected number of type II errors is 3). The value of p=0.01
was therefore chosen for the significance criterion.
A weighted average score (WAS) is used. This is calculated by summing the product
of response rating and the corresponding number of responses and dividing this figure
by the total number of responses.
A request for respondents to nominate the most beneficial risk management training
produced only 11 responses comprising:
• In house training (5 responses)
• Experience (3 responses)
• MBA (1 response)
• Feasibility analysis (1 response)
• Institute of planning supervisors, Scotland (1 response)
One contractor stated that they ‘did not find formal training all that useful’.
Significant differences were found between those with different organisational risk
tolerances, with risk averse organisations scoring significantly high in their use of
decision trees (mean score 2.77, 1.50 and 1.33 for risk averse, risk neutral and risk
taking respectively: ANOVA p=0.0000), decision analysis (mean score 2.77, 1.79 and
1.25 for risk averse, risk neutral and risk taking respectively: ANOVA p=0.0004) and
subjective probability (mean score 3.17, 2.00 and 1.83 for risk averse, risk neutral and
risk taking respectively: ANOVA p=0.0055). Respondents were invited to nominate
additional techniques to those listed but no additional techniques were nominated.
6
Finally in response to a request to raise any other risk management issues, the only
response received was ‘Profile risk has for managing large projects. Is it the sole
driver or just one of the PMBOK elements, treated after scope, cost and time?’ In
total, 4 replies were obtained out of the potential 195 replies (5 questions x 39
respondents) from the questions requesting additional risk management factors to
those listed in the survey instrument. This low response to requests for additional risk
management factors (2% of the potential responses) supports the view that the key
risk management issues of the respondents were covered in this survey.
DISCUSSION
The statistical tests show the responses to be remarkably homogeneous, with only
three significant differences recorded (relating to organisational risk tolerance and
decision trees, decision analysis and subjective probability). This encourages a
comparison with the other previous studies made in this topic, as it is clear that the
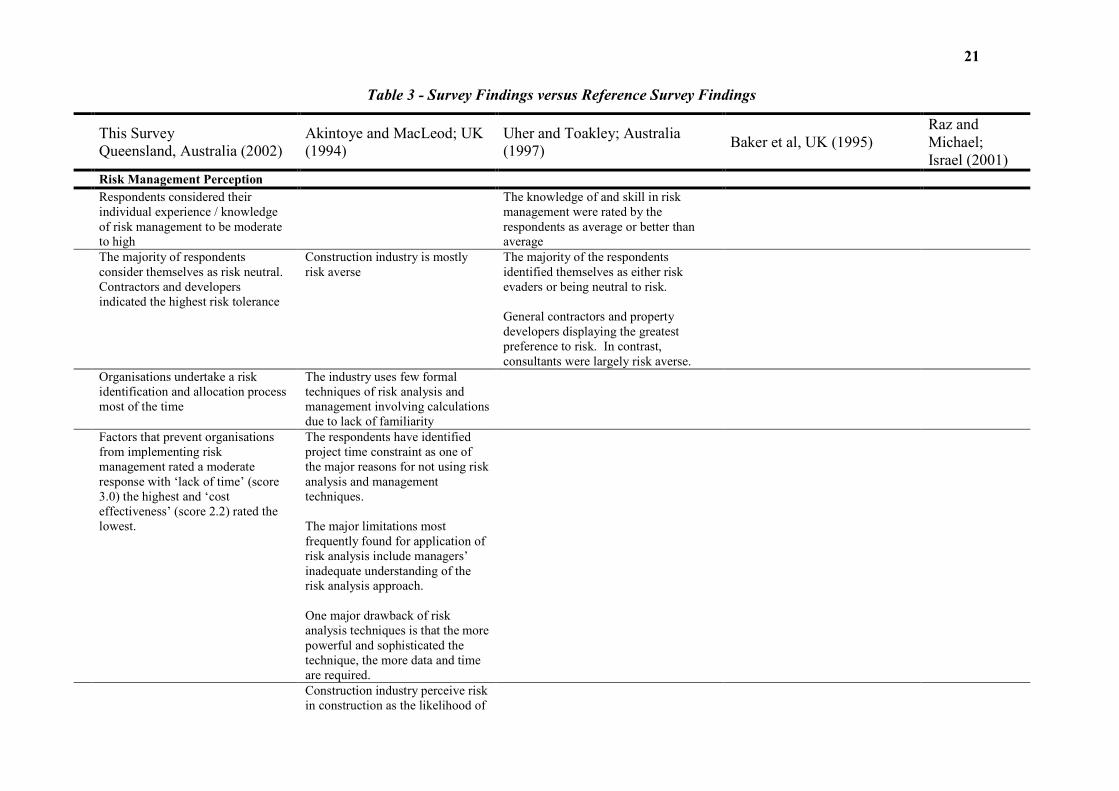
results here are unlikely to be overly idiosyncratic. This is summarised in Table 3 in
relation to Akintoye and MacLeod [6]; Uher and Toakley [11]; Baker et al [7] and
Raz and Michael [12] and examined in more detail below. It is, of course,
acknowledged that differences in findings between this survey and previous similar
surveys may in part be due to the different wording of questions. For this reason,
comparisons are only provided where findings are substantially in agreement or
disagreement with the references.
7
Risk Management Training
Respondents considered their individual experience / knowledge of risk management
to be moderate to high, which is consistent with Uher and Toakley’s [11] findings of
‘average or better than average’. The level of training in risk analysis and
management techniques was found to be low to moderate, which is consistent with
Akintoye and MacLeod’s [6] finding that there was a ‘lack of formal training in risk
analysis and management techniques by most of the respondents’. Respondents
indicated that the most beneficial risk management training that they had received was
by way of in-house training and experience, with only three respondents referencing
external courses (MBA; Feasibility analysis and Institute of planning supervisors,
Scotland).
Risk Management Usage
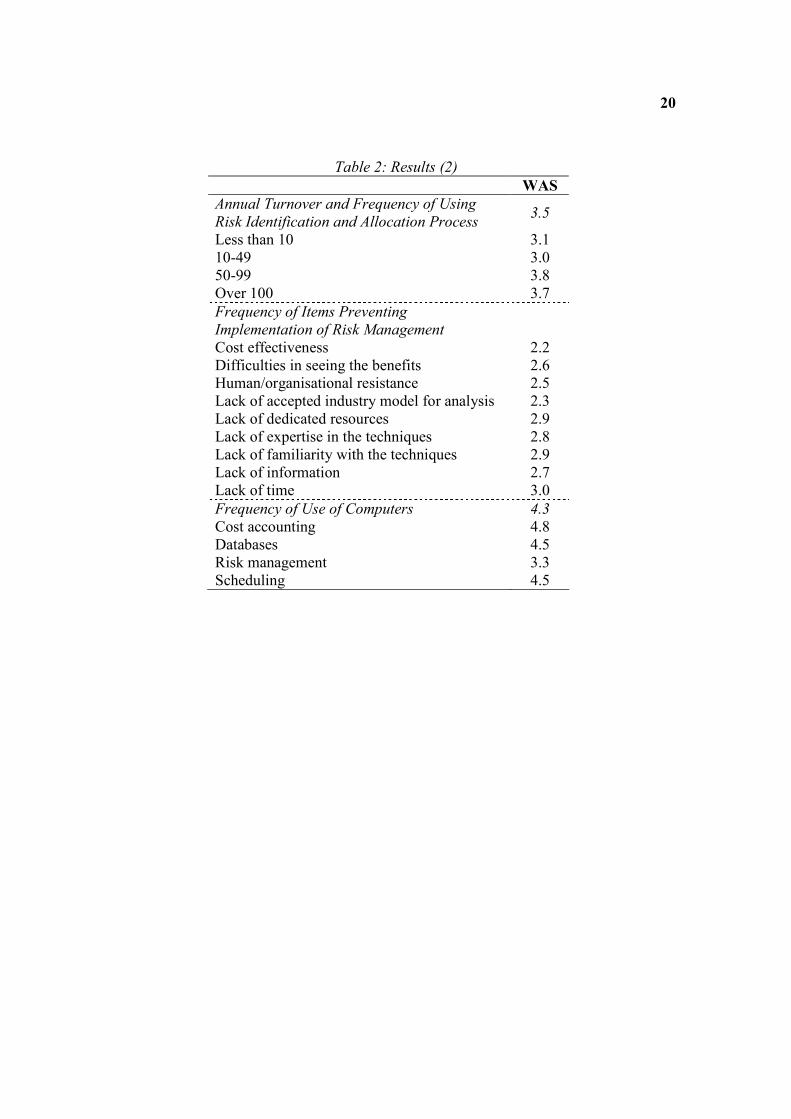
When considering a project, the organisations surveyed undertake a risk identification
and allocation process on a moderate to high frequency (WAS=3.4 to 3.8). The
survey results on the factors preventing organisations from implementing risk
management showed no dominant reason for this. All factors rated a moderate
response with ‘lack of time’ (WAS=3.0) the highest and ‘cost effectiveness’
(WAS=2.2) rated the lowest. Akintoye and MacLeod [6] also found project time
constraints to be a major limitation.
8
The use of computers was found to be consistently lower for risk management than
for cost accounting, databases or scheduling. This is consistent with the findings of
Akintoye and MacLeod [6] and Uher and Toakley [12]. As Nikander and Eloranta
[13] observe, computer based risk management programs ‘have not yet been
developed into commonplace tools of project management in the same way as time
management programs have’.
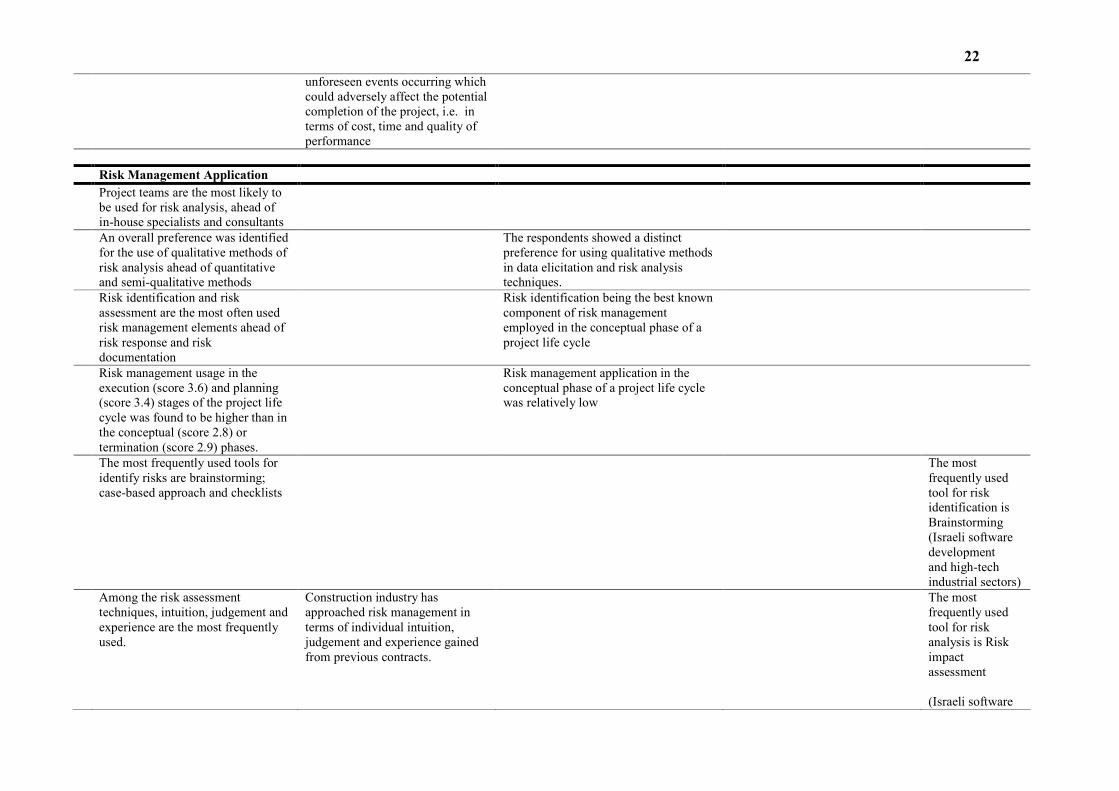
Risk Management Application
Project teams are the most likely group, according to this survey, to be used for risk
analysis, ahead of in-house specialists and consultants. Cost appears not to be the
limiting factor in the use of in-house specialists and consultants, given that ‘cost
effectiveness’ (WAS=2.2) was rated the lowest risk management limiting factor.
Surprisingly, the factors that rated higher as limiting risk management: ‘difficulty in
seeing the benefits’ (WAS=2.6); ‘lack of dedicated resources’ (WAS=2.9); ‘lack of
expertise in the techniques’ (WAS=2.8); ‘lack of familiarity with the techniques’
(WAS=2.9) and ‘lack of time’ (WAS=3), are all areas where in-house specialists and
consultants could offer assistance. This highlights a possible opportunity to provide
assistance to industry in risk management application.
An overall preference was found for the use of qualitative methods of risk analysis
ahead of quantitative and semi-qualitative methods. With the exception of
consultants, this preference is not as strong as that indicated by Uher and Toakley [11]
who found ‘a distinct preference for using qualitative methods in data elicitation and
9
risk analysis techniques’. The moderate average (WAS=2.9) obtained for quantitative
methods across all respondents is closer to the qualitative (WAS=3.5) than would be
expected. This relatively frequent use of the more complicated quantitative methods
suggests an increase in the sophistication of risk management application among the
survey respondents over previous surveys, which would indicate a change in approach
as risk management gains support in the engineering construction industry.
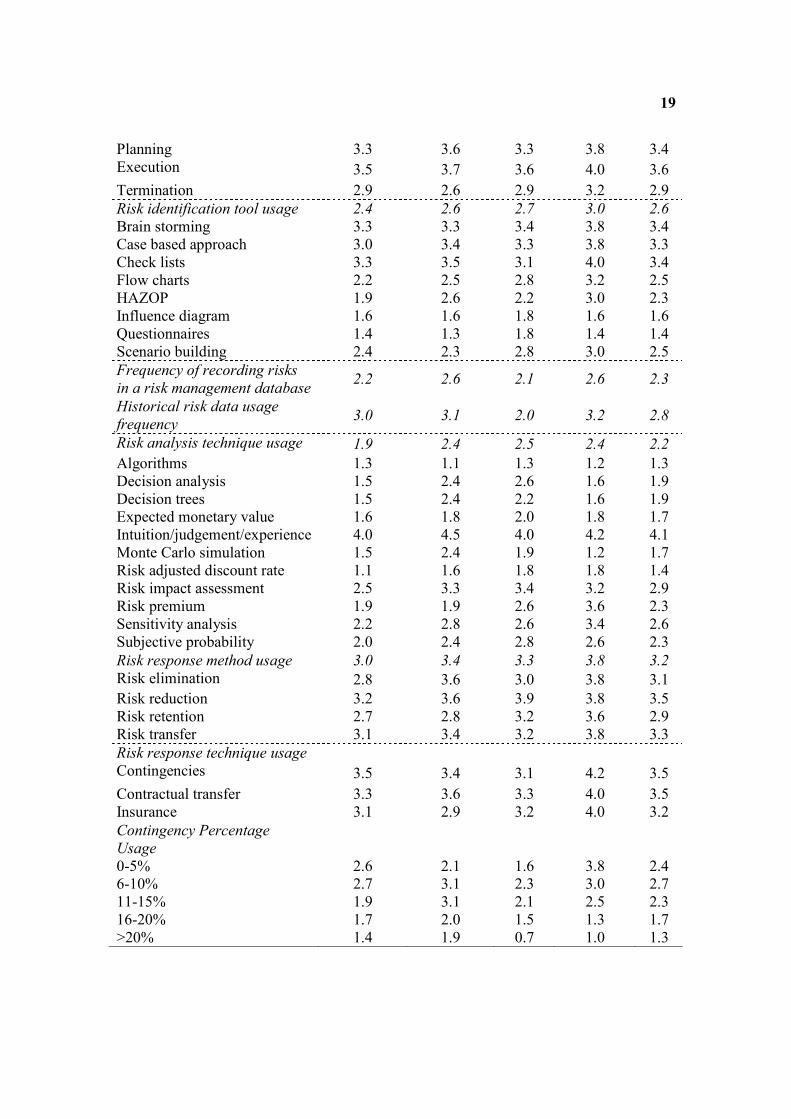
Risk identification (WAS=4.0) and risk assessment (WAS=3.9) were found to be the
most often used risk management elements ahead of risk response (WAS=3.5) and
risk documentation (WAS=3.2). Uher and Toakley [11] also found risk identification
to be the best-known component. Risk management usage in the execution
(WAS=3.6) and planning (WAS=3.4) stages of the project life cycle was found to be
higher than in the conceptual (WAS=2.8) or termination (WAS=2.9) phases. The
lower usage in the conceptual phase is consistent with Uher and Toakleys [11]
findings. However, this result contrasts with Elkington and Smallman [15], for
example, who found that ‘the earlier that risk management was used in a project, the
more successful it was’. This finding may be partially explained by the high
proportion of contractor responses (39%), as contractors tend to be involved in the
execution phase more than the conceptual phase of projects. However, all the
response groups indicated a higher frequency of risk management usage in the
execution and planning stages of the project life cycle.
The use of risk management databases to record project risks was found to be low to
moderate (WAS=2.3), along with the usage of such risk data on other projects
(WAS=2.8). This may be because respondents record risks in other ways, eg., by the
10
use of hand written risk registers. Indeed, the use of computers for risk management
was found to be lower than for other tasks. Given the obvious benefits of risk
documentation, there would seem to be an opportunity to make better use of risk
management data.
The most frequently used tools to identify risks are brainstorming, the case-based
approach and checklists. Raz and Michael’s Israel survey [12] also found
brainstorming to be the most frequently used tool. Among the risk assessment
techniques available, intuition, judgement and experience are the most frequently
used, which is consistent with Akintoye and MacLeod’s [6] findings. This result is
also consistent with Fayek and Rolla’s [10] conclusion that ‘experience, judgement,
and subjective assessment are the main tools used’ in their own and Ahmad and
Minkarah [3], Shash and Abdul-Hadi [4], Shash [5], Hegazy and Moselhi [8], Ting
and Mills [9] and Uher and Toakley’s [11] surveys. Owners (WAS=2.5), consultants
(WAS=2.4) and developers (WAS=2.4) indicated similar overall average usage of
risk assessment techniques, with contractors (WAS=1.9) recording the lowest average
frequency of use.
Risk reduction (WAS=3.5) is the most frequently used risk response method, closely
followed by risk transfer (WAS=3.3), risk elimination (WAS=3.1) and risk retention
(WAS=2.9). Given that the respondents’ preference for risk reduction is not
substantially higher than the other methods, this result is not as conclusive as Baker et
al’s [7] finding that the methods available are favoured ‘in the order of risk reduction,
risk transfer, risk retention, and risk elimination’. Furthermore, over 90% of Baker et
11
al’s responses ‘suggested the constant use of risk reduction techniques’. This close
result is consistent with the predominantly risk neutral response obtained earlier.
Among the risk response techniques, the survey found a preference for contingencies
(WAS=3.5) and contractual transfer (WAS=3.5) over insurance (WAS=3.2). This
contrasts with Akintoye and MacLeod [6], who found that ‘project managers resort to
professional indemnity insurance to transfer risks’ and ‘contractors transfer risks to
their domestic and specialist sub-contractors and through insurance premiums’. The
rapid increase in insurance premiums in Queensland over the six months preceding
the survey may have contributed to the move away from insurance. Moreover, this
result supports the risk neutral response, with respondents prepared to use
contingencies to cover retained risks.
CONCLUSIONS
This paper described a survey of the perceived risk tolerance of a sample of
individuals and their companies in the Queensland engineering construction industry.
The results are that:
• The use of risk management is moderate to high, with very little differences
between the types, sizes and risk tolerance of the organisations, and experience
and risk tolerance of the individual respondents.
• Risk management usage in the execution and planning stages of the project life
cycle is higher than in the conceptual or termination phases. This contrasts with
12
the view that risk management application in the conceptual phase is the most
important.
• Risk identification and risk assessment are the most often used risk management
elements ahead of risk response and risk documentation.
• Brainstorming is the most common risk identification technique used. Consistent
with previous survey findings, intuition / judgement / experience are the most
frequently used risk assessment techniques. That no single risk assessment
technique is best for all cases may be in part be the reason why the respondents
have opted for the simplest approach.
• Qualitative methods of risk assessment are used most frequently, ahead of
quantitative and semi-qualitative methods.
• Risk reduction is the most frequently used risk response method followed by risk
transfer; risk elimination and risk retention - with the use of contingencies and
contractual transfer preferred over insurance.
• Project teams are the most frequently used group to be used for risk analysis,
ahead of in-house specialists and consultants. The level of training in risk
management techniques is low to moderate.
• The use of computers is consistently lower for risk management than for cost
accounting, databases or scheduling. The recording and use of historical risk data
is also low to moderate, along with the usage of such risk data on other projects.
Given the general philosophy for risk documentation and the use of risk
management in the early stages of project development, the industry has an
opportunity to make better use of risk management in these areas.

13
No dominant factor was identified that limits the implementation of risk management.
All the factors nominated in the survey: cost effectiveness; difficulty in seeing the
benefits; human / organisational resistance; lack of accepted industry model for risk
analysis; lack of dedicated resources; lack of expertise in the techniques; lack of
familiarity with the techniques; lack of information; and lack of time were low to
moderately relevant.

14
ACKNOWLEDGEMENTS
The author acknowledges the help of Tzvi Raz, Tom Uher and Simon Smith for
providing copies of their questionnaires; Arkady Retik for translating Tzvi’s
questionnaire from Hebrew; and the industry participants who reviewed the draft
questionnaire and provided valuable advice and assistance in formulating the survey
questionnaire.
15
REFERENCES
[1] Royer PS. Risk Management: The Undiscovered Dimension of Project
Management, PM Network, 2000, 14:31-40, 36770 edition.
[2] Lyons, T. Project risk management in the Queensland engineering construction
industry. Masters of Project Management Dissertation, Queensland University of
Technology, 2002.
[3] Ahmad I, Minkarah I. Questionnaire survey on bidding in construction, Journal of
Management in Engineering, 1988, (4)3:229-43.
[4] Shash AA, Abdul-Hadi NH. The effect of contractor size on mark-up size decision
in Saudi Arabia Construction Management and Economics 1993, 11(6):421.
[5] Shash AA. Factors considered in tendering decisions by top UK contractors
Construction Management and Economics 1993, 11(2):111.
[6] Akintoye AS, MacLeod MJ. Risk analysis and management in construction,
International Journal of Project Management, 1997, 15(1):31-38.
[7] Baker S, Ponniah D, Smith S. Risk response techniques employed currently for
major projects, Construction Management and Economics, London, 1999, 7(2):205-
213.
[8] Hegazy T, Moselhi O. Elements of Cost Estimation: A survey in Canada and the
United States Cost Engineering –Ann Arbor Morgantown, 1995 37(5):27.
[9] Ting Shih Chin Mills A. An analysis of contractors' bidding decisions, Taylor, R.
(ed) Proceedings Procurement Systems Symposium, Pietermaritzburg; Univ of Natal,
Durban, South Africa, 1996, 53-65.
[10] Fayek A, Rolla. A survey of tendering practices in the Australian construction
industry, Engineering Management Journal, 1998, 10(4):29-34.
16
[11] Uher TE, Toakley AR. Risk management in the conceptual phase of the project
development cycle, International Journal of Project Management 1999, Vol 17; No 3,
pp. 161-70.
[12] Raz T, Michael E. Use and benefits of tools for project risk management,
International Journal of Project Management, 2001, vol.19, pp.9 - 17.
[13] Nikander IO, Eloranta E. Project management by early warnings International
Journal of Project Management, 2001 vol 19; No 7, page(s) 385-99
[14] Elkington P, Smallman C. Managing project risks: a case study from the utilities
sector, International Journal of Project Management, 2002, vol.20, No.1, pp.49-57.

17
CAPTIONS TO TABLES AND ILLUSTRATIONS
Table Caption
1 Results (1)
2 Results (2)
3 Survey Findings versus Reference Survey Findings
18
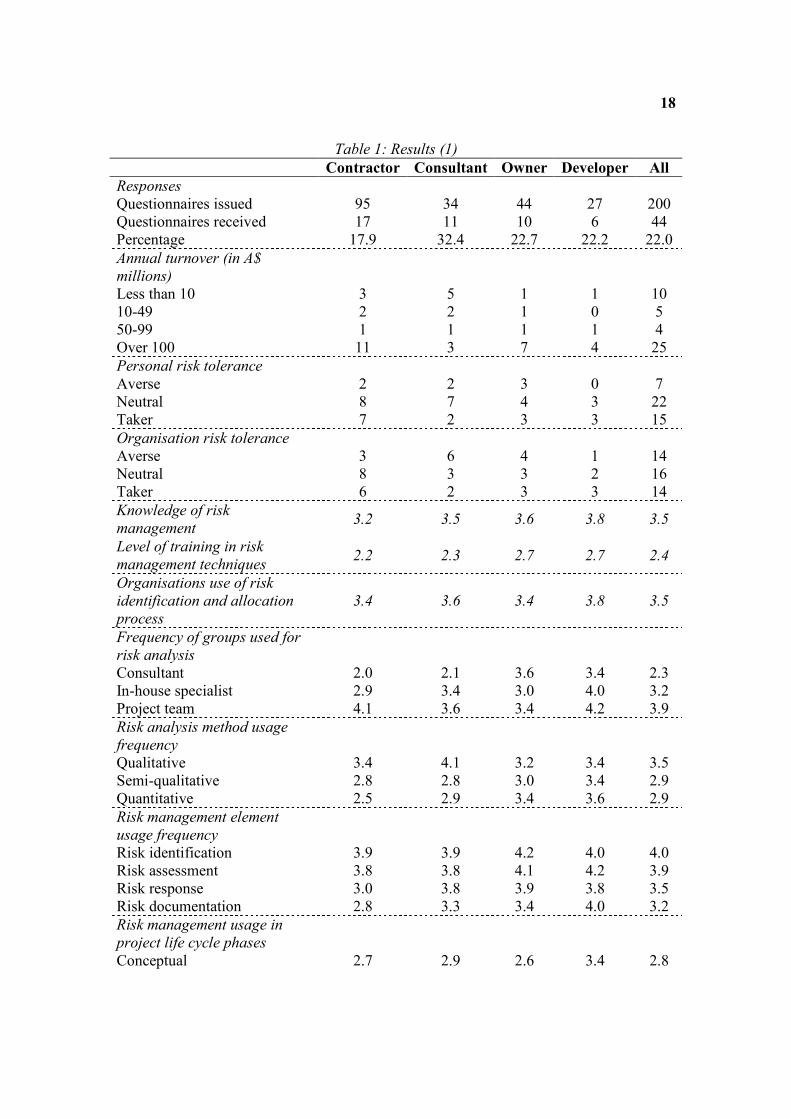
Table 1: Results (1)
Contractor Consultant Owner Developer All
Responses
Questionnaires issued 95 34 44 27 200
Questionnaires received 17 11 10 6 44
Percentage 17.9 32.4 22.7 22.2 22.0
Annual turnover (in A$
millions)
Less than 10 3 5 1 1 10
10-49 2 2 1 0 5
50-99 1 1 1 1 4
Over 100 11 3 7 4 25
Personal risk tolerance
Averse 2 2 3 0 7
Neutral 8 7 4 3 22
Taker 7 2 3 3 15
Organisation risk tolerance
Averse 3 6 4 1 14
Neutral 8 3 3 2 16
Taker 6 2 3 3 14
Knowledge of risk
management 3.2 3.5 3.6 3.8 3.5
Level of training in risk
management techniques 2.2 2.3 2.7 2.7 2.4
Organisations use of risk
identification and allocation
process
3.4 3.6 3.4 3.8 3.5
Frequency of groups used for
risk analysis
Consultant 2.0 2.1 3.6 3.4 2.3
In-house specialist 2.9 3.4 3.0 4.0 3.2
Project team 4.1 3.6 3.4 4.2 3.9
Risk analysis method usage
frequency
Qualitative 3.4 4.1 3.2 3.4 3.5
Semi-qualitative 2.8 2.8 3.0 3.4 2.9
Quantitative 2.5 2.9 3.4 3.6 2.9
Risk management element
usage frequency
Risk identification 3.9 3.9 4.2 4.0 4.0
Risk assessment 3.8 3.8 4.1 4.2 3.9
Risk response 3.0 3.8 3.9 3.8 3.5
Risk documentation 2.8 3.3 3.4 4.0 3.2
Risk management usage in
project life cycle phases
Conceptual 2.7 2.9 2.6 3.4 2.8
19
Planning 3.3 3.6 3.3 3.8 3.4
Execution 3.5 3.7 3.6 4.0 3.6
Termination 2.9 2.6 2.9 3.2 2.9
Risk identification tool usage 2.4 2.6 2.7 3.0 2.6
Brain storming 3.3 3.3 3.4 3.8 3.4
Case based approach 3.0 3.4 3.3 3.8 3.3
Check lists 3.3 3.5 3.1 4.0 3.4
Flow charts 2.2 2.5 2.8 3.2 2.5
HAZOP 1.9 2.6 2.2 3.0 2.3
Influence diagram 1.6 1.6 1.8 1.6 1.6
Questionnaires 1.4 1.3 1.8 1.4 1.4
Scenario building 2.4 2.3 2.8 3.0 2.5
Frequency of recording risks
in a risk management database 2.2 2.6 2.1 2.6 2.3
Historical risk data usage
frequency 3.0 3.1 2.0 3.2 2.8
Risk analysis technique usage 1.9 2.4 2.5 2.4 2.2
Algorithms 1.3 1.1 1.3 1.2 1.3
Decision analysis 1.5 2.4 2.6 1.6 1.9
Decision trees 1.5 2.4 2.2 1.6 1.9
Expected monetary value 1.6 1.8 2.0 1.8 1.7
Intuition/judgement/experience 4.0 4.5 4.0 4.2 4.1
Monte Carlo simulation 1.5 2.4 1.9 1.2 1.7
Risk adjusted discount rate 1.1 1.6 1.8 1.8 1.4
Risk impact assessment 2.5 3.3 3.4 3.2 2.9
Risk premium 1.9 1.9 2.6 3.6 2.3
Sensitivity analysis 2.2 2.8 2.6 3.4 2.6
Subjective probability 2.0 2.4 2.8 2.6 2.3
Risk response method usage 3.0 3.4 3.3 3.8 3.2
Risk elimination 2.8 3.6 3.0 3.8 3.1
Risk reduction 3.2 3.6 3.9 3.8 3.5
Risk retention 2.7 2.8 3.2 3.6 2.9
Risk transfer 3.1 3.4 3.2 3.8 3.3
Risk response technique usage
Contingencies 3.5 3.4 3.1 4.2 3.5
Contractual transfer 3.3 3.6 3.3 4.0 3.5
Insurance 3.1 2.9 3.2 4.0 3.2
Contingency Percentage
Usage
0-5% 2.6 2.1 1.6 3.8 2.4
6-10% 2.7 3.1 2.3 3.0 2.7
11-15% 1.9 3.1 2.1 2.5 2.3
16-20% 1.7 2.0 1.5 1.3 1.7
>20% 1.4 1.9 0.7 1.0 1.3
20
Table 2: Results (2)
WAS
Annual Turnover and Frequency of Using
Risk Identification and Allocation Process 3.5
Less than 10 3.1
10-49 3.0
50-99 3.8
Over 100 3.7
Frequency of Items Preventing
Implementation of Risk Management
Cost effectiveness 2.2
Difficulties in seeing the benefits 2.6
Human/organisational resistance 2.5
Lack of accepted industry model for analysis 2.3
Lack of dedicated resources 2.9
Lack of expertise in the techniques 2.8
Lack of familiarity with the techniques 2.9
Lack of information 2.7
Lack of time 3.0
Frequency of Use of Computers 4.3
Cost accounting 4.8
Databases 4.5
Risk management 3.3
Scheduling 4.5
21
Table 3 - Survey Findings versus Reference Survey Findings
This Survey
Queensland, Australia (2002)
Akintoye and MacLeod; UK
(1994)
Uher and Toakley; Australia
(1997) Baker et al, UK (1995)
Raz and
Michael;
Israel (2001)
Risk Management Perception
Respondents considered their
individual experience / knowledge
of risk management to be moderate
to high
The knowledge of and skill in risk
management were rated by the
respondents as average or better than
average
The majority of respondents
consider themselves as risk neutral.
Contractors and developers
indicated the highest risk tolerance
Construction industry is mostly
risk averse
The majority of the respondents
identified themselves as either risk
evaders or being neutral to risk.
General contractors and property
developers displaying the greatest
preference to risk. In contrast,
consultants were largely risk averse.
Organisations undertake a risk
identification and allocation process
most of the time
The industry uses few formal
techniques of risk analysis and
management involving calculations
due to lack of familiarity
Factors that prevent organisations
from implementing risk
management rated a moderate
response with ‘lack of time’ (score
3.0) the highest and ‘cost
effectiveness’ (score 2.2) rated the
lowest.
The respondents have identified
project time constraint as one of
the major reasons for not using risk
analysis and management
techniques.
The major limitations most
frequently found for application of
risk analysis include managers’
inadequate understanding of the
risk analysis approach.
One major drawback of risk
analysis techniques is that the more
powerful and sophisticated the
technique, the more data and time
are required.
Construction industry perceive risk
in construction as the likelihood of
22
unforeseen events occurring which
could adversely affect the potential
completion of the project, i.e. in
terms of cost, time and quality of
performance
Risk Management Application
Project teams are the most likely to
be used for risk analysis, ahead of
in-house specialists and consultants
An overall preference was identified
for the use of qualitative methods of
risk analysis ahead of quantitative
and semi-qualitative methods
The respondents showed a distinct
preference for using qualitative methods
in data elicitation and risk analysis
techniques.
Risk identification and risk
assessment are the most often used
risk management elements ahead of
risk response and risk
documentation
Risk identification being the best known
component of risk management
employed in the conceptual phase of a
project life cycle
Risk management usage in the
execution (score 3.6) and planning
(score 3.4) stages of the project life
cycle was found to be higher than in
the conceptual (score 2.8) or
termination (score 2.9) phases.
Risk management application in the
conceptual phase of a project life cycle
was relatively low
The most frequently used tools for
identify risks are brainstorming;
case-based approach and checklists
The most
frequently used
tool for risk
identification is
Brainstorming
(Israeli software
development
and high-tech
industrial sectors)
Among the risk assessment
techniques, intuition, judgement and
experience are the most frequently
used.
Construction industry has
approached risk management in
terms of individual intuition,
judgement and experience gained
from previous contracts.
The most
frequently used
tool for risk
analysis is Risk
impact
assessment
(Israeli software
23
development and
high-tech
industrial sectors)
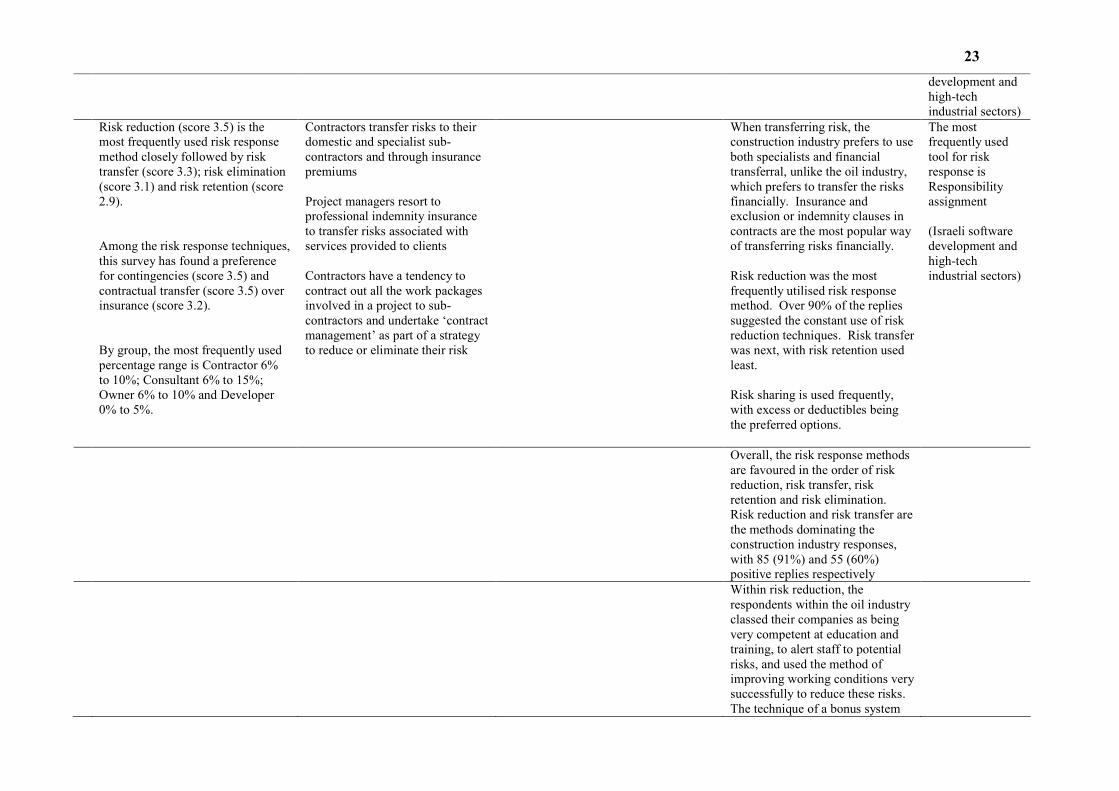
Risk reduction (score 3.5) is the
most frequently used risk response
method closely followed by risk
transfer (score 3.3); risk elimination
(score 3.1) and risk retention (score
2.9).
Among the risk response techniques,
this survey has found a preference
for contingencies (score 3.5) and
contractual transfer (score 3.5) over
insurance (score 3.2).
By group, the most frequently used
percentage range is Contractor 6%
to 10%; Consultant 6% to 15%;
Owner 6% to 10% and Developer
0% to 5%.
Contractors transfer risks to their
domestic and specialist sub-
contractors and through insurance
premiums
Project managers resort to
professional indemnity insurance
to transfer risks associated with
services provided to clients
Contractors have a tendency to
contract out all the work packages
involved in a project to sub-
contractors and undertake ‘contract
management’ as part of a strategy
to reduce or eliminate their risk
When transferring risk, the
construction industry prefers to use
both specialists and financial
transferral, unlike the oil industry,
which prefers to transfer the risks
financially. Insurance and
exclusion or indemnity clauses in
contracts are the most popular way
of transferring risks financially.
Risk reduction was the most
frequently utilised risk response
method. Over 90% of the replies
suggested the constant use of risk
reduction techniques. Risk transfer
was next, with risk retention used
least.
Risk sharing is used frequently,
with excess or deductibles being
the preferred options.
The most
frequently used
tool for risk
response is
Responsibility
assignment
(Israeli software
development and
high-tech
industrial sectors)
Overall, the risk response methods
are favoured in the order of risk
reduction, risk transfer, risk
retention and risk elimination.
Risk reduction and risk transfer are
the methods dominating the
construction industry responses,
with 85 (91%) and 55 (60%)
positive replies respectively
Within risk reduction, the
respondents within the oil industry
classed their companies as being
very competent at education and
training, to alert staff to potential
risks, and used the method of
improving working conditions very
successfully to reduce these risks.
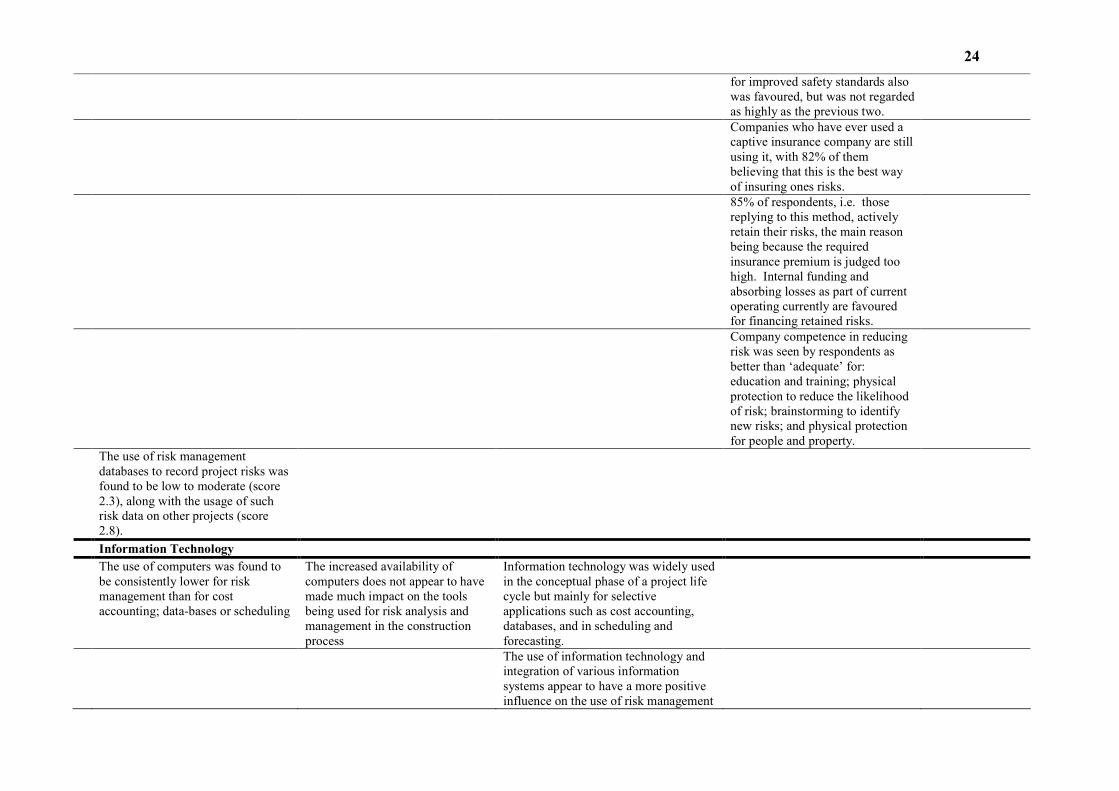
The technique of a bonus system
24
for improved safety standards also
was favoured, but was not regarded
as highly as the previous two.
Companies who have ever used a
captive insurance company are still
using it, with 82% of them
believing that this is the best way
of insuring ones risks.
85% of respondents, i.e. those
replying to this method, actively
retain their risks, the main reason
being because the required
insurance premium is judged too
high. Internal funding and
absorbing losses as part of current
operating currently are favoured
for financing retained risks.
Company competence in reducing
risk was seen by respondents as
better than ‘adequate’ for:
education and training; physical
protection to reduce the likelihood
of risk; brainstorming to identify
new risks; and physical protection
for people and property.
The use of risk management
databases to record project risks was
found to be low to moderate (score
2.3), along with the usage of such
risk data on other projects (score
2.8).
Information Technology
The use of computers was found to
be consistently lower for risk
management than for cost
accounting; data-bases or scheduling
The increased availability of
computers does not appear to have
made much impact on the tools
being used for risk analysis and
management in the construction
process
Information technology was widely used
in the conceptual phase of a project life
cycle but mainly for selective
applications such as cost accounting,
databases, and in scheduling and
forecasting.
The use of information technology and
integration of various information
systems appear to have a more positive
influence on the use of risk management
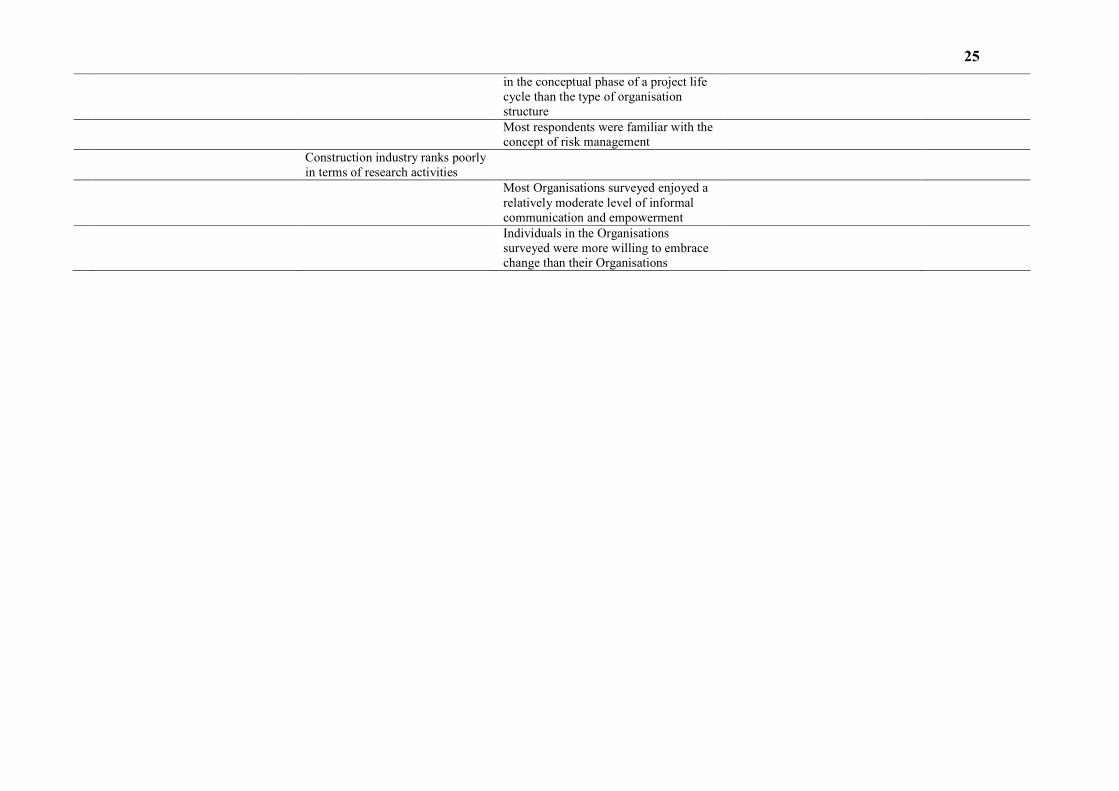
25
in the conceptual phase of a project life
cycle than the type of organisation
structure
Most respondents were familiar with the
concept of risk management
Construction industry ranks poorly
in terms of research activities
Most Organisations surveyed enjoyed a
relatively moderate level of informal
communication and empowerment
Individuals in the Organisations
surveyed were more willing to embrace
change than their Organisations