lynn public schools review - mass.gov · executive order 393 - education management accountability...
TRANSCRIPT

Lynn Public Schools ReviewExecutive Order 393
Education Management Accountability Board ReportDecember 2000
Massachusetts Department of Revenue Division of Local ServicesFrederick A. Laskey, Commissioner Joseph J. Chessey, Jr., Deputy Commissioner

EDUCATIONAL MANAGEMENT ACCOUNTABILITY BOARD
Michael Sentance, Chairman Robert Addelson
Peter Nessen Mark Roosevelt
Hugh Scott Carmel Shields
Alison Taunton-Rigby Samuel Tyler, Vice Chairman
Staff to the Board: Jill Reynolds
Executive Office for Administration & Finance Stephen Crosby, Secretary
Peter Foreman, Undersecretary
Department of Revenue Frederick A. Laskey, Commissioner
Division of Local Services Joseph J. Chessey, Jr., Deputy Commissioner
Gerard D. Perry, Associate Deputy Commissioner Dieter H. Wahl, Director, Educational Audit Bureau
Project Team Mark Tambascio, Auditor-In Charge
Brian Barry, Auditor Kimberly Penta, AuditorEdward Smith, Auditor
The Division of Local Services would like to acknowledge the professional cooperationextended to the audit team by The Department of Education, Lynn Public SchoolsSuperintendent Dr. James Mazareas and the school department staff.

TABLE OF CONTENTS
I. INTRODUCTION............................................................................................. 1
II. EXECUTIVE SUMMARY............................................................................... 1
III. GENERAL CONDITIONS AND FINDINGS..............................................10
1. OVERVIEW...................................................................................................102. ENROLLMENT...............................................................................................123. SCHOOL BUDGET PROCESS.......................................................................154. TOTAL SCHOOL DISTRICT EXPENDITURES ...............................................165. COMPLIANCE WITH SPENDING REQUIREMENTS .......................................196. STAFFING - FULL TIME EQUIVALENT (FTE) TRENDS ...............................227. TEACHER COMPENSATION .........................................................................248. SPECIAL EDUCATION AND TRANSITIONAL BILINGUAL EDUCATION ..........289. TEXTBOOKS AND OTHER INSTRUCTIONAL SERVICE EXPENDITURES......31
10. ACCOUNTING AND REPORTING ..................................................................32 11. REVIEW OF EXPENDITURES.......................................................................33 12. MANAGEMENT AND PERSONNEL PRACTICES............................................33 13. PROFESSIONAL DEVELOPMENT PROGRAM...............................................36 14. SCHOOL IMPROVEMENT PLANS ..................................................................38 15. STUDENT LEARNING TIME .........................................................................39 16. COURSE LOAD AND CLASS SIZE ...............................................................40 17. TECHNOLOGY ..............................................................................................41 18. MAINTENANCE AND CAPITAL IMPROVEMENT ...........................................42 19. HIGH SCHOOL ACCREDITATION .................................................................43 20. TEST SCORES.............................................................................................44 21. CURRICULUM DEVELOPMENT ....................................................................50 22. GRADE THREE TRANSIENCY ......................................................................50 23. DROPOUT AND TRUANCY............................................................................51
IV. EMPLOYEE SURVEY................................................................................52
V. SUPERINTENDENT’S STATEMENT – EDUCATION REFORM......54
VI. APPENDIX ...................................................................................................55

December 2000 Lynn Public Schools Review
Executive Order 393 - Education Management Accountability Board1
I. Introduction
The Massachusetts Education Reform Act (MERA) of 1993 has three major goals: toincrease student achievement; to achieve adequate funding for all local and regional schooldistricts over a seven-year period; and to bring equity to local taxation efforts based on acommunity’s ability to pay. In February 1997, the Governor issued Executive Order 393 toevaluate the education reform program that was nearing the end of its fourth year. In FY99,Massachusetts General Laws (M.G.L.) Ch. 70 state aid for education had reached $2.6billion. With an investment of this magnitude in the Commonwealth’s schools, it is critical to“review, investigate and report on the expenditures of funds by school districts, includingregional school districts, consistent with the goals of improving student achievement.” Tothat end, Executive Order 393 established the Education Management Accountability Board(EMAB).
The Secretary of Administration and Finance, serving as chief of staff to the EMAB, selected ateam of auditors from the Department of Revenue’s (DOR) Division of Local Services (DLS) toconduct the school district reviews. DOR’s Director of Accounts is the chief investigator withauthority to examine municipal and school department accounts and transactions pursuant toM.G.L. Ch. 44, §§45 and 46A. The reviews are conducted in consultation with the StateAuditor and the Commissioner of Education.
The audit team began the review of LPS in May 2000, and completed it in June 2000. Aspart of this review, the audit team conducted a confidential survey of employees of the schooldistrict and included the results in this report. School officials cooperated fully with the auditteam.
The Executive Summary includes some of the more significant observations and findings ofthe review of LPS’ operations. When possible, the audit team has identified and presentedbest practices, which may be adopted by other school districts. The report discusses allresults, best practices, deficiencies and recommendations in greater detail in the "GeneralConditions and Findings" section.
II. Executive Summary
SUMMARY
Over the past three years LPS has made progress in achieving some of the key goals ofeducation reform. These initiatives include developing a professional development plan,which received commendation from the U. S. Department of Education, aligning thecurriculum to the state frameworks and providing on site support staff to coach teachers onhow to implement these frameworks. In addition, LPS is one of the first districts in the stateto link principals’ pay raises with improvements in test scores. Presently, the currentSuperintendent’s initiatives are not always fully accepted by the majority members of theschool committee. In recent months this resistance to certain practices has come from

December 2000 Lynn Public Schools Review
Executive Order 393 - Education Management Accountability Board2
members of the school committee who opted to negotiate certain principals’ contracts,remove support staff for curriculum alignment in each school building and diminish theprofessional development program under its present form. The net result of this is a schoolsystem, which has a very high level of tension between the Superintendent and the fourmajority members of the school committee. The present Superintendent is devoting asignificant amount of his time and effort in justifying to the public the benefits of his initiatives.The majority block of school committee members took office in January 2000 and havebeen very critical of the Superintendent’s initiatives. At the close of the audit fieldwork theSuperintendent and the Mayor have requested the Commissioner of Education to rule oncertain decisions made by the school committee. The net effect of this conflict is a schoolsystem that is in crisis. Thus LPS faces significant challenges in the near future. The abilityto overcome these challenges will depend largely on resolving the conflicts between theschool committee members and the Superintendent, and the ability of community leaders tobring all parties together for the benefit of all students.
The current Superintendent began his tenure in September of 1998. The Superintendent hasover 30 years of experience at all levels of this school system and has cultivated and promotedgenerally from within. The only major exception to this was the hiring of a consultant who wasalso given the title of acting associate superintendent. This decision was made in an effort toprovide the consultant with the authority to help develop a standardized curriculum and relatedtraining program for the system. This acting associate superintendent would also review theresults of this effort and make adjustments accordingly under the direction of theSuperintendent. Overall the style of the current Superintendent is one of a centralizedmanagement process versus a decentralized management process. This, he felt, wasnecessitated in an effort to bring consistently applied teaching methods in the area ofcurriculum to the district.
Test scores are below the state average but MCAS scores show improvement from 1998 to2000, however, they are still below the state average scaled scores for all grades in allsubjects. The district does not have a remedial program for students who failed the test. InJune of 1998, the DOE, based on the MCAS results categorized 19 of the 24 schools in Lynnas “in need of improvement”. Since then LPS has implemented several initiatives to improvestudent achievement and staff accountability.
Less progress has been made in the areas of annual updates of school improvement plans,the upgrading of old school buildings, enhancement of library books in the schools and theavailability of computers at the elementary and middle school levels.
Lynn is a low-income city located near Boston. Enrollment has increased significantly and at amuch higher rate than the state average. Total school district expenditures for FY99 are$108.1 million, or 88.24 percent higher than in FY93. LPS did not exceed the foundationbudget from FY94 to FY99. For the FY93-FY99 period teaching positions increased 38.8percent while student enrollment increased by 20.4 percent.

December 2000 Lynn Public Schools Review
Executive Order 393 - Education Management Accountability Board3
The district FY98 average teacher salary reported to DOE of $44,509 was $458 or 1.0percent higher than the state average of $44,051.
The State Ethics Commission is presently conducting an investigation into possible violationsof the state ethics laws by the Superintendent. As of this report date the investigation was stillongoing.
OVERVIEW [Section 1]
• The city of Lynn is a low-income urbanized center located near Boston.• A unique aspect of Lynn is its cultural diversity. People from 71 different countries reside
here. There are 875 qualifying immigrant and refugee students enrolled in the Lynn PublicSchools. Many of the immigrant and refugee students are transients, because they areenrolled in a school in September, return to their homeland during the winter, then return toschool in the spring. Limited English proficiency is at 13.8 percent, much higher than thestate average of 4.7 percent.
• LPS high school graduating class of 1997 indicated that 61.1 percent intended to go on toa 2 or 4 year college, a rate lower than the 71.8 percent state average. The percent ofgraduates planning to go to work was 23.6 percent, a rate higher than the state average of16.2 percent. In 1998, the high school dropout rate was 5.6 percent, significantly higherthan the state average of 3.4 percent.
ENROLLMENT [Section 2]
• LPS headcount increased from 12,014 in FY92 to 14,747 in FY99, or 22.7 percent. Thisincrease was almost two times the state average increase of 13.6 percent during thistime.
• DOE requires each school district to submit an individual school report that certifies thetotal number of students in the district for that particular school year each October 1st.There have been some major variances between the individual school report and thereport from data generated from the parent information center over the past several yearsnot including the current school year (99-00). The principals in preparing the individualschool report did not always remove the discharges from their enrollment figures,therefore overstating their individual enrollments. The director of the parent informationcenter (P.I.C.) put a new data purification system into place in 1999. Beginning with the99-00 school year the P.I.C. director reviews the enrollment figures that are submitted bythe principals and matches them against the figures submitted by the parent informationcenter. If any variances exist, the P.I.C. director immediately reconciles them. Once theenrollment figures on both reports agree within a reasonable margin of error theenrollment figures are sent to the business manager who prepares the foundationenrollment report. This practice will be followed in subsequent years.

December 2000 Lynn Public Schools Review
Executive Order 393 - Education Management Accountability Board4
SCHOOL BUDGET PROCESS [Section 3]-
• LPS School Committee reviews the budget materials in detail, adjusting positions,requested monetary amounts, materials and also transferring functions as desired fromone arena of accountability to another. The approved school budget is submitted to thecity council for final approval and adoption, once the state aid amounts are solidified anda tax rate can be set.
TOTAL SCHOOL DISTRICT EXPENDITURES [Section 4]
• Total school district expenditures for FY99 are $108.1 million, or 88.5 percent higher thanin FY93.
• LPS per pupil spending, as a percentage of the state average, has been rising sinceFY94. LPS is slightly below the state average for per pupil spending.
COMPLIANCE WITH SPENDING REQUIREMENTS [Section 5]
• LPS did not exceed the foundation budget from FY94 to FY99.• Expenditures did not reach foundation budget for any of the key areas in any of the fiscal
years except for books and equipment in FY99.• LPS exceeded the net school spending requirement in every fiscal year from FY94 to
FY99
STAFFING – FULL TIME EQUIVALENT (FTE) TRENDS [Section 6]
• LPS increased FTE’s between FY93 and FY99. Total FTE’s increased by 635.4 betweenFY93-FY99, which included 298.5 teaching positions or a 38.8 percent increase. In thoseyears total student enrollment increased by 20.4 percent.
TEACHER COMPENSATION [Section 7]
• Between FY93 and FY99, expenditures for salaries rose $28.9 million or 91.4 percent.Total teaching salaries rose $22.8 million or 91.2 percent.
• The district FY98 average teacher salary reported to DOE of $44,509 was $458 or 1.0percent higher than the state average of $44,051.
• Union contracts annual increases plus step increases for teachers have increased by 48.5percent from 1993 to 1999.
SPECIAL EDUCATION [Section 8]
• In FY99, special education students represent 17.3 percent of the total school enrollment.• In FY99, total special education expenditures account for approximately $19.2 million.

December 2000 Lynn Public Schools Review
Executive Order 393 - Education Management Accountability Board5
TEXTBOOKS AND OTHER INSTRUCTIONAL SERVICE EXPENDITURES [Section 9]
• In most cases the libraries have an inadequate supply of reading material available to thestudents. During the school tours, the auditors noted that the shelves were not overflowingwith books. In some cases the conditions of the libraries were not conducive to learning.
ACCOUNTING AND REPORTING [Section 10]
• The audit team was satisfied that the expenditure reports were generally an accuraterepresentation of LPS expenditures. The audit team was satisfied that adequatesafeguards exist for proper internal controls.
• LPS currently has a flexible accounting system that allows school officials to trackexpenditures by program, accountable unit, or statutory classification. The district and thecity recently converted to a new accounting package. During the conversion process(October 1999) the school department had problems accessing certain aspects of thesoftware package thus limiting them in predicting spending for the balance of the year. Thiscoupled with the fact that the system opened two new schools, which required overtimespending for custodians, a significant rise in fuel costs, and a large benefits buyout due toemployee deaths resulted in budget problems in FY2000. In addition, state Chapter 70monies were less than originally expected in FY2000. As a result of the above LPS wasforced to reduce spending in the maintenance, administration and supplies accounts late inFY2000 to cover a shortfall. These monies were used to cover payroll expenses, which hada subsequent projected overspending of $1.3 million. These budget cuts amounted to $.8million. A request by the superintendent in the amount of $670,000 was presented to theCity Council to pay a prior year deficit with current year funds. LPS is not certain if$670,000 is the bottom line according to the school business administrator. This vote wastaken on August 08, 2000. The audit team compared previous years’ expenditures tobudget amounts and found no overspending in these areas. It was noted, however, thatfinancial reports are not submitted to the school committee on a regular basis. The schoolcommittee presently approves warrants for all expenditures.
REVIEW OF EXPENDITURES [Section 11] • The audit team reviewed FY99 expenditures in detail. The review showed that purchasing
and payment procedures were properly followed.
MANAGEMENT AND PERSONNEL PRACTICES [Section 12]

December 2000 Lynn Public Schools Review
Executive Order 393 - Education Management Accountability Board6
• The current superintendent began his tenure in September of 1998. His currentmanagement team is comprised of experienced educational professionals.
The Superintendent has over 30 years of experience at all levels of this school system and hascultivated and promoted generally from within. The only major exception to this was the hiring ofa consultant who was also given the title of acting associate superintendent. This decision wasmade in an effort to provide the consultant with the authority to help developed a standardizedcurriculum and related training program for the system. This acting associate superintendentwould also review the results of this effort and make adjustments accordingly under thedirection of the superintendent.
• Overall the style of the current superintendent is one of a centralized management processversus a decentralized management process. This he felt was necessitated in an effort tobring consistently applied methods in the area of curriculum to the district. His initiativeswere not always fully accepted by the teachers or administrators in the district. In recentmonths this resistance to certain practices has also come from certain members of theschool committee who opted to negotiate principals’ contracts and eliminate theprofessional development program under its present form. At the close of our fieldwork thesuperintendent has gone before the Commissioner of the Department of Education forrulings on these matters.
• LPS has contained within the teacher’s union contract a section, which allows teachers withprofessional status to “bid/bump” within the system on an annual basis. This greatly limitsany authority principals may have in hiring and retaining the teachers they wish to employ.Occasionally and for compelling reasons, a principal may deny the bid subsequent tointerviewing the teacher. The principal must submit written reasons to the Superintendentwho makes the final decision. If the Superintendent approves denying the bid, he mustplace the teacher in an available open position.
PROFESSIONAL DEVELOPMENT [Section 13]
• The United States Department of Education is currently considering LPS among a dozenschool districts around the United States for its National Awards Program for ModelProfessional Development.
• LPS did not meet minimum spending requirements for FY94 through FY96.
SCHOOL IMPROVEMENT PLANS [Section 14]
• The 1997 and 2000 school improvement plans addressed three-year periods. The districtallowed for yearly updates at the discretion of individual principals. M.G.L. Chapter 71,§59C mandates that schools develop and update annual school improvement plans for allof its schools. The district should follow this mandate and produce improvement plansannually.

December 2000 Lynn Public Schools Review
Executive Order 393 - Education Management Accountability Board7
STUDENT LEARNING TIME [Section 15]
• LPS met DOE’s time requirements at the high school, middle, and the elementary schoolsfor school year 1999/00.
COURSE LOAD AND CLASS SIZE [Section 16]
• LPS has classes in excess of 25 students in certain schools.
TECHNOLOGY [Section 17]
• DOE approved LPS’ five-year technology plan in December of 1996. The plan projected tospend a total of $17.1 million by the end of year five.
• There are more than 3500 computers connected to over 30 servers and an array ofperipheral components throughout the LPS district. Most elementary and middle schoolshave one computer lab with additional computers and Internet access found in the library.Only the high schools have an ample supply of computers in every classroom. There werevery few computers in the classroom in the middle and elementary schools; therefore, thestudents spend an average of one hour per week in the computer lab. The district has 4.3students per computer, better than the state average of 7.2. The average rises to between15 and 20 students per computer in the elementary and middle schools.
MAINTENANCE AND CAPITAL IMPROVEMENT [Section 18]
• The auditors conducted interviews and made site visits to all twenty-five public schools. Allof the facilities appeared to be clean and maintained. Most of the buildings, which werevisited by the audit team, are in need of capital repair. The average school building is 67years old. Space is also an issue due to increasing enrollments, and parental choice for thesixth grade.
• In 1999, a weekly checklist, which is filled out by the senior custodian and reviewed by theprincipal, was instituted. This checklist is a good mechanism to keep a check on theeveryday maintenance and custodial issues.
• LPS has a five year capital improvement plan and has invested over $70,000,000 in newconstruction, renovations to older schools and improvements since 1993. Since educationreform Lynn has built 2 new schools (Classical High and Marshall’s Wharf annex to theVocational Technical High School) and is in the process of renovating one school (EnglishHigh School). English High School is 2 – 3 years behind schedule according to the capitalimprovement plan.

December 2000 Lynn Public Schools Review
Executive Order 393 - Education Management Accountability Board8
HIGH SCHOOL ACCREDITATION [Section 19]
• LPS high schools are accredited.
TEST SCORES [Section 20]
• Test scores are generally below the state average.• MCAS scores show that LPS scored below the state average scaled scores for all grades
in all areas. There is no required remedial program for students who fail the test.• SAT scores have been below the state average.• The Massachusetts Educational Assessment Program (MEAP), the state’s educational
testing program from 1988 to 1996, showed that LPS increased in all four subject mattersfor grades 4 and 8 between 1988 and 1996.
• Results from the 1999 Iowa Tests of Educational Development (ITED) indicate that 59percent of LPS 3rd graders demonstrated a high degree of proficiency in fundamental skillsof reading.
CURRICULUM DEVELOPMENT [Section 21]
• As of our audit date, LPS curriculum was aligned to the state frameworks in the four coresubject areas with the exception of grades 9 through 12 social studies.
GRADE THREE TRANSIENCY [Section 22]
• Lynn has a somewhat stable student population in the lower grades, as determined byfigures from the 1999 3rd grade Iowa reading test, in comparison to 14 communities ofsimilar population to Lynn. LPS’s transiency percentage of 19.0 is below the state averageof 20.4 percent. LPS has a stable population percent of 81.0 percent, above the stateaverage of 79.6 percent.
DROPOUT AND TRUANCY [Section 23]
• Lynn’s dropout rate for FY98 was 2.2 percent higher than the state average of 3.4 percent.
• LPS offers nine alternative school programs to keep at risk children in the system. Thisincludes a high school with after workday hours and a program for pregnant teens. Theseprograms have contributed to the overall decrease in the dropout rates.

December 2000 Lynn Public Schools Review
Executive Order 393 - Education Management Accountability Board9
SURVEY RESULTS • A total of 2,000 questionnaires were delivered to school staff and 638 responses were
received and tabulated, a response rate of 31.9 percent. BEST PRACTICES
• In 1999, a weekly school maintenance checklist, which is filled out by the senior custodianand reviewed by the principal, was instituted. This checklist, which goes to theSuperintendent’s Office, is a good mechanism to keep a check on the everydaymaintenance and custodial issues.
• The LPS curriculum was realigned three years ago to adopt the knowledge, concepts, andskills contained in the Massachusetts Curriculum Frameworks. Curriculum guides in thefour core content areas were developed to include learning objectives; standards basedlessons and informal assessments. These curriculum guides were developed to assistteachers in translating the state learning standards into productive educational practices ineach of the four curriculum areas. Instructional Facilitators are also located in each schoolto provide pedagogical and curriculum support aligned to the Massachusetts CurriculumFrameworks and the Principles of Effective Teaching as defined by the MassachusettsEducation Reform Act of 1993. By having the Instructional Facilitators based at eachschool the district feels that they can assess needs and focus on how and what studentsare taught.
• The principals will not receive salary increases unless they meet their goals of improvedstudent achievement in the MCAS. LPS is the only school system in the Commonwealth totie administration salaries to test results.
Auditee’s Response The audit team held an exit conference with the Superintendent and his administrative staffon September 29, 2000. The team invited LPS to suggest specific technical corrections andmake a formal written response.
Review Scope

December 2000 Lynn Public Schools Review
Executive Order 393 - Education Management Accountability Board10
In preparation for the school district reviews, the audit team held meetings with officials fromDOE, the State Auditor’s Office, and other statewide organizations and read publishedreports on educational and financial issues.
DOE provided data including the end-of-year reports, foundation budgets and statewidecomparative data. The DOR’s Division of Local Services Municipal Data bank provideddemographic information, community profiles, and overall state aid data.
While on site, the audit team interviewed officials including, but not limited to, the Mayor, thecity comptroller/auditor, several school committee members, the school Superintendent,deputy superintendents, school business manager, the director of pupil services, principals,the directors of staff development and instructional support, and technology. Documentsreviewed included vendor and personnel contracts, invoices, payroll data, and statistics onstudents and teachers as well as test results and reports submitted to DOE.
In keeping with the goals set out by the EMAB, the school district review was designed todetermine whether or not basic financial goals related to education reform have been met.The audit team gathered data related to performance such as test scores, student to teacherratios and class sizes to show results and operational trends. However, this report does notintend to present a definitive opinion regarding the quality of education in LPS, or itssuccesses or failures in meeting particular education reform goals. Rather, it is intended topresent a relevant summary of data to the EMAB for evaluation and comparison purposes.
The focus of this review was on operational issues. It did not encompass all of the tests thatare normally part of a year-end financial audit such as: review of internal controls; cashreconciliation of accounts; testing compliance with purchasing and expenditure laws andregulations; and generally accepted accounting principles. The audit team tested financialtransactions. The audit team also excluded federal grants, state grants except for EqualEducation opportunity (EEO) and Per Pupil Education Aid, revolving accounts, and studentactivity accounts. The audit team did not test statistical data relating to enrollment, testscores and other measures of achievement. This report is intended for the information anduse of EMAB and LPS. However, this report is a matter of public record and its distributionis not limited.
III. General Conditions and Findings
1. OverviewLynn, incorporated as a city in 1850, is a low-income urbanized center located on the NorthShore approximately ten miles north of Boston. Its 1996 population was 81,075, down 0.2percent from 1990. A mayor and an eleven-member city council govern the city. There is asix-member school committee. The mayor acts as chairman of the school committee.Four city councilors and all school committee members are elected at-large to a two-yearterm.

December 2000 Lynn Public Schools Review
Executive Order 393 - Education Management Accountability Board11
Lynn derives its revenues from the following sources: 58.8 percent from state aid; 29.5 percentfrom tax levies; 9.4 percent from local receipts; and 2.2 percent from other sources. Theunemployment rate is 4.0 percent with per capita income of $13,026, below the state averageof $17,200. In 1996 there were 9,700 fewer jobs than in 1985 due in large part to a reductionin workforce at General Electric.
Like many Massachusetts school districts, Lynn faced budgetary pressures in the early 1990’sas a result of an economic recession and the associated decline in municipal state aid foreducation. Lynn has received $321.8 million in Chapter 70 funds since FY94.
Charts 1-1 and 1-2 present some key economic and demographic statistics for Lynn.
Chart 1-1
Chart 1-2
City of LynnEconomic Data
1996 Population 81,075 FY99 Tax Levy $54,082,4411989 Per Capita Income $13,026 FY99 Levy Limit $59,184,963FY99 Residential Tax Rate $17.73 FY99 Levy Ceiling $63,967,606FY99 Average Single Family Tax $1,976 FY99 State Aid $107,713,344FY99 Avg. Assessed Value - FY99 State Aid as a - Per Single Family $111,459 Percent of Revenue 58.8%1996 Average Unemployment Rate 4.0% 7/1/98 Free Cash ($1,357,384)Note: Data provided by DLS
Lynn Public SchoolsDemographic Data 1998/99
LPS State LPS State1999 1998
Race / Ethnicity:
White 45.3% 77.1% % Attending Private School 12.6% 10.0%Minority 54.7% 22.9% High School Drop-Out Rate 5.6% 3.4%
Limited English Proficiency 13.8% 4.7% Plan of Graduates:
Special Education 16.3% 16.6% 4 Year College 32.6% 53.2%Eligible for Free/Reduced 2 Year College 28.5% 18.6% Priced Lunch 54.3% 25.8% Work 23.6% 16.2%Note: Data provided by DOE. Special Education data as of October 1998.

December 2000 Lynn Public Schools Review
Executive Order 393 - Education Management Accountability Board12
As of our audit date, the district consists of five high schools (grades 9-12), five middleschools (grades 6-8), and nineteen elementary schools, (thirteen grades K-6 and six gradesK-5). The district’s central administration offices are located independently from all schoolbuildings.
As of our audit date, the Superintendent has been in the position for two years, and has overthirty years experience in the LPS system.
A unique aspect of Lynn is its cultural diversity. People from 71 different countries reside here.There is a significant number of qualifying immigrant and refugee students enrolled in LPS.Many immigrant and refugee students are transients because they are enrolled in a school inSeptember, return to their homeland during the winter, then return to school in the spring.Limited English proficiency is at 13.8 percent, much higher than the state average of 4.7percent.
2. Enrollment
Several measures may be used to report actual student enrollment. This audit uses actualand projected student headcount and also foundation enrollment, both as of October 1.Projected enrollment is reviewed by the audit team to determine reasonableness inmethodology and use in school construction or in academic decision making.
Headcount: Actual and Projected
Headcount is based upon students enrolled at each school as annually reported to DOE onthe Individual School Reports.
Chart 2-1 illustrates LPS enrollment trend from October 1, 1988, the 1988/89-school year, toOctober 1, 1998, the 1998/99 school year. Enrollments projected by the district are shownfrom October 2000 to October 2004.
Chart 2-1
Lynn Public SchoolsActual and Projected Student EnrollmentSchool Years 1988/89 to 2004/05
Note: Enrollment for school year as of October 1st. Data obtained from LPS. A solid line represents actual enrollment; a dotted line represents projected enrollment
Actual and Projected Student Enrollment
11,000
13,000
15,000
17,000
88/89 89/90 90/91 91/92 92/93 93/94 94/95 95/96 96/97 97/98 98/99 99/00 00/01 01/02 02/03 03/04 04/05

December 2000 Lynn Public Schools Review
Executive Order 393 - Education Management Accountability Board13
DOE requires each school district to submit an individual school report that certifies the totalnumber of students in the district for that particular school year each October 1st. The principalof each school within the district submits the individual school report containing the enrollmentfor that particular school to the Superintendent’s office. The Superintendent’s office preparesa school summary report which combines all of the individual school reports into a cumulativesummary of enrollment within the district.An annual enrollment report is generated by the parent information center, and submitted to theschool business manager, who prepares the foundation enrollment report. This report isbased the demographic information that is provided by each student upon LPS enrollment.
Finding
There have been some major variances between the individual school report and the reportfrom data generated from the parent information center over the past several years notincluding the current school year (99-00). The principals in preparing the individual schoolreport did not always remove the discharges from their enrollment figures thereby overstatingtheir individual enrollments.
Recommendation
The district should continue the reconciliation process that began in school year 1999/00. Theenrollment director reviews the enrollment figures submitted by the principals and matchesthem against the figures submitted by the parent information center. If any variances exist, theenrollment director immediately reconciles them with the principal. Once the enrollment figureson both reports agree, they are sent to the business manager who prepares the foundationenrollment report. It was indicated to the audit team that the district expects to continue thispractice in future years.
Chart 2-2 illustrates LPS’ actual and projected student enrollment as well as percentagedistribution by grade level for selected school years from October 1, 1991 to October 1, 2004.The chart indicates:
• LPS’ total enrollment percentage increase between FY92 and FY99 exceeded the stateaverage by almost double.
• The chart shows a trend of decreasing enrollment percentage at the elementary schoollevel and an increase at the middle and high school levels.
Ungraded enrollment includes special education and bilingual students in separateclassrooms and tuitioned-out students. In school year 1999/00, some elementary schoolsretained a grade 6 concept at the request of the school committee. All other elementaryschools are grades 1 – 5. For the purpose of Chart 2-2, all elementary schools are shown asgrades 1 – 6.

December 2000 Lynn Public Schools Review
Executive Order 393 - Education Management Accountability Board14
Chart 2-2
Foundation Enrollment
Foundation enrollment is based upon students for whom the district is financially responsible.It is used in the calculation of each district’s required spending on its own students and amountof Chapter 70 state aid each district receives to assist with the cost.
According to DOE, statewide foundation enrollment increased by 14 percent between FY93and FY99. DOE determined that above average and high foundation enrollment growthcommunities are concentrated along route I-495, west and north of the Boston metropolitanarea, yet also appear in a few communities on Cape Cod and in western Massachusetts.
By apportioning regional, choice and charter school students back to their membercommunities, DOE categorized foundation enrollment growth levels as shown in Chart 2-3. On
Lynn Public SchoolsActual and Projected Student Enrollment
Elementary Middle High TotalSchool School School Other Enrollment
School YearPre K & K 1 - 6 % 6 - 8 % 9 - 12 % %
91-92 1,313 5,956 61% 1,541 13.0% 2,804 23.0% 400 3.0% 12,015 92-93 1,437 6,233 63% 1,690 14.0% 2,728 22.0% 154 1.0% 12,243 93-94 1,510 6,327 61% 1,860 15.0% 2,798 22.0% 276 2.0% 12,772 98-99 1,595 6,928 58% 2,468 17.0% 3,443 23.0% 313 2.0% 14,748 99-00 1,742 6,546 55% 3,070 20.0% 3,622 24.0% 200 1.0% 15,18100-01 1,800 6,271 51% 3,463 22.0% 4,129 26.0% 140 1.0% 15,804 04-05 2,000 6,450 50% 3,650 22.0% 4,631 27.0% 160 1.0% 16,892 LPS 92-99% Change 21.5% 16.3% 60.2% 22.8% 22.7%State 92-99% Change 9.5% 14.9% 19.8% 11.9% 13.6%LPS 00-05% Change 14.8% 18.9% 27.9% 11.3%Note: Data obtained from LPS. Actual and projected enrollments seperated by double-line

December 2000 Lynn Public Schools Review
Executive Order 393 - Education Management Accountability Board15
this basis, LPS’ foundation enrollment increase from 11,671 in FY93 to 14,289 in FY99, or by22.4 percent, categorizes it as above average in growth.
Chart 2-3
3. School Budget Process
This section examines the school budget process and the school committees review processto determine how financially sensitive decisions are made and how objectives of educationreform are thought out.
School Budget Development
LPS administrative leadership establishes a budget for each fiscal year. The process involvesa complete analysis of staffing (FTE) counts by grade and school facility so that appropriateclass size and building staffing needs can be met as requested by principals to meetprojected enrollments. Non-salary needs from the management plan are prioritized andincluded within the budget review process as fiscal constraints allow. Building principals havecontrol of any remaining funds designated for educational materials and textbooks or otherschool supplies not budgeted for systemwide.
The school department budget is formulated in several ways. It is a general school-operatingbudget showing prior year budget amounts as well as proposed amounts for the next fiscalyear and the resulting increases and decreases in funding for salary or non-salary categories.The budget documents are also developed as school staffing mechanisms presented byschool; the number of FTE’s for each grade level and other positions as FTE counts both forthe present period and for the proposed fiscal year. The budget is also shown by function foradministrative categories within the school system and for system wide activities. Overheadbudgeted expenses are also shown in comparison format by school facility for review andcomparison from year to year and school to school. Along with the FTE budgeting the schooldepartment shows budgetary data by school and grade level.
Massachusetts Foundation Enrollment
Growth Level Category Cities/Towns PercentDecreasing 44 13%Low ( 0% to 10% ) 101 29%Average ( 10% to 20% ) 102 29%Above Average ( 20% to 30% ) 64 18%High ( Over 30% ) 40 11%Note: Data obtained from DOE

December 2000 Lynn Public Schools Review
Executive Order 393 - Education Management Accountability Board16
School Budget Review
LPS school committee reviews the budget materials in detail, adjusting positions, requestedmonetary amounts, materials and also transferring functions as desired from one arena ofaccountability to another. The approved school budget is submitted to the city council for finalapproval and adoption, once the state aid amounts are solidified and a tax rate can be set.
Certain Goals and Objectives
LPS has consistently been a below foundation community until FY 2000. Key areas of thefoundation budget categories have not received priority in the budgeting process. The auditteam has found that not providing for foundation in the key areas is not uncommon in districtsthroughout the state. Foundation budgeting and net school spending will be discussed insection 5 of this report. LPS has significantly increased its spending on professionaldevelopment, but this effort has only been started during the past 2 years and is interwovenwith curriculum revision to meet frameworks criteria and for direct efforts to improve MCASscores. Prior to the last two years, spending on professional development has lagged.
4. Total School District Expenditures
Total school district expenditures include school committee approved appropriations, andappropriations by the municipality for school purposes as reported in the DOE end of yearreport. This section reviews spending by function, by program and on a per pupil basis.Spending includes FY93 EEO and per pupil aid. One measure of per pupil spendingcalculated and reported by DOE is presented for comparison purposes. The audit teamreviewed spending factors but not student FTEs or methodologies used in DOE’s calculations.
Total Spending
Chart 4-1 illustrates LPS’ total school district expenditure trend in both actual and in constantdollars for FY89 and for FY93 to FY99. In constant dollars, where FY92 is set at 100, the chartillustrates how expenditures fared with respect to inflation over time.

December 2000 Lynn Public Schools Review
Executive Order 393 - Education Management Accountability Board17
Chart 4-1
Spending by Function
Chart 4-2 illustrates in summary total district expenditures by function and bypercentage distribution for selected fiscal years. Appendix A-1 provides thedetail for this chart. The chart indicates a steady increase across the board inoverall spending in all applicable areas
Chart 4-2
Lynn Public Schools
Total School District Expenditures By Function(in millions of dollars) and By Percentage Distribution
% of % ofFY93 Total FY95 FY97 FY99 Total $ Diff. % Diff.
Instructional Services $23.3 40.7% $41.9 $53.7 $65.0 60.2% $41.7 178.9%Other Services $11.4 20.0% $14.2 $17.5 $22.4 20.8% $11.0 96.1%Municipal Services $12.5 21.8% $14.8 $13.4 $20.6 19.1% $8.1 65.1%EEO $8.9 15.5% $0.0 $0.0 $0.0 0.0% -$8.9 -100.0%FY93 Per Pupil Aid $1.2 2.1% $0.0 $0.0 $0.0 0.0% -$1.2 -100.0%Total School District: $57.3 100.0% $70.9 $84.6 $108.0 100.0% $50.7 88.5%Note: Data provided by LPS. Percentages may not add due to rounding.
FY93 - FY99
Lynn Public SchoolsTotal School District Expenditures in Actual and Constant DollarsFY89 and FY93-FY99
Note: Data obtained from LPS. Numbers in bars represent actual $ and above bars constant $
Total School District Expenditures
$108.0$97.0
$84.6$76.1
$70.9$64.1
$57.3$47.1
$90.8$84.4
$74.0$68.1$65.5
$61.1$55.9$52.0
$10
$30
$50
$70
$90
$110
$130
FY89 FY93 FY94 FY95 FY96 FY97 FY98 FY99
$ mil
Actual$Constant $

December 2000 Lynn Public Schools Review
Executive Order 393 - Education Management Accountability Board18
Spending By Program
Chart 4-3 illustrates in summary total school expenditures by program and percentagedistribution for selected fiscal years. Appendix A-2 provides the detail for this chart. The chartindicates that the largest dollar and percent increases between FY93 and FY99 was in regularday with an increase of $27 million or a 218.7 percent increase.
Chart 4-3
Per Pupil Spending
DOE annually calculates per pupil spending based upon programmatic costs and totalaverage membership in FTEs reported on the end-of-year reports. Certain expenditures andschool choice tuitions are excluded. Regular day programs are those where students receivea general course of instruction. Special education programs are for students whoseeducational needs cannot be satisfied in a regular day program. Total day costs are the sumof all programmatic costs. Chart 4-4 shows DOE’s calculation of per pupil spending for regular, special education andtotal day programs. Note that LPS per pupil spending, as a percentage of the state average,has been increasing slightly overall for total day programs and also for regular day programs,but has been declining slightly as a percentage of program spending in the special educationarea.
Lynn Public Schools
Total School District Expenditures By Program(in millions of dollars) and By Percentage Distribution
$ % $ $ $ %FY93 FY93 FY95 FY97 FY99 FY99 $ Diff. % Diff.
School and Municipal:Regular Day $12.3 21.5% $26.7 $33.3 $39.3 36.4% $27.0 218.7%Special Education $8.1 14.1% $12.2 $15.2 $19.2 17.8% $11.1 137.6%Bilingual $1.6 2.7% $2.3 $2.8 $3.5 3.2% $1.9 124.4%Occ. Ed., Adult Ed., Expanded $1.9 3.4% $2.2 $2.8 $4.1 3.8% $2.2 113.2%Undistributed $23.3 40.7% $27.5 $30.5 $41.9 38.8% $18.6 79.7%Total: $47.2 82.4% $70.9 $84.6 $108.0 100.0% $60.8 128.8%
Equal Educational Opportunity $8.9 15.5% $0.0 $0.0 $0.0 0.0% -$8.9 -100.0%FY93 Per Pupil Aid $1.2 2.1% $0.0 $0.0 $0.0 0.0% -$1.2 -100.0%
Total School District: $57.3 100.0% $70.9 $84.6 $108.0 100.0% $50.7 88.5%Note: Data provided by LPS. Percentages may not add due to rounding.
FY93 - FY99

December 2000 Lynn Public Schools Review
Executive Order 393 - Education Management Accountability Board19
Chart 4-4
5. Compliance with Spending Requirements
Pursuant to education reform, DOE determines a required school spending target, orfoundation budget, and an annual school spending requirement, or net school spending, foreach school district. In addition, the law requires action on the part of a district when certainspending amounts are not met. This section determines compliance with these requirements.One measure of per pupil spending reported by DOE is presented for comparison purposes. Foundation Budget
The foundation budget is a target level of spending designed to ensure a quality level ofeducation in each school district. DOE determines a foundation budget by using severalfactors and by including an annual adjustment for inflation. All school districts are expected tomeet their total foundation budget by FY00. Chart 5-1 illustrates that LPS has consistently been an under foundation community. Althoughnot presented in this chart, LPS budgeted to exceed its FY00 total foundation budget.
Lynn Public SchoolsPer Pupil Spending - Day Program
Regular Day Special EducationLPS% LPS% LPS%
Fiscal State of State State of State State of StateYear LPS Avg. Avg. LPS Avg. Avg. LPS Avg. Avg.FY94 3,555$ 4,369$ 81.4% 7,384$ 7,666$ 96.3% 4,511$ 5,235$ 86.2%FY95 3,944$ 4,528$ 87.1% 7,608$ 8,241$ 92.3% 4,845$ 5,468$ 88.6%FY96 4,079$ 4,737$ 86.1% 8,666$ 8,873$ 97.7% 5,289$ 5,750$ 92.0%FY97 4,793$ 4,933$ 97.2% 8,831$ 8,391$ 105.2% 5,741$ 6,015$ 95.4%FY98 4,950$ 5,221$ 94.8% 8,703$ 9,873$ 88.1% 6,088$ 6,361$ 95.7%FY99 5,238$ 5,481$ 95.6% 9,259$ 10,502$ 88.2% 6,626$ 6,684$ 99.1%Note: Data provided by DOE

December 2000 Lynn Public Schools Review
Executive Order 393 - Education Management Accountability Board20
Chart 5-1
The foundation budget also establishes spending targets by grade and program. Thesetargets are intended as guidelines only and are not binding on school districts. To encouragean appropriate level of spending, M.G.L. Ch.70, §9 requires a school district to report to theCommissioner of Education when it has failed to meet the spending target in any one of fourkey functional areas: professional development, books and instructional equipment,expanded programs and extraordinary maintenance.
Finding
According to Chart 5-2, expenditures did not reach foundation budget for any of thecategories in any fiscal year. LPS did not file a report with the Commissioner’s office asrequired by law for these fiscal years stating its reasons for not meeting these levels nor didDOE direct LPS to submit such report. Appendix B provides the detail for this chart. Chart 5-2
Lynn Public Schools
Meeting Total Foundation Budget Target(in millions of dollars)
FY94 FY95 FY96 FY97 FY98 FY99Foundation Budget Target $73.3 $77.3 $84.6 $90.0 $96.5 $101.0
Required NSS as % of Foundation 79.7% 84.2% 87.0% 91.7% 94.5% 97.4%Actual NSS as % of Foundation 79.8% 84.3% 86.9% 91.7% 94.6% 97.8%Note: Data obtained from DOE. FY99 actual NSS is budget.
Lynn Public SchoolsMeeting Foundation Budget Target for Key Areas(by percentage)
FY95 FY97 FY99NSS/FND NSS/FND NSS/FND
Professional Development 0.0% 50.9% 92.2%Books and Equipment 56.1% 92.5% 86.2%Expanded Program 0.0% 0.0% 0.0%Extrodinary Maintenance 0.0% 0.0% 0.0%Note: Data obtained from DOE and LPS. Percentages calculated using whole dollars.

December 2000 Lynn Public Schools Review
Executive Order 393 - Education Management Accountability Board21
Recommendation
In the future LPS should file a report with the Commissioner of Education’s office as requiredby law stating its reasons for not meeting the foundation budget target levels in any of the keyareas noted in the chart above.
Net School Spending
Net school spending is the amount a school district must spend for the support of publiceducation including certain expenditures made by the municipality on behalf of the localschool district. It does not include expenditures for certain classes of long-term debt service,school lunches, community services, fixed assets and student transportation. It also does notinclude tuition revenue. Chart 5-3 illustrates that LPS has exceeded the actual net school-spending requirement in allyears except FY96 when it approximated the 100 percent amount. Chart 5-3
A district’s net school spending requirement is the sum of the school district’s minimum localcontribution and Chapter 70 state aid. Local and regional school districts must provide atleast 95 percent of the net school-spending requirement. As illustrated in Chart 5-4, LPSlocal contribution has remained relatively constant but the percentage of local contribution hasdeclined dramatically from 43 percent to 24 percent from FY94 through FY99. During thissame time period the state share has dramatically increased in dollars from $33.4 million or57 percent to $74.7 million dollars or 75.6 percent of net school spending.
Lynn Public SchoolsMeeting Net School Spending(in millions of dollars)
FY94 FY95 FY96 FY97 FY98 FY99Required Net School Spending 58.4$ 65.1$ 73.6$ 82.5$ 91.2$ 98.4$ Actual Net School Spending 58.5$ 65.2$ 73.5$ 82.5$ 91.3$ 98.8$ Actual as Percentage of Required100.2% 100.2% 99.9% 100.0% 100.1% 100.4%Note: Data obtained from DOE

December 2000 Lynn Public Schools Review
Executive Order 393 - Education Management Accountability Board22
Chart 5-4
Per Pupil Actual Net School Spending Chart 5-5 illustrates LPS’ and the state’s actual net school spending in actual and constant(1992) dollars on a per student basis. Actual net school spending is calculated by DOE.
Chart 5-5
6. Staffing – Full Time Equivalent (FTE) Trends
This section reviews staffing trends at the district and classroom levels. Data is from October1 School System Summary Reports submitted annually to DOE. This report includes district
Lynn Public Schools
Actual Net School Spending Per StudentActual and Constant (1992=100) Dollars
FY94 FY95 FY96 FY97 FY98 FY99in Actual $ $5,053 $5,426 $5,798 $6,237 $6,571 $6,976in 1992 $ $4,822 $5,015 $5,191 $5,457 $5,714 $5,862in Actual $ $5,533 $5,832 $6,070 $6,359 $6,667 $6,995in 1992 $ $5,280 $5,390 $5,434 $5,563 $5,797 $5,878
Note: Data obtained from DOE
FY94 to FY99 Change
LPS
State
38.1%21.6%26.4%11.3%
Lynn Public SchoolsLocal and State Contributions to Actual Net School Spending(in millions of dollars)
FY94 FY95 FY96 FY97 FY98 FY99Actual Net School Spending $58.5 $65.2 $73.5 $82.5 $91.3 $98.8
Actual Local Contribution $ $24.1 $24.7 $24.7 $24.9 $24.5 $24.1State Contribution $ $33.4 $40.5 $48.8 $57.6 $66.8 $74.7
Actual Local Contribution % 43.0% 37.9% 33.7% 30.2% 26.9% 24.4%State Contribution % 57.0% 62.1% 66.3% 69.8% 73.1% 75.6%Note: Data obtained from DOE

December 2000 Lynn Public Schools Review
Executive Order 393 - Education Management Accountability Board23
employees on the payroll as of October 1. Teachers are categorized according to theirassignments regardless of certification.
Chart 6-1 illustrates LPS staffing in FTEs for three selected fiscal years. Since salariescomprise approximately 56.1 percent of the FY99 total school district expenditures, budgetchanges closely reflect changes in staffing or FTEs. LPS had a total of 1,261.5 FTEsincluding 769.7 teachers in FY93. By FY95, total FTE numbers had increased to 1,414.6while teachers increased to 851.3. In this context, teachers exclude instructional assistants.Guidance counselors, psychologists, cafeteria, custodians, and maintenance personnel areincluded as all others in the chart. LPS increased FTEs between FY93 and FY99. Total FTEs increased by 635.4 betweenFY93- FY99 which included teaching 298.5 positions. In those same years total studentenrollment increased by 20.4 percent. For the FY93 to FY99 period, schools in the district experienced an increase in total FTEs of50.4 percent while teachers increased by 38.8 percent.
Chart 6-1
Chart 6-2 shows changes in teaching FTEs by type of school or program. The largestincrease in teachers occurred at the high school level between FY93 and FY99, when 110.1FTEs were added. This was a 33.0 percent increase. There were 70.5 FTE teacherpositions added at the elementary level.
Lynn Public SchoolsStaffing Trends in Full Time Equivalent (FTE)
Teachers as % Instruct. AllTotal FTEs Teachers of Total FTEs Assists. Administrators Others
FY93 1,261.5 769.7 61.0% 174 50.5 267.3FY95 1,414.6 851.3 60.2% 270.5 30.0 262.8FY99 1,896.9 1,068.2 56.3% 310.7 44.0 474
FY93 - FY95 153.1 81.6 96.5 -20.5 -4.5Incr. / Decr. 12.1% 10.6% 55.5% -40.6% -1.7%
FY95 - FY99 482.3 216.9 40.2 14.0 211.2Incr. / Decr. 34.1% 25.5% 14.9% 46.7% 80.4%
FY93 - FY99 635.4 298.5 136.7 -6.5 206.7Incr. / Decr. 50.4% 38.8% 78.6% -12.9% 77.3%Note: Data obtained from LPS.

December 2000 Lynn Public Schools Review
Executive Order 393 - Education Management Accountability Board24
Chart 6-2
Chart 6-3 provides information on students per FTE teacher for LPS and statewide. Thischart does not represent class size. Course load and class size is detailed in section 16.Student/teacher ratios decreased between FY93 and FY95 and decreased again betweenFY95 and FY99. The overall ratio for students to teachers was 15.9:1 in FY93, 15.4:1 in FY95and 13.8:1 by FY99. When adjusted for the number of SPED teachers, using the same totalstudent population for illustration purposes, the resulting all student ratios are somewhathigher. Chart 6-3
7. Teacher Compensation
Expenditures for teacher salaries are reviewed to determine how the school district hasincreased expenditures for teachers and how those salaries have increased as a result ofunion contract agreements.
Lynn Public SchoolsStudents Per FTE Teacher
FY93 FY95 FY99All Students / All FTE Teachers 15.9 15.4 13.8All Students / All FTE Teachers - State Average 13.8 14.9 13.8
All Students / All Non-SPED FTE Teachers 20.2 19.8 18.0All Students / All Non-SPED FTE Teachers - State Avg. 17.2 18.9 17.7
Note: Data obtained from LPS and DOE
Lynn Public Schools
FTE Teachers By Program(excluding teaching aides)
FY93 FY95 FY99 Incr. % Incr.Early Childhood 9.7 8.0 45.0 35.3 363.9%Elementary 261.5 289.0 332.0 70.5 27.0%Secondary 333.9 366.6 444.0 110.1 33.0%Subtotal 605.1 663.6 821.0 215.9 35.7%
Bilingual/ESL 48.6 46.7 63.2 14.6 30.0%Special Education 116 141 184 68.0 58.6%Subtotal 164.6 187.7 247.2 82.6 50.2%
Total 769.7 851.3 1,068.2 298.5 38.8%Note: Data obtained from LPS.
FY93 - FY99

December 2000 Lynn Public Schools Review
Executive Order 393 - Education Management Accountability Board25
Chart 7-1 indicates how school salaries have increased in comparison to total school districtexpenditures. The total expenditure for both salaries and non-salaries has increased morethan 90 percent between FY93 and FY99. Some of this increase has been due to theincrease in FTE staffing in LPS particularly the teaching staff. It should be noted that theoverall level of expenditures in LPS has increased by over 128 percent in only 7 fiscal years.Almost half of this increase is due to salary increases especially for teaching salaries. Thisincrease in salary expenditures and their percentage increase are significantly higher in LPSthan in other similar communities that have been reviewed.
Chart 7-1
Chart 7-2 shows that since FY93 average teacher salary has risen from $34,786 to $47,505per year, representing average individual teacher increases of more than $12,000 dollars.This increase represents faster growth than the statewide average during the same period.Since FY97 LPS has had higher than average teacher salaries and that trend appears to becontinuing with a significant jump for LPS average teacher salaries in FY99 of approximately$3,000 dollars.
Chart 7-2Lynn Public SchoolsAverage Teacher Salary Comparsion
FY89 FY93 FY95 FY97 FY98 FY99Average Teacher Salary per FTE $33,232 $34,786 $38,194 $43,636 $44,509 $47,505DOE Reported State Average N/A $38,681 $40,718 $42,874 $44,051 $45,149Note: Data obtained from DOE
Lynn Public SchoolsSalary Expenditures Compared to Total School District Expenditures(in millions of dollars)
FY93 - FY99FY89 FY93 FY95 FY97 FY99 $ Incr. / Decr. % Incr. / Decr.
Total School DistrictExpenditures $47.1 $47.2 $70.9 $84.6 $108.0 $60.8 128.8%
Total Salaries $29.4 $31.7 $40.7 $45.2 $60.6 $28.9 91.2%as % of Total Expenditures 62.4% 67.2% 57.4% 53.4% 56.1% 47.5%
Teaching Salaries $23.4 $25.0 $32.2 $40.0 $47.9 $22.9 91.6%as % of Total Salaries 79.4% 78.9% 79.1% 88.5% 79.0% 79.2%
Non-Teaching Salaries $6.0 $6.7 $8.5 $5.2 $12.7 $6.0 89.6%as % of Total Salaries 20.4% 21.1% 20.9% 11.5% 21.0% 20.8%Note: Data obtained from LPS. Numbers may not add due to rounding.

December 2000 Lynn Public Schools Review
Executive Order 393 - Education Management Accountability Board26
After reviewing the expenditure for teaching salaries in Chart 7-1, further analysis of the dataindicates that teaching salary increases were 23 percent above the given rate of inflation asshown in Chart 7-3. This increase amounted to over $10.2 million or 47 percent to teachingstaff hired prior to FY93.
Chart 7-3
Chart 7-4 indicates some very substantial salary increases both in step raises and in annualcollective bargaining contracts. As noted in Chart 7-4, LPS has negotiated contractincreases of 5.5 percent in FY95, 8.4 percent in FY96 and 5.4 percent in FY98. These largeincreases were combined with annual step increases together totaling 9.8 percent in FY95,12 percent in FY96 and 8.9 percent in FY98, resulting in increases over the FY94 throughFY99 fiscal years of 48.5 percent.
Chart 7-4
Lynn Public SchoolsTeachers Salaries - Step and Contract Percent Increases
Period 1994 1995 1996 1997 1998 1999 TotalAnnual Contract Increase 5.5% 8.4% 3.4% 5.4% 2.9% 25.6%Step Increase 4.4% 4.3% 3.6% 3.6% 3.5% 3.5% 22.9%Total 4.4% 9.8% 12.0% 7.0% 8.9% 6.4% 48.5%Note: Data obtained from LPS
Lynn Public Schools
Teaching Salary ExpendituresCost of New Positions and Salary Increases(in millions of dollars)
% ofFY93 FY99 Cum. Incr.
Total Teaching Salary Exp. $25.0 $47.9
Cumulative Increase from FY93 $22.9 100%
Cost of 3% Inflationary Increase $4.9 21%FY93-FY99 Cost of New Positions $12.8 56%Subtotal $17.7 77%
Amount above 3% Annual Increase $5.3 23%Note: Analysis based on data obtained from LPS

December 2000 Lynn Public Schools Review
Executive Order 393 - Education Management Accountability Board27
Chart 7-5 shows how salary schedules might apply to a particular teacher for the period ofFY94 to FY99 depending on the step and academic degree. Various examples outlinedifferent situations. The chart illustrates so-called lane changes due to credits and degreeearned such as BA to MA and MA to DOC.
As shown in Chart 7-5, a review of salary changes over the period of FY94 to FY99 indicatesthat the step 11 salary level increased by 26 percent without changing lanes and 33.2 percentif a master’s lane was attained. The increases for step 11 at the master’s level was 25.8percent and if a doctorate lane was achieved the increase was 39.7 percent. The largestincrease was for teachers starting at step 1 and increasing to step 6 between the periods ofFY94 through FY99. These increases ranged from 53.2 percent too as much as 74 percent ifthe appropriate lane changes were achieved.
Chart 7-5
Lynn Public Schools
Teaching StaffStep/Degree Summary - Selected Years
FY94 Base Pay FY99 Base PayStep Base Pay Step Base Pay
BA BA MA BA MATeacher A 11 $33,788 11 $42,574 $45,003 26.0% 33.2%Teacher B 6 $27,881 11 $42,574 $45,003 52.7% 61.4%Teacher C 1 $21,973 6 $34,355 $36,713 56.4% 67.1%
MA MA DOC MA DOCTeacher A 11 $35,783 11 $45,003 $50,003 25.8% 39.7%Teacher B 6 $29,876 11 $45,003 $50,003 50.6% 67.4%Teacher C 1 $23,967 6 $36,713 $41,713 53.2% 74.0%Note: BA - Bachelor of Arts degree, MA - Master of Arts degree, DOC- Doctorate. Data obtained from LPS. LPS teachers salary schedules have 5 lanes. Comparisons of BA to MA represents 2 lane changes. The comparison of MA to DOC represents 2 additional lane changes
FY94-99 % Change

December 2000 Lynn Public Schools Review
Executive Order 393 - Education Management Accountability Board28
Chart 7-6
8. Special Education and Transitional Bilingual Education
Special Education (SPED)
LPS had a SPED participation rate of 17.3 percent in school year 1998, above the stateaverage of 16.6 reported by DOE. Total SPED enrollment in the 1990’s has averaged 15.2percent. The number of SPED students increased significantly from 1992 through 1999.Many of the new students are from out of state and require residential and day placementsmandated by their IEPs. The percentage of SPED students, who are consideredsubstantially separate, has fluctuated between a high of 28.2 percent in school year 1992 toa low of 21.7 percent in school year 1997. The demographic changes indicate greaterpoverty, lower per capita incomes, and higher special needs during the same period.
Comparison of FY94 through FY99 Salary Schedules - Steps 1 and 11
Salary Initial Entry Level - Step 1Lane FY94 FY95 FY96 FY97 FY98 FY99BA 21,973$ 23,182$ 25,381$ 26,323$ 27,276$ 28,197$ BA + 15 22,969$ 24,232$ 26,484$ 27,454$ 28,552$ 29,409$ MA 23,967$ 25,285$ 27,590$ 28,587$ 29,730$ 30,622$ MA + 30 24,964$ 26,337$ 28,695$ 29,720$ 30,909$ 31,836$ DOC 25,960$ 27,388$ 29,800$ 30,853$ 34,730$ 35,622$ Salary Highest Level - Step 11Lane FY94 FY95 FY96 FY97 FY98 FY99BA 33,788$ 35,646$ 38,475$ 39,744$ 41,334$ 42,574$ BA + 15 34,787$ 36,700$ 39,583$ 40,880$ 42,515$ 43,790$ MA 35,783$ 37,751$ 40,687$ 42,012$ 43,692$ 45,003$ MA + 30 36,780$ 38,803$ 41,792$ 43,144$ 44,870$ 46,216$ DOC 37,778$ 39,856$ 42,898$ 44,278$ 48,692$ 50,003$ Note: LPS has 5 salary lanes and 11 Steps. Data obtained from LPS.

December 2000 Lynn Public Schools Review
Executive Order 393 - Education Management Accountability Board29
Chart 8-1
DOE found the LPS SPED program to be in full compliance with state mandates when theCoordinated Program Review was conducted last year.
The increase in SPED costs from FY93 to FY99 was $10.1 million or 111 percent, while theincrease in total district expenditures for the same period was $60.8 million, or 128.8percent. The majority of the SPED increase was due to the increase in SPED tuitions. In anattempt to control some of these tuition costs, LPS is a member of the tuition based NorthShore Consortium. LPS houses many of its special needs classes within its facilities.
Chart 8-2
Lynn Public SchoolsSPED Enrollment
Substantially Separate
School Year Total Total SPED as % Substantially as % ofEnding Enrollment SPED of Total Separate SPED1992 12,014 1,626 13.5% 458 28.2%1993 12,242 1,774 14.5% 448 25.3%1994 12,771 1,832 14.3% 419 22.9%1995 13,124 1,945 14.8% 440 22.6%1997 14,306 2,268 15.9% 492 21.7%1998 14,769 2,411 16.3% 538 22.3%1999 14,747 2,547 17.3% 599 23.5%
Note: Data obtained from October 1 reports
Lynn Public SchoolsTotal SPED Expenditures(in thousands of dollars)
FY89 FY93 FY99 $ Incr. / Decr. % Incr. / Decr.SPED Program $6,697 $8,080 $17,313 $9,233 114.3%SPED Transportation $1,204 $1,004 $1,882 $878 87.4%Total SPED $7,901 $9,084 $19,195 $10,111 111.3%Note: Data obtained from DOE
FY93 - FY99
December 2000 Lynn Public Schools Review
Executive Order 393 - Education Management Accountability Board30
Transitional Bilingual Education (TBE)
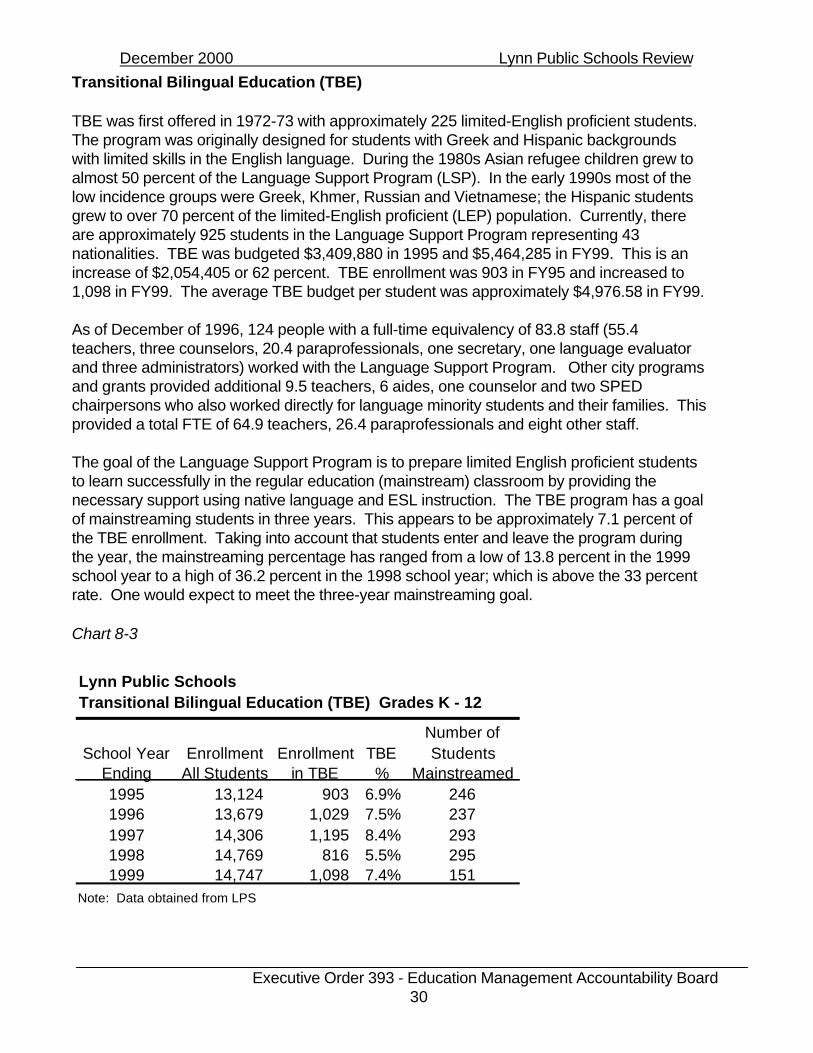
TBE was first offered in 1972-73 with approximately 225 limited-English proficient students.The program was originally designed for students with Greek and Hispanic backgroundswith limited skills in the English language. During the 1980s Asian refugee children grew toalmost 50 percent of the Language Support Program (LSP). In the early 1990s most of thelow incidence groups were Greek, Khmer, Russian and Vietnamese; the Hispanic studentsgrew to over 70 percent of the limited-English proficient (LEP) population. Currently, thereare approximately 925 students in the Language Support Program representing 43nationalities. TBE was budgeted $3,409,880 in 1995 and $5,464,285 in FY99. This is anincrease of $2,054,405 or 62 percent. TBE enrollment was 903 in FY95 and increased to1,098 in FY99. The average TBE budget per student was approximately $4,976.58 in FY99.
As of December of 1996, 124 people with a full-time equivalency of 83.8 staff (55.4teachers, three counselors, 20.4 paraprofessionals, one secretary, one language evaluatorand three administrators) worked with the Language Support Program. Other city programsand grants provided additional 9.5 teachers, 6 aides, one counselor and two SPEDchairpersons who also worked directly for language minority students and their families. Thisprovided a total FTE of 64.9 teachers, 26.4 paraprofessionals and eight other staff.
The goal of the Language Support Program is to prepare limited English proficient studentsto learn successfully in the regular education (mainstream) classroom by providing thenecessary support using native language and ESL instruction. The TBE program has a goalof mainstreaming students in three years. This appears to be approximately 7.1 percent ofthe TBE enrollment. Taking into account that students enter and leave the program duringthe year, the mainstreaming percentage has ranged from a low of 13.8 percent in the 1999school year to a high of 36.2 percent in the 1998 school year; which is above the 33 percentrate. One would expect to meet the three-year mainstreaming goal.
Chart 8-3
Lynn Public SchoolsTransitional Bilingual Education (TBE) Grades K - 12
Number ofSchool Year Enrollment Enrollment TBE Students
Ending All Students in TBE % Mainstreamed1995 13,124 903 6.9% 2461996 13,679 1,029 7.5% 2371997 14,306 1,195 8.4% 2931998 14,769 816 5.5% 2951999 14,747 1,098 7.4% 151
Note: Data obtained from LPS

December 2000 Lynn Public Schools Review
Executive Order 393 - Education Management Accountability Board31
9. Textbooks and Other Instructional Service Expenditures
This section reviews instructional service expenditures by grade level for selected fiscal years.These expenditures include textbooks, supplies and other activities involving the teaching ofstudents and exclude salaries.
LPS has amounts budgeted for textbooks and instructional supplies. Budget allocations areper pupil based for each school, with site based management responsibility resting with eachprincipal. Principals and facilitators review each teacher’s school year syllabus, teachingmaterials and supplementary textbooks.
LPS relies on a variety of instructional materials, trade books, individually prepared materials,and various kits for science and math. Curriculum direction is mostly in math; reading andwriting at all levels. The material is standardized to co-align with the state frameworks.Textbooks are supplemental as determined by central office. A review of textbook inventoriesshowed that most textbooks have been published within the last ten years.
Finding
In most cases the libraries have an inadequate supply of reading material available to thestudents. During the school tours, the auditors noted that most library books were in tatteredcondition and the library in several elementary schools was simply a rolling cart that traveledclassroom to classroom. Libraries were not sufficiently supplied with books. In some casesthe conditions of the libraries were not conducive to learning.
Recommendation
The district should consider using resources to provide additional library books at all schools.The Massachusetts School Library Media Association recommends the following standardsper library: twenty-four books per student and access to seventy-five periodicals.Chart 9-1 shows actual expenditures for textbooks and instructional materials. The chartindicates a steady increase in expenditures for textbooks from $405,000 in FY93 to $994,000in FY99. This is an increase of $589,000 or 145.2 percent. Other instructional materialexpenditures vary from year to year based on the needs and priorities of each school.

December 2000 Lynn Public Schools Review
Executive Order 393 - Education Management Accountability Board32
Chart 9-1
10. Accounting and Reporting
The audit team traced LPS accounting records to the figures reported in the general ledgerand to DOE. A detailed review of the payable process was also conducted. The audit teammet separately with LPS staff and the city comptroller. There is separation of duties anddepartments within the financial offices of the school department.
There appears to be a good working relationship between the city and the school department.Although most internal controls lie with the school department, the city comptroller serves asanother by signing off on all encumbered purchase orders. To serve as a final control feature,the city treasurer has final authority of writing the checks and distributing them.
LPS currently has a flexible accounting system that allows school officials to track expendituresby program, accountable unit, or statutory classification. The district and the city recentlyconverted to a new accounting package. During the conversion process in October of 1999,the school department had problems accessing certain aspects of thesoftware package thus limiting them in predicting spending for the balance of the year. Thiscoupled with the fact that the system opened two new schools, which required overtimespending for custodians, and a significant rise in fuel cost resulted in budget problems in
Lynn Public SchoolsTextbooks and Other Instructional Expenditures(in thousands of dollars)
FY93 - FY99FY93 FY95 FY97 FY99 $ Incr. % Incr.
High School $77 $370 $909 $590 $513 666.2%Jr. High/Middle $64 $157 $167 $527 $463 723.4%Elementary $278 $1,047 $1,510 $1,408 $1,130 406.5%SPED $312 $316 $674 $741 $429 137.5%Bilingual N/A $65 $65 $164 N/A N/AOther N/A $143 $421 $250 N/A N/ATotal $731 $2,098 $3,746 $3,680 $2,949 403.4%
Textbooks Only $405 $1,150 $1,150 $994 $589 145.4%Other Expenditures $325 $947 $2,596 $2,685 $2,360 726.2%
Textbooks / Student $33 $88 $80 $67 $34 103.7%Exp. / Student $27 $72 $181 $182 $155 574.3%Note: Data obtained from LPS and DOE. Elementary includes kindergarten and preschool.

December 2000 Lynn Public Schools Review
Executive Order 393 - Education Management Accountability Board33
FY2000. In addition, state Chapter 70 monies were less than originally expected in FY2000.As a result of the above LPS was forced to reduced spending in the maintenance,administration and supplies account late in FY2000 to cover a shortfall. These monies wereused to cover payroll expenses, which had a subsequent projected overspending of $1.3million. As of the close of our fieldwork these budget cuts amounted to $.8 million. An amountof $670,000 was going to be presented to the City Council and passed to pay a prior yeardeficit with current year funds. This vote was expected on August 08, 2000. There may bemore unpaid bills from FY00, which would also be prior year deficiencies. The audit teamcompared previous years’ expenditures to budget amounts and found no overspending inthese areas. It was noted, however, that financial reports are not submitted to the schoolcommittee on a regular basis. The school committee presently approves warrants for allexpenditures.
11. Review of Expenditures
The audit team reviewed FY99 expenditures in detail. The review showed that purchasing andpayment procedures were properly followed. Proper controls are in place; signoffs andauthorizations are being utilized. The city’s purchasing agent is responsible for purchasingand bidding. LPS administers contracts with vendors. Expenditures are properly authorizedand reviewed by the school committee and the city comptroller prior to payments being madeby the city treasurer. The selection of expenditures and accounts and corroborating data wasverified to account records.
12. Management and Personnel Practices
The purpose of this section is to review the Superintendent’s management style and practices,as well as the hiring and evaluation processes for administrators and teachers.
Management Practices
During the 1990’s the district has had two Superintendents. The former Superintendent heldstrong ties to the Lynn community. The Superintendent developed a strong relationshipthroughout the community and many issues were resolved using community involvement.Many schools utilized their own curriculum, teaching techniques, textbooks and instructionalmaterials. This led to development of instructional programs based upon individual schoolneeds and community expectations.
The current Superintendent began his tenure in September of 1998. His current managementteam is comprised of experienced educational professionals. The Superintendent has over30 years of experience at all levels of this school system and has cultivated and promotedgenerally from within. The only major exception to this was the hiring of a consultant who wasalso given the title of acting associate superintendent. This decision was made in an effort toprovide the consultant with the authority to help develop a standardized curriculum and relatedtraining program for the system. This acting associate superintendent would also review theresults of this effort and make adjustments accordingly under the direction of theSuperintendent.

December 2000 Lynn Public Schools Review
Executive Order 393 - Education Management Accountability Board34
Because LPS is so large, the management structure utilized is through assistantsuperintendents, directors and principals to manage and direct the efforts of the schools. TheSuperintendent meets regularly with his leadership team as well as with faculty, parents,elected officials, and local business leaders.
Overall the style of the current Superintendent is one of a centralized management processversus a decentralized management process. This he felt was necessitated in an effort tobring consistently applied methods in the area of curriculum to the district. His initiatives werenot always fully accepted by the teachers or administrators in the district. In recent months thisresistance to certain practices has also come from certain members of the school committeewho opted to negotiate principal contracts and eliminate the professional developmentprogram under its present form. At the close of our fieldwork the Superintendent has gonebefore the Commissioner of DOE for rulings on these matters.
Hiring Process - Principals
The personnel department prepares and distributes a 30-day internal posting for principalvacancies. The personnel director will then paper screen the initial applicants and refer themto an interview committee, which includes parents, school council members, individuals fromthe business community, teachers and administrators. Previous policy called for a screeningcommittee that included up to three school committee members. The current Superintendentvigorously challenged this part of the policy. He obtained a legal ruling from DOE eliminatingschool committee members from direct involvement and reducing their role to observersduring the process. The final decision of the candidate comes from the Superintendent.
Hiring Process - Teachers
LPS makes every effort to hire certified teachers. Recruitment methods include printadvertisement, the Internet, and on campus recruitment. Principals screen, interview andrecommend new teacher candidates to the Superintendent for appointment. The personneldirector assists the actual screening of applicants. New teachers are subject to employmentreference checks and CORIs per LPS hiring policy. Usually interviews for new teachers occurduring June and July. Principals do not have the final hiring authority but recommend theirchoices of candidates to the Superintendent for final approval.
LPS has contained within the teacher’s union contract a section, which allow teachers withprofessional status to “bid/bump” within the system on an annual basis. This greatly limits anyauthority principals may have in hiring and retaining the teachers they wish to employ.Occasionally and for compelling reasons, a principal may deny the bid subsequent tointerviewing the teacher. The principal must submit written reasons to the Superintendent whomakes the final decision. If the Superintendent approves denying the bid, he must place theteacher in an available open position.

December 2000 Lynn Public Schools Review
Executive Order 393 - Education Management Accountability Board35
Evaluation Process
The District Improvement Plan outlines goals for each deputy superintendent and director andincludes time frames for meeting each goal. The actual goals are not contained in individualcontracts. The goals and time frames contained in the District Improvement Plan form thebasis for the evaluations of the deputy superintendents and directors. In addition, the LPS willbe using criteria from Principles of Effective Administration as a basis for the evaluationinstrument. Implementation is contingent on school committee approval. The schoolcommittee determines the salaries and contracts for these employees.
The Superintendent and deputy superintendents evaluate all principals. The Superintendentdetermines the final pay raise. Principals’ last pay raises were variable and based onachievement of goals. The principals will not receive salary increases unless they meet theirgoals of improved student achievement in the MCAS. LPS is the only school system in theCommonwealth to tie administration salaries to test results.
Finding
In reviewing principal contracts it was noted that four elementary school principals and onemiddle school principal did not have contracts. These principals chose to go directly to theschool committee regarding their contract negotiations. The main point of disagreement wasthe Superintendent’s extension of the work-year from 190 days to 220 days. Schoolcommittee attempts to negotiate these contracts would be a violation of the education reformlaw. The Superintendent was forced to get a ruling from DOE stating that responsibility forprincipal contract negotiations lies with the Superintendent and not the school committee.
Recommendation
Pursuant to Education Reform, it is the responsibility of the Superintendent to negotiateprincipal contracts.
Since the passage of the Education Reform Act, 11 principals have left the system (two due todeath and nine by retirement).
Teachers with professional status are evaluated every two years and are observed routinelyand on an ongoing basis during the school year. Teachers with professional status who do notreceive a favorable evaluation are required to have a professional development plan draftedwith the respective principal. This plan must include specific plans and goals forimprovements.
Teachers without professional status are evaluated twice annually per contract and areobserved on regular basis throughout the school year. Those non-professional teachers who
December 2000 Lynn Public Schools Review
Executive Order 393 - Education Management Accountability Board36
do not receive a favorable evaluation must also have a professional development plan draftedwith the respective principal.
This plan must include specific plans and goals for improvements. Occasionally and forcompelling reasons, teachers without professional status may be terminated. Based on theprincipal’s evaluation and recommendation, the Superintendent will terminate employment.The current Superintendent has terminated five teachers based on principals’recommendations.
13. Professional Development Program
DOE requires school systems to prepare a professional development plan, to update andrevise it annually, and meet minimum spending requirements for professional development. Finding Prior to school year 1997/98 LPS did not have a formal professional development plan. Thedistrict did not monitor course selections and workshops, did not track previous professionaldevelopment workshops or participants and participation in workshops was taken in theteachers’ respective building where they taught as deemed necessary by the respectiveprincipal. Monies for a formalized professional development plan was not budgeted untilFY99 or school year 1998/99.
Recommendation
Whereas the district initiated a formalized professional development program in school year1998/99, and has achieved national recognition for it, the district should strive to maintain ahigh level of commitment in providing professional development training for its staff. The goal of the current professional development program is to provide systemic professionaldevelopment supporting a standards-based curriculum development and implementation. Tothis end the Superintendent and school committee developed a professional developmentmodel which included a Director of Staff Development and Instructional Support as well assite based Instructional Facilitators in all schools. The Instructional Facilitators providepedagogical and curriculum support aligned to Massachusetts Curriculum Frameworks andthe Principles of Effective Teaching as defined in the Massachusetts Education Reform Act of1993. By having the Instructional Facilitators site based at each school the district feels thatthe Facilitators can assess needs and collaboratively plan future professional developmentinitiatives. Also this site-based model allows the district professional development initiativesto focus on how and what students are taught. Goals for the Staff Development andInstructional Support group are aligned with the Superintendent’s district wide goals.
Beginning in 1997, elementary teachers received 5 full days of training in the John CollinsProcess Writing Program. Over the last three years, 550.5 hours of workshops in the John

December 2000 Lynn Public Schools Review
Executive Order 393 - Education Management Accountability Board37
Collins Process Writing program were presented to 2,269 participants (principals,instructional facilitators, teachers, and instructional aides). Also, since 1998, 430 hours of standards-based mathematics workshops were presented to1,021 participants. In the past two years, 104 hours of training in Wilson Phonics andSpelling have been given to 233 staff members. In summary, LPS professional developmentplan includes the following professional development programs:
• John Collins Writing Across The Curriculum (John Collins)• Mimosa Growing with Mathematics (Mimosa)• Connected Math Project (Dale Seymour Publications)• Wilson Reading
The United States Department of Education is currently considering LPS among a dozenschool districts around the United States for its National Awards Program for ModelProfessional Development.
Finding During FY95 and FY96, DOE required school districts to spend at a rate equivalent to $25per pupil for professional development. This requirement increased to $50 per pupil forFY97 and $75 for FY98. In FY99 this requirement was $100. According to Chart 13-1, LPSwas over the minimum spending requirements only from FY97 to FY99.
Recommendation
LPS continue to fund professional development in such a manner as to meet DOE minimumspending requirements.
Chart 13-1
Lynn Public Schools
Expenditures for Professional Development(in whole dollars)
Minimum Total SpentProfessional Spending as % ofDevelopment Requirement Requirement
FY94 $28,000 N/A N/AFY95 $0 $300,525 0.0%FY96 $82,446 $317,000 26.0%FY97 $748,671 $661,450 113.2%FY98 $1,316,697 $1,107,675 118.9%FY99 $1,518,936 $1,474,700 103.0%Note: Data obtained from LPS

December 2000 Lynn Public Schools Review
Executive Order 393 - Education Management Accountability Board38
Chart 13-2 shows a sample of courses offered, the number of professional developmentpoints earned for each course and the number of attendees.
Chart 13-2
14. School Improvement Plans
M.G.L. Chapter 71, §59C mandates a school council at each school that must develop aschool improvement plan and update it annually. The audit team reviewed 1997 and 2000school improvement plans for all schools. In 1997 the district developed guidelines whichwere updated in 2000.
Although 1997 school improvement plans assessed school needs, had measurable goals, andsought to improve student performance, some did not address certain components of the law
Lynn Public SchoolsSelected Professional Development Offerings 1999/00
Title PDPs AttendanceCollins Writing: Grade 1 5 30Pre K/K New Curriculum 1 65Mimosa Training Workshops: Grade 3 6 48Balanced Reading: Early Literacy Workshops 15 36Connected University 1.5 53Cross Curriculum Writing Course 5 28Goal 2000 4.5 43Writing Staff Development 5 81Physical Science Workshop 2.5 47National Science Foundation 5 34Early Childhood Curriculum 3 47Teaching Mathematics to Grade 2 20 80Crisis Response Workshop 12 69The History of Lynn 9 39Who's Afraid of Basic Macintosh Computer 30 46Making Multicultural Books 2.5 86Basics in Middle School 15 42Diverse Needs: Middle School Transition 4 29Revise Curriculum to meet Subject Area Planning 26 72Note: Information obtained from LPS

December 2000 Lynn Public Schools Review
Executive Order 393 - Education Management Accountability Board39
such as the impact of class size, student/teacher ratios, and recommendations for meetingdiverse learning needs.
The 2000 school improvement plans were developed more along the lines of the law. Thewritten assessment of goals improved from 1997 to the 2000 plans. The 2000 plans includedsupporting documentation for written objectives including but not limited to test results, surveys,and demographics.
Finding
The 1997 and 2000 school improvement plans addressed three-year periods. The districtallowed for yearly updates at the discretion of individual principals.
Recommendation
M.G.L. Chapter 71, §59C mandates that schools develop and update annual schoolimprovement plans for all of its schools. The district should follow this mandate and produceimprovement plans annually.
15. Student Learning Time
Time and learning standards refer to the amount of time students are expected to spend inschool. The number of minutes or hours in a school day and the number of days in the schoolyear measure it. As of September 1997, DOE requires 990 instruction hours per year forboth secondary (junior high and high schools) and 900 hours of instruction for the elementaryand middle schools.
As shown in Chart 15-1, LPS student learning time exceeded the 1999/00 DOE school yearrequirements in the middle school and in the elementary schools. Currently the high schoolexceeds the DOE requirements by 18 hours. Kindergarten also exceeded the DOErequirements by 25 hours.
Teachers were compensated by $1,025 annually starting in September 1995 because thelength of the day was extended. Also, in FY2000, the school year was extended by two days.Compensation for these two days was given to teachers on a per diem basis.
Chart 15-1
Lynn Public SchoolsStudent Learning Time
1995/96LPS Standard DOE Req. LPS Standard
Hours Per Hours Per Hours PerYear Year Year
High School 990 990 1008Middle School 1002 900 1080Elementary School 900 900 945Kindergarten 435 425 450Note: Data obtained from LPS
1999/00

December 2000 Lynn Public Schools Review
Executive Order 393 - Education Management Accountability Board40
16. Course Load and Class Size
Course load reflects the number of students that each teacher is responsible for teachingduring a school year. This number is significant because it not only represents the number ofstudents a teacher works with on a daily basis, but also the number of assignments, tests,and/or papers the teacher is responsible for grading. Class size is important becauseresearch shows the value of lowering class size on student learning. DOE notes that studentsattending smaller classes in the early grades make more rapid educational progress thanstudents do in larger classes.
Chart 16-1 shows the average teacher workload of the three Lynn High Schools for the fourcore class subjects as of October 1999 for the 1999/2000 school year. The student to teacherratio reflects the number of students that each teacher is responsible for teaching during aschool year. The average student to teacher ratio is 134 students per teacher. Math teachershad the smallest ratio with 121.1 per teacher and social studies had the largest ratio with147.4students per teacher. Sections per teacher show the average number of periods each coreteacher has per core subject. These range from a low of 6.3 sections per teacher for Math to ahigh of 7.9 sections per teacher in social studies.
Chart 16-1
Chart 16-2 shows the average class size in the Lynn elementary schools. The averagenumber of students in all elementary classes for school year 1999/2000 is 20.33. Fifth gradehas the highest average class size with 22.8 students per class, and kindergarten has thelowest average class size at 17.3 students per class. LPS has fifty-one classes with at least25 students per class. Some of the elementary schools have a sixth grade, which wouldaccount for the shortage in classroom space ultimately increasing the number of students in aclassroom.
Lynn Public SchoolsHigh School Teacher Course Load1999/00 School Year
Students/ Sections/Core Subject Students Teachers Teachers Sections Teacher
English 4865 40 121.6 296 7.4Math 3511 29 121.1 183 6.3Science 4374 30 145.8 222 7.4Social Studies 4422 30 147.4 237 7.9Note: Data obtained from LPS

December 2000 Lynn Public Schools Review
Executive Order 393 - Education Management Accountability Board41
Chart 16-2
17. Technology
DOE approved the LPS five-year technology plan in March of 1996. The plan was preparedby the Technology Planning Group as part of the Lynn Tech 2000, a citywide technologyplanning committee. This group included the Superintendent, deputy superintendent, andexecutive director of management services, assistant superintendent of curriculum, communitymembers and various K-12 computer personnel. Funding for technology improvements andupgrades has been provided by a combination of school budget appropriation, capital grants,school construction reimbursements and city bonding.
There are more than 3,500 computers connected to over 30 servers and an array of peripheralcomponents throughout the LPS district.
Finding
Most elementary and middle schools have one computer lab with additional computers andInternet access found in the library. Only the high schools have an ample supply of computersin every classroom. There were very few computers in the classroom in the middle andelementary schools. Therefore, the students spend an average of one hour per week in thecomputer lab. The district has 4.3 students per computer, better than the state average of 7.2.The average rises to between 15 and 20 students per computer in the elementary and middleschools.
Lynn Public SchoolsElementary Class Size1999/00 School Year
Average Classes Average ClassesGrade Classrooms Students Class Size 25+ Grade Classrooms Students Class Size 25+
Pre K 63 707 11.2 0 Grade 3 61 1246 20.4 14K 60 1035 17.3 1 Grade 4 53 1167 22.0 8Grade 1 68 1322 19.4 4 Grade 5 53 1210 22.8 11Grade 2 64 1265 19.8 8 Grade 6 16 336 * 21.0 0Note: Data obtained from LPS* 6th Graders retained In elementary school per the school committee's request

December 2000 Lynn Public Schools Review
Executive Order 393 - Education Management Accountability Board42
Recommendation
The district should consider using resources to provide additional computers in theclassrooms at the elementary and middle school levels as included in the initial technologyplan.
The plan projected that full implementation would cost $15,100,000 over 5 years. The plan isin its 5th year and $17,056,476 or 113 percent has been expended. These expenditures areinclusive of $11,546,173 for the school committee, $4,197,238 for bonded technology,$1,308,065 for grants and $14,000 for donations. The schools are connected to a Wide AreaNetwork (WAN) and all schools have Internet access. The Internet is provided to LPS throughShore.Net of Lynn MA. The older school buildings have inadequate computer wiring and haveoutdated inadequate electrical service. These buildings would have to be converted fromsingle phase (outlet with a standard plug capability) to three phase electrical power (outlet witha standard plug plus voice and data capability).
Within the 99/2000 budget, the school committee approved a policy relative to providingtechnical, training, and technology curriculum integration support for schools. The policyupdates the current status and condition of LPS technology, supports technical training, showsfunding sources, personnel (FTE) requirements and curriculum support, as well asimplementation timeframes.
LPS has installed a new administrative server based software application with municipalfinancial compatibility to replace an outdated Digital Equipment Corporation (DEC)mainframe. Transfer of the human resources, payroll and position control occurred inNovember of 1999. A Pentamation student information system was implemented inSeptember 1999.
Although LPS has expended close to $17 million, the larger investment has been borne by thecity of Lynn through the school construction reimbursement program for new construction andmajor renovations to schools benefiting Lynn at a 90 percent rate of reimbursement.
18. Maintenance and Capital Improvement
The purpose of this section is to review how LPS maintains its facilities to ensure a safe,healthy educational environment and how the district plans for future facility needs.
Maintenance and Site Visits
The auditors conducted interviews and made site visits to all twenty-five public schools. All ofthe facilities appeared to be clean and maintained. Each school in the district has its own
December 2000 Lynn Public Schools Review
Executive Order 393 - Education Management Accountability Board43
maintenance and custodial staff. In 1999, LPS initiated a ten-man crew consisting of twoplumbers, two electricians, two roofers, two masons, and two painters.
This crew is responsible for maintenance and repairs in all of the schools in the district, whichthe regular custodial crew in each school was unable to do. In 1999, a weekly checklist, whichis filled out by the senior custodian and reviewed by the principal, was instituted. This checklistis a good mechanism to keep a check on the everyday maintenance and custodial issues.Most of the buildings, which were visited by the audit team, are in need of capital repair. Theaverage school building is 67 years old. Space is also an issue due to increasing enrollments,and parental choice for the sixth grade. The school committee gave parents a choice ofwhether to keep sixth graders in elementary school or send them to middle school.
Capital Improvements
LPS has a five year capital improvement plan and has invested over $70,000,000 in newconstruction, renovations to older schools and improvements since 1993. Since educationreform, Lynn has built 2 new schools (Classical High and Marshall’s Wharf annex to theVocational Technical High School) and is in the process of renovating 1 school (English HighSchool). English High School is 2 – 3 years behind schedule according to the capitalimprovement plan.
Lynn receives a 90% reimbursement for both new construction and major renovationinitiatives. LPS has a current plan for 1999 through 2004 to spend $120,000,000 in majorrenovations.
19. High School Accreditation
The Lynn Vocational and Technical Institute (LVTI) received its most recent accreditation fromthe New England Association of Schools and Colleges (NEAS&C) in 1996. The Commissionon Technical and Career Institutions made recommendations to LVTI in four areas: facilities,procurement, cleanliness issues, and compliance with city codes in its special report onNovember 13, 1998. The commission also noted the following commendations: movingahead with the rehabilitation and expansion of LVTI.
English High School received its most recent accreditation from NEAS&C in 1994. Thecommission reviewed the Special Progress Report on January 10, 2000. Althoughrecommending continuing accreditation, the commission determined that English High Schoolshould remain on warning for the Standards for Accreditation on School Resources forLearning until all concerns have been satisfactorily resolved. There were 167recommendations in the March 01, 1998 report. The status of the recommendations is: 130completed, 23 in progress, 9 planned for the future, 3 rejected, and 2 no action.

December 2000 Lynn Public Schools Review
Executive Order 393 - Education Management Accountability Board44
Classical High School received its most recent accreditation from NEAS&C in 1996. TheSpecial Progress Report was reviewed therefore removing the school from warning onSeptember 28, 1999.
The report cited significant progress addressing deficiencies related to the Standards forAccreditation on Library Technology, Media Services, and School Facilities.
The completion of the new high school construction project, increased level of funding for thelibrary media center, installation of the security system for the library media center, and theaddition of staff for television production pleased the commission.The Lynn high schools are currently preparing for the next progress reports, which are due in2001 and 2002.
20. Test Scores
Test scores are generally below the state average. MCAS scores show that LPS scoredbelow the state average scaled scores for all grades in all areas. SAT scores have beenbelow the state average. The Massachusetts Educational Assessment Program (MEAP), thestate’s educational testing program from 1988 to 1996, showed that LPS increased in all foursubject matters for grades 4 and 8 between 1988 and 1996. Results from the 1999 IowaTests of Educational Development (ITED) indicate that 59 percent of LPS 3rd gradersdemonstrated a high degree of proficiency in fundamental skills of reading.
Massachusetts Comprehensive Assessment System (MCAS)
MCAS is the statewide assessment program given yearly to grades 4, 8, and 10. It measuresperformance of students, schools, and districts on learning standards contained in theMassachusetts Curriculum Frameworks and fulfills the requirements of education reform. Thisassessment program serves two purposes:
• measures performance of students and schools against established statestandards; and
improves effective classroom instruction by providing feedback about instructionand modeling assessment approaches for classroom use.
MCAS tests are reported according to performance levels that describe student performancelevels in relation to established state standards. Students earn a separate performance levelof advanced, proficient, needs improvement, and failing based on their total scaled score foreach test completed. There is no overall classification of student performance across contentareas. Performance levels report school, district, and state levels.
MCAS scores show improvement from 1998 to 2000. While Lynn’s scores are below stateaverages, the improvement in scores outpaced statewide improvement over the test years.(Charts 20-1 and 20-2.)

December 2000 Lynn Public Schools Review
Executive Order 393 - Education Management Accountability Board45
In June of 1998, the DOE, based on the MCAS results categorized 19 of the 24 schools inLynn as “in need of improvement”. Since then LPS has implemented several initiatives toimprove student achievement and staff accountability. Some of which are:
• curriculum is aligned to the state frameworks• provided instructional facilitators to ensure uniform curriculum• the opening of four new alternative schools to bring the total to seven• the reduction of class size• the reduction of teaching load for English teachers in the high schools so their
primary focus is on writing• the opening of voluntary summer schools at all schools.
Principals will not receive salary increases unless they meet their goals of improved studentachievement in the MCAS according to their employment contracts. LPS is the only schoolsystem in the Commonwealth to tie administration salaries to test results.
Chart 20-1
Lynn Public SchoolsComparison of 1998 -- 2000 MCAS Average Scaled Scores
1998 1998 Point 1999 1999 Point 2000 2000 Point 1998 - 2000 Incr./Decr.All Students District State Diff. District State Diff. District State Diff. District State
Grade 4:English Language Arts 223 230 -7 225 231 -6 228 231 -3 5 1Mathematics 221 234 -13 224 235 -11 228 235 -7 7 1Science & Technology 228 238 -10 229 240 -11 234 241 -7 6 3
Grade 8:
English Language Arts 229 237 -8 228 238 -10 232 240 -8 3 3Mathematics 213 227 -14 213 226 -13 215 228 -13 2 1Science & Technology 215 225 -10 212 224 -12 217 228 -11 2 3History N/A N/A N/A 211 221 -10 212 221 -9 N/A N/A
Grade 10:English Language Arts 223 230 -7 221 229 -8 224 229 -5 1 -1Mathematics 213 222 -9 213 222 -9 221 228 -7 8 6Science & Technology 219 225 -6 219 226 -7 222 226 -4 3 1Total Score (excluding History) 1984 2068 -84 1984 2071 -87 2021 2086 -65 37 18Note: Data provided by DOE

December 2000 Lynn Public Schools Review
Executive Order 393 - Education Management Accountability Board46
Chart 20-2
Lynn Public Schools
1998, 99, & 2000 MCAS Test ScoresPercentage of Students at Each Performance Level
Grade Subject Year
Average Scaled Score Advanced Proficient
Needs Improve-
mentFailing
(Tested)Failing
(Absent)
2000 228 0 8 75 17 0English Lang. 1999 225 0 5 69 26 0
Arts 1998 223 0 4 62 34 0
2000 228 3 18 48 30 0Mathematics 1999 224 2 2 47 41 0
1998 221 2 9 38 51 0
2000 234 2 37 48 13 0Science and 1999 229 0 25 53 21 0Technology 1998 228 1 19 52 28 0
2000 232 0 38 39 22 1English Lang. 1999 228 0 26 44 29 1
Arts 1998 229 0 32 40 27 2
2000 215 2 9 22 67 0Mathematics 1999 213 1 7 20 71 2
1998 213 2 10 17 69 2
2000 217 1 13 23 62 1Science and 1999 212 1 9 19 71 2Technology 1998 215 1 10 24 63 2
2000 212 0 2 27 69 1History 1999 211 0 3 20 76 2
1998 N/A N/A N/A N/A N/A N/A
2000 224 3 21 33 41 3English Lang. 1999 221 1 15 36 47 0
Arts 1998 223 1 18 41 39 1
2000 221 6 14 24 54 2Mathematics 1999 213 2 8 21 68 1
1998 213 1 8 20 69 1
2000 222 1 14 38 44 3Science and 1999 219 0 9 35 54 1Technology 1998 219 0 8 37 53 1
Gra
de 1
0G
rade
8G
rade
4

December 2000 Lynn Public Schools Review
Executive Order 393 - Education Management Accountability Board47
Scholastic Aptitude Tests (SAT)
SAT scores are below the state average for all years shown.
Chart 20-3
Massachusetts Educational Assessment Program (MEAP)
In 1996 the district scored below the state average in all subjects matters for grades 4, 8 and10. MEAP reports in two ways: scaled scores, which range from 1000 to 1600, andproficiency levels, which are reported as percentage of students in each proficiency. Level 1is the lowest; level 2 is considered the “passing grade” level, while levels 3 and 4 constitute themore advanced levels of skills. [Appendix C]
Scores for LPS 4th and 8th grade students show an increase in level 2 in all four-subjectareas. Level 1 or below shows a decrease for both grades 4 and 8 in all four-subject areasfor those same years.
Lynn Public SchoolsScholastic Aptitude Test (SAT) Results
1995 1996 1997 1998 1999SAT State State State State State
Content Areas LPS Avg. LPS Avg. LPS Avg. LPS Avg. LPS Avg.Verbal 350 430 422 507 426 508 428 502 426 504Math 379 477 404 504 432 508 440 502 431 505Total 729 907 826 1011 858 1016 868 1004 857 1009
LPS - % ofState Avg. 80.4% 81.7% 84.4% 86.5% 84.9%Note: Data obtained from LPS and DOE

December 2000 Lynn Public Schools Review
Executive Order 393 - Education Management Accountability Board48
Chart 20-4
Between 1988 and 1996 MEAP scores for students in grades 4 and 8 improved in all foursubject areas. In 1996 grade 4 and 8 scores were under the state average in all four-subjectareas. [Appendix C]
Shown in Chart 20-5 are MEAP grade 4 reading scores for selected school districts whosescores in 1988 range from 1090 to 1250 as compared to LPS score of 1210. The scores forgrade 4 students are particularly significant because, 1996 should have initially seen thegreatest impact of education reform seen in the performance of these students. The readingscores for LPS grade 4 students showed an increase of 10 points from 1992 to 1996.
Lynn Public Schools
MEAP Proficiency Scores1992 and 1996 Fourth and Eighth Grades
1992 1996Fourth Grade Level 1 Level 2 Levels Level 1 Level 2 Levels
or Below 3 & 4 or Below 3 & 4Reading 58% 27% 14% 55% 32% 13%Mathematics 55% 34% 11% 59% 36% 6%Science 64% 26% 10% 55% 37% 9%Social Studies 63% 28% 9% 54% 39% 6%
1992 1996Eighth Grade Level 1 Level 2 Levels Level 1 Level 2 Levels
or Below 3 & 4 or Below 3 & 4Reading 58% 23% 19% 32% 38% 30%Mathematics 68% 22% 10% 40% 40% 20%Science 50% 21% 18% 40% 39% 22%Social Studies 63% 19% 17% 41% 38% 21%Note: Data provided by LPS. Percentages may not add to 100% due to rounding.

December 2000 Lynn Public Schools Review
Executive Order 393 - Education Management Accountability Board49
Chart 20-5
Iowa Tests
The Iowa Test of Basic Skills (Iowa tests) for grade 3 was administered throughoutMassachusetts in the spring of 1997, 1998 and 1999. The test defines four different levels ofreading comprehension: pre-reader, basic reader, proficient reader and advanced reader.
Chart 20-6
Lynn Public SchoolsIowa Test of Basic Skills
Pre Basic Proficient AdvancedLPS State Reader Reader Reader Reader
1997 42 65 12 35 43 101998 46 64 7 30 52 101999 53 69 5 33 43 16
Note: Data obtained from DOE
Reading Percentile Rank Reading Comprehension Performance
MEAP Reading Scores - 4th Grade- 1988 Scores from 1090 - 1250
Selected Districts 1992 - 1996
1988 1990 1992 1994 1996 Change
Holyoke 1090 1100 1170 1140 1110 -60Lawrence 1100 1100 1140 1220 1210 70Chelsea 1110 1100 1170 1140 1110 -60Boston 1150 1130 1170 1180 1180 10New Bedford 1200 1220 1270 1320 1270 0Cambridge 1200 1220 1240 1260 1230 -10Chicopee 1210 1240 1250 1270 1270 20Lynn 1210 1200 1230 1230 1240 10
Brockton 1220 1220 1210 1220 1200 -10Worcester 1230 1260 1280 1300 1350 70Medford 1230 1280 1290 1330 1310 20Malden 1240 1290 1280 1320 1310 30Taunton 1250 1270 1310 1320 1310 0State Average 1300 1310 1330 1300 1350 20
Note: A significant change in a score is considered to be 50 points in either direction.

December 2000 Lynn Public Schools Review
Executive Order 393 - Education Management Accountability Board50
In 1997, 81 percent of the tested students attended LPS since the first grade. For both 1998and 1999 this percentage was also approximately 81 percent. Proficient and advancedreaders were 59 percent in 1999 versus 62 percent in 1998 and 53 percent in 1997. Theoverall reading percentile rank has risen from 42 to 53 from 1997 to 1999. These readingpercentile ranks were below the state averages in these years.
The Iowa Tests of Educational development, also referred to as the Massachusetts Grade 10Achievement Test, was also administered in the spring of 1997. It tested seven different areasof skills including reading, quantitative thinking and social studies. Scores were based on anational sample of students who took the test. LPS grade 10 students scored at the 41stpercentile compared to the national sample. LPS’ performance compares to scores as highas the 89th percentile and as low as the 28th percentile for other Massachusetts schooldistricts.
21. Curriculum Development
The LPS curriculum was realigned three years ago to adopt the knowledge, concepts, andskills contained in the Massachusetts curriculum frameworks. Over one hundred teachersand staff undertook this project beginning in the summer of 1998. Curriculum guides in thefour core content areas were developed to include learning objectives, standards, basedlessons, and informal assessments. These curriculum guides were developed to assistteachers in translating the state learning standards into productive educational practices ineach of the four curriculum areas. As of our audit date, LPS curriculum was aligned to thestate frameworks in the four core subject areas with the exception of grades 9 through 12social studies. Physical education and health are presently being aligned. Instructional Facilitators are also located in each school to provide pedagogical andcurriculum support aligned to the Massachusetts curriculum frameworks and the Principles ofEffective Teaching as defined by the Massachusetts Education Reform Act of 1993. Byhaving the Instructional Facilitators based at each school the district feels that they canassess needs and focus on how and what students are taught.
22. Grade 3 Transiency
Student transiency is generally defined as the percentage of students who enter and/or leavethe system after the first day of school. Transiency poses an educational problem becausestudents may lose the benefit of a sequential and coherent school program as they move fromschool to school.
According to Chart 22-1, of the 14 communities of similar population to Lynn, LPS transiencypercentage is 19 percent, below the statewide average of 20.4 percent. LPS has a relatively

December 2000 Lynn Public Schools Review
Executive Order 393 - Education Management Accountability Board51
high stable population percent of grade 3 students who attended LPS in grades 1, 2 and 3.This stability percentage, 81 percent, is above the statewide average of 79.6 percent.
Chart 22-1
23. Dropout and Truancy
Chart 23-1 identifies Lynn’s dropout rates from FY93 to FY98 in comparison to the stateaverage and to the average of fourteen communities similar in population to Lynn. Lynn’sdropout rate for FY98 was 2.2 percentage points higher than the state average of 3.4 percent.This dropout rate was lower than previous years due partially to LPS increasing its truancypolice force from one to three persons. Truant officers work with all schools in the district aswell as the Lynn Police Department to monitor the student base to prevent truancy andsubsequent dropouts. These truancy officers all carry communication devices to receive anymessages from principals and the Lynn Police Department pertaining to students whomshould be in school. In addition to the above, LPS produces absences reports on all students.
Transiency and Stability - 3rd GradeSelected Communities
Stable Total Stable Population TransiencyCommunity Population Population Percent PercentSpringfield N/A 1,539 N/A N/ANewton 630 724 87.0% 13.0%Fall River 794 924 85.9% 14.1%Quincy 453 528 85.8% 14.2%New Bedford 930 1,099 84.6% 15.4%Framingham 397 475 83.6% 16.4%Waltham 278 335 83.0% 17.0%Lowell 879 1,062 82.8% 17.2%Lawrence 634 766 82.8% 17.2%Cambridge 327 396 82.6% 17.4%Worcester 1,515 1,843 82.2% 17.8%Boston 3,133 3,846 81.5% 18.5%Brockton 1,042 1,285 81.1% 18.9%Lynn 778 960 81.0% 19.0%Somerville 262 339 77.3% 22.7%Statewide 54,239 68,103 79.6% 20.4%Note: Student population includes only students tested under "routine" conditions. Data obtained from DOE's 1999 Iowa Grade 3 reading test summary results

December 2000 Lynn Public Schools Review
Executive Order 393 - Education Management Accountability Board52
These reports are monitored and used to identify truant students. Students found to be absentwithout a valid reason such as sickness or a religious holiday is given detention.
LPS offers nine alternative school programs to keep at risk children in the system. Thisincludes a high school with after workday hours and a program for pregnant teens. Theseprograms have also contributed to the overall decrease in the dropout rates.
Chart 23-1
IV. Employee Survey
The audit team conducted a confidential survey of all employees of LPS to provide a forumfor teachers and staff to express their opinions on education in LPS. A total of 2,000questionnaires were delivered to school staff and 638 responses were received andtabulated, a response rate of 31.9 percent. Areas covered by the survey include:
High School Dropout Rates
Selected CommunitiesFY93 - FY98
Community FY93 FY94 FY95 FY96 FY97 FY98Lawrence 14.0% 13.8% 8.6% 6.4% 10.4% 17.4%New Bedford 10.7% 9.1% 9.5% 9.2% 9.0% 9.2%Somerville 5.7% 7.5% 7.8% 5.9% 5.5% 4.9%Chicopee 5.4% 5.6% 3.9% 12.0% 6.4% 5.8%Brockton 9.0% 8.3% 8.4% 7.3% 5.7% 3.6%Fall River 8.7% 6.7% 6.1% 8.1% 4.6% 4.5%Lynn 7.1% 9.3% 7.2% 7.2% 4.3% 5.6%Weymouth 2.5% 2.8% 2.4% 2.9% 4.1% 3.8%Framingham 3.2% 3.2% 3.6% 2.5% 3.8% 3.8%Lowell 3.1% 3.3% 2.8% 2.6% 3.1% 8.2%Waltham 2.1% 3.0% 2.4% 2.8% 1.8% 3.3%Medford 1.3% 1.8% 2.7% 2.1% 2.5% 2.5%Cambridge 4.0% 3.3% 4.2% 3.0% 2.0% 2.5%Quincy 1.7% 1.5% 1.0% 1.0% 1.5% 1.5%Newton 0.4% 1.1% 1.0% 0.7% 1.0% 0.9%Average These Communities 5.3% 5.4% 4.8% 4.9% 4.4% 5.2%Median These Communities 4.0% 3.3% 3.9% 3.0% 4.1% 3.8%State Average 3.5% 3.7% 3.6% 3.4% 3.4% 3.4%Note: Data provided by DOE

December 2000 Lynn Public Schools Review
Executive Order 393 - Education Management Accountability Board53
1. education reform,2. education goals and objectives,3. curriculum,4. planning,
5. communications and mission statements,6. budget process,7. professional development,8. supplies,9. facilities, and
10. computers and other education technology.
Appendix D shows the teachers’ answers to the survey questions. The Superintendent alsoreceived a summary of responses.
Seventy-six percent of teacher’s think that education reform issues are considered whentheir own school-based plans are made and sixty-eight percent think that also applies todistrict-wide plans. Seventy-six percent believe that the school district is taking positivesteps to improve education and sixty-three percent state that their job has changed becauseof education reform.
Sixty-seven percent of teachers are clear about the school district’s goals and objectives aswell as how they relate to their own jobs. Forty-five percent feel that they have a role in thedevelopment of these goals and objectives versus thirty-six percent do not. Fifty-Six percent confirm that there are indicators used to measure progress toward them versussixteen percent who do not.
The survey indicates that twenty-five percent of teachers do not think that an increase inschool funding is tied directly to improvements in education. Thirty-five percent of teachersthink that improvements in education at the school would have occurred without educationreform.
Fifty-five percent believe that the curriculum is coherent and sequential. Forty-three percentbelieve that the curriculum now in use in their school will improve student test scores whileforty-three percent are not sure. Sixty-five percent of the teachers feel that there is acoherent, on-going effort within LPS to keep curriculum current and forty-one percent feel thatteachers play an important role in reviewing and revising the curriculum versus thirty-fourpercent who do not. Sixty percent feel that how a teacher teaches a subject impacts testscores more than curriculum content.
Seventy percent believe that planning for important issues such as curriculum, and budgetwithin the district is a top down process. Forty-three percent do not feel that there is animportant role for teachers and professional staff in the planning process versus, thirty-twopercent, which do. Forty-two percent believe that decisions made by central office/school

December 2000 Lynn Public Schools Review
Executive Order 393 - Education Management Accountability Board54
committee are not clearly explained so that the basis for the decision/policy is understoodversus thirty-one percent who do.
Forty-six percent feel that on-going communications between teachers and administrators isnot adequate versus thirty-two percent, which do. Forty percent understand how the budgetprocess impacts their department versus thirty-nine percent who do. Forty-nine percent feelthat they do not understand the school budget process versus twenty-eight percent who do.
Forty-one percent feel that the school budget process is not fair and equitable versus sixteenpercent who do. Thirty-nine percent believe that budgetary needs are not adequatelyaddressed in the budget process, versus sixteen percent who do. Forty-two percent believethat the school department is not doing the best that it can with the budget process versustwenty-two percent who do.
Thirty percent feel that there is not an adequate professional development program in theirschool versus fifty-two percent who do. Forty-five percent feel that there are deficiencies inthe professional development program versus twenty-eight percent who do.
Forty-four percent have not received sufficient and appropriate supplies versus forty-fivepercent who do. Sixty-three percent believe they have not been supplied with ancillarycurriculum materials whereas twenty-four percent have. Thirty-eight percent believe theyhave not been supplied with a sufficient number of current editions of textbooks whereas fifty-two percent have. Forty-seven percent believe the process for obtaining supplies andmaterials is not effective, time sensitive and responsive to classroom needs versus thirty-fivepercent who do.
Thirty-nine percent believe that the overall state of school facilities is not good versus thirty-six percent who do. Forty-one percent rates the overall state of classrooms, labs, and otherteaching rooms are not good versus thirty-seven people who do. Thirty-eight would rate theoverall state of the areas outside of the building as not good versus thirty-six percent who do.Twenty-six percent would rate the overall state of the common areas as not good versusforty-one percent feel they are good.
Forty percent feel that the computers and other technological tools are not a significant partof the instructional practices in the schools versus thirty-seven percent who feel they aresignificant. Fifty-nine percent feel that the number of computers available per student is notsufficient versus twenty-eight percent who do. Sixty-two percent do not have computersdedicated for their usage versus thirty-four percent who do. Thirty-one percent feel that thereis no policy or program providing for computer training for teachers on software andcomputers used by students versus forty-three percent who do. Twenty-four percent feel thatthe software packages in the computer are not uniform and consistent with the instructionallevel being provided versus forty-four percent who do.
V. Superintendent’s Statement – Education Reform

December 2000 Lynn Public Schools Review
Executive Order 393 - Education Management Accountability Board55
As part of this review, the Superintendent was asked to submit a brief statement expressinghis point of view with respect to three areas:
1. school district progress and education reform since 1993;2. barriers to education reform; and3. plans over the next three to five years.
The Superintendent’s statement is included in Appendix E.
VI. Appendix
Appendix A1 Total School District Expenditures by Function
Appendix A2 Total School District Expenditures by Program and PercentageDistribution
Appendix B1 Foundation Budget Line ItemsTargets and Expenditures FY96, FY98-FY99 - Table
Appendix B2 - 3 Foundation Budget Line ItemsTargets and Expenditures FY96, FY98-FY99 - Graph
Appendix C Mass. Educational Assessment Program (MEAP)
Appendix D Employee Survey Results
Appendix E Superintendent’s Statement on Education ReformAccomplishments, Barriers and Goals
Appendix F Auditee’s Response

Appendix A-1Page 1 of 2
Lynn Public SchoolsTotal School District Expenditures By Function(in thousands of dollars)
% of % of FY93 Total FY97 FY99 Total $ Diff. % Diff.
Instructional Services:Supervisory $560 1% $1,442 $1,596 1% $1,036 185.1%Principal $2,664 5% $3,963 $4,399 4% $1,735 65.1%Teaching $18,264 32% $44,338 $53,079 49% $34,815 190.6%Professional Development N/A N/A $749 $1,519 1% N/A N/ATextbooks & Inst. Equipment $405 1% $1,150 $994 1% $589 145.2%Instructional Technology N/A N/A $0 $447 0% N/A N/AEducational Media $203 0% $373 $914 1% $711 350.0%Guidance & Psychological $1,207 2% $1,700 $2,040 2% $833 69.0%Subtotal: $23,303 41% $53,715 $64,986 60% $41,684 178.9%
Other Services:General Administration $199 0% $271 $552 1% $352 176.7%Administrative Support $1,148 2% $1,599 $1,572 1% $423 36.8%Administrative Technology N/A N/A $0 $353 0% N/A N/AEmployee Benefits Admin. N/A N/A $0 $312 0% N/A N/AAttendance $74 0% $170 $174 0% $100 134.7%Health $58 0% $485 $1,094 1% $1,036 1781.9%Pupil Transportation $1,262 2% $2,134 $2,424 2% $1,162 92.1%Food Service $349 1% $413 $427 0% $78 22.3%Athletics $293 1% $1,070 $662 1% $370 126.3%Other Student Body Activities $52 0% $0 $0 0% -$52 -100.0%Operations and Maintenance$4,857 8% $8,089 $9,767 9% $4,910 101.1%Extraordinary Maintenance N/A N/A $0 $0 0% N/A N/ANetworking & Telecomm. N/A N/A $0 $207 0% N/A N/AEmployee Benefits & Ins. $880 2% $138 $159 0% -$722 -82.0%Rent. Lease, Int.,Fixed Chgs. $0 0% $473 $664 1% $664 N/ACivic Activities $99 0% $4 $86 0% -$13 -12.9%Asset Acq. & Improvement $0 0% $0 $7 0% $7 N/APayments To Other Districts$2,169 4% $2,608 $3,981 4% $1,812 83.5%Subtotal: $11,442 20% $17,454 $22,441 21% $10,999 96.1%
Total School CommitteeExpenditures By Function:$34,745 61% $71,169 $87,427 81% $52,683 151.6%
Note: Data provided by LPS. Percentages may not add due to rounding. Health and Pupil Transportation include non-Public. N/A indicates no category in that fiscal year or dividing by "0". Certain lines omitted due to no dollar entry.
FY93 - FY99

Appendix A-1Page 2 of 2
Lynn Public SchoolsTotal School District Expenditures By Function(in thousands of dollars)
% of % ofFY93 Total FY97 FY99 Total $ Diff. % Diff.
Municipal Expenditures:General Administration $0 0% $904 $926 1% $926 N/AHealth Services $452 1% $370 $0 0% -$452 -100.0%Pupil Transportation $0 0% $0 $0 0% $0 N/AOperation & Maint.- Plant $679 1% $0 $0 0% -$679 -100.0%Extraordinary Maint. N/A N/A $0 $0 0% N/A N/ANetworking & Telecomm. N/A N/A $0 $0 0% N/A N/AEmployer Retirement $1,507 3% $1,819 $2,594 2% $1,087 72.1%Insurance $8,816 15% $9,566 $9,155 8% $339 3.8%Rent-Lease, Int., Chgs. $250 0% $0 $396 0% $146 58.5%Asset Acq. & Improve. $0 0% $0 N/A N/A N/A N/ADebt Service $762 1% $0 $5,586 5% $4,824 633.5%Payments - Other Dists. $0 0% $772 $1,926 2% $1,926 N/ATotal Munic. Expend: $12,466 22% $13,431 $20,582 19% $8,116 65.1%
EEO $8,902 16% $0 $0 0% -$8,902 -100.0%
FY93 Per Pupil Aid $1,200 2% $0 $0 0% -$1,200 -100.0%
Total School DistrictExpend. By Function: $57,313 100% $84,600 $108,010 100% $50,697 88.5%Note: Data provided by LPS. Percentages may not add due to rounding. Health and Pupil Transportation include non-Public. N/A indicates no category in that fiscal year or dividing by "0". Certain lines omitted due to no dollar entry.
FY93 - FY99

Appendix A-2 Page 1 of 2
Lynn Public SchoolsTotal School District Expenditures By Program (in thousands of dollars) and By Percentage Distribution
$ % $ % $ % $ %FY93 FY93 FY95 FY95 FY97 FY97 FY99 FY99 $ Diff % Diff.
Instructional:Regular Day $12,238 21.4% $25,896 36.5% $32,635 38.6% $37,261 34.5% $25,023 204.5%Special Education $4,886 8.5% $8,254 11.6% $10,811 12.8% $13,220 12.2% $8,334 170.6%Bilingual $1,388 2.4% $1,998 2.8% $2,538 3.0% $3,218 3.0% $1,830 131.9%Occupational Day $1,924 3.4% $2,169 3.1% $2,647 3.1% $4,009 3.7% $2,085 108.3%Undistributed $2,867 5.0% $3,539 5.0% $5,084 6.0% $7,279 6.7% $4,412 153.9%Subtotal Instructional: $23,303 40.7% $41,856 59.1% $53,715 63.5% $64,986 60.2% $41,684 178.9%
Other Services:Regular Day $102 0.2% $197 0.3% $142 0.2% $303 0.3% $201 196.1%Special Education $3,194 5.6% $3,983 5.6% $4,278 5.1% $5,903 5.5% $2,709 84.8%Bilingual $173 0.3% $306 0.4% $246 0.3% $285 0.3% $112 64.3%Occupational Day $0 0.0% $0 0.0% $0 0.0% $0 0.0% $0 N/AUndistributed $7,972 13.9% $9,693 13.7% $12,788 15.1% $15,950 14.8% $7,978 100.1%Subtotal Other Services: $11,442 20.0% $14,180 20.0% $17,454 20.6% $22,441 20.8% $10,999 96.1%
Total School Expenditures:Regular Day $12,341 21.5% $26,093 36.8% $32,777 38.7% $37,564 34.8% $25,224 204.4%Special Education $8,080 14.1% $12,238 17.3% $15,089 17.8% $19,123 17.7% $11,043 136.7%Bilingual $1,561 2.7% $2,304 3.3% $2,784 3.3% $3,503 3.2% $1,942 124.4%Occupational Day $1,924 3.4% $2,169 3.1% $2,647 3.1% $4,009 3.7% $2,085 108.3%Undistributed $10,839 18.9% $13,232 18.7% $17,872 21.1% $23,229 21.5% $12,389 114.3%Total: $34,745 60.6% $56,036 79.1% $71,169 84.1% $87,427 80.9% $52,683 151.6%Note: Data provided by LPS
FY93 - FY99

Appendix A-2 Page 2 of 2
Lynn Public SchoolsTotal School District Expenditures By Program (in thousands of dollars) and By Percentage Distribution
$ % $ % $ % $ %FY93 FY93 FY95 FY95 FY97 FY97 FY99 FY99 $ Diff % Diff.
Municipal:Regular Day $0 0.0% $598 0.8% $561 0.7% $1,761 1.6% $1,761 N/ASpecial Education $0 0.0% $0 0.0% $81 0.1% $72 0.1% $72 N/ABilingual $0 0.0% $0 0.0% $0 0.0% $0 0.0% $0 N/AOccupational Day $0 0.0% $0 0.0% $130 0.2% $93 0.1% $93 N/AUndistributed $12,466 21.8% $14,224 20.1% $12,659 15.0% $18,656 17.3% $6,190 49.7%Total Municipal: $12,466 21.8% $14,822 20.9% $13,431 15.9% $20,582 19.1% $8,116 65.1%
School and Municipal Expenditures:Regular Day $12,341 21.5% $26,691 37.7% $33,338 39.4% $39,325 36.4% $26,985 218.7%Special Education $8,080 14.1% $12,238 17.3% $15,170 17.9% $19,195 17.8% $11,115 137.6%Bilingual $1,561 2.7% $2,304 3.3% $2,784 3.3% $3,503 3.2% $1,942 124.4%Occupational Day $1,924 3.4% $2,169 3.1% $2,777 3.3% $4,102 3.8% $2,178 113.2%Undistributed $23,305 40.7% $27,457 38.7% $30,531 36.1% $41,885 38.8% $18,579 79.7%Total: $47,211 82.4% $70,858 100.0% $84,600 100.0% $108,010 100.0% $60,799 128.8%
Equal Educ. Opportunity $8,902 15.5% $0 0.0% $0 0.0% $0 0.0% -$8,902 -100.0%
FY93 Per Pupil Aid $1,200 2.1% $0 0.0% $0 0.0% $0 0.0% -$1,200 -100.0%
Total School DistrictExpend. By Program $57,313 100.0% $70,858 100.0% $84,600 100.0% $108,010 100.0% $50,697 88.5%Note: Data provided by LPS
FY93 - FY99

Appendix B1Lynn Public SchoolsNet School Spending According to Foundation Budget Categories(in thousands of dollars)
FY96 FY98 FY99 FY96 FY98 FY99 FY96 FY98 FY99
Teaching Salaries $36,159 $43,968 $47,969 $37,280 $42,391 $44,202 ($1,121) $1,577 $3,767Support Salaries $2,220 $2,736 $2,976 $8,905 $10,209 $10,699 ($6,685) ($7,473) ($7,723)Assistants' Salaries $2,539 $3,448 $3,658 $1,450 $1,673 $1,715 $1,089 $1,775 $1,943Principals' Salaries $1,998 $2,656 $2,862 $2,729 $3,129 $3,308 ($731) ($473) ($446)Clerical Salaries $2,256 $2,913 $2,736 $1,617 $1,856 $1,953 $639 $1,057 $783Health Salaries $245 $709 $864 $609 $700 $731 ($364) $9 $133Central Office Salaries $797 $950 $1,113 $2,620 $3,006 $3,164 ($1,823) ($2,056) ($2,051)Custodial Salaries $4,596 $5,516 $6,324 $3,038 $3,460 $3,612 $1,558 $2,056 $2,712Total Salaries $50,810 $62,896 $68,502 $58,248 $66,424 $69,384 ($7,438) ($3,528) ($882)
Benefits $11,356 $11,300 $11,632 $8,086 $9,229 $9,633 $3,270 $2,071 $1,999
Expanded Program $0 $0 $0 $2,091 $2,359 $2,399 ($2,091) ($2,359) ($2,399)Professional Development $82 $1,317 $1,519 $1,385 $1,578 $1,647 ($1,303) ($261) ($128)Athletics $730 $784 $663 $737 $836 $951 ($7) ($52) ($288)Extra-Curricular $42 $0 $0 $397 $454 $495 ($355) ($454) ($495)Maintenance $2,839 $2,919 $3,650 $3,999 $4,560 $4,792 ($1,160) ($1,641) ($1,142)Special Needs Tuition $2,593 $3,393 $4,052 $1,655 $1,898 $2,003 $938 $1,495 $2,049Miscellaneous $3,144 $4,003 $4,750 $1,278 $1,468 $1,555 $1,866 $2,535 $3,195Books and Equipment $2,532 $4,392 $4,380 $4,137 $4,748 $5,079 ($1,605) ($356) ($699)Extraordinary Maintenance $0 $0 $0 $2,599 $2,962 $3,110 ($2,599) ($2,962) ($3,110)Total Non-Salaries $11,962 $16,808 $19,014 $18,278 $20,863 $22,031 ($6,316) ($4,055) ($3,017)
Total $74,128 $91,004 $99,148 $84,612 $96,516 $101,048 ($10,484) ($5,512) ($1,900)Revenues $0 $0 $0Net School Spending $74,128 $91,004 $99,148 $84,612 $96,516 $101,048 ($10,484) ($5,512) ($1,900)Note: Data obtained from DOE and HPS. Totals may not add due to rounding.
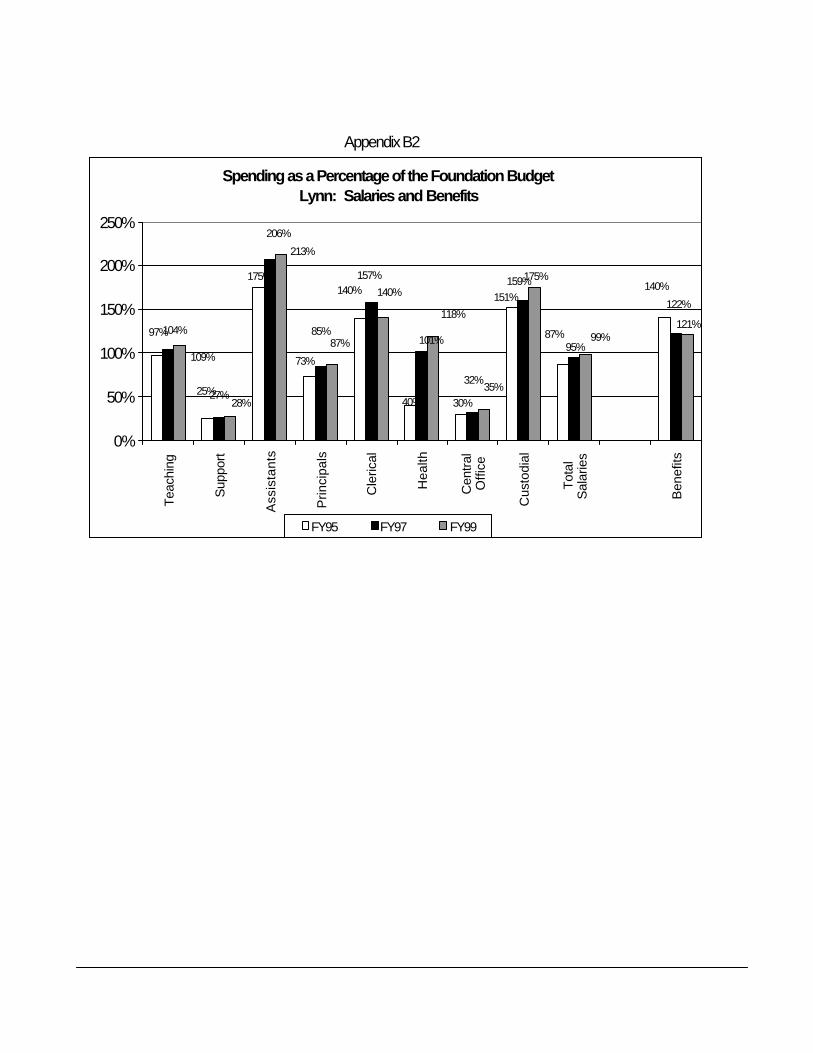
Appendix B2
Spending as a Percentage of the Foundation Budget Lynn: Salaries and Benefits
175%
30%
95%
175%
121%
140%
87%
151%
40%
140%
73%
25%
97%
122%
159%
32%
101%
157%
85%
206%
27%
104%99%
35%
118%
140%
87%
213%
28%
109%
0%
50%
100%
150%
200%
250%
Teac
hing
Sup
port
Ass
ista
nts
Prin
cipa
ls
Cle
rical
Hea
lth
Cen
tral
Offi
ce
Cus
todi
al
Tota
lS
alar
ies
Ben
efits
FY95 FY97 FY99

Appendix B3
Spending as a Percentage of the Foundation Budget Lynn: Non-Salary Categories
0%
81%94%
0%
61%
157%
71%
11%6%0%
99%
246%
65%
88%93%
273%
179%
64%
0%
94%83%
0%0%
305%
202%
76%
0%
70%
92%
0%
86%86% 98%
0%
100%
200%
300%
400%
Expa
nded
Prog
ram
Pro
fess
iona
lD
evel
opm
ent
Ath
letic
s
Ext
ra-C
urric
.
Mai
nt.
Sp. N
eeds
Tuitio
n Mis
c.
Book
s an
dEq
uip.
Ext
raor
dina
ryM
aint
.
Tota
l Non
-Sa
larie
s
Tota
l
FY95 FY97 FY99
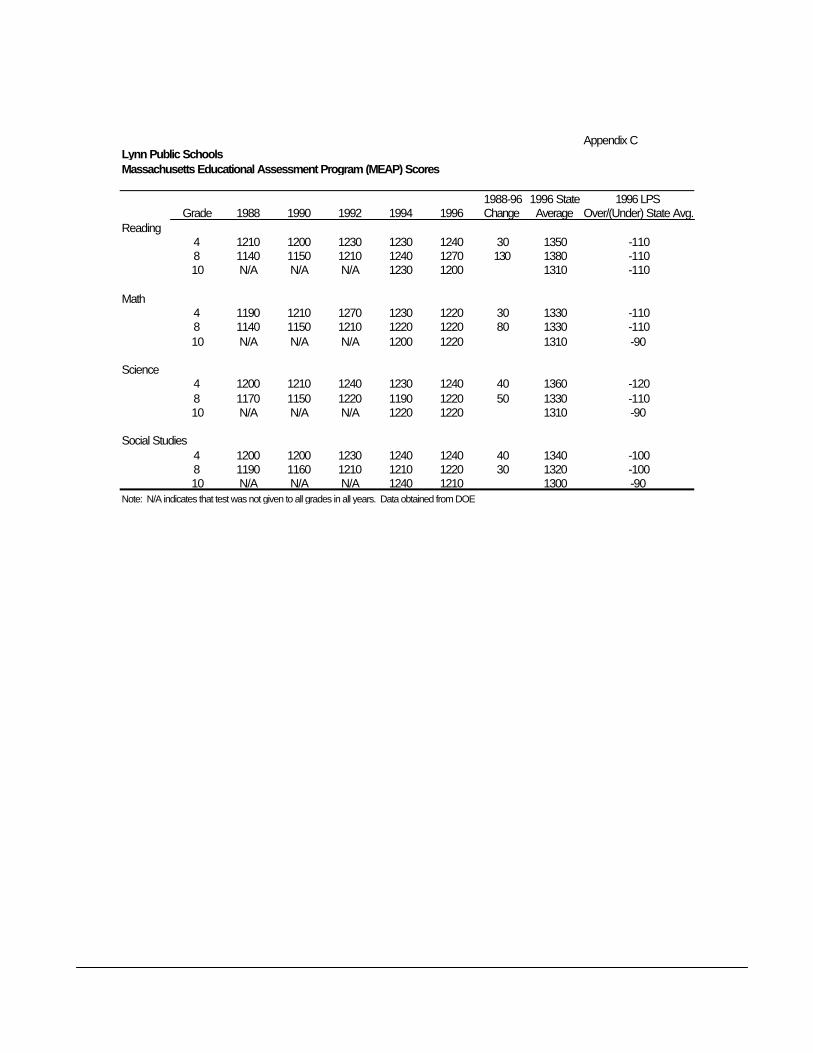
Appendix CLynn Public SchoolsMassachusetts Educational Assessment Program (MEAP) Scores
1988-96 1996 State 1996 LPSGrade 1988 1990 1992 1994 1996 Change Average Over/(Under) State Avg.
Reading4 1210 1200 1230 1230 1240 30 1350 -1108 1140 1150 1210 1240 1270 130 1380 -11010 N/A N/A N/A 1230 1200 1310 -110
Math4 1190 1210 1270 1230 1220 30 1330 -1108 1140 1150 1210 1220 1220 80 1330 -11010 N/A N/A N/A 1200 1220 1310 -90
Science4 1200 1210 1240 1230 1240 40 1360 -1208 1170 1150 1220 1190 1220 50 1330 -11010 N/A N/A N/A 1220 1220 1310 -90
Social Studies4 1200 1200 1230 1240 1240 40 1340 -1008 1190 1160 1210 1210 1220 30 1320 -10010 N/A N/A N/A 1240 1210 1300 -90
Note: N/A indicates that test was not given to all grades in all years. Data obtained from DOE

APPENDIX DEMPLOYEE SURVEY - Lynn Rating Scale638 teachers responding Yes/No Questions Opinion
yes 1&2 Good to Excellent
No 4 &5 Not good, inadequate
Note: Percentages may not add to Not sure, one way 3 OK - could be better, 100% due to rounding or the other could be worse
1 Education Reform 1&2 4 &5 31.a. Are you familiar with the issues of Education Reform, the Law
passed in 1993? 78% 7% 15%
1.b. Do you feel you have a good understanding of the purpose and the goals of the law? 73% 9% 17%
1.c. Do you feel that there is a lot of confusion about what Education Reform is all about? 60% 16% 24%
1.d. Do you feel the issues of Education Reform are considered when school district plans are made? 68% 5% 27%
1.e. Do you feel the issues of Education Reform are considered when school-based plans are made? 76% 6% 18%
1.f. In your opinion is the school district taking positive steps to improve education? 76% 10% 14%
1.g. Do you feel your job has changed because of Education Reform? 63% 21% 15%
1.h. Do you think there has been an improvement in student achievement in your school due to Education Reform? 40% 19% 40%
1.i. Do you think the improvements in education at the school would have happened without Education Reform? 35% 20% 46%
1.j. Have you perceived an increase in school funding tied directly to improvements in education in your district? 36% 25% 39%
1.k. Is there a formalized process in place to analyze student test scores and identify areas of academic weakness? 61% 11% 28%
1.l. Are there specific programs in place to improve student performance in areas where academic weaknesses have been identified? 77% 8% 15%
2 Educational Goals and Objectives 1&2 4 &5 32.a. Are the school administration's goals and objectives generally
clear and understandable? 71% 15% 14%
2.b. Are you clear about the school district's goals and objectives as they relate to your own job? 67% 17% 16%
2.c. Are there indicators issued to measure progress toward goals and objectives generally? 53% 15% 31%
2.d. Are there indicators used to measure your progress toward goals and objectives? 56% 16% 27%
2.e. Do you have a role in developing these goals and objectives? 45% 36% 19%

APPENDIX DEMPLOYEE SURVEY - Lynn Rating Scale638 teachers responding Yes/No Questions Opinion
yes 1&2 Good to Excellent
No 4 &5 Not good, inadequate
Note: Percentages may not add to Not sure, one way 3 OK - could be better, 100% due to rounding or the other could be worse
3 Curriculum 1&2 4 &5 33.a. Do you believe that your district's curriculum is coherent and
sequential? 55% 24% 20%
3.b. Do you believe that your curriculum is challenging and tied to preparing students for life after secondary school? 59% 19% 22%
3.c. Is there a coherent, on-going effort within the district to keep curriculum current with evolving trends and best practices in pedagogy and educational research? 65% 15% 20%
3.d. Do teachers play an important role in reviewing and revising curriculum in the district? 41% 34% 25%
3.e. Will the curriculum now in use in your school improve student test scores? 43% 14% 43%
3.f. Do you believe that the curriculum content does not impact test scores as much as how a subject is taught by a teacher? 60% 16% 24%
3.g. Is the curriculum in your school aligned with the state frameworks? 87% 4% 9%
4 Planning 1&2 4 &5 34.a. Is the planning for important issues (e.g. curriculum, budgetary,
etc.) within the district a top-down process? 70% 7% 23%4.a.1. If the answer is "Definitely yes" (1) or "Generally yes" (2), is
there an important role for teachers and professional staff in the planning process? 32% 43% 25%
4.b. If staff does not have an important role in developing plans, are decisions made by the central office/school committee explained so that you can understand the basis for the decision/policy? 31% 42% 27%
4.c. Are you familiar with the content of your school improvement plan? 82% 9% 9%
4.d. Does the school improvement plan address the needs of students in your school? 76% 8% 16%
4.e. Is the plan used to effect important changes in your school? 68% 10% 22%

APPENDIX DEMPLOYEE SURVEY - Lynn Rating Scale638 teachers responding Yes/No Questions Opinion
yes 1&2 Good to Excellent
No 4 &5 Not good, inadequate
Note: Percentages may not add to Not sure, one way 3 OK - could be better, 100% due to rounding or the other could be worse
5 Communications and Mission Statement 1&2 4 &5 35.a. Is there adequate on-going communication between teachers
and district administrators? In other words, do you think that you know what is going on in the district? 32% 46% 22%
5.b. Is there adequate communication between you and your superiors? 64% 22% 14%
5.c. Is there a mission statement in place for your school district? 75% 4% 21%
5.d. Is there a mission statement in place for your school? 90% 2% 7%
5.e. Does the mission statement define how the school is run, and how students are taught? 75% 7% 18%
5.f. Are these mission statements applied in the operation of the school and the teaching of students? 70% 8% 21%
6 Budget Process 1&2 4 &5 36.a. Do you understand your school budget process? 28% 49% 22%6.b Do you understand how the budget process impacts your
department? 40% 39% 21%6.c. Is the school budgeting process fair and equitable? 16% 41% 43%6.d. Are budgetary needs solicited and adequately addressed in the
budget process? 16% 39% 46%6.e. Once the budget is approved and implemented, does the
allocation and use of funds match the publicly stated purposes?16% 29% 55%
6.f. Given the circumstances, the school department seems to be doing the best it can with in the school budget process. 22% 42% 36%
6.g. Are there deficiencies in this process? 45% 17% 38%
7 Professional Development 1&2 4 &5 37.a. Is there an adequate professional development program in your
school? 52% 30% 17%
7.b. Is the program designed to meet school needs and tied to the new frameworks and assessments? 60% 18% 22%
7.c. Is the program designed to change the content of pedagogy in classrooms? 48% 19% 33%
7.d. Are there deficiencies in the professional development program? 45% 28% 27%
7.e. Did you participate in the professional development program in 1997/98? 76% 19% 4%
7.f. Professional development is making a difference and will improve education in my school district. 55% 20% 25%

8 Supplies 1&2 4 &5 38.a. Have you generally received sufficient and appropriate supplies
to do your job? 45% 44% 11%
8.b. Have you generally received sufficient and appropriate basic educational supplies (e.g. chalk, paper, pens, pencils, etc.) to do your job? 62% 27% 11%
8.c. Have you generally been supplied with a sufficient number of a current edition of textbooks? 52% 38% 10%
8.d. Are students given a copy of these textbooks to keep at home during the year? 4% 90% 6%
8.e. Have you generally been supplied with sufficient ancillary curriculum materials (e.g. current maps, lab supplies, videos, etc.)? 24% 63% 14%
8.f. Is the process for obtaining supplies and materials effective, time sensitive and responsive to your classroom needs? 35% 47% 18%
9 Facilities 1&2 4 &5 39.a. How would you rate the overall state of school facilities (e.g.
cleanliness, security, maintenance, structural integrity)? 36% 39% 24%
9.b. How would you rate the overall state of classrooms, labs, and other teaching rooms/areas? 37% 41% 22%
9.c. How would you rate the overall state of the common areas (e.g. hallways, stairwells, and cafeteria)? 41% 26% 33%
9.d. How would you rate the overall state of the areas outside of the building (e.g. playgrounds, walk-ways and grounds)? 36% 38% 26%
9.e. Would you agree with the following statement: "The school administration makes an effort to provide a clean and safe working environment." 60% 20% 21%
APPENDIX DEMPLOYEE SURVEY - Lynn Rating Scale638 teachers responding Yes/No Questions Opinion
yes 1&2 Good to Excellent
No 4 &5 Not good, inadequate
Note: Percentages may not add to Not sure, one way 3 OK - could be better, 100% due to rounding or the other could be worse

APPENDIX DEMPLOYEE SURVEY - Lynn Rating Scale638 teachers responding Yes/No Questions Opinion
yes 1&2 Good to Excellent
No 4 &5 Not good, inadequate
Note: Percentages may not add to Not sure, one way 3 OK - could be better, 100% due to rounding or the other could be worse
10 Computers and other Educational Technology 1&2 4 &5 310.a. Are the usage of computers and other technological tools a
significant part of the management practices at the school? 52% 27% 22%10.b. Are the usage of computers and other technological tools a
significant part of the instructional practices at the school? 37% 40% 23%10.c. In terms of student usage, are computers generally available
only in a computer laboratory setting or library/media center? 69% 25% 6%10.d. How many computers are located in your classroom?
10.e. Do you have a school computer provided for and dedicated for your usage? 34% 62% 4%
10.f. Is there a school computer provided for and shared by you and other teachers? 58% 31% 11%
10.g. Are there computers available for and used on a regular basis by students? 58% 29% 13%
10.h. Is the number of available computers sufficient for the number of students? 28% 59% 14%
10.i. Are the computers in good working order? 56% 20% 24%10.j. Are the software packages in the computers uniform and
consistent with the instructional level to be provided? 44% 24% 33%10.k. Is there a policy or program providing for computer training for
teachers on software and computers used by students? 43% 31% 25%

APPENDIX E
1.School District Progress and Education Reform since 1993
Before the Education Reform Act, Lynn could not afford the kind of schooling taken for
granted in wealthy suburban communities. Such components as curriculum, staffing,
professional development, instructional materials, buildings and technology were all
inadequate to the task of serving children of a growing population of poor immigrants from
countries around the world--many of them children with special needs. With the support of the
mayor, city council, school committee, and the business community, and with carefully designed
district plans, we approached these and other issues systematically to the extent that state,
federal, and local funds allowed; brief descriptions of the resulting initiatives follow:
• Buildings were renovated, expanded, built, leased or purchased so that we couldaccommodate our growing student population. (Examples: A new Lynn ClassicalHigh School; renovated and expanded Lynn Vocational Technical Institute and LynnEnglish High School; most recently, the purchase of the I.U.E. building for twentyadditional classrooms).
• Staffing was increased, including the addition of nearly 400 teachers and more than 20nurses, among others, with obvious implications for class size and health services.
• Curriculum was realigned to conform with the state Curriculum Frameworks with theresult that a district-wide curriculum was finally in place.
• Professional development was instituted at an unprecedented pace and depth to providethe foundation for district-wide implementation of mathematics, writing and phonicsprograms; instructional facilitators were placed at each school to model instructionand to coach teachers in applying innovative instructional procedures. (The U.S.Office of Education has nominated the Lynn Public Schools, together with twelveother districts or schools across the nation, as a semifinalist in the U.S. Department ofEducation's National Awards Program for Model Professional Development).
• Instructional materials have been acquired, covering a wide range of content; selectioncriteria included concurrence with state frameworks, their basis in research, andendorsement by national educational institutions.

2
• Technology has been dramatically enhanced through a $17,000,000 investment.Important examples include a local area network for internal communication and awide area network with Internet access for all teachers and students; acquisitionsinclude software with multiple management capabilities-scheduling, data analysis,etc.; and a state-of-the-art security system.
2. Barriers to Education Reform:
The topics of barriers and plans, in this section and the next, have obvious correlations; this
section addresses barriers from the perspective of the general principles involved, and the
following section adds specific details on plans for the next three to five years.
In school systems, as in any organization, certain practices, procedures, beliefs, and attitudes
become entrenched over time. Veteran staff members include many who are largely skeptical
of educational innovations, often justifiably, in light of the long history of educational fads.
Suggestions for change are often viewed with suspicion: a prime example is the range of
reactions to the MCAS as the chief indicator of student and school performance.
Efforts to effect fundamental change are rarely accomplished without strong resistance and,
in the end, continuing efforts place exceptional demands on the fortitude of change agents.
My considered opinion is that the most challenging barriers to educational change are bound
up in precisely this syndrome-not unique to Lynn-whereby the initiatives that most directly
target system deficiencies are the very ones resisted most intractably. Given what we know
about the inevitable backlash associated with reform, our shared challenge on the national,
state, and local levels is to turn that knowledge to the advantage of the school system:
prescriptive strategies can disarm major sectors of resistance to change.

3
3. Plans Over the Next Three to Five Years
Because I spent the previous thirty years as a teacher or principal in the Lynn Public Schools before
I entered the central office, I became clearly aware of needed changes. I knew, for example, that the
belief that all children can think and learn at higher levels, given significant changes in curriculum
and instruction, would not prevail without relentless effort and resolve from the central office. I have
pressed on with reforms that are just beginning to muster support, particularly in the elementary
schools. The demands of Vie new accreditation process and the establishment of strategic leadership
teams will energize high schools in their restructuring efforts. Our challenge is to cultivate smaller
and more personalized learning communities committed to the essential belief that all children can
learn at higher cognitive levels.
It is now time for every principal to assume main responsibility for guiding schools toward the
attainment of the higher academic standards expressed in the Education Reform Act. To this end, I
propose to strengthen the decision-making authority of the School Councils, regarding programs
and budgets, so that school-based management will become a reality in Lynn. I also propose the
establishment of a demanding accountability system--one which will include at least three
important functions: an intensive formative and summative evaluation of professional and
non-professional staff; detailed assessment of the quality and implementation of school
improvement plans; and periodic external review of all schools by an external accrediting agency.
Finally, I propose again that all administrators' salaries-mine included-be based on evaluation of
clear performance standards, including improvements on MCAS scores.
The several policies and proposals outlined in this statement involve not merely a reliance on
appropriate reactions, but also a proactive approach to effecting change. Among the most worthy
results of school reform, such plans might multiply the numbers of students in Lynn who know how
to care for others, and think for themselves.

APPENDIX F
LYNN PUBLIC SCHOOLS
Administration Building - 14 Central Avenue, Lynn, MA 01901 (617) 593-1680
Fax: (617) 477-7303
Dieter Wahl, Director of Education AuditsMassachusetts Department of RevenueP.O. Box 9655Boston, Massachusetts 02114-9655
Dear Mr. Wahl:
Office of the Superintendent
December 12, 2000
We have had the opportunity to examine the program audit prepared by the Department ofRevenue. The report provides a detailed and comprehensive review of the Lynn Public Schools'fiscal and program activity conducted in accordance with the Massachusetts Education ReformAct. To accomplish their task, the team of auditors examined a multitude of documents, conductedextensive interviews and a survey of all staff, and inspected school buildings. Throughout theirstay from mid-April to early July, the auditors were meticulous in reviewing data and presentingfindings.
In the interest of accuracy, however, the section on the top of page 3 ought to be modified.Appropriate suggestions for change follow:
"The Superintendent stated that the transfer occurred prior to his appointmentas Superintendent."
The sentence, "This earned her a $16,000 raise", should be deleted.
Similarly, the sentence in the first paragraph on page 2 should read:
"At the close of our fieldwork, the Superintendent and the Mayor have gone beforethe Commissioner of DOE for rulings on certain decisions by the school committee."
We all appreciated the auditors' efforts, as well as their recognition of our dedication in carryingout the demands of educational reform. As you may know, the performance of the Lynn PublicSchools on the MCAS has shown continuous progress, particularly this past year. I haveforwarded copies of reports describing improvements across the district and at individual schools.
Very truly yours,
Pb


