luye pharma group ltd. (incorporated in bermuda with
TRANSCRIPT

2015
Lu
ye Pharm
a Gro
up
Ltd.綠葉制藥集團有限公司
AN
NU
AL REPO
RT 2015年報
www.luye.cn
Luye Pharma Group Ltd.(incorporated in Bermuda with limited liability)
Stock Code: 2186
ANNUALREPORT
Luye Pharma Group Ltd.

Contents
Company Overview
Corporate Information
Financial Highlights
Chairman’s Statement
Management Discussion and Analysis
Directors and Senior Management
Report of Directors
Corporate Governance Report
Independent Auditors’ Report
Consolidated Statement of Profit or Loss
Consolidated Statement of Comprehensive Income
Consolidated Statement of Financial Position
Consolidated Statement of Changes in Equity
Consolidated Statement of Cash Flows
Notes to the Consolidated Financial Statements
2
3
5
6
8
17
24
36
45
47
48
49
51
52
54

Company Overview
2
Luye Pharma Group Ltd. (the “Company”, together with its subsidiaries collectively the “Group” or “Luye”)
focuses on developing, producing, marketing and selling innovative pharmaceutical products in three of
the largest and fastest growing therapeutic areas in the People’s Republic of China (the “PRC” or “China”)
— oncology, cardiovascular system and alimentary tract and metabolism. The Group’s product portfolio
consists of 30 products and centres around five key products, four of which have patent protection and
are indicated for the treatment or prevention of high prevalence medical conditions, including cancer,
cardiovascular diseases and diabetes.
The Group has established production facilities and research and development (“R&D”) centres in
Beijing, Jiangsu, Shandong and Sichuan as well as offices in Malaysia and Singapore with over 3,400
employees, including over 300 R&D personnel. The Group’s products are marketed and sold in a vast
majority of provinces, autonomous regions and municipalities in the PRC, as well as a number of foreign
countries and regions. The Group’s nationwide sales and distribution network enabled it to sell its
products to over 10,000 hospitals in the PRC.
The history of the Group began with the establishment of Shandong Luye Pharmaceutical Co. Ltd.,
formerly known as Yantai Luye Pharmaceutical Co. Ltd., on 8 June 1994, to engage in the manufacture
and sale of pharmaceutical products as well as active pharmaceutical ingredients. As the Group’s
business continued to expand and required further capital to fund its operations and expansion plan, the
Group sought a listing on the main board of the Singapore Exchange Securities Trading Limited, or
SGX-ST, in 2004 with the aim of gaining access to capital markets and raising its corporate profile. The
Company’s shares were delisted from the SGX-ST on 29 November 2012. On 9 July 2014, the shares
of the Company were listed on the Main Board of The Stock Exchange of Hong Kong Limited (the “Stock
Exchange”). Over the past 21 years, the Group has grown into an international pharmaceutical group
with market leading position in its key therapeutic areas. With the corporate value of “Professional
Technology Serves Human Health” and the corporate philosophy of “Customer Orientation, Efficiency,
and Employee Achievement”, the Group is committed to providing high quality pharmaceutical products
and professional services for customers and patients.
Luye Pharma Group Ltd.

Corporate Information
3Annual Report 2015
Board of Directors
Executive Directors
Mr. LIU Dian Bo
(Executive Chairman and Chief Executive Officer)
Mr. YANG Rong Bing (Vice Executive Chairman)
Mr. YUAN Hui Xian
Ms. ZHU Yuan Yuan
Non-Executive Directors
Mr. PAN Jian
Mr. LIU Dong
Ms. WANG Xin
Independent Non-executive Directors
Mr. ZHANG Hua Qiao
Professor LO Yuk Lam
Mr. LEUNG Man Kit
Mr. CHOY Sze Chung Jojo
Company Secretary
Ms. LAI Siu Kuen
Authorized Representatives
Mr. YANG Rong Bing
Ms. ZHU Yuan Yuan
Audit Committee
Mr. LEUNG Man Kit (Chairman)
Mr. ZHANG Hua Qiao
Professor LO Yuk Lam
Remuneration Committee
Mr. CHOY Sze Chung Jojo (Chairman)
Mr. ZHANG Hua Qiao
Professor LO Yuk Lam
Nomination Committee
Professor LO Yuk Lam (Chairman)
Mr. ZHANG Hua Qiao
Mr. CHOY Sze Chung Jojo
Registered Office
Clarendon House
2 Church Street
Hamilton HM 11
Bermuda
Head Office and Principal Place of Business in the People’s Republic of China
No. 15 Chuang Ye Road
High-tech Industrial Development Zone
Yantai, Shandong
264003
People’s Republic of China
Building 4-1
Shanghai Business Park III
No. 1036 Tianlin Road
Shanghai
People’s Republic of China
Principal Place of Business in Hong Kong
Unit 3207, 32/F, Citibank Tower
Citibank Plaza
3 Garden Road
Central
Hong Kong

4
Corporate Information (continued)
Principal Share Registrar and Transfer Office
Codan Services Limited
Clarendon House
2 Church Street
Hamilton HM 11
Bermuda
Hong Kong Share Registrar
Computershare Hong Kong Investor Services Limited
Shops 1712–1716
17th Floor, Hopewell Centre
183 Queen’s Road East
Wanchai
Hong Kong
Legal Advisers
as to Hong Kong and United States laws:
Ashurst Hong Kong
11/F, Jardine House
One Connaught Place
Central
Hong Kong
as to Bermuda law:
Conyers Dill & Pearman
2901 One Exchange Square
8 Connaught Place
Central
Hong Kong
Compliance Adviser
Guotai Junan Capital Limited
27/F, Low Block
Grand Millennium Plaza
181 Queen’s Road Central
Hong Kong
Auditor
Ernst & Young
Certified Public Accountants
22/F, CITIC Tower
1 Tim Mei Avenue
Central
Hong Kong
Stock Code
2186
Company’s Website
www.luye.cn
Principal Bankers
Bank of China Limited
China Everbright Bank
Industrial and Commercial Bank of China Limited
Citibank (China) Limited

Financial Highlights
5Annual Report 2015
2011 2012 2013 2014 2015RMB Million RMB Million RMB Million RMB Million RMB Million
(Restated) (Restated) (Restated) (Restated)
Revenue 1,510.2 1,713.8 1,996.5 2,544.0 2,563.1Gross Profit 1,209.1 1,362.0 1,583.0 2,061.5 2,087.4EBITDA 299.4 368.2 508.2 875.9 1,028.9Net Profit 166.2 175.6 327.9 614.4 764.7Profit attributable to owners of the parent 155.8 169.0 310.5 605.5 754.5
Total Assets 2,442.4 2,677.6 3,387.5 6,130.8 7,052.9Total Liabilities 1,038.0 1,093.8 1,489.8 1,093.2 1,253.4Equity 1,404.4 1,583.8 1,897.7 5,037.6 5,799.5
• Profit attributable to shareholders increased by RMB149.0 million or 24.6% to RMB754.5 million, as compared to the year ended 31 December 2014.
• EBITDA increased by RMB153.0 million or 17.5% to RMB1.0 billion, as compared to the year ended 31 December 2014.
• Gross profit increased by RMB25.9 million or 1.3% to RMB2,087.4 million, as compared to the year ended 31 December 2014, and gross profit margin reached 81.4%.
• Revenue increased by RMB19.1 million or 0.8% to RMB2,563.1 million, as compared to RMB2,544.0 million for the year ended 31 December 2014. The 2014 revenue is restated as a result of offsetting of certain third party promotion expenses against the revenue for that year. The adjustment did not affect the net profit or the net assets of the Group for the year ended/as at 31 December 2014 or any earlier financial year/end date.
• Earnings per share was RMB22.72 cents compared to RMB20.22 cents for the year ended 31 December 2014.
• No dividend was proposed for the year ended 31 December 2015.

Chairman’s Statement
6
Dear Shareholders:
I would like to report the annual performance of Luye as at and for the year ended 31 December 2015, as well as present the
outlook of the Group’s operation in 2016.
As a leading innovative pharmaceutical enterprise in China, Luye focuses on therapeutic areas with high morbidity and high growth
rate including oncology, cardiovascular system and alimentary tract and metabolism. In 2015, the Group’s five key products are
sold to over 10,000 hospitals in 30 provinces and municipalities in China. The Group has 21 product candidates in China and 7
product candidates overseas, among which five candidates have entered into the clinical trial stage in the United States of America (the
“U.S.”) under U.S. Food and Drug Administration rules.
Despite clear slowdown in the pharmaceutical sector’s overall growth, Luye achieved steady growth in its results in 2015 with its
own competitiveness. Revenue increased by 0.8% year-on-year to RMB2.563 billion; profit attributable to owners of the parent
increased by 24.6% year-on-year to RMB755 million and EBITDA increased by 17.5% year-on-year to RMB1.029 billion.
This annual report indicated that Luye achieved revenue increase in all sectors in a well-balanced manner. Revenue from sales of
oncology products and alimentary tract & metabolism products increased by 5.8% and 5.5%, respectively, while that from
cardiovascular system products decreased by 5.9%. Market share of the Group’s key products continued to rise with improved
market presence and market penetration. The Group maintained a stable gross profit margin by reducing operational expenditure
and enhancing sales and management efficiency.
2015 represented a milestone in Luye’s launching of globalisation process and the Company achieved a series of encouraging
progress in overseas R&D. In August 2015, the Group has completed phase 1 clinical studies for ansofaxine hydrochloride extended
release tablets, a Class 1.1 New Chemical Drug for the treatment of major depressive disorder, in the U.S.. Besides, the medicine
has obtained the approval from the China Food and Drug Administration (“CFDA”) to commence phase 2 and phase 3 clinical trials.
In October 2015, the U.S. Food and Drug Administration (“FDA”) confirmed that the results of the completed pivotal study for the
Group’s investigational new drug, i.e. Risperidone Extended-release Microspheres for Injection can be used to support a New Drug
Application (“NDA”) submission in the U.S. via the 505(b)(2) pathway without any additional clinical trials. This will significantly cut
down the capital and time cost required for obtaining FDA approval for the launching of the medicine, which is expected to become
the first new drug to be launched in the U.S. by a Chinese pharmaceutical enterprise. In December 2015, the Group has also
completed phase 1 clinical studies for Rotigotine Extended-release Microspheres for Injection, a new drug for the treatment of
Parkinson’s disease, in the U.S.. The successful development of the medicine will strongly promote the Group’s expansion in the
international market for central nervous system treatment. In addition, in March 2016, the Group’s product candidate, Goserelin
Acetate Extended Release Microspheres for Injection, has obtained the approval from FDA to initiate clinical trials for the treatment
of carcinoma of the prostate. The medicine has a good marketing potential and will provide an impetus to the Group’s development
in the oncology therapeutic area. The Group’s management is confident that Luye will stand out in the international market with its
strong product pipeline and proven strengths in R&D.

7Annual Report 2015
Chairman’s Statement (continued)
In 2016, Luye will speed up its pace in international expansion and development. The Group will continue to uphold its mission and
vision, firmly implement existing strategies including innovation and globalisation, and further improve the market share in China in
the three key therapeutic areas, namely oncology, cardiovascular system and alimentary tract and metabolism. In addition, Luye will
strengthen international cooperation, accelerate the launch of product candidates in international market and endeavour to make
key breakthroughs in international business expansion. The Company strives to become one of world’s top 100 pharmaceutical
manufacturers by 2020. We are fully confident about the fulfillment of our 2016 goals and the future of Luye. Finally, on behalf of
Luye Pharma Group Ltd., I give my sincerest thanks to our shareholders for your significant contributions to the Company.
Liu Dian Bo
Executive Chairman
29 March 2016

Management Discussion and Analysis
8
Business Overview
The Group focuses on developing, producing, marketing and selling innovative pharmaceutical products in three of the largest and
fast growing therapeutic areas in the PRC, namely oncology, cardiovascular system and alimentary tract and metabolism. The
Group’s product portfolio consists of 30 products and centres around five key products, four of which have patent protection and
are indicated for the treatment or prevention of high prevalence medical conditions, including cancer, cardiovascular diseases and
diabetes. During the year ended 31 December 2015, the Group’s sales of innovative pharmaceutical products maintained a stable
growth momentum as the Group further deepened its market penetration and expanded the market share of its key products. The
Group recorded a stable revenue growth of 0.8% in 2015 as compared to 2014.
Market Positioning
All of the Group’s key products are competitively positioned in one of its three key therapeutic areas and have gained top-ranking
market shares measured by revenue. According to IMS Health Incorporated (“IMS”), oncology-related pharmaceutical products
constituted the third largest market for pharmaceutical products in the PRC in 2015. The Group’s portfolio of oncology products
includes Lipusu, the best-selling pharmaceutical product for cancer treatment in China in 2015 according to IMS, as well as CMNa,
a Class I New Chemical Drug and the only CFDA approved sensitiser for cancer radiotherapy in China. IMS data showed that
cardiovascular system-related pharmaceutical products constituted the second largest market for pharmaceutical products in the
PRC in 2015. According to IMS, the Group’s key cardiovascular system products, Xuezhikang and Maitongna, were the most
popular Chinese medicine for the treatment of hypercholesterolaemia and the best-selling domestically manufactured vasoprotective
pharmaceutical product in China in 2015, respectively. According to IMS, alimentary tract and metabolism related pharmaceutical
products constituted the largest market for pharmaceutical products in the PRC in 2015. According to IMS, the Group was the third
largest domestic pharmaceutical manufacturer of oral diabetic medications in China in 2015 by revenue. For the year ended 31
December 2015, the Group’s revenue from sales of oncology products and alimentary tract and metabolism products increased to
RMB1,395.4 million and RMB468.1 million, respectively, representing a growth rate of 5.8% and 5.5% as compared to the year
ended 31 December 2014 for the respective therapeutic areas. The Group’s revenue from sales of cardiovascular system products
and other products achieved RMB621.3 million and RMB78.2 million, respectively in 2015 representing a decrease of 5.9% and
35.1% as compared to 2014.
Key Products
The Company believes that the Group’s five key products are competitively positioned for high prevalence medical conditions that
are expected to grow stably in China.
Lipusu® (力撲素®)
Lipusu is the Group’s proprietary formulation of paclitaxel using an innovative liposome injection delivery vehicle and a chemotherapy
treatment of certain types of cancer. According to IMS, the market for oncology pharmaceutical products in the PRC was RMB60.3
billion in 2015 and by revenue, Lipusu was the most popular pharmaceutical product for cancer treatment, in China in 2015, as well
as the most popular paclitaxel product in China in 2015 with a market share of approximately 48.9%. As of 31 December 2015,
Lipusu represented the first and only paclitaxel liposome product approved for sale globally.

9Annual Report 2015
Management Discussion and Analysis (continued)
CMNa® (希美納®)
CMNa is sodium glycididazole, a proprietary compound that the Group prepares in injectable form and is indicated for use in
connection with radiotherapy for certain solid tumours. It is a Class I New Chemical Drug and the only CFDA approved sensitiser for
cancer radiotherapy in China. According to the CFDA, CMNa was the only glycididazole product available for sale in China as of 31
December 2015. An independent third-party study in 2009 concluded that the use of CMNa for the treatment of certain cancers
increased the probability of complete or partial remission and reduced overall treatment costs.
Xuezhikang® (血脂康®)
Xuezhikang is the Group’s proprietary Chinese medicine derived from red yeast rice indicated for hypercholesterolaemia and,
according to the CFDA, the Group was the only Xuezhikang manufacturer in China as of 31 December 2015. According to IMS, the
market for pharmaceutical products indicated for hypercholesterolaemia and the lowering of blood cholesterol triglycerides and low
density lipoprotein cholesterol in China was estimated to be approximately RMB10.2 billion in 2015. According to IMS, Xuezhikang
ranked as the most popular Chinese medicine for the treatment of hypercholesterolaemia in China in 2015.
Maitongna® (麥通納®)
Maitongna is sodium aescinate in injectable form and is indicated for the treatment of cerebral oedema and oedema caused by
trauma or surgery as well as for the treatment of venous reflux disorder. According to IMS, the market for vasoprotective
pharmaceutical products in China was estimated to be approximately RMB1.58 billion in 2015. Maitongna was the best-selling
sodium aescinate product in China in 2015 and ranked as the best-selling domestically manufactured vasoprotective pharmaceutical
product in China in 2015, according to IMS, with a market share of approximately 66.2% in 2015.
Bei Xi® (貝希®)
Bei Xi is acarbose in capsule form and is indicated for lowering blood glucose in patients with type 2 diabetes mellitus. According to
the CFDA, the Group was the only manufacturer of acarbose in capsule form in China as of 31 December 2015. According to IMS,
the market for acarbose products in China was estimated to be approximately RMB3.0 billion in 2015 and Bei Xi ranked as the third
most popular acarbose product in China with a market share of approximately 5.3% in 2015.
R&D
The Group’s R&D activities are organized around three platforms — long-acting and extended release technology, liposome and
targeted drug delivery and new compounds. The Group balances clinical development risk by strategically allocating its efforts
between proprietary formulations of proven compounds and new chemical entities. The Group believes that its R&D capabilities will
be the driving force behind the Group’s long-term competitiveness, as well as the Group’s future growth and development. As of 31
December 2015, the Group’s R&D team consisted of 301 employees, including 41 Ph.D. degree holders and 151 Master’s degree
holders in medical, pharmaceutical and other related areas. As of 31 December 2015, the Group had been granted 288 patents and
had 51 pending patent applications in the PRC, as well as 115 patents and 70 pending patent applications overseas.

10
Management Discussion and Analysis (continued)
Through the Group’s three platforms and the corresponding R&D capabilities, the Group focuses on R&D projects not only within its
core strength therapeutic areas of oncology and alimentary tract and metabolism, but also expands into the central nervous system
(“CNS”) therapeutic area, which according to IMS, was one of the fastest growing therapeutic areas in China from 2013 to 2015
with a CAGR of 11.7%. As of 31 December 2015, the Group had a pipeline of 21 PRC product candidates in various stages of
development. These candidates included 8 oncology products, 3 alimentary tract and metabolism products, as well as 10 CNS
products.
In July 2015, the Group’s product candidate, ansofaxine hydrochloride extended release tablets (“LY03005”), a Class 1.1 New
Chemical Drug for the treatment of major depressive disorder has obtained the approval from the CFDA to commence phase 2 and
phase 3 clinical trials. The approval for the commencement of phase 2 and phase 3 clinical trials for LY03005 is expected to provide
an impetus to the Group’s product development in the CNS therapeutic area and to further enrich the Group’s product portfolio in
the future. The phase 2 clinical trial has already started.
In August 2015, the Group has completed two phase 1 clinical studies for LY03005, in the U.S.. The Group holds 14 patents over
the chemical compound, crystal form and formulation of LY03005 in China and internationally.
In October 2015, FDA has confirmed the Company’s NDA submission in the U.S. via a pathway under section 505(b)(2) of the
United States Federal Food, Drug and Cosmetic Act for an investigational drug product of risperidone extended-release
microspheres for injection (“LY03004”) without additional clinical trials. This will significantly cut down costs and time required for
obtaining FDA approval for LY03004. The Company is currently preparing the NDA report for LY03004.
In December 2015, the Group has completed two phase 1 clinical studies for rotigotine extended release microspheres for injection
(“LY03003”), an investigational drug product for the treatment of Parkinson’s disease, in the U.S.. LY03003 is one of the Group’s
key central nervous system product candidates developed based on the Group’s long acting and extended-release formulation
platform. To the best knowledge of the Group, LY03003 is the first product worldwide to produce long term Continuous Dopamine
Stimulation (CDS), and it can improve efficacy and/or reduce side effects especially for the “on-off” effect.
In March 2016, the Group’s product candidate, Goserelin Acetate Extended Release Microspheres for Injection (“LY01005”), has
obtained the approval from the U.S. FDA to initiate clinical trials for the treatment of carcinoma of the prostate. The Group believes
that LY01005 has a good marketing potential and will provide an impetus to the Group’s development in the oncology therapeutic
area.

11Annual Report 2015
Management Discussion and Analysis (continued)
Sales, Marketing and Distribution
The Group has established an extensive nationwide sales and distribution network and sold its products to 30 provinces,
autonomous regions and municipalities throughout the PRC in 2015. The Group’s sales, marketing and distribution functions are
conducted through over 60 sales support offices, over 1,300 sales and marketing personnel, a network of approximately 1,000
distributors that collectively enabled the Group to sell its products to over 10,000 hospitals, which comprised approximately 1,220
or approximately 67% of all Class III hospitals, approximately 2,950 or approximately 43% of all Class II hospitals and approximately
6,000 or approximately 37% of all Class I and other hospitals and medical institutions, in the PRC in 2015. The Group develops its
marketing and promotion strategies centrally in order to maximize its brand recognition and optimize its product positioning in the
PRC market. The Group implements its strategies primarily through three internal sales teams that are aligned to its key therapeutic
areas. The Group also believes that the alignment of its internal sales team to its therapeutic areas positions it well to conduct
specialized academic promotional activities that are specifically tailored to meet the needs of doctors and hospitals, thereby driving
the recognition and demand for the Group’s products within their respective therapeutic areas. The Group places strong emphasis
on academic promotion and carries out various marketing activities throughout China, including organizing academic conferences,
seminars and symposia, to promote awareness and knowledge of its products in the industry. In order to competitively position its
products, the Group’s marketing department establishes marketing strategies for each of its products through market research and
analysis and coordinates the various other departments involved in its marketing and promotion activities. In addition, the Group’s
marketing department is responsible for devising new product pre-marketing strategy, including market research and planning,
allocation of marketing resources and, based on new product features and competitive conditions, pricing strategy. The Group
believes that its sales and marketing model and extensive coverage of hospitals with other medical institutions represent a significant
competitive advantage and a culmination of both academic promotion by the Group’s in-house personnel in different regions and
partnerships with high-quality distributors across China. The Group also believes that its sales and marketing model also provides a
solid foundation for the Group to continue to enhance market awareness of its brand and expand the market reach of its products.
In addition to the Group’s continued efforts to strengthen its sales force through enhanced recruitment, training and management
programmes, the Group has also developed an internal management system and a robust compliance programme to manage and
support its in-house and external sales and marketing team, as well as its nationwide distribution network.
Outlook
Due to policy and market factors, the Chinese pharmaceutical industry’s growth rate has decreased significantly in these two years
and is expected to continue in the near future. It is a highly competitive industry and inevitably all the pharmaceutical companies are
facing intense competition from other market participants. For 2016, the Group will continue to introduce measures to improve its
profitability and enhance efficiency in key aspects of its operations. With respect to its sales and marketing activities, the Group will
continue to undertake a series of changes and initiatives to enable it to focus its marketing and promotion resources on the regions
and products where marketing and promotion expenditure yields higher returns, thereby increasing its overall sales efficiency. The
Group also intends to increase its profitability through production efficiency and to continuously upgrade its production facilities. In
addition, the Group intends to further strengthen its R&D capabilities and develop its product candidates.

12
Management Discussion and Analysis (continued)
As described above, in July 2015, the Group’s product candidate, LY03005, a Class 1.1 New Chemical Drug, has obtained the
approval from the China Food and Drug Administration (“CFDA”) to commence phase 2 and phase 3 clinical trials. The approval is
expected to provide an impetus to the Group’s product development in the central nervous system (CNS) therapeutic area and to
further enrich the Group’s product portfolio in the future. In August 2015, the Group has completed two phase 1 clinical studies for
LY03005 in the U.S.. The results of these two phase 1 clinical studies have demonstrated that LY03005 treatment was well tolerated
and produced good pharmacokinetic profile in the subjects, which provides a solid basis for further clinical development. In October
2015, the FDA has confirmed the Company’s NDA submission in the U.S. via a pathway under section 505(b)(2) of the United
States Federal Food, Drug and Cosmetic Act for an investigational drug product of LY03004 without additional clinical trials. This will
significantly cut down costs and time required for obtaining FDA approval for LY03004. In December 2015, the Group has
completed two phase 1 clinical studies for rotigotine extended release microspheres for injection (“LY03003”), LY03003 is the first
product worldwide to produce long term Continuous Dopamine Stimulation (“CDS”), and it can improve efficacy and/or reduce side
effects especially for the “on-off” effect. The drug is expected to provide an impetus to the Group’s product development in the
global CNS therapeutic area. In March 2016, the Group’s product candidate, LY01005, has obtained the approval from the U.S.
FDA to initiate clinical trials for the treatment of carcinoma of the prostate. The Group believes that LY01005 has a good marketing
potential and will provide an impetus to the Group’s development in the oncology therapeutic area.
Management of the Group is confident that, with the Group’s strong competitive positioning of its innovative products, its strong
pipeline of product candidates, its proven R&D capabilities and its sales and marketing networks, as well as its capabilities to
execute strategic acquisitions, the Group is well positioned to enter a new phase of rapid growth.
Financial Review
Revenue
For the year ended 31 December 2015, the Group’s revenue amounted to RMB2,563.1 million, as compared to approximately
RMB2,544.0 million for the year ended 2014, representing an increase of RMB19.1 million, or 0.8%. The lower increase in sales is
mainly attributable to the overall economic slowdown in China.
For the year ended 31 December 2015, the Group’s revenue from sales of oncology products increased to RMB1,395.4 million, as
compared to RMB1,319.3 million for the year ended 31 December 2014, representing an increase of RMB76.1 million, or 5.8%,
primarily attributable to the increase in sales volume of our key oncology products, the increased was offset by lower sales of few
non key products, this was in line with the Group strategy to allocate more resources to the Group’s key products.
For the year ended 31 December 2015, the Group’s revenue from sales of cardiovascular system products decreased to RMB621.3
million, as compared to RMB660.6 million for the year ended 31 December 2014, representing a decrease of RMB39.3 million, or 5.9%,
primarily attributable to the lower sales of few non-key products, this was in line with the Group strategy to allocate more resources
to the Group’s key products.
For the year ended 31 December 2015, the Group’s revenue from sales of alimentary tract and metabolism products increased to
RMB468.1 million, as compared to RMB443.8 million for the year ended 31 December 2014, representing an increase of RMB24.3
million, or 5.5%, primarily attributable to the increase in sales volume of various key alimentary tract and metabolism products of the
Group, the increase was offset by lower sales of few non-key products, this was in line with Group strategy to allocate more
resources to the Group’s key products.
For the year ended 31 December 2015, the Group’s revenue from sales of other products decreased to RMB78.2 million, as
compared to RMB120.4 million for the year ended 31 December 2014, representing a decrease of RMB42.2 million, or 35.1%, this
was in line with the Group strategy to allocate more resources to the Group’s key products.

13Annual Report 2015
Management Discussion and Analysis (continued)
Cost of Sales
The Group’s cost of sales decreased from RMB482.5 million for the year ended 31 December 2014 to RMB475.7 million for the
year ended 31 December 2015, which accounted for 18.6% of the Group’s total revenue for the year. The primary driver of the
Group’s decreased cost of sales was attributable to the improved economies of scale, and since some of the products then
manufactured by our subcontracting manufacturers is currently manufactured in the Group’s new facilities.
Gross Profit
For the year ended 31 December 2015, the Group’s gross profit increased to RMB2,087.4 million, as compared to RMB2,061.5
million for the year ended 31 December 2014, representing an increase of RMB25.9 million, or 1.3%. The increase in the Group’s
gross profit was broadly in line with its revenue growth. The Group’s gross profit margin increased to 81.4% the year ended 31
December 2015 from 81.0% for the year ended 31 December 2014.
Other Income and Gains
The Group’s other income and gains mainly comprised government grants, interest income and investment income. For the year
ended 31 December 2015, the Group’s other income and gains increased to RMB165.1 million, as compared to approximately
RMB98.4 million for the year ended 31 December 2014, representing an increase of approximately RMB66.7 million. The increase is
mainly attributable to a higher investment income and government grants for the year ended 31 December 2015. The Group has
utilised the proceeds from initial public offering of the Company’s shares on the Stock Exchange (“IPO”) for better investment and
cash return management.
Selling and Distribution Expenses
The Group’s selling and distribution expenses consisted of expenses that were directly related to the Group’s marketing, promotion
and distribution activities. For the year ended 31 December 2015, the Group’s selling and distribution expenses amounted to
approximately RMB964.1 million, as compared to RMB1,006.3 million for the year ended 31 December 2014, representing a
decrease of RMB42.2 million, or 4.2%. The decrease was mainly attributable to the decrease in promotional activities for the
Group’s products and decline in staff cost as part of the Group sales team reform. On the other hand, as a percentage of revenue,
the Group’s selling and distribution expenses decreased from 39.6% for the year ended 31 December 2014 to 37.6% for the year
ended 31 December 2015, which has shown the Group’s determination to reduce and control its cost.
Administrative Expenses
The Group’s administrative expenses primarily consisted of staff cost, general operating expense, conference and entertainment
expense, travel and transportation expense, depreciation, amortisation and impairment loss, auditor’s remuneration, consulting
expenses, bank charges, taxation and other administrative expenses. For the year ended 31 December 2015, the Group’s
administrative expenses amounted to RMB184.8 million, as compared to RMB195.0 million for the year ended 31 December 2014,
representing a decrease of approximately RMB10.2 million, or 5.2%. The decrease was mainly due to a one-off listing expense
incurred for the year ended 31 December 2014 and offset by higher staff cost and general operating expenses for the year ended
31 December 2015.
Other Expenses
The Group’s other expenses primarily consisted of its R&D costs, foreign exchange losses, donations, loss on disposals of property,
plants and equipment and miscellaneous expenses. For the year ended 31 December 2015, the Group’s other expenses amounted
to RMB190.2 million, as compared to approximately RMB193.8 million for the year ended 31 December 2014, representing a
decrease of RMB3.6 million, or 1.9%. The decrease was mainly due to the decreased R&D costs. The decrease is offset by other
higher expenses during the year ended 31 December 2015.

14
Management Discussion and Analysis (continued)
Finance Costs
For the year ended 31 December 2015, the Group’s finance costs amounted to RMB15.6 million, as compared to RMB39.7 million
for the year ended 31 December 2014, representing a decrease of approximately RMB24.1 million, or 60.7%. The decrease was
mainly due to the lower level of monthly average outstanding bank borrowings during the year as compared to the corresponding
year of 2014.
Income Tax Expense
For the year ended 31 December 2015, the Group’s income tax expense amounted to RMB133.4 million, as compared to
RMB111.1 million for the year ended 31 December 2014, representing an increase of RMB22.3 million, or 20.1%. The effective tax
rate for the year ended 31 December 2015 and the year ended 31 December 2014 was 14.9% and 15.3%, respectively.
Net Profit
For the year ended 31 December 2015, the Group’s net profit amounted to RMB764.7 million, as compared to RMB614.4 million
for the year ended 31 December 2014, representing an increase of RMB150.3 million, or 24.5%.
Liquidity, Financial and Capital Resources
Net Current Assets
As at 31 December 2015, the Group had net current assets of approximately RMB4,026.0 million, as compared to RMB2,637.7
million as at 31 December 2014. The current ratio of the Group increased slightly to approximately 4.9 as at 31 December 2015
from 4.0 as at 31 December 2014. The increase in net current assets was mainly attributable to higher level of trade and note
receivables which is in line with the growth in revenue, as well as significant increase in cash and cash equivalents as a result of the
deposit refund received following the termination of the acquisition of Beijing Jialin Pharmaceutical Co., Ltd. (“Beijing Jialin”).
Borrowings and Pledge of Assets
As at 31 December 2015, the Group had an aggregate interest-bearing bank and other borrowings of approximately RMB502.7
million, as compared to RMB305.5 million as at 31 December 2014. Amongst the bank and other borrowings, approximately
RMB502.2 million are repayable within one year, and approximately RMB0.5 million are repayable after one year. The increase in
bank borrowings is mainly for the working capital of the Company. The bank loans were secured by the Group’s time deposits.
Gearing Ratio
As at 31 December 2015, the gearing ratio of the Group, which is calculated by dividing total borrowings by total equity, increased
to 8.7% from approximately 6.1% as at 31 December 2014. The increase was primarily due to an increase in the Group’s total
borrowings resulting from additional loans taken during the year.
Debt Ratio
As at 31 December 2015, the debt ratio of the Group, which calculated by dividing total liabilities by total assets, was 17.8%, as
compared with 17.8% as at 31 December 2014.
15Annual Report 2015
Management Discussion and Analysis (continued)
Return on Equity
As at 31 December 2015, the return on equity of the Group, which calculated by dividing net income by average shareholder equity,
decreased to 14.1% from approximately 17.7% as at 31 December 2014. The decrease was primarily due to increase in Group
shareholders equity.
Foreign Currency Risk
The Group primarily operates in the PRC and is exposed to foreign currency risk arising from fluctuations in exchange rate between
RMB and other currencies in which the Group conducts its business. The Group is subject to foreign currency risk attributable to
the bank balances, trade and other receivables and payables as well as bank loans that are denominated in currencies other than
RMB. The Group seeks to limit the exposure to foreign currency risk by minimising its net foreign currency position . The Group did
not enter into any hedging transactions in respect of foreign currency risk during the year ended 31 December 2015. For details,
please refer to note 37 to the consolidated financial statements in this annual report.
Interest Rate Risk
The Group adopts a policy to manage interest cost using a combination of fixed and floating rate debts. For details, please refer to
note 25 to the consolidated financial statements in this annual report on interest rate risk the Group faced. The Group did not enter
into any hedging transactions in respect of interest rate risk during the year ended 31 December 2015.
Contingent Liabilities
As at 31 December 2015, the Group did not have any material contingent liabilities.
Material Acquisition and Disposal
The Group entered into a series of agreements to acquire the entire equity interest of Beijing Jialin. Subsequently, the Group served
notices terminating the relevant agreements in relation to the Group’s proposed acquisition of equity interest in Beijing Jialin. For
further information, please refer to the Company’s announcements dated 27 August, 6 October, 24 October, 5 November, 20
November, 1 December, 15 December and 30 December 2014, and 16 January, 2 February, 9 February and 30 March, 1 June
2015, and the Company’s circular dated 31 December 2014.
Save as disclosed above, during the year ended 31 December 2015, the Group had no other, material acquisition or disposal of
subsidiaries and associated companies. As at the date of this annual report, the Directors confirm that there are no current plans to
acquire any material investment.

16
Management Discussion and Analysis (continued)
Use of Net Proceeds from Listing
The net proceeds from the Company’s IPO (after deducting the underwriting fees and related expenses) amounted to HK$3,845
million, which are intended to be applied in the manner consistent with that set out in the Company’s prospectus dated 26 June
2014. As at 29 March 2016, the Group had utilised HK$1,339.7 million, representing 34.8% of the net proceeds received by the
Company from the IPO. Set out below is a summary of the utilisation of the net proceeds:
Use of proceeds (HK$’MM) Amount % Utilised %
Unutilized balance as
at 29 March 2016 %
To expand the Group’s portfolio of pharmaceuticals products 769.0 20.0 NIL NIL 769.0 20.0
For research and development 769.0 20.0 170.0 4.4 599.0 15.6
For selective acquisition of domestic or international companies 769.0 20.0 NIL NIL 769.0 20.0
To fund capital expenditure projects to increase production capabilities 769.0 20.0 581.4 15.1 187.6 4.9
To expand sales and marketing networks 192.2 5.0 115.3 3.0 76.9 2.0
To partially repay borrowings under U.S. Dollar secured loan 192.2 5.0 192.2 5.0 NIL NIL
For working capital and general corporate purposes 384.6 10.0 280.8 7.3 103.8 2.7
Significant Investment Held
As at 31 December 2015, the Group had available-for-sale financial assets of approximately RMB1,402.1 million, which represents
the outstanding balance of the wealth management product subscribed by the Group with various bank as at the year ended 31
December 2015. For details, please refer to the Company’s announcement dated 1 June 2015, 30 September 2015 and note 18 to
the consolidated financial statements in this annual report.
Employee and Remuneration Policy
As at 31 December 2015, the Group had approximately 3,410 employees (2014: 3,359). For the year ended 31 December 2015,
the staff costs of the Group, including Directors’ emoluments but excluding any contributions to pension scheme, were RMB302.8
million as compared to RMB307.9 million for the year ended 31 December 2014.
Remuneration Policy
The objective of the Group’s remuneration policy is to motivate and retain talented employees to achieve the Group’s long-term
corporate goals and objectives. The Group’s employee remuneration policy is determined by taking into account factors such as
remuneration in respect of the overall remuneration standard in the industry and employee’s performance. The management reviews
the Group’s employee remuneration policy and arrangements on a regular basis. Apart from social insurance contributions are made
by the Group for its PRC employees in accordance with the relevant PRC regulations. For employee retirement benefits, please refer
to note 2.5 to the consolidated financial statements in this annual report.

Directors and Senior Management
17Annual Report 2015
Directors
Executive Directors
Mr. Liu Dian Bo, aged 50, Executive Chairman, is a founding member of our Group. He was appointed as a director of the
Company (“Director”) in July 2003. As our Executive Chairman, Mr. Liu is responsible for the overall management, operations and
the charting and reviewing of corporate directions and strategies of our Group. Prior to founding our Group, Mr. Liu was a teacher at
Yantai Teacher’s College from 1985 to 1989. From 1989 to 1993, Mr. Liu was the general manager of Penglai Huatai
Pharmaceutical Co. Ltd. From 1994 to 1999, Mr. Liu was the chairman cum general manager of shandong luye Pharmaceutical
Co., Ltd. (“Shandong Luye”). From 1999 to the incorporation of our Company in 2003, Mr. Liu was the chairman cum president of
Shandong Luye. Mr. Liu obtained a Medical Diploma from Yishui Special Medical College (now known as Shandong Medical
College) in July 1985. Mr. Liu is the executive chairman of Shandong Luye and Beijing WBL Peking University Biotech Co., Ltd.
(“Beijing WPU”), and a director of the following main subsidiaries of our Company: Yantai Luye Drugs Trading Co., Ltd. (“Luye
Trading”), Sichuan Luye Buoguang Pharmaceutical Co., Ltd., Shandong Luye Natural Drug R&D Co. Ltd., Shanghai Ge Lin Li Fu
Business Consulting Co. Ltd., AsiaPharm Investments Limited, AsiaPharm Biotech Pte. Ltd., Luye Biotech (Singapore) Pte. Ltd. and
A-Bio Pharma Pte. Ltd.. Mr. Liu is a director of each of Luye Group Ltd (“Luye Group”), Luye Pharma Holdings Ltd. (“Luye Pharma
Holdings”), Luye Pharmaceutical International Co., Ltd. (“Luye Pharma Intl”), Luye Pharmaceutical Investment Co., Ltd. (“Luye
Pharma Investment”), Shorea LBG, Gingko Trust Limited, and Nelumbo Investment Limited.
Mr. Yang Rong Bing, aged 50, holds the office of Vice Executive Chairman and is also a founding member of our Group. Mr. Yang
was appointed as an Executive Director on 1 March 2007 and was previously a Non-Executive Director from July 2003. Mr. Yang
was appointed as a vice executive chairman of the Board with effect from 30 March 2015. Mr. Yang has also been a non-executive
director of Shandong Luye since 2000. Prior to that, Mr. Yang was with Jiangsu Xuzhou Bio-Chemical Pharmaceutical Factory from
1988 to 1994 where he worked as an assistant factory head. In 1994, Mr. Yang joined Shandong Luye as a deputy general
manager and from 1999 to 2000, he was the chief sales executive and executive director of Shandong Luye. Mr. Yang obtained a
Bachelor’s degree in Science from Beijing Normal University in July 1988. Mr. Yang is the executive chairman of Nanjing Luye
Pharmaceutical Co., Ltd.. (“Nanjing Luye”) and a director of the following main subsidiaries of our Company: Shandong Luye, Luye
Trading and Nanjing Luye. Mr. Yang is a director of each of Luye Group, Luye Pharma Holdings, Luye Pharma Intl and Luye Pharma
Investment.
Mr. Yuan Hui Xian, aged 57, holds the office of Executive Director and is also a founding member of our Group. Mr. Yuan was
appointed as a Director in July 2003 and is in charge of our Group’s public relations. Prior to joining our Group in 1994, Mr. Yuan
was a doctor with Shengli Petroleum Administrative Bureau Yantai Sanatorium from 1980 to 1994, where he was in charge of
radiation diagnosis. From 1994 to 1999, Mr. Yuan was a deputy general manager with Shandong Luye. From 1999 to the
incorporation of our Company in 2003, Mr. Yuan was the vice-president and executive director of Shandong Luye. He has also
received a Post-graduate Certificate in National Economics from the China People’s University in February 2003. Mr. Yuan is the
executive chairman of Luye Trading and a director of the following main subsidiaries of our Company: Shandong Luye, Nanjing Luye
and Nanjing New AIGE Eggs Co. Ltd.. Mr. Yuan is a director of each of Luye Group, Luye Pharma Holdings, Luye Pharma Intl and
Luye Pharma Investment.
Ms. Zhu Yuan Yuan, aged 35, has been our Executive Director since March 2014. She joined our Group in August 2009 and has
10 years of experience in corporate finance. Before joining our Group, she worked for New Asia Partners Investment Holdings
Limited, a Shanghai and Hong Kong-based investment firm focused on assisting Chinese companies in accessing the international
capital markets, principally by providing equity capital and corporate finance advisory services. She obtained her Master’s degree in
Corporate Strategy and Governance from the University of Nottingham in December 2004 and a Bachelor’s degree in Finance from
Southeast University, the PRC in June 2003. Ms. Zhu is a director of the following subsidiaries of our Company: Luye Pharma Hong
Kong Limited, Solid Success Holdings Limited, Apex Group Holdings Limited and Kang Hai Pharmaceutical Technology
Development Limited. She is a supervisor of our subsidiary, Beijing WPU. Ms. Zhu is a director of each of Luye Pharma Holdings,
Luye Pharma Intl and Luye Pharma Investment.

18
Directors and Senior Management (continued)
Non-Executive Directors
Mr. Pan Jian, aged 40, has been our Non-Executive Director since March 2014. Mr. Pan is a managing director at CDH
Pharmaceutical Investments Limited, where he is responsible for sourcing, evaluating and executing investment opportunities in
China. Mr. Pan has extensive experiences in finance and management consulting. Mr. Pan received his Bachelor’s degree in
Electrical Engineering from Shanghai Jiaotong University in July 1998 and a MBA degree from University of Chicago in March 2005.
He is a director of Shanghai M&G Stationary Inc. (a company listed on the Shanghai Stock Exchange with stock code 603899). Mr.
Pan is a director of each of Luye Pharma Holdings, Luye Pharma Intl and Luye Pharma Investment.
Mr. Liu Dong, aged 42, has been our Non-Executive Director since March 2014. Mr. Liu joined CITIC Private Equity Funds
Management Co., Ltd. in January 2009. He is a managing director in charge of investment in the healthcare sector. In addition to
our board of Directors of the Company (the “Board”), he also sits on the boards of Biosensors International Group, Ltd. (a company
listed on the SGX-ST with symbol B20) and 3S Bio Inc. (a company listed on the stock Exchange with stock code 1530). Mr Liu was
a director of Zhejiang Beingmate Technology Industry & Trade Co., Ltd. (a company listed on the Shenzhen Stock Exchange, stock
code: 002570) from September 2012 to September 2015. Mr. Liu graduated from Nankai University with a joint Bachelor’s degree
in Physics and Finance in June 1995. He received an EMBA degree from China Europe International Business School in October
2011. Mr. Liu is a director of each of Luye Pharma Holdings, Luye Pharma Intl and Luye Pharma Investment.
Ms. Wang Xin, aged 38, has been our Non-Executive Director since March 2014. Ms. Wang has extensive experience in
investment analysis, financial advisory and legal services industry, focusing on areas of healthcare, consumer products and
alternative energy. Ms. Wang is currently an executive director of the New Horizon group companies, and has been an investment
professional at New Horizon and certain affiliates since April 2005. Ms. Wang obtained a Bachelor’s degree in Professional
Investment in Economics from Central University of Finance and Economics, the PRC in July 2000 and an Executive Master of
Business Administration from Cheung Kong Graduate School of Business in September 2013. Ms. Wang is a director of each of
Luye Pharma Holdings, Luye Pharma Intl and Luye Pharma Investment.
Independent Non-executive Directors
Mr. Zhang Hua Qiao, aged 52, has been our Independent Non-Executive Director since June 2014. Mr. Zhang has 16 years of
experience in working in the investment banking industry since 1994. He served as managing director and the co-head of China
research team from June 1999 to April 2006 and the deputy head of China investment banking division of UBS AG, Hong Kong
Branch from September 2008 to June 2011. He graduated from the Graduate School of the People’ s Bank of China (中國人民銀行
研究生部) with a Master’s degree in Economics in 1986, and from the Australian National University with a Master’s degree in
Economics in January 1991.

19Annual Report 2015
Directors and Senior Management (continued)
As at the date of this annual report, Mr. Zhang holds or held directorships in the following listed companies in the past three years:
Name of the listed company Term Position
Yancoal Australia Ltd, a company listed on the Australian Securities Exchange (stock code: YAL)
April 2014 to present Independent non-executive director
Logan Property Holdings Company Limited, a company listed on the Main Board of the Stock Exchange (stock code: 3380)
November 2013 to present Independent non-executive director
China Huirong Financial Holdings Limited, a company listed on the Main Board of the Stock Exchange (stock code: 1290)
October 2013 to present Independent non-executive director
Nanjing Central Emporium (Group) Stocks Co. Ltd., a company listed on the Shanghai Stock Exchange (stock code: 600280)
March 2013 to June 2015 Director
Zhong An Real Estate Limited, a company listed on the Main Board of the Stock Exchange (stock code: 672)
January 2013 to present Independent non-executive director
China Smartpay Group Holdings Limited a company listed on the Growth Enterprise Market of the Stock Exchange (stock code: 8325)
September 2012 to May 2015 Non-executive director
May 2015 to present Executive director
Fosun International Limited, a company listed on the Main Board of the Stock Exchange (stock code: 656)
March 2012 to present Independent non-executive director
Boer Power Holdings Limited, a company listed on the Main Board of the Stock Exchange (stock code: 1685)
November 2011 to present Non-executive director
Sinopec Oil field Service Corporation (formerly known as Sinopec Yizheng Chemical Fibre Company Limited), a company listed on the Main Board of the Stock Exchange (stock code: 1033)
February 2015 to present Independent non-executive director
Wanda Hotel Development Company Limited, a company listed on the Main Board of the Stock Exchange (stock code: 169)
September 2014 to present Independent non-executive director
Fuguiniao Co. Ltd., a company listed on the Main Board of the Stock Exchange (stock code: 1819)
May 2013 to June 2014 Independent non-executive director
Ernest Borel Holdings Limited, a company listed on the Main Board of the Stock Exchange (stock code: 1856)
June 2014 to November 2014 Independent non-executive director

20
Directors and Senior Management (continued)
Professor Lo Yuk Lam, aged 67, has been the Independent Non-Executive Director since June 2014. Professor Lo has extensive
experience in biotechnology industry, corporate management, academic research and community service. Professor Lo currently
sits on the Advisory Council on Food and Environment Hygiene of the Hong Kong Government. Previously, he was a member of the
Hong Kong Government Research Grants Council. He also served as the honorary chairman of the Hong Kong Biotechnology
Organization of the Hong Kong Industry & Technology Development Council, and chairman of Biotechnology Projects Vetting
Committee of the Innovation and Technology Fund.
In recognition of his leadership in the community and dedication to his field, Professor Lo has received many awards. In 2008, he
received the prestigious “World’s Outstanding Chinese” Award. He was awarded China’s “Top Ten Financial and Intelligent Persons”
in 2007 in recognition of his outstanding contribution to economic development and business innovation in China. In 2000, he was
the first to be bestowed with the title of Honorary Fellow by the Hong Kong University of Science and Technology for his role in
establishing Hong Kong’s biotechnology industry.
As at the date of this annual report, Professor Lo holds or held directorships in the following listed companies in the past three
years:
Name of the listed company Term Position
CSPC Pharmaceutical Group Limited, a company
listed on the Main Board of the Stock Exchange
(stock code: 1093)
June 2014 to present Independent non-executive director
Sinovac Biotech Ltd., a company listed
on NASDAQ Global Select Market (symbol SVA)
March 2006 to present Independent director
China Minsheng Drawin Technology Group Limited (formerly
known as South East Group Limited), a company listed
on the Main Board of the Stock Exchange
(stock code: 726)
January 2002 to December
2013
Independent non-executive director
ShangPharma Corporation, a company delisted
from the New York Stock Exchange in April 2013
October 2010 to March 2013 Independent non-executive director
Professor Lo obtained an Honorary Doctorate of Philosophy in Business Management from York University in June 2008.
Mr. Leung Man Kit, aged 62, has been the Independent Non-executive Director since June 2014. Mr. Leung has over 32 years of
experience in project finance and corporate finance. He joined Chanceton Financial Group Limited, a company listed on the Growth
Enterprise Market of the Stock Exchange (stock code: 8020), in March 2011, and has been its executive director since September
2011. He is also a responsible officer of Chanceton Capital Partners Limited. Previously, he was a director of Emerging Markets
Partnership (Hong Kong) Limited, the principal adviser to the AIG Infrastructure Fund L.P. in 1999. He also held senior positions in
the Hong Kong Branch of the Swiss Bank Corporation, SG Securities (HK) Limited (formerly known as Crosby Securities (Hong
Kong) Limited) and Peregrine Capital Limited.

21Annual Report 2015
Directors and Senior Management (continued)
As at the date of this annual report, Mr. Leung holds or held directorships in the following listed companies in the past three years:
Name of the listed company Term Position
Optics Valley Union Holding Company Limited,
a company listed on the Main Board of
the Stock Exchange (stock code: 798)*
March 2014 to present Independent non-executive director
China Huiyuan Juice Group Limited,
a company listed on the Main Board of
the Stock Exchange (stock code: 1886)*
June 2012 to present Independent non-executive director
Chanceton Financial Group Limited, a company
listed on the Growth Enterprise Market of
the Stock Exchange (stock code: 8020)
October 2011 to present Executive director
Orange Sky Golden Harvest Entertainment
(Holdings) Limited, a company listed
on the Main Board of the Stock Exchange
(stock code: 1132)*
February 2008 to present Independent non-executive director
China Ting Group Holdings Limited,
a company listed on the Main Board of
the Stock Exchange (stock code: 3398)
November 2005 to present Independent non-executive director
Netease.com Inc., a company listed on NASDAQ
(stock code: NTES)*
July 2002 to present Independent non-executive director
Junefield Department Store Group Limited,
a company listed on the Main Board of
the Stock Exchange (stock code: 758)
December 2012 to May 2013 Independent non-executive director
* Mr. Leung is also the chairman of the audit committee of these companies.
Mr. Leung obtained a Bachelor’s degree in Social Sciences from University of Hong Kong in October 1977.
Mr. Choy Sze Chung Jojo, aged 57, has been the Independent Non-executive Director since June 2014. Mr. Choy has extensive
experience in the securities industry and business management. He is currently the vice chairman of National Resources Securities
Limited and the permanent honourable president and vice chairman of the Institute of Securities Dealers Ltd.
Mr. Choy is a fellow member of the Hong Kong Institute of Directors, the Institute of Financial Accountants the Institute of Public
Account and the Institute of Compliance Officer, the Securities Panel Coordinator of the Hong Kong Mediation Alliance, a member
of the Stock Exchange Cash Market Consultative Panel and the Society of Registered Financial Planner Limited. Mr. Choy is also a
member of the Election Council for Hong Kong Deputies to the 12th National People’s Congress of the People’s Republic of China,
a member of the 4th term Chief Executive Election Committee of Hong Kong and a member of Chinese People’s Political
Consultative Conference, Shantou.

22
Directors and Senior Management (continued)
As at the date of this annual report, Mr. Choy holds or held directorships in the following listed companies in the past three years:
Name of the listed company Term Position
Orient Securities International Holdings Limited,
a company listed on the Growth Enterprise
Market of the Stock Exchange (stock code: 8001)
March 2010 to present Independent non-executive director
Sparkle Roll Group Limited, a company listed
on the Main Board of the Stock Exchange
(stock code: 970)
October 2007 to present Independent non-executive director
Zhaojin Mining Industry Company Limited,
a company listed on the Main Board of
the Stock Exchange (stock code: 1818)
May 2007 to present Independent non-executive director
Chengdu Putian Telecommunications Cable
Company Limited, a company listed
on the Main Board of the Stock Exchange
(stock code: 1202)
February 2006 to present Independent non-executive director
Wison Engineering Services Co. Ltd.,
a company listed on the Main Board of
the Stock Exchange (stock code: 2236)
November 2012
to September 2013
Independent non-executive director
Mr. Choy obtained a Master’s degree in Business Administration from University of Wales, Newport in October 2004 and a Master’s
degree in Business Law from Monash University in April 2007.
Senior Management
Our senior management comprises Executive Directors and the following persons:
Mr. Liu Yuan Chong, aged 52, joined our Group in March 1997 and is currently our chief financial officer. He started as the
accountant-in-charge at our finance department, and was promoted to chief of the finance department in 2005 and to our Chief
Financial Officer in 2012. Prior to joining our Group, he was the head of accounting of Yantai Alternator Plant (煙台家電交電總公司).
He also taught at Yantai Business Vocational Secondary School (煙台商業中專) from September 1983 until September 1986. From
1980 to 1983, he was employed by Shangdong Laiyang Biochemical Pharmaceutical Factory. Mr. Liu received a Post-Graduate
Certificate in Financial Management from Peking University in October 2006.

23Annual Report 2015
Directors and Senior Management (continued)
Dr. Li You Xin, aged 54, joined our Group in October 2007 and is currently our senior vice president and head of R&D. Dr. Li has
extensive experience in drug design. He is responsible for a number of our R&D platforms including our long-acting and extended
release technology and targeted drug delivery platforms. Under Dr. Li’s leadership, the Company was awarded the State Key
Laboratory of Long-acting and Targeting Drug Delivery System (長效和靶向製劑國家重點實驗室). Dr. Li is also a professor at the
College of Life Sciences of Jilin University. Prior to joining our Group, he was a senior scientist officer at Schwarz Pharma AG. He
was also a Research Fellow of Alexandar von Humboldt Foundation of University of Marburg from 1991 to 1993. Dr. Li obtained a
Bachelor’s degree in Chemistry in July 1982, a Master of Science degree in July 1985 and a Ph.D. in Science in July 1988 from
Peking University.
Ms. Xue Yun Li, aged 52, joined our Group in 1994 and is currently our senior vice president and the general manager of
Shandong Luye and responsible for manufacturing and quality management of subsidiaries. From 1999 to 2009, she was the
director of the R&D centre and then vice president of R&D of Shandong Luye. Prior to joining our Group, she was a technician and
the chief of scientific research at Shenyang Liaohe Pharmaceutical Factory from 1988 to 1994. Ms. Xue obtained a Bachelor’s
degree in Engineering from Jiamusi University in July 1988 and a Master’s degree in Integrated Traditional Chinese and Western
Clinical Medicine from Shandong University of Traditional Chinese Medicine in July 2011.
Ms. Jiang Hua, aged 38, joined our Group in 1998 and is currently our vice president and head of international business,
responsible for corporate strategy, product portfolio management and our Group’s international business. Ms. Jiang has over 16
years of experience in international business development. Ms. Jiang holds a Doctor of Business Administration from United
Business Institute, a Master’s degree in Business Administration from KEDGE Business School (formerly known as Euromed
Management School), and a Bachelor’s degree of Economics from Economy School, Fudan University. She is also an economist
certified by the Ministry of Personnel of the People’s Republic of China (now the Ministry of Human Resources and Social Security of
the People’s Republic of China).

Report of Directors
24
The directors of the Company (the “Directors”) are pleased to present their report together with the audited consolidated financial
statements of the Group for the year ended 31 December 2015.
Corporate Information
The Company was incorporated in the Bermuda on 2 July 2003 as an exempted company with limited liability under the laws of
Bermuda (the “Companies Law”). The Company’s shares (the “Shares”) were listed on the Stock Exchange on 9 July 2014 (the
“Listing” or “Listing Date”).
Principal Activities
The principal activity of the Company is investment holding and the Group focuses on developing, producing, marketing and selling
innovative pharmaceutical products in three of the largest and fastest growing therapeutic areas in the PRC. Details of the principal
activities of the Company’s subsidiaries are set out in note 1 to the consolidated financial statements of this annual report.
Business Review and Performance
A fair review of the Group’s business during the year, including an analysis of which using financial key performance indicators, and
the outlook of the Group’s business are provided in the section headed "Management Discussion and Analysis" of this annual
report, which discussion forms part of this “Report of Directors”.
Results
The results of the Group for the year ended 31 December 2015 are set out in the consolidated statement of profit or loss on page
47 of this annual report.
Final Dividend
The Board did not propose any dividend for the year ended 31 December 2015 (2014: Nil).
Financial Summary
A summary of the Group’s results, assets, liabilities for the last five financial years are set out on page 5 of this annual report. This
summary does not form part of the audited consolidated financial statements.
Use of Net Proceeds from Listing
The net proceeds from the Listing (after deducting underwriting fees and related expenses) amounted to approximately HK$3,845
million, which sum is intended to be applied in the manner consistent with that set out in the Company’s prospectus dated 26 June
2014. For details of the utilisation of the net proceeds, please refer to “Use of Net Proceeds from Listing” under the Management
Discussion and Analysis section of this annual report.

25Annual Report 2015
Report of Directors (continued)
Risks and Uncertainties Relating to the Group’s Business
The Group’s financial condition, results of operations, and business prospects may be affected by a number of risks and
uncertainties directly or indirectly pertaining to the Group’s businesses. The followings are the key risks and uncertainties identified
by the Group. There may be other risks and uncertainties in addition to those shown below which are not known to the Group or
which may not be material now but could turn out to be material in the future.
Market Risk
Market risk is the risk that deteriorates profitability or affects ability to meet business objectives arising from the movement in market
prices. The management of the Group manages and monitors these exposures to ensure appropriate measures are implemented
on a timely and effective manner.
Operational Risk
Operational risk is the risk of loss resulting from inadequate or failed internal processes, people and systems or from external events.
Responsibility for managing operational risks basically rests with every function at divisional and departmental levels. Key functions
in the Group are guided by their standard operating procedures, limits of authority and reporting framework. Our management will
identify and assess key operational exposures regularly so that appropriate risk response can be taken.
Investment Risk
Investment risk can be defined as the likelihood of occurrence of losses relative to the expected return on any particular investment.
Key concern of investment framework will be balancing risk and return across different investments, and thus risk assessment is a
core aspect of the investment decision process. Proper authorisation system has been set up and detailed analysis will be made
before approving investments. Regular updates on the progress of the investments of the Group would be submitted to the Board.
Manpower and Retention Risk
The Group may face the risk of not being able to attract and retain key personnel and talents with appropriate and required skills,
experience and competence which would meet the business objectives of the Group. The Group will provide attractive remuneration
package to suitable candidates and personnel.
Financial Risk
The Group’s also faces financial risks including interest rate risk, foreign currency risk, credit risk and liquidity risk. Details of these
financial risks are set out in note 37 to the consolidated financial statements of the Group.

26
Report of Directors (continued)
Environmental Policies and Performance
Our Group is committed to achieving environmental sustainability. Our commitment to protect the environment is well reflected by
our continuous efforts in promoting green measures and awareness in our daily business operations. Our Group’s business is
subject to national, provincial and local environmental laws and regulations of the PRC. During the year ended 31 December 2015,
so far as our Directors are aware, there were no material breach of applicable environmental laws and regulations of the PRC that
have a significant adverse impact on the business and operations of our Group.
Our Group also encourages environmental protection and promote awareness towards environmental protection to the employees.
Our Group adheres to the principle of recycling and reducing. It implements green office practices such as double-sided printing
and copying, setting up recycling bins, promoting using recycled paper and reducing energy consumption by switching off idle
lightings and electrical appliance.
Our Group endeavours to comply with the relevant laws and regulations regarding environmental protection and adopt effective
measures to achieve efficient use of resources, waste reduction and energy saving. Our Group will review its environmental practices
from time to time and will consider implementing further eco-friendly measures and practices in the operation of our Group’s
businesses to move towards adhering the 3Rs — reduce, recycle and reuse and enhance environmental sustainability.
Compliance with Laws and Regulations
Our Group recognises the importance of compliance with regulatory requirements and the risk of non-compliance with such
requirements could lead to the termination of operating licences. Our Group has been allocating system and staff resources to
ensure ongoing compliance with rules and regulations and to maintain cordial working relationships with regulators effectively
through effective communications. For the year ended 31 December 2015, the Group has complied, to the best of our knowledge,
with all relevant rules and regulations that have a significant impact on the Company.
Key Relationships with Employees, Customers and Suppliers
Being people-oriented, our Group ensures all staff are reasonable remunerated and also continues to improve and regularly review
and update its policies on remuneration and benefits, training, occupational health and safety.
Our Group maintains a good relationship with its customers. A customer complaint handling mechanism is in place to receive,
analyse and study complaints and make recommendations on remedies with the aim of improving service quality.
Our Group is in good relationship with its suppliers and conducts a fair and strict appraisal of its suppliers on an annual basis.

27Annual Report 2015
Report of Directors (continued)
Major Customers and Suppliers
Sales to the Group’s five largest customers accounted for approximately 24.1% of the total sales for the year ended 31 December
2015 and sales to the largest customer included therein amounted to 9.4% of the total sales for the year. Purchases from the
Group’s five largest suppliers accounted for approximately 57.3% of the total purchase for the year ended 31 December 2015 and
purchase from the Group’s largest supplier included therein amounted to 22.6% of the total purchase for the year.
None of the Directors or any of their close associates or any Shareholders (which, to the best knowledge of the Directors, own more
than 5% of the Company’s issued share capital) had any interest in the Group’s five largest customers and suppliers.
Property, Plant and Equipment
Details of movements in the property, plant and equipment of the Group during the year ended 31 December 2015 are set out in
note 13 to the consolidated financial statements in this annual report.
Share Capital
Details of movements in the share capital of the Company during the year ended 31 December 2015 are set out in note 29 to the
consolidated financial statements in this annual report.
Reserves
Details of movements in the reserves of the Group during the year are set out on page 51 in the consolidated statement of changes
in equity of this annual report and in note 30 to the consolidated financial statements.
Bank Loans and Other Borrowings
Particulars of bank loans and other borrowings of the Group as at 31 December 2015 are set out in note 25 to the consolidated
financial statements in this annual report.
28
Report of Directors (continued)
Directors
The Directors during the year ended 31 December 2015 and up to the date of this annual report were:
Executive Directors:
Mr. LIU Dian Bo (Executive Chairman and Chief Executive Officer)
Mr. YANG Rong Bing (Vice Executive Chairman)
Mr. YUAN Hui Xian
Ms. ZHU Yuan Yuan
Non-executive Directors:
Mr. PAN Jian
Mr. LIU Dong
Ms. WANG Xin
Independent non-executive Directors:
Mr. ZHANG Hua Qiao
Professor LO Yuk Lam
Mr. LEUNG Man Kit
Mr. CHOY Sze Chung Jojo
In accordance with the bye-laws of the Company (the “Bye-laws”), any Director appointed by the Board to fill a casual vacancy shall
hold office until the first general meeting of the Shareholders after his appointment and be subject to re-election at such meeting and
any Director appointed by the Board as an addition to the existing Board shall hold office only until the next following annual general
meeting of the Company and shall then be eligible for re-election.
In accordance with bye-law 84(1) of the Bye-laws, Mr. Liu Dian Bo, Mr. Liu Dong, Mr. Pan Jian and Ms. Wang Xin will retire by
rotation at the forthcoming annual general meeting (the “AGM”). Mr. Liu Dian Bo, being eligible will offer himself for re-election as the
Directors at the AGM. Mr. Pan Jian, Mr. Liu Dong and Ms. Wang Xin will retire at AGM and will not offer themselves for re-election at
the AGM due to their business engagement/arrangements.
Details of the Directors to be re-elected at the AGM are set out in the circular to the Shareholders.
Board of Directors and Senior Management
Biographical details of the Directors and senior management of the Group are set out on pages 17 to 23 of this annual report.
Confirmation of Independence of Independent Non-executive Directors
Each of the independent non-executive Directors has confirmed their independence pursuant to Rule 3.13 of the Rules Governing
the Listing of Securities on the Stock Exchange (the “Listing Rules”). The Company considers all of the independent non-executive
Directors to be independent in accordance with Rule 3.13 of the Listing Rules.

29Annual Report 2015
Report of Directors (continued)
Directors’ Service Contracts
Each of the executive Directors has entered into an appointment letter with the Company for an initial term of three years commencing from the Listing Date and may be terminated in accordance with the respective terms of the appointment letters.
Each of the non-executive Directors has entered into an appointment letter with the Company for an initial term of two years commencing from the date of appointment until the end of two years from the Listing Date and may be terminated in accordance with the respective terms of the appointment letters.
Each of the independent non-executive Directors has entered into an appointment letter with the Company for an initial term of two years commencing from the Listing Date and may be terminated in accordance with the respective terms of the appointment letters.
None of the Directors has a service contract which is not determinable by the Group within one year without payment of compensation (other than statutory compensation).
Directors’ Interests in Transactions, Arrangements and Contracts
Other than those transactions disclosed in note 34 to the consolidated financial statements in this annual report, no transactions, arrangements and contracts of significance in relation to the Group’s business to which the Company, Company’s subsidiaries, fellow subsidiaries or its parent companies was a party and in which a Director or his or her connected entity had a material interest, whether directly or indirectly, subsisted at the end of the year or at any time during the year.
Controlling Shareholders’ Interests in Contracts
Save as disclosed in this annual report, at no time during the year had the Company or any of its subsidiaries entered into any
contract of significance with the Controlling Shareholder (as defined in the Listing Rules) or any of its subsidiaries, nor had any
contract of significance been entered into for the services provided by the Controlling Shareholder or any of its subsidiaries to the
Company or any of its subsidiaries.
Management Contracts
No contracts concerning the management and administration of the whole or any substantial part of the business of the Company were entered into or existed during the year ended 31 December 2015.
Equity-Linked Agreements
No equity-linked agreement that will or may result in the Company issuing shares nor require the Company to enter into an agreement that will or may result in the Company issuing shares was entered into by the Company during the year or subsisted at the end of the year.
Share Option Scheme
During the year ended 31 December 2015 and up to the date of this annual report, the Group has no share option scheme.

30
Report of Directors (continued)
Emolument Policy
A remuneration committee was set up for reviewing the Group’s emolument policy and structure for all remuneration of the Directors and senior management of the Group, having regard to the Group’s operating results, individual performance of the Directors and senior management and comparable market practices. Our Group participates in the national pension schemes as defined by the laws of the countries in which it has operations and our Group make contributions to the Central Provident Fund Scheme in Singapore, a defined contribution pension scheme, for its employees in Singapore. The Company’s subsidiaries established and operating in Mainland China are required to provide certain staff pension benefits to their employees under existing regulations of the PRC.
Remuneration of Directors and Five Individuals with Highest Emoluments
Details of the emoluments of the Directors and the five highest paid individuals are set out in notes 8 and 9 to the consolidated
financial statements in this annual report.
Changes to Information in respect of Directors
Save as disclosed in the section headed “Directors and Senior Management” in this annual report, there was no change to any of
the information required to be disclosed in relation to any Director pursuant to paragraphs (a) to (e) and (g) of rule 13.51(2) of the
Listing Rules for the year ended 31 December 2015.
Directors’ and Chief Executive’s Interests and Short Position in Shares, Underlying Shares and Debentures
As at 31 December 2015, the interests or short positions of the Directors or chief executive of the Company in the Shares,
underlying Shares and debentures of the Company or its associated corporations (within the meaning of Part XV of the Securities
and Futures Ordinance (the “SFO”)) required to be notified to the Company and the Stock Exchange pursuant to Divisions 7 and 8
of Part XV of the SFO (including interest or short positions which they were taken or deemed to have under such provisions of the
SFO), or which would be required, pursuant to section 352 of the SFO, to be entered in the register referred to therein, or which
would be required to be notified to the Company and the Stock Exchange pursuant to Model Code for Securities Transactions by
Directors of Listed Issuers as set out in Appendix 10 of the Listing Rules (the “Model Code”), are as follows:
(i) Interest in the Company
Name of Director Nature of interest
Number of
securities(1)
Approximate
percentage of
shareholding
Liu Dian Bo Founder of a discretionary trust 1,484,999,930 (L) 44.71% (L)
Remark: The Letter “L” denotes long position in such securities.

31Annual Report 2015
Report of Directors (continued)
Notes:
1. Mr. Liu Dian Bo through his controlled corporations, namely Shorea LBG, Ginkgo Trust Limited, Nelumbo Investments Limited, Luye Group Ltd,
Luye Pharma Holdings Ltd., Luye Pharmaceutical International Co., Ltd. and Luye Pharmaceutical Investment Co., Ltd., is deemed to be
interested in 1,484,999,930 ordinary shares in the Company held by Luye Pharmaceutical Investment Co., Ltd. Nelumbo Investments Limited
holds 70% of the issued share capital of Luye Group Ltd.
2. The entire issued share capital of Nelumbo Investments Limited is held by Ginkgo Trust Limited as trustee of the family trust of Mr. Liu Dian Bo.
Ginkgo Trust Limited is wholly owned by Shorea LBG whose sole shareholder is Mr. Liu Dian Bo.
(ii) Interest in associated corporations
Name of Director Associated Corporation Nature of interest
Number of
securities
Approximate
percentage in
the registered
capital of the
associated
corporation
Liu Dian Bo Luye Group Ltd Founder of a discretionary trust 8,400 (L) 70%
Liu Dian Bo Ginkgo Trust Limited Founder of a discretionary trust 1 (L) 100%
Liu Dian Bo Luye Pharma Holdings Ltd. Founder of a discretionary trust 1,136,852 (L) 100%
Liu Dian Bo Luye Pharmaceutical
International Co., Ltd.
Founder of a discretionary trust 202,180,988 (L) 100%
Liu Dian Bo Luye Pharmaceutical
Investment Co., Ltd.
Founder of a discretionary trust 1 (L) 100%
Liu Dian Bo Nelumbo Investments Limited Founder of a discretionary trust 1 (L) 100%
Yang Rong Bing Luye Group Ltd Beneficial interest 1,800 (L) 15%
Yuan Hui Xian Luye Group Ltd Beneficial interest 1,800 (L) 15%
Remark: The Letter “L” denotes long position in such securities.
Notes:
1. The entire issued share capital of Nelumbo Investments Limited is held by Ginkgo Trust Limited as trustee of the family trust of Mr. Liu Dian Bo.
2. Luye Group Ltd holds the entire issued ordinary share capital of Luye Pharma Holdings Ltd. Luye Pharmaceutical International Co., Ltd. is wholly-
owned by Luye Pharma Holdings Ltd. and Luye Pharmaceutical Investment Co., Ltd. is wholly-owned by Luye Pharmaceutical International Co.,
Ltd.
Save as disclosed above, none of our Directors and chief executive of the Company has any interests or short positions in the
Shares, underlying Shares or debentures of the Company or its associated corporations (within the meaning of Part XV of the SFO)
which were (i) recorded in the register required to be kept under section 352 of the SFO, or (ii) otherwise notified to the Company
and the Stock Exchange pursuant to the Model Code.
Directors’ Rights to Acquire Shares or Debentures
Save as otherwise disclosed in this annual report, no rights to acquire benefits by means of the acquisition of Shares in or
debentures of the Company were granted to any Director or their respective spouse or children under 18 years of age, or were any
such rights exercised by them; or was the Company and any of its subsidiaries a party to any arrangement to enable the Directors,
or their respective spouse or children under 18 years of age, to acquire such rights in any other body corporate for the year ended
31 December 2015.

32
Report of Directors (continued)
Substantial Shareholders’ Interests and Short Positions in Shares and Underlying Shares
As at 31 December 2015, to the best of the Directors’ knowledge, the following persons (other than the Directors and chief
executives of the Company) had or deemed or taken to have an interests and/or short position in the Shares or the underlying
Shares which fall to be disclosed under the provisions of Division 2 and 3 of Part XV of the SFO or as recorded in the register
required to be kept pursuant to Section 336 of the SFO:
Name Capacity/Nature of interest
Number of
securities(1)
Approximate
percentage of
shareholding
Luye Pharmaceutical Investment Co., Ltd.(1) Beneficial owner 1,484,999,930 (L) 44.71%
Luye Pharmaceutical International Co., Ltd.(1) Interest in controlled corporation 1,484,999,930 (L) 44.71%
Luye Pharma Holdings Limited(1) Interest in controlled corporation 1,484,999,930 (L) 44.71%
Luye Group Ltd(2) Interest in controlled corporation 1,484,999,930 (L) 44.71%
Nelumbo Investments Limited(2) Interest in controlled corporation 1,484,999,930 (L) 44.71%
Ginkgo Trust Limited(2) Trustee 1,484,999,930 (L) 44.71%
Shorea LBG(2) Interest in controlled corporation 1,484,999,930 (L) 44.71%
CPE Greenery Ltd.(3) Beneficial owner 196,561,695 (L) 5.92%
CPEChina Fund, L.P.(3) Interest in controlled corporation 196,561,695 (L) 5.92%
CITIC PE Associates, L.P.(3) Interest in controlled corporation 196,561,695 (L) 5.92%
CITIC PE Funds Limited(3) Interest in controlled corporation 196,561,695 (L) 5.92%
Remark: The Letter “L” denotes long position in such securities.
Notes:
1. Luye Pharmaceutical Investment Co., Ltd. is wholly owned by Luye Pharmaceutical International Co., Ltd., which is in turn wholly owned by Luye Pharma
Holdings Limited.
2. Nelumbo Investments Limited holds 70% of the issued share capital of Luye Group Ltd (formerly known as AsiaPharm Holdings Ltd.) The entire issued
share capital of Nelumbo Investments Limited is held by Ginkgo Trust Limited as trustee of the family trust of Mr. Liu Dian Bo. Ginkgo Trust Limited is
wholly owned by Shorea LBG whose sole shareholder is Mr. Liu Dian Bo.
3. CPE Greenery Ltd. is wholly owned by CPEChina Fund, L.P. The general partner of CPEChina Fund, L.P. is CITIC PE Associates, L.P. The general
partner of CITIC PE Associates, L.P. is CITIC PE Funds Limited.
Save as disclosed above, as at 31 December 2015, the Directors have not been aware of any person who had interests or short
positions in the Shares or underlying Shares of the Company which would be required to be disclosed to the Company under the
provisions of Divisions 2 and 3 of Part XV of the SFO or as recorded in the register required to be kept pursuant to Section 336 of
the SFO.

33Annual Report 2015
Report of Directors (continued)
Purchase, Sale or Redemption of Company’s Listed Securities
There was no purchase, sale and redemption of any listed securities of the Company by the Company or any of its subsidiaries for the year ended 31 December 2015.
Pre-Emptive Rights
There are no provisions for pre-emptive rights under the Company’s Bye-laws or the Companies Law that would oblige the Company to offer new Shares on a pro rata basis to the existing Shareholders.
Permitted Indemnity Provision
According to the Bye-laws of the Company, among others, the Directors acting in relation to any of the affairs of the Company may be entitled to indemnified and secured harmless out of assets and profits of the Company from and against all, among others, actions, costs, charges, losses, damages and expenses which they or any of them shall or may incur or sustain.
The Company has arranged appropriate insurance cover in respect of legal action against its Directors.
Director’s and Controlling Shareholder’s Interest in Competing Business
A deed of non-compete undertaking dated 19 June 2014 (the “Deed of Non-compete Undertaking”) was entered into between the Company and the controlling shareholder and the executive chairman of the Company, Mr. Liu Dian Bo, who has undertaken to our Company that conditional upon Listing, he will not carry on, engage, invest, participate or otherwise be interested in any business which competes or is likely to compete with any of the existing and/or future businesses carried on by any shareholder of our Group in relation to developing, producing, marketing and selling innovative pharmaceutical products.
As disclosed in the Company’s prospectus dated 26 June 2014 (“Prospectus”), separately from Mr. Liu Dian Bo’s interest in our Group, he is interested in the equity interest of 蕪湖綠葉製藥有限公司 (Wuhu Luye Pharmaceutical Co. Ltd.) (“Wuhu Luye”), which is owned as to 90% by 綠葉投資集團有限公司 (Luye Investment Group Co. Ltd.) (“Luye Investment Group”) and 10% by 蕪湖長榮醫藥科技資訊諮詢有限責任公司 (Wuhu Changrong Pharmaceutical Technology Information Consulting Co. Ltd.), an independent third party. Luye Investment Group is owned by the founding shareholders (namely, Messrs. Liu Dian Bo, Yuan Hui Xian (“Mr. Yuan”) and Yang Rong Bing (“Mr. Yang”)) as to 70% by Mr. Liu Dian Bo and 15% by each of Mr. Yang and Mr. Yuan (each an executive Director). Wuhu Luye is primarily engaged in the production and sale of Chinese medicine covering a number of therapeutic areas including cardio-cerebral vascular, neurology, neuropsychiatry and hepatology, which competes or is likely to compete, either directly or indirectly, with our Group’s business.
By reasons of the fact that Wuhu Luye and our Group have (i) different management teams; (ii) separate production facilities and respective procurement teams to source raw materials and suppliers; (iii) independent sales and marketing activities; and (iv) independent financial and accounting systems, and that Mr. Liu Dian Bo has already given an undertaking pursuant to the Deed of Non-compete Undertaking, our Group is therefore capable of carrying on its business independently of, and at arms length from, the excluded business as described above.

34
Report of Directors (continued)
The Company has received an annual written confirmation from the controlling shareholder, Mr. Liu Dian Bo, in respect of his compliance with the Deed of Non-compete Undertaking.
The independent non-executive Directors have reviewed the Deed of Non-compete Undertaking and assessed whether the controlling shareholder has abided by the non-competition undertaking. The independent non-executive Directors confirmed that the controlling shareholder has not been in breach of the non-competition undertaking during the year ended 31 December 2015.
Save as disclosed above, none of the Directors held any interests in any business that compete directly against the Company or any of its jointly controlled entities and subsidiaries during the year ended 31 December 2015.
Disclosure Under Rule 13.21 of the Listing Rules
On 28 January 2015, Luye Pharmaceutical Investment Co. Ltd., a controlling shareholder of the Company (“Luye Investment”)
entered into two security agreements with two lenders which are authorised institutions (as defined in the Banking Ordinance,
Chapter 155 of the Laws of Hong Kong) (the “Lenders”), pursuant to which Luye Investment agreed to (among other things) pledge
an aggregate of 232,475,000 Shares (representing approximately 7% of the Company’s issued share capital as at the date of this
report) held by it in favour of the Lenders as security for two loan facilities granted by the Lenders to Luye Investment. As at the date
of this annual report, such pledge of Shares continued to exist.
Connected Transactions
The Company has complied with the disclosure requirements, to the extent they are not waived by the Stock Exchange, in accordance with Chapter 14A of the Listing Rules with respect to the connected transaction entered into by the Group during the year ended 31 December 2015.
A summary of the related party transactions entered into by the Group during the year ended 31 December 2015 is contained in note 34 to the consolidated financial statements in this annual report. The transactions summarised in such note do not fall under
the definition of “connected transactions” or “continuing connected transactions” under Chapter 14A of the Listing Rules.
Charitable Donations
During the year ended 31 December 2015, the Group made charitable and other donations in a total amount of RMB3.3 million.
Post Balance Sheet Events
There are no material events after the reporting period.
Audit Committee
The audit committee has reviewed together with the management and external auditor the accounting principles and policies
adopted by the Group and the audited consolidated financial statements for the year ended 31 December 2015.

35Annual Report 2015
Report of Directors (continued)
Code of Conduct regarding Directors’ Securities Transactions
The Company has adopted a code of conduct regarding Directors’ securities transactions on terms no less exacting than the
required standard set out in the Model Code. Specific enquiry has been made of all the Directors and the Directors have confirmed
that they have complied with the Model Code from the Listing Date to 31 December 2015.
Corporate Governance
The Company is committed to maintaining the highest standard of corporate governance practices. Information on the corporate
governance practices adopted by the Company is set out in the Corporate Governance Report on pages 36 to 44 of this annual
report.
Closure of Register of Shareholders
The register of shareholders of the Company will be closed from Monday, 6 June 2016 to Wednesday, 8 June 2016, both days
inclusive, in order to determine the identity of the shareholders who are entitled to attend and vote at the AGM. In order to be eligible
to attend and vote at the AGM, all transfer accompanied by the relevant share certificates and transfer forms must be lodged with
the Company’s branch share registrar in Hong Kong, Computershare Hong Kong Investor Services Limited, at shops 1712–1716,
17th Floor, Hopewell Centre, 183 Queen’s Road East, Wanchai, Hong Kong before 4:30 p.m. on Friday, 3 June 2016.
Sufficiency of Public Float
Based on the information that is publicly available to the Company and to the knowledge of the Directors at the date of this annual
report, there was a sufficient prescribed public float of the issued share of the Company under the Listing Rules as at the latest
practicable date prior to the issue of this annual report.
Auditor
Ernst & Young has been appointed as auditor of the Company for the year ended 31 December 2015.
Ernst & Young shall retire in the AGM and, being eligible, will offer themselves for re-appointment. A resolution for the re-
appointment of Ernst & Young as independent auditor of the Company will be proposed at the AGM.
On behalf of the Board
Liu Dian Bo
Chairman
Hong Kong, 29 March 2016

Corporate Governance Report
36
Corporate Governance Practices
The Group is committed to maintaining high standards of corporate governance to safeguard the interests of shareholders and to
enhance corporate value and accountability. The Company has adopted the Corporate Governance Code (the “CG Code”)
contained in Appendix 14 to the Listing Rules as its own code of corporate governance.
Save for the deviation disclosed in this annual report, in the opinion of the Directors, the Company has complied with all the code
provisions as set out in the CG Code during the year ended 31 December 2015.
The Board
Responsibilities
The Board is responsible for the overall leadership of the Group, oversees the Group’s strategic decisions and monitors business
and performance. The Board has delegated the authority and responsibility for day-to-day management and operation of the Group
to the senior management of the Group. To oversee particular aspects of the Company’s affairs, the Board has established three
Board committees including the audit committee (the “Audit Committee”), the remuneration committee (the “Remuneration
Committee”) and the nomination committee (the “Nomination Committee”) (together, the “Board Committees”). The Board has
delegated to the Board Committees responsibilities as set out in their respective terms of reference.
All Directors shall ensure that they carry out duties in good faith, in compliance with applicable laws and regulations, and in the
interests of the Company and its shareholders at all times.
Board Composition
As at the date of this annual report, the Board comprises 11 members, consisting of 4 executive Directors, 3 non-executive
Directors and 4 independent non-executive Directors as set out below:
Executive DirectorsMr. LIU Dian Bo (Executive Chairman and Chief Executive Officer)
Mr. YANG Rong Bing (Vice Executive Chairman)
Mr. YUAN Hui Xian
Ms. ZHU Yuan Yuan
Non-executive DirectorsMr. PAN Jian
Mr. LIU Dong
Ms. WANG Xin
Independent Non-executive DirectorsMr. ZHANG Hua Qiao
Professor LO Yuk Lam
Mr. LEUNG Man Kit
Mr. CHOY Sze Chung Jojo
The biographies of the Directors are set out under the section headed “Directors and Senior Management” of this annual report.

37Annual Report 2015
Corporate Governance Report (continued)
During the year ended 31 December 2015, the Board at all times met the requirements of the Rules 3.10(1) and 3.10(2) of the
Listing Rules relating to the appointment of at least three independent non-executive Directors with at least one independent non-
executive Director possessing appropriate professional qualifications or accounting or related financial management expertise.
The Company also complied Rule 3.10A of the Listing Rules, which relating to the appointment of independent non-executive
Directors representing at least one-third of the Board.
Each of the independent non-executive Directors has confirmed his independence pursuant to Rule 3.13 of the Listing Rules and
the Company considers each of them to be independent.
All Directors, including independent non-executive Directors, have brought a wide spectrum of valuable business experience,
knowledge and professionalism to the Board for its efficient and effective functioning. Independent non-executive Directors are
invited to serve on the Audit Committee, the Remuneration Committee and the Nomination Committee.
None of the Directors has any personal relationship (including financial, business, family or other material/relevant relationship) with
any other Director.
As regards the CG Code provision requiring directors to disclose the number and nature of offices held in public companies or
organisations and other significant commitments as well as their identity and the time involved to the issuer, Directors have agreed
to disclose their commitments to the Company in a timely manner.
Induction and Continuous Professional Development
Each newly appointed Director is provided with necessary induction and information to ensure that he/she has a proper
understanding of the Company’s operations and businesses as well as his/her responsibilities under relevant status, laws, rules and
regulations. The Company also arranges regular seminars to provide Directors with updates on latest development and changes in
the Listing Rules and other relevant legal and regulatory requirements from time to time. The Directors are also provided with regular
updates on the Company’s performance, position and prospects to enable the Board as a whole and each Director to discharge
their duties.
According to A.6.5 of the CG Code, Directors should participate in appropriate continuous professional development to develop and
refresh their knowledge and skills to ensure that their contribution to the Board remains informed and relevant. According to the
records kept by the Company, all the existing Directors have received continuous and professional development and training during
the year ended 31 December 2015.
Chairman and Chief Executive Officer
As required by code provision A.2.1 of the CG Code, the roles of chairman and chief executive officer should be separate and
performed by different individuals.
Under the current organization structure of the Company, Mr. Liu Dian Bo is our Executive Chairman of the Board and the Chief
Executive Officer. Although the dual roles of Chairman and Chief Executive Officer is a deviation from the CG Code, the Board
believes that with extensive experience in the pharmaceutical industry, vesting the roles of chairman and chief executive officer in the
same person is beneficial to the business prospects and management of the Group. The balance of power and authority is ensured
by the operation of the senior management and the Board, which comprise experienced and high caliber individuals.

38
Corporate Governance Report (continued)
Appointment and Re-Election of Directors
Each of the executive Directors has entered into an appointment letter with the Company for an initial term of three years
commencing from the Listing Date and may be terminated in accordance with the respective terms of the appointment letters.
Each of the non-executive Directors has entered into an appointment letter with the Company for an initial term of two years
commencing from the date of appointment until the end of two years from the Listing Date and may be terminated in accordance
with the respective terms of the appointment letters.
Each of the independent non-executive Directors has entered into an appointment letter with the Company for an initial term of two
years commencing from the Listing Date and may be terminated in accordance with the respective terms of the appointment letters.
None of the Directors has a service agreement which is not determinable by the Group within one year without payment of
compensation (other than statutory compensation).
In accordance with the Bye-laws, all Directors are subject to retirement by rotation at least once every three years and any new
Director appointed to fill a casual vacancy shall submit himself/herself for re-election by the Shareholders at the first general meeting
of the Company after appointment and new Directors appointed as an addition to the Board shall submit himself/herself for re-
election by the Shareholders at the next following annual general meeting of the Company after appointment.
The procedures and process of appointment, re-election and removal of directors are set out in the Bye-laws. The Nomination
Committee is responsible for reviewing the Board composition, monitoring the appointment, re-election and succession planning of
Directors.
Board Meetings
The Company has adopted the practice of holding board meetings regularly, at least four times a year, and at approximately
quarterly intervals. Notices of not less than 14 days will be given for all regular board meetings to provide all Directors with an
opportunity to attend and include matters in the agenda for a regular meeting.
For other Board and committee meetings, reasonable notice will generally be given. The agenda and accompanying board papers
are dispatched to the Directors or committee members at least three days before the meetings to ensure that they have sufficient
time to review the papers and be adequately prepared for the meetings. When directors or committee members are unable to
attend a meeting, they will be advised of the matters to be discussed and given an opportunity to make their views known to the
Chairman prior to the meeting.
Minutes of the board meetings and committee meetings will be recorded in sufficient detail the matters considered by the Board
and the committees and the decisions reached, including any concerns raised by the Directors. Draft minutes of each board
meeting and committee meeting are/will be sent to the Directors for comments within a reasonable time after the date on which the
meeting is held.

39Annual Report 2015
Corporate Governance Report (continued)
During the year end, seven board meetings, one annual general meeting (“2015 AGM”) and one special general meeting (“SGM”)
were held and the attendance of the individual Directors at these meetings is set out in the table below:
Name of Director
Attended/Eligible to attend
Board meeting
2015
AGM SGM
Mr. LIU Dian Bo 7/7 1/1 1/1
Mr. YANG Rong Bing 7/7 1/1 1/1
Mr. YUAN Hui Xian 7/7 1/1 1/1
Ms. ZHU Yuan Yuan 7/7 1/1 1/1
Mr. PAN Jian 5/7 0/1 0/1
Mr. LIU Dong 5/7 0/1 0/1
Ms. WANG Xin 7/7 0/1 0/1
Mr. ZHANG Hua Qiao 5/7 0/1 0/1
Professor LO Yuk Lam 4/7 1/1 0/1
Mr. LEUNG Man Kit 7/7 1/1 1/1
Mr. CHOY Sze Chung Jojo 7/7 1/1 1/1
Model Code for Securities Transactions
The Company has adopted a code of conduct regarding Directors’ securities transactions on terms no less exacting than the
required standard set out in the Model Code. Specific enquiry has been made of all the Directors and the Directors have confirmed
that they have complied with the Model Code for the Listing Date to 31 December 2015.
The Company has also adopted its own code of conduct regarding employees’ securities transactions on terms no less exacting
than the standard set out in the Model Code for the compliance by its relevant employees who are likely to be in possession of
unpublished inside information of the Company in respect of their dealings in the Company’s securities.
Delegation by the Board
The Board reserves for its decision all major matters of the Company, including: approval and monitoring of all policy matters, overall
strategies and budgets, internal control and risk management systems, material transactions (in particular those that may involve
conflict of interests), financial information, appointment of Directors and other significant financial and operational matters. Directors
could have recourse to seek independent professional advice in performing their duties at the Company’s expense and are
encouraged to access and to consult with the Company’s senior management independently.
The daily management, administration and operation of the Group are delegated to the senior management. The delegated
functions and responsibilities are periodically reviewed by the Board. Approval has to be obtained from the Board prior to any
significant transactions entered into by the management.

40
Corporate Governance Report (continued)
Corporate Governance Function
The Board recognizes that corporate governance should be the collective responsibility of Directors which include:
(a) to develop and review the Company’s policies and practices on corporate governance;
(b) to review and monitor the training and continuous professional development of Directors and senior management of the
Company;
(c) to review and monitor the Company’s policies and practices on compliance with legal and regulatory requirements;
(d) to develop, review and monitor the code of conduct and compliance manual (if any) applicable to employees and directors;
and
(e) to review the Company’s compliance with the CG Code and disclosure in the Corporate Governance Report.
Remuneration of Directors and Senior Management
The Company has established a formal and transparent procedure for formulating policies on remuneration of Directors and senior
management of the Group. Details of the remuneration of each of the Directors for the year ended 31 December 2015 are set out in
note 8 to the consolidated financial statements in this annual report.
The biographies of the senior management are disclosed in the section headed “Directors and Senior Management” in this annual
report. Remuneration paid to the top senior management (excluding the Directors) for the year ended 31 December 2015 fell within
the following bands as follows:
Remuneration Band No. of employees
Nil to RMB1,000,000 2
RMB1,000,001 to RMB1,500,000 2
RMB1,500,001 to RMB2,000,000 1
5
Directors’ Liability Insurance
The Company has arranged appropriate insurance cover in respect of legal action against its Directors.
Board Committees
Nomination Committee
The Nomination Committee currently comprises three members, namely Professor Lo Yuk Lam (chairman), Mr. Zhang Hua Qiao and
Mr. Choy Sze Chung Jojo, all of them are independent non-executive Directors.

41Annual Report 2015
Corporate Governance Report (continued)
The principal duties of the Nomination Committee include reviewing the Board composition, making recommendation to the Board
on the appointment and succession planning of Directors, and assessing the independence of the independent non-executive
Directors. The Nomination Committee adopted certain criteria and procedure in the nomination of new directors. The Nomination
Committee will assess the candidate or incumbent on criteria such as integrity, experience, skill and ability to commit time and effort
to carry out the duties and responsibilities. The recommendations of the Nomination Committee will then be put to the Board for
decision.
The written terms of reference of Nomination Committee are available on the websites of the Stock Exchange and the Company.
During the year ended 31 December 2015, one meeting of the Nomination Committee were held and the attendance record of the
Nomination Committee members is set out in the table below:
Directors Attended/Eligible to attend
Professor LO Yuk Lam 1/1
Mr. ZHANG Hua Qiao 1/1
Mr. CHOY Sze Chung Jojo 1/1
During the year 2015, the Nomination Committee reviewed the Board composition and considered that the existing Board was
appropriately structured. The Nomination Committee also assessed the independence of the independent non-executive Directors
and made recommendation to the Board for the re-election of Directors.
Board Diversity PolicyThe Company views diversity at the Board level as an essential element in supporting the attainment of its strategic objectives and
its sustainable development. To that end, the Company has adopted a Board Diversity Policy to set out the approach to achieve
diversity on the Board. In designing the Board’s composition, Board diversity has been considered from a number of aspects,
including but not limited to gender, age, cultural and educational background, ethnicity, professional experience, skills, knowledge
and length of service. Ultimately, all Board appointments have been based on merit, and candidates were considered against
objective criteria, having due regard for the benefits of diversity on the Board.
Remuneration Committee
The Remuneration Committee comprises three members, namely Mr. Choy Sze Chung Jojo (chairman), Mr. Zhang Hua Qiao and
Professor LO Yuk Lam, all of them are independent non-executive Directors.
The primary duties of the Remuneration Committee include making recommendations to the Board for approval on the remuneration
policy and structure and remuneration packages of the Directors and the senior management. The Remuneration Committee is also
responsible for ensuring that no Director or any of his/her associates will participate in deciding his/her own remuneration.
The written terms of reference of Remuneration Committee are available on the websites of the Stock Exchange and the Company.
During the year ended 31 December 2015, two meetings of the Remuneration Committee were held and the attendance record of
the Remuneration Committee members is set out in the table below:
Directors Attended/Eligible to attend
Mr. CHOY Sze Chung Jojo 2/2
Mr. ZHANG Hua Qiao 1/2
Professor LO Yuk Lam 2/2

42
Corporate Governance Report (continued)
During the year 2015, the Remuneration Committee assessed the performance of the Directors and reviewed and made
recommendation to the Board on the Company’s policy and structure for all directors’ and senior management remuneration.
Audit Committee
The Audit Committee comprises three members namely, Mr. Leung Man Kit (chairman), Mr. Zhang Hua Qiao and Professor Lo Yuk
Lam, all of them are independent non-executive Directors. The main duties of the Audit Committee include the following:
— To review the financial statements and reports before submission to the Board;
— To review and monitor the external auditor’s independence and objectivity and effectiveness of the audit process in
accordance with applicable standard and discuss with external auditor the nature and scope of the audit and reporting
obligations before the audit commences;
— To review the adequacy and effectiveness of the Company’s financial reporting system, internal control system and risk
management system and associated procedures, including the adequacy of the resources, staff qualifications and experience,
training programmes and budget of the Company’s accounting and financial reporting function; and
— To oversee the risk management and internal control systems of the Group, report to the Board on any material issue, and
make recommendations to the Board.
The written terms of reference of Audit Committee has been amended on 30 December 2015 which are available on the websites of
the Stock Exchange and the Company.
During the year ended 31 December 2015, two meetings of the Audit Committee were held and the attendance record of the Audit
Committee members is set out in the table below:
Directors Attended/Eligible to attend
Mr. LEUNG Man Kit 2/2
Mr. ZHANG Hua Qiao 2/2
Professor LO Yuk Lam 2/2
During the year 2015, the Audit Committee had reviewed the annual results and interim results of the Company and its subsidiaries
for the year ended 31 December 2014 and for the period ended 30 June 2015 respectively, the risk management systems and
processes for the re-appointment of the external auditor. There are proper arrangements for employees, in confidence, to raise
concerns about possible improprieties in financial reporting, internal control and other matters.
Directors’ Responsibilities for Financial Reporting in respect of Financial Statements
The Directors acknowledge their responsibility for preparing the financial statements for the year ended 31 December 2015 which
give a true and fair view of the affairs of the Company and the Group and of the Group’s results and cash flows.
The management has provided to the Board such explanation and information as are necessary to enable the Board to carry out an
informed assessment of the Company’s financial statements, which are put to the Board for approval. The Company provides all
members of the Board with monthly updates on Company’s performance, positions and prospects.
43Annual Report 2015
Corporate Governance Report (continued)
The Directors were not aware of any material uncertainties relating to events or conditions which may cast significant doubt upon
the Group’s ability to continue as a going concern.
The statement by the auditor of the Company regarding their reporting responsibilities on the consolidated financial statements of
the Company is set out in the Independent Auditor’s Report on page 45 of this annual report.
Internal Control
The Board acknowledges that it is the responsibility of the Board for maintaining an adequate internal control system to safeguard
shareholders investments and Company assets and reviewing the effectiveness of such system on an annual basis.
The Group has established an internal audit department to review the financial condition, operational condition, risk management,
compliance control and internal control of the Group.
The Board, through the Audit Committee, conducted a review of the effectiveness of the internal control system of the Company
including the adequacy of resources, qualifications and experience of staff of the Company’s accounting and financial reporting
function, and their training programmes and budget and considered the internal control system is effective and adequate.
Auditor’s Remuneration
An analysis of the remuneration paid or payable to the Company’s auditors, Ernst & Young, in respect of audit and non-audit
services for the year ended 31 December 2015 is set out below:
Items of auditors’ services Amount (RMB’000)
Audit services 4,860
Non-audit services —
Total 4,860
The Audit Committee and the Board have agreed on the re-appointment of Ernst & Young as the independent auditor of the Group
for 2016 and the proposal will be submitted for approval at the AGM to be held on 8 June 2016.
Company Secretary
Ms. Lai Siu Kuen (“Ms. Lai”) was appointed as the Company Secretary. She is a senior manager of KCS Hong Kong Limited (a
company secretarial service provider). Ms. Zhu Yuan Yuan, an executive Director of the Company, is the main internal liaison
between her and the Company.
During the year 2015, Ms. Lai undertook not less than 15 hours of relevant professional training in compliance with Rule 3.29 of the
Listing Rules.

44
Corporate Governance Report (continued)
Communication with Shareholders and Investor Relations
The Company considers that effective communication with shareholders is essential for enhancing investor relations and
understanding of the Group’s business, performance and strategies. The Company also recognises the importance of timely and
non-selective disclosure of information, which will enable shareholders and investors to make the informed investment decisions.
The annual general meeting of the Company provides opportunity for shareholders to communicate directly with the Directors. The
Chairman of the Company, the chairman of the Board Committee of the Company will attend the AGMs to answer shareholders’
questions. The external auditor of the Company will also attend the AGMs to answer questions about the conduct of the audit, the
preparation and contents of the auditor’s report, the accounting policies and auditor independence.
To promote effective communication, the Company adopts a shareholders’ communication policy which aims at establishing a two-
way relationship and communication between the Company and its shareholders and maintains a website at www.luye.cn, where
up-to-date information on the Company’s business operations and developments, financial information, corporate governance
practices and other information are available for public access.
Shareholders’ Rights
To safeguard shareholders’ interests and rights, a separate resolution will be proposed for each issue at shareholder meetings,
including the election of individual directors. All resolutions put forward at shareholder meetings will be voted on by poll pursuant to
the Listing Rules and poll results will be posted on the websites of the Company and the Stock Exchange in a timely manner after
each shareholder meeting.
Convening of Special General Meeting and Putting Forward Proposals
In accordance with the Bye-laws, a special general meeting shall be convened on the requisition of one or more shareholders of the
Company holding, at the date of deposit of the requisition, not less than one tenth of the paid up capital of the Company having the
right of voting at general meetings.
Such requisition shall be made in writing to the Board or the Company Secretary for the purpose of requiring a special general
meeting to be called by the Board for the transaction of any business specified in such requisition. Such meeting shall be held within
2 months after the deposit of such requisition.
Shareholders may put forward proposals for consideration at an annual general meeting in accordance with the Companies Act
1981 of Bermuda and the Bye-laws.
As regards proposing a person for election as a Director, the procedures are available on the website of the Company.
Enquiries to the Board
Written enquiries may be put to the Board through the Company’s principal place of business in Hong Kong at Unit 3207, 32/F,
Citibank Tower, 3 Garden Road, Central, Hong Kong for the attention to the Chairman of the Board.
Change in Constitutional Documents
An altered Bye-laws of the Company was adopted by the Company on 19 June 2014 and was effective on the Listing Date. There
was no change in the Bye-laws of the Company for the year ended 31 December 2015.

Independent Auditors’ Report
45Annual Report 2015
22/F, CITIC Tower
1 Tim Mei Avenue
Central, Hong Kong
To the shareholders of Luye Pharma Group Ltd.
(Incorporated in Bermuda with limited liability)
We have audited the consolidated financial statements of Luye Pharma Group Ltd. (the “Company”) and its subsidiaries set out on
pages 47 to 124, which comprise the consolidated statement of financial position as at 31 December 2015, and the consolidated
statement of profit or loss, the consolidated statement of comprehensive income, the consolidated statement of changes in equity
and the consolidated statement of cash flows for the year then ended, and a summary of significant accounting policies and other
explanatory information.
Directors’ responsibility for the consolidated financial statements
The directors of the Company are responsible for the preparation of consolidated financial statements that give a true and fair view
in accordance with International Financial Reporting Standards issued by the International Accounting Standards Board and the
disclosure requirements of the Hong Kong Companies Ordinance, and for such internal control as the directors determine is
necessary to enable the preparation of consolidated financial statements that are free from material misstatement, whether due to
fraud or error.
Auditors’ responsibility
Our responsibility is to express an opinion on these consolidated financial statements based on our audit. Our report is made solely
to you, as a body, in accordance with section 90 of the Bermuda Companies Act 1981, and for no other purpose. We do not
assume responsibility towards or accept liability to any other person for the contents of this report.
We conducted our audit in accordance with Hong Kong Standards on Auditing issued by the Hong Kong Institute of Certified Public
Accountants. Those standards require that we comply with ethical requirements and plan and perform the audit to obtain
reasonable assurance about whether the consolidated financial statements are free from material misstatement.
An audit involves performing procedures to obtain audit evidence about the amounts and disclosures in the consolidated financial
statements. The procedures selected depend on the auditors’ judgement, including the assessment of the risks of material
misstatement of the consolidated financial statements, whether due to fraud or error. In making those risk assessments, the auditors
consider internal control relevant to the entity’s preparation of consolidated financial statements that give a true and fair view in order
to design audit procedures that are appropriate in the circumstances, but not for the purpose of expressing an opinion on the
effectiveness of the entity’s internal control. An audit also includes evaluating the appropriateness of accounting policies used and
the reasonableness of accounting estimates made by the directors, as well as evaluating the overall presentation of the consolidated
financial statements.
We believe that the audit evidence we have obtained is sufficient and appropriate to provide a basis for our audit opinion.

46 Luye Pharma Group Ltd.
Independent Auditors’ Report (continued)
Opinion
In our opinion, the consolidated financial statements give a true and fair view of the financial position of the Company and its
subsidiaries as at 31 December 2015, and of their financial performance and cash flows for the year then ended in accordance with
International Financial Reporting Standards and have been properly prepared in compliance with the disclosure requirements of the
Hong Kong Companies Ordinance.
Ernst & Young
Certified Public Accountants
Hong Kong
29 March 2016

Consolidated Statement of Profit or Loss
47Annual Report 2015
Year ended 31 December 2015
2015 2014
Notes RMB’000 RMB’000
(Restated)
REVENUE 5 2,563,129 2,543,986
Cost of sales (475,717) (482,505)
Gross profit 2,087,412 2,061,481
Other income and gains 5 165,132 98,375
Selling and distribution expenses (964,097) (1,006,259)
Administrative expenses (184,821) (194,984)
Other expenses (190,164) (193,786)
Finance costs 7 (15,606) (39,661)
Share of profit of an associate 17 276 348
PROFIT BEFORE TAX 6 898,132 725,514
Income tax expense 10 (133,433) (111,068)
PROFIT FOR THE YEAR 764,699 614,446
Attributable to:
Owners of the parent 754,523 605,524
Non-controlling interests 10,176 8,922
764,699 614,446
EARNINGS PER SHARE ATTRIBUTABLE TO ORDINARY EQUITY
HOLDERS OF THE PARENT
Basic and diluted (RMB)
— For profit for the year 12 22.72 cents 20.22 cents

Consolidated Statement of Comprehensive Income
48 Luye Pharma Group Ltd.
Year ended 31 December 2015
2015 2014
RMB’000 RMB’000
PROFIT FOR THE YEAR 764,699 614,446
OTHER COMPREHENSIVE INCOME
Other comprehensive income to be reclassified to profit or loss in subsequent periods:
Available-for-sale investments:
Changes in fair value 74,684 18,033
Reclassification adjustments for gains included in the consolidated statement of
profit or loss (76,895) (15,892)
Exchange differences on translation of foreign operations 4,051 304
Net other comprehensive income to be reclassified to profit or loss
in subsequent periods 1,840 2,445
OTHER COMPREHENSIVE INCOME FOR THE YEAR, NET OF TAX 1,840 2,445
TOTAL COMPREHENSIVE INCOME FOR THE YEAR 766,539 616,891
Attributable to:
Owners of the parent 756,363 607,969
Non-controlling interests 10,176 8,922
766,539 616,891

Consolidated Statement of Financial Position
49Annual Report 2015
31 December 2015
2015 2014
Notes RMB’000 RMB’000
NON-CURRENT ASSETS
Property, plant and equipment 13 1,196,262 1,092,151
Advance payments for property, plant and equipment 48,762 34,227
Prepayments, deposits and other receivables 21 — 700,000
Prepaid land lease payments 14 185,813 194,193
Goodwill 15 347,356 347,356
Other intangible assets 16 126,216 145,888
Investment in an associate 17 4,350 5,485
Available-for-sale investments 18 3,342 2,242
Deferred tax assets 28 69,377 83,259
Total non-current assets 1,981,478 2,604,801
CURRENT ASSETS
Inventories 19 285,609 251,198
Trade and notes receivables 20 1,193,103 914,130
Prepayments, deposits and other receivables 21 118,249 53,502
Due from related parties 34(b)(i) 1,600 2,655
Pledged time deposits 22 266,500 127,215
Available-for-sale investments 18 1,402,118 1,845,392
Time deposits with original maturity of over three months 22 960,591 180,000
Cash and cash equivalents 22 843,674 151,863
Total current assets 5,071,444 3,525,955
CURRENT LIABILITIES
Trade and notes payables 23 83,219 59,044
Other payables and accruals 24 366,457 439,576
Interest-bearing loans and borrowings 25 502,222 304,899
Government grants 27 25,155 37,049
Tax payable 64,946 47,668
Due to related parties 34(b)(ii) 3,428 —
Total current liabilities 1,045,427 888,236
NET CURRENT ASSETS 4,026,017 2,637,719
TOTAL ASSETS LESS CURRENT LIABILITIES 6,007,495 5,242,520

50 Luye Pharma Group Ltd.
31 December 2015
Consolidated Statement of Financial Position (continued)
2015 2014
Notes RMB’000 RMB’000
TOTAL ASSETS LESS CURRENT LIABILITIES 6,007,495 5,242,520
NON-CURRENT LIABILITIES
Interest-bearing loans and borrowings 25 493 638
Government grants 27 115,150 106,605
Deferred tax liabilities 28 92,321 97,717
Total non-current liabilities 207,964 204,960
Net assets 5,799,531 5,037,560
EQUITY
Equity attributable to owners of the parent
Issued capital 29 427,269 427,269
Share premium 2,936,817 2,936,817
Reserves 30 2,299,875 1,543,512
5,663,961 4,907,598
Non-controlling interests 135,570 129,962
Total equity 5,799,531 5,037,560
Mr. Liu Dianbo Mr. Yang Rongbing
Director Director

Consolidated Statement of Changes in Equity
51Annual Report 2015
Year ended 31 December 2015
Attributable to owners of the parent
Issuedcapital
Sharepremiumaccount
Otherreserves*
Statutorysurplus
reserves*Retainedearnings*
Unrealisedgain
reserves*
Foreigncurrency
translationreserves* Total
Non-controlling
interestsTotal
equityRMB’000 RMB’000 RMB’000 RMB’000 RMB’000 RMB’000 RMB’000 RMB’000 RMB’000 RMB’000
(note 30)
At 1 January 2015 427,269 2,936,817 41,387 297,796 1,206,771 4,253 (6,695) 4,907,598 129,962 5,037,560Profit for the year — — — — 754,523 — — 754,523 10,176 764,699Other comprehensive income
for the year:Fair value change on
available-for-sale investments, net of tax — — — — — (2,211) — (2,211) — (2,211)
Currency realignment — — — — — — 4,051 4,051 — 4,051
Total comprehensive income for the year — — — — 754,523 (2,211) 4,051 756,363 10,176 766,539
Transfer to statutory reserves — — — 30,388 (30,388) — — — — —Dividends paid to non-controlling
shareholders — — — — — — — — (4,568) (4,568)
At 31 December 2015 427,269 2,936,817 41,387 328,184 1,930,906 2,042 (2,644) 5,663,961 135,570 5,799,531
At 1 January 2014 81,180 427,980 41,387 231,324 992,058 2,112 (6,999) 1,769,042 128,653 1,897,695Profit for the year — — — — 605,524 — — 605,524 8,922 614,446Other comprehensive income
for the year:Fair value change
on available-for-sale investments, net of tax — — — — — 2,141 — 2,141 — 2,141
Currency realignment — — — — — — 304 304 — 304
Total comprehensive income for the year — — — — 605,524 2,141 304 607,969 8,922 616,891
Transfer to statutory reserves — — — 66,472 (66,472) — — — — —
Share repurchase** (8,556) (191,444) — — — — — (200,000) — (200,000)Issue of shares 82,195 3,057,145 — — — — — 3,139,340 — 3,139,340Capitalisation issue 272,450 (272,450) — — — — — — — —Share issue expenses — (84,414) — — — — — (84,414) — (84,414)Dividends paid — — — — (324,339) — — (324,339) — (324,339)Dividends paid to non-controlling
shareholders — — — — — — — — (7,613) (7,613)
At 31 December 2014 427,269 2,936,817 41,387 297,796 1,206,771 4,253 (6,695) 4,907,598 129,962 5,037,560
* These reserve accounts comprise the consolidated reserves of RMB2,299,875,000 (2014: RMB1,543,512,000) in the consolidated statement of financial
position.
** On 30 May 2014, the Company repurchased 51,932,992 shares from the immediate holding company, Luye Pharmaceutical Investment Co., Ltd. (“Luye
Investment”), at a total consideration of RMB200,000,000 and declared a dividend of US$52,865,878 (equivalent to RMB324,339,000) to Luye
Investment. Luye Investment used the dividend receivable and the share repurchase consideration from the Company to offset its amount due to the
Company on the same date.

Consolidated Statement of Cash Flows
52 Luye Pharma Group Ltd.
Year ended 31 December 2015
2015 2014
Notes RMB’000 RMB’000
CASH FLOWS FROM OPERATING ACTIVITIES
Profit before tax 898,132 725,514
Adjustments for:
Share of profit of an associate (276) (348)
Depreciation of items of property, plant and equipment 13 86,280 79,813
Amortisation of other intangible assets 16 23,657 25,491
Amortisation of prepaid land lease payments 14 5,272 5,141
Amortisation of long-term deferred expenditure — 292
(Gain)/loss on disposal of items of property, plant and equipment (21) 3,966
Interest income 5 (21,776) (25,175)
Investment income from available-for-sale investments 5 (76,895) (15,892)
Interest expense 7 15,606 39,545
929,979 838,347
Increase in trade and notes receivables (278,973) (378,568)
Increase in prepayments, deposits and other receivables (44,959) (5,976)
Decrease in amounts due from related parties 1,055 2,808
Increase in inventories (34,411) (16,465)
Decrease in government grants (6,019) (786)
Increase/(decrease) in trade and notes payables 24,175 (10,325)
(Decrease)/increase in other payables and accruals (76,523) 70,622
Increase/(decrease) in amounts due to related parties 3,428 (36,856)
Decrease in pledged time deposits 2,015 175,470
Cash generated from operations 519,767 638,271
Interest paid (13,971) (40,321)
Income tax paid (111,088) (103,384)
Net cash flows from operating activities 394,708 494,566

53Annual Report 2015
Year ended 31 December 2015
Consolidated Statement of Cash Flows (continued)
2015 2014
Notes RMB’000 RMB’000
Net cash flows from operating activities 394,708 494,566
CASH FLOWS FROM INVESTING ACTIVITIES
Purchases of items of property, plant and
equipment and construction in progress (204,107) (268,836)
Prepayment of land lease payments — (12,285)
Purchases of other intangible assets 16 (3,985) (8,154)
Purchases of available-for-sale investments (5,138,720) (1,840,465)
Proceeds from sales of available-for-sale investments 5,578,185 10,000
Receipt of investment income from available-for-sale investments 76,895 15,892
Proceeds from disposal of items of property, plant and equipment 971 25,162
Refund of prepayment for/(prepayment for) acquisition of a subsidiary 21 700,000 (700,000)
Increase/(decrease) in government grants 2,670 (8,680)
Increase in time deposits with original maturity of over three months (780,591) (180,000)
Increase in an amount due from the immediate holding company — (213,520)
Interest received 9,000 22,099
Net cash flows from/(used in) investing activities 240,318 (3,158,787)
CASH FLOWS FROM FINANCING ACTIVITIES
Repayment of loans (1,294,293) (2,187,013)
Proceeds from loans 1,491,471 1,747,242
Increase in pledged time deposits (141,300) (125,200)
Dividends paid to non-controlling shareholders (4,568) (7,613)
Payment of listing expenses — (84,414)
Issue of shares — 3,139,340
Net cash flows from financing activities 51,310 2,482,342
NET INCREASE/(DECREASE) IN CASH AND CASH EQUIVALENTS 686,336 (181,879)
Net foreign exchange difference 5,475 592
Cash and cash equivalents at beginning of year 22 151,863 333,150
CASH AND CASH EQUIVALENTS AT END OF YEAR 22 843,674 151,863

Notes to the Consolidated Financial Statements
54 Luye Pharma Group Ltd.
31 December 2015
1. Corporate and group information
Luye Pharma Group Ltd. (the “Company”) was incorporated in Bermuda as an exempted company with limited liability under
the Bermuda Companies Act on 2 July 2003. It was listed on the Singapore Exchange Securities Trading Limited (the “SGX”)
on 5 May 2004, and delisted since 29 November 2012. On 9 July 2014, the Company succeeded its listing on the Main
Board of the Stock Exchange of Hong Kong Limited (“SEHK”).
The Company is an investment holding company. The Company’s subsidiaries are principally engaged in the development,
production, marketing and sale of pharmaceutical products.
The registered office of the Company is located at Clarendon House, 2 Church Street, Hamilton HM 11, Bermuda. The
principal place of business of the Company in Hong Kong is Unit 3207, 32/F, Citibank Tower, Citibank Plaza, 3 Garden Road,
Central, Hong Kong.
In the opinion of the directors of the Company, the ultimate holding company of the Company is AsiaPharma Holdings Ltd.,
which is incorporated in Bermuda.
Information about subsidiaries
Particulars of the Company’s principal subsidiaries are as follows:
Company
Place and date of
incorporation/
registration and
business
Issued ordinary/
registered
share capital
Percentage of equity
attributable to
the Company Principal activities
Direct Indirect
AsiaPharm Investments Ltd.
(“AsiaPharm Investments”)
Bermuda
2 July 2003
US$120,000 100 — Investment holding
Luye Pharma (Singapore) Pte. Ltd.
(“LPPL”, formerly known as
AsiaPharm Biotech Pte. Ltd.)
Singapore
23 April 1991
SG$1,700,000 100 — Distribution and sale of
pharmaceutical drugs
Luye Pharma Investments Pte. Ltd.
(“Luye Pharma Investments”)
Singapore
26 August 2010
SG$2 100 — Investment holding
Luye Pharma Hong Kong Limited
(“Luye Hong Kong”)
Hong Kong
31 July 2007
HK$1 100 — Investment holding
Luye Pharma (USA) Ltd.
(“LPU”)
United States of
America (“USA”)
3 August 2015
— 100 — Manufacture and sale of
pharmaceutical
products

55Annual Report 2015
31 December 2015
Notes to the Consolidated Financial Statements (continued)
1. Corporate and group information (continued)
Information about subsidiaries (continued)
Particulars of the Company’s principal subsidiaries are as follows: (continued)
Company
Place and date of
incorporation/
registration and
business
Issued ordinary/
registered
share capital
Percentage of equity
attributable to
the Company Principal activities
Direct Indirect
Luye Pharma Venture Capital
(“LPV”)
Cayman Islands
26 November 2015
US$50,000 100 — Investment holding
Solid Success Holdings Ltd.
(“Solid Success”)
British Virgin Islands
22 August 2002
US$100 — 100 Investment holding
Kanghai Pharmaceutical Technology
Development Limited (“Kang Hai”)
Hong Kong
22 June 2002
HK$100 — 100 Investment holding
Apex Group Holding Limited (“Apex”) Hong Kong
10 June 1993
HK$10,000 — 100 Investment holding
A-Bio Pharma Pte. Ltd. (“A-Bio”) Singapore
17 August 2001
SG$12,500,000 — 100 Provision of contract
research, process
development and
manufacturing
services
Luye Biotech Pte. Ltd.
(“Luye Biotech”)
Singapore
6 November 2009
SG$26,100,000 — 100 Research and
development on
oncological,
cardiovascular
and other tropical
diseases
AsiaPharm Biotech Sdn. Bhd.
(“AsiaPharm Biotech”)
Malaysia
15 September 2010
MYR100,000 — 100 Distribution and sale of
pharmaceutical
products

56 Luye Pharma Group Ltd.
31 December 2015
Notes to the Consolidated Financial Statements (continued)
1. Corporate and group information (continued)
Information about subsidiaries (continued)
Particulars of the Company’s principal subsidiaries are as follows: (continued)
Company
Place and date of
incorporation/
registration and
business
Issued ordinary/
registered
capital
Percentage of equity
attributable to
the Company Principal activities
Direct Indirect
Shandong Luye Pharmaceutical
Co., Ltd. (“Shandong Luye”)(i)People’s Republic of
China (“PRC”)/
Mainland China
8 June 1994
RMB271,800,000 — 100 Manufacture and sale of
pharmaceutical
products
Yantai Luye Drugs Trading
Co., Ltd. (“Luye Trading”)(i)PRC/
Mainland China
27 March 1997
RMB20,000,000 — 100 Distribution and sale of
pharmaceutical
products
Shandong Langhe Biotechnology
Ltd.(“Shandong Langhe”)(i)PRC/
Mainland China
11 March 2010
RMB10,000,000 — 100 Research and
development
Shandong Luye Natural Drug
Research and Development Co.,
Ltd. (“Luye R&D”)(i)
PRC/
Mainland China
31 December 2002
RMB5,000,000 — 100 Research and
development of
Chinese and Western
medicines and
provision of related
services
Nanjing Luye Pharmaceutical
Co., Ltd. (“Nanjing Luye”)(i)PRC/
Mainland China
22 February 2004
RMB70,000,000 — 100 Manufacture and sale of
pharmaceutical
products
Beijing WBL Peking University
Biotech Co., Ltd. (“WPU”)(i)PRC/
Mainland China
1 September 1994
RMB80,000,000 — 69.55 Manufacture and sale of
pharmaceutical
products
Nanjing New AIGE Eggs Co., Ltd.
(“Nanjing AIGE”)(i)PRC/
Mainland China
25 June 2010
RMB300,000 — 100 Manufacture and sale of
eggs and technology
development

57Annual Report 2015
31 December 2015
Notes to the Consolidated Financial Statements (continued)
1. Corporate and group information (continued)
Information about subsidiaries (continued)
Particulars of the Company’s principal subsidiaries are as follows: (continued)
Company
Place and date of
incorporation/
registration and
business
Issued ordinary/
registered
share capital
Percentage of equity
attributable to
the Company Principal activities
Direct Indirect
Nanjing Kanghai Phospholipid
Biological Technology Co., Ltd.
(“Nanjing Kanghai
Phospholipid”)(i)
PRC/
Mainland China
13 September 2010
RMB1,500,000 — 100 Manufacture and sale of
pharmaceutical
products
Shanghai Ge Lin Li Fu Consulting
Co., Ltd. (“Shanghai Ge Lin”)(i)PRC/
Mainland China
28 June 2010
RMB1,000,000 — 100 Provision of business
and investment
consultation services
Sichuan Luye Baoguang
Pharmaceutical Co., Ltd.
(“Sichuan Baoguang”)(i)
PRC/
Mainland China
21 December 2000
RMB36,000,000 — 100 Manufacture and sale of
pharmaceutical
products
Chengdu Bomai Technology Co.,
Ltd. (“Chengdu Bomai”)(i)PRC/
Mainland China
1 December 2004
RMB500,000 — 100 Research and
development
Yantai Luye Pharma Holdings
Co., Ltd. (“Yantai Luye”)(ii)PRC/
Mainland China
15 May 2014
US$173,600,000 — 100 Investment holding
Yantai Lujian Drugs Retail
Co.,Ltd. (“Yantai Lujian”)(i)PRC/
Mainland China
12 August 2015
RMB200,000 — 100 Retail of pharmaceutical
products
(i) These entities are limited liability enterprises established under PRC law.
(ii) The entity is a wholly-foreign-owned enterprise established under PRC law.

58 Luye Pharma Group Ltd.
31 December 2015
Notes to the Consolidated Financial Statements (continued)
2.1 Basis of preparation
These financial statements have been prepared in accordance with International Financial Reporting Standards (“IFRSs”)
issued by the International Accounting Standards Board (“IASB”), accounting principles generally accepted in Hong Kong and
the disclosure requirements of the Hong Kong Companies Ordinance.
They have been prepared under the historical cost convention, except for available-for-sale investments which have been
measured at fair value. These financial statements are presented in Renminbi (“RMB”) and all values are rounded to the
nearest thousand except when otherwise indicated.
Basis of consolidation
The consolidated financial statements include the financial statements of the Company and its subsidiaries (collectively
referred to as the “Group”) for the year ended 31 December 2015. A subsidiary is an entity (including a structured entity),
directly or indirectly, controlled by the Company. Control is achieved when the Group is exposed, or has rights, to variable
returns from its involvement with the investee and has the ability to affect those returns through its power over the investee (i.e.,
existing rights that give the Group the current ability to direct the relevant activities of the investee).
When the Company has, directly or indirectly, less than a majority of the voting or similar rights of an investee, the Group
considers all relevant facts and circumstances in assessing whether it has power over an investee, including:
(a) the contractual arrangement with the other vote holders of the investee;
(b) rights arising from other contractual arrangements; and
(c) the Group’s voting rights and potential voting rights.
The financial statements of the subsidiaries are prepared for the same reporting period as the Company, using consistent
accounting policies. The results of subsidiaries are consolidated from the date on which the Group obtains control, and
continue to be consolidated until the date that such control ceases.
Profit or loss and each component of other comprehensive income are attributed to the owners of the parent of the Group
and to the non-controlling interests, even if this results in the non-controlling interests having a deficit balance. All intra-group
assets and liabilities, equity, income, expenses and cash flows relating to transactions between members of the Group are
eliminated in full on consolidation.
The Group reassesses whether or not it controls an investee if facts and circumstances indicate that there are changes to one
or more of the three elements of control described in the accounting policy for subsidiaries below. A change in the ownership
interest of a subsidiary, without a loss of control, is accounted for as an equity transaction.
If the Group loses control over a subsidiary, it derecognises (i) the assets (including goodwill) and liabilities of the subsidiary, (ii)
the carrying amount of any non-controlling interest and (iii) the cumulative translation differences recorded in equity; and
recognises (i) the fair value of the consideration received, (ii) the fair value of any investment retained and (iii) any resulting
surplus or deficit in profit or loss. The Group’s share of components previously recognised in other comprehensive income is
reclassified to profit or loss or retained profits, as appropriate, on the same basis as would be required if the Group had
directly disposed of the related assets or liabilities.
59Annual Report 2015
31 December 2015
Notes to the Consolidated Financial Statements (continued)
2.2 Prior year restatement
Certain of the marketing and promotion expenses paid by the Group to the third party promoters were passed onto the
distributors and the directors of the Company considered that the relevant expenses should be adjusted and accounted for
as a reduction of the revenue earned from the distributors instead of recorded as selling and distribution expenses in the
consolidated financial statements of the Group. As a result, a prior year adjustment was recorded to offset the related revenue
and selling and distribution expenses of RMB610,234,000 for the year ended 31 December 2014.
The above adjustment did not affect the net profit or net assets of the Group as at 31 December 2014 or before.
2.3 Changes in accounting policies and disclosures
The Group has adopted the following revised standards for the first time for the current year’s financial statements.
Amendments to IAS 19 Defined Benefit Plans: Employee Contributions
Annual Improvements 2010–2012 Cycle Amendments to a number of IFRSs
Annual Improvements 2011–2013 Cycle Amendments to a number of IFRSs
The adoption of the above revised standards has had no significant financial effect on the financial statements.
In addition, the Company has adopted the amendments to the Listing Rules issued by the Hong Kong Stock Exchange
relating to the disclosure of financial information with reference to the Hong Kong Companies Ordinance (Cap. 622) during the
current financial year. The main impact to the financial statements is on the presentation and disclosure of certain information
in the financial statements.

60 Luye Pharma Group Ltd.
31 December 2015
Notes to the Consolidated Financial Statements (continued)
2.4 Issued but not yet effective International Financial Reporting Standards
The Group has not applied the following new and revised IFRSs, that have been issued but are not yet effective, in the
financial statements.
IFRS 9 Financial Instruments3
Amendments to IFRS 10
and IAS 28
Sale or Contribution of Assets between an Investor and its Associate or Joint Venture6
Amendments to IFRS 10,
IFRS 12 and IAS 28
Investment Entities: Applying the Consolidation Exception1
Amendments to IFRS 11 Accounting for Acquisitions of Interests in Joint Operations1
IFRS 14 Regulatory Deferral Accounts5
IFRS 15 Revenue from Contracts with Customers3
IFRS 16 Leases4
Amendments to IAS 1 Disclosure Initiative1
Amendments to IAS 7 Disclosure Initiative2
Amendments to IAS 12 Recognition of Deferred Tax Assets for Unrealised Losses2
Amendments to IAS 16
and IAS 38
Clarification of Acceptable Methods of Depreciation and Amortisation1
Amendments to IAS 16
and IAS 41
Agriculture: Bearer Plants1
Amendments to IAS 27 Equity Method in Separate Financial Statements1
Annual Improvements
2012–2014 Cycle
Amendments to a number of IFRSs1
1 Effective for annual periods beginning on or after 1 January 2016
2 Effective for annual periods beginning on or after 1 January 2017
3 Effective for annual periods beginning on or after 1 January 2018
4 Effective for annual periods beginning on or after 1 January 2019
5 Effective for an entity that first adopts IFRSs for its annual financial statements beginning on or after 1 January 2016 and therefore is not
applicable to the Group
6 No mandatory effective date yet determined but is available for adoption
The directors of the Company anticipate that the application of the new and revised IFRSs will have no material impact on the
financial statements.

61Annual Report 2015
31 December 2015
Notes to the Consolidated Financial Statements (continued)
2.5 Summary of significant accounting policies
Investments in associates and joint ventures
An associate is an entity in which the Group has a long term interest of generally not less than 20% of the equity voting rights
and over which it is in a position to exercise significant influence. Significant influence is the power to participate in the financial
and operating policy decisions of the investee, but is not control or joint control over those policies.
A joint venture is a type of joint arrangement whereby the parties that have joint control of the arrangement have rights to the
net assets of the joint venture. Joint control is the contractually agreed sharing of control of an arrangement, which exists only
when decisions about the relevant activities require the unanimous consent of the parties sharing control.
The Group’s investments in associates and joint ventures are stated in the consolidated statement of financial position at the
Group’s share of net assets under the equity method of accounting, less any impairment losses. Adjustments are made to
bring into line any dissimilar accounting policies that may exist. The Group’s share of the post-acquisition results and other
comprehensive income of associates and joint ventures is included in the consolidated statement of profit or loss and
consolidated other comprehensive income, respectively. In addition, when there has been a change recognised directly in the
equity of the associate or joint venture, the Group recognises its share of any changes, when applicable, in the consolidated
statement of changes in equity. Unrealised gains and losses resulting from transactions between the Group and its associates
or joint ventures are eliminated to the extent of the Group’s investments in the associates or joint ventures, except where
unrealised losses provide evidence of an impairment of the assets transferred. Goodwill arising from the acquisition of
associates or joint ventures is included as part of the Group’s investments in associates or joint ventures.
If an investment in an associate becomes an investment in a joint venture or vice versa, the retained interest is not
remeasured. Instead, the investment continues to be accounted for under the equity method. In all other cases, upon loss of
significant influence over the associate or joint control over the joint venture, the Group measures and recognises any retained
investment at its fair value. Any difference between the carrying amount of the associate or joint venture upon loss of
significant influence or joint control and the fair value of the retained investment and proceeds from disposal is recognised in
profit or loss.
When an investment in an associate or a joint venture is classified as held for sale, it is accounted for in accordance with IFRS
5 Non-current Assets Held for Sale and Discontinued Operations.

62 Luye Pharma Group Ltd.
31 December 2015
Notes to the Consolidated Financial Statements (continued)
2.5 Summary of significant accounting policies (continued)
Business combination and goodwill
Business combination is accounted for using the acquisition method. The consideration transferred is measured at the
acquisition date fair value which is the sum of the acquisition date fair values of assets transferred by the Group, liabilities
assumed by the Group to the former owners of the acquiree and the equity interests issued by the Group in exchange for
control of the acquiree. For each business combination, the Group elects whether to measure the non-controlling interests in
the acquiree that are present ownership interests and entitle their holders to a proportionate share of net assets in the event
of liquidation at fair value or at the proportionate share of the acquiree’s identifiable net assets. All other components of non-
controlling interests are measured at fair value. Acquisition-related costs are expensed as incurred.
When the Group acquires a business, it assesses the financial assets and liabilities assumed for appropriate classification and
designation in accordance with the contractual terms, economic circumstances and pertinent conditions as at the acquisition
date. This includes the separation of embedded derivatives in host contracts of the acquiree.
If the business combination is achieved in stages, the previously held equity interest is remeasured at its acquisition date
through fair value and any resulting gain or loss is recognised in profit or loss.
Any contingent consideration to be transferred by the acquirer is recognised at fair value at the acquisition date. Contingent
consideration classified as an asset or liability is measured at fair value with changes in fair value recognised in profit or loss.
Contingent consideration that is classified as equity is not remeasured and subsequent settlement is accounted for within
equity.
Goodwill is initially measured at cost, being the excess of the aggregate of the consideration transferred, the amount
recognised for non-controlling interests and any fair value of the Group’s previously held equity interests in the acquiree over
the identifiable net assets acquired and liabilities assumed. If the sum of this consideration and other items is lower than the
fair value of the net assets acquired, the difference is, after reassessment, recognised in profit or loss as a gain on bargain
purchase.
After initial recognition, goodwill is measured at cost less any accumulated impairment losses. Goodwill is tested for
impairment annually or more frequently if events or changes in circumstances indicate that the carrying value may be impaired.
The Group performs its annual impairment test of goodwill as at 31 December. For the purpose of impairment testing,
goodwill acquired in a business combination is, from the acquisition date, allocated to each of the Group’s cash-generating
units, or groups of cash-generating units, that are expected to benefit from the synergies of the combination, irrespective of
whether other assets or liabilities of the Group are assigned to those units or groups of units.

63Annual Report 2015
31 December 2015
Notes to the Consolidated Financial Statements (continued)
2.5 Summary of significant accounting policies (continued)
Business combination and goodwill (continued)
Impairment is determined by assessing the recoverable amount of the cash-generating unit (group of cash-generating units)
to which the goodwill relates. Where the recoverable amount of the cash-generating unit (group of cash-generating units) is
less than the carrying amount, an impairment loss is recognised. An impairment loss recognised for goodwill is not reversed in
a subsequent period.
Where goodwill has been allocated to a cash-generating unit (or group of cash-generating units) and part of the operation
within that unit is disposed of, the goodwill associated with the operation disposed of is included in the carrying amount of the
operation when determining the gain or loss on the disposal. Goodwill disposed of in these circumstances is measured based
on the relative value of the operation disposed of and the portion of the cash-generating unit retained.
Impairment of non-financial assets
Where an indication of impairment exists, or when annual impairment testing for an asset is required (other than inventories,
deferred tax assets, financial assets and non-current assets), the asset’s recoverable amount is estimated. An asset’s
recoverable amount is the higher of the asset’s or cash-generating unit’s value in use and its fair value less costs of disposal,
and is determined for an individual asset, unless the asset does not generate cash inflows that are largely independent of
those from other assets or groups of assets, in which case the recoverable amount is determined for the cash-generating unit
to which the asset belongs.
An impairment loss is recognised only if the carrying amount of an asset exceeds its recoverable amount. In assessing value
in use, the estimated future cash flows are discounted to their present value using a pre-tax discount rate that reflects current
market assessments of the time value of money and the risks specific to the asset. An impairment loss is charged to the
statement of profit or loss in the period in which it arises in those expense categories consistent with the function of the
impaired asset.
An assessment is made at the end of each reporting period as to whether there is an indication that previously recognised
impairment losses may no longer exist or may have decreased. If such an indication exists, the recoverable amount is
estimated. A previously recognised impairment loss of an asset other than goodwill is reversed only if there has been a change
in the estimates used to determine the recoverable amount of that asset, but not to an amount higher than the carrying
amount that would have been determined (net of any depreciation/amortisation) had no impairment loss been recognised for
the asset in prior years. A reversal of such an impairment loss is credited to the statement of profit or loss in the period in
which it arises.

64 Luye Pharma Group Ltd.
31 December 2015
Notes to the Consolidated Financial Statements (continued)
2.5 Summary of significant accounting policies (continued)
Foreign currencies
These financial statements are presented in RMB, which the Company adopted as the presentation currency of the Group.
The functional currency of the Company is the United States dollar (“US$”) and certain subsidiaries incorporated outside
Mainland China use the Singapore dollar (“SG$”), the Hong Kong dollar (“HK$”) and Malaysian Ringgit (“MYR”) as their
functional currencies. The functional currency of the subsidiaries established in Mainland China is RMB. Each entity in the
Group determines its own functional currency and items included in the financial statements of each entity are measured
using that functional currency. Foreign currency transactions recorded by the entities in the Group are initially recorded using
their respective functional currency rates prevailing at the dates of the transactions. Monetary assets and liabilities
denominated in foreign currencies are retranslated at the functional currency rates of exchange ruling at the reporting date.
Differences arising on settlement or translation of monetary items are recognised in the statement of profit or loss.
Non-monetary items that are measured in terms of historical cost in a foreign currency are translated using the exchange
rates at the dates of the initial transactions. Non-monetary items measured at fair value in a foreign currency are translated
using the exchange rates at the date when the fair value was determined. The gain or loss arising on translation of a non-
monetary item measured at fair value is treated in line with the recognition of the gain or loss on change in fair value of the
item (i.e., translation difference on the item whose fair value gain or loss is recognised in other comprehensive income or profit
or loss is also recognised in other comprehensive income or profit or loss, respectively).
The functional currencies of the non-PRC established subsidiaries are currencies other than the RMB. As at the end of the
reporting period, the assets and liabilities of these entities are translated into RMB at the exchange rates ruling at the end of
the reporting period and their statements of profit or loss are translated into RMB at the weighted average exchange rates for
the year.
The resulting exchange differences are recognised in other comprehensive income and accumulated as a separate
component of equity until the disposal of the respective foreign operation entities. On disposal of a foreign operation, the
component of other comprehensive income relating to that particular foreign operation is recognised in the statement of profit
or loss.
Any goodwill arising on the acquisition of a foreign operation and any fair value adjustments to the carrying amounts of assets
and liabilities arising on the acquisition are treated as assets and liabilities of the foreign operation and translated at the closing
rate.
For the purpose of the consolidated statement of cash flows, the cash flows of the non-PRC established subsidiaries are
translated into RMB at the exchange rates ruling at the dates of the cash flows. Frequently recurring cash flows of the non-
PRC established companies which arise throughout the year are translated into RMB at the weighted average exchange rates
for the year.

65Annual Report 2015
31 December 2015
Notes to the Consolidated Financial Statements (continued)
2.5 Summary of significant accounting policies (continued)
Revenue recognition
Revenue is recognised when it is probable that the economic benefits will flow to the Group and when the revenue can be
measured reliably, on the following bases:
(a) from the sale of goods, when the significant risks and rewards of ownership have been transferred to the buyer,
provided that the Group maintains neither managerial involvement to the degree usually associated with ownership, nor
effective control over the goods sold;
(b) from the rendering of services, on the percentage of completion basis, as further explained in accounting policy for “Contracts
for services” below;
(c) interest income, on an accrual basis using the effective interest method by applying the rate that exactly discounts the
estimated future cash receipts over the expected life of the financial instrument or a shorter period, when appropriate,
to the net carrying amount of the financial asset; and
(d) dividend income, when the shareholders’ right to receive payment has been established.
Contracts for services
Contract revenue on the rendering of services comprises the agreed contract amount. Costs of rendering services comprise
labour and other costs of personnel directly engaged in providing the services and attributable overheads.
Revenue from the rendering of services is recognised based on the percentage of completion of the transaction, provided that
the revenue, the costs incurred and the estimated costs to completion can be measured reliably. The percentage of
completion is established by reference to the costs incurred to date as compared to the total costs to be incurred under the
transaction. Where the outcome of a contract cannot be measured reliably, revenue is recognised only to the extent that the
expenses incurred are eligible to be recovered.
Provision is made for foreseeable losses as soon as they are anticipated by management. Where contract costs incurred to
date plus recognised profits less recognised losses exceed progress billings, the surplus is treated as an amount due from
contract customers. Where progress billings exceed contract costs incurred to date plus recognised profits less recognised
losses, the surplus is treated as an amount due to contract customers.

66 Luye Pharma Group Ltd.
31 December 2015
Notes to the Consolidated Financial Statements (continued)
2.5 Summary of significant accounting policies (continued)
Income tax
Income tax comprises current and deferred tax. Income tax relating to items recognised outside profit or loss is recognised
outside profit or loss, either in other comprehensive income or directly in equity.
Current tax assets and liabilities are measured at the amount expected to be recovered from or paid to the taxation
authorities, based on tax rates (and tax laws) that have been enacted or substantively enacted by the end of the reporting
period, taking into consideration interpretations and practices prevailing in the countries in which the Group operates.
Deferred tax is provided, using the liability method, on temporary differences at the end of the reporting period between the
tax bases of assets and liabilities and their carrying amounts for financial reporting purposes.
Deferred tax liabilities are recognised for all taxable temporary differences, except:
• where the deferred tax liability arises from the initial recognition of goodwill or an asset or liability in a transaction that is
not a business combination and, at the time of the transaction, affects neither the accounting profit nor taxable profit or
loss; and
• in respect of taxable temporary differences associated with investments in subsidiaries and an associate, when the
timing of the reversal of the temporary differences can be controlled and it is probable that the temporary differences
will not reverse in the foreseeable future.
Deferred tax assets are recognised for all deductible temporary differences, the carryforward of unused tax credits and any
unused tax losses. Deferred tax assets are recognised to the extent that it is probable that taxable profit will be available
against which the deductible temporary differences, and the carryforward of unused tax credits and unused tax losses can be
utilised, except:
• when the deferred tax asset relating to the deductible temporary difference arises from the initial recognition of an asset
or liability in a transaction that is not a business combination and, at the time of the transaction, affects neither the
accounting profit nor taxable profit or loss; and
• in respect of deductible temporary differences associated with investments in subsidiaries and an associate, deferred
tax assets are only recognised to the extent that it is probable that the temporary differences will reverse in the
foreseeable future and taxable profit will be available against which the temporary differences can be utilised.
The carrying amount of deferred tax assets is reviewed at the end of each reporting period and reduced to the extent that it is
no longer probable that sufficient taxable profit will be available to allow all or part of the deferred tax asset to be utilised.
Unrecognised deferred tax assets are reassessed at the end of each reporting period and are recognised to the extent that it
has become probable that sufficient taxable profit will be available to allow all or part of the deferred tax asset to be recovered.

67Annual Report 2015
31 December 2015
Notes to the Consolidated Financial Statements (continued)
2.5 Summary of significant accounting policies (continued)
Income tax (continued)
Deferred tax assets and liabilities are measured at the tax rates that are expected to apply to the period when the asset is
realised or the liability is settled, based on tax rates (and tax laws) that have been enacted or substantively enacted by the end
of the reporting period.
Deferred tax assets and deferred tax liabilities are offset if a legally enforceable right exists to set off current tax assets against
current tax liabilities and the deferred taxes relate to the same taxable entity and the same taxation authority.
Government grants
Government grants are recognised at their fair value where there is reasonable assurance that the grant will be received and
all attaching conditions will be complied with. When the grant relates to an expense item, it is recognised as income on a
systematic basis over the periods that the costs, which it is intended to compensate, are expensed.
Where the grant relates to an asset, the fair value is credited to a deferred income account and is released to the statement of
profit or loss over the expected useful life of the relevant asset by equal annual instalments or deducted from the carrying
amount of the asset and released to the statement of profit or loss by way of a reduced depreciation charge.
Other employee benefits
Pension schemeContributions made to the government retirement benefit fund under defined contribution retirement plans are charged to the
statement of profit or loss as incurred.
The Group participates in the national pension schemes as defined by the laws of the countries in which it has operations.
The Group make contributions to the Central Provident Fund (the “CPF”) Scheme in Singapore, a defined contribution pension
scheme, for its employees in Singapore.
The subsidiaries established and operating in Mainland China are required to provide certain staff pension benefits to their
employees under existing regulations of the PRC. Pension scheme contributions are provided at rates stipulated by PRC
regulations and are made to a pension fund managed by government agencies, which are responsible for administering the
contributions for the subsidiaries’ employees.
Investments and other financial assets
Initial recognition and measurementFinancial assets are classified, at initial recognition, as loans and receivables and available-for-sale investments, as
appropriate. When financial assets are recognised initially, they are measured at fair value plus transaction costs that are
attributable to the acquisition of the financial assets.
All regular way purchases and sales of financial assets are recognised on the trade date, that is, the date that the Group
commits to purchase or sell the asset. Regular way purchases or sales are purchases or sales of financial assets that require
delivery of assets within the period generally established by regulation or convention in the marketplace.

68 Luye Pharma Group Ltd.
31 December 2015
Notes to the Consolidated Financial Statements (continued)
2.5 Summary of significant accounting policies (continued)
Investments and other financial assets (continued)
Subsequent measurementThe subsequent measurement of financial assets depends on their classification as follows:
Loans and receivablesLoans and receivables are non-derivative financial assets with fixed or determinable payments that are not quoted in an active
market. After initial measurement, such assets are subsequently measured at amortised cost using the effective interest rate
method less any allowance for impairment. Amortised cost is calculated by taking into account any discount or premium on
acquisition and includes fees or costs that are an integral part of the effective interest rate method. The effective interest rate
amortisation is included in other income and gains in the statement of profit or loss. The loss arising from impairment is
recognised in the statement of profit or loss in finance costs for loans and in other expenses for receivables.
Available-for-sale investmentsAvailable-for-sale investments are non-derivative financial assets in listed and unlisted equity investments and debt securities.
Equity investments classified as available for sale are those which are neither classified as held for trading nor designated as
at fair value through profit or loss. Debt securities in this category are those which are intended to be held for an indefinite
period of time and which may be sold in response to needs for liquidity or in response to changes in market conditions.
After initial recognition, available-for-sale investments are subsequently measured at fair value, with unrealised gains or losses
recognised as other comprehensive income in the available-for-sale investment revaluation reserve until the investment is
derecognised, at which time the cumulative gain or loss is recognised in the statement of profit or loss in other income, or until
the investment is determined to be impaired, when the cumulative gain or loss is reclassified from the available-for-sale
investment revaluation reserve to the statement of profit or loss in other gains or losses. Interest and dividends earned whilst
holding the available-for-sale investments are reported as interest income and dividend income, respectively and are
recognised in the statement of profit or loss as other income in accordance with the policies set out for “Revenue recognition”
above.
When the fair value of unlisted equity investments cannot be reliably measured because (a) the variability in the range of
reasonable fair value estimates is significant for the investment, or (b) the probabilities of the various estimates within the range
cannot be reasonably assessed and used in estimating fair value, such investments are stated at cost less any impairment
losses.
The Group evaluates whether the ability and intention to sell its available-for-sale financial assets in the near term are still
appropriate. When, in rare circumstances, the Group is unable to trade these financial assets due to inactive markets, the
Group may elect to reclassify these financial assets, if management has the ability and intention to hold the assets for the
foreseeable future or until maturity.
For a financial asset reclassified from the available-for-sale category, the fair value carrying amount at the date of
reclassification becomes its new amortised cost and any previous gain or loss on that asset that has been recognised in
equity is amortised to profit or loss over the remaining life of the investment using the effective interest rate. Any difference
between the new amortised cost and the maturity amount is also amortised over the remaining life of the asset using the
effective interest rate. If the asset is subsequently determined to be impaired, then the amount recorded in equity is
reclassified to the statement of profit or loss.

69Annual Report 2015
31 December 2015
Notes to the Consolidated Financial Statements (continued)
2.5 Summary of significant accounting policies (continued)
Derecognition of financial assets
A financial asset (or, where applicable, a part of a financial asset or part of a group of similar financial assets) is primarily
derecognised (i.e., removed from the Group’s consolidated statement of financial position) when:
• the rights to receive cash flows from the asset have expired; or
• the Group has transferred its rights to receive cash flows from the asset or has assumed an obligation to pay the
received cash flows in full without material delay to a third party under a “pass-through” arrangement; and either (a) the
Group has transferred substantially all the risks and rewards of the asset, or (b) the Group has neither transferred nor
retained substantially all the risks and rewards of the asset, but has transferred control of the asset.
When the Group has transferred its rights to receive cash flows from an asset or has entered into a pass-through
arrangement, it evaluates if and to what extent it has retained the risk and rewards of ownership of the asset. When it has
neither transferred nor retained substantially all the risks and rewards of the asset nor transferred control of the asset, the
Group continues to recognise the transferred asset to the extent of the Group’s continuing involvement. In that case, the
Group also recognises an associated liability. The transferred asset and the associated liability are measured on a basis that
reflects the rights and obligations that the Group has retained.
Continuing involvement that takes the form of a guarantee over the transferred assets is measured at the lower of the original
carrying amount of the asset and the maximum amount of consideration that the Group could be required to repay.
Impairment of financial assets
The Group assesses at the end of each reporting period whether there is objective evidence that a financial asset or a group
of financial assets is impaired. An impairment exists if one or more events that occurred after the initial recognition of the asset
have an impact on the estimated future cash flows of the financial asset or the group of financial assets that can be reliably
estimated. Evidence of impairment may include indications that the debtors or a group of debtors is experiencing significant
financial difficulty, default or delinquency in interest or principal payments, the probability that they will enter bankruptcy or
other financial reorganisation and observable data indicating that there is a measurable decrease in the estimated future cash
flows, such as changes in arrears or economic conditions that correlate with defaults.
Financial assets carried at amortised costFor financial assets carried at amortised cost, the Group first assesses whether impairment exists individually for financial
assets that are individually significant, or collectively for financial assets that are not individually significant. If the Group
determines that no objective evidence of impairment exists for an individually assessed financial asset, whether significant or
not, it includes the asset in a group of financial assets with similar credit risk characteristics and collectively assesses them for
impairment. Assets that are individually assessed for impairment and for which an impairment loss is, or continues to be,
recognised are not included in a collective assessment of impairment.
The amount of any impairment loss identified is measured as the difference between the asset’s carrying amount and the
present value of estimated future cash flows (excluding future credit losses that have not been incurred). The present value of
the estimated future cash flows is discounted at the financial asset’s original effective interest rate (i.e. the effective interest
rate computed at initial recognition).

70 Luye Pharma Group Ltd.
31 December 2015
Notes to the Consolidated Financial Statements (continued)
2.5 Summary of significant accounting policies (continued)
Impairment of financial assets (continued)
Financial assets carried at amortised cost (continued)
The carrying amount of the asset is reduced through the use of an allowance account and the loss is recognised in the
statement of profit or loss. Interest income continues to be accrued on the reduced carrying amount using the rate of interest
used to discount the future cash flows for the purpose of measuring the impairment loss. Loans and receivables together with
any associated allowance are written off when there is no realistic prospect of future recovery and all collateral has been
realised or has been transferred to the Group.
If, in a subsequent period, the amount of the estimated impairment loss increases or decreases because of an event occurring
after the impairment was recognised, the previously recognised impairment loss is increased or reduced by adjusting the
allowance account. If a write-off is later recovered, the recovery is credited to administrative expenses in the statement of
profit or loss.
Assets carried at costIf there is objective evidence that an impairment loss has been incurred on an unquoted equity instrument that is not carried at
fair value because its fair value cannot be reliably measured, or on a derivative asset that is linked to and must be settled by
delivery of such an unquoted equity instrument, the amount of the loss is measured as the difference between the asset’s
carrying amount and the present value of estimated future cash flows discounted at the current market rate of return for a
similar financial asset. Impairment losses on these assets are not reversed.
Available-for-sale investmentsFor available-for-sale investments, the Group assesses at the end of each reporting period whether there is objective evidence
that an investment or a group of investments is impaired.
If an available-for-sale asset is impaired, an amount comprising the difference between its cost (net of any principal payment
and amortisation) and its current fair value, less any impairment loss previously recognised in the statement of profit or loss, is
removed from other comprehensive income and recognised in the statement of profit or loss.
In the case of equity investments classified as available for sale, objective evidence would include a significant or prolonged
decline in the fair value of an investment below its cost. “Significant” is evaluated against the original cost of the investment
and “prolonged” against the period in which the fair value has been below its original cost. Where there is evidence of
impairment, the cumulative loss — measured as the difference between the acquisition cost and the current fair value, less
any impairment loss on that investment previously recognised in the statement of profit or loss — is removed from other
comprehensive income and recognised in the statement of profit or loss. Impairment losses on equity investments classified
as available for sale are not reversed through the statement of profit or loss. Increases in their fair value after impairment are
recognised directly in other comprehensive income.
The determination of what is “significant” or “prolonged” required judgement. In making this judgement, the Group evaluates,
among other factors, the duration or extent to which the fair value of an investment is less than its cost.

71Annual Report 2015
31 December 2015
Notes to the Consolidated Financial Statements (continued)
2.5 Summary of significant accounting policies (continued)
Financial liabilities
Initial recognition and measurementFinancial liabilities are classified, at initial recognition, as loans and borrowings, as appropriate.
All financial liabilities are recognised initially at fair value and, in the case of loans and borrowings, net of directly attributable
transaction costs.
The Group’s financial liabilities include trade and other payables, amounts due to related parties and interest-bearing loans
and borrowings.
Subsequent measurementThe subsequent measurement of loans and borrowings is as follows:
After initial recognition, interest-bearing loans and borrowings are subsequently measured at amortised cost, using the
effective interest rate method unless the effect of discounting would be immaterial, in which case they are stated at cost.
Gains and losses are recognised in the statement of profit or loss when the liabilities are derecognised as well as through the
effective interest rate amortisation process.
Amortised cost is calculated by taking into account any discount or premium on acquisition and fees or costs that are an
integral part of the effective interest rate. The effective interest rate amortisation is included in finance costs in the statement of
profit or loss.
Derecognition of financial liabilities
A financial liability is derecognised when the obligation under the liability is discharged or cancelled, or expires.
When an existing financial liability is replaced by another from the same lender on substantially different terms, or the terms of
an existing liability are substantially modified, such an exchange or modification is treated as a derecognition of the original
liability and a recognition of a new liability, and the difference between the respective carrying amounts is recognised in the
statement of profit or loss.
Offsetting of financial instruments
Financial assets and financial liabilities are offset and the net amount is reported in the statement of financial position if there is
a currently enforceable legal right to offset the recognised amounts and there is an intention to settle on a net basis, or to
realise the assets and settle the liabilities simultaneously.

72 Luye Pharma Group Ltd.
31 December 2015
Notes to the Consolidated Financial Statements (continued)
2.5 Summary of significant accounting policies (continued)
Fair value measurement
The Group measures financial instruments at fair value at the end of each reporting period. Fair value is the price that would
be received to sell an asset or paid to transfer a liability in an orderly transaction between market participants at the
measurement date. The fair value measurement is based on the presumption that the transaction to sell the asset or transfer
the liability takes place either in the principal market for the asset or liability, or in the absence of a principal market, in the
most advantageous market for the asset or liability. The principal or the most advantageous market must be accessible by the
Group. The fair value of an asset or a liability is measured using the assumptions that market participants would use when
pricing the asset or liability, assuming that market participants act in their economic best interest.
A fair value measurement of a non-financial asset takes into account a market participant’s ability to generate economic
benefits by using the asset in its highest and best use or by selling it to another market participant that would use the asset in
its highest and best use.
The Group uses valuation techniques that are appropriate in the circumstances and for which sufficient data are available to
measure fair value, maximising the use of relevant observable inputs and minimising the use of unobservable inputs.
All assets and liabilities for which fair value is measured or disclosed in the financial statements are categorised within the fair
value hierarchy, described as follows, based on the lowest level input that is significant to the fair value measurement as a
whole:
Level 1 — based on quoted prices (unadjusted) in active markets for identical assets or liabilities
Level 2 — based on valuation techniques for which the lowest level input that is significant to the fair value measurement
is observable, either directly or indirectly
Level 3 — based on valuation techniques for which the lowest level input that is significant to the fair value measurement
is unobservable
For assets and liabilities that are recognised in the financial statements on a recurring basis, the Group determines whether
transfers have occurred between levels in the hierarchy by reassessing categorisation (based on the lowest level input that is
significant to the fair value measurement as a whole) at the end of each reporting period.

73Annual Report 2015
31 December 2015
Notes to the Consolidated Financial Statements (continued)
2.5 Summary of significant accounting policies (continued)
Property, plant and equipment and depreciation
Property, plant and equipment, other than construction in progress, are stated at cost less accumulated depreciation and any
impairment losses. When an item of property, plant and equipment is classified as held for sale or when it is part of a disposal
group classified as held for sale, it is not depreciated and is accounted for in accordance with IFRS 5, as further explained in
the accounting policy for “Non-current assets and disposal groups held for sale”. The cost of an item of property, plant and
equipment comprises its purchase price and any directly attributable costs of bringing the asset to its working condition and
location for its intended use.
Expenditure incurred after items of property, plant and equipment have been put into operation, such as repairs and
maintenance, is normally charged to the statement of profit or loss in the period in which it is incurred. In situations where the
recognition criteria are satisfied, the expenditure for a major inspection is capitalised in the carrying amount of the asset as a
replacement. Where significant parts of property, plant and equipment are required to be replaced at intervals, the Group
recognises such parts as individual assets with specific useful lives and depreciates them accordingly.
Depreciation is calculated on the straight-line basis to write off the cost of each item of property, plant and equipment to its
residual value over its estimated useful life. The estimated useful lives of property, plant and equipment are as follows:
Buildings 10–40 years
Machinery and equipment 5–10 years
Motor vehicles 5–10 years
Computer and office equipment 3–10 years
Leasehold improvements 2–5 years
Where parts of an item of property, plant and equipment have different useful lives, the cost of that item is allocated on a
reasonable basis among the parts and each part is depreciated separately. Residual values, useful lives and the depreciation
method are reviewed, and adjusted if appropriate, at least at each financial year end.
An item of property, plant and equipment including any significant part initially recognised is derecognised upon disposal or
when no future economic benefits are expected from its use or disposal. Any gain or loss on disposal or retirement recognised
in the statement of profit or loss in the year the asset is derecognised is the difference between the net sales proceeds and
the carrying amount of the relevant asset.
Construction in progress represents a building under construction, which is stated at cost less any impairment losses, and is
not depreciated. Cost comprises the direct costs of construction and capitalised borrowing costs on related borrowed funds
during the period of construction. Construction in progress is reclassified to the appropriate category of property, plant and
equipment when completed and ready for use.

74 Luye Pharma Group Ltd.
31 December 2015
Notes to the Consolidated Financial Statements (continued)
2.5 Summary of significant accounting policies (continued)
Non-current assets and disposal groups held for sale
Non-current assets and disposal groups are classified as held for sale if their carrying amounts will be recovered principally
through a sales transaction rather than through continuing use. For this to be the case, the asset or disposal group must be
available for immediate sale in its present condition subject only to terms that are usual and customary for the sale of such
assets or disposal groups and its sale must be highly probable. All assets and liabilities of a subsidiary classified as a disposal
group are reclassified as held for sale regardless of whether the Group retains a non-controlling interest in its former subsidiary
after the sale.
No-current assets and disposal groups (other than investment properties and financial assets) classified as held for sale are
measured at the lower of their carrying amounts and fair values less costs to sell. Property, plant and equipment and
intangible assets classified as held for sale are not depreciated or amortised.
Leases
Leases that transfer substantially all the rewards and risks of ownership of assets to the Group, other than legal title, are
accounted for as finance leases. At the inception of a finance lease, the cost of the leased asset is capitalised at the present
value of the minimum lease payments and recorded together with the obligation, excluding the interest element, to reflect the
purchase and financing. Assets held under capitalised finance leases, including prepaid land lease payments under finance
leases, are included in property, plant and equipment, and depreciated over the shorter of the lease terms and the estimated
useful lives of the assets. The finance costs of such leases are charged to the statement of profit or loss so as to provide a
constant periodic rate of charge over the lease terms.
Assets acquired through hire purchase contracts of a financing nature are accounted for as finance leases, but are
depreciated over their estimated useful lives.
Leases where substantially all the rewards and risks of ownership of assets remain with the lessor are accounted for as
operating leases. Where the Group is the lessor, assets leased by the Group under operating leases are included in non-
current assets, and rentals receivable under the operating leases are credited to the statement of profit or loss on the straight-
line basis over the lease terms. Where the Group is the lessee, rentals payable under operating leases net of any incentives
received from the lessor are charged to the statement of profit or loss on the straight-line basis over the lease terms.
Prepaid land lease payments under operating leases are initially stated at cost and subsequently recognised on the straight-
line basis over the lease terms.

75Annual Report 2015
31 December 2015
Notes to the Consolidated Financial Statements (continued)
2.5 Summary of significant accounting policies (continued)
Borrowing costs
Borrowing costs directly attributable to the acquisition, construction or production of qualifying assets, i.e., assets that
necessarily take a substantial period of time to get ready for their intended use or sale, are capitalised as part of the cost of
those assets. The capitalisation of such borrowing costs ceases when the assets are substantially ready for their intended use
or sale. Investment income earned on the temporary investment of specific borrowings pending their expenditure on qualifying
assets is deducted from the borrowing costs capitalised. All other borrowing costs are expensed in the period in which they
are incurred. Borrowing costs consist of interest and other costs that an entity incurs in connection with the borrowing of
funds.
Intangible assets (other than goodwill)
Intangible assets acquired separately are measured on initial recognition at cost. The cost of intangible assets acquired in a
business combination is the fair value at the date of acquisition. The useful lives of intangible assets are assessed to be either
finite or indefinite. Intangible assets with finite lives are subsequently amortised over the useful economic life and assessed for
impairment whenever there is an indication that the intangible asset may be impaired. The amortisation period and the
amortisation method for an intangible asset with a finite useful life are reviewed at least at each financial year end.
Intangible assets with indefinite useful lives are tested for impairment annually either individually or at the cash-generating unit
level. Such intangible assets are not amortised. The useful life of an intangible asset with an indefinite life is reviewed annually
to determine whether the indefinite life assessment continues to be supportable. If not, the change in the useful life
assessment from indefinite to finite is accounted for on a prospective basis.
Intangible assets are amortised on the straight-line basis over the following useful economic lives:
Trademarks 10 years
Patents and technology know-how 5–20 years
Software 2–10 years
Research and development costsAll research costs are charged to the statement of profit or loss as incurred.
Expenditure incurred on projects to develop new products is capitalised and deferred only when the Group can demonstrate
the technical feasibility of completing the intangible asset so that it will be available for use or sale, its intention to complete
and its ability to use or sell the asset, how the asset will generate future economic benefits, the availability of resources to
complete the project and the ability to measure reliably the expenditure during the development. Product development
expenditure which does not meet these criteria is expensed when incurred.

76 Luye Pharma Group Ltd.
31 December 2015
Notes to the Consolidated Financial Statements (continued)
2.5 Summary of significant accounting policies (continued)
Inventories
Inventories are stated at the lower of cost and net realisable value. Cost is determined on the first-in, first-out basis and, in the
case of work in progress and finished goods, comprises direct materials, direct labour and an appropriate proportion of
overheads. Net realisable value is based on estimated selling prices less any estimated costs to be incurred to completion and
disposal.
Costs incurred in bringing each product to its present location and condition are accounted for as follows:
Raw materials Purchase cost on a weighted average basis
Finished goods and work in progress Cost of direct materials and labour and a proportion of manufacturing
overheads based on normal operating capacity but excluding
borrowing costs
Dividends
Final dividends are recognised as a liability when they are approved by the shareholders in a general meeting. In prior years,
final dividends proposed by the directors were classified as a separate allocation of retained profits within the equity section of
the statement of financial position, until they have been approved by the shareholders in a general meeting. Following the
implementation of the Hong Kong Companies Ordinance (Cap. 622), proposed final dividends are disclosed in the notes to
the financial statements.
Cash and cash equivalents
For the purpose of the consolidated statement of cash flows, cash and cash equivalents comprise cash on hand and demand
deposits, and short-term highly liquid investments that are readily convertible into known amounts of cash, are subject to an
insignificant risk of changes in value, and have a short maturity of generally within three months when acquired, less bank
overdrafts which are repayable on demand and form an integral part of the Group’s cash management.
For the purpose of the consolidated statement of financial position, cash and cash equivalents comprise cash on hand and at
banks, including term deposits, which are not restricted as to use.

77Annual Report 2015
31 December 2015
Notes to the Consolidated Financial Statements (continued)
2.5 Summary of significant accounting policies (continued)
Provisions
A provision is recognised when a present obligation (legal or constructive) has arisen as a result of a past event and it is
probable that a future outflow of resources will be required to settle the obligation, provided that a reliable estimate can be
made of the amount of the obligation.
When the effect of discounting is material, the amount recognised for a provision is the present value at the end of the
reporting period of the future expenditures expected to be required to settle the obligation. The increase in the discounted
present value amount arising from the passage of time is included in finance costs in the statement of profit or loss.
Related parties
A party is considered to be related to the Group if:
(a) the party is a person or a close member of that person’s family and that person
(i) has control or joint control over the Group;
(ii) has significant influence over the Group; or
(iii) is a member of the key management personnel of the Group or of a parent of the Group;
or
(b) the party is an entity where any of the following conditions applies:
(i) the entity and the Group are members of the same group;
(ii) one entity is an associate or joint venture of the other entity (or of a parent, subsidiary or fellow subsidiary of the
other entity);
(iii) the entity and the Group are joint ventures of the same third party;
(iv) one entity is a joint venture of a third entity and the other entity is an associate of the third entity;
(v) the entity is a post-employment benefit plan for the benefit of employees of either the Group or an entity related
to the Group;
(vi) the entity is controlled or jointly controlled by a person identified in (a);
(vii) a person identified in (a)(i) has significant influence over the entity or is a member of the key management
personnel of the entity (or of a parent of the entity); and
(viii) the entity, or any member of a group of which it is a part, provides key management personnel services to the
Group or to the parent of the Group.

78 Luye Pharma Group Ltd.
31 December 2015
Notes to the Consolidated Financial Statements (continued)
3. Significant accounting judgements, estimates and assumptions
The preparation of the Group’s financial statements requires management to make significant judgements, estimates and
assumptions that affect the reported amounts of revenues, expenses, assets and liabilities, and their accompanying
disclosures, and the disclosure of contingent liabilities. Uncertainty about these assumptions and estimates could result in
outcomes that could require a material adjustment to the carrying amounts of the assets or liabilities affected in the future.
Judgements
There is no significant effect on the amounts recognised in the financial statements arising from the judgements, apart from
those involving estimations, made by management in the process of applying the Group’s accounting policies.
Estimation and assumptions
The key assumptions concerning the future and other key sources of estimation uncertainty at the end of the reporting period,
that have a significant risk of causing a material adjustment to the carrying amounts of assets and liabilities within the next
financial year, are described below.
Impairment of goodwillThe Group determines whether goodwill is impaired at least on an annual basis. This requires an estimation of the value in use
of the cash-generating units to which the goodwill is allocated. Estimating the value in use requires the Group to make an
estimate of the expected future cash flows from the cash-generating units and also to choose a suitable discount rate in order
to calculate the present value of those cash flows. The carrying amount of goodwill at 31 December 2015 was
RMB347,356,000 (2014: RMB347,356,000). Further details are given in note 15.
Impairment of non-financial assets (other than goodwill)The Group assesses whether there are any indicators of impairment for all non-financial assets at the end of each reporting
period. Indefinite life intangible assets are tested for impairment annually and at other times when such an indicator exists.
Other non-financial assets are tested for impairment when there are indicators that the carrying amounts may not be
recoverable. An impairment exists when the carrying value of an asset or a cash-generating unit exceeds its recoverable
amount, which is the higher of its fair value less costs of disposal and its value in use. The calculation of the fair value less
costs of disposal is based on available data from binding sales transactions in an arm’s length transaction of similar assets or
observable market prices less incremental costs for disposing of the asset. When value in use calculations are undertaken,
management must estimate the expected future cash flows from the asset or cash-generating unit and choose a suitable
discount rate in order to calculate the present value of those cash flows.

79Annual Report 2015
31 December 2015
Notes to the Consolidated Financial Statements (continued)
3. Significant accounting judgements, estimates and assumptions (continued)
Estimation and assumptions (continued)
Deferred tax assetsDeferred tax assets are recognised for unused tax losses and deductible temporary differences to the extent that it is probable
that taxable profit will be available against which the losses and deductible temporary differences can be utilised. Significant
management judgement is required to determine the amount of deferred tax assets that can be recognised, based upon the
likely timing and level of future taxable profits together with future tax planning strategies. The carrying amount of deferred tax
assets relating to recognised tax losses at 31 December 2015 was RMB994,000 (2014: Nil). The carrying amount of deferred
tax assets relating to recognised deductible temporary differences at 31 December 2015 was RMB68,383,000 (2014:
RMB83,259,000). Further details are contained in note 28.
Income taxThe Group is subject to income taxes in various regions. As a result, certain matters relating to the income taxes have not
been confirmed by the local tax bureau, objective estimates and judgements based on currently enacted tax laws, regulations
and other related policies are required in determining the provision for corporate income taxes. Where the final tax outcome of
these matters is different from the amounts originally recorded, the differences will impact on the corporate income tax and
tax provisions over the period in which the differences are realised.
Impairment of trade and other receivablesImpairment of trade and other receivables is made based on an assessment of the recoverability of trade and other
receivables. The identification of impairment requires management’s judgements and estimates. Where the actual outcome is
different from the original estimate, such differences will impact on the carrying values of the trade and other receivables and
impairment loss over the period in which such estimate has been changed. The provision for impairment of trade and other
receivables at 31 December 2015 was RMB5,124,000 (2014: RMB3,865,000).
Useful lives of property, plant and equipmentThe Group’s management determines the estimated useful lives and related depreciation charges for its property, plant and
equipment. This estimate is based on the historical experience of the actual useful lives of property, plant and equipment of
similar nature and functions. It could change significantly as a result of technical innovations and competitor actions in
response to severe industry cycles. Management will increase the depreciation charge where useful lives are less than
previously estimated lives, or management will write off or write down technically obsolete or non-strategic assets that have
been abandoned.
4. Operating segment information
The Group manages its businesses by type of products. The Group’s chief operating decision maker is the Chief Executive
Officer, who reviews revenue from and results of the major type of products sold for the purpose of resource allocation and
assessment of segment performance. Segment result is evaluated based on gross profit less selling expenses allocated. No
analysis of the Group’s assets and liabilities by operating segment is disclosed as it is not regularly provided to the chief
operating decision maker for review.

80 Luye Pharma Group Ltd.
31 December 2015
Notes to the Consolidated Financial Statements (continued)
4. Operating segment information (continued)
Year ended 31 December 2015
Oncologydrugs
Cardio-vascular
systemdrugs
Alimentarytract and
metabolismdrugs Others Total
RMB’000 RMB’000 RMB’000 RMB’000 RMB’000
Segment revenueExternal customers 1,395,446 621,348 468,146 78,189 2,563,129
Total revenue 1,395,446 621,348 468,146 78,189 2,563,129
Segment results 657,296 239,462 203,356 23,201 1,123,315
Other income and gains 165,132Administrative expenses (184,821)Other expenses (190,164 )Finance costs (15,606)Share of profit of an associate 276
Profit before tax 898,132
Year ended 31 December 2014
Oncologydrugs
Cardio-vascularsystem
drugs
Alimentarytract and
metabolismdrugs Others Total
RMB’000 RMB’000 RMB’000 RMB’000 RMB’000(Restated) (Restated) (Restated) (Restated) (Restated)
Segment revenueExternal customers 1,319,255 660,586 443,761 120,384 2,543,986
Total revenue 1,319,255 660,586 443,761 120,384 2,543,986
Segment results 598,993 253,827 174,083 28,319 1,055,222
Other income and gains 98,375Administrative expenses (194,984 )Other expenses (193,786 )Finance costs (39,661)Share of profit of an associate 348
Profit before tax 725,514

81Annual Report 2015
31 December 2015
Notes to the Consolidated Financial Statements (continued)
4. Operating segment information (continued)
Geographic information
(a) Revenue from external customers
2015 2014
RMB’000 RMB’000
(Restated)
Mainland China 2,546,373 2,520,383
Other countries 16,756 23,603
Total 2,563,129 2,543,986
The revenue information above is based on the locations of the customers. No revenue from the Group’s sales to a
single customer amounted to 10% or more of the Group’s revenue during the years ended 31 December 2015 and
2014.
(b) Non-current assets
2015 2014
RMB’000 RMB’000
Mainland China 1,902,785 2,513,601
Other countries 5,974 5,699
Total 1,908,759 2,519,300
The non-current asset information above is based on the locations of the assets and excludes financial instruments and
deferred tax assets.

82 Luye Pharma Group Ltd.
31 December 2015
Notes to the Consolidated Financial Statements (continued)
5. Revenue, other income and gains
Revenue, represents the net invoiced value of goods sold, after allowances for returns and trade discounts during the year.
An analysis of revenue, other income and gains is as follows:
2015 2014
RMB’000 RMB’000
(Restated)
Revenue
Sale of drugs 2,621,019 2,601,265
Less: Business tax and government surcharges (57,890) (57,279)
2,563,129 2,543,986
Other income and gains
Bank interest income 21,776 25,175
Government grants 62,904 46,959
Investment income 76,895 15,892
Foreign exchange gain, net — 8,780
Others 3,557 1,569
165,132 98,375

83Annual Report 2015
31 December 2015
Notes to the Consolidated Financial Statements (continued)
6. Profit before tax
The Group’s profit before tax is arrived at after charging/(crediting):
2015 2014
Notes RMB’000 RMB’000
Depreciation of items of property, plant and equipment 13 86,280 79,813
Amortisation of other intangible assets* 16 23,657 25,491
Amortisation of prepaid land lease payments** 14 5,272 5,141
Amortisation of long-term deferred expenditure** — 292
Provision/(reversal of provision) for impairment of trade receivables 20 1,458 (503)
Reversal of provision for impairment of other receivables 21 — (600)
Listing expenses — 32,749
Operating lease expenses 15,827 11,503
Auditors’ remuneration 4,860 7,360
Employee benefit expenses (excluding directors’ remuneration):
Wages and salaries 276,091 276,352
Pension scheme contributions 59,851 54,350
Central Provident Fund in Singapore 329 348
Staff welfare expenses 20,126 25,452
356,397 356,502
Other expenses:
Research and development costs 170,439 182,332
Foreign exchange loss, net 16,139 —
Donation 3,288 6,587
Loss on disposal of items of property, plant and equipment — 3,966
Others 298 901
190,164 193,786

84 Luye Pharma Group Ltd.
31 December 2015
Notes to the Consolidated Financial Statements (continued)
6. Profit before tax (continued)
The Group’s profit before tax is arrived at after charging/(crediting): (continued)
2015 2014
RMB’000 RMB’000
Cost of inventories sold*** 475,717 482,505
The “Cost of sales” amount includes the following expenses which are also
included in the respective total amounts of the items disclosed above:
Depreciation 67,716 59,604
Amortisation of other intangible assets* 23,017 25,032
Staff costs 117,741 113,609
* The amortisation of trademarks, patents and technology know-how is included in “Cost of sales” on the face of the consolidated statement of
profit or loss.
The amortisation of software is included in “Administrative expenses” on the face of the consolidated statement of profit or loss.
** The amortisation of prepaid land lease payments and long-term deferred expenditure is included in “Administrative expenses” on the face of the
consolidated statement of profit or loss.
*** The write-down of inventories to net realisable value of RMB965,000 for the year ended 31 December 2015 (2014: RMB2,605,000) is included in
“Cost of sales” on the face of the consolidated statement of profit or loss.
7. Finance costs
2015 2014
RMB’000 RMB’000
Interest on bank loans 15,576 39,513
Finance charges payable under a hire purchase contract 30 32
Total interest expense 15,606 39,545
Others — 116
15,606 39,661

85Annual Report 2015
31 December 2015
Notes to the Consolidated Financial Statements (continued)
8. Directors’ and chief executive’s remuneration
Directors’ and chief executive’s remuneration for the year, disclosed pursuant to the Listing Rules, section 383(1)(a), (b), (c)
and (f) of the Hong Kong Companies Ordinance and Part 2 of the Companies (Disclosure of Information about Benefits of
Directors) Regulation, is as follows:
2015 2014
RMB’000 RMB’000
Fees 1,063 621
Other emoluments:
Salaries, allowances and benefits in kind 4,673 4,677
Performance related bonuses 797 810
Pension scheme contributions 194 178
5,664 5,665
6,727 6,286
Independent non-executive directors
The fees paid to independent non-executive directors during the year were as follows:
2015 2014
RMB’000 RMB’000
Choy Sze Chung Jojo 253 148
Leung Man Kit 304 177
Lo Yuk Lam 253 148
Zhang Hua Qiao 253 148
1,063 621
There were no other emoluments payable to the independent non-executive directors during the year (2014: Nil).

86 Luye Pharma Group Ltd.
31 December 2015
Notes to the Consolidated Financial Statements (continued)
8. Directors’ and chief executive’s remuneration (continued)
Executive directors and non-executive directors
Fees
Salaries,allowances
and benefitsin kind
Performancerelated
bonuses
Pensionscheme
contributionsTotal
remunerationRMB’000 RMB’000 RMB’000 RMB’000 RMB’000
2015
Executive directors:Liu Dian Bo — 2,603 420 54 3,077Yang Rong Bing — 1,084 200 54 1,338Yuan Hui Xian — 693 108 5 806Zhu Yuan Yuan — 293 69 81 443
— 4,673 797 194 5,664
Non-executive directors:Liu Dong — — — — —Wang Xin — — — — —Pan Jian — — — — —
— — — — —
2014
Executive directors:Liu Dian Bo — 2,742 420 49 3,211Yang Rong Bing — 1,099 200 49 1,348Yuan Hui Xian — 594 120 5 719Zhu Yuan Yuan — 242 70 75 387
— 4,677 810 178 5,665
Non-executive directors:Liu Dong — — — — —Wang Xin — — — — —Pan Jian — — — — —
— — — — —
There was no arrangement under which a director or the chief executive waived or agreed to waive any remuneration during
the year.
Liu Dian Bo is the chief executive officer and an executive director of the Group.
The directors did not receive any emoluments from the Group as an inducement to join or upon joining the Group or as
compensation for loss of office during the year (2014: Nil).

87Annual Report 2015
31 December 2015
Notes to the Consolidated Financial Statements (continued)
9. Five highest paid employees
The five highest paid employees of the Group during the year included 2 directors (2014: 2), details of whose remuneration
are set out in note 8 above. Details of the remuneration for the year of the remaining 3 (2014: 3) highest paid employees who
are neither a director nor chief executive of the Company are as follows:
2015 2014
RMB’000 RMB’000
Salaries, allowances and benefits in kind 2,999 2,661
Performance related bonuses 848 957
Pension scheme contributions 138 100
3,985 3,718
The number of the non-director and non-chief executive highest paid employees whose remuneration fell within the following
bands is as follows:
Number of employees
2015 2014
Nil to HK$1,000,000 — —
HK$1,000,001 to HK$1,500,000 1 1
HK$1,500,001 to HK$2,000,000 2 2
3 3

88 Luye Pharma Group Ltd.
31 December 2015
Notes to the Consolidated Financial Statements (continued)
10. Income tax
The Group is subject to income tax on an entity basis on profits arising in or derived from the jurisdictions in which members
of the Group are domiciled and operate.
Pursuant to the rules and regulations of Bermuda, the BVI and the Cayman Islands, the Group is not subject to any income
tax in these jurisdictions.
Pursuant to the relevant tax law of the Hong Kong Special Administrative Region, Hong Kong profits tax has been provided at
the rate of 16.5% (2014: 16.5%) on the estimated assessable profits arising in Hong Kong during the year. No provision for
income tax has been made as the Group did not generate any assessable profits in Hong Kong during the year (2014: Nil).
Pursuant to the rules and regulations of Singapore and Malaysia, the Group is subject to 17% and 25% of taxable income in
Singapore and Malaysia, respectively.
Pursuant to the rules and regulations of the USA, no provision for income tax has been made as the Group did not generate
any taxable income in the USA during the year.
The provision for Mainland China current income tax is based on the statutory rate of 25% of the assessable profits of certain
PRC subsidiaries of the Group as determined in accordance with the PRC Corporate Income Tax Law which was approved
and became effective on 1 January 2008, except for certain subsidiaries of the Group in Mainland China which are granted
tax concession and are taxed at preferential tax rates.
Shandong Luye, Nanjing Luye, WPU, Sichuan Baoguang and Nanjing Kanghai Phospholipid are qualified as High and New
Technology Enterprises and were subject to a preferential income tax rate of 15% during the year.
Nanjing AIGE is exempted from income tax as it is involved in the production and trading of agricultural products.
2015 2014
RMB’000 RMB’000
Current tax:
Income tax charge 126,818 113,972
Adjustments in respect of income tax of previous years (1,617) 2,663
Deferred tax (note 28) 8,232 (5,567)
Total tax charge for the year 133,433 111,068
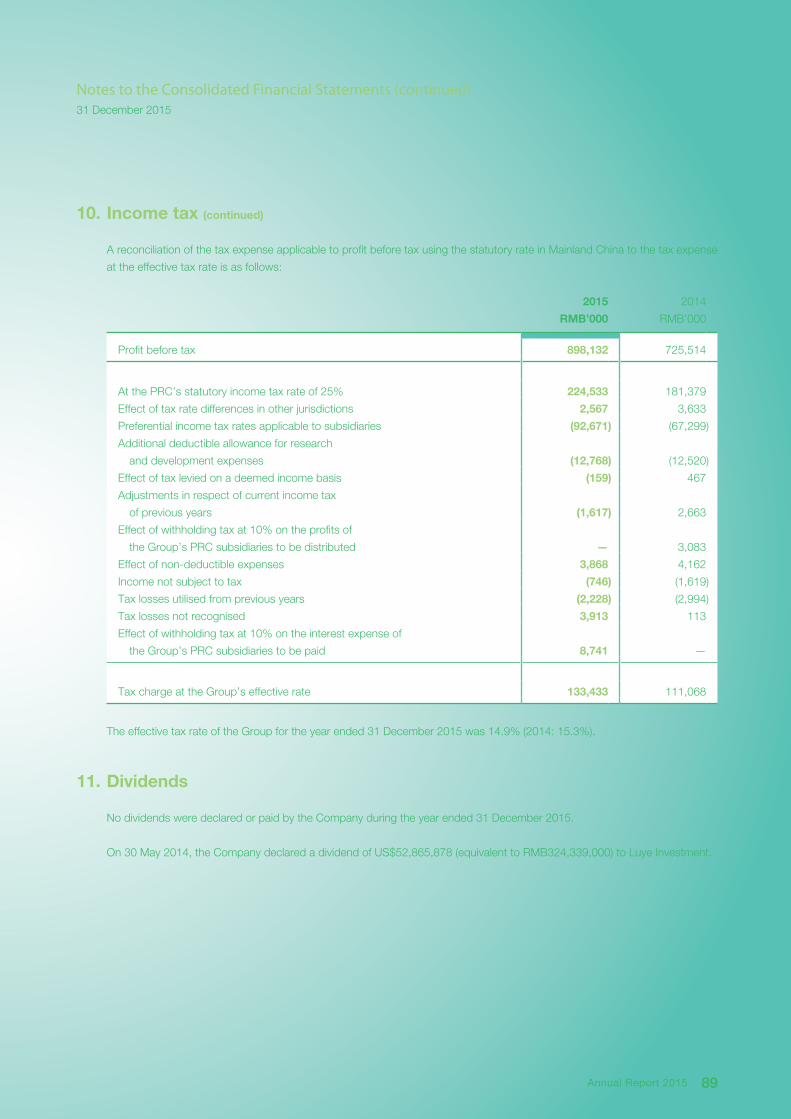
89Annual Report 2015
31 December 2015
Notes to the Consolidated Financial Statements (continued)
10. Income tax (continued)
A reconciliation of the tax expense applicable to profit before tax using the statutory rate in Mainland China to the tax expense
at the effective tax rate is as follows:
2015 2014
RMB’000 RMB’000
Profit before tax 898,132 725,514
At the PRC’s statutory income tax rate of 25% 224,533 181,379
Effect of tax rate differences in other jurisdictions 2,567 3,633
Preferential income tax rates applicable to subsidiaries (92,671) (67,299)
Additional deductible allowance for research
and development expenses (12,768) (12,520)
Effect of tax levied on a deemed income basis (159) 467
Adjustments in respect of current income tax
of previous years (1,617) 2,663
Effect of withholding tax at 10% on the profits of
the Group’s PRC subsidiaries to be distributed — 3,083
Effect of non-deductible expenses 3,868 4,162
Income not subject to tax (746) (1,619)
Tax losses utilised from previous years (2,228) (2,994)
Tax losses not recognised 3,913 113
Effect of withholding tax at 10% on the interest expense of
the Group’s PRC subsidiaries to be paid 8,741 —
Tax charge at the Group’s effective rate 133,433 111,068
The effective tax rate of the Group for the year ended 31 December 2015 was 14.9% (2014: 15.3%).
11. Dividends
No dividends were declared or paid by the Company during the year ended 31 December 2015.
On 30 May 2014, the Company declared a dividend of US$52,865,878 (equivalent to RMB324,339,000) to Luye Investment.

90 Luye Pharma Group Ltd.
31 December 2015
Notes to the Consolidated Financial Statements (continued)
12. Earnings per share attributable to ordinary equity holders of the parent
The calculation of the basic earnings per share amount is based on the profit for the year attributable to ordinary equity
holders of the parent, and the weighted average number of ordinary shares of 3,321,073,843 (2014: 2,994,929,593) in issue
during the year.
The following reflects the income and share data used in the basic earnings per share computation:
2015 2014
RMB’000 RMB’000
Earnings
Profit attributable to equity holders of the parent 754,523 605,524
Number of shares
2015 2014
Shares
Weighted average number of shares in issue during the year 3,321,073,843 2,994,929,593
No adjustment has been made to the basic earnings per share amounts presented for the years ended 31 December 2015
and 2014 in respect of a dilution as the Group had no potentially dilutive ordinary shares in issue during the year.

91Annual Report 2015
31 December 2015
Notes to the Consolidated Financial Statements (continued)
13. Property, plant and equipment
Buildings
Machinery
and
equipment
Motor
vehicles
Computer
and office
equipment
Leasehold
improvements
Construction
in progress Total
RMB’000 RMB’000 RMB’000 RMB’000 RMB’000 RMB’000 RMB’000
31 December 2015
At 1 January 2015:
Cost 524,622 593,474 17,508 59,938 — 186,839 1,382,381
Accumulated depreciation
and impairment (77,231) (182,496) (6,171) (24,332) — — (290,230)
Net carrying amount 447,391 410,978 11,337 35,606 — 186,839 1,092,151
At 1 January 2015, net of
accumulated depreciation
and impairment 447,391 410,978 11,337 35,606 — 186,839 1,092,151
Additions 17 69,282 2,695 9,554 7,073 102,720 191,341
Disposals (358) (350) (206) (36) — — (950)
Depreciation provided
during the year (19,719) (55,163) (2,196) (8,694) (508) — (86,280)
Transfers 12,888 54,002 — 1,070 — (67,960) —
At 31 December 2015, net of
accumulated depreciation
and impairment 440,219 478,749 11,630 37,500 6,565 221,599 1,196,262
At 31 December 2015:
Cost 534,447 693,188 18,812 69,334 7,073 221,599 1,544,453
Accumulated depreciation
and impairment (94,228) (214,439) (7,182) (31,834) (508) — (348,191)
Net carrying amount 440,219 478,749 11,630 37,500 6,565 221,599 1,196,262

92 Luye Pharma Group Ltd.
31 December 2015
Notes to the Consolidated Financial Statements (continued)
13. Property, plant and equipment (continued)
Buildings
Machinery
and
equipment
Motor
vehicles
Computer
and office
equipment
Leasehold
improvements
Construction
in progress Total
RMB’000 RMB’000 RMB’000 RMB’000 RMB’000 RMB’000 RMB’000
31 December 2014
At 1 January 2014:
Cost 517,640 556,549 17,254 53,866 — 13,356 1,158,665
Accumulated depreciation
and impairment (61,025) (149,478) (4,823) (17,515) — — (232,841)
Net carrying amount 456,615 407,071 12,431 36,351 — 13,356 925,824
At 1 January 2014, net of
accumulated depreciation
and impairment 456,615 407,071 12,431 36,351 — 13,356 925,824
Additions 9,313 37,038 1,221 5,096 — 221,782 274,450
Disposals (3,398) (23,919) (83) (910) — — (28,310)
Depreciation provided
during the year (19,791) (50,267) (2,232) (7,523) — — (79,813)
Transfers 4,652 41,055 — 2,592 — (48,299) —
At 31 December 2014, net of
accumulated depreciation
and impairment 447,391 410,978 11,337 35,606 — 186,839 1,092,151
At 31 December 2014:
Cost 524,622 593,474 17,508 59,938 — 186,839 1,382,381
Accumulated depreciation
and impairment (77,231) (182,496) (6,171) (24,332) — — (290,230)
Net carrying amount 447,391 410,978 11,337 35,606 — 186,839 1,092,151
As at 31 December 2015, the Group is applying for certificates of ownership for certain properties with a net book value of
RMB1,519,000 (2014: RMB1,570,000). The directors of the Company are of the opinion that the use of the properties and
the conduct of operating activities at those properties referred to above are not affected by the fact the Group had not yet
obtained the relevant property title certificates. The Group is not able to assign, transfer or mortgage these assets until these
certificates are obtained.

93Annual Report 2015
31 December 2015
Notes to the Consolidated Financial Statements (continued)
14. Prepaid land lease payments
2015 2014
RMB’000 RMB’000
Carrying amount at 1 January 196,446 189,302
Additions — 12,285
Recognised (5,272) (5,141)
Carrying amount at 31 December 191,174 196,446
Current portion included in prepayments, deposits and other receivables (5,361) (2,253)
Non-current portion 185,813 194,193
15. Goodwill
2015 2014
RMB’000 RMB’000
Carrying amount at 1 January and 31 December 347,356 347,356
There was no impairment charge made against goodwill for the year (2014: Nil).
Impairment testing of goodwill
Goodwill acquired through business combinations has been allocated to six individual cash-generating units for impairment
testing as follows:
(a) CMNa cash-generating unit (“CMNa unit”), which relates to CMNa, one of the Group’s key products;
(b) Pharmaceutical products other than CMNa cash-generating unit (“Other products unit”), which relates to Maitongna
and Lutingnuo, of which Maitongna is one of the Group’s key products;
(c) Solid Success Group cash-generating unit (“SSL unit”), which relates to Lipusu and Tiandixin, of which Lipusu is one of
the Group’s key products;
(d) Luye Pharma (Singapore) Pte. Ltd. (“LPPL”) cash-generating unit (“LPPL unit”), which relates to HypoCol;
(e) WPU cash-generating unit (“WPU unit”), which relates to Xuezhikang, one of the Group’s key products; and
(f) Sichuan Baoguang cash-generating unit (“SB unit”), which relates to Bei Xi, one of the Group’s key products.

94 Luye Pharma Group Ltd.
31 December 2015
Notes to the Consolidated Financial Statements (continued)
15. Goodwill (continued)
Impairment testing of goodwill (continued)
The carrying amount of goodwill allocated to each of the cash-generating units is as follows:
2015 2014
RMB’000 RMB’000
CMNa unit 38,444 38,444
Other products unit 5,954 5,954
SSL unit 114,185 114,185
LPPL unit 7,353 7,353
WPU unit 22,276 22,276
SB unit 159,144 159,144
347,356 347,356
The recoverable amounts of the cash-generating units have been determined based on a value in use calculation using cash
flow projections based on financial budgets approved by senior management covering a five-year period for all units. The pre-
tax discount rate applied to cash flow projections was 15% (2014: 15%) and the growth rate beyond the five-year period had
been projected as 3% (2014: 3%).
Key assumptions used in the value in use calculationThe calculation of value in use is based on assumptions of the following:
• Gross margins and operating expenses
• Discount rate
• Growth rate
Gross margins and operating expenses — Gross margins are based on the average gross margins achieved in the year
immediately before the budget year and are increased over the budget period for anticipated efficiency improvements.
Estimates on operating expenses reflect past experience and management’s commitment to maintain them at an acceptable
level.
Discount rate — the rate reflects management’s estimate of the risks specific to each unit.
Growth rate — the rate is based on published industry research.

95Annual Report 2015
31 December 2015
Notes to the Consolidated Financial Statements (continued)
16. Other intangible assets
Trademarks
Patents and
technology
know-how Software Total
RMB’000 RMB’000 RMB’000 RMB’000
31 December 2015
At 1 January 2015:
Cost 41,971 370,434 5,586 417,991
Accumulated amortisation (17,690) (252,831) (1,582) (272,103)
Net carrying amount 24,281 117,603 4,004 145,888
Cost at 1 January 2015,
net of accumulated amortisation 24,281 117,603 4,004 145,888
Additions — 14 3,971 3,985
Amortisation provided during the year (3,179) (19,838) (640) (23,657)
At 31 December 2015 21,102 97,779 7,335 126,216
At 31 December 2015:
Cost 41,971 357,636 9,222 408,829
Accumulated amortisation (20,869) (259,857) (1,887) (282,613)
Net carrying amount 21,102 97,779 7,335 126,216

96 Luye Pharma Group Ltd.
31 December 2015
Notes to the Consolidated Financial Statements (continued)
16. Other intangible assets (continued)
Trademarks
Patents and
Technology
know-how Software Total
RMB’000 RMB’000 RMB’000 RMB’000
31 December 2014
At 1 January 2014:
Cost 41,971 336,626 4,316 382,913
Accumulated amortisation (14,467) (231,022) (1,123) (246,612)
Net carrying amount 27,504 105,604 3,193 136,301
Cost at 1 January 2014,
net of accumulated amortisation 27,504 105,604 3,193 136,301
Additions — 33,808 1,270 35,078
Amortisation provided during the year (3,223) (21,809) (459) (25,491)
At 31 December 2014 24,281 117,603 4,004 145,888
At 31 December 2014:
Cost 41,971 370,434 5,586 417,991
Accumulated amortisation (17,690) (252,831) (1,582) (272,103)
Net carrying amount 24,281 117,603 4,004 145,888

97Annual Report 2015
31 December 2015
Notes to the Consolidated Financial Statements (continued)
17. Investment in an associate
2015 2014
RMB’000 RMB’000
At 1 January 5,485 5,323
Share of profit (1,060) 348
Foreign currency translation differences (75) (186)
At 31 December 4,350 5,485
The Group’s trade receivable balance with the associate is disclosed in note 34 to the financial statements.
Particulars of the associate are as follows:
Company
Place of
incorporation/
registration
and business
Issued ordinary/
registered
share capital
Percentage
of ownership
interest
attributable to
the Group Principal activities
Steward Cross Pte. Ltd.
(“Steward Cross”)
Singapore SG$620,002 36 Distribution and sale of
pharmaceutical drugs
The Group’s shareholdings in this associate all comprise equity shares held through a wholly-owned subsidiary of the
Company.
The following table illustrates the financial information of the Group’s associate that is not individually material:
2015 2014
RMB’000 RMB’000
Share of the associate’s profit for the year 276 348
Share of the associate’s total comprehensive income 276 348
Carrying amount of the Group’s investment in the associate 4,350 5,485
As at 31 December 2015, the unrealised profit from the related party transaction between Steward Cross and LPPL was
RMB1,336,000 (31 December 2014: RMB544,000).

98 Luye Pharma Group Ltd.
31 December 2015
Notes to the Consolidated Financial Statements (continued)
18. Available-for-sale investments
2015 2014
RMB’000 RMB’000
Current
Investment in bank financial products, at fair value 1,402,118 1,845,392
Non-current
Listed equity investment, at fair value 2,842 1,742
Unlisted investment, at cost 500 500
3,342 2,242
Current available-for-sale investments were structured financial products issued by banks with expected interest rates ranging
from 2.6% to 4.0% per annum with a maturity period within one year in the PRC. The principals are all protected. The fair
values of the financial products approximate to their costs plus expected interest.
Non-current available-for-sale financial assets consist of investments in ordinary shares, and therefore have no fixed maturity
date or coupon date.
The fair value of the listed equity investment is derived from quoted price in an active market.
The fair value of unlisted investment cannot be reliably measured because (a) the variability in the range of reasonable fair
value estimates is significant for the investment, and (b) the probabilities of the various estimates within the range cannot be
reasonably assessed and used in estimating fair value. The investment was stated at cost less any impairment losses.
19. Inventories
2015 2014
RMB’000 RMB’000
Raw materials 117,214 108,431
Work in progress 61,989 60,523
Finished goods 106,406 82,244
285,609 251,198

99Annual Report 2015
31 December 2015
Notes to the Consolidated Financial Statements (continued)
20. Trade and notes receivables
2015 2014
RMB’000 RMB’000
Trade receivables 622,554 633,867
Notes receivable 572,673 281,128
1,195,227 914,995
Less: Impairment of trade receivables (2,124) (865)
1,193,103 914,130
The Group’s trading terms with its customers are mainly on credit. The credit period is generally one month to three months,
extending up to six months for major customers. The Group seeks to maintain strict control over its outstanding receivables
and overdue balances are reviewed regularly by senior management. In view of the aforementioned and the fact that the
Group’s trade receivables relate to large number of diversified customers, there is no significant concentration of credit risk.
Trade receivables are non-interest-bearing.
Movements in the provision for impairment of trade receivables were as follows:
Individually
impaired
Collectively
impaired Total
RMB’000 RMB’000 RMB’000
At 1 January 2015 445 420 865
Charge for the year — 2,071 2,071
Reversal — (613) (613)
Write-off (199) — (199)
At 31 December 2015 246 1,878 2,124
At 1 January 2014 1,538 654 2,192
Charge for the year 33 65 98
Reversal (302) (299) (601)
Write-off (824) — (824)
At 31 December 2014 445 420 865

100 Luye Pharma Group Ltd.
31 December 2015
Notes to the Consolidated Financial Statements (continued)
20. Trade and notes receivables (continued)
An aged analysis of the trade receivables as at the end of the reporting period, based on the invoice date, is as follows:
2015 2014
RMB’000 RMB’000
Less than 3 months 530,615 564,098
Between 3 and 6 months 50,876 47,432
Between 6 and 12 months 37,347 20,090
Between 1 and 2 years 2,145 791
Over 2 years 1,571 1,456
622,554 633,867
The aged analysis of the trade receivables that are not individually nor collectively considered to be impaired is as follows:
2015 2014
RMB’000 RMB’000
Neither past due nor impaired 515,336 625,798
Less than 3 months past due 91,986 5,822
Over 3 months past due 13,108 1,382
620,430 633,002
Trade receivables that were neither past due nor impaired relate to a large number of diversified customers for whom there
was no recent history of default.
Trade receivables that were past due but not impaired relate to a number of independent customers that have a good track
record with the Group. Based on past experience, the directors of the Group are of the opinion that no provision for
impairment is necessary in respect of these balances as there has not been a significant change in credit quality and the
balances are still considered fully recoverable. The Group does not hold any collateral or other credit enhancements over
these balances.
As at 31 December 2015, the Group has pledged notes receivable of RMB15,805,000 (2014: RMB4,500,000) to secure
notes payable of RMB10,235,000 (2014: RMB3,340,000) (note 23).
As at 31 December 2015, the Group has pledged intra-group trade receivables of RMB80,000,000 to secure a short-term
loan of RMB80,000,000 (2014: Nil) (note 25).
The notes receivable are due within six months. No notes receivable were discounted as at 31 December 2015 (2014: Nil).

101Annual Report 2015
31 December 2015
Notes to the Consolidated Financial Statements (continued)
21. Prepayments, deposits and other receivables
2015 2014
RMB’000 RMB’000
Current
Other receivables 80,427 38,660
Prepaid income tax 3,904 —
Prepayments 36,918 17,760
Prepaid expense — 82
121,249 56,502
Less: Impairment of other receivables (3,000) (3,000)
118,249 53,502
Non-current
Deposit* — 700,000
* In 2014, Shandong Luye entered into a series of share transfer agreements with shareholders of Beijing Jialin to conditionally purchase a 100%
equity interest of Beijing Jialin at a total consideration of RMB6,100,020,000 (“Beijing Jialin Acquisition”). As at 31 December 2014,
RMB700,000,000 was paid to the shareholders of Beijing Jialin as deposit for the acquisition. On 1 June 2015, the Group announced the
termination of the proposed acquisition of Beijing Jialin. On 12 June 2015, the Group had received the full refund of the deposit, which was paid
to the shareholders of Beijing Jialin in relation to the acquisition.
Movements in the provision for impairment of other receivables were as follows:
Individually
impaired
RMB’000
At 1 January 2015 3,000
Charge for the year —
Reversal —
At 31 December 2015 3,000
At 1 January 2014 3,600
Charge for the year 21
Reversal (621)
At 31 December 2014 3,000

102 Luye Pharma Group Ltd.
31 December 2015
Notes to the Consolidated Financial Statements (continued)
21. Prepayments, deposits and other receivables (continued)
The aged analysis of the prepayments, deposits and other receivables that are not considered to be impaired is as follows:
2015 2014RMB’000 RMB’000
Neither past due nor impaired 118,249 753,502
The financial assets included in the above balances that were neither past due nor impaired relate to other receivables for
which there was no recent history of default.
22. Cash and cash equivalents and pledged time deposits
2015 2014RMB’000 RMB’000
Cash and bank balances 843,674 151,863Time deposits 1,227,091 307,215
2,070,765 459,078Less:Pledged time deposits for bank loans and notes payable (266,500) (127,215)Non-pledged time deposits with original maturity of over three months
when acquired (960,591) (180,000)
Cash and cash equivalents 843,674 151,863
Denominated in RMB 561,697 134,116Denominated in US$ 267,366 3,647Denominated in others 14,611 14,100
Cash and cash equivalents 843,674 151,863
The RMB is not freely convertible into other currencies. However, under Mainland China’s Foreign Exchange Control
Regulations and Administration of Settlement, Sales and Payment of Foreign Exchange Regulations, the Group is permitted to
exchange RMB for other currencies through banks authorised to conduct foreign exchange business. The remittance of funds
out of Mainland China is subject to exchange restrictions imposed by the PRC government.
Cash at banks earns interest at floating rates based on daily bank deposit rates. Time deposits are made for varying periods
of between one day and twelve months depending on the immediate cash requirements of the Group, and earn interest at the
respective short term time deposit rates. The bank balances and pledged time deposits are deposited with creditworthy
banks with no recent history of default.
As at 31 December 2015, time deposits of RMB266,500,000 (2014: RMB125,200,000) have been pledged to secure bank
loans (note 25).

103Annual Report 2015
31 December 2015
Notes to the Consolidated Financial Statements (continued)
23. Trade and notes payables
2015 2014
RMB’000 RMB’000
Trade payables 72,984 55,704
Notes payable 10,235 3,340
83,219 59,044
An aged analysis of the trade and notes payables as at the end of the reporting period, based on the invoice date, is as
follows:
2015 2014
RMB’000 RMB’000
Within 3 months 71,221 26,748
3 to 6 months 9,751 25,203
6 to 12 months 1,420 5,050
1 to 2 years 513 1,136
Over 2 years 314 907
83,219 59,044
The trade payables are non-interest-bearing and are normally settled on 90-day terms.
As at 31 December 2015, notes payable of RMB10,235,000 (2014: RMB3,340,000) were secured by the Group’s notes
receivable with a carrying amount of RMB15,805,000 (2014: RMB4,500,000) (note 20). The maturity date of the notes
payable is within six months.
24. Other payables and accruals
2015 2014
RMB’000 RMB’000
Other payables 70,309 60,584
Accrued liabilities 25,856 122,431
Accrued payroll 66,654 70,411
Advances from customers 10,978 14,910
Taxes payable other than corporate income tax 94,489 74,838
Payables for purchases of property, plant and equipment, and other
intangible assets 98,171 96,402
366,457 439,576
Other payables are non-interest-bearing.

104 Luye Pharma Group Ltd.
31 December 2015
Notes to the Consolidated Financial Statements (continued)
25. Interest-bearing loans and borrowings
2015
Effective interest
rate (%) Maturity RMB’000
Current
Bank loans — secured
RMB80,000,000 bank loan 3.77 15 March 2016 80,000
US$25,000,000 bank loan 3-Month LIBOR+1.8 1 April 2016 162,340
US$40,000,000 bank loan 12-Month LIBOR+0.75 28 July 2016 259,744
Finance lease payables, current portion (note 26) 2.2 31 December 2016 138
502,222
Non-current
Finance lease payables (note 26) 2.2 1 January 2017 ~ 493
30 August 2020
502,715
2014
Effective interest
rate (%) Maturity RMB’000
Current
Bank loans — secured
RMB60,000,000 bank loan 5.60 2 March 2015 60,000
US$40,000,000 bank loan 3-Month LIBOR+2.3 29 June 2015 244,760
Finance lease payables, current portion (note 26) 2.2 31 December 2015 139
304,899
Non-current
Finance lease payables (note 26) 2.2 1 January 2016 ~ 638
30 August 2020
305,537

105Annual Report 2015
31 December 2015
Notes to the Consolidated Financial Statements (continued)
25. Interest-bearing loans and borrowings (continued)
2015 2014RMB’000 RMB’000
Analysed into:Bank loans and overdrafts repayables:
Within one year or on demand 502,222 304,899In the second year 138 139In the third to fifth years, inclusive 355 417Beyond five years — 82
502,715 305,537
Certain of the Group’s bank loans are secured by:
(i) the pledge of certain of the Group’s time deposits of RMB266,500,000 (2014: RMB125,200,000) (note 22); and
(ii) the pledge of certain of the Group’s intra-group trade receivables of RMB80,000,000 (2014: Nil) (note 20).
26. Finance lease payables
The Group has certain finance leases for motor vehicles, equipment and machinery. The total future minimum lease payments
under finance leases and their present values were as follows:
Minimum leasepayments
2015
Minimum leasepayments
2014
Present value ofminimum lease
payments2015
Present value ofminimum lease
payments2014
RMB’000 RMB’000 RMB’000 RMB’000
Amounts payable:Within one year 168 170 138 139In the second year 168 170 138 139 In the third to fifth years, inclusive 435 510 355 417After five years — 97 — 82
Total minimum finance lease payments 771 947 631 777
Future finance charges (140) (170)
Total net finance lease payables 631 777Portion classified as current liabilities
(note 25) (138) (139)
Non-current portion (note 25) 493 638

106 Luye Pharma Group Ltd.
31 December 2015
Notes to the Consolidated Financial Statements (continued)
27. Government grants
2015 2014
RMB’000 RMB’000
At 1 January 143,654 153,120
Grants received during the year 20,156 25,575
Amount released (23,505) (35,041)
At 31 December 140,305 143,654
Current 25,155 37,049
Non-current 115,150 106,605
140,305 143,654
The grants are related to the subsidies received from the government for the purpose of compensation for expenses arising
from research expenses and improvement of manufacturing facilities on certain special projects. Upon completion of the
related projects and having passed the final assessment of the relevant government authorities, the grants related to the
expense items would be recognised as other income directly in the statement of profit or loss and the grants related to an
asset would be released to the statement of profit or loss over the expected useful life of the relevant asset.

107Annual Report 2015
31 December 2015
Notes to the Consolidated Financial Statements (continued)
28. Deferred tax
The movements in deferred tax assets and liabilities during the year are as follows:
2015 2014
RMB’000 RMB’000
Deferred tax assets 69,377 83,259
Deferred tax liabilities (92,321) (97,717)
(22,944) (14,458)
Deferred tax assets
Accrued
expenses
Decelerated
depreciation
for tax
purposes
Losses
available for
offsetting
against
future taxable
profits
Impairment of
inventories
Impairment
of trade
and other
receivables
Government
grants
Unrealised
profit from
inter-company
transactions
Total
deferred
tax assets
RMB’000 RMB’000 RMB’000 RMB’000 RMB’000 RMB’000 RMB’000 RMB’000
At 1 January 2015 39,108 368 — 779 560 17,990 24,454 83,259
Deferred tax (charged)/credited to the
statement of profit or loss during
the year (note 10) (18,965) 342 994 (300) 254 459 3,334 (13,882)
At 31 December 2015 20,143 710 994 479 814 18,449 27,788 69,377
Accrued
expenses
Decelerated
depreciation
for tax
purposes
Impairment of
non-current
assets
held-for-sale
Impairment of
inventories
Impairment of
trade and other
receivables
Government
grants
Unrealised
profit from
inter-company
transactions
Total
deferred tax
assets
RMB’000 RMB’000 RMB’000 RMB’000 RMB’000 RMB’000 RMB’000 RMB’000
At 1 January 2014 35,514 254 289 1,284 866 19,479 21,742 79,428
Deferred tax credited/(charged) to
the statement of profit or loss
during the year (note 10) 3,594 114 (289) (505) (306) (1,489) 2,712 3,831
At 31 December 2014 39,108 368 — 779 560 17,990 24,454 83,259

108 Luye Pharma Group Ltd.
31 December 2015
Notes to the Consolidated Financial Statements (continued)
28. Deferred tax (continued)
Deferred tax liabilities
Withholding
taxes
Fair value
adjustment
on acquisition
Accelerated
depreciation
for tax
purposes
Fair value
adjustments
arising from
available-
for-sale
investments
Total
deferred tax
liabilities
RMB’000 RMB’000 RMB’000 RMB’000 RMB’000
At 1 January 2015 (57,251) (38,845) (882) (739) (97,717)
Deferred tax credited to the
statement of profit or loss during
the year (note 10) — 4,734 177 739 5,650
Deferred tax charged to other
comprehensive income
during the year — — — (254) (254)
At 31 December 2015 (57,251) (34,111) (705) (254) (92,321)
Withholding
taxes
Fair value
adjustment
on acquisition
Accelerated
depreciation
for tax
purposes
Fair value
adjustments
arising from
available-
for-sale
investments
Total
deferred tax
liabilities
RMB’000 RMB’000 RMB’000 RMB’000 RMB’000
At 1 January 2014 (54,168) (44,546) — — (98,714)
Deferred tax (charged)/credited to
the statement of profit or loss
during the year (note 10) (3,083) 5,701 (882) — 1,736
Deferred tax charged to other
comprehensive income
during the year — — — (739) (739)
At 31 December 2014 (57,251) (38,845) (882) (739) (97,717)

109Annual Report 2015
31 December 2015
Notes to the Consolidated Financial Statements (continued)
28. Deferred tax (continued)
Pursuant to the PRC Corporate Income Tax Law, a 10% withholding tax is levied on dividends declared to foreign investors
from the foreign investment enterprises established in Mainland China. The requirement is effective from 1 January 2008 and
applies to earnings after 31 December 2007. A lower withholding tax rate may be applied if there is a tax arrangement
between Mainland China and the jurisdiction of the foreign investors. For the Group, the applicable rate is 10%. The Group is
therefore liable for withholding taxes on dividends distributed by those subsidiaries established in Mainland China in respect of
earnings generated since 1 January 2008. At 31 December 2015, the directors of the Company, based on the Group’s
expansion plan in Mainland China and the cash flow needs overseas at the end of each year, estimated that part of the
retained earnings of its subsidiaries established in Mainland China amounting to RMB572,510,000 (2014: RMB572,510,000)
would be subject to future dividend distribution, and a 10% deferred tax liability amounting to RMB57,251,000 (2014:
RMB57,251,000) was recognised.
There are no income tax consequences attaching to the payment of dividends by the Company to its shareholders.
The Group has tax losses arising in Singapore and Hong Kong of RMB52,096,000 (2014: RMB50,508,000) that are available
indefinitely for offsetting against future taxable profits.
The Group has tax losses arising in USA of RMB760,000 (2014: Nil) that are available for offsetting against future taxable
profits in twenty years.
The Group also has tax losses arising in Mainland China of RMB8,809,000 (2014: RMB3,525,000) that will expire in one to
five years for offsetting against future taxable profits.
Deferred tax assets have not been recognised in respect of these losses arisen in Singapore, Hong Kong, the USA and
Mainland China as it is not considered probable that taxable profits will be available against which the tax losses can be
utilised.
29. Issued capital
2015 2014
RMB’000 RMB’000
Issued and fully paid:
3,321,073,843 (2014: 3,321,073,843) ordinary shares of US$0.02 each
US$’000 66,421 66,421
RMB’000 427,269 427,269

110 Luye Pharma Group Ltd.
31 December 2015
Notes to the Consolidated Financial Statements (continued)
29. Issued capital (continued)
A summary of movements in the Company’s issued share capital and share premium is as follows:
Number of shares in issue Issued capital
Sharepremium account Total
RMB’000 RMB’000 RMB’000
At 1 January 2014 492,764,900 81,180 427,980 509,160Share repurchase (51,932,992) (8,556) (191,444) (200,000)Issue of shares 667,540,000 82,195 3,057,145 3,139,340Capitalisation issue 2,212,701,935 272,450 (272,450) —Share issue expenses — — (84,414) (84,414)
At 31 December 2014, 1 January 2015 and 31 December 2015 3,321,073,843 427,269 2,936,817 3,364,086
30. Reserves
Statutory surplus reserves
In accordance with the Company Law of the PRC, certain subsidiaries of the Group which are domestic enterprises are required to allocate 10% of their profit after tax, as determined in accordance with the relevant PRC accounting standards, to their respective statutory surplus reserves until the reserves reach 50% of their respective registered capital. Subject to certain restrictions set out in the Company Law of the PRC, part of the statutory surplus reserves may be converted to increase share capital, provided that the remaining balance after the capitalisation is not less than 25% of the registered capital.
31. Partly-owned subsidiary with material non-controlling interests
Financial information of the subsidiary that has material non-controlling interests is provided below:
Proportion of equity interest held by non-controlling interests:
Name Country of incorporation and operation 2015 2014
WPU PRC/Mainland China 30.45% 30.45%
2015 2014RMB’000 RMB’000
Accumulated balances of material non-controlling interests:WPU 135,570 129,962
Profit allocated to material non-controlling interests:WPU 10,176 8,922
Dividends paid to material non-controlling interests:WPU 4,568 7,613

111Annual Report 2015
31 December 2015
Notes to the Consolidated Financial Statements (continued)
31. Partly-owned subsidiary with material non-controlling interests (continued)
The following tables illustrate the summarised financial information of the above subsidiary. The amounts disclosed are before
any inter-company eliminations:
2015 2014
RMB’000 RMB’000
Revenue 247,715 297,030
Total expenses (224,157) (251,915)
Profit for the year 23,558 45,115
Total comprehensive income for the year 23,558 45,115
Current assets 177,739 222,373
Non-current assets 332,234 322,885
Current liabilities (24,896) (71,294)
Non-current liabilities (33,899) (31,344)
Net cash flows from operating activities 30,996 48,634
Net cash flows used in investing activities (19,994) (21,403)
Net cash flows used in financing activities (15,000) (25,108)
Net foreign exchange difference 62 3
Net (decrease)/increase in cash and cash equivalents (3,936) 2,126
As at 31 December 2015, the unrealised profit from the inter-company transaction between WPU and Luye Trading was
RMB5,954,000 (31 December 2014: RMB15,814,000).
32. Operating lease commitments
The Group leases certain of its office properties under operating lease arrangements. Leases for properties are negotiated for
terms of one to ten years. As at 31 December 2015 and 2014, the Group had total future minimum lease payments under
non-cancellable operating leases falling due as follows:
2015 2014
RMB’000 RMB’000
Within one year 8,495 3,367
In the second to fifth years, inclusive 7,943 1,719
After five years 2,625 2,675
19,063 7,761

112 Luye Pharma Group Ltd.
31 December 2015
Notes to the Consolidated Financial Statements (continued)
33. Commitments
In addition to the operating lease commitments detailed in note 32, the Group had the following capital commitments at the
end of the reporting period:
2015 2014RMB’000 RMB’000
Contracted, but not provided for:Land and buildings 75,467 104,102Plant and machinery 106,215 84,979
181,682 189,081
34. Related party transactions
Details of the Group’s principal related parties are as follows:
Company Relationship
Luye Investment Immediate holding companyLuye Pharma Holdings Ltd.
(“Luye Holdings”)Intermediate holding company
Steward Cross AssociateShandong International Biological Technology Co., Ltd.
(“Shandong Biological Tech”)An entity controlled by a director of the Company
Shandong Boan Biological Technology Co., Ltd. (“Shandong Boan”)
A subsidiary wholly controlled by Shandong Biological Tech
(a) The Group had the following transactions with related parties during the year:
2015 2014Notes RMB’000 RMB’000
Sales of products to Steward Cross (i) 4,886 10,526
Loans to Luye Investment — 213,520
Payment for purchase of buildings to Shandong Biological Tech — 105,863
Sales of inventories to Shandong Boan (ii) 2,873 36,063Sales of machinery and equipment to Shandong Boan — 23,236
Notes:
(i) The sales to Steward Cross were made according to the published prices and conditions offered to the major customers of the Group.
(ii) The sales to Shandong Boan were made on terms equivalent to those that prevail in arm’s length transactions.

113Annual Report 2015
31 December 2015
Notes to the Consolidated Financial Statements (continued)
34. Related party transactions (continued)
(b) Outstanding balances with related parties:
The Group had the following significant balances with its related parties:
(i) Due from related parties
2015 2014
RMB’000 RMB’000
Steward Cross 1,600 2,219
Shandong Boan — 436
1,600 2,655
(ii) Due to related parties
2015 2014
RMB’000 RMB’000
Shandong Boan 3,428 —
3,428 —
(c) Compensation of key management personnel of the Group:
2015 2014
RMB’000 RMB’000
Short-term employee benefits 15,629 14,612
Pension scheme contributions 851 796
Total compensation paid to key management personnel 16,480 15,408
Further details of directors’ remuneration are included in note 8.

114 Luye Pharma Group Ltd.
31 December 2015
Notes to the Consolidated Financial Statements (continued)
35. Financial instruments by category
The carrying amounts of each of the categories of financial instruments as at the end of the reporting period are as follows:
2015
Financial assets
Loans and
receivables
Available-for-
sale financial
assets Total
RMB’000 RMB’000 RMB’000
Available-for-sale investments — 1,405,460 1,405,460
Trade and notes receivables 1,193,103 — 1,193,103
Financial assets included in prepayments, deposits
and other receivables 80,427 — 80,427
Cash and cash equivalents 843,674 — 843,674
Time deposits with original maturity of over three months 960,591 — 960,591
Pledged time deposits 266,500 — 266,500
Due from related parties 1,600 — 1,600
3,345,895 1,405,460 4,751,355
Financial liabilities
Financial
liabilities at
amortised cost Total
RMB’000 RMB’000
Trade and notes payables 83,219 83,219
Financial liabilities included in other payables and accruals 194,336 194,336
Interest-bearing loans and borrowings 502,715 502,715
780,270 780,270

115Annual Report 2015
31 December 2015
Notes to the Consolidated Financial Statements (continued)
35. Financial instruments by category (continued)
The carrying amounts of each of the categories of financial instruments as at the end of the reporting period are as follows:
(continued)
2014
Financial assets
Loans and
receivables
Available-for-
sale financial
assets Total
RMB’000 RMB’000 RMB’000
Available-for-sale investments — 1,847,634 1,847,634
Trade and notes receivables 914,130 — 914,130
Financial assets included in prepayments, deposits
and other receivables 38,660 — 38,660
Cash and cash equivalents 151,863 — 151,863
Time deposits with original maturity of over three months 180,000 — 180,000
Pledged time deposits 127,215 — 127,215
Due from related parties 2,655 — 2,655
1,414,523 1,847,634 3,262,157
Financial liabilities
Financial
liabilities at
amortised cost Total
RMB’000 RMB’000
Trade and notes payables 59,044 59,044
Financial liabilities included in other payables and accruals 280,726 280,726
Interest-bearing loans and borrowings 305,537 305,537
645,307 645,307
Fair valuesThe fair value of a financial instrument is the amount at which the instrument could be exchanged or settled between
knowledgeable and willing parties in an arm’s length transaction, other than in a forced or liquidation sale.

116 Luye Pharma Group Ltd.
31 December 2015
Notes to the Consolidated Financial Statements (continued)
35. Financial instruments by category (continued)
Financial instruments carried at fair valueThe Group has carried all investment securities that are classified as available-for-sale investments at their fair values as
required by IAS 39, except for unlisted investments which were stated at cost (note 18).
As at 31 December 2015, the Group endorsed certain notes receivable accepted by certain banks in the PRC (the “Endorsed
Notes”) to certain of its suppliers in order to settle the trade payables due to such suppliers (the “Endorsement”). Subsequent
to the endorsement, the Group does not retain any rights on the use of the Endorsed Notes, including sale, transfer or pledge
of the Endorsed Notes to any other third parties. In accordance with the Law of Negotiable Instruments in the PRC, the
holders of the Endorsed Notes have a right of recourse against the Group if the PRC banks default (the “Continuing
Involvement”). The total carrying amount of the Endorsed Notes was RMB73,157,000 as at 31 December 2015 (2014:
RMB80,179,000). In the opinion of the directors, the Group has transferred substantially all the risks and rewards relating to
certain Endorsed Notes accepted by large and reputable banks with amount of RMB44,662,000 (“Derecognised Notes”) as at
31 December 2015 (2014: RMB64,224,000). Accordingly, it has derecognised the full carrying amounts of these
Derecognised Notes and the associated trade payables. The maximum exposure to loss from the Group’s Continuing
Involvement in these Derecognised Notes and the undiscounted cash flows to repurchase these Derecognised Notes is equal
to their carrying amounts. In the opinion of the directors, the fair values of the Group’s Continuing Involvement in these
Derecognised Notes are not significant. The Group continued to recognise the full carrying amount of the remaining Endorsed
Notes and associated trade payables settled of RMB28,495,000 (2014: RMB15,955,000) since the directors believe the
Group has retained the substantial risks and rewards, which include default risks relating to such remaining Endorsed Notes.
During the year, the Group has not recognised any gain or loss on the date of transfer of the Derecognised Notes. No gains
or losses were recognised from the continuing involvement, both during the year or cumulatively. The Endorsement has been
made evenly throughout the year.

117Annual Report 2015
31 December 2015
Notes to the Consolidated Financial Statements (continued)
36. Fair value and fair value hierarchy of financial instruments
The following tables illustrate the fair value measurement hierarchy of the Group’s financial instruments:
Assets measured at fair value:
As at 31 December 2015
Fair value measurement using
Quoted prices
in active
markets
Significant
observable
inputs
Significant
unobservable
inputs
(Level 1) (Level 2) (Level 3) Total
RMB’000 RMB’000 RMB’000 RMB’000
Available-for-sale investments:
Equity investment 2,842 — — 2,842
Investment in bank financial products — 1,402,118 — 1,402,118
2,842 1,402,118 — 1,404,960
As at 31 December 2014
Fair value measurement using
Quoted prices
in active
markets
Significant
observable
inputs
Significant
unobservable
inputs
(Level 1) (Level 2) (Level 3) Total
RMB’000 RMB’000 RMB’000 RMB’000
Available-for-sale investments:
Equity investment 1,742 — — 1,742
Investment in bank financial products — 1,845,392 — 1,845,392
1,742 1,845,392 — 1,847,134
During the year, there were no transfers of fair value measurements between Level 1 and Level 2 and no transfers into or out
of Level 3 (2014: Nil).
The Group did not have any financial liabilities measured at fair value as at 31 December 2015 (2014: Nil).
Financial instruments whose carrying amounts approximate to their fair valuesManagement has determined that the carrying amounts of cash and cash equivalents, pledged time deposits, trade and notes
receivables, deposits and other receivables, amounts due from/to related parties, trade and notes payables, other payables
and short-term interest-bearing loans and borrowings, based on their notional amounts, reasonably approximate to their fair
values because these financial instruments are mostly short term in nature. The carrying amounts of long term interest-bearing
loans and borrowings, which incur interest at floating interest rate, also approximate to their fair values as the interest rate is
periodically adjusted to market rate.

118 Luye Pharma Group Ltd.
31 December 2015
Notes to the Consolidated Financial Statements (continued)
37. Financial risk management objectives and policies
The Group’s principal financial instruments comprise interest-bearing loans and borrowings and cash and time deposits. The
main purpose of these financial instruments is to raise finance for the Group’s operations. The Group has various other
financial assets and liabilities such as trade receivables and trade payables, which arise directly from its operations.
The main risks arising from the Group’s financial instruments are interest rate risk, foreign currency risk, credit risk and liquidity
risk. The board of directors reviews and agrees policies for managing each of these risks and they are summarised below.
Interest rate risk
Interest rate risk is the risk that the fair value or future cash flows of a financial instrument will fluctuate because of changes in
market interest rates. The Group’s exposure to the risk of changes in market interest rates relates primarily to the Group’s
interest-bearing loans and borrowings with floating interest rates.
The Group’s policy is to manage interest cost using a mix of fixed and floating rate debts.
The following table demonstrates the sensitivity to a reasonably possible change in the RMB and US$ interest rates, with all
other variables held constant, of the Group’s profit before tax (through the impact on floating rate borrowings).
Increase/
(decrease)
in basis
points
Increase/
(decrease)
in profit
before tax
RMB’000
2015
RMB 50 —
RMB (50) —
US$ 50 (16)
US$ (50) 16
2014
RMB 50 (3)
RMB (50) 3
US$ 50 (15)
US$ (50) 15

119Annual Report 2015
31 December 2015
Notes to the Consolidated Financial Statements (continued)
37. Financial risk management objectives and policies (continued)
Foreign currency risk
Foreign currency risk is the risk of loss resulting from changes in foreign currency exchange rates. Fluctuations in exchange
rates between RMB and other currencies in which the Group conducts business may affect the Group’s financial condition
and results of operations. The Group seeks to limit its exposure to foreign currency risk by minimising its net foreign currency
position.
The following table demonstrates the sensitivity at the end of the reporting period to a reasonably possible change in foreign
currency exchange rates, with all other variables held constant, of the Group’s profit before tax (due to changes in the fair
value of monetary assets and liabilities).
Increase/
(decrease)
in rate of
foreign
currency
Increase/
(decrease)
in profit
before tax
% RMB’000
2015
If RMB weakens against US$ 5 (14,481)
If RMB strengthens against US$ (5) 14,481
If US$ weakens against SG$ 5 (881)
If US$ strengthens against SG$ (5) 881
If US$ weakens against HK$ 5 (14)
If US$ strengthens against HK$ (5) 14
If HK$ weakens against SG$ 5 4
If HK$ strengthens against SG$ (5) (4)
2014
If RMB weakens against US$ 5 (7)
If RMB strengthens against US$ (5) 7
If US$ weakens against SG$ 5 (34)
If US$ strengthens against SG$ (5) 34
If US$ weakens against HK$ 5 13
If US$ strengthens against HK$ (5) (13)
If HK$ weakens against SG$ 5 7
If HK$ strengthens against SG$ (5) (7)

120 Luye Pharma Group Ltd.
31 December 2015
Notes to the Consolidated Financial Statements (continued)
37. Financial risk management objectives and policies (continued)
Credit risk
The Group trades mainly with recognised and creditworthy third parties. It is the Group’s policy that all customers who wish to
trade on credit terms are subject to credit verification procedures. In addition, receivable balances are monitored on an on-
going basis. For transactions that are not denominated in the functional currency of the relevant operating unit, the Group
does not offer credit terms without the specific approval of senior management.
The credit risk of the Group’s other financial assets, which comprise cash and cash equivalents, pledged time deposits,
available-for-sale financial assets, other receivables and amounts due from related parties, arises from default of the
counterparty, with a maximum exposure equal to the carrying amounts of these instruments.
Since the Group trades only with recognised and creditworthy third parties, there is no requirement for collateral.
Concentrations of credit risk are managed by customer/counterparty and by geographical region. There are no significant
concentrations of credit risk within the Group as the customer bases of the Group’s trade receivables are widely dispersed in
different regions.
Further quantitative data in respect of the Group’s exposure to credit risk arising from trade and other receivables are
disclosed in notes 20 and 21.
Liquidity risk
The Group monitors its risk to a shortage of funds using a recurring liquidity planning tool. This tool considers the maturity of
both its financial investments and financial assets (e.g., trade receivables and other financial assets) and projected cash flows
from operations.
The Group maintains a balance between continuity of funding and flexibility through the use of interest-bearing loans and
borrowings.

121Annual Report 2015
31 December 2015
Notes to the Consolidated Financial Statements (continued)
37. Financial risk management objectives and policies (continued)
Liquidity risk (continued)
The maturity profile of the Group’s financial liabilities as at the end of the reporting period, based on contractual undiscounted
payments, is as follows:
31 December 2015
On
demand
Less than
3 months
3 to 12
months
1 to 5
years
Over
5 years Total
RMB’000 RMB’000 RMB’000 RMB’000 RMB’000 RMB’000
Interest-bearing loans
and borrowings — 82,523 423,556 603 — 506,682
Trade and notes payables 11,998 71,221 — — — 83,219
Financial liabilities included in
other payables and accruals 93,270 101,066 — — — 194,336
105,268 254,810 423,556 603 — 783,607
31 December 2014
On
demand
Less than
3 months
3 to 12
months
1 to 5
years
Over
5 years Total
RMB’000 RMB’000 RMB’000 RMB’000 RMB’000 RMB’000
Interest-bearing loans
and borrowings — 62,162 246,416 777 — 309,355
Trade and notes payables 7,093 51,951 — — — 59,044
Financial liabilities included in
other payables and accruals 177,915 102,811 — — — 280,726
185,008 216,924 246,416 777 — 649,125
Capital management
The primary objectives of the Group’s capital management are to safeguard the Group’s ability to continue as a going concern
and to maintain a strong credit rating and healthy capital ratios in order to support its business and maximise shareholders’
value.
The Group manages its capital structure and makes adjustments to it in light of changes in economic conditions. To maintain
or adjust the capital structure, the Group may adjust the dividend payment to shareholders, return capital to shareholders or
issue new shares. The Group is not subject to any externally imposed capital requirements. No changes were made in the
objectives, policies or processes for managing capital during the years ended 31 December 2015 and 2014.

122 Luye Pharma Group Ltd.
31 December 2015
Notes to the Consolidated Financial Statements (continued)
37. Financial risk management objectives and policies (continued)
Capital management (continued)
The Group monitors capital using a gearing ratio, which is net debt divided by total capital plus net debt. The Group’s policy is
to keep the gearing ratio below 30%. Net debt includes interest-bearing loans and borrowings, trade and notes payables,
other payables and accruals and amounts due to related parties, less cash and cash equivalents and pledged time deposits.
Total capital represents equity attributable to the owners of the parent less the net unrealised gain reserves. The gearing ratios
as at the end of the reporting periods were as follows:
2015 2014
RMB’000 RMB’000
Interest-bearing loans and borrowings 502,715 305,537
Trade and notes payables 83,219 59,044
Other payables and accruals 366,457 439,576
Due to related parties 3,428 —
Less: Cash and cash equivalents (843,674) (151,863)
Time deposits with original maturity of over three months (960,591) (180,000)
Pledged time deposits (266,500) (127,215)
Net (cash)/debt (1,114,946) 345,079
Equity attributable to owners of the parent 5,663,961 4,907,598
Less: Net unrealised gain reserves (2,042) (4,253)
Total capital 5,661,919 4,903,345
Total capital and net (cash)/debt 4,546,973 5,248,424
Gearing ratio (25%) 7%

123Annual Report 2015
31 December 2015
Notes to the Consolidated Financial Statements (continued)
38. Statement of financial position of the Company
Information about the statement of financial position of the Company at the end of the reporting period is as follows:
2015 2014
RMB’000 RMB’000
NON-CURRENT ASSETS
Investments in subsidiaries 116,460 116,135
Total non-current assets 116,460 116,135
CURRENT ASSETS
Due from subsidiaries 3,404,824 3,459,400
Prepayments, deposits and other receivables 40,836 33,790
Time deposits with original maturity of over three months 290,591 —
Cash and cash equivalents 250,286 13,587
Total current assets 3,986,537 3,506,777
CURRENT LIABILITIES
Interest-bearing loans and borrowings 259,744 244,760
Due to subsidiaries 436,898 148,976
Other payables and accruals 3,355 6,248
Total current liabilities 699,997 399,984
NET CURRENT ASSETS 3,286,540 3,106,793
TOTAL ASSETS LESS CURRENT LIABILITIES 3,403,000 3,222,928
Net assets 3,403,000 3,222,928
EQUITY
Issued capital 427,269 427,269
Share premium (Note) 2,936,817 2,936,817
Reserves (Note) 38,914 (141,158)
Total equity 3,403,000 3,222,928

124 Luye Pharma Group Ltd.
31 December 2015
Notes to the Consolidated Financial Statements (continued)
38. Statement Of Financial Position of the Company (continued)
Note:
A summary of the Company’s share premium account and reserves is as follows:
Share
premium
account
Retained
earnings
Foreign
currency
translation
reserves Total
RMB’000 RMB’000 RMB’000 RMB’000
At 1 January 2014 427,980 97,516 (126,709) 398,787
Profit for the year — 228,105 — 228,105
Other comprehensive income for the year:
Currency realignment — — (15,731) (15,731)
Total comprehensive income for the year — 228,105 (15,731) 212,374
Share repurchase (191,444) — — (191,444)
Issue of shares 3,057,145 — — 3,057,145
Capitalisation issue (272,450) — — (272,450)
Share issue expenses (84,414) — — (84,414)
Dividends paid — (324,339) — (324,339)
At 31 December 2014 and 1 January 2015 2,936,817 1,282 (142,440) 2,795,659
Loss for the year — (9,683) — (9,683)
Other comprehensive income for the year:
— — 189,755 189,755Currency realignment
Total comprehensive income for the year — (9,683) 189,755 180,072
At 31 December 2015 2,936,817 (8,401) 47,315 2,975,731
39. Approval of the consolidated financial statements
The consolidated financial statements were approved and authorised for issue by the board of directors on 29 March 2016.

2015
Lu
ye Pharm
a Gro
up
Ltd.綠葉制藥集團有限公司
AN
NU
AL REPO
RT 2015年報
www.luye.cn
Luye Pharma Group Ltd.(incorporated in Bermuda with limited liability)
Stock Code: 2186
ANNUALREPORT
Luye Pharma Group Ltd.