lung cancer disparities in screening age new jersey adults · lung cancer is the leading cause of...
TRANSCRIPT

Lung Cancer Disparities in Screening Age
New Jersey Adults
Prepared by: Pamela Agovino, MPH; Lindsay Eberhart; Susan German, MPH;
Jie Li, MPH; Lisa E. Paddock, MPH, PhD; Antoine e Stroup, PhD
Phil Murphy
Governor
Sheila Oliver
Lt. Governor
Shereef Elnahal, MD, MBA
Commissioner
February 2019

Lung cancer is the leading cause of cancer death in the United States (US) and in New Jersey (NJ).1 In the US each
year, about 154,050 people will die from lung cancer and 234,030 people will be newly diagnosed with lung cancer.1
Compared to the national average, NJ has a slightly elevated incidence of lung cancer (57.4 vs. 54.5 per 100,000;
2011-2015).2,3 Conversely, lung cancer mortality rates in NJ are slightly lower than the US average (38.3 vs. 43.4 per
100,000; 2011-2015).2,3
In NJ, lung cancer is the second most commonly diagnosed cancer with about 5,879 new cases each year, although
disparities in who gets diagnosed with lung cancer exist.4 Men are more likely than women to be diagnosed with lung
cancer (64.3 vs. 52.6 per 100,000; 2011-2015).3 In addition, geographic variations of cancer incidence rates are not
uncommon and usually arise from differences in sociodemographic characteristics of the population (age, race and
ethnicity, geographic region, urban or rural residence), after screening use and health-related behaviors (tobacco
use, diet, physical activity).5
Exposure to factors that increase the risk of lung cancer can make a diagnosis of lung cancer more likely.1 The main
risk factor for lung cancer is smoking.1 Other risk factors include exposure to radon or asbestos and a family history
of lung cancer.1 From 1965 to 2014, the prevalence of smoking among adults in the US decreased from 42.4% to
16.8%, although smoking rates have plateaued recently.6 The decline in smoking started in 1984 for men, whereas
smoking among women did not start to decline until 1998.7 From 1965-1995, Black men were more likely to be
smokers than White men, however Black men and White men now smoke at similar rates, 20.2% and 17.8%
respectively.8,9 Cigarette smoking tends to be higher among those with less education and those living below the
poverty line.10
The average 5-year survival rate for lung cancer is 17.7%, although the survival rate varies widely by stage at
diagnosis.7 People who are diagnosed in the earliest stages of lung cancer have a 55% survival rate compared to a 4%
survival rate in people who are diagnosed in later stages when the cancer has spread.7 Unfortunately, only 16% of
lung cancers are diagnosed at an early stage.7
Late stage diagnosis of lung cancer is common due to a lack of symptoms in early stage lung cancer.1 Therefore, lung
cancer screening has been suggested for those at higher risk.1 The National Lung Screening Trial, which enrolled
individuals at high risk for lung cancer, found that low-dose computed topography screening reduced lung cancer
deaths by 20%.11 Based on this study and a review of lung cancer literature, the US Preventive Services Task Force
(USPSTF) released a statement in 2013 recommending lung cancer screening for current and former (quit within past
15 years) smokers aged 55-80, with a 30-pack year smoking history.12 Pack-years can be determined by multiplying
the number of cigarette packs smoked a day, by the number of years a person has smoked.12
Data on the implementation of lung cancer screening recommendations is limited, however, existing data suggests poor uptake. In 2015, only about half of primary care physicians were aware of the lung cancer screening guidelines.13 Another study used 2015 National Health Interview Survey data to determine that of the 6.8 million smokers meeting USPSTF screening guidelines, only 262,700 were screened.14 An exploratory study in 2017 also found that of the participants meeting the USPSTF guidelines, only 22.7% had been screened for lung cancer.15 Furthermore, non-Black patients meeting USPSTF screening guidelines were 2.8 times more likely to be screened than Black patients meeting the same standards.15 ScreenNJ (https://screennj.org/) is a collaborative project of organizations across New Jersey, headed by Rutgers Cancer Institute of New Jersey, committed to reducing cancer incidence and mortality through an effective cancer prevention and screening project.
This report characterizes lung cancer diagnosis and smoking prevalence by NJ county using data from the New Jersey
State Cancer Registry (NJSCR) and the NJ Behavioral Risk Factor Survey by examining cases of NJ adults who were
diagnosed with invasive lung cancer between 2011 and 2015 and who were in the age category recommended for
lung cancer screening (ages 55-79 for purposes of this report).
Lung Cancer Disparities in Screening Age New Jersey Adults
BACKGROUND

2
OCEAN
SUSSEX
BURLINGTON
ATLANTIC
MORRIS
SALEM
MONMOUTH
WARREN
CUMBERLAND
HUNTERDON
MERCER
UNION
BERGEN
CAPE MAY
MIDDLESEX
SOMERSET
CAMDEN
GLOUCESTER
PASSAIC
ESSEX
HUDSON
OCEAN
SUSSEX
BURLINGTON
ATLANTIC
MORRIS
SALEM
MONMOUTH
WARREN
CUMBERLAND
HUNTERDON
MERCER
UNION
BERGEN
CAPE MAY
MIDDLESEX
SOMERSET
CAMDEN
GLOUCESTER
PASSAIC
ESSEX
HUDSON
Age-adjusted Incidence Rates per 100,000
Incidence data are from the New Jersey State Cancer Registry and include invasive lung cancers from 2011-2015 in adults ages 55-79 years.
New Jersey Incidence Rates: Males 241.1 Females 202.4
Male Female
Newly Diagnosed Lung Cancer in Screening Age New Jersey Adults
State/ County
Male Age-
adjusted Rate
Male Count
Female Age-
adjusted Rate
Female Count
New Jersey 241.1 10,122 202.4 10,276
Atlantic 271.2 391 246.4 420
Bergen 209.9 970 179.8 1,006
Burlington 275.0 611 220.9 584
Camden 301.3 717 248.1 716
Cape May 346.5 255 265.8 218
Cumberland 343.3 248 236.3 199
Essex 215.5 666 159.1 657
Gloucester 326.6 444 250.4 414
Hudson 225.1 531 148.2 449
Hunterdon 200.5 135 201.7 149
Mercer 249.3 418 198.1 395
Middlesex 215.5 774 181.2 785
Monmouth 238.8 754 240.5 903
Morris 181.4 454 175.0 508
Ocean 275.6 1,005 261.0 1,195
Passaic 222.5 487 165.9 444
Salem 376.1 136 272.5 116
Somerset 203.6 317 168.9 304
Sussex 282.2 220 208.7 181
Union 197.7 450 167.8 474
Warren 238.0 139 248.1 159
Lung cancer incidence rates are higher among males compared to females.
Male and female incidence is higher among the southern counties compared to the northern counties.
Female incidence rates are notably lower in the northeastern portion of the state whereas
males in this area have higher incidence rates.

3
Late Stage SPR*
*Standardized Proportion Ratio (SPR) of late stage lung cancer cases in each county compared to New Jersey. SPRs can be interpreted as the percentage above or below the reference population’s SPR of 1.00 or 100%. A SPR of 1.13 represents 13% higher than the New Jersey SPR, while a 0.89 SPR represents 11% lower than the New Jersey SPR. Late stage includes regional and distant stages. The denominator includes all cases (in situ, local, regional, distant). Incidence data are from the New Jersey State Cancer Registry and include invasive lung cancers from 2011-2015 in adults ages 55-79 years.
Late Stage Lung Cancer Diagnosis Among New Jersey Adults of Screening Age
Among screening age adults, men have a higher proportion of late stage lung cancer.
Northern New Jersey counties have higher proportions of people being diagnosed with late stage lung cancer than the early, more treatable stages.
Women in Sussex county have 13% more (SPR 1.13) and men have 7% more (SPR 1.07) late stage lung cancer diagnoses compared to overall New Jersey proportions. Essex and Warren counties also have a high proportion of men and women who are diagnosed with late stage lung cancer.
State/ County
Male SPR*
Female SPR*
New Jersey 1.04 0.97
Atlantic 1.00 0.92
Bergen 1.01 0.93
Burlington 1.02 0.97
Camden 1.06 0.97
Cape May 1.02 0.89
Cumberland 1.10 1.00
Essex 1.08 1.04
Gloucester 0.99 0.95
Hudson 1.06 0.98
Hunterdon 1.07 0.96
Mercer 1.06 0.94
Middlesex 1.02 0.95
Monmouth 1.01 0.95
Morris 1.04 0.97
Ocean 1.00 0.94
Passaic 1.05 0.97
Salem 0.98 0.99
Somerset 1.05 0.97
Sussex 1.07 1.13
Union 1.10 1.02
Warren 1.08 1.05
Male Female
0.89 - 0.93
0.94 - 0.98
0.99 - 1.03
1.04 - 1.08
1.09 - 1.13
New Jersey overall: 1.00
OCEAN
SUSSEX
ATLANTIC
BURLINGTON
MORRIS
SALEM
MONMOUTH
CUMBERLAND
HUNTERDON
WARREN
BERGEN
CAPE MAY
MIDDLESEX
SOMERSET
MERCER
CAMDEN
GLOUCESTER
PASSAIC
ESSEX
UNION
HUDSON
OCEAN
SUSSEX
ATLANTIC
BURLINGTON
MORRIS
SALEM
MONMOUTH
CUMBERLAND
HUNTERDON
WARREN
BERGEN
CAPE MAY
MIDDLESEX
SOMERSET
MERCER
CAMDEN
GLOUCESTER
PASSAIC
ESSEX
UNION
HUDSON

4
Incidence data are from the New Jersey State Cancer Registry and include invasive lung cancers from 2011-2015 in adults ages 55-79 years.
OCEAN
SUSSEX
BURLINGTON
ATLANTIC
MORRIS
SALEM
MONMOUTH
CUMBERLAND
MERCER
WARREN
HUNTERDON
BERGEN
CAPE MAY
MIDDLESEX
SOMERSET
CAMDEN
GLOUCESTER
PASSAIC
ESSEX
UNION
HUDSON
OCEAN
SUSSEX
BURLINGTON
ATLANTIC
MORRIS
SALEM
MONMOUTH
CUMBERLAND
HUNTERDON
MERCER
WARREN
BERGEN
CAPE MAY
MIDDLESEX
SOMERSET
CAMDEN
GLOUCESTER
PASSAIC
ESSEX
UNION
HUDSON
State/ County
Male APC
Female APC
New Jersey -2.7↓ -0.9
Atlantic -1.1 -4.2
Bergen 1.2 -0.4
Burlington -2.7↓ 3.1
Camden -3.4↓ 0.4
Cape May -5.0 1.4
Cumberland -7.3 -1.3
Essex -0.9 0.4
Gloucester -6.0 -5.8↓
Hudson -4.0 5.6
Hunterdon -7.6 4.6
Mercer 1.5 1.3
Middlesex -4.1 -4.1
Monmouth -2.7 -4.1
Morris -3.7 2.2
Ocean 0.1 -0.5
Passaic -12.3 -1.0
Salem 11.4 2.3
Somerset -5.7 -5.2
Sussex -2.2 -1.6
Union -3.3 -2.6
Warren -5.0↓ -4.9
Male
Changes Over Five Years of Newly Diagnosed Lung Cancer in Screening Age New Jersey Adults
Significant decrease over time
Annual Percent Change
Female
Overall, rates of newly diagnosed lung cancer decreased significantly in men. Rates of newly diagnosed lung cancer in women also decreased (not statistically significant).
Rates of new lung cancer among men decreased significantly in Burlington, Camden, and Warren counties.
In men, Warren county had the highest decline in rates of new lung cancer among counties that showed a significant decline.
Among women, newly diagnosed lung cancer rates decreased significantly in Gloucester county.
-12.3 _ -7.8
-7.7 __ -2.9
-2.8 __ 1.8
1.9 __ 6.6
6.7 __ 11.4
New Jersey Annual Percent Change (APC): Males -2.7 Females -0.9
5
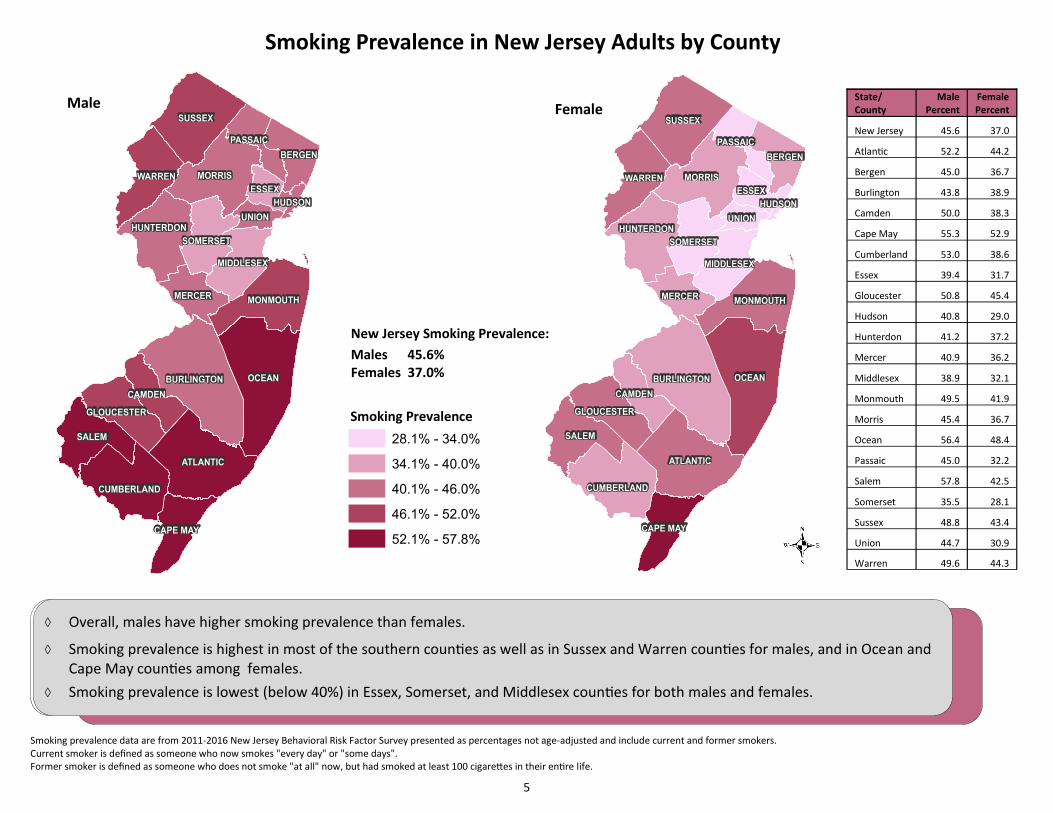
Smoking prevalence data are from 2011-2016 New Jersey Behavioral Risk Factor Survey presented as percentages not age-adjusted and include current and former smokers. Current smoker is defined as someone who now smokes "every day" or "some days". Former smoker is defined as someone who does not smoke "at all" now, but had smoked at least 100 cigarettes in their entire life.
OCEAN
SUSSEX
BURLINGTON
ATLANTIC
MORRIS
SALEM
MONMOUTH
CUMBERLAND
HUNTERDON
WARREN
BERGEN
CAPE MAY
MIDDLESEX
SOMERSET
MERCER
CAMDEN
GLOUCESTER
PASSAIC
ESSEX
UNION
HUDSON
New Jersey Smoking Prevalence:
Males 45.6% Females 37.0%
State/ County
Male Percent
Female Percent
New Jersey 45.6 37.0
Atlantic 52.2 44.2
Bergen 45.0 36.7
Burlington 43.8 38.9
Camden 50.0 38.3
Cape May 55.3 52.9
Cumberland 53.0 38.6
Essex 39.4 31.7
Gloucester 50.8 45.4
Hudson 40.8 29.0
Hunterdon 41.2 37.2
Mercer 40.9 36.2
Middlesex 38.9 32.1
Monmouth 49.5 41.9
Morris 45.4 36.7
Ocean 56.4 48.4
Passaic 45.0 32.2
Salem 57.8 42.5
Somerset 35.5 28.1
Sussex 48.8 43.4
Union 44.7 30.9
Warren 49.6 44.3
OCEAN
SUSSEX
BURLINGTON
ATLANTIC
MORRIS
SALEM
MONMOUTH
CUMBERLAND
HUNTERDON
WARREN
BERGEN
CAPE MAY
MIDDLESEX
SOMERSET
MERCER
CAMDEN
GLOUCESTER
PASSAIC
ESSEX
UNION
HUDSON
Smoking Prevalence
Overall, males have higher smoking prevalence than females.
Smoking prevalence is highest in most of the southern counties as well as in Sussex and Warren counties for males, and in Ocean and Cape May counties among females.
Smoking prevalence is lowest (below 40%) in Essex, Somerset, and Middlesex counties for both males and females.
Male
Smoking Prevalence in New Jersey Adults by County
Female
28.1% - 34.0%
34.1% - 40.0%
40.1% - 46.0%
46.1% - 52.0%
52.1% - 57.8%

6
Rates of new lung cancer diagnoses are higher in men compared to women who are in the age group
recommended for lung cancer screening (55-79), although geographic disparities exist.
For both men and women who are screening age, newly diagnosed (incidence) lung cancer rates tend
to be higher in the southern portion of the state compared to the northern portion.
Late stage lung cancer by county is more often diagnosed in men compared with women. Because
late stage diagnosis in the 55-79 age group is often the result of poor screening rates, the data and
maps presented here can be used to direct screening efforts to assist in early detection, and thereby
decreasing the proportion of lung cancers detected in later stages.
Past and current smoking prevalence is generally higher among men compared to women as well as
in the southern and northwestern counties of the state.
Areas that had a high smoking prevalence also had high lung cancer incidence, as we would expect to
see given the strong association between smoking and lung cancer risk. This is particularly evident in
southern New Jersey counties.
Men of screening age displayed a statistically significant recent decline in rates of newly diagnosed
lung cancer while the rates among women of screening age showed little change. This most likely
reflects historical differences in tobacco use and cessation, such that women took up smoking many
years later than men.16,17
Warren, Burlington and Camden counties saw a statistically significant decline in rates of newly
diagnosed lung cancer among men in the screening age group, while Gloucester county saw a
statistically significant decline among women in the same age group. More than likely, these declines
are due to reduced smoking prevalence over the past several decades.
Overall, New Jersey is making very good progress toward the Healthy New Jersey (HNJ) 2020 target
lung cancer mortality rate of 31.5 per 100,000 population.18 In 2016, New Jersey’s lung cancer
mortality rate was 33.8 per 100,000 population. The HNJ 2020 target for the percentage of adults
who smoke is 12.4%.18 New Jersey is making progress toward this goal, with 14.2% of adults reporting
having smoked cigarettes in 2016.18
Data were collected by the New Jersey State Cancer Registry under contract HHSN 261201300021I and control No. N01PC-2013-00021 from the Surveillance, Epidemiology, and End Results Program of the National Cancer Institute, and under cooperative agreement 5U58DP003931-02 from the National Program of Cancer Registries, Centers for Disease Control and Prevention, in addition to funding from the State of New Jersey, and the Rutgers Cancer Institute.
Lung Cancer Disparities in Screening Age New Jersey Adults
CONCLUSIONS

7
Data Sources
New Jersey incidence data for this report were derived from the NJSCR December 2017 file. This report
includes lung and bronchus cancer cases from 2011-2015 in adults ages 55-79 years. Lung and bronchus
cancer is defined by the topography codes C340-C349 as detailed in the International Classification of
Diseases for Oncology (ICD-O) third edition.
Smoking data were obtained from the New Jersey Behavioral Risk Factor Survey (NJBRFS): New Jersey
Department of Health, Center for Health Statistics, New Jersey State Health Assessment Data (NJSHAD).
Accessed at http://nj.gov/health/shad on 05/16/18. The estimated percentages have been produced by
weighting the sample so that the results better represent the New Jersey population and to adjust for the
probability of selection.
Software
Data analyses were conducted using SEER*Stat version 8.3.5 and ESRI ArcMap version 10.4.1.
Methods
Rates are per 100,000 and age-adjusted to the 2000 US population standard.
The annual percent change is statistically significant at p < 0.05.
The standardized proportion ratio displays the burden of late stage (regional and distant) lung cancer cases in
each county compared to New Jersey. Total number of cases include in situ, local, regional, and distant stage.
Because unstaged cases were not used for the standardized proportion ratio calculation, caution is advised
when interpreting the results.
Map legend categories were created using equal intervals for the complete range of data for males and
females and then applying breakpoints to male and female data separately.
The NJSCR Data Guidelines containing comprehensive data analysis methods, race and ethnicity classification,
population and mortality data sources, and additional information related to NJSCR data can be found at
https://nj.gov/health/ces/reports.shtml.
Lung Cancer Disparities in Screening Age New Jersey Adults
TECHNICAL NOTES

8
1) American Cancer Society. Lung Cancer. Available at: https://www.cancer.org/cancer/lung-cancer.html. Accessed May 2018.
2) Noone AM, Howlader N, Krapcho M, Miller D, Brest A, Yu M, Ruhl J, Tatalovich Z, Mariotto A, Lewis DR, Chen HS, Feuer EJ,
Cronin KA (eds). SEER Cancer Statistics Review, 1975-2015, National Cancer Institute. Bethesda, MD, https://seer.cancer.gov/
csr/1975_2015/, based on November 2017 SEER data submission, posted to the SEER web site, April 2018.
3) New Jersey State Cancer Registry December 2017 file.
4) New Jersey State Cancer Registry. Cancer Incidence and Mortality in New Jersey, 2010-2014.
Available at: http://www.nj.gov/health/ces/documents/reports/report10-14.pdf. Accessed May 2018.
5) Centers for Disease Control and Prevention. Interpreting the Incidence Data. Centers for Disease Control and Prevention;
2005. Available at: https://www.cdc.gov/cancer/uscs/technical_notes/contributors/index.htm. Accessed December 2018.
6) Center for Disease Control and Prevention. Trends in Current Cigarette Smoking Among High School Students and Adults,
United States, 1965–2014. Available at: https://www.cdc.gov/tobacco/data_statistics/tables/trends/cig_smoking/index.htm.
Accessed May 2018.
7) American Lung Association. Lung Cancer Fact Sheet. Available at: http://www.lung.org/lung-health-and-diseases/lung-
disease-lookup/lung-cancer/resource-library/lung-cancer-fact-sheet.html. Accessed May 2018.
8) U.S. Department of Health and Human Services. Tobacco Use Among U.S. Racial/Ethnic Minority Groups—African
Americans, American Indians and Alaska Natives, Asian Americans and Pacific Islanders, and Hispanics: A Report of the
Surgeon General. Atlanta, Georgia: U.S. Department of Health and Human Services, Centers for Disease Control and
Prevention, National Center for Chronic Disease Prevention and Health Promotion, Office on Smoking and Health, 1998.
9) Centers for Disease Control and Prevention. Burden of Tobacco Use in the U.S. Available at: https://www.cdc.gov/tobacco/
campaign/tips/resources/data/cigarette-smoking-in-united-states.html. Accessed May 2018.
10) Centers for Disease Control and Prevention. Cigarette smoking And Tobacco Use Among People of Low Socioeconomic
Status. Available at: https://www.cdc.gov/tobacco/disparities/low-ses/index.htm. Accessed May 2018.
11) National Lung Screening Trial Research Team. "Reduced lung-cancer mortality with low-dose computed tomographic
screening." New England Journal of Medicine 365.5 (2011): 395-409.
12) U.S. Preventive Services Task Force. Final Recommendation Statement: Lung Cancer: Screening. Available at: https://
www.uspreventiveservicestaskforce.org/Page/Document/RecommendationStatementFinal/lung-cancer-screening. Accessed
May 2018.
13) Raz, Dan J., et al. "Perceptions and utilization of lung cancer screening among primary care physicians." Journal of Thoracic
Oncology 11.11 (2016): 1856-1862.
14) Jemal, Ahmedin, and Stacey A. Fedewa. “Lung Cancer Screening With Low-Dose Computed Tomography in the United
States—2010 to 2015.” JAMA Oncology 3.9 (2017): 1278–1281. PMC. Web. 15 May 2018.
15) Japuntich, Sandra J., et al. "Racial Disparities in Lung Cancer Screening: An Exploratory Investigation." Journal of the
National Medical Association (2017).
16) Siegel RL, Miller KD, Jemal A. Cancer statistics, 2018. CA Cancer J Clin 2018;68:7-30.
17) American Cancer Society. Facts & Figures 2018: Rate of Deaths from Cancer Continues Decline. Available at: https://
www.cancer.org/latest-news/facts-and-figures-2018-rate-of-deaths-from-cancer-continues-decline.html#helpful_resources.
Accessed October 2018.
18) New Jersey Department of Health. Healthy New Jersey 2020 Objectives, Baselines, and Targets: CA-14. Available at:
http://www.state.nj.us/health/chs/hnj2020/documents/objectives/allobjtable.pdf. Accessed December 2018.
REFERENCES