lte-u forum way forward on wfa test plan verizon, ericsson ... -presented final.pdf · lte-u forum...
TRANSCRIPT

1
WFA Workshop on Coexistence
LTE-U Forum Way Forward on WFA Test Plan
Verizon, Ericsson, Samsung, Nokia, LGE, T-Mobile, Qualcomm
Tamer Kadous
Sr. Director of Engineering
Qualcomm Research

26/22/2016
Brief reminder of LTE-U coexistence mechanisms
On Wi-Fi spectrum sharing performance
On Wi-Fi operating RSSI regime
− RSSI measurements from Wi-Fi chipsets can be biased
− Deployment recommendations from leading Wi-Fi suppliers and
professional installers confirm need for higher RSSI
− Measurements showing issues with Wi-Fi link at -80dBm
Summary and Recommendations
Outline
3
LTEu Coexistence Mechanisms

46/22/2016
Coexistence Mechanisms in LTE-U
− 1) Channel Selection – Frequency-domain (U-NII-1, U-NII-3)
− 2) Shared Channel – Time-domain
− 3) Opportunistic Scell – Turn Scell OFF when not needed
Real World
− Channel selection suffices in most cases
− Valid channel numbering for Wi-Fi, at 5 GHz, begins with channel 36
− LTE-U optionally leverages channel 32 (U-NII-1), not currently a valid channel for Wi-Fi
(see next slides)
− Even in extremely congested Wi-Fi scenarios, where Wi-Fi uses all the supported channels in U-NII-1
(ch 36, 40, 44, 48) and U-NII-3, the channel selection algorithm in LTE-U can optionally select
channel 32 (unused by Wi-Fi), avoiding interference to Wi-Fi
Coexistence Mechanisms in LTE-U

5
Current Valid Wi-Fi Channels for U-NII-1
36 40 44 48
Used by LTE-U (U-NII-3 channels are not shown)
LTE-U Forum creation
5160 5180 5200 5220 5240
Band
Edge
5150
Band
Edge
5250
32
20 MHz
Used by Wi-Fi
Can be Used by LTE-U if rest of UNII1/UNII3 are heavily used
( Invalid for Wi-Fi)

6
On WiFi Sharing

76/22/2016
A set of 4 Wi-Fi APs, A,B,C,D from different vendors
are considered
All tests are above ED
Each AP is connected to a STA
In each test, two APs and associated STAs are run
− Full buffer traffic
Test metric is how fair the two APs share with each
other
− Ideally, they would share 50% each
We repeat the test, replacing one of the
WiFi APs with LTE-U
Wi-Fi/Wi-Fi Sharing Example (Screen Room)
0 10 20 30 40 50 60 70 80 900
0.1
0.2
0.3
0.4
0.5
0.6
0.7
0.8
0.9
1Duty Cycle
Percentage
CD
F
W in 1W+1W
W in 1W+1L
L in 1W+1L
Observation: Wi-Fi APs do not share the medium
equally, Unequal sharing is attributed to several
factors, among which using different TxOP length
(802.11 spec allows different TxOP duration)
8
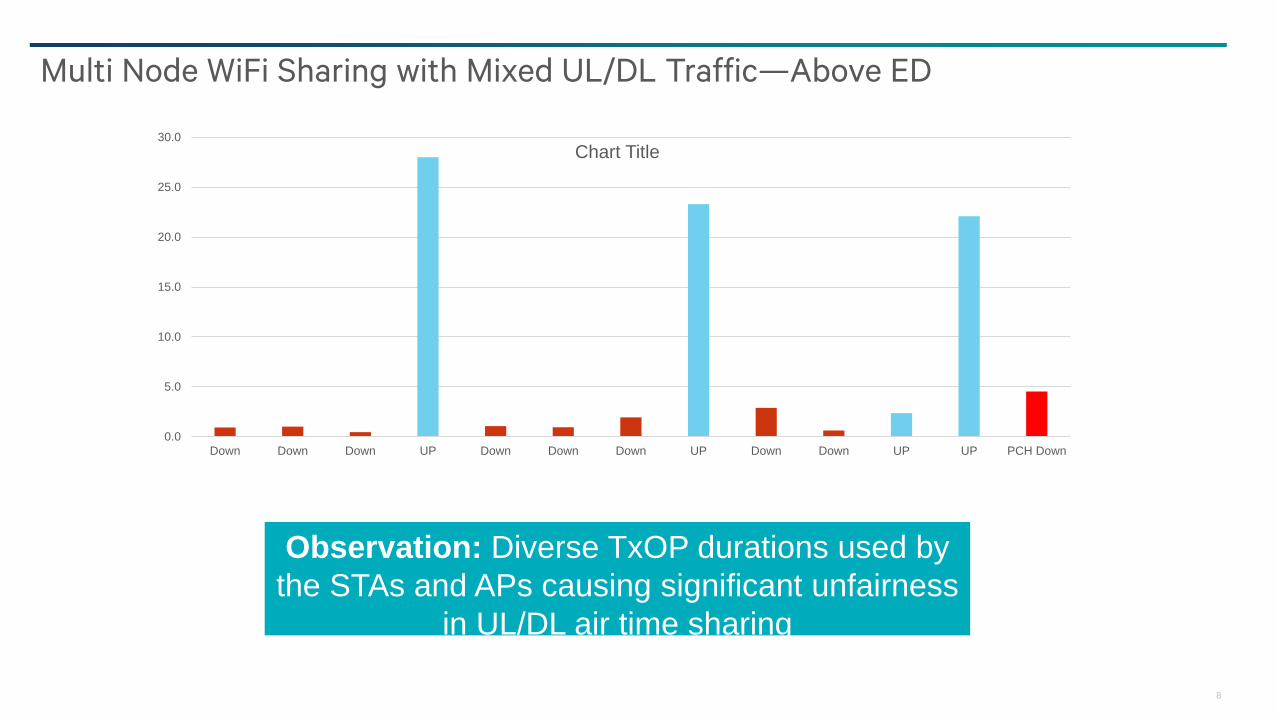
Multi Node WiFi Sharing with Mixed UL/DL Traffic—Above ED
0.0
5.0
10.0
15.0
20.0
25.0
30.0
Down Down Down UP Down Down Down UP Down Down UP UP PCH Down
Chart Title
Observation: Diverse TxOP durations used by
the STAs and APs causing significant unfairness
in UL/DL air time sharing
9
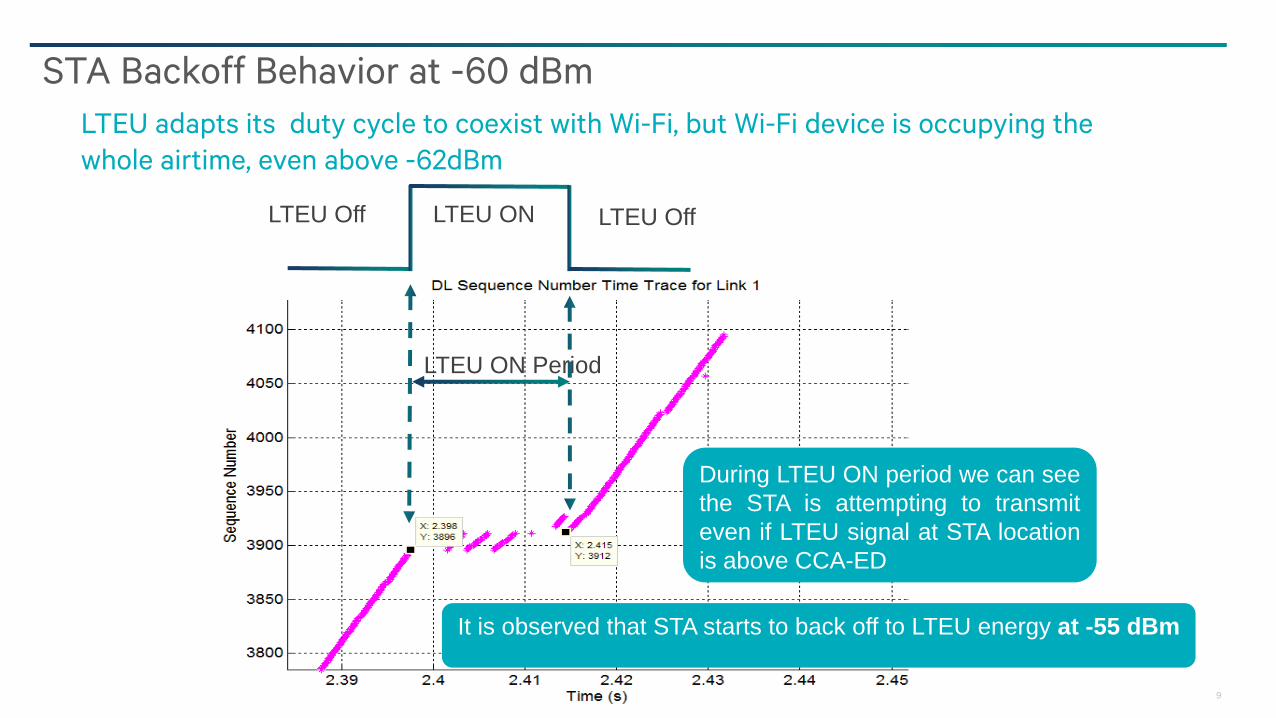
STA Backoff Behavior at -60 dBm
LTEU adapts its duty cycle to coexist with Wi-Fi, but Wi-Fi device is occupying the
whole airtime, even above -62dBm
During LTEU ON period we can see
the STA is attempting to transmit
even if LTEU signal at STA location
is above CCA-ED
It is observed that STA starts to back off to LTEU energy at -55 dBm
LTEU ON Period
LTEU ONLTEU Off LTEU Off

10
Below ED – SCH Results
Vendor A Vendor BW Baseline Thpt in Mbps
W+W Thpt in Mbps 29.0 11.5
Vendor A(40MHz)+Interferer(20MHz)SNR 0 dB
103.0
802.11 spec only defined preamble detection for Wi-Fi primary channel
In case of 802.11n/802.11ac where the BW can be > 20MHz (e.g. 40MHz, 80MHz,
160MHz)
− 802.11 spec only requires preamble detection @-82dBm on the primary 20MHz channel,
and energy detection at -62dBm on the secondary channel(s). 802.11ax increases the
sensitivity for detecting secondary channels from -62dBm to -72dBm
Therefore, Wi-Fi only protects other technologies above -62dBm, and for
protects other Wi-Fi nodes using its secondary channel only above -72dBm
• AP Vendor A is 40MHz, and AP Vendor B is
20MHz sharing AP A secondary channel
• Although the RSSI is -62dBm, the Vendor A AP is
not backing off to Vendor B AP, and significant
collisions occur resulting in low throughput for
both

11
On WiFi Operating RSSI Regime

12
Several WFA submissions have presented low Wi-Fi Reported RSSI measurements as an argument to further reduce the ED thresholdbelow -72 dBm
− These measurements have been presented as true absolute signalstrength numbers representing dBm
Regardless that SINR is the right approach, Wi-Fi measurements are known to be relative indicators, rather than absolute numbers, as supported by published papers, the IEEE 802.11 standard, enterprise documentation, and lab test results
− There is no fixed standard which Wi-Fi manufacturers are required to follow; thus, Wi-Fi RSSI measurements should only be considered asrelative indicators, and cannot be used to justify changes to ED thresholds
Background
13
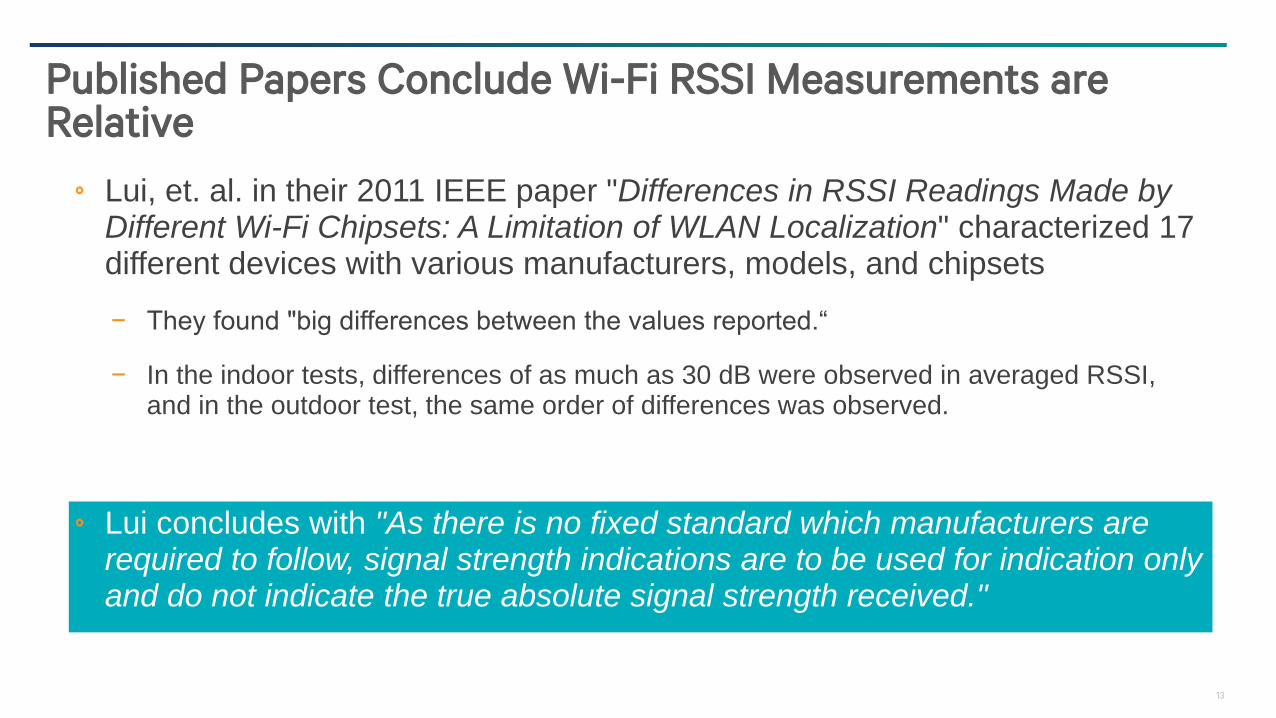
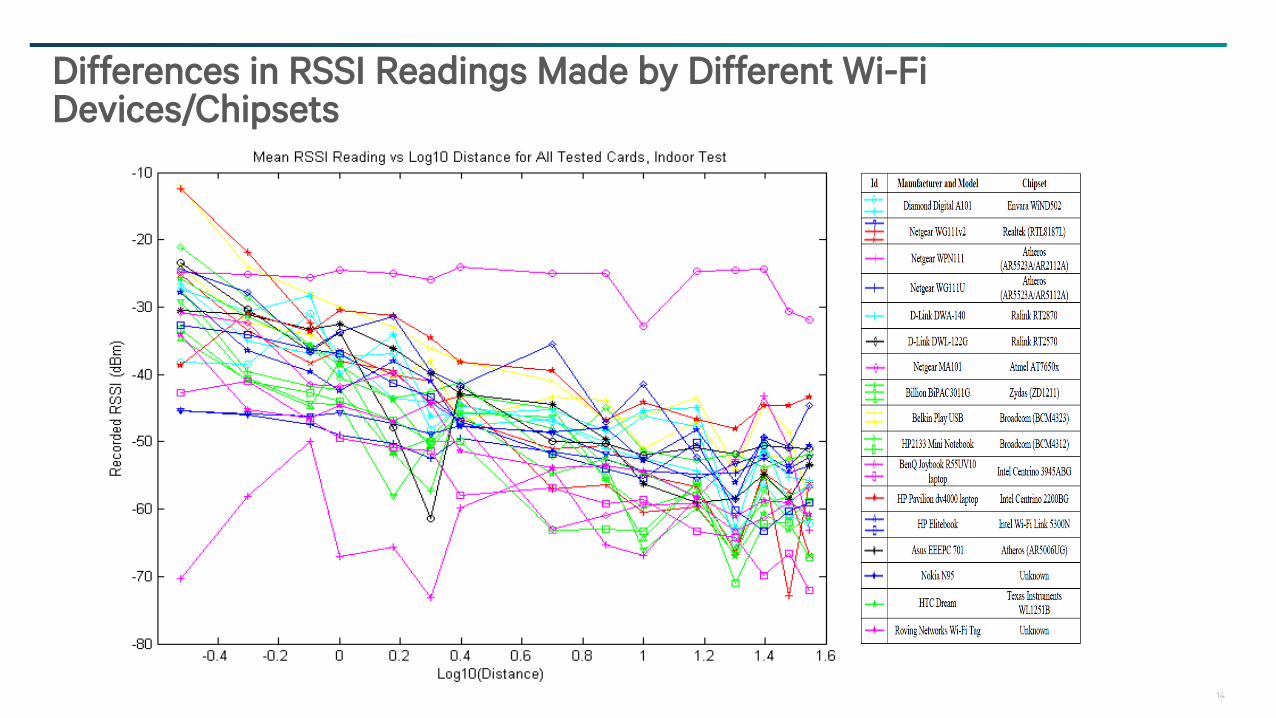
Lui, et. al. in their 2011 IEEE paper "Differences in RSSI Readings Made by Different Wi-Fi Chipsets: A Limitation of WLAN Localization" characterized 17 different devices with various manufacturers, models, and chipsets
− They found "big differences between the values reported.“
− In the indoor tests, differences of as much as 30 dB were observed in averaged RSSI, and in the outdoor test, the same order of differences was observed.
Lui concludes with "As there is no fixed standard which manufacturers are required to follow, signal strength indications are to be used for indication only and do not indicate the true absolute signal strength received."
Published Papers Conclude Wi-Fi RSSI Measurements are Relative
14
Differences in RSSI Readings Made by Different Wi-Fi Devices/Chipsets
15
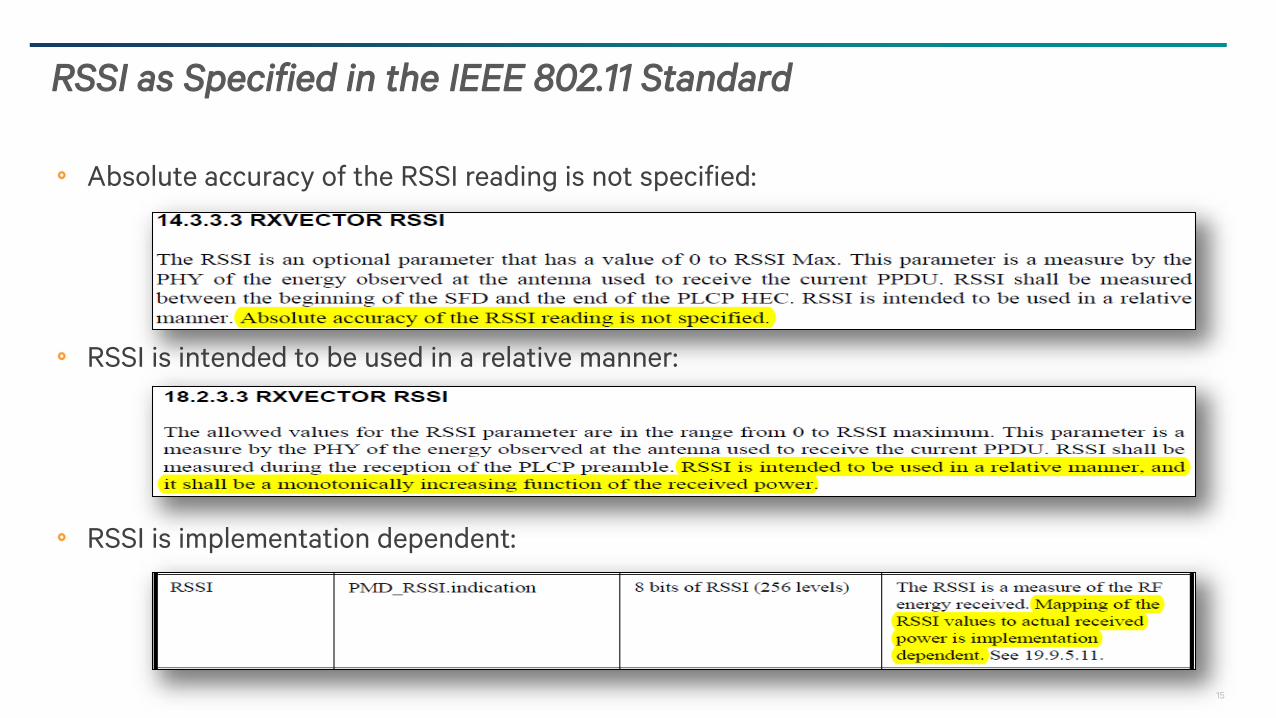
Absolute accuracy of the RSSI reading is not specified:
RSSI is intended to be used in a relative manner:
RSSI is implementation dependent:
RSSI as Specified in the IEEE 802.11 Standard
16
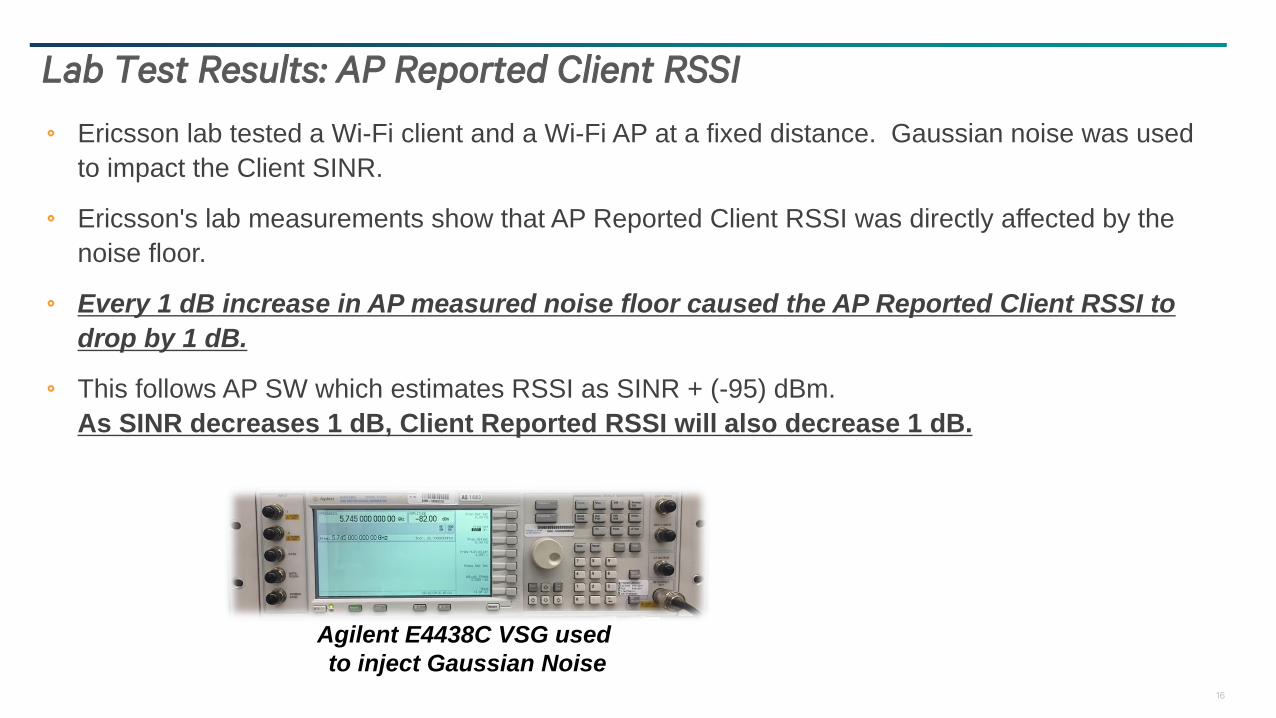
Ericsson lab tested a Wi-Fi client and a Wi-Fi AP at a fixed distance. Gaussian noise was used
to impact the Client SINR.
Ericsson's lab measurements show that AP Reported Client RSSI was directly affected by the
noise floor.
Every 1 dB increase in AP measured noise floor caused the AP Reported Client RSSI to
drop by 1 dB.
This follows AP SW which estimates RSSI as SINR + (-95) dBm.
As SINR decreases 1 dB, Client Reported RSSI will also decrease 1 dB.
Lab Test Results: AP Reported Client RSSI
Agilent E4438C VSG used
to inject Gaussian Noise
17
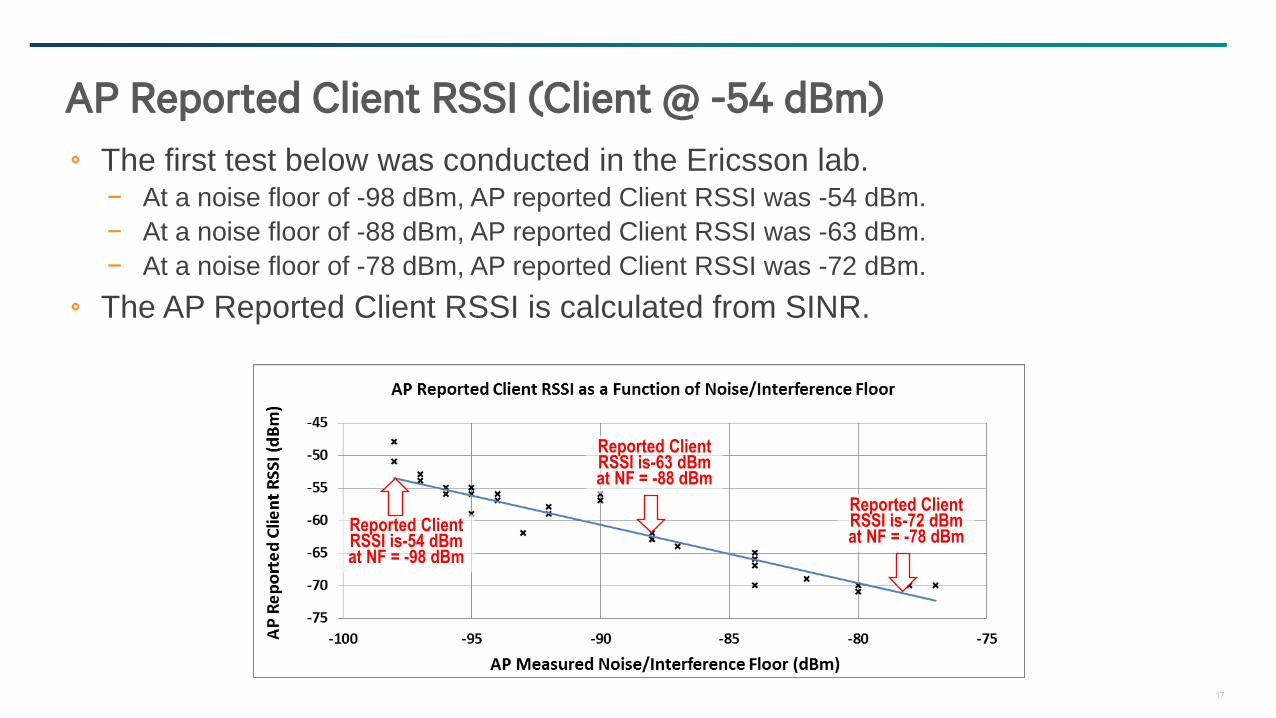
The first test below was conducted in the Ericsson lab.− At a noise floor of -98 dBm, AP reported Client RSSI was -54 dBm.
− At a noise floor of -88 dBm, AP reported Client RSSI was -63 dBm.
− At a noise floor of -78 dBm, AP reported Client RSSI was -72 dBm.
The AP Reported Client RSSI is calculated from SINR.
AP Reported Client RSSI (Client @ -54 dBm)
Reported ClientRSSI is-54 dBmat NF = -98 dBm
Reported ClientRSSI is-63 dBmat NF = -88 dBm
Reported ClientRSSI is-72 dBmat NF = -78 dBm

18
The second test below was conducted in the Ericsson lab.− At a noise floor of -98 dBm, AP reported Client RSSI was -71 dBm.
− At a noise floor of -88 dBm, AP reported Client RSSI was -81 dBm.
− At a noise floor of -78 dBm, AP reported Client RSSI was -91 dBm.
The AP Reported Client RSSI is calculated from SINR.
AP Reported Client RSSI (Client @ -71 dBm)
At NF = -98 dBmReported ClientRSSI is-71 dBm
At NF = -88 dBmReported ClientRSSI is-81 dBm
At NF = -78 dBmReported ClientRSSI is-91 dBm
19
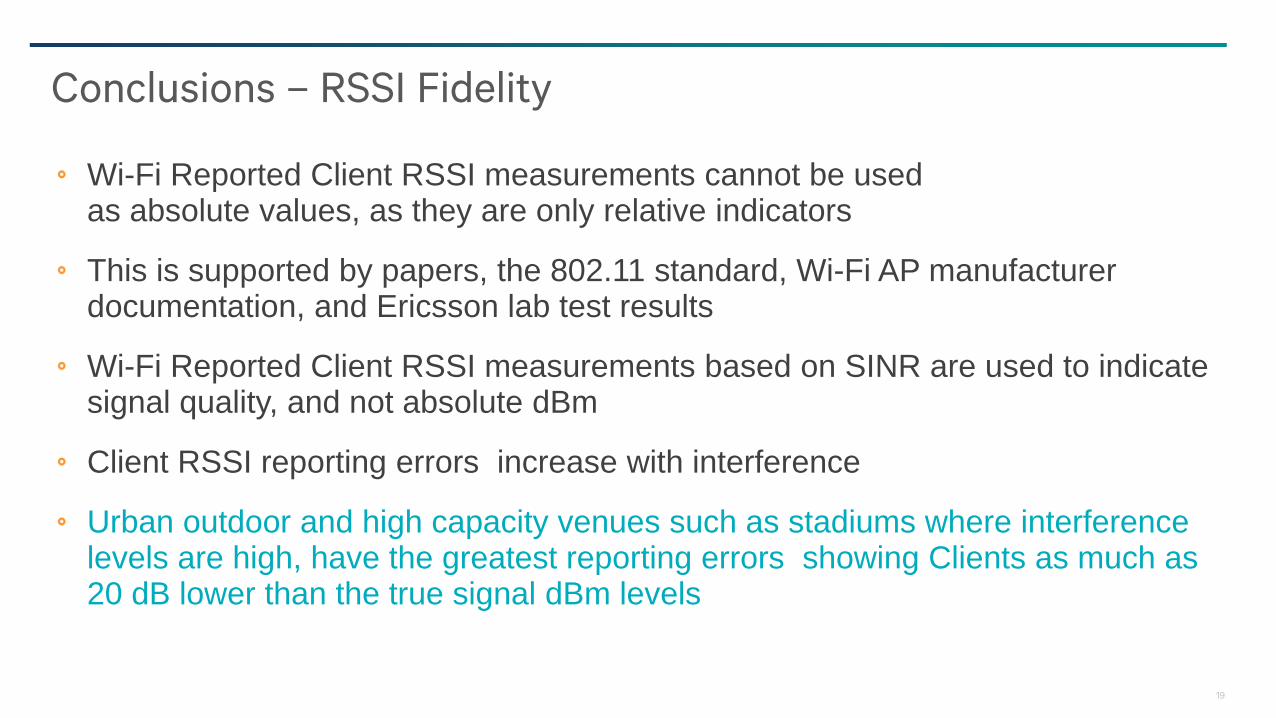
Wi-Fi Reported Client RSSI measurements cannot be usedas absolute values, as they are only relative indicators
This is supported by papers, the 802.11 standard, Wi-Fi AP manufacturer documentation, and Ericsson lab test results
Wi-Fi Reported Client RSSI measurements based on SINR are used to indicate signal quality, and not absolute dBm
Client RSSI reporting errors increase with interference
Urban outdoor and high capacity venues such as stadiums where interference levels are high, have the greatest reporting errors showing Clients as much as 20 dB lower than the true signal dBm levels
Conclusions – RSSI Fidelity
20
So What Does WiFiDeployment Guidelines say on RSSI Levels?
21
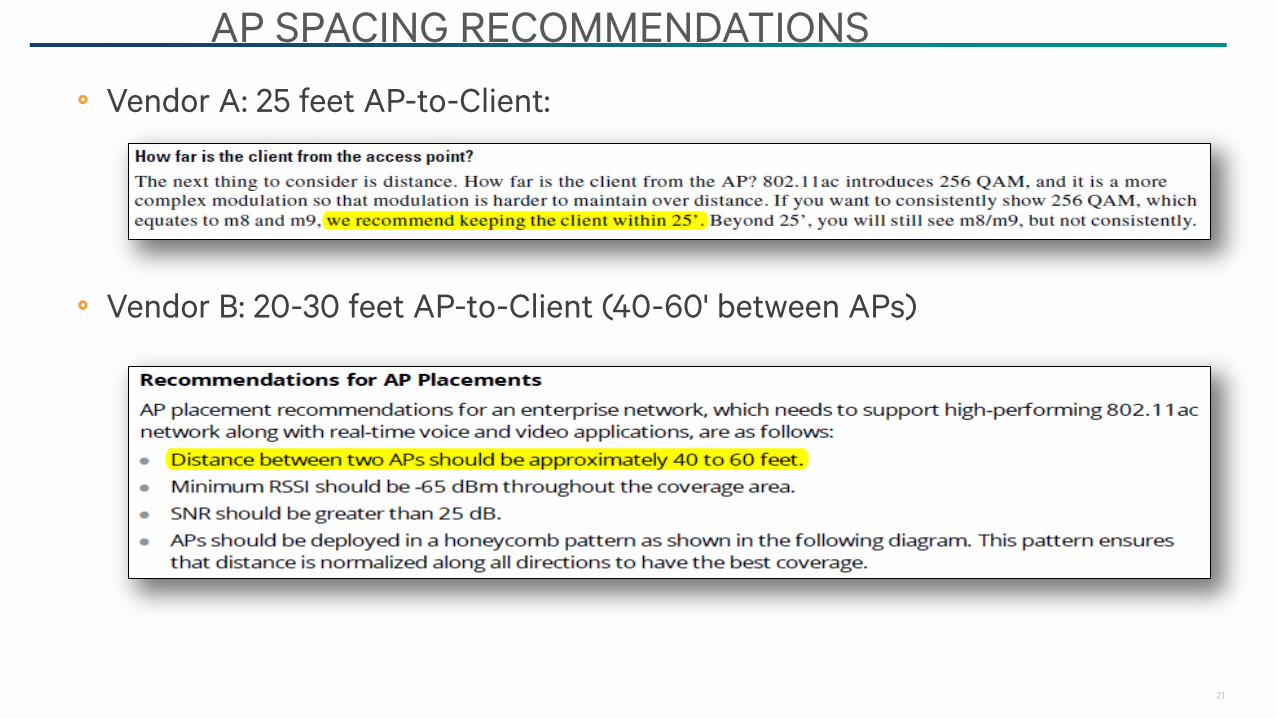
Vendor A: 25 feet AP-to-Client:
Vendor B: 20-30 feet AP-to-Client (40-60' between APs)
AP SPACING RECOMMENDATIONS
22
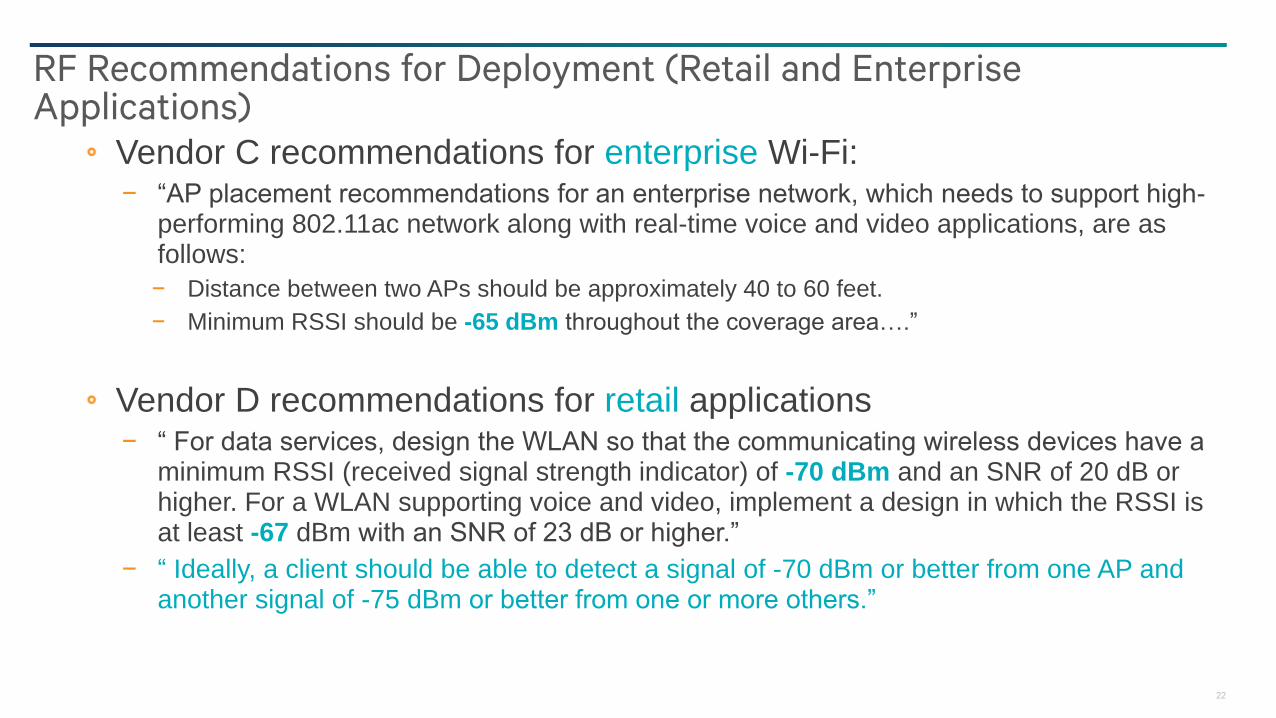
RF Recommendations for Deployment (Retail and Enterprise Applications)
Vendor C recommendations for enterprise Wi-Fi:− “AP placement recommendations for an enterprise network, which needs to support high-
performing 802.11ac network along with real-time voice and video applications, are as follows:
− Distance between two APs should be approximately 40 to 60 feet.
− Minimum RSSI should be -65 dBm throughout the coverage area….”
Vendor D recommendations for retail applications − “ For data services, design the WLAN so that the communicating wireless devices have a
minimum RSSI (received signal strength indicator) of -70 dBm and an SNR of 20 dB or higher. For a WLAN supporting voice and video, implement a design in which the RSSI is at least -67 dBm with an SNR of 23 dB or higher.”
− “ Ideally, a client should be able to detect a signal of -70 dBm or better from one AP and another signal of -75 dBm or better from one or more others.”

23
RF Recommendations for Deployment (Retail and Enterprise Applications) – Cont’d
Vendor E recommendations for enterprise Wi-Fi
− “Most application specific coverage guidelines describe the signal level or coverage at the cell edge required for good operation as a design recommendation. This is generally a negative RSSI value like -67 dBm. It’s important to understand that this number assumes good signal to noise ratio of 25 dB with a noise floor of -92 dBm. If the noise floor is higher than -92 dBm then -67 dBm may not be enough signal to support the minimum data rates required for the application to perform it’s function
− “For location-aware services, deploying a network to a specification on -67 dBm is fine –however what matters to location-aware applications is how the network hears the client –not how the client hears network. For Location-Aware we need to hear the client at three AP’s or more at a level of >= -75 dBm for it to be part of the calculation. (-72 is the recommended design minimum)”

24
RF Recommendations for Deployment (Retail and Enterprise Applications) – Cont’d
Vendor F recommendations for enterprise Wi-Fi
− “The AP coverage should be planned for a minimum of -65 dBm as observed by the most frequently
used client device for voice calls. The channel planning should be done in a way such that there is
substantial gap between the same channel cells - It is recommended that there is a ~20dB gap
between the cell boundaries. In cases where no ‘frequently used’ client is defined, the coverage should
be planned for a worst case scenario using a device with known poor roaming performance but with a
likelihood of being used in the network.”
iOS roaming recommendations https://support.apple.com/en-us/HT203068
− “iOS clients monitor and maintain the current BSSID’s connection until the RSSI
crosses the -70 dBm threshold. Once crossed, iOS initiates a scan to find roam
candidate BSSIDs for the current ESSID.”

25
HPE presented field measurements from indoor enterprise and large stadium
The measurements included both MyBSS (desired signal) and OBSS (interference) RSSI
levels – this is the right approach
− Previous field measurements from CL, Boingo, E/// only considered MyBSS RSSI distribution
The results from HPE are useful as it can shed some light SINR distribution to consider in
the test plans
− Especially that RSSI measurements can be biased as illustrated before
Results show that SINR distribution is in the range of 10-20 dB (see next slide)
HPE agreed with the high RSSI observation in myBSS and
recommended testing at -77dBm as mandatory
Interference and SINR Distribution from HPE Field Measurements
Recommendation: SINR distribution in the WFA TP should be
selected in the 10-20dB range. Some of current WFA test cases
have SINR in range of neg30dB which is contradictory with field
measurements

26
Original: Measurement Results: Bay Area Enterprise (All Channels)
Channels: 36+, 44+, 52+, 108+ and 157+Duration: ~15 min on each channelNoise floor: -92dBm
MyBSSID Count: 15OBSSID Count: 199My STA Count: 378OBSS STA Count: 1157
Packets Captured:MyBSS: 12,839,489OBSS: 13,631,534Total: 26,471,023
Traffic below -72dBm:MyBSS: 5.4%OBSS: 65%MyBSS+OBSS: 36%
June 22, 2016

27
Empirical Analysis
-10 0 10 20 30 40 500
0.1
0.2
0.3
0.4
0.5
0.6
0.7
0.8
0.9
1
SINR dB
F(x
)
SINR: BayArea Enterprise
-100 -90 -80 -70 -60 -50 -40 -300
0.1
0.2
0.3
0.4
0.5
0.6
0.7
0.8
0.9
1
x
F(x
)
Bayarea Enterprise
MyBSS RSSI
OBSS RSSI
28
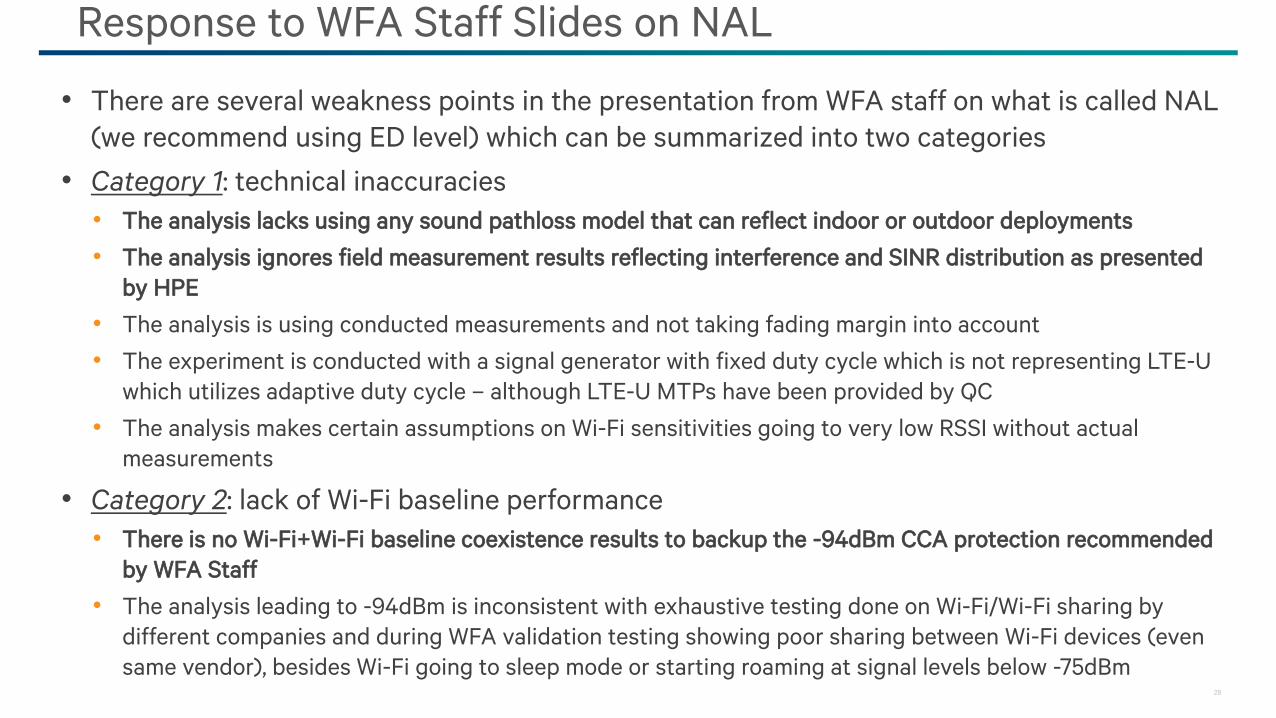
• There are several weakness points in the presentation from WFA staff on what is called NAL
(we recommend using ED level) which can be summarized into two categories
• Category 1: technical inaccuracies
• The analysis lacks using any sound pathloss model that can reflect indoor or outdoor deployments
• The analysis ignores field measurement results reflecting interference and SINR distribution as presented
by HPE
• The analysis is using conducted measurements and not taking fading margin into account
• The experiment is conducted with a signal generator with fixed duty cycle which is not representing LTE-U
which utilizes adaptive duty cycle – although LTE-U MTPs have been provided by QC
• The analysis makes certain assumptions on Wi-Fi sensitivities going to very low RSSI without actual
measurements
• Category 2: lack of Wi-Fi baseline performance
• There is no Wi-Fi+Wi-Fi baseline coexistence results to backup the -94dBm CCA protection recommended
by WFA Staff
• The analysis leading to -94dBm is inconsistent with exhaustive testing done on Wi-Fi/Wi-Fi sharing by
different companies and during WFA validation testing showing poor sharing between Wi-Fi devices (even
same vendor), besides Wi-Fi going to sleep mode or starting roaming at signal levels below -75dBm
Response to WFA Staff Slides on NAL

29
Conclusion – Best Practices
Sound engineering practices from Wi-Fi equipment vendors recommend a
minimum signal level that ranges between -65 dBm to -72 dBm, for retail and
enterprise applications
Both guidelines and measurements are showing 20+dB SINR, something
completely ignored in NAL analysis by staff and can significantly change the
picture
30
WiFi Unpredictable behavior at low RSSI

31
Bi-directional VoIP flow @ -80dBm – Delay Issues
DL & UL One Way Delay peaks at the same time for same duration
2 out of 5 iterations exhibited high One Way Delay (OWD) values
Downlink OWD time plot Uplink OWD time plot
Similar behavior seen on several popular products

32
STA’s Power Save modeIn the middle of call, STA goes to power save mode for 140ms
− Most probable reason: Wi-Fi scanning
STA going to Sleep
STA wake up from
Sleep
140
ms
DL Voice packets
UL Voice packets
2ms
• Wi-Fi links can have unpredictable performance at -80dBm, which aligns with
deployment recommendation for Wi-Fi to be above -70dBm or higher
33
Additional comments on other test cases

34
On Throughput Influencers
• Modulation & Coding
• MIMO
• Carrier Bandwidth
• Overhead
• SINR
• Transmit Power
• IRC
• Beamforming
• Receiver Noise Figure
• Transmitter EVM
• Burst duration
• Contention Windows
• LBT / Duty Cycle
• Blocking Rate
• Utilization
Medium Availability
Time on Air
Spectral Efficiency
Interference
Throughput Influenced by many aspects
that do not represent “Fairness”
Air Interface Utilization is a better metric

35
In-device coexistence is not unique to LTE-U/Wi-Fi, as the problem occurs in
other scenarios
− Wi-Fi/BT
− LTE in B40/B7 and Wi-Fi
In-device coexistence is out of scope of the WFA test plan which is defining
sharing with other existing Wi-Fi devices
In-device coexistence solutions were introduced in Rel-11 to handle multi-radio
coexistence problems
If concurrency is required by operators, UE can solve IDC problems internally
through proprietary implementation, or indicate IDC problem to eNB which can
utilize any of the solutions introduced in Rel-11
− Currently implemented and commercialized for the problems above
In-Device Coexistence Testing

366/22/2016
The general principle for test development so far in the group is that there should not be any requirement for LTE-U nodes to implement Wi-Fi transceiver module in their device for the sole purpose of coexistence – this has been widely ignored in TP and staff recommendations
RSSI measurements by Wi-Fi devices cannot be used as absolute values since the measurements can be biased with interference level
Sound engineering practices from Wi-Fi equipment vendors recommend a minimum signal level that ranges between -65 dBm to -72 dBm & SINR of 20+dB for retail and enterprise applications
− This is further confirmed from observing that Wi-Fi devices (STAs) typically start scanning other channels and may go into sleep mode for RSSI levels below -75dBm
− Wi-Fi field measurements show that SINR range is typically 10-20dB
Adopt -72dBm as mandatory ED level and below -72dBm as optional
− Wi-Fi backs off to other technologies and to Wi-Fi on its secondary channels above -62dBm
− Some Wi-Fi implementation even does not backoff at -62dBm
In-Device coexistence test should be removed from the test plan as it is clearly out of scope
Summary and Recommendations

37
Thank you

38
Back up

396/22/2016
CableLabs presented compiled data consisting of 1 million RSSI samples from over
13,000 outdoor APs. These RSSI samples varied from -52 dBm to -96 dBm, and were
stated as being absolute values.
It has been explained that this AP data is not absolute, but is a relative measurement of
SINR.
Moreover, the presented "absolute RSSI values" is not theoretically possible, as it does
not account for fade margin. The best 5 GHz AP, running mcs0, with a receive sensitivity
of -96 dBm, can only recover to -88 dBm over the air. This is well understood by RF
engineers.
Outline
406/22/2016
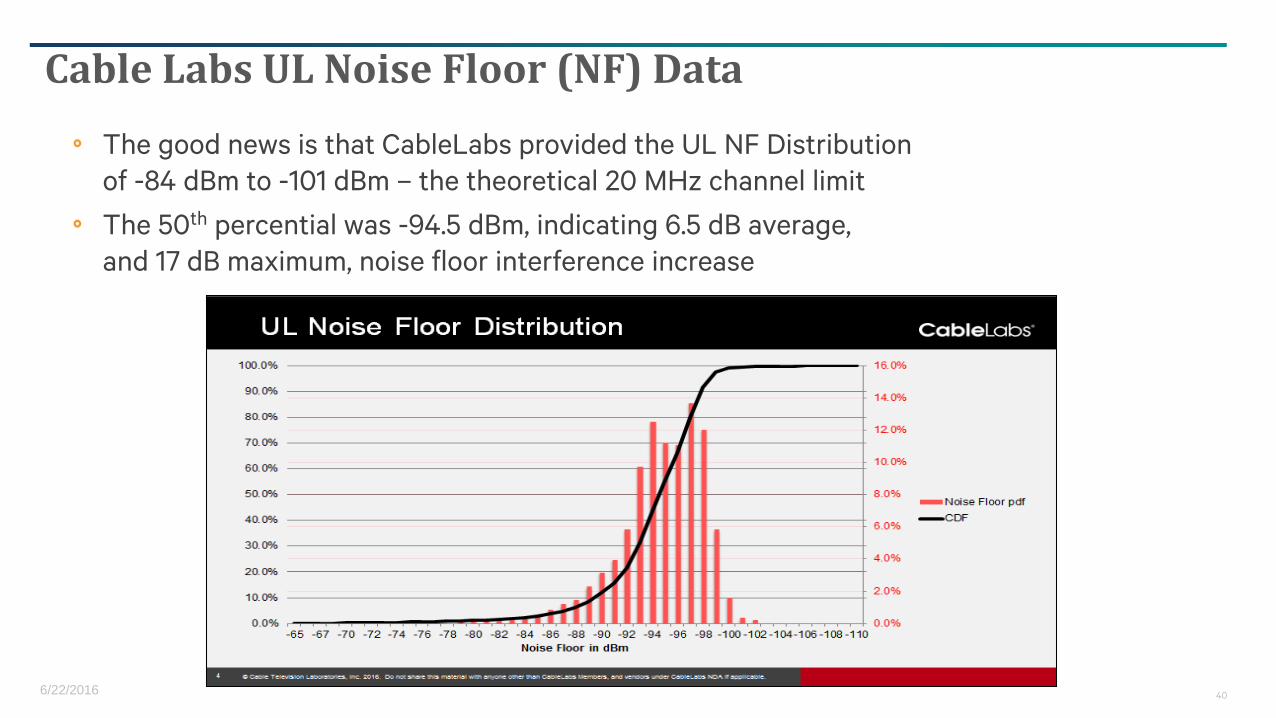
The good news is that CableLabs provided the UL NF Distribution
of -84 dBm to -101 dBm – the theoretical 20 MHz channel limit
The 50th percential was -94.5 dBm, indicating 6.5 dB average,
and 17 dB maximum, noise floor interference increase
Cable Labs UL Noise Floor (NF) Data

41
UL NF is used to re-baseline the -101 dBm thermal NF
UL NF is a measure of the lowest signal level detected over a 3-minute interval, and is used by the receiver to set AGC levels
The plot below is a spectrum analyzer capture of channel 153in our Ericsson lab. The environment is relatively clean, with a noise floor of -98 dBm, and most interference below -85 dBm.
What Does UL Noise Floor (NF) Report?
-98 dBm

42
Effect of Interference on Client Reported RSSI
The lab plots below shows the effect of noise interference onClient Reported RSSI, initially seen (red) as -76.4 dBm.
A 10 dB interference noise increase causes the Client Reported RSSI (blue) to be seen as -82.7 dBm (6.3 dB).
Each test ran for over 200,000 collected sample points.
MEAN INTERFERENCE -95 dBm MEAN INTERFERNCE -90 dBm
ClientReported
RSSI-76.4 dBm
ClientReported
RSSI-82.7 dBm

436/22/2016
CableLabs showed an UL RSSI Distribution of -52 to -94 dBm.
Packets were shown as being received to cabled sensitivity
which represents a "low cabled SINR" of 3 dB.
CableLabs UL RSSI Distribution
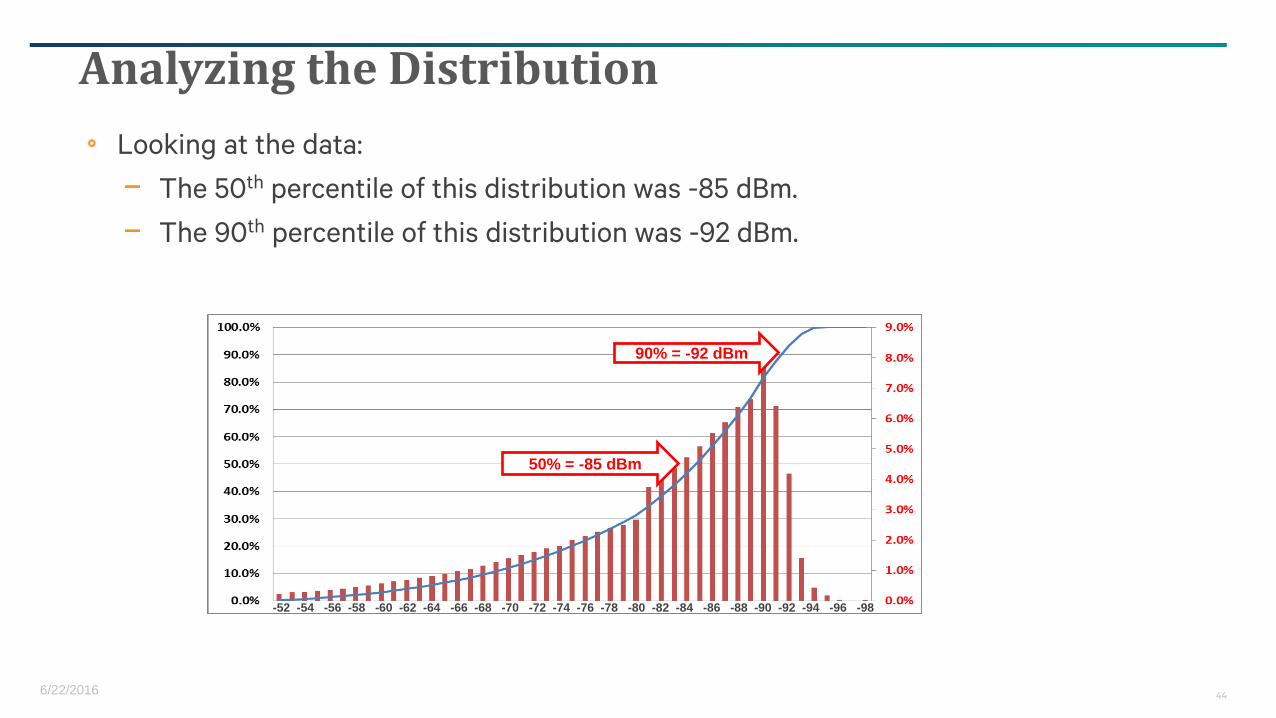
446/22/2016
Looking at the data:
− The 50th percentile of this distribution was -85 dBm.
− The 90th percentile of this distribution was -92 dBm.
Analyzing the Distribution
-52 -54 -56 -58 -60 -62 -64 -66 -68 -70 -72 -74 -76 -78 -80 -82 -84 -86 -88 -90 -92 -94 -96 -98
90% = -92 dBm
50% = -85 dBm

456/22/2016
The previous numbers represent SINR, and must be adjusted to include the
measured noise floor values.
− The 50th percentile of this distribution becomes -78 dBm.
− The 90th percentile of this distribution becomes -85 dBm.
Accounting for CableLabs NF
-52 -54 -56 -58 -60 -62 -64 -66 -68 -70 -72 -74 -76 -78 -80 -82 -84 -86 -88 -90 -92 -94 -96 -98
90% = -85 dBm
50% = -78 dBm

466/22/2016
We showed that Noise Floor variability (i.e. interference) affects the RSSI reading
Adjusting a minimal 5 dB of interference, we see:
− The 50th percentile of this distribution was -75 dBm
− The 90th percential of this distribution was -82 dBm
These numbers are best case "guestimates" and unreliable
Including 5 dB of NF Variability
-52 -54 -56 -58 -60 -62 -64 -66 -68 -70 -72 -74 -76 -78 -80 -82 -84 -86 -88 -90 -92 -94 -96 -98
90% = -82 dBm
50% = -75 dBm

476/22/2016
CableLabs field data are relative measurements
The data represents SINR – i.e. signal quality, and is not intended to be used as absolute
RSSI numbers
A best case "guestimate" shows a 10 dB error in the presented
"absolute RSSI" values, however, this guestimate makes many assumptions about
interference, and calibration
None of the APs in the field have RSSI factory calibrated. It is not required by the IEEE, nor
by the WFA. RSSI is a relative measure
CableLabs data cannot be used to draw conclusions about absolute dBm values, and
therefore, cannot be used to define an ED Threshold
Summary