lte performance for initial deployments
TRANSCRIPT

LTE performance for initial deployments
White paper
LTE performance for initial deployments2
Contents
2 Executive summary
3 Motivation and background
4 Test environment4 Goals and scenarios5 Test configuration6 Test bed description
8 Results of the drive tests8 Campus route9 Wide area route10 Long distance route
12 Lab tests and simulations12 Speed tests13 QoS measurements
14 Conclusion
15 Glossary
15 References
Executive summary
It is no longer a question of whether LTE (Long Term Evolution) and SAE (System Architecture Evolution) are on the way. The question is now about when, where and how LTE/SAE will arrive. Regardless of what motivates each operator to make the transition, it is essential to demonstrate the stability and performance of the new systems at an early stage in order to promote the smooth and cost-efficient introduction and deployment of LTE/SAE technology. This is true both within companies and as part of wider, coordinated efforts towards interoperability. Since the 3GPP specifications are now reasonably well defined and stable, the time is right to evaluate performance and to publish the most interesting results.
Nokia Siemens Networks has therefore been working closely with the Fraunhofer Institute for Telecommunications Heinrich-Hertz-Institut in Berlin to measure the performance of LTE radio systems under real network deployment conditions, complete with appropriate feature sets. A series of drive tests was performed in the vicinity of installed LTE test beds in the center of two major German cities. Analysis of the resulting data will help us design and optimize the related products as early as possible.
Nokia Siemens Networks focused particularly on the most likely scenarios for the early introduction of LTE/SAE. This is especially relevant for radio base station antenna sites and antenna configurations where there are established 3G networks.
The real world outdoor drive tests performed by our development engineers were completed with selected lab tests. This is useful where it would be impractical in a real drive test to create conditions in general or the level of stability needed to distinguish between all the factors that might affect the results.
Our results show that the design goals of LTE, as currently incorporated in the 3GPP specifications, can be met with a great deal of certainty and reliability. The LTE system is stable and robust, which is essential to provide adequate support for the high data rates required. This document also provides information on the cell edge coverage and the system behavior in multi-user scenarios. This is in line with our strategy of providing system insight that is relevant to real world situations.

LTE performance for initial deployments 3
Motivation and background
LTE is an important evolutionary step that builds on GSM/EDGE and WCDMA/HSPA to make higher data rates for mobile broadband services economically viable. The LTE/SAE approach is also suitable for replacing existing CDMA2000 networks. It is therefore important to prove as early as possible that the system can live up to its promises. This paper is intended to help achieve this goal from the radio perspective.
The LTE system is based on an OFDM radio interface, while SAE defines and implements scalable and flat network architecture. The two approaches are currently standardized by 3GPP for Release 8. A high-level description of the LTE air interface and SAE network architecture can be obtained from [1]. The standardization process is in its final stage with a first set of LTE specifications planned for end of the first quarter of 2009.
Market observations report that data traffic in existing WCDMA/HSPA and CDMA networks is growing dramatically. Consequently, many mobile network operators are looking for early deployments of a highly efficient mobile broadband technology such as LTE. The first commercial network deployments are expected in the second half of 2010, with field trials taking place in the second half of 2009.
In order to achieve a smooth and stable service introduction, both vendors and operators want to test the performance and behavior of the new
technology under various lab and real world deployment conditions as soon as possible. The field experience and the knowhow gained will help to optimize the design of infrastructure solutions, as well as network planning and field deployment. This will benefit operators and vendors alike.
The LTE/SAE Trial Initiative (LSTI) was founded by industry leaders in May 2007 to meet this need and demonstrate the feasibility and capabilities of 3GPP LTE-SAE technology [2]. LSTI participants established a phased plan and are making good progress with the test program. In the Proof of Concept (PoC) test phase, the performance of various configurations of the LTE/SAE standard (such as SIMO, 2x2 MIMO and 4x4 MIMO) were evaluated by several vendors. As part of the program, the peak data rates of the LTE configurations were tested under ideal lab conditions. Recently, some LSTI members have complemented these lab tests with outdoor tests in realistic deployment scenarios.
In the next phase, LSTI will focus on interoperability testing between different vendor equipment by performing interoperability development tests (IODT) and interoperability tests (IOT) based on pre-commercial LTE equipment. LSTI also plans to perform friendly customer trials in the near future. Nokia Siemens Networks is deeply involved at every stage and we are a major contributor to all established LSTI activities.
To perform substantial tests under real world deployment scenarios and as a pre-requisite for LSTI PoC phase 2, Nokia Siemens Networks has installed two LTE test beds in the German cities of Munich and Berlin. The reason for operating two installations is to evaluate the performance of LTE in a number of real urban deployment scenarios that are regarded as typical for major LTE deployments.
It is worth noting that Nokia Siemens Networks’ strategy is to concentrate on typical LTE start-up scenarios for initial LTE deployments, rather than testing the sophisticated technology options that will be deployed in later phases of a network rollout. LTE will initially be rolled out in urban and suburban areas and will re-use as many antenna sites as possible. Munich and Berlin are therefore ideal for these tests since they are typical suburban and urban deployments, including the antenna heights favored in larger European cities. The LTE base station (BTS) equipment has been collocated with commercial 3G equipment on existing sites. This is a likely option for commercial LTE deployments by most operators.
Moreover, and in alignment with this assumption, all tests were performed with 2x2 MIMO antenna configurations using slim-line cross-polarized multiband antennas, which are commercially deployed in existing 3G networks for leveraging RX diversity gains. 4x4 MIMO systems will only be added later to accommodate the increasing traffic in commercial LTE networks. Such systems will require additional technology innovation to support e.g. the integration of 4 RX antennas in terminals. Nokia Siemens Networks will test such configurations when increasing capacity requirements justify operators’ investments in these systems. Likewise, additional tests for rural deployment scenarios will take place after initial LTE network deployments.

LTE performance for initial deployments4
Test environment
Goals and scenarios
Nokia Siemens Networks was the first to demonstrate a live transmission via an LTE air interface at the ITU Congress in Hong Kong in November 2006. We were also first to perform an LTE multi-user field trial under real world urban deployment conditions in the center of Berlin in December 2007 [3].
In the meantime, many additional tests for LTE were performed using the test beds already mentioned. These tests were carried out for both the FDD and TDD mode of the LTE air interface standard. This paper concentrates on FDD tests.
The tests were designed to:• demonstrate that LTE works in a
stable way and to prove the radio link performance assumptions under realistic initial LTE deployment scenarios in typical suburban/urban campus and wide area environments
• demonstrate that LTE delivers high transmission performance at the cell edge and to show which data rates can be achieved there by using suitable antenna heights and near line of sight (LOS) propagation conditions in urban areas
• explore achievable throughput rates in a single and multi-user environment, both outdoors and inside buildings
• verify the optimal scheduler behavior of LTE base stations for mixed QoS scenarios under various channel conditions
• test the impact of UE speeds on link performance using the different modulation schemes
• quantify the impact of an adaptive MIMO switching mode (single stream/dual stream transmission) under real world conditions.
With this in mind, we selected three test cases/drive routes of our test program for this paper:(1) A route on the Nokia Siemens
Network campus in Munich within about 300 meters of the base station antenna.
(2) A wide area route on public streets within about 1000 meters of the Munich test site antenna.
(3) A long distance route up to about 4000 meters from the base station at the Berlin test site.
Test cases (1) and (3) were performed with a single mobile user terminal. Test case (2) used four user terminals in parallel. Two terminals were real mobiles in a measurement van, while the others were stationary and placed in a building in order to measure the impact on system performance of indoor penetration.
To complement the results gained from the “real world” measurements, information from the following lab tests is also presented in this paper:• Layer 1 and IP throughput as a
function of the modulation scheme and the UE speed.
• QoS achievements of two different bearers (best effort traffic bearer and guaranteed bit rate (GBR) bearer) as a function of the signal-to-noise ratio (SNR).
To improve the clarity and visibility of the results, this paper presents the data in a new way. Rather than using the Cumulated Distribution Function (CDF) of the achieved throughput rates, a presentation of the achieved throughput along the drive route has been chosen.

LTE performance for initial deployments 5
Test configuration
All tests were performed using the Nokia Siemens Networks LTE development platform, which consists of an LTE base station, a specially developed LTE test terminal, GPS receivers and various laptops to act as local maintenance terminals, application servers and application clients (Figure 1).
The test terminals implement a modular structure combining boards of SW-upgradeable digital signal processors (DSPs) and field programmable gate arrays (FPGAs). The test mobile controller (LMT) allows engineers to select operating modes such as fixed MCS, link adaption, SIMO, MIMO and so on. All performance data is displayed on the local management controller and stored in a log file for further analysis.
The LTE development platform currently operates in the 2.6 GHz frequency band, which is expected to be the initial spectrum band for LTE deployment in Europe. It supports bandwidth options up to 20 MHz with 2x2 MIMO antenna configurations, controls a single cell environment and can be flexibly adapted to any changes required to conform to the latest LTE specifications. As the standard becomes increasingly fixed, however, the test system will be adapted to match commercial LTE base station and pre-commercial terminal hardware in near future.
A measurement van was used to accommodate the mobile terminals for the drive tests. Two UEs (UE2, UE3) are mounted in the car and are connected to antennas on the roof (Figure 2). This provides variable SNR as channel conditions change along the drive route.
Both UE3 antennas
Both UE2 antennas
LTE test terminal 2
Applicationclient
GPS tracking
LMT for the LTE test
terminal 2
Remote control of the
eNB LMT
LMT for the LTE test
terminal 3
Optional:LTE test terminal 3
LMT
Server high priority
services
Server low priority services
Internetaccess
Time server (NTP)
Measurement controller for
lab tests
Local measurement
database
LTE FDDterminal
Applicationclient
GPS receiver
LMTLocal
measurement database
NSNeNB
LTE FDD
GPS receiver
LMTLocal
measurement database
LTE FDDterminal
Applicationclient
U-planegateway
GPS receiver
Figure 1. Nokia Siemens Networks LTE development platform
Figure 2. Measurement van with LTE UEs

LTE performance for initial deployments6
The same test configuration is used in lab tests, but instead of transmitting via the air interface, the LTE base station and UE are connected to a channel simulator that implements various radio channel characteristics and noise situations.
The LTE development platform supports a multitude of modulation and coding schemes (MCS) and other parameters that are used during the tests (see Figure 3).
Test bed description
The test site in Munich is installed on the Nokia Siemens Networks campus. The LTE antenna is mounted on a pole on the roof of a building at a height of 30 meters above the ground (see the upper antenna in Figure 4), co-sited with an WCDMA antenna (middle antenna) and a Flash-OFDM antenna (lowest antenna) on the same pole. It is a commercial 3-sector cross-polarized wideband antenna with 45° directivity operating in a frequency range of 1800 to 2600 MHz. The system can support MIMO implementing an antenna gain of about 18 dBi.
Carrier frequency 2.6 GHz (UMTS Extension band)
Duplex FDD
Scalable bandwidth 20 MHz, 10 MHz, 5 MHz
Data rate @ 20 MHz >150 Mbps (DL), >50 Mbps (UL)
Transmission Time Interval (TTI) 1 ms
Tx power DL 40 dBm
Tx power UL 23 dBm
Modulation schemes:
• Downlink OFDMA (64QAM, 16QAM, QPSK)
• Uplink SC-FDMA (16QAM, QPSK)
Antenna techniques:
• Downlink 2x2 MIMO
• Uplink SDMA, Rx-Diversity
CQI based link adaptation (DL) Time, Frequency, Space
Setup single Cell – multi user
Number eUE per Node B per Sector 4
Figure 3. Features of LTE development platform for FDD mode
Figure 5. Data rates along campus and wide area routes in Munich
Figure 4. LTE antenna at Munich test site

LTE performance for initial deployments 7
The LTE test bed in Berlin is operated by Nokia Siemens Networks in cooperation with the Heinrich-Hertz-Institut and located on the city-center campus of the Technical University Berlin. As shown in Figure 6, the overall scenario consists of three base station sites, each of them with three sectors (30°, 150°, 270°). The sector marked ➀ was used for the measurements outlined in this paper. It is served by an antenna on top of a tower at a height of 85 meters above ground. The downtilt of the antennas is typically set to cover a radius of 500 meters (optionally 0–10°), which corresponds to the typical setup of commercial UMTS antennas. The distance between the sites is approximately 500 meters. All sites are synchronized using Rubidium-disciplined GPS-clocks.
For the long distance measurements shown below, the northeast sector of the antenna set on the Telefunken building was used, and the antenna downtilt was modified to 1°.
Figure 6. Test site Berlin
LTE performance for initial deployments8
Results of the drive tests
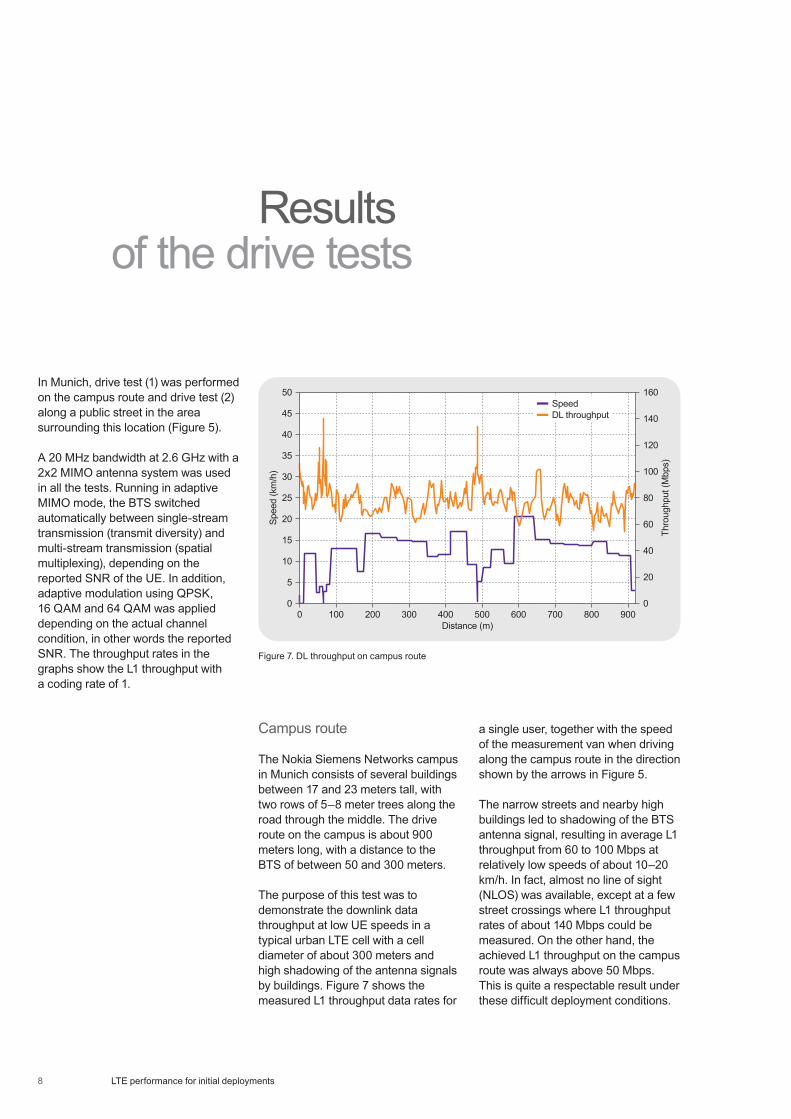
In Munich, drive test (1) was performed on the campus route and drive test (2) along a public street in the area surrounding this location (Figure 5).
A 20 MHz bandwidth at 2.6 GHz with a 2x2 MIMO antenna system was used in all the tests. Running in adaptive MIMO mode, the BTS switched automatically between single-stream transmission (transmit diversity) and multi-stream transmission (spatial multiplexing), depending on the reported SNR of the UE. In addition, adaptive modulation using QPSK, 16 QAM and 64 QAM was applied depending on the actual channel condition, in other words the reported SNR. The throughput rates in the graphs show the L1 throughput with a coding rate of 1.
Campus route
The Nokia Siemens Networks campus in Munich consists of several buildings between 17 and 23 meters tall, with two rows of 5–8 meter trees along the road through the middle. The drive route on the campus is about 900 meters long, with a distance to the BTS of between 50 and 300 meters.
The purpose of this test was to demonstrate the downlink data throughput at low UE speeds in a typical urban LTE cell with a cell diameter of about 300 meters and high shadowing of the antenna signals by buildings. Figure 7 shows the measured L1 throughput data rates for
Speed50
0
160
140
120
100
80
60
40
20
0
10
20
30
40
5
15
25
35
45
0 100 200 300 400 500 600 700 800 900Distance (m)
Spee
d (k
m/h
)
Thro
ughp
ut (M
bps)
DL throughput
a single user, together with the speed of the measurement van when driving along the campus route in the direction shown by the arrows in Figure 5.
The narrow streets and nearby high buildings led to shadowing of the BTS antenna signal, resulting in average L1 throughput from 60 to 100 Mbps at relatively low speeds of about 10–20 km/h. In fact, almost no line of sight (NLOS) was available, except at a few street crossings where L1 throughput rates of about 140 Mbps could be measured. On the other hand, the achieved L1 throughput on the campus route was always above 50 Mbps. This is quite a respectable result under these difficult deployment conditions.
Figure 7. DL throughput on campus route

LTE performance for initial deployments 9
Wide area route
The wide area route was on public roads near the Munich Nokia Siemens Networks campus, between 350 and 1000 meters away from the BTS (Figure 5). This area is characterized by medium building density along a main road, mainly apartment houses with a height of 10–20 meters. These are typical suburban to urban deployment conditions.
Two different measurement scenarios were performed on the route:• A single user scenario with only
one UE active in the cell.• A multi-user scenario with four
users active in the cell, two of them mobile and located in the measurement van, the other two placed inside buildings on the campus.
The purpose of the single user test was to measure the achievable DL throughput rate in typical urban/suburban cells with a cell diameter of approximately 1000 meters under highly varying channel conditions and typical urban speeds of up to 40 km/h.
Figure 8 shows the received L1 throughput along the wide area route together with the speed of the measurement van at the related spots. Since this route is on public streets there were several stops at street crossings with traffic lights. As the measurement was performed at a time with high traffic density the average speed was only 30–40 km/h. The measured L1 throughput was in the range of 14–83 Mbps. It varied extensively depending on the shadowing conditions along the test route and decreased on average with the increasing distance from the site. Even at a distance of about 1000 meters from the BTS the average L1 throughput reaches a level of 30 Mbps.
Speed80
0
90
80
70
60
50
40
30
20
10
0
20
40
60
10
30
50
70
0 200 400 600 800 1000Distance (m)
Spee
d (k
m/h
)
Thro
ughp
ut (M
bps)
DL throughput
The scope of the multi-user measurement was to evaluate the achievable DL data rates in a multi-user environment consisting of mobile and stationary users. The stationary users were mobile terminals placed inside an office. At least one of them experienced indoor penetration losses that are typical for urban and suburban LTE cells with a diameter of 1000 meters.
Figure 8. DL single user throughput along wide area route

LTE performance for initial deployments10
The measurements were performed on the same test route as the single user wide area tests. During these tests four UEs were active in the cell:• Two UEs (UE2, UE3) were mounted
in the car and connected to antennas on the roof. This provided variable SNR due to changing channel conditions along the drive route. A different orientation of the two antennas was selected for U2 and U3 (see Figure 9).
• One UE (UE4) was located in the lab with antennas very close to the window to get a good SNR. The distance between lab and BTS site is 282 meters.
• One UE (UE1) was located in the lab (same distance from the BTS site as above) with the antenna round about 4 meters away from the window, which provides only medium SNR.
Figure 9 shows the measured L1 throughput of each UE while moving along the drive route, together with the speed of the van, which was on average about 40 km/h. The figure shows that the stationary UE with the antenna close to the window (UE4) has the highest data rate (about 30–60 Mbps), followed by the second stationary UE in the middle in the room (UE1) (about 12–25 Mbps). The two fully mobile UEs (UE2 und UE3) achieved an L1 throughput in the range of 5–25 Mbps, depending on the channel conditions along the drive route.
In fact, all radio resources are shared between the terminals connected to one and the same radio cell depending on the channel condition and the decisions of the proportional fair scheduler. As a result, the data rate varies with time also for the stationary office users because the scheduler must also satisfy the requirements of the mobile users as well as possible. This is reflected in the measurement results. The results also show slightly different throughput rates for UE2 and UE3, which are caused by the different antenna orientation as the van drives along the route towards the antenna at an almost constant angle.
Long distance route
In addition to the Munich tests, long distance measurement tests were made in Berlin (see Figure 10) thanks to close cooperation between the Heinrich-Hertz-Institut and Nokia Siemens Networks. The test bed configuration is described on pages 6–7.
The goal of the long distance measurements is to test the robustness of the synchronization mechanism in the downlink and the stability of the feedback channel in the uplink. With LTE, a robust feedback channel is the key to realizing high performance in the downlink. It is achieved by frequency selective scheduling and link adaptation, which are the main
Speed80
0
70
60
50
40
30
20
10
0
20
40
60
10
30
50
70
340 440 540 740640 840 940Distance (m)
Spee
d (k
m/h
)
Thro
ughp
ut (M
bps)
UE4 DL throughputUE3 DL throughput
UE2 DL throughputUE1 DL throughput
Figure 9. DL throughput for multi-user test on wide area route

LTE performance for initial deployments 11
advantages of the LTE radio interface. Since the transmission power at the terminal is limited to 200 mW, robust power control and timing advance are mandatory for a stable uplink feedback channel.
The arrows in Figure 10 indicate the driving direction of the measurement van. Starting at the Heinrich-Hertz-Institut and passing Tiergarten park, the track ends at the Brandenburger Tor. The environment along the drive route is typically urban, with a mixture of LOS and NLOS with some multipath propagation due to the buildings between the base station site and Tiergarten park. The buildings have heights ranging from 40–70 meters. The park is about 1000 meters from the base station site and is mostly covered with trees. To the east, the park ends at the Brandenburger Tor. It is worth noting that on the route the van passes a tall statue (Siegessäule) at the center of Tiergarten park. It is approximately 67 meters high with a marble base and the radio signal suffers from strong shadowing.
The L1 throughput results for the long distance measurements are shown in Figure 11 with a maximum data rate of approximately 150 Mbps. Synchronization with the base station was stable and the data rate never dropped below 1 Mbps throughout the measurements. These results show a robust system performance without signal loss and high throughputs for a distance of up to 4 km under LOS conditions in the 2.6 GHz spectrum band.
Furthermore, the total throughput rate as shown in Figure 11 is split to its two decoupled components related to the MIMO modes allocated by the scheduler. The scheduling algorithm supports adaptive MIMO mode switching to transmit a given physical resource block (PRB) either in single- or multi-stream mode depending on the channel condition. The multi-stream is realized via 2x2 MIMO antenna configurations. The results show the following:• The multi-stream mode is often
chosen and the multi-stream rate never drops to zero, demonstrating
that some PRBs are always transmitted in multi-stream mode. This shows that the second stream substantially contributes to the high overall system performance.
• Multi-stream transmission is the key to achieving high data rates that cannot be realized in a single-antenna/SISO system.
• When the channel conditions degrade, the adaptive scheduling algorithm increasingly utilizes single-stream transmission. This contributes to stable transmission along the whole measurement track.
Total140
0
40
80
120
20
60
100
0 1000 2000 3000 4000 5000Distance (m)
Thro
ughp
ut (M
bps)
Multi-streamSingle-stream
Figure 10. Long distance route
Figure 11. DL throughput on long distance route for single-stream and multi-stream transmission

LTE performance for initial deployments12
Lab tests and simulations
In addition to the outdoor tests, some stress tests were carried out in the lab to simulate conditions such as high velocities and/or different combinations of channel models. For these tests, the antennas of the LTE BTS and the LTE test mobile were connected to a channel simulator. The channel simulator works in the RF domain and modifies the transmitted signals. Depending on the selected channel model and the adjusted parameters (such as vehicular speed) the receiver of the device under test gets the frequency and time varying signal values.
For the lab tests a fixed MCS with a coding rate of ½ was used, and the throughput rates are shown as L1 goodput and data throughput on the IP level. The L1 goodput is selected to show values comparable to the IP throughput. The L1 goodput is the error free data rate after de-coding (the L1 throughput multiplied by the coding rate minus the data rate encountered by block errors).
No HARQ and ARQ mechanisms were used in these tests.
Speed tests
Vehicular speeds above 60 km/h are often difficult to realize in real world measurements, so lab tests were used to investigate the high-speed performance of the LTE radio interface.
During the tests, the channel simulator operated in Vehicular A channel mode, as defined by 3GPP, with a series of vehicular speeds as a parameter. Only the vehicular speed was changed while the SNR was kept at a fixed level to provide good channel conditions. The resulting behavior of the mobile radio channel was like a car driving around the base station antennas at a short distance with a constant speed.
SIMO transmission (a single transmit antenna with receive diversity on the UE side) was applied during these tests.
Two key performance indicators (KPI) are plotted in Figure 12. The most important one from an end user perspective is the achievable IP data rate. In order to evaluate the LTE radio performance it is very important to observe the degradation of the IP data rate in comparison to the so called L1 data rate, which is shown in the graph as L1 goodput.
The measurements show that 10 Mbps per radio cell can be provided to a single mobile user at speeds up to 200 km/h. Since the IP packet size is larger than the L1 transport block size, the probability of IP packet errors is also higher which explains the higher L1 goodput.
L1 goodput, QPSK40
0
10
20
30
5
15
25
35
0 10050 200150 300250 350 400 450Speed (km/h)
Thro
ughp
ut (M
bps)
IP throughput, QPSKL1 goodput, 16QAMIP throughput, 16QAML1 goodput, 64QAMIP throughput, 64QAM
Figure 12. Speed test for SIMO transmission under lab conditions

LTE performance for initial deployments 13
QoS measurements
The LTE test mobile and the BTS each support two different QoS classes. The “priority class” GBR bearer offers a constant data rate to the test mobile. All services assigned to this QoS class are transmitted without any queuing problems and with low delay. All other services are without any sort of transmission guarantee. This class (assigned to non-GBR bearers) takes the remaining resources depending on the channel conditions. So there may be longer queues and occasional packet loss.
The following additional conditions are applied for the QoS tests:• A single UE with two QoS bearers.• One GBR bearer adjusted to
6 Mbps.• One bearer with a best effort
scheme (non-GBR).• Adaptive MIMO (dual stream,
single stream, Rx diversity).• Channel model: Pedestrian B at
3 km/h (PB3).
The required user data rate of about 6 Mbps can be provided at a very stable level over a large SNR range. To compensate the varying channel conditions the MIMO function and the link adaption function adjust the transmission schemes accordingly in order to guarantee the constant bit rate also for low SNR values. Since all remaining resources are used by the service allocated to the non-GBR bearer, this results in a higher data rate as long as the SNR conditions are sufficient.
For lower SNR figures the GBR service needs more and more resources in time and frequency domain to maintain a stable data rate. Eventually there will be no or only a few resources left to be used for the non-GBR service. The throughput of this service therefore degrades to some extent, as shown in Figure 13.
In a real environment, however, the mobile user will never enjoy constant SNR conditions over the entire connection. The SNR condition instead changes continuously due to the time and frequency variance of the radio channel. So the throughput of all services assigned to the non-GBR class becomes unpredictable to some extent.
While this may be acceptable for non real-time applications such as web browsing, it is not sufficient for services such as high-quality video streaming or Voice over IP (VoIP). In these cases, it is very important to guarantee a minimum data rate. The results of
our test show that the algorithms for QoS-aware scheduling designed by Nokia Siemens Networks are working properly and can guarantee the quality of associated services.
As mentioned above, the data rate of the non-GBR service will be higher in the case of excellent SNR conditions. This holds true only if there are few mobiles in the cell. If the number of mobiles increases, the scheduler has to share the resources between more users and the user rate will drop accordingly. As a consequence, QoS-aware scheduling is most important for both medium- and high-loaded radio cells.
L1 goodput, non QoS
Non GBR bearer
80
0
20
40
60
10
30
50
70
5 10 2015 3025 35 40 45SNR (dB)
Thro
ughp
ut (M
bps)
IP throughput, non QoSL1 goodput, QoSIP throughput, QoS
IP GBR ≈ 5.8 Mbps
GBR bearer
Figure 13. DL tests with different QoS bearers per UE under lab conditions

LTE performance for initial deployments14
Conclusion
Nokia Siemens Networks has carried out a series of essential drive tests in order to evaluate LTE radio interface characteristics and performance. As a result, it can be shown that the design goals of LTE, as incorporated in the 3GPP specifications, can already be met with a great deal of certainty and reliability. The system provides the stability and robustness that is essential to provide adequate support for high data rates.
Nokia Siemens Networks particularly focuses on the most likely representative scenarios in the early deployment of LTE/SAE where there are established 3G networks. This is a pre-requisite for smooth and cost-efficient introduction to the market, especially with regard to the use of radio base station antenna sites and proper antenna configurations. The scope of testing will be expanded as the need arises in order to guarantee excellent system performance. In particular, it will extend to more-complex MIMO scenarios, including multi-user arrangements.
The drive test results are encouraging for the throughput of the LTE radio cell. Even under difficult conditions the system performed well. Depending on the scenario, the cell was able to serve at L1 throughput rates of 20–60 Mbps on average.
In addition to information available from other stakeholders, we think that this document provides a better view of the performance expectations for cell edge coverage and the system behavior in case of multi-user scenarios. This is in line with our strategy of providing system insight as close as possible to real world scenarios. In particular, it allows a one-by-one correlation between the performance data and locations, which is not commonly published in other papers.

LTE performance for initial deployments 15
Glossary
3GPP Third Generation Partnership ProjectARQ Automatic Repeat RequestBS Base StationBSC Base Station ControllerBSS Base Station SubsystemBTS Base Transceiver StationCDF Cumulated Distribution FunctionCDMA Code Division Multiple AccessCS Coding SchemeDL DownlinkDSP Digital signal ProcessorEDGE Enhanced Data rates for GSM
EvolutioneNode B Enhanced Node BFDD Frequency Division MultiplexingFDMA Frequency Division Multiple AccessFPGA Field Programmable Gate ArrayFTP File Transfer ProtocolGBR Guaranteed bit rateGPS Global Positioning SystemGSM Global System for Mobile
CommunicationsHARQ Hybrid Automatic Repeat RequestHSDPA High-Speed Downlink Packet AccessHSPA High-Speed Packet AccessIODT Interoperability Development TestIOT Interoperability TestIP Internet ProtocolITU International Telecommunication
UnionL1 Layer 1LTE Long-Term EvolutionLMT Local Maintenance TerminalLoS Line of SightLSTI LTE-SAE Trial InitiativeMCS Modulation and Coding SchemeMIMO Multiple Input / Multiple OutputNGMN Next Generation of Mobile NetworksNLOS None Line of SightNSN Nokia Siemens NetworksNTP Network Time Protocol OFDM Orthogonal Frequency Division
MultiplexingPoC Proof of ConceptPRB Physical resource Block
QAM Quadrature Amplitude ModulationQoS Quality of serviceQPSK Quadrature Phase Shift KeyingRAN Radio Access NetworkRF Radio FrequencyRX ReceiveSAE System Architecture EvolutionSC-FDMA Single Carrier Frequency Multiple
AccessSGSN Service GPRS Service NodeSIMO Single Input / Multiple OutputSISO Single Input / Single OutputSNR Signal Noise RatioTDD Time division MultiplexingTU Technical UniversityUE User EquipmentUL UplinkUMTS Universal Mobile Telecommunications
SystemVoIP Voice over IPWCDMA Wideband Code Division Multiple
Access
References
[1] White Paper “Charting the Course for Mobile Broadband: Heading Towards High-Performance All-IP with LTE/SAE” http://www.nokiasiemensnetworks.com/NR/rdonlyres/AB092948-6281-4452-8D59-90B7A310B5BA/0/broadband_lte_sae_update_intranet.pdf
[2] Web page of LSTI (http://lstiforum.org/)[3] Press release on Multi-user field trial on December 2007
(http://www.nokiasiemensnetworks.com/global/Press/Press+releases/news-archive/Up_to_ten_times_faster_mobile_broadband_data_rates_a_step_closer_to_reality.htm)
All map data included in this document is taken from the Open Street Map project (www.openstreetmaps.org) and is subject to the license terms there under following the license rules granted according to Creative Commons Attribution Share Alike License 2.0.

www.nokiasiemensnetworks.com
Nokia Siemens Networks CorporationP.O. Box 1FI-02022 NOKIA SIEMENS NETWORKSFinland
Visiting address:Karaportti 3, ESPOO, Finland
Switchboard +358 71 400 4000
Product code B301-00376-B-200902-1-ENIndivisual
Copyright © 2009 Nokia Siemens Networks. All rights reserved.
A license is hereby granted to download and print a copy of this document for personal use only. No other license to any other intellectual property rights is granted herein. Unless expressly permitted herein, reproduction, transfer, distribution or storage of part or all of the contents in any form without the prior written permission of Nokia Siemens Networks is prohibited.
The content of this document is provided “AS IS”, without warranties of any kind with regards its accuracy or reliability, and specifically excluding all implied warranties, for example of merchantability, fitness for purpose, title and non-infringement. In no event shall Nokia Siemens Networks be liable for any special, indirect or consequential damages, or any damages whatsoever resulting form loss of use, data or profits, arising out of or in connection with the use of the document. Nokia Siemens Networks reserves the right to revise the document or withdraw it at any time without prior notice.
Nokia is a registered trademark of Nokia Corporation, Siemens is a registered trademark of Siemens AG. The wave logo is a trademark of Nokia Siemens Networks Oy. Other company and product names mentioned in this document may be trademarks of their respective owners, and they are mentioned for identification purposes only.