lso a full listing in the final column , 20 01 33*, *, 07 05 10, 9*, 11 ... · lso a full listing...
TRANSCRIPT
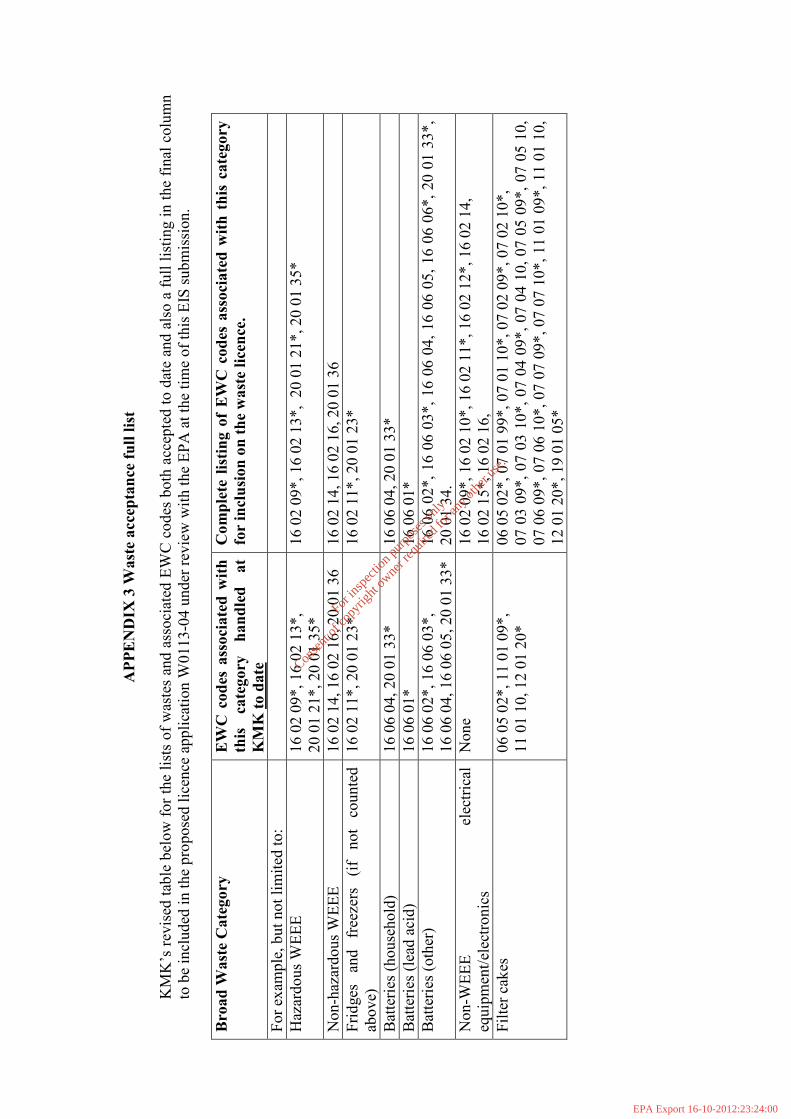
APPENDIX 3 Waste acceptance full list
KMK’s revised table below for the lists of wastes and associated EWC codes both accepted to date and also a full listing in the final column
to be included in the proposed licence application W
0113-04 under review with the EPA at the time of this EIS submission.
Broad Waste Category
EWC codes associated with
this category handled at
KMK to date
Complete listing of EWC codes associated with this category
for inclusion on the waste licence.
For exam
ple, but not limited to:
Hazardous WEEE
16 02 09*, 16 02 13*,
20 01 21*, 20 01 35*
16 02 09*, 16 02 13*, 20 01 21*, 20 01 35*
Non-hazardous WEEE
16 02 14, 16 02 16, 20 01 36
16 02 14, 16 02 16, 20 01 36
Fridges and freezers (if
not counted
above)
16 02 11*, 20 01 23*
16 02 11*, 20 01 23*
Batteries (household)
16 06 04, 20 01 33*
16 06 04, 20 01 33*
Batteries (lead acid)
16 06 01*
16 06 01*
Batteries (other)
16 06 02*, 16 06 03*,
16 06 04, 16 06 05, 20 01 33*
16 06 02*, 16 06 03*, 16 06 04, 16 06 05, 16 06 06*, 20 01 33*,
20 01 34.
Non-W
EEE
electrical
equipment/electronics
None
16 02 09*, 16 02 10*, 16 02 11*, 16 02 12*, 16 02 14,
16 02 15*, 16 02 16,
Filter cakes
06 05 02*, 11 01 09*,
11 01 10, 12 01 20*
06 05 02*, 07 01 99*, 07 01 10*, 07 02 09*, 07 02 10*,
07 03 09*, 07 03 10*, 07 04 09*, 07 04 10, 07 05 09*, 07 05 10,
07 06 09*, 07 06 10*, 07 07 09*, 07 07 10*, 11 01 09*, 11 01 10,
12 01 20*, 19 01 05*
For
insp
ectio
n pur
pose
s only
.
Conse
nt of
copy
right
owne
r req
uired
for a
ny ot
her u
se.
EPA Export 16-10-2012:23:24:00
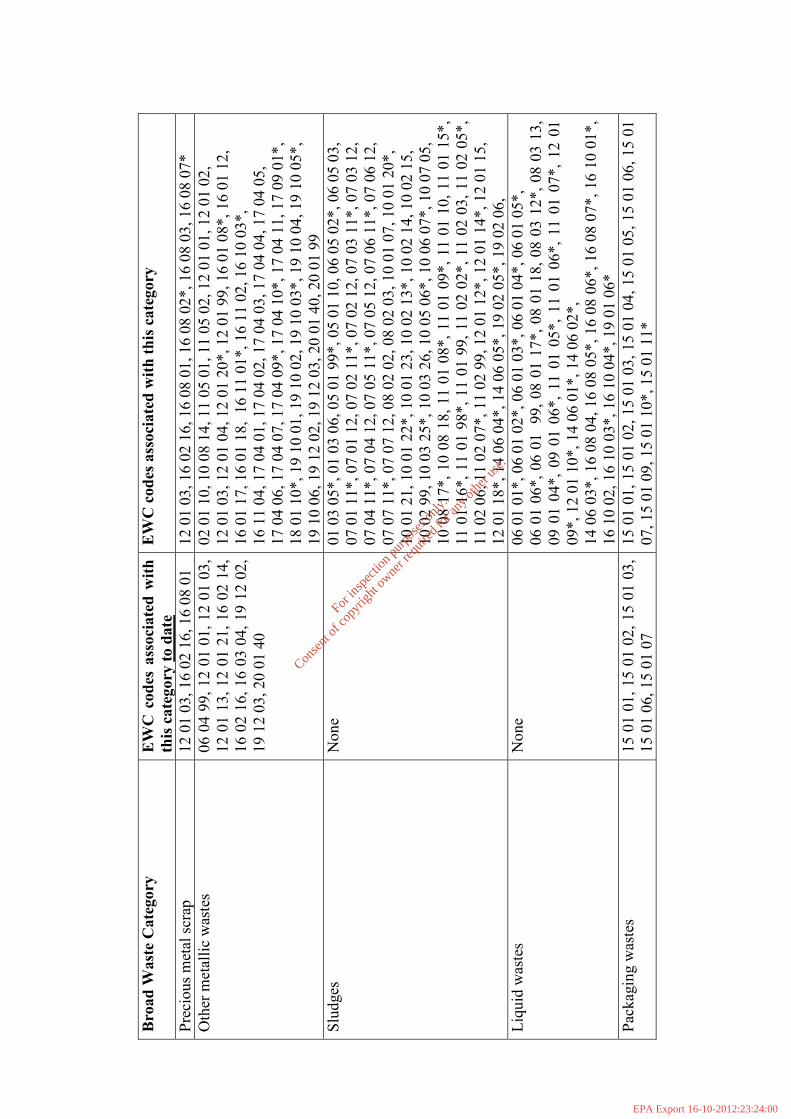
Broad Waste Category
EWC codes associated with
this category to date
EWC codes associated with this category
Precious metal scrap
12 01 03, 16 02 16, 16 08 01
12 01 03, 16 02 16, 16 08 01, 16 08 02*, 16 08 03, 16 08 07*
Other m
etallic wastes
06 04 99, 12 01 01, 12 01 03,
12 01 13, 12 01 21, 16 02 14,
16 02 16, 16 03 04, 19 12 02,
19 12 03, 20 01 40
02 01 10, 10 08 14, 11 05 01, 11 05 02, 12 01 01, 12 01 02,
12 01 03, 12 01 04, 12 01 20*, 12 01 99, 16 01 08*, 16 01 12,
16 01 17, 16 01 18, 16 11 01*, 16 11 02, 16 10 03*,
16 11 04, 17 04 01, 17 04 02, 17 04 03, 17 04 04, 17 04 05,
17 04 06, 17 04 07, 17 04 09*, 17 04 10*, 17 04 11, 17 09 01*,
18 01 10*, 19 10 01, 19 10 02, 19 10 03*, 19 10 04, 19 10 05*,
19 10 06, 19 12 02, 19 12 03, 20 01 40, 20 01 99
Sludges
None
01 03 05*, 01 03 06, 05 01 99*, 05 01 10, 06 05 02*, 06 05 03,
07 01 11*, 07 01 12, 07 02 11*, 07 02 12, 07 03 11*, 07 03 12,
07 04 11*, 07 04 12, 07 05 11*, 07 05 12, 07 06 11*, 07 06 12,
07 07 11*, 07 07 12, 08 02 02, 08 02 03, 10 01 07, 10 01 20*,
10 01 21, 10 01 22*, 10 01 23, 10 02 13*, 10 02 14, 10 02 15,
10 02 99, 10 03 25*, 10 03 26, 10 05 06*, 10 06 07*, 10 07 05,
10 08 17*, 10 08 18, 11 01 08*, 11 01 09*, 11 01 10, 11 01 15*,
11 01 16*, 11 01 98*, 11 01 99, 11 02 02*, 11 02 03, 11 02 05*,
11 02 06, 11 02 07*, 11 02 99, 12 01 12*, 12 01 14*, 12 01 15,
12 01 18*, 14 06 04*, 14 06 05*, 19 02 05*, 19 02 06,
Liquid wastes
None
06 01 01*, 06 01 02*, 06 01 03*, 06 01 04*, 06 01 05*,
06 01 06*, 06 01 99, 08 01 17*, 08 01 18, 08 03 12*, 08 03 13,
09 01 04*, 09 01 06*, 11 01 05*, 11 01 06*, 11 01 07*, 12 01
09*, 12 01 10*, 14 06 01*, 14 06 02*,
14 06 03*, 16 08 04, 16 08 05*, 16 08 06*, 16 08 07*, 16 10 01*,
16 10 02, 16 10 03*, 16 10 04*, 19 01 06*
Packaging wastes
15 01 01, 15 01 02, 15 01 03,
15 01 06, 15 01 07
15 01 01, 15 01 02, 15 01 03, 15 01 04, 15 01 05, 15 01 06, 15 01
07, 15 01 09, 15 01 10*, 15 01 11*
For
insp
ectio
n pur
pose
s only
.
Conse
nt of
copy
right
owne
r req
uired
for a
ny ot
her u
se.
EPA Export 16-10-2012:23:24:00
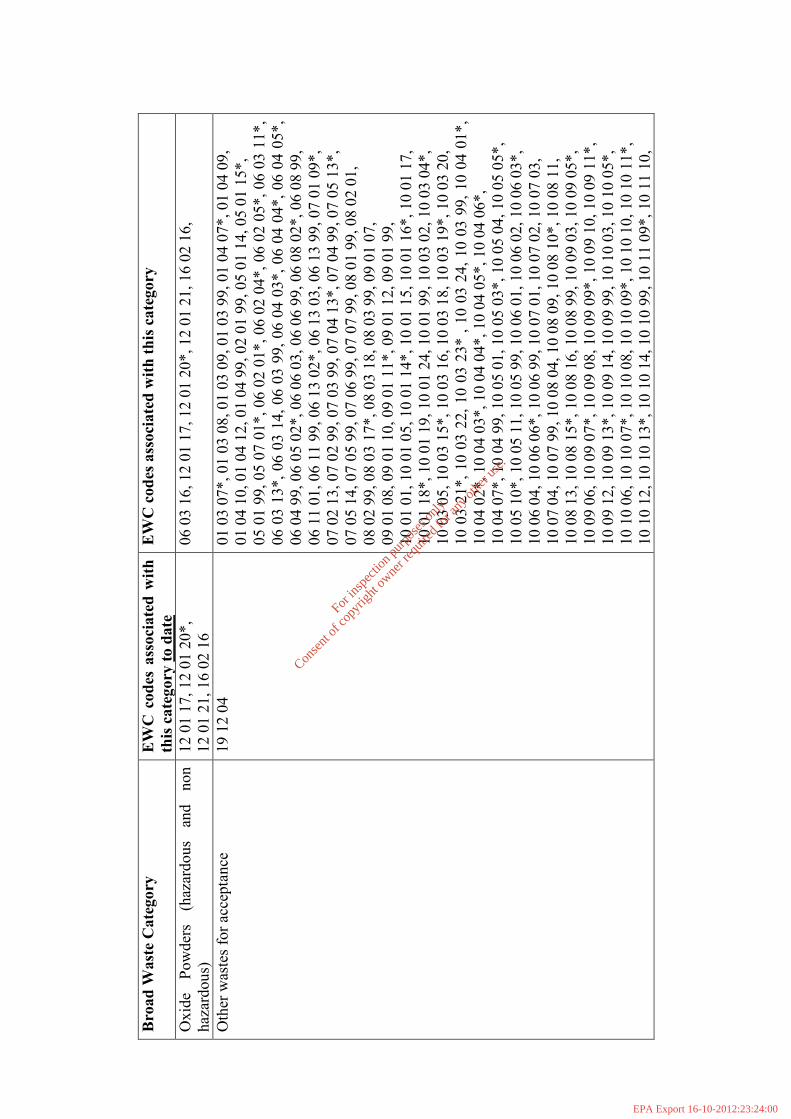
Broad Waste Category
EWC codes associated with
this category to date
EWC codes associated with this category
Oxide
Powders
(hazardous
and non
hazardous)
12 01 17, 12 01 20*,
12 01 21, 16 02 16
06 03 16, 12 01 17, 12 01 20*, 12 01 21, 16 02 16,
Other wastes for acceptance
19 12 04
01 03 07*, 01 03 08, 01 03 09, 01 03 99, 01 04 07*, 01 04 09,
01 04 10, 01 04 12, 01 04 99, 02 01 99, 05 01 14, 05 01 15*,
05 01 99, 05 07 01*, 06 02 01*, 06 02 04*, 06 02 05*, 06 03 11*,
06 03 13*, 06 03 14, 06 03 99, 06 04 03*, 06 04 04*, 06 04 05*,
06 04 99, 06 05 02*, 06 06 03, 06 06 99, 06 08 02*, 06 08 99,
06 11 01, 06 11 99, 06 13 02*, 06 13 03, 06 13 99, 07 01 09*,
07 02 13, 07 02 99, 07 03 99, 07 04 13*, 07 04 99, 07 05 13*,
07 05 14, 07 05 99, 07 06 99, 07 07 99, 08 01 99, 08 02 01,
08 02 99, 08 03 17*, 08 03 18, 08 03 99, 09 01 07,
09 01 08, 09 01 10, 09 01 11*, 09 01 12, 09 01 99,
10 01 01, 10 01 05, 10 01 14*, 10 01 15, 10 01 16*, 10 01 17,
10 01 18*, 10 01 19, 10 01 24, 10 01 99, 10 03 02, 10 03 04*,
10 03 05, 10 03 15*, 10 03 16, 10 03 18, 10 03 19*, 10 03 20,
10 03 21*, 10 03 22, 10 03 23* , 10 03 24, 10 03 99, 10 04 01*,
10 04 02*, 10 04 03*, 10 04 04*, 10 04 05*, 10 04 06*,
10 04 07*, 10 04 99, 10 05 01, 10 05 03*, 10 05 04, 10 05 05*,
10 05 10*, 10 05 11, 10 05 99, 10 06 01, 10 06 02, 10 06 03*,
10 06 04, 10 06 06*, 10 06 99, 10 07 01, 10 07 02, 10 07 03,
10 07 04, 10 07 99, 10 08 04, 10 08 09, 10 08 10*, 10 08 11,
10 08 13, 10 08 15*, 10 08 16, 10 08 99, 10 09 03, 10 09 05*,
10 09 06, 10 09 07*, 10 09 08, 10 09 09*, 10 09 10, 10 09 11*,
10 09 12, 10 09 13*, 10 09 14, 10 09 99, 10 10 03, 10 10 05*,
10 10 06, 10 10 07*, 10 10 08, 10 10 09*, 10 10 10, 10 10 11*,
10 10 12, 10 10 13*, 10 10 14, 10 10 99, 10 11 09*, 10 11 10,
For
insp
ectio
n pur
pose
s only
.
Conse
nt of
copy
right
owne
r req
uired
for a
ny ot
her u
se.
EPA Export 16-10-2012:23:24:00
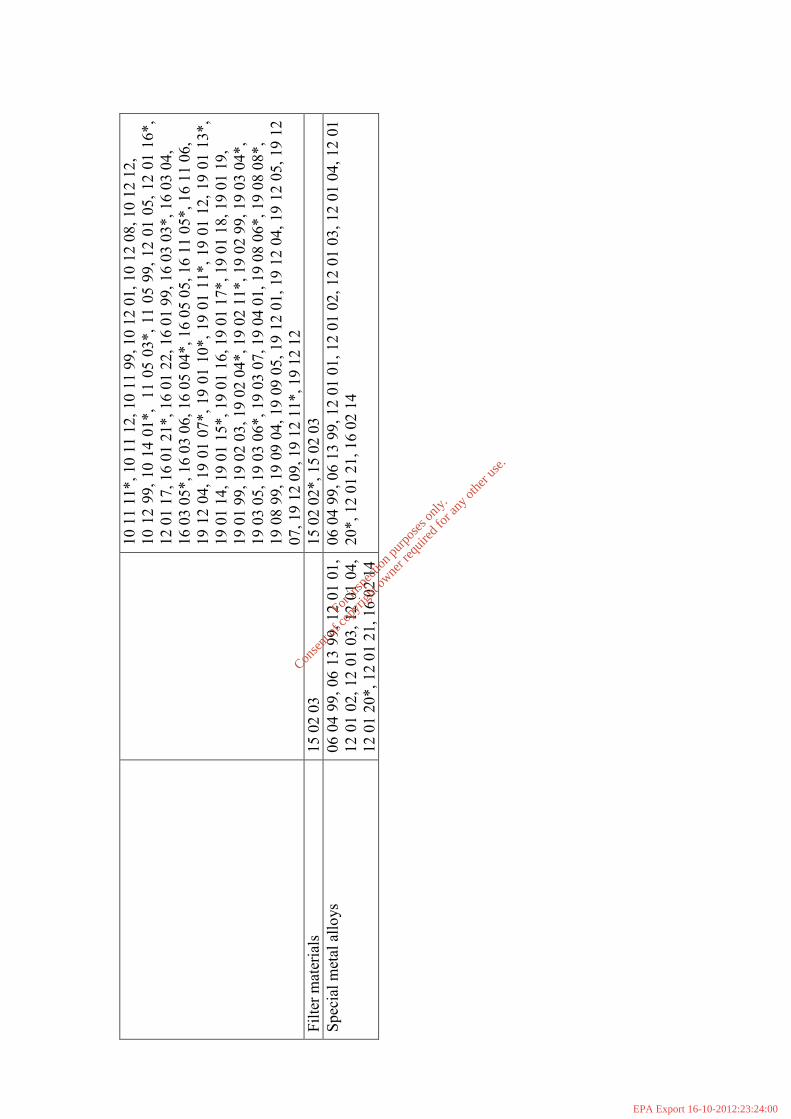
10 11 11*, 10 11 12, 10 11 99, 10 12 01, 10 12 08, 10 12 12,
10 12 99, 10 14 01*, 11 05 03*, 11 05 99, 12 01 05, 12 01 16*,
12 01 17, 16 01 21*, 16 01 22, 16 01 99, 16 03 03*, 16 03 04,
16 03 05*, 16 03 06, 16 05 04*, 16 05 05, 16 11 05*, 16 11 06,
19 12 04, 19 01 07*, 19 01 10*, 19 01 11*, 19 01 12, 19 01 13*,
19 01 14, 19 01 15*, 19 01 16, 19 01 17*, 19 01 18, 19 01 19,
19 01 99, 19 02 03, 19 02 04*, 19 02 11*, 19 02 99, 19 03 04*,
19 03 05, 19 03 06*, 19 03 07, 19 04 01, 19 08 06*, 19 08 08*,
19 08 99, 19 09 04, 19 09 05, 19 12 01, 19 12 04, 19 12 05, 19 12
07, 19 12 09, 19 12 11*, 19 12 12
Filter materials
15 02 03
15 02 02*, 15 02 03
Special metal alloys
06 04 99, 06 13 99, 12 01 01,
12 01 02, 12 01 03, 12 01 04,
12 01 20*, 12 01 21, 16 02 14
06 04 99, 06 13 99, 12 01 01, 12 01 02, 12 01 03, 12 01 04, 12 01
20*, 12 01 21, 16 02 14
For
insp
ectio
n pur
pose
s only
.
Conse
nt of
copy
right
owne
r req
uired
for a
ny ot
her u
se.
EPA Export 16-10-2012:23:24:00
Author:
TFK
Job number:
ATH/09/086
Client:
Traffic Wise
Job day:
Thursday
Drawing No:
ATH/09/086-1
Job date:
30th June 2009
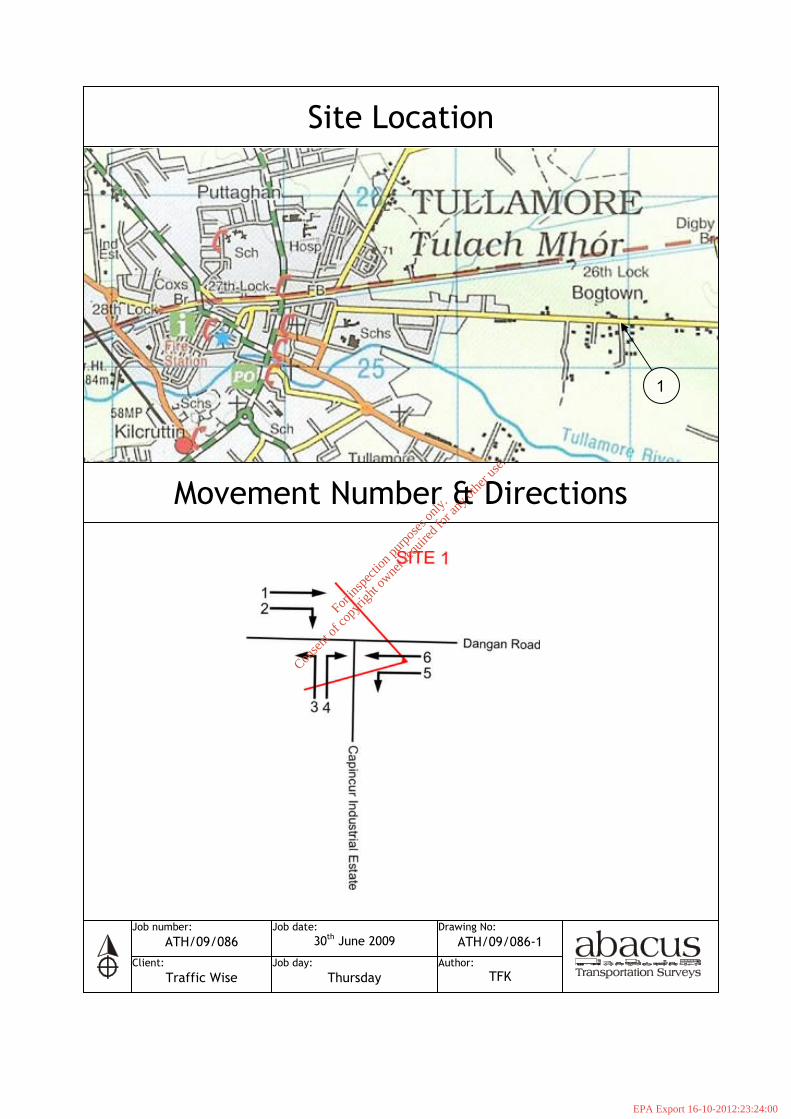
Site Location
1
Movement Number & Directions
For
insp
ectio
n pur
pose
s only
.
Conse
nt of
copy
right
owne
r req
uired
for a
ny ot
her u
se.
EPA Export 16-10-2012:23:24:00
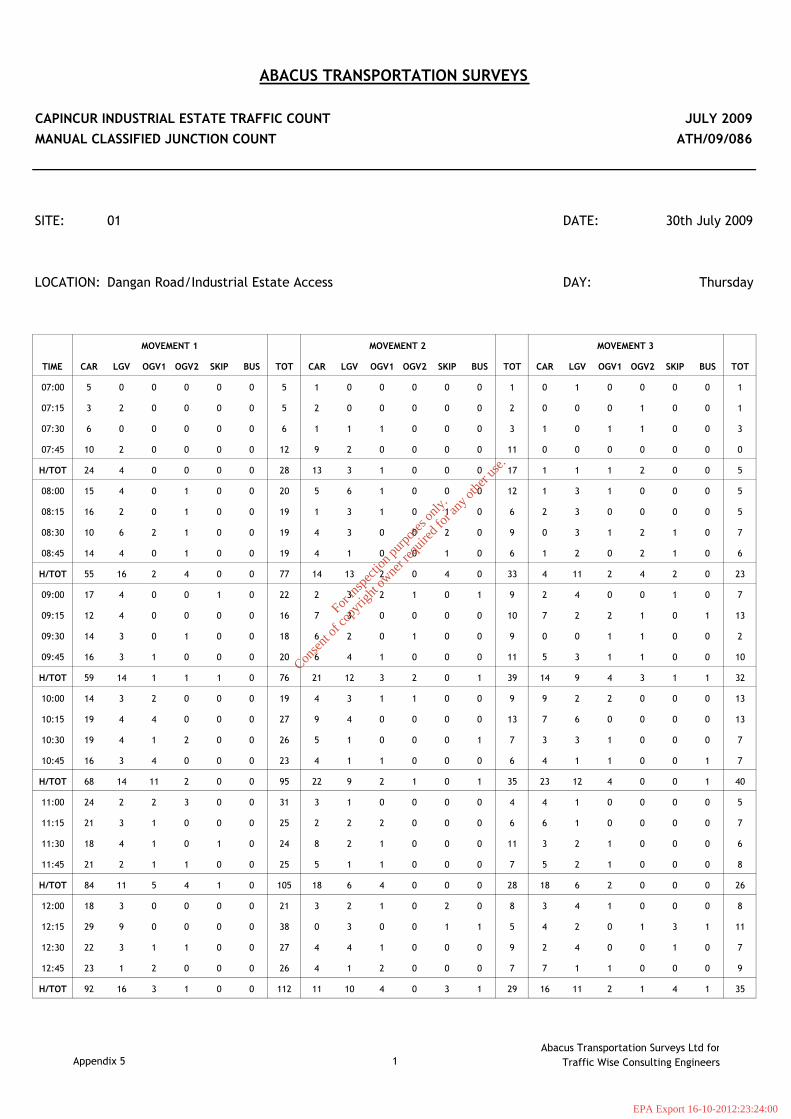
ABACUS TRANSPORTATION SURVEYS
CAPINCUR INDUSTRIAL ESTATE TRAFFIC COUNT JULY 2009
MANUAL CLASSIFIED JUNCTION COUNT ATH/09/086
SITE: 01 DATE: 30th July 2009
LOCATION: Dangan Road/Industrial Estate Access DAY: Thursday
MOVEMENT 1 MOVEMENT 2 MOVEMENT 3
TIME CAR LGV OGV1 OGV2 SKIP BUS TOT CAR LGV OGV1 OGV2 SKIP BUS TOT CAR LGV OGV1 OGV2 SKIP BUS TOT
07:00 5 0 0 0 0 0 5 1 0 0 0 0 0 1 0 1 0 0 0 0 1
07:15 3 2 0 0 0 0 5 2 0 0 0 0 0 2 0 0 0 1 0 0 1
07:30 6 0 0 0 0 0 6 1 1 1 0 0 0 3 1 0 1 1 0 0 3
07:45 10 2 0 0 0 0 12 9 2 0 0 0 0 11 0 0 0 0 0 0 0
H/TOT 24 4 0 0 0 0 28 13 3 1 0 0 0 17 1 1 1 2 0 0 5
08:00 15 4 0 1 0 0 20 5 6 1 0 0 0 12 1 3 1 0 0 0 5
08:15 16 2 0 1 0 0 19 1 3 1 0 1 0 6 2 3 0 0 0 0 5
08:30 10 6 2 1 0 0 19 4 3 0 0 2 0 9 0 3 1 2 1 0 7
08:45 14 4 0 1 0 0 19 4 1 0 0 1 0 6 1 2 0 2 1 0 6
H/TOT 55 16 2 4 0 0 77 14 13 2 0 4 0 33 4 11 2 4 2 0 23
09:00 17 4 0 0 1 0 22 2 3 2 1 0 1 9 2 4 0 0 1 0 7
09:15 12 4 0 0 0 0 16 7 3 0 0 0 0 10 7 2 2 1 0 1 13
09:30 14 3 0 1 0 0 18 6 2 0 1 0 0 9 0 0 1 1 0 0 2
09:45 16 3 1 0 0 0 20 6 4 1 0 0 0 11 5 3 1 1 0 0 10
H/TOT 59 14 1 1 1 0 76 21 12 3 2 0 1 39 14 9 4 3 1 1 32
10:00 14 3 2 0 0 0 19 4 3 1 1 0 0 9 9 2 2 0 0 0 13
10:15 19 4 4 0 0 0 27 9 4 0 0 0 0 13 7 6 0 0 0 0 13
10:30 19 4 1 2 0 0 26 5 1 0 0 0 1 7 3 3 1 0 0 0 7
10:45 16 3 4 0 0 0 23 4 1 1 0 0 0 6 4 1 1 0 0 1 7
H/TOT 68 14 11 2 0 0 95 22 9 2 1 0 1 35 23 12 4 0 0 1 40
11:00 24 2 2 3 0 0 31 3 1 0 0 0 0 4 4 1 0 0 0 0 5
11:15 21 3 1 0 0 0 25 2 2 2 0 0 0 6 6 1 0 0 0 0 7
11:30 18 4 1 0 1 0 24 8 2 1 0 0 0 11 3 2 1 0 0 0 6
11:45 21 2 1 1 0 0 25 5 1 1 0 0 0 7 5 2 1 0 0 0 8
H/TOT 84 11 5 4 1 0 105 18 6 4 0 0 0 28 18 6 2 0 0 0 26
12:00 18 3 0 0 0 0 21 3 2 1 0 2 0 8 3 4 1 0 0 0 8
12:15 29 9 0 0 0 0 38 0 3 0 0 1 1 5 4 2 0 1 3 1 11
12:30 22 3 1 1 0 0 27 4 4 1 0 0 0 9 2 4 0 0 1 0 7
12:45 23 1 2 0 0 0 26 4 1 2 0 0 0 7 7 1 1 0 0 0 9
H/TOT 92 16 3 1 0 0 112 11 10 4 0 3 1 29 16 11 2 1 4 1 35
Appendix 5 1
Abacus Transportation Surveys Ltd for
Traffic Wise Consulting Engineers
For
insp
ectio
n pur
pose
s only
.
Conse
nt of
copy
right
owne
r req
uired
for a
ny ot
her u
se.
EPA Export 16-10-2012:23:24:00
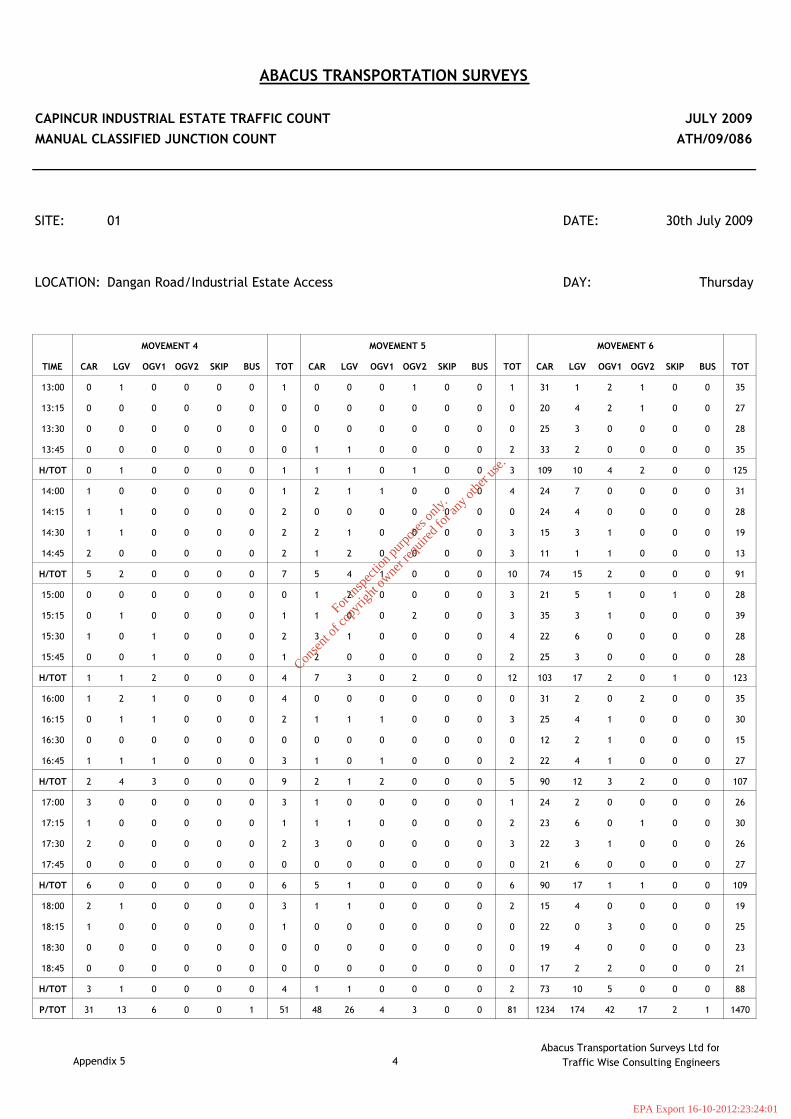
ABACUS TRANSPORTATION SURVEYS
CAPINCUR INDUSTRIAL ESTATE TRAFFIC COUNT JULY 2009
MANUAL CLASSIFIED JUNCTION COUNT ATH/09/086
SITE: 01 DATE: 30th July 2009
LOCATION: Dangan Road/Industrial Estate Access DAY: Thursday
MOVEMENT 1 MOVEMENT 2 MOVEMENT 3
TIME CAR LGV OGV1 OGV2 SKIP BUS TOT CAR LGV OGV1 OGV2 SKIP BUS TOT CAR LGV OGV1 OGV2 SKIP BUS TOT
13:00 27 1 2 0 0 0 30 6 0 0 0 2 0 8 7 2 0 0 0 0 9
13:15 29 4 0 0 0 0 33 2 1 1 0 0 0 4 4 1 1 0 0 0 6
13:30 30 4 0 2 0 0 36 6 0 0 1 0 0 7 4 2 1 0 0 0 7
13:45 24 4 1 1 0 0 30 12 4 1 1 0 1 19 7 2 2 0 0 0 11
H/TOT 110 13 3 3 0 0 129 26 5 2 2 2 1 38 22 7 4 0 0 0 33
14:00 21 0 0 0 0 0 21 8 3 0 1 2 0 14 5 2 0 1 1 0 9
14:15 16 1 0 0 0 0 17 4 4 1 0 0 0 9 8 3 0 1 2 0 14
14:30 22 4 1 1 0 0 28 5 3 1 0 1 0 10 6 1 1 1 2 0 11
14:45 20 5 1 0 0 0 26 12 5 1 0 1 0 19 11 4 0 0 0 0 15
H/TOT 79 10 2 1 0 0 92 29 15 3 1 4 0 52 30 10 1 3 5 0 49
15:00 30 5 1 0 0 0 36 4 1 0 0 1 0 6 3 4 0 0 1 0 8
15:15 23 7 1 0 0 0 31 4 2 1 1 0 0 8 4 2 0 0 1 0 7
15:30 24 3 1 0 0 0 28 4 1 0 0 0 0 5 3 1 0 0 0 0 4
15:45 23 3 2 0 0 0 28 5 2 0 1 0 0 8 7 2 0 0 0 0 9
H/TOT 100 18 5 0 0 0 123 17 6 1 2 1 0 27 17 9 0 0 2 0 28
16:00 25 4 2 0 0 0 31 2 1 1 1 0 0 5 6 1 0 0 0 0 7
16:15 23 3 0 0 0 1 27 7 2 1 0 1 0 11 5 1 0 0 0 0 6
16:30 33 5 0 0 0 0 38 1 2 0 2 1 0 6 4 1 1 0 2 0 8
16:45 25 3 2 0 0 0 30 1 0 0 1 1 0 3 3 5 1 2 1 0 12
H/TOT 106 15 4 0 0 1 126 11 5 2 4 3 0 25 18 8 2 2 3 0 33
17:00 37 5 3 0 0 0 45 4 0 0 1 1 0 6 13 2 0 0 0 0 15
17:15 51 4 0 0 0 0 55 6 0 0 0 1 0 7 5 3 0 0 2 0 10
17:30 31 5 0 0 0 0 36 2 1 1 1 1 1 7 5 1 0 0 0 0 6
17:45 47 5 2 1 0 0 55 1 0 0 1 0 0 2 3 1 0 0 1 0 5
H/TOT 166 19 5 1 0 0 191 13 1 1 3 3 1 22 26 7 0 0 3 0 36
18:00 36 5 1 0 0 0 42 2 0 1 0 0 0 3 5 1 0 0 0 0 6
18:15 25 3 0 0 0 0 28 0 0 0 0 0 0 0 5 0 0 2 0 0 7
18:30 22 1 3 0 0 0 26 0 1 0 0 0 0 1 0 1 0 1 0 0 2
18:45 21 4 1 0 0 0 26 0 0 0 0 0 0 0 3 0 0 0 0 0 3
H/TOT 104 13 5 0 0 0 122 2 1 1 0 0 0 4 13 2 0 3 0 0 18
P/TOT 1047 163 46 17 2 1 1276 197 86 26 15 20 5 349 202 93 22 18 20 3 358
Appendix 5 2
Abacus Transportation Surveys Ltd for
Traffic Wise Consulting Engineers
For
insp
ectio
n pur
pose
s only
.
Conse
nt of
copy
right
owne
r req
uired
for a
ny ot
her u
se.
EPA Export 16-10-2012:23:24:01
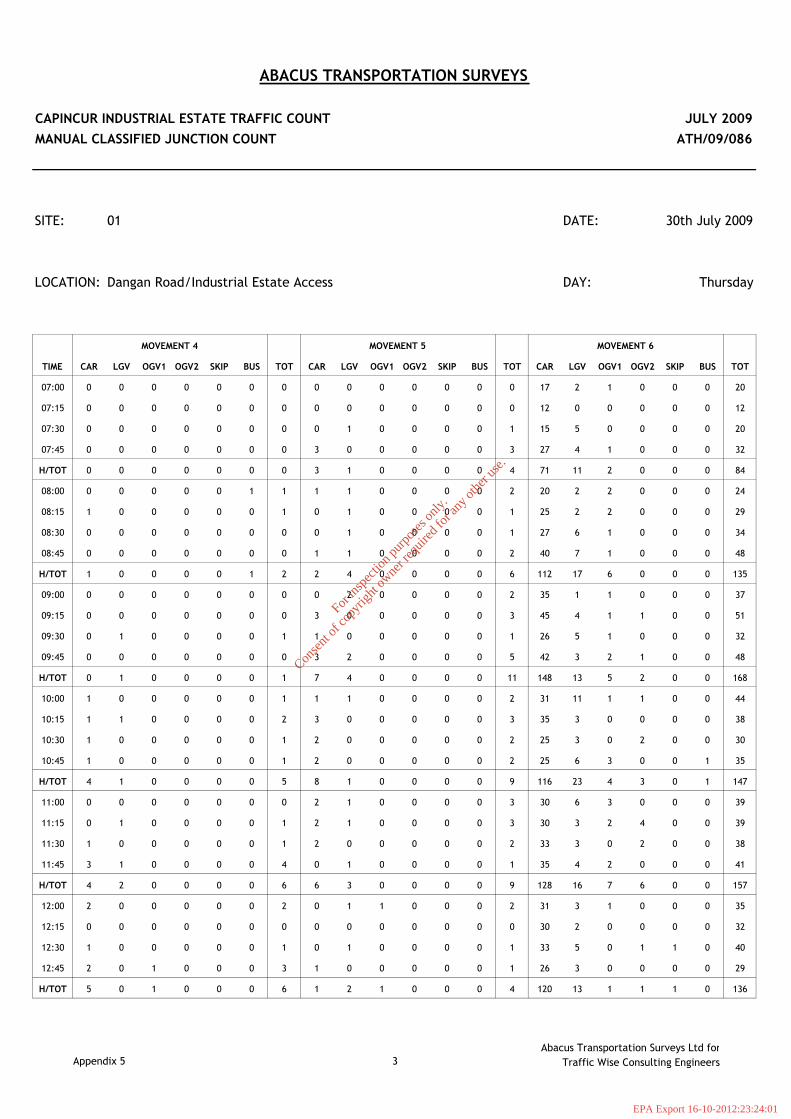
ABACUS TRANSPORTATION SURVEYS
CAPINCUR INDUSTRIAL ESTATE TRAFFIC COUNT JULY 2009
MANUAL CLASSIFIED JUNCTION COUNT ATH/09/086
SITE: 01 DATE: 30th July 2009
LOCATION: Dangan Road/Industrial Estate Access DAY: Thursday
MOVEMENT 4 MOVEMENT 5 MOVEMENT 6
TIME CAR LGV OGV1 OGV2 SKIP BUS TOT CAR LGV OGV1 OGV2 SKIP BUS TOT CAR LGV OGV1 OGV2 SKIP BUS TOT
07:00 0 0 0 0 0 0 0 0 0 0 0 0 0 0 17 2 1 0 0 0 20
07:15 0 0 0 0 0 0 0 0 0 0 0 0 0 0 12 0 0 0 0 0 12
07:30 0 0 0 0 0 0 0 0 1 0 0 0 0 1 15 5 0 0 0 0 20
07:45 0 0 0 0 0 0 0 3 0 0 0 0 0 3 27 4 1 0 0 0 32
H/TOT 0 0 0 0 0 0 0 3 1 0 0 0 0 4 71 11 2 0 0 0 84
08:00 0 0 0 0 0 1 1 1 1 0 0 0 0 2 20 2 2 0 0 0 24
08:15 1 0 0 0 0 0 1 0 1 0 0 0 0 1 25 2 2 0 0 0 29
08:30 0 0 0 0 0 0 0 0 1 0 0 0 0 1 27 6 1 0 0 0 34
08:45 0 0 0 0 0 0 0 1 1 0 0 0 0 2 40 7 1 0 0 0 48
H/TOT 1 0 0 0 0 1 2 2 4 0 0 0 0 6 112 17 6 0 0 0 135
09:00 0 0 0 0 0 0 0 0 2 0 0 0 0 2 35 1 1 0 0 0 37
09:15 0 0 0 0 0 0 0 3 0 0 0 0 0 3 45 4 1 1 0 0 51
09:30 0 1 0 0 0 0 1 1 0 0 0 0 0 1 26 5 1 0 0 0 32
09:45 0 0 0 0 0 0 0 3 2 0 0 0 0 5 42 3 2 1 0 0 48
H/TOT 0 1 0 0 0 0 1 7 4 0 0 0 0 11 148 13 5 2 0 0 168
10:00 1 0 0 0 0 0 1 1 1 0 0 0 0 2 31 11 1 1 0 0 44
10:15 1 1 0 0 0 0 2 3 0 0 0 0 0 3 35 3 0 0 0 0 38
10:30 1 0 0 0 0 0 1 2 0 0 0 0 0 2 25 3 0 2 0 0 30
10:45 1 0 0 0 0 0 1 2 0 0 0 0 0 2 25 6 3 0 0 1 35
H/TOT 4 1 0 0 0 0 5 8 1 0 0 0 0 9 116 23 4 3 0 1 147
11:00 0 0 0 0 0 0 0 2 1 0 0 0 0 3 30 6 3 0 0 0 39
11:15 0 1 0 0 0 0 1 2 1 0 0 0 0 3 30 3 2 4 0 0 39
11:30 1 0 0 0 0 0 1 2 0 0 0 0 0 2 33 3 0 2 0 0 38
11:45 3 1 0 0 0 0 4 0 1 0 0 0 0 1 35 4 2 0 0 0 41
H/TOT 4 2 0 0 0 0 6 6 3 0 0 0 0 9 128 16 7 6 0 0 157
12:00 2 0 0 0 0 0 2 0 1 1 0 0 0 2 31 3 1 0 0 0 35
12:15 0 0 0 0 0 0 0 0 0 0 0 0 0 0 30 2 0 0 0 0 32
12:30 1 0 0 0 0 0 1 0 1 0 0 0 0 1 33 5 0 1 1 0 40
12:45 2 0 1 0 0 0 3 1 0 0 0 0 0 1 26 3 0 0 0 0 29
H/TOT 5 0 1 0 0 0 6 1 2 1 0 0 0 4 120 13 1 1 1 0 136
Appendix 5 3
Abacus Transportation Surveys Ltd for
Traffic Wise Consulting Engineers
For
insp
ectio
n pur
pose
s only
.
Conse
nt of
copy
right
owne
r req
uired
for a
ny ot
her u
se.
EPA Export 16-10-2012:23:24:01
ABACUS TRANSPORTATION SURVEYS
CAPINCUR INDUSTRIAL ESTATE TRAFFIC COUNT JULY 2009
MANUAL CLASSIFIED JUNCTION COUNT ATH/09/086
SITE: 01 DATE: 30th July 2009
LOCATION: Dangan Road/Industrial Estate Access DAY: Thursday
MOVEMENT 4 MOVEMENT 5 MOVEMENT 6
TIME CAR LGV OGV1 OGV2 SKIP BUS TOT CAR LGV OGV1 OGV2 SKIP BUS TOT CAR LGV OGV1 OGV2 SKIP BUS TOT
13:00 0 1 0 0 0 0 1 0 0 0 1 0 0 1 31 1 2 1 0 0 35
13:15 0 0 0 0 0 0 0 0 0 0 0 0 0 0 20 4 2 1 0 0 27
13:30 0 0 0 0 0 0 0 0 0 0 0 0 0 0 25 3 0 0 0 0 28
13:45 0 0 0 0 0 0 0 1 1 0 0 0 0 2 33 2 0 0 0 0 35
H/TOT 0 1 0 0 0 0 1 1 1 0 1 0 0 3 109 10 4 2 0 0 125
14:00 1 0 0 0 0 0 1 2 1 1 0 0 0 4 24 7 0 0 0 0 31
14:15 1 1 0 0 0 0 2 0 0 0 0 0 0 0 24 4 0 0 0 0 28
14:30 1 1 0 0 0 0 2 2 1 0 0 0 0 3 15 3 1 0 0 0 19
14:45 2 0 0 0 0 0 2 1 2 0 0 0 0 3 11 1 1 0 0 0 13
H/TOT 5 2 0 0 0 0 7 5 4 1 0 0 0 10 74 15 2 0 0 0 91
15:00 0 0 0 0 0 0 0 1 2 0 0 0 0 3 21 5 1 0 1 0 28
15:15 0 1 0 0 0 0 1 1 0 0 2 0 0 3 35 3 1 0 0 0 39
15:30 1 0 1 0 0 0 2 3 1 0 0 0 0 4 22 6 0 0 0 0 28
15:45 0 0 1 0 0 0 1 2 0 0 0 0 0 2 25 3 0 0 0 0 28
H/TOT 1 1 2 0 0 0 4 7 3 0 2 0 0 12 103 17 2 0 1 0 123
16:00 1 2 1 0 0 0 4 0 0 0 0 0 0 0 31 2 0 2 0 0 35
16:15 0 1 1 0 0 0 2 1 1 1 0 0 0 3 25 4 1 0 0 0 30
16:30 0 0 0 0 0 0 0 0 0 0 0 0 0 0 12 2 1 0 0 0 15
16:45 1 1 1 0 0 0 3 1 0 1 0 0 0 2 22 4 1 0 0 0 27
H/TOT 2 4 3 0 0 0 9 2 1 2 0 0 0 5 90 12 3 2 0 0 107
17:00 3 0 0 0 0 0 3 1 0 0 0 0 0 1 24 2 0 0 0 0 26
17:15 1 0 0 0 0 0 1 1 1 0 0 0 0 2 23 6 0 1 0 0 30
17:30 2 0 0 0 0 0 2 3 0 0 0 0 0 3 22 3 1 0 0 0 26
17:45 0 0 0 0 0 0 0 0 0 0 0 0 0 0 21 6 0 0 0 0 27
H/TOT 6 0 0 0 0 0 6 5 1 0 0 0 0 6 90 17 1 1 0 0 109
18:00 2 1 0 0 0 0 3 1 1 0 0 0 0 2 15 4 0 0 0 0 19
18:15 1 0 0 0 0 0 1 0 0 0 0 0 0 0 22 0 3 0 0 0 25
18:30 0 0 0 0 0 0 0 0 0 0 0 0 0 0 19 4 0 0 0 0 23
18:45 0 0 0 0 0 0 0 0 0 0 0 0 0 0 17 2 2 0 0 0 21
H/TOT 3 1 0 0 0 0 4 1 1 0 0 0 0 2 73 10 5 0 0 0 88
P/TOT 31 13 6 0 0 1 51 48 26 4 3 0 0 81 1234 174 42 17 2 1 1470
Appendix 5 4
Abacus Transportation Surveys Ltd for
Traffic Wise Consulting Engineers
For
insp
ectio
n pur
pose
s only
.
Conse
nt of
copy
right
owne
r req
uired
for a
ny ot
her u
se.
EPA Export 16-10-2012:23:24:01
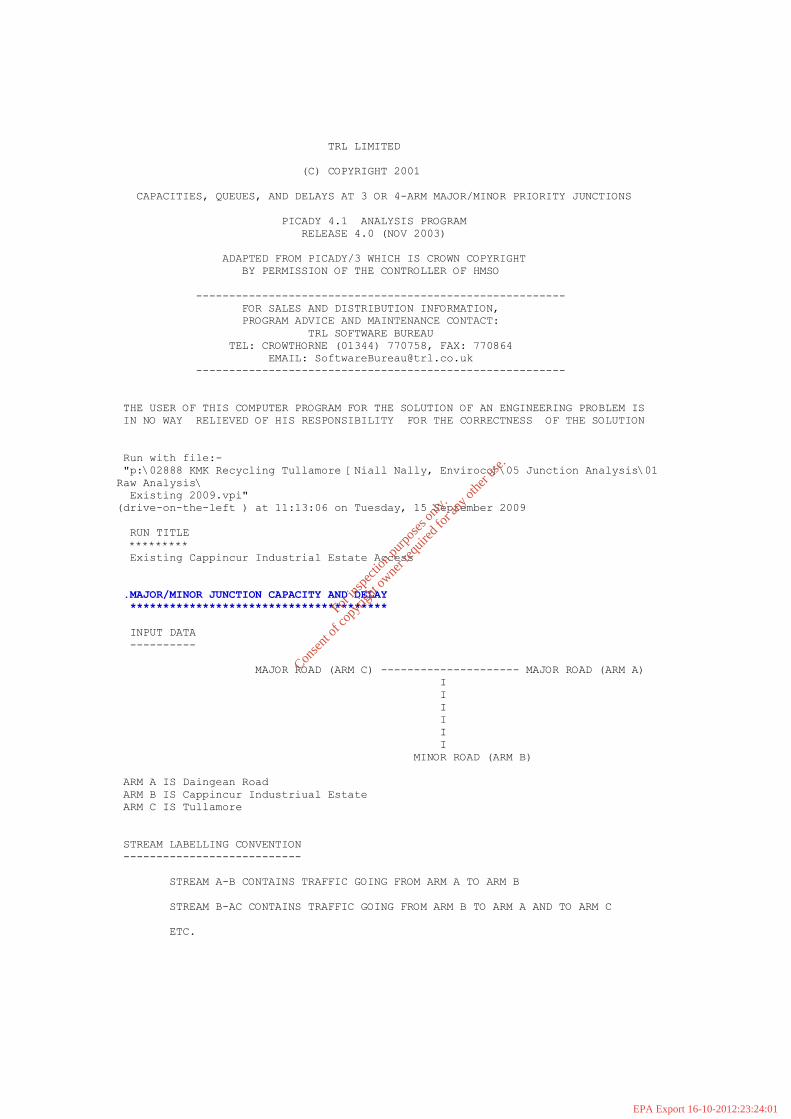
TRL LIMITED
(C) COPYRIGHT 2001
CAPACITIES, QUEUES, AND DELAYS AT 3 OR 4-ARM MAJOR/MINOR PRIORITY JUNCTIONS
PICADY 4.1 ANALYSIS PROGRAM
RELEASE 4.0 (NOV 2003)
ADAPTED FROM PICADY/3 WHICH IS CROWN COPYRIGHT
BY PERMISSION OF THE CONTROLLER OF HMSO
--------------------------------------------------------
FOR SALES AND DISTRIBUTION INFORMATION,
PROGRAM ADVICE AND MAINTENANCE CONTACT:
TRL SOFTWARE BUREAU
TEL: CROWTHORNE (01344) 770758, FAX: 770864
EMAIL: [email protected]
--------------------------------------------------------
THE USER OF THIS COMPUTER PROGRAM FOR THE SOLUTION OF AN ENGINEERING PROBLEM IS
IN NO WAY RELIEVED OF HIS RESPONSIBILITY FOR THE CORRECTNESS OF THE SOLUTION
Run with file:-
"p:\02888 KMK Recycling Tullamore [Niall Nally, Enviroco]\05 Junction Analysis\01
Raw Analysis\
Existing 2009.vpi"
(drive-on-the-left ) at 11:13:06 on Tuesday, 15 September 2009
RUN TITLE
*********
Existing Cappincur Industrial Estate Access
.MAJOR/MINOR JUNCTION CAPACITY AND DELAY
***************************************
INPUT DATA
----------
MAJOR ROAD (ARM C) --------------------- MAJOR ROAD (ARM A)
I
I
I
I
I
I
MINOR ROAD (ARM B)
ARM A IS Daingean Road
ARM B IS Cappincur Industriual Estate
ARM C IS Tullamore
STREAM LABELLING CONVENTION
---------------------------
STREAM A-B CONTAINS TRAFFIC GOING FROM ARM A TO ARM B
STREAM B-AC CONTAINS TRAFFIC GOING FROM ARM B TO ARM A AND TO ARM C
ETC.
For
insp
ectio
n pur
pose
s only
.
Conse
nt of
copy
right
owne
r req
uired
for a
ny ot
her u
se.
EPA Export 16-10-2012:23:24:01

.GEOMETRIC DATA
--------------
----------------------------------------------------------------
I DATA ITEM I MINOR ROAD B I
----------------------------------------------------------------
I TOTAL MAJOR ROAD CARRIAGEWAY WIDTH I ( W ) 6.00 M. I
I CENTRAL RESERVE WIDTH I (WCR ) 0.00 M. I
I I I
I MAJOR ROAD RIGHT TURN - WIDTH I (WC-B) 2.20 M. I
I - VISIBILITY I (VC-B) 180.0 M. I
I - BLOCKS TRAFFIC I YES I
I I I
I MINOR ROAD - VISIBILITY TO LEFT I (VB-C) 90.0 M. I
I - VISIBILITY TO RIGHT I (VB-A) 120.0 M. I
I - LANE 1 WIDTH I (WB-C) - I
I - LANE 2 WIDTH I (WB-A) - I
I - WIDTH AT 0 M FROM JUNC. I 4.40 M. I
I - WIDTH AT 5 M FROM JUNC. I 3.00 M. I
I - WIDTH AT 10 M FROM JUNC. I 2.20 M. I
I - WIDTH AT 15 M FROM JUNC. I 2.20 M. I
I - WIDTH AT 20 M FROM JUNC. I 2.20 M. I
I - LENGTH OF FLARED SECTION I 1 VEHS I
----------------------------------------------------------------
.
.TRAFFIC DEMAND DATA
-------------------
TIME PERIOD BEGINS 16.45 AND ENDS 18.15
LENGTH OF TIME PERIOD - 90 MINUTES.
LENGTH OF TIME SEGMENT - 15 MINUTES.
DEMAND FLOW PROFILES ARE SYNTHESISED FROM TURNING COUNT DATA
-----------------------------------------------------------------------------
I I NUMBER OF MINUTES FROM START WHEN I RATE OF FLOW (VEH/MIN) I
I ARM I FLOW STARTS I TOP OF PEAK I FLOW STOPS I BEFORE I AT TOP I AFTER I
I I TO RISE I IS REACHED I FALLING I PEAK I OF PEAK I PEAK I
-----------------------------------------------------------------------------
I ARM A I 15.00 I 45.00 I 75.00 I 1.44 I 2.16 I 1.44 I
I ARM B I 15.00 I 45.00 I 75.00 I 0.52 I 0.79 I 0.52 I
I ARM C I 15.00 I 45.00 I 75.00 I 2.65 I 3.98 I 2.65 I
-----------------------------------------------------------------------------
.
-----------------------------------------------------------
I I TURNING PROPORTIONS I
I I TURNING COUNTS (VEH/HR) I
I I (PERCENTAGE OF H.V.S) I
I --------------------------------------
I TIME I FROM/TO I ARM A I ARM B I ARM C I
-----------------------------------------------------------
I 16.45 - 18.15 I I I I I
I I ARM A I 0.000 I 0.052 I 0.948 I
I I I 0.0 I 6.0 I 109.0 I
I I I ( 0.0)I ( 10.0)I ( 10.0)I
I I I I I I
I I ARM B I 0.143 I 0.000 I 0.857 I
For
insp
ectio
n pur
pose
s only
.
Conse
nt of
copy
right
owne
r req
uired
for a
ny ot
her u
se.
EPA Export 16-10-2012:23:24:01

I I I 6.0 I 0.0 I 36.0 I
I I I ( 10.0)I ( 0.0)I ( 10.0)I
I I I I I I
I I ARM C I 0.901 I 0.099 I 0.000 I
I I I 191.0 I 21.0 I 0.0 I
I I I ( 10.0)I ( 10.0)I ( 0.0)I
I I I I I I
-----------------------------------------------------------
TURNING PROPORTIONS ARE CALCULATED FROM TURNING COUNT DATA
DEFAULT PROPORTIONS OF HEAVY VEHICLES ARE USED
.-----------------------------------------------------------------------------------
--------------
I TIME DEMAND CAPACITY DEMAND/ PEDESTRIAN START END DELAY
GEOMETRIC DELAYI
I (VEH/MIN) (VEH/MIN) CAPACITY FLOW QUEUE QUEUE (VEH.MIN/
(VEH.MIN/ I
I (RFC) (PEDS/MIN) (VEHS) (VEHS) TIME SEGMENT)
TIME SEGMENT) I
I 16.45-17.00
I
I B-C 0.45 9.86 0.046 0.0 0.0 0.7
I
I B-A 0.08 5.91 0.013 0.0 0.0 0.2
I
I C-AB 0.33 11.41 0.029 0.0 0.0 0.6
I
I C-A 2.32
I
I A-B 0.08
I
I A-C 1.36
I
I
I
-----------------------------------------------------------------------------------
--------------
.-----------------------------------------------------------------------------------
--------------
I TIME DEMAND CAPACITY DEMAND/ PEDESTRIAN START END DELAY
GEOMETRIC DELAYI
I (VEH/MIN) (VEH/MIN) CAPACITY FLOW QUEUE QUEUE (VEH.MIN/
(VEH.MIN/ I
I (RFC) (PEDS/MIN) (VEHS) (VEHS) TIME SEGMENT)
TIME SEGMENT) I
I 17.00-17.15
I
I B-C 0.54 9.78 0.055 0.0 0.1 0.9
I
I B-A 0.09 5.78 0.016 0.0 0.0 0.2
I
I C-AB 0.41 11.63 0.035 0.0 0.0 0.7
I
I C-A 2.75
I
I A-B 0.09
I
I A-C 1.63
I
I
I
-----------------------------------------------------------------------------------
--------------
For
insp
ectio
n pur
pose
s only
.
Conse
nt of
copy
right
owne
r req
uired
for a
ny ot
her u
se.
EPA Export 16-10-2012:23:24:01
.-----------------------------------------------------------------------------------
--------------
I TIME DEMAND CAPACITY DEMAND/ PEDESTRIAN START END DELAY
GEOMETRIC DELAYI
I (VEH/MIN) (VEH/MIN) CAPACITY FLOW QUEUE QUEUE (VEH.MIN/
(VEH.MIN/ I
I (RFC) (PEDS/MIN) (VEHS) (VEHS) TIME SEGMENT)
TIME SEGMENT) I
I 17.15-17.30
I
I B-C 0.66 9.67 0.068 0.1 0.1 1.1
I
I B-A 0.11 5.60 0.020 0.0 0.0 0.3
I
I C-AB 0.53 11.94 0.045 0.0 0.1 1.0
I
I C-A 3.34
I
I A-B 0.11
I
I A-C 1.99
I
I
I
-----------------------------------------------------------------------------------
--------------
.-----------------------------------------------------------------------------------
--------------
I TIME DEMAND CAPACITY DEMAND/ PEDESTRIAN START END DELAY
GEOMETRIC DELAYI
I (VEH/MIN) (VEH/MIN) CAPACITY FLOW QUEUE QUEUE (VEH.MIN/
(VEH.MIN/ I
I (RFC) (PEDS/MIN) (VEHS) (VEHS) TIME SEGMENT)
TIME SEGMENT) I
I 17.30-17.45
I
I B-C 0.66 9.67 0.068 0.1 0.1 1.1
I
I B-A 0.11 5.60 0.020 0.0 0.0 0.3
I
I C-AB 0.53 11.94 0.045 0.1 0.1 1.0
I
I C-A 3.34
I
I A-B 0.11
I
I A-C 1.99
I
I
I
-----------------------------------------------------------------------------------
--------------
.-----------------------------------------------------------------------------------
--------------
I TIME DEMAND CAPACITY DEMAND/ PEDESTRIAN START END DELAY
GEOMETRIC DELAYI
I (VEH/MIN) (VEH/MIN) CAPACITY FLOW QUEUE QUEUE (VEH.MIN/
(VEH.MIN/ I
I (RFC) (PEDS/MIN) (VEHS) (VEHS) TIME SEGMENT)
TIME SEGMENT) I
I 17.45-18.00
I
I B-C 0.54 9.78 0.055 0.1 0.1 0.9
I
For
insp
ectio
n pur
pose
s only
.
Conse
nt of
copy
right
owne
r req
uired
for a
ny ot
her u
se.
EPA Export 16-10-2012:23:24:01

I B-A 0.09 5.78 0.016 0.0 0.0 0.2
I
I C-AB 0.41 11.63 0.035 0.1 0.0 0.7
I
I C-A 2.75
I
I A-B 0.09
I
I A-C 1.63
I
I
I
-----------------------------------------------------------------------------------
--------------
.-----------------------------------------------------------------------------------
--------------
I TIME DEMAND CAPACITY DEMAND/ PEDESTRIAN START END DELAY
GEOMETRIC DELAYI
I (VEH/MIN) (VEH/MIN) CAPACITY FLOW QUEUE QUEUE (VEH.MIN/
(VEH.MIN/ I
I (RFC) (PEDS/MIN) (VEHS) (VEHS) TIME SEGMENT)
TIME SEGMENT) I
I 18.00-18.15
I
I B-C 0.45 9.86 0.046 0.1 0.0 0.7
I
I B-A 0.08 5.90 0.013 0.0 0.0 0.2
I
I C-AB 0.33 11.41 0.029 0.0 0.0 0.6
I
I C-A 2.32
I
I A-B 0.08
I
I A-C 1.36
I
I
I
-----------------------------------------------------------------------------------
--------------
*WARNING* NO MARGINAL ANALYSIS OF CAPACITIES AS MAJOR ROAD BLOCKING MAY OCCUR
.
QUEUE FOR STREAM B-C
-------------------------
TIME SEGMENT NO. OF
ENDING VEHICLES
IN QUEUE
17.00 0.0
17.15 0.1
17.30 0.1
17.45 0.1
18.00 0.1
18.15 0.0
.
QUEUE FOR STREAM B-A
-------------------------
TIME SEGMENT NO. OF
ENDING VEHICLES
IN QUEUE
17.00 0.0
17.15 0.0
17.30 0.0
17.45 0.0
18.00 0.0
18.15 0.0
For
insp
ectio
n pur
pose
s only
.
Conse
nt of
copy
right
owne
r req
uired
for a
ny ot
her u
se.
EPA Export 16-10-2012:23:24:01

.
QUEUE FOR STREAM C-AB
-------------------------
TIME SEGMENT NO. OF
ENDING VEHICLES
IN QUEUE
17.00 0.0
17.15 0.0
17.30 0.1
17.45 0.1
18.00 0.0
18.15 0.0
.
QUEUEING DELAY INFORMATION OVER WHOLE PERIOD
--------------------------------------------
---------------------------------------------------------------------------
I STREAM I TOTAL DEMAND I * QUEUEING * I * INCLUSIVE QUEUEING * I
I I I * DELAY * I * DELAY * I
I I----------------------------------------------------------------I
I I (VEH) (VEH/H) I (MIN) (MIN/VEH) I (MIN) (MIN/VEH) I
---------------------------------------------------------------------------
I B-C I 49.4 I 32.9 I 5.3 I 0.11 I 5.3 I 0.11 I
I B-A I 8.2 I 5.5 I 1.4 I 0.18 I 1.4 I 0.18 I
I C-AB I 38.2 I 25.5 I 4.5 I 0.12 I 4.5 I 0.12 I
I C-A I 252.5 I 168.3 I I I I I
I A-B I 8.2 I 5.5 I I I I I
I A-C I 149.5 I 99.6 I I I I I
---------------------------------------------------------------------------
I ALL I 506.0 I 337.3 I 11.3 I 0.02 I 11.3 I 0.02 I
---------------------------------------------------------------------------
* DELAY IS THAT OCCURRING ONLY WITHIN THE TIME PERIOD .
* INCLUSIVE DELAY INCLUDES DELAY SUFFERED BY VEHICLES WHICH ARE STILL QUEUEING
AFTER THE END OF THE TIME PERIOD.
* THESE WILL ONLY BE SIGNIFICANTLY DIFFERENT IF THERE IS A LARGE QUEUE REMAINING AT
THE END OF THE TIME PERIOD.
END OF JOB
****** PICADY 4 run completed.
============================================= end of file
===============================================
For
insp
ectio
n pur
pose
s only
.
Conse
nt of
copy
right
owne
r req
uired
for a
ny ot
her u
se.
EPA Export 16-10-2012:23:24:01
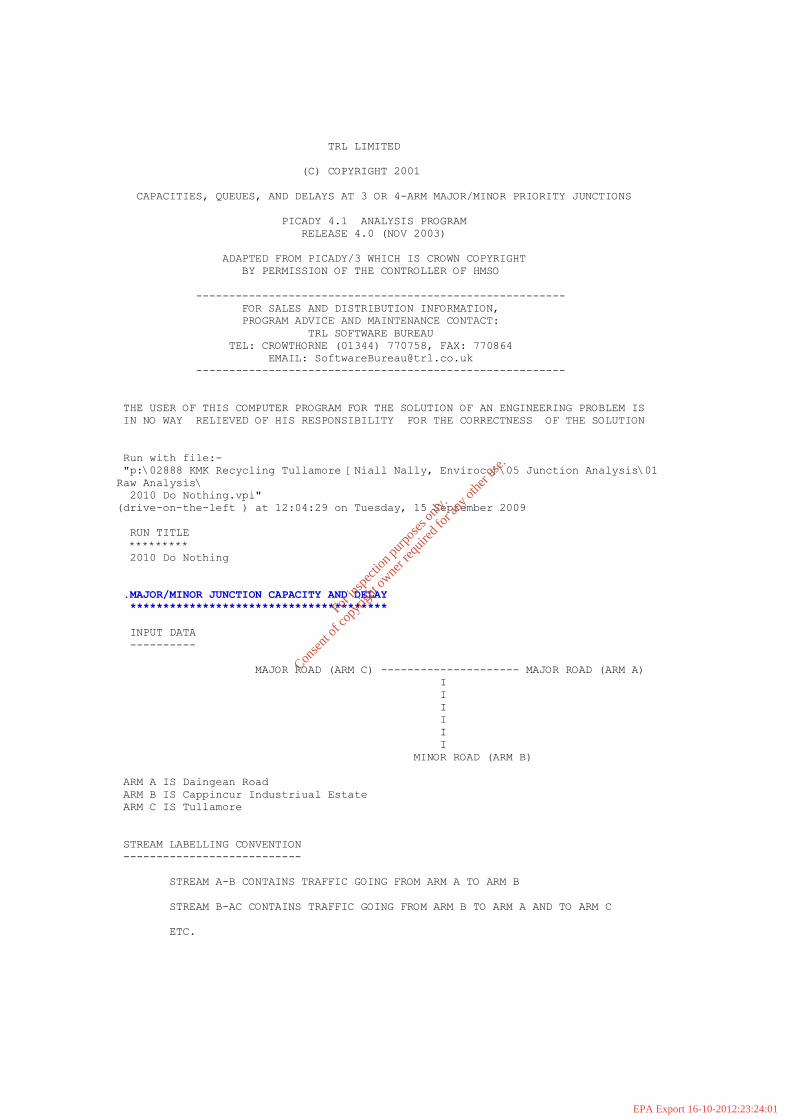
TRL LIMITED
(C) COPYRIGHT 2001
CAPACITIES, QUEUES, AND DELAYS AT 3 OR 4-ARM MAJOR/MINOR PRIORITY JUNCTIONS
PICADY 4.1 ANALYSIS PROGRAM
RELEASE 4.0 (NOV 2003)
ADAPTED FROM PICADY/3 WHICH IS CROWN COPYRIGHT
BY PERMISSION OF THE CONTROLLER OF HMSO
--------------------------------------------------------
FOR SALES AND DISTRIBUTION INFORMATION,
PROGRAM ADVICE AND MAINTENANCE CONTACT:
TRL SOFTWARE BUREAU
TEL: CROWTHORNE (01344) 770758, FAX: 770864
EMAIL: [email protected]
--------------------------------------------------------
THE USER OF THIS COMPUTER PROGRAM FOR THE SOLUTION OF AN ENGINEERING PROBLEM IS
IN NO WAY RELIEVED OF HIS RESPONSIBILITY FOR THE CORRECTNESS OF THE SOLUTION
Run with file:-
"p:\02888 KMK Recycling Tullamore [Niall Nally, Enviroco]\05 Junction Analysis\01
Raw Analysis\
2010 Do Nothing.vpi"
(drive-on-the-left ) at 12:04:29 on Tuesday, 15 September 2009
RUN TITLE
*********
2010 Do Nothing
.MAJOR/MINOR JUNCTION CAPACITY AND DELAY
***************************************
INPUT DATA
----------
MAJOR ROAD (ARM C) --------------------- MAJOR ROAD (ARM A)
I
I
I
I
I
I
MINOR ROAD (ARM B)
ARM A IS Daingean Road
ARM B IS Cappincur Industriual Estate
ARM C IS Tullamore
STREAM LABELLING CONVENTION
---------------------------
STREAM A-B CONTAINS TRAFFIC GOING FROM ARM A TO ARM B
STREAM B-AC CONTAINS TRAFFIC GOING FROM ARM B TO ARM A AND TO ARM C
ETC.
For
insp
ectio
n pur
pose
s only
.
Conse
nt of
copy
right
owne
r req
uired
for a
ny ot
her u
se.
EPA Export 16-10-2012:23:24:01

.GEOMETRIC DATA
--------------
----------------------------------------------------------------
I DATA ITEM I MINOR ROAD B I
----------------------------------------------------------------
I TOTAL MAJOR ROAD CARRIAGEWAY WIDTH I ( W ) 6.00 M. I
I CENTRAL RESERVE WIDTH I (WCR ) 0.00 M. I
I I I
I MAJOR ROAD RIGHT TURN - WIDTH I (WC-B) 2.20 M. I
I - VISIBILITY I (VC-B) 180.0 M. I
I - BLOCKS TRAFFIC I YES I
I I I
I MINOR ROAD - VISIBILITY TO LEFT I (VB-C) 90.0 M. I
I - VISIBILITY TO RIGHT I (VB-A) 120.0 M. I
I - LANE 1 WIDTH I (WB-C) - I
I - LANE 2 WIDTH I (WB-A) - I
I - WIDTH AT 0 M FROM JUNC. I 4.40 M. I
I - WIDTH AT 5 M FROM JUNC. I 3.00 M. I
I - WIDTH AT 10 M FROM JUNC. I 2.20 M. I
I - WIDTH AT 15 M FROM JUNC. I 2.20 M. I
I - WIDTH AT 20 M FROM JUNC. I 2.20 M. I
I - LENGTH OF FLARED SECTION I 1 VEHS I
----------------------------------------------------------------
.
.TRAFFIC DEMAND DATA
-------------------
TIME PERIOD BEGINS 16.45 AND ENDS 18.15
LENGTH OF TIME PERIOD - 90 MINUTES.
LENGTH OF TIME SEGMENT - 15 MINUTES.
DEMAND FLOW PROFILES ARE SYNTHESISED FROM TURNING COUNT DATA
-----------------------------------------------------------------------------
I I NUMBER OF MINUTES FROM START WHEN I RATE OF FLOW (VEH/MIN) I
I ARM I FLOW STARTS I TOP OF PEAK I FLOW STOPS I BEFORE I AT TOP I AFTER I
I I TO RISE I IS REACHED I FALLING I PEAK I OF PEAK I PEAK I
-----------------------------------------------------------------------------
I ARM A I 15.00 I 45.00 I 75.00 I 1.49 I 2.23 I 1.49 I
I ARM B I 15.00 I 45.00 I 75.00 I 0.54 I 0.81 I 0.54 I
I ARM C I 15.00 I 45.00 I 75.00 I 2.74 I 4.11 I 2.74 I
-----------------------------------------------------------------------------
.
-----------------------------------------------------------
I I TURNING PROPORTIONS I
I I TURNING COUNTS (VEH/HR) I
I I (PERCENTAGE OF H.V.S) I
I --------------------------------------
I TIME I FROM/TO I ARM A I ARM B I ARM C I
-----------------------------------------------------------
I 16.45 - 18.15 I I I I I
I I ARM A I 0.000 I 0.050 I 0.950 I
I I I 0.0 I 6.0 I 113.0 I
I I I ( 0.0)I ( 10.0)I ( 10.0)I
I I I I I I
I I ARM B I 0.140 I 0.000 I 0.860 I
For
insp
ectio
n pur
pose
s only
.
Conse
nt of
copy
right
owne
r req
uired
for a
ny ot
her u
se.
EPA Export 16-10-2012:23:24:01

I I I 6.0 I 0.0 I 37.0 I
I I I ( 10.0)I ( 0.0)I ( 10.0)I
I I I I I I
I I ARM C I 0.900 I 0.100 I 0.000 I
I I I 197.0 I 22.0 I 0.0 I
I I I ( 10.0)I ( 10.0)I ( 0.0)I
I I I I I I
-----------------------------------------------------------
TURNING PROPORTIONS ARE CALCULATED FROM TURNING COUNT DATA
DEFAULT PROPORTIONS OF HEAVY VEHICLES ARE USED
.-----------------------------------------------------------------------------------
--------------
I TIME DEMAND CAPACITY DEMAND/ PEDESTRIAN START END DELAY
GEOMETRIC DELAYI
I (VEH/MIN) (VEH/MIN) CAPACITY FLOW QUEUE QUEUE (VEH.MIN/
(VEH.MIN/ I
I (RFC) (PEDS/MIN) (VEHS) (VEHS) TIME SEGMENT)
TIME SEGMENT) I
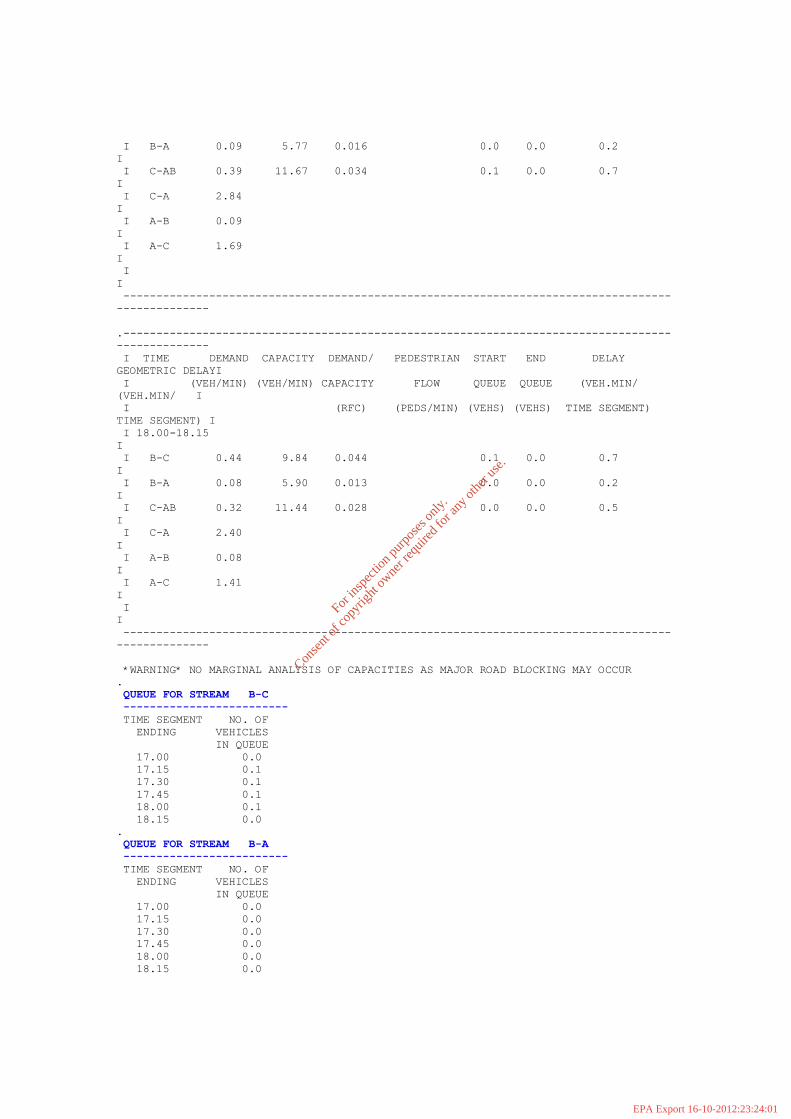
I 16.45-17.00
I
I B-C 0.46 9.85 0.047 0.0 0.0 0.7
I
I B-A 0.08 5.87 0.013 0.0 0.0 0.2
I
I C-AB 0.35 11.44 0.030 0.0 0.0 0.6
I
I C-A 2.39
I
I A-B 0.08
I
I A-C 1.41
I
I
I
-----------------------------------------------------------------------------------
--------------
.-----------------------------------------------------------------------------------
--------------
I TIME DEMAND CAPACITY DEMAND/ PEDESTRIAN START END DELAY
GEOMETRIC DELAYI
I (VEH/MIN) (VEH/MIN) CAPACITY FLOW QUEUE QUEUE (VEH.MIN/
(VEH.MIN/ I
I (RFC) (PEDS/MIN) (VEHS) (VEHS) TIME SEGMENT)
TIME SEGMENT) I
I 17.00-17.15
I
I B-C 0.55 9.77 0.057 0.0 0.1 0.9
I
I B-A 0.09 5.74 0.016 0.0 0.0 0.2
I
I C-AB 0.43 11.67 0.037 0.0 0.1 0.8
I
I C-A 2.84
I
I A-B 0.09
I
I A-C 1.69
I
I
I
-----------------------------------------------------------------------------------
--------------
For
insp
ectio
n pur
pose
s only
.
Conse
nt of
copy
right
owne
r req
uired
for a
ny ot
her u
se.
EPA Export 16-10-2012:23:24:01

.-----------------------------------------------------------------------------------
--------------
I TIME DEMAND CAPACITY DEMAND/ PEDESTRIAN START END DELAY
GEOMETRIC DELAYI
I (VEH/MIN) (VEH/MIN) CAPACITY FLOW QUEUE QUEUE (VEH.MIN/
(VEH.MIN/ I
I (RFC) (PEDS/MIN) (VEHS) (VEHS) TIME SEGMENT)
TIME SEGMENT) I
I 17.15-17.30
I
I B-C 0.68 9.65 0.070 0.1 0.1 1.1
I
I B-A 0.11 5.56 0.020 0.0 0.0 0.3
I
I C-AB 0.56 11.99 0.047 0.1 0.1 1.0
I
I C-A 3.44
I
I A-B 0.11
I
I A-C 2.07
I
I
I
-----------------------------------------------------------------------------------
--------------
.-----------------------------------------------------------------------------------
--------------
I TIME DEMAND CAPACITY DEMAND/ PEDESTRIAN START END DELAY
GEOMETRIC DELAYI
I (VEH/MIN) (VEH/MIN) CAPACITY FLOW QUEUE QUEUE (VEH.MIN/
(VEH.MIN/ I
I (RFC) (PEDS/MIN) (VEHS) (VEHS) TIME SEGMENT)
TIME SEGMENT) I
I 17.30-17.45
I
I B-C 0.68 9.65 0.070 0.1 0.1 1.1
I
I B-A 0.11 5.56 0.020 0.0 0.0 0.3
I
I C-AB 0.56 11.99 0.047 0.1 0.1 1.1
I
I C-A 3.44
I
I A-B 0.11
I
I A-C 2.07
I
I
I
-----------------------------------------------------------------------------------
--------------
.-----------------------------------------------------------------------------------
--------------
I TIME DEMAND CAPACITY DEMAND/ PEDESTRIAN START END DELAY
GEOMETRIC DELAYI
I (VEH/MIN) (VEH/MIN) CAPACITY FLOW QUEUE QUEUE (VEH.MIN/
(VEH.MIN/ I
I (RFC) (PEDS/MIN) (VEHS) (VEHS) TIME SEGMENT)
TIME SEGMENT) I
I 17.45-18.00
I
I B-C 0.55 9.77 0.057 0.1 0.1 0.9
I
For
insp
ectio
n pur
pose
s only
.
Conse
nt of
copy
right
owne
r req
uired
for a
ny ot
her u
se.
EPA Export 16-10-2012:23:24:01

I B-A 0.09 5.74 0.016 0.0 0.0 0.2
I
I C-AB 0.43 11.67 0.037 0.1 0.1 0.8
I
I C-A 2.83
I
I A-B 0.09
I
I A-C 1.69
I
I
I
-----------------------------------------------------------------------------------
--------------
.-----------------------------------------------------------------------------------
--------------
I TIME DEMAND CAPACITY DEMAND/ PEDESTRIAN START END DELAY
GEOMETRIC DELAYI
I (VEH/MIN) (VEH/MIN) CAPACITY FLOW QUEUE QUEUE (VEH.MIN/
(VEH.MIN/ I
I (RFC) (PEDS/MIN) (VEHS) (VEHS) TIME SEGMENT)
TIME SEGMENT) I
I 18.00-18.15
I
I B-C 0.46 9.85 0.047 0.1 0.0 0.8
I
I B-A 0.08 5.87 0.013 0.0 0.0 0.2
I
I C-AB 0.35 11.44 0.030 0.1 0.0 0.6
I
I C-A 2.39
I
I A-B 0.08
I
I A-C 1.41
I
I
I
-----------------------------------------------------------------------------------
--------------
*WARNING* NO MARGINAL ANALYSIS OF CAPACITIES AS MAJOR ROAD BLOCKING MAY OCCUR
.
QUEUE FOR STREAM B-C
-------------------------
TIME SEGMENT NO. OF
ENDING VEHICLES
IN QUEUE
17.00 0.0
17.15 0.1
17.30 0.1
17.45 0.1
18.00 0.1
18.15 0.0
.
QUEUE FOR STREAM B-A
-------------------------
TIME SEGMENT NO. OF
ENDING VEHICLES
IN QUEUE
17.00 0.0
17.15 0.0
17.30 0.0
17.45 0.0
18.00 0.0
18.15 0.0
For
insp
ectio
n pur
pose
s only
.
Conse
nt of
copy
right
owne
r req
uired
for a
ny ot
her u
se.
EPA Export 16-10-2012:23:24:01

.
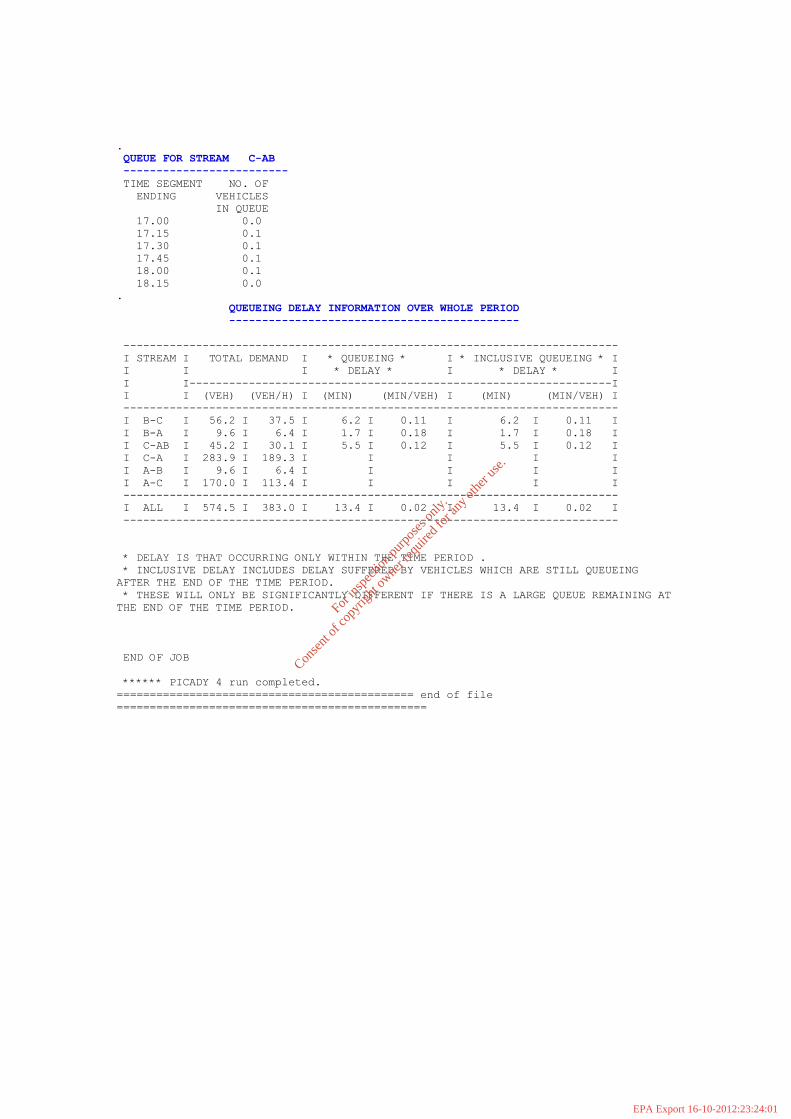
QUEUE FOR STREAM C-AB
-------------------------
TIME SEGMENT NO. OF
ENDING VEHICLES
IN QUEUE
17.00 0.0
17.15 0.1
17.30 0.1
17.45 0.1
18.00 0.1
18.15 0.0
.
QUEUEING DELAY INFORMATION OVER WHOLE PERIOD
--------------------------------------------
---------------------------------------------------------------------------
I STREAM I TOTAL DEMAND I * QUEUEING * I * INCLUSIVE QUEUEING * I
I I I * DELAY * I * DELAY * I
I I----------------------------------------------------------------I
I I (VEH) (VEH/H) I (MIN) (MIN/VEH) I (MIN) (MIN/VEH) I
---------------------------------------------------------------------------
I B-C I 50.7 I 33.8 I 5.5 I 0.11 I 5.5 I 0.11 I
I B-A I 8.2 I 5.5 I 1.5 I 0.18 I 1.5 I 0.18 I
I C-AB I 40.3 I 26.9 I 4.8 I 0.12 I 4.8 I 0.12 I
I C-A I 260.0 I 173.3 I I I I I
I A-B I 8.2 I 5.5 I I I I I
I A-C I 154.9 I 103.3 I I I I I
---------------------------------------------------------------------------
I ALL I 522.4 I 348.3 I 11.8 I 0.02 I 11.8 I 0.02 I
---------------------------------------------------------------------------
* DELAY IS THAT OCCURRING ONLY WITHIN THE TIME PERIOD .
* INCLUSIVE DELAY INCLUDES DELAY SUFFERED BY VEHICLES WHICH ARE STILL QUEUEING
AFTER THE END OF THE TIME PERIOD.
* THESE WILL ONLY BE SIGNIFICANTLY DIFFERENT IF THERE IS A LARGE QUEUE REMAINING AT
THE END OF THE TIME PERIOD.
END OF JOB
****** PICADY 4 run completed.
============================================= end of file
===============================================
For
insp
ectio
n pur
pose
s only
.
Conse
nt of
copy
right
owne
r req
uired
for a
ny ot
her u
se.
EPA Export 16-10-2012:23:24:01

TRL LIMITED
(C) COPYRIGHT 2001
CAPACITIES, QUEUES, AND DELAYS AT 3 OR 4-ARM MAJOR/MINOR PRIORITY JUNCTIONS
PICADY 4.1 ANALYSIS PROGRAM
RELEASE 4.0 (NOV 2003)
ADAPTED FROM PICADY/3 WHICH IS CROWN COPYRIGHT
BY PERMISSION OF THE CONTROLLER OF HMSO
--------------------------------------------------------
FOR SALES AND DISTRIBUTION INFORMATION,
PROGRAM ADVICE AND MAINTENANCE CONTACT:
TRL SOFTWARE BUREAU
TEL: CROWTHORNE (01344) 770758, FAX: 770864
EMAIL: [email protected]
--------------------------------------------------------
THE USER OF THIS COMPUTER PROGRAM FOR THE SOLUTION OF AN ENGINEERING PROBLEM IS
IN NO WAY RELIEVED OF HIS RESPONSIBILITY FOR THE CORRECTNESS OF THE SOLUTION
Run with file:-
"p:\02888 KMK Recycling Tullamore [Niall Nally, Enviroco]\05 Junction Analysis\01
Raw Analysis\
2010 Do Something.vpi"
(drive-on-the-left ) at 12:05:19 on Tuesday, 15 September 2009
RUN TITLE
*********
2010 Do Something
.MAJOR/MINOR JUNCTION CAPACITY AND DELAY
***************************************
INPUT DATA
----------
MAJOR ROAD (ARM C) --------------------- MAJOR ROAD (ARM A)
I
I
I
I
I
I
MINOR ROAD (ARM B)
ARM A IS Daingean Road
ARM B IS Cappincur Industriual Estate
ARM C IS Tullamore
STREAM LABELLING CONVENTION
---------------------------
STREAM A-B CONTAINS TRAFFIC GOING FROM ARM A TO ARM B
STREAM B-AC CONTAINS TRAFFIC GOING FROM ARM B TO ARM A AND TO ARM C
ETC.
For
insp
ectio
n pur
pose
s only
.
Conse
nt of
copy
right
owne
r req
uired
for a
ny ot
her u
se.
EPA Export 16-10-2012:23:24:01

.GEOMETRIC DATA
--------------
----------------------------------------------------------------
I DATA ITEM I MINOR ROAD B I
----------------------------------------------------------------
I TOTAL MAJOR ROAD CARRIAGEWAY WIDTH I ( W ) 6.00 M. I
I CENTRAL RESERVE WIDTH I (WCR ) 0.00 M. I
I I I
I MAJOR ROAD RIGHT TURN - WIDTH I (WC-B) 2.20 M. I
I - VISIBILITY I (VC-B) 180.0 M. I
I - BLOCKS TRAFFIC I YES I
I I I
I MINOR ROAD - VISIBILITY TO LEFT I (VB-C) 90.0 M. I
I - VISIBILITY TO RIGHT I (VB-A) 120.0 M. I
I - LANE 1 WIDTH I (WB-C) - I
I - LANE 2 WIDTH I (WB-A) - I
I - WIDTH AT 0 M FROM JUNC. I 4.40 M. I
I - WIDTH AT 5 M FROM JUNC. I 3.00 M. I
I - WIDTH AT 10 M FROM JUNC. I 2.20 M. I
I - WIDTH AT 15 M FROM JUNC. I 2.20 M. I
I - WIDTH AT 20 M FROM JUNC. I 2.20 M. I
I - LENGTH OF FLARED SECTION I 1 VEHS I
----------------------------------------------------------------
.
.TRAFFIC DEMAND DATA
-------------------
TIME PERIOD BEGINS 16.45 AND ENDS 18.15
LENGTH OF TIME PERIOD - 90 MINUTES.
LENGTH OF TIME SEGMENT - 15 MINUTES.
DEMAND FLOW PROFILES ARE SYNTHESISED FROM TURNING COUNT DATA
-----------------------------------------------------------------------------
I I NUMBER OF MINUTES FROM START WHEN I RATE OF FLOW (VEH/MIN) I
I ARM I FLOW STARTS I TOP OF PEAK I FLOW STOPS I BEFORE I AT TOP I AFTER I
I I TO RISE I IS REACHED I FALLING I PEAK I OF PEAK I PEAK I
-----------------------------------------------------------------------------
I ARM A I 15.00 I 45.00 I 75.00 I 1.49 I 2.23 I 1.49 I
I ARM B I 15.00 I 45.00 I 75.00 I 0.51 I 0.77 I 0.51 I
I ARM C I 15.00 I 45.00 I 75.00 I 2.71 I 4.07 I 2.71 I
-----------------------------------------------------------------------------
.
-----------------------------------------------------------
I I TURNING PROPORTIONS I
I I TURNING COUNTS (VEH/HR) I
I I (PERCENTAGE OF H.V.S) I
I --------------------------------------
I TIME I FROM/TO I ARM A I ARM B I ARM C I
-----------------------------------------------------------
I 16.45 - 18.15 I I I I I
I I ARM A I 0.000 I 0.050 I 0.950 I
I I I 0.0 I 6.0 I 113.0 I
I I I ( 0.0)I ( 10.0)I ( 10.0)I
I I I I I I
I I ARM B I 0.146 I 0.000 I 0.854 I
For
insp
ectio
n pur
pose
s only
.
Conse
nt of
copy
right
owne
r req
uired
for a
ny ot
her u
se.
EPA Export 16-10-2012:23:24:01

I I I 6.0 I 0.0 I 35.0 I
I I I ( 10.0)I ( 0.0)I ( 10.0)I
I I I I I I
I I ARM C I 0.908 I 0.092 I 0.000 I
I I I 197.0 I 20.0 I 0.0 I
I I I ( 10.0)I ( 10.0)I ( 0.0)I
I I I I I I
-----------------------------------------------------------
TURNING PROPORTIONS ARE CALCULATED FROM TURNING COUNT DATA
DEFAULT PROPORTIONS OF HEAVY VEHICLES ARE USED
.-----------------------------------------------------------------------------------
--------------
I TIME DEMAND CAPACITY DEMAND/ PEDESTRIAN START END DELAY
GEOMETRIC DELAYI
I (VEH/MIN) (VEH/MIN) CAPACITY FLOW QUEUE QUEUE (VEH.MIN/
(VEH.MIN/ I
I (RFC) (PEDS/MIN) (VEHS) (VEHS) TIME SEGMENT)
TIME SEGMENT) I
I 16.45-17.00
I
I B-C 0.44 9.84 0.044 0.0 0.0 0.7
I
I B-A 0.08 5.90 0.013 0.0 0.0 0.2
I
I C-AB 0.32 11.44 0.028 0.0 0.0 0.5
I
I C-A 2.40
I
I A-B 0.08
I
I A-C 1.41
I
I
I
-----------------------------------------------------------------------------------
--------------
.-----------------------------------------------------------------------------------
--------------
I TIME DEMAND CAPACITY DEMAND/ PEDESTRIAN START END DELAY
GEOMETRIC DELAYI
I (VEH/MIN) (VEH/MIN) CAPACITY FLOW QUEUE QUEUE (VEH.MIN/
(VEH.MIN/ I
I (RFC) (PEDS/MIN) (VEHS) (VEHS) TIME SEGMENT)
TIME SEGMENT) I
I 17.00-17.15
I
I B-C 0.52 9.76 0.054 0.0 0.1 0.8
I
I B-A 0.09 5.77 0.016 0.0 0.0 0.2
I
I C-AB 0.39 11.67 0.034 0.0 0.0 0.7
I
I C-A 2.84
I
I A-B 0.09
I
I A-C 1.69
I
I
I
-----------------------------------------------------------------------------------
--------------
For
insp
ectio
n pur
pose
s only
.
Conse
nt of
copy
right
owne
r req
uired
for a
ny ot
her u
se.
EPA Export 16-10-2012:23:24:01

.-----------------------------------------------------------------------------------
--------------
I TIME DEMAND CAPACITY DEMAND/ PEDESTRIAN START END DELAY
GEOMETRIC DELAYI
I (VEH/MIN) (VEH/MIN) CAPACITY FLOW QUEUE QUEUE (VEH.MIN/
(VEH.MIN/ I
I (RFC) (PEDS/MIN) (VEHS) (VEHS) TIME SEGMENT)
TIME SEGMENT) I
I 17.15-17.30
I
I B-C 0.64 9.65 0.066 0.1 0.1 1.0
I
I B-A 0.11 5.59 0.020 0.0 0.0 0.3
I
I C-AB 0.51 11.99 0.043 0.0 0.1 0.9
I
I C-A 3.45
I
I A-B 0.11
I
I A-C 2.07
I
I
I
-----------------------------------------------------------------------------------
--------------
.-----------------------------------------------------------------------------------
--------------
I TIME DEMAND CAPACITY DEMAND/ PEDESTRIAN START END DELAY
GEOMETRIC DELAYI
I (VEH/MIN) (VEH/MIN) CAPACITY FLOW QUEUE QUEUE (VEH.MIN/
(VEH.MIN/ I
I (RFC) (PEDS/MIN) (VEHS) (VEHS) TIME SEGMENT)
TIME SEGMENT) I
I 17.30-17.45
I
I B-C 0.64 9.65 0.066 0.1 0.1 1.1
I
I B-A 0.11 5.59 0.020 0.0 0.0 0.3
I
I C-AB 0.51 11.99 0.043 0.1 0.1 0.9
I
I C-A 3.45
I
I A-B 0.11
I
I A-C 2.07
I
I
I
-----------------------------------------------------------------------------------
--------------
.-----------------------------------------------------------------------------------
--------------
I TIME DEMAND CAPACITY DEMAND/ PEDESTRIAN START END DELAY
GEOMETRIC DELAYI
I (VEH/MIN) (VEH/MIN) CAPACITY FLOW QUEUE QUEUE (VEH.MIN/
(VEH.MIN/ I
I (RFC) (PEDS/MIN) (VEHS) (VEHS) TIME SEGMENT)
TIME SEGMENT) I
I 17.45-18.00
I
I B-C 0.52 9.76 0.054 0.1 0.1 0.9
I
For
insp
ectio
n pur
pose
s only
.
Conse
nt of
copy
right
owne
r req
uired
for a
ny ot
her u
se.
EPA Export 16-10-2012:23:24:01
I B-A 0.09 5.77 0.016 0.0 0.0 0.2
I
I C-AB 0.39 11.67 0.034 0.1 0.0 0.7
I
I C-A 2.84
I
I A-B 0.09
I
I A-C 1.69
I
I
I
-----------------------------------------------------------------------------------
--------------
.-----------------------------------------------------------------------------------
--------------
I TIME DEMAND CAPACITY DEMAND/ PEDESTRIAN START END DELAY
GEOMETRIC DELAYI
I (VEH/MIN) (VEH/MIN) CAPACITY FLOW QUEUE QUEUE (VEH.MIN/
(VEH.MIN/ I
I (RFC) (PEDS/MIN) (VEHS) (VEHS) TIME SEGMENT)
TIME SEGMENT) I
I 18.00-18.15
I
I B-C 0.44 9.84 0.044 0.1 0.0 0.7
I
I B-A 0.08 5.90 0.013 0.0 0.0 0.2
I
I C-AB 0.32 11.44 0.028 0.0 0.0 0.5
I
I C-A 2.40
I
I A-B 0.08
I
I A-C 1.41
I
I
I
-----------------------------------------------------------------------------------
--------------
*WARNING* NO MARGINAL ANALYSIS OF CAPACITIES AS MAJOR ROAD BLOCKING MAY OCCUR
.
QUEUE FOR STREAM B-C
-------------------------
TIME SEGMENT NO. OF
ENDING VEHICLES
IN QUEUE
17.00 0.0
17.15 0.1
17.30 0.1
17.45 0.1
18.00 0.1
18.15 0.0
.
QUEUE FOR STREAM B-A
-------------------------
TIME SEGMENT NO. OF
ENDING VEHICLES
IN QUEUE
17.00 0.0
17.15 0.0
17.30 0.0
17.45 0.0
18.00 0.0
18.15 0.0
For
insp
ectio
n pur
pose
s only
.
Conse
nt of
copy
right
owne
r req
uired
for a
ny ot
her u
se.
EPA Export 16-10-2012:23:24:01

.
QUEUE FOR STREAM C-AB
-------------------------
TIME SEGMENT NO. OF
ENDING VEHICLES
IN QUEUE
17.00 0.0
17.15 0.0
17.30 0.1
17.45 0.1
18.00 0.0
18.15 0.0
.
QUEUEING DELAY INFORMATION OVER WHOLE PERIOD
--------------------------------------------
---------------------------------------------------------------------------
I STREAM I TOTAL DEMAND I * QUEUEING * I * INCLUSIVE QUEUEING * I
I I I * DELAY * I * DELAY * I
I I----------------------------------------------------------------I
I I (VEH) (VEH/H) I (MIN) (MIN/VEH) I (MIN) (MIN/VEH) I
---------------------------------------------------------------------------
I B-C I 48.0 I 32.0 I 5.2 I 0.11 I 5.2 I 0.11 I
I B-A I 8.2 I 5.5 I 1.4 I 0.18 I 1.4 I 0.18 I
I C-AB I 36.7 I 24.5 I 4.3 I 0.12 I 4.3 I 0.12 I
I C-A I 260.9 I 173.9 I I I I I
I A-B I 8.2 I 5.5 I I I I I
I A-C I 154.9 I 103.3 I I I I I
---------------------------------------------------------------------------
I ALL I 516.9 I 344.6 I 10.9 I 0.02 I 10.9 I 0.02 I
---------------------------------------------------------------------------
* DELAY IS THAT OCCURRING ONLY WITHIN THE TIME PERIOD .
* INCLUSIVE DELAY INCLUDES DELAY SUFFERED BY VEHICLES WHICH ARE STILL QUEUEING
AFTER THE END OF THE TIME PERIOD.
* THESE WILL ONLY BE SIGNIFICANTLY DIFFERENT IF THERE IS A LARGE QUEUE REMAINING AT
THE END OF THE TIME PERIOD.
END OF JOB
****** PICADY 4 run completed.
============================================= end of file
===============================================
For
insp
ectio
n pur
pose
s only
.
Conse
nt of
copy
right
owne
r req
uired
for a
ny ot
her u
se.
EPA Export 16-10-2012:23:24:01

TRL LIMITED
(C) COPYRIGHT 2001
CAPACITIES, QUEUES, AND DELAYS AT 3 OR 4-ARM MAJOR/MINOR PRIORITY JUNCTIONS
PICADY 4.1 ANALYSIS PROGRAM
RELEASE 4.0 (NOV 2003)
ADAPTED FROM PICADY/3 WHICH IS CROWN COPYRIGHT
BY PERMISSION OF THE CONTROLLER OF HMSO
--------------------------------------------------------
FOR SALES AND DISTRIBUTION INFORMATION,
PROGRAM ADVICE AND MAINTENANCE CONTACT:
TRL SOFTWARE BUREAU
TEL: CROWTHORNE (01344) 770758, FAX: 770864
EMAIL: [email protected]
--------------------------------------------------------
THE USER OF THIS COMPUTER PROGRAM FOR THE SOLUTION OF AN ENGINEERING PROBLEM IS
IN NO WAY RELIEVED OF HIS RESPONSIBILITY FOR THE CORRECTNESS OF THE SOLUTION
Run with file:-
"p:\02888 KMK Recycling Tullamore [Niall Nally, Enviroco]\05 Junction Analysis\01
Raw Analysis\
2015 Do Nothing.vpi"
(drive-on-the-left ) at 12:06:11 on Tuesday, 15 September 2009
RUN TITLE
*********
2015 Do Nothing
.MAJOR/MINOR JUNCTION CAPACITY AND DELAY
***************************************
INPUT DATA
----------
MAJOR ROAD (ARM C) --------------------- MAJOR ROAD (ARM A)
I
I
I
I
I
I
MINOR ROAD (ARM B)
ARM A IS Daingean Road
ARM B IS Cappincur Industriual Estate
ARM C IS Tullamore
STREAM LABELLING CONVENTION
---------------------------
STREAM A-B CONTAINS TRAFFIC GOING FROM ARM A TO ARM B
STREAM B-AC CONTAINS TRAFFIC GOING FROM ARM B TO ARM A AND TO ARM C
ETC.
For
insp
ectio
n pur
pose
s only
.
Conse
nt of
copy
right
owne
r req
uired
for a
ny ot
her u
se.
EPA Export 16-10-2012:23:24:01

.GEOMETRIC DATA
--------------
----------------------------------------------------------------
I DATA ITEM I MINOR ROAD B I
----------------------------------------------------------------
I TOTAL MAJOR ROAD CARRIAGEWAY WIDTH I ( W ) 6.00 M. I
I CENTRAL RESERVE WIDTH I (WCR ) 0.00 M. I
I I I
I MAJOR ROAD RIGHT TURN - WIDTH I (WC-B) 2.20 M. I
I - VISIBILITY I (VC-B) 180.0 M. I
I - BLOCKS TRAFFIC I YES I
I I I
I MINOR ROAD - VISIBILITY TO LEFT I (VB-C) 90.0 M. I
I - VISIBILITY TO RIGHT I (VB-A) 120.0 M. I
I - LANE 1 WIDTH I (WB-C) - I
I - LANE 2 WIDTH I (WB-A) - I
I - WIDTH AT 0 M FROM JUNC. I 4.40 M. I
I - WIDTH AT 5 M FROM JUNC. I 3.00 M. I
I - WIDTH AT 10 M FROM JUNC. I 2.20 M. I
I - WIDTH AT 15 M FROM JUNC. I 2.20 M. I
I - WIDTH AT 20 M FROM JUNC. I 2.20 M. I
I - LENGTH OF FLARED SECTION I 1 VEHS I
----------------------------------------------------------------
.
.TRAFFIC DEMAND DATA
-------------------
TIME PERIOD BEGINS 16.45 AND ENDS 18.15
LENGTH OF TIME PERIOD - 90 MINUTES.
LENGTH OF TIME SEGMENT - 15 MINUTES.
DEMAND FLOW PROFILES ARE SYNTHESISED FROM TURNING COUNT DATA
-----------------------------------------------------------------------------
I I NUMBER OF MINUTES FROM START WHEN I RATE OF FLOW (VEH/MIN) I
I ARM I FLOW STARTS I TOP OF PEAK I FLOW STOPS I BEFORE I AT TOP I AFTER I
I I TO RISE I IS REACHED I FALLING I PEAK I OF PEAK I PEAK I
-----------------------------------------------------------------------------
I ARM A I 15.00 I 45.00 I 75.00 I 1.64 I 2.46 I 1.64 I
I ARM B I 15.00 I 45.00 I 75.00 I 0.60 I 0.90 I 0.60 I
I ARM C I 15.00 I 45.00 I 75.00 I 3.00 I 4.50 I 3.00 I
-----------------------------------------------------------------------------
.
-----------------------------------------------------------
I I TURNING PROPORTIONS I
I I TURNING COUNTS (VEH/HR) I
I I (PERCENTAGE OF H.V.S) I
I --------------------------------------
I TIME I FROM/TO I ARM A I ARM B I ARM C I
-----------------------------------------------------------
I 16.45 - 18.15 I I I I I
I I ARM A I 0.000 I 0.053 I 0.947 I
I I I 0.0 I 7.0 I 124.0 I
I I I ( 0.0)I ( 10.0)I ( 10.0)I
I I I I I I
I I ARM B I 0.146 I 0.000 I 0.854 I
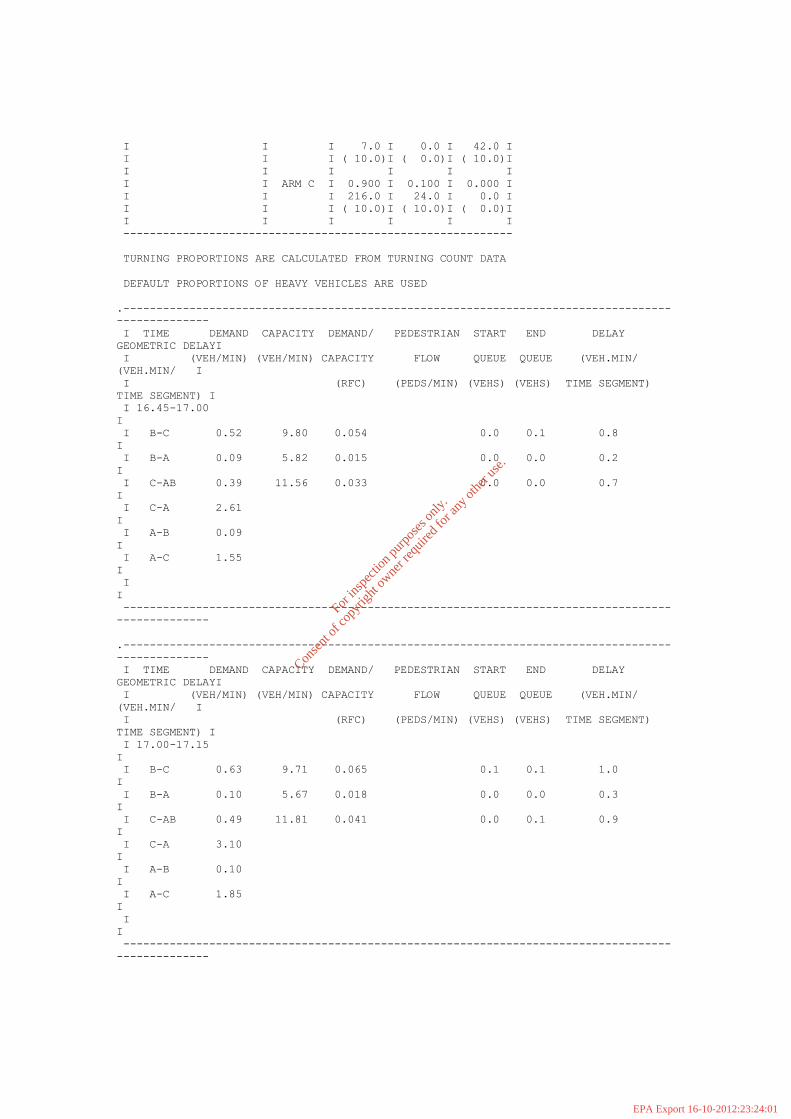
For
insp
ectio
n pur
pose
s only
.
Conse
nt of
copy
right
owne
r req
uired
for a
ny ot
her u
se.
EPA Export 16-10-2012:23:24:01

I I I 7.0 I 0.0 I 41.0 I
I I I ( 10.0)I ( 0.0)I ( 10.0)I
I I I I I I
I I ARM C I 0.900 I 0.100 I 0.000 I
I I I 216.0 I 24.0 I 0.0 I
I I I ( 10.0)I ( 10.0)I ( 0.0)I
I I I I I I
-----------------------------------------------------------
TURNING PROPORTIONS ARE CALCULATED FROM TURNING COUNT DATA
DEFAULT PROPORTIONS OF HEAVY VEHICLES ARE USED
.-----------------------------------------------------------------------------------
--------------
I TIME DEMAND CAPACITY DEMAND/ PEDESTRIAN START END DELAY
GEOMETRIC DELAYI
I (VEH/MIN) (VEH/MIN) CAPACITY FLOW QUEUE QUEUE (VEH.MIN/
(VEH.MIN/ I
I (RFC) (PEDS/MIN) (VEHS) (VEHS) TIME SEGMENT)
TIME SEGMENT) I
I 16.45-17.00
I
I B-C 0.51 9.80 0.052 0.0 0.1 0.8
I
I B-A 0.09 5.83 0.015 0.0 0.0 0.2
I
I C-AB 0.39 11.56 0.033 0.0 0.0 0.7
I
I C-A 2.61
I
I A-B 0.09
I
I A-C 1.55
I
I
I
-----------------------------------------------------------------------------------
--------------
.-----------------------------------------------------------------------------------
--------------
I TIME DEMAND CAPACITY DEMAND/ PEDESTRIAN START END DELAY
GEOMETRIC DELAYI
I (VEH/MIN) (VEH/MIN) CAPACITY FLOW QUEUE QUEUE (VEH.MIN/
(VEH.MIN/ I
I (RFC) (PEDS/MIN) (VEHS) (VEHS) TIME SEGMENT)
TIME SEGMENT) I
I 17.00-17.15
I
I B-C 0.61 9.71 0.063 0.1 0.1 1.0
I
I B-A 0.10 5.68 0.018 0.0 0.0 0.3
I
I C-AB 0.49 11.81 0.041 0.0 0.1 0.9
I
I C-A 3.10
I
I A-B 0.10
I
I A-C 1.85
I
I
I
-----------------------------------------------------------------------------------
--------------
For
insp
ectio
n pur
pose
s only
.
Conse
nt of
copy
right
owne
r req
uired
for a
ny ot
her u
se.
EPA Export 16-10-2012:23:24:01

.-----------------------------------------------------------------------------------
--------------
I TIME DEMAND CAPACITY DEMAND/ PEDESTRIAN START END DELAY
GEOMETRIC DELAYI
I (VEH/MIN) (VEH/MIN) CAPACITY FLOW QUEUE QUEUE (VEH.MIN/
(VEH.MIN/ I
I (RFC) (PEDS/MIN) (VEHS) (VEHS) TIME SEGMENT)
TIME SEGMENT) I
I 17.15-17.30
I
I B-C 0.75 9.59 0.078 0.1 0.1 1.2
I
I B-A 0.13 5.48 0.023 0.0 0.0 0.3
I
I C-AB 0.63 12.15 0.052 0.1 0.1 1.2
I
I C-A 3.75
I
I A-B 0.13
I
I A-C 2.27
I
I
I
-----------------------------------------------------------------------------------
--------------
.-----------------------------------------------------------------------------------
--------------
I TIME DEMAND CAPACITY DEMAND/ PEDESTRIAN START END DELAY
GEOMETRIC DELAYI
I (VEH/MIN) (VEH/MIN) CAPACITY FLOW QUEUE QUEUE (VEH.MIN/
(VEH.MIN/ I
I (RFC) (PEDS/MIN) (VEHS) (VEHS) TIME SEGMENT)
TIME SEGMENT) I
I 17.30-17.45
I
I B-C 0.75 9.59 0.078 0.1 0.1 1.3
I
I B-A 0.13 5.48 0.023 0.0 0.0 0.4
I
I C-AB 0.63 12.15 0.052 0.1 0.1 1.2
I
I C-A 3.75
I
I A-B 0.13
I
I A-C 2.27
I
I
I
-----------------------------------------------------------------------------------
--------------
.-----------------------------------------------------------------------------------
--------------
I TIME DEMAND CAPACITY DEMAND/ PEDESTRIAN START END DELAY
GEOMETRIC DELAYI
I (VEH/MIN) (VEH/MIN) CAPACITY FLOW QUEUE QUEUE (VEH.MIN/
(VEH.MIN/ I
I (RFC) (PEDS/MIN) (VEHS) (VEHS) TIME SEGMENT)
TIME SEGMENT) I
I 17.45-18.00
I
I B-C 0.61 9.71 0.063 0.1 0.1 1.0
I
For
insp
ectio
n pur
pose
s only
.
Conse
nt of
copy
right
owne
r req
uired
for a
ny ot
her u
se.
EPA Export 16-10-2012:23:24:01

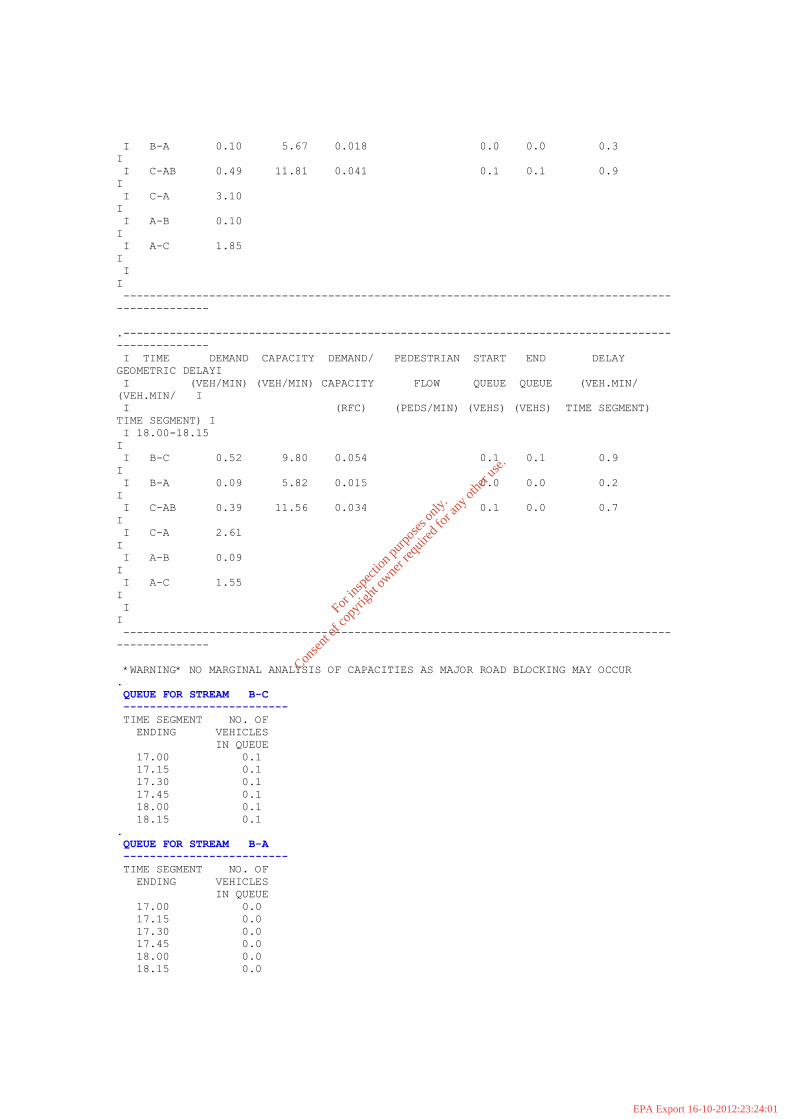
I B-A 0.10 5.68 0.018 0.0 0.0 0.3
I
I C-AB 0.49 11.81 0.041 0.1 0.1 0.9
I
I C-A 3.10
I
I A-B 0.10
I
I A-C 1.85
I
I
I
-----------------------------------------------------------------------------------
--------------
.-----------------------------------------------------------------------------------
--------------
I TIME DEMAND CAPACITY DEMAND/ PEDESTRIAN START END DELAY
GEOMETRIC DELAYI
I (VEH/MIN) (VEH/MIN) CAPACITY FLOW QUEUE QUEUE (VEH.MIN/
(VEH.MIN/ I
I (RFC) (PEDS/MIN) (VEHS) (VEHS) TIME SEGMENT)
TIME SEGMENT) I
I 18.00-18.15
I
I B-C 0.51 9.80 0.052 0.1 0.1 0.8
I
I B-A 0.09 5.83 0.015 0.0 0.0 0.2
I
I C-AB 0.39 11.56 0.034 0.1 0.0 0.7
I
I C-A 2.61
I
I A-B 0.09
I
I A-C 1.55
I
I
I
-----------------------------------------------------------------------------------
--------------
*WARNING* NO MARGINAL ANALYSIS OF CAPACITIES AS MAJOR ROAD BLOCKING MAY OCCUR
.
QUEUE FOR STREAM B-C
-------------------------
TIME SEGMENT NO. OF
ENDING VEHICLES
IN QUEUE
17.00 0.1
17.15 0.1
17.30 0.1
17.45 0.1
18.00 0.1
18.15 0.1
.
QUEUE FOR STREAM B-A
-------------------------
TIME SEGMENT NO. OF
ENDING VEHICLES
IN QUEUE
17.00 0.0
17.15 0.0
17.30 0.0
17.45 0.0
18.00 0.0
18.15 0.0
For
insp
ectio
n pur
pose
s only
.
Conse
nt of
copy
right
owne
r req
uired
for a
ny ot
her u
se.
EPA Export 16-10-2012:23:24:01
.
QUEUE FOR STREAM C-AB
-------------------------
TIME SEGMENT NO. OF
ENDING VEHICLES
IN QUEUE
17.00 0.0
17.15 0.1
17.30 0.1
17.45 0.1
18.00 0.1
18.15 0.0
.
QUEUEING DELAY INFORMATION OVER WHOLE PERIOD
--------------------------------------------
---------------------------------------------------------------------------
I STREAM I TOTAL DEMAND I * QUEUEING * I * INCLUSIVE QUEUEING * I
I I I * DELAY * I * DELAY * I
I I----------------------------------------------------------------I
I I (VEH) (VEH/H) I (MIN) (MIN/VEH) I (MIN) (MIN/VEH) I
---------------------------------------------------------------------------
I B-C I 56.2 I 37.5 I 6.2 I 0.11 I 6.2 I 0.11 I
I B-A I 9.6 I 6.4 I 1.7 I 0.18 I 1.7 I 0.18 I
I C-AB I 45.2 I 30.1 I 5.5 I 0.12 I 5.5 I 0.12 I
I C-A I 283.9 I 189.3 I I I I I
I A-B I 9.6 I 6.4 I I I I I
I A-C I 170.0 I 113.4 I I I I I
---------------------------------------------------------------------------
I ALL I 574.5 I 383.0 I 13.4 I 0.02 I 13.4 I 0.02 I
---------------------------------------------------------------------------
* DELAY IS THAT OCCURRING ONLY WITHIN THE TIME PERIOD .
* INCLUSIVE DELAY INCLUDES DELAY SUFFERED BY VEHICLES WHICH ARE STILL QUEUEING
AFTER THE END OF THE TIME PERIOD.
* THESE WILL ONLY BE SIGNIFICANTLY DIFFERENT IF THERE IS A LARGE QUEUE REMAINING AT
THE END OF THE TIME PERIOD.
END OF JOB
****** PICADY 4 run completed.
============================================= end of file
===============================================
For
insp
ectio
n pur
pose
s only
.
Conse
nt of
copy
right
owne
r req
uired
for a
ny ot
her u
se.
EPA Export 16-10-2012:23:24:01

TRL LIMITED
(C) COPYRIGHT 2001
CAPACITIES, QUEUES, AND DELAYS AT 3 OR 4-ARM MAJOR/MINOR PRIORITY JUNCTIONS
PICADY 4.1 ANALYSIS PROGRAM
RELEASE 4.0 (NOV 2003)
ADAPTED FROM PICADY/3 WHICH IS CROWN COPYRIGHT
BY PERMISSION OF THE CONTROLLER OF HMSO
--------------------------------------------------------
FOR SALES AND DISTRIBUTION INFORMATION,
PROGRAM ADVICE AND MAINTENANCE CONTACT:
TRL SOFTWARE BUREAU
TEL: CROWTHORNE (01344) 770758, FAX: 770864
EMAIL: [email protected]
--------------------------------------------------------
THE USER OF THIS COMPUTER PROGRAM FOR THE SOLUTION OF AN ENGINEERING PROBLEM IS
IN NO WAY RELIEVED OF HIS RESPONSIBILITY FOR THE CORRECTNESS OF THE SOLUTION
Run with file:-
"p:\02888 KMK Recycling Tullamore [Niall Nally, Enviroco]\05 Junction Analysis\01
Raw Analysis\
2015 Do Something.vpi"
(drive-on-the-left ) at 12:07:10 on Tuesday, 15 September 2009
RUN TITLE
*********
2015 Do Something
.MAJOR/MINOR JUNCTION CAPACITY AND DELAY
***************************************
INPUT DATA
----------
MAJOR ROAD (ARM C) --------------------- MAJOR ROAD (ARM A)
I
I
I
I
I
I
MINOR ROAD (ARM B)
ARM A IS Daingean Road
ARM B IS Cappincur Industriual Estate
ARM C IS Tullamore
STREAM LABELLING CONVENTION
---------------------------
STREAM A-B CONTAINS TRAFFIC GOING FROM ARM A TO ARM B
STREAM B-AC CONTAINS TRAFFIC GOING FROM ARM B TO ARM A AND TO ARM C
ETC.
For
insp
ectio
n pur
pose
s only
.
Conse
nt of
copy
right
owne
r req
uired
for a
ny ot
her u
se.
EPA Export 16-10-2012:23:24:01

.GEOMETRIC DATA
--------------
----------------------------------------------------------------
I DATA ITEM I MINOR ROAD B I
----------------------------------------------------------------
I TOTAL MAJOR ROAD CARRIAGEWAY WIDTH I ( W ) 6.00 M. I
I CENTRAL RESERVE WIDTH I (WCR ) 0.00 M. I
I I I
I MAJOR ROAD RIGHT TURN - WIDTH I (WC-B) 2.20 M. I
I - VISIBILITY I (VC-B) 180.0 M. I
I - BLOCKS TRAFFIC I YES I
I I I
I MINOR ROAD - VISIBILITY TO LEFT I (VB-C) 90.0 M. I
I - VISIBILITY TO RIGHT I (VB-A) 120.0 M. I
I - LANE 1 WIDTH I (WB-C) - I
I - LANE 2 WIDTH I (WB-A) - I
I - WIDTH AT 0 M FROM JUNC. I 4.40 M. I
I - WIDTH AT 5 M FROM JUNC. I 3.00 M. I
I - WIDTH AT 10 M FROM JUNC. I 2.20 M. I
I - WIDTH AT 15 M FROM JUNC. I 2.20 M. I
I - WIDTH AT 20 M FROM JUNC. I 2.20 M. I
I - LENGTH OF FLARED SECTION I 1 VEHS I
----------------------------------------------------------------
.
.TRAFFIC DEMAND DATA
-------------------
TIME PERIOD BEGINS 16.45 AND ENDS 18.15
LENGTH OF TIME PERIOD - 90 MINUTES.
LENGTH OF TIME SEGMENT - 15 MINUTES.
DEMAND FLOW PROFILES ARE SYNTHESISED FROM TURNING COUNT DATA
-----------------------------------------------------------------------------
I I NUMBER OF MINUTES FROM START WHEN I RATE OF FLOW (VEH/MIN) I
I ARM I FLOW STARTS I TOP OF PEAK I FLOW STOPS I BEFORE I AT TOP I AFTER I
I I TO RISE I IS REACHED I FALLING I PEAK I OF PEAK I PEAK I
-----------------------------------------------------------------------------
I ARM A I 15.00 I 45.00 I 75.00 I 1.64 I 2.46 I 1.64 I
I ARM B I 15.00 I 45.00 I 75.00 I 0.61 I 0.92 I 0.61 I
I ARM C I 15.00 I 45.00 I 75.00 I 3.00 I 4.50 I 3.00 I
-----------------------------------------------------------------------------
.
-----------------------------------------------------------
I I TURNING PROPORTIONS I
I I TURNING COUNTS (VEH/HR) I
I I (PERCENTAGE OF H.V.S) I
I --------------------------------------
I TIME I FROM/TO I ARM A I ARM B I ARM C I
-----------------------------------------------------------
I 16.45 - 18.15 I I I I I
I I ARM A I 0.000 I 0.053 I 0.947 I
I I I 0.0 I 7.0 I 124.0 I
I I I ( 0.0)I ( 10.0)I ( 10.0)I
I I I I I I
I I ARM B I 0.143 I 0.000 I 0.857 I
For
insp
ectio
n pur
pose
s only
.
Conse
nt of
copy
right
owne
r req
uired
for a
ny ot
her u
se.
EPA Export 16-10-2012:23:24:01
I I I 7.0 I 0.0 I 42.0 I
I I I ( 10.0)I ( 0.0)I ( 10.0)I
I I I I I I
I I ARM C I 0.900 I 0.100 I 0.000 I
I I I 216.0 I 24.0 I 0.0 I
I I I ( 10.0)I ( 10.0)I ( 0.0)I
I I I I I I
-----------------------------------------------------------
TURNING PROPORTIONS ARE CALCULATED FROM TURNING COUNT DATA
DEFAULT PROPORTIONS OF HEAVY VEHICLES ARE USED
.-----------------------------------------------------------------------------------
--------------
I TIME DEMAND CAPACITY DEMAND/ PEDESTRIAN START END DELAY
GEOMETRIC DELAYI
I (VEH/MIN) (VEH/MIN) CAPACITY FLOW QUEUE QUEUE (VEH.MIN/
(VEH.MIN/ I
I (RFC) (PEDS/MIN) (VEHS) (VEHS) TIME SEGMENT)
TIME SEGMENT) I
I 16.45-17.00
I
I B-C 0.52 9.80 0.054 0.0 0.1 0.8
I
I B-A 0.09 5.82 0.015 0.0 0.0 0.2
I
I C-AB 0.39 11.56 0.033 0.0 0.0 0.7
I
I C-A 2.61
I
I A-B 0.09
I
I A-C 1.55
I
I
I
-----------------------------------------------------------------------------------
--------------
.-----------------------------------------------------------------------------------
--------------
I TIME DEMAND CAPACITY DEMAND/ PEDESTRIAN START END DELAY
GEOMETRIC DELAYI
I (VEH/MIN) (VEH/MIN) CAPACITY FLOW QUEUE QUEUE (VEH.MIN/
(VEH.MIN/ I
I (RFC) (PEDS/MIN) (VEHS) (VEHS) TIME SEGMENT)
TIME SEGMENT) I
I 17.00-17.15
I
I B-C 0.63 9.71 0.065 0.1 0.1 1.0
I
I B-A 0.10 5.67 0.018 0.0 0.0 0.3
I
I C-AB 0.49 11.81 0.041 0.0 0.1 0.9
I
I C-A 3.10
I
I A-B 0.10
I
I A-C 1.85
I
I
I
-----------------------------------------------------------------------------------
--------------
For
insp
ectio
n pur
pose
s only
.
Conse
nt of
copy
right
owne
r req
uired
for a
ny ot
her u
se.
EPA Export 16-10-2012:23:24:01

.-----------------------------------------------------------------------------------
--------------
I TIME DEMAND CAPACITY DEMAND/ PEDESTRIAN START END DELAY
GEOMETRIC DELAYI
I (VEH/MIN) (VEH/MIN) CAPACITY FLOW QUEUE QUEUE (VEH.MIN/
(VEH.MIN/ I
I (RFC) (PEDS/MIN) (VEHS) (VEHS) TIME SEGMENT)
TIME SEGMENT) I
I 17.15-17.30
I
I B-C 0.77 9.59 0.080 0.1 0.1 1.3
I
I B-A 0.13 5.47 0.023 0.0 0.0 0.3
I
I C-AB 0.63 12.15 0.052 0.1 0.1 1.2
I
I C-A 3.75
I
I A-B 0.13
I
I A-C 2.27
I
I
I
-----------------------------------------------------------------------------------
--------------
.-----------------------------------------------------------------------------------
--------------
I TIME DEMAND CAPACITY DEMAND/ PEDESTRIAN START END DELAY
GEOMETRIC DELAYI
I (VEH/MIN) (VEH/MIN) CAPACITY FLOW QUEUE QUEUE (VEH.MIN/
(VEH.MIN/ I
I (RFC) (PEDS/MIN) (VEHS) (VEHS) TIME SEGMENT)
TIME SEGMENT) I
I 17.30-17.45
I
I B-C 0.77 9.59 0.080 0.1 0.1 1.3
I
I B-A 0.13 5.47 0.023 0.0 0.0 0.4
I
I C-AB 0.63 12.15 0.052 0.1 0.1 1.2
I
I C-A 3.75
I
I A-B 0.13
I
I A-C 2.27
I
I
I
-----------------------------------------------------------------------------------
--------------
.-----------------------------------------------------------------------------------
--------------
I TIME DEMAND CAPACITY DEMAND/ PEDESTRIAN START END DELAY
GEOMETRIC DELAYI
I (VEH/MIN) (VEH/MIN) CAPACITY FLOW QUEUE QUEUE (VEH.MIN/
(VEH.MIN/ I
I (RFC) (PEDS/MIN) (VEHS) (VEHS) TIME SEGMENT)
TIME SEGMENT) I
I 17.45-18.00
I
I B-C 0.63 9.71 0.065 0.1 0.1 1.1
I
For
insp
ectio
n pur
pose
s only
.
Conse
nt of
copy
right
owne
r req
uired
for a
ny ot
her u
se.
EPA Export 16-10-2012:23:24:01
I B-A 0.10 5.67 0.018 0.0 0.0 0.3
I
I C-AB 0.49 11.81 0.041 0.1 0.1 0.9
I
I C-A 3.10
I
I A-B 0.10
I
I A-C 1.85
I
I
I
-----------------------------------------------------------------------------------
--------------
.-----------------------------------------------------------------------------------
--------------
I TIME DEMAND CAPACITY DEMAND/ PEDESTRIAN START END DELAY
GEOMETRIC DELAYI
I (VEH/MIN) (VEH/MIN) CAPACITY FLOW QUEUE QUEUE (VEH.MIN/
(VEH.MIN/ I
I (RFC) (PEDS/MIN) (VEHS) (VEHS) TIME SEGMENT)
TIME SEGMENT) I
I 18.00-18.15
I
I B-C 0.52 9.80 0.054 0.1 0.1 0.9
I
I B-A 0.09 5.82 0.015 0.0 0.0 0.2
I
I C-AB 0.39 11.56 0.034 0.1 0.0 0.7
I
I C-A 2.61
I
I A-B 0.09
I
I A-C 1.55
I
I
I
-----------------------------------------------------------------------------------
--------------
*WARNING* NO MARGINAL ANALYSIS OF CAPACITIES AS MAJOR ROAD BLOCKING MAY OCCUR
.
QUEUE FOR STREAM B-C
-------------------------
TIME SEGMENT NO. OF
ENDING VEHICLES
IN QUEUE
17.00 0.1
17.15 0.1
17.30 0.1
17.45 0.1
18.00 0.1
18.15 0.1
.
QUEUE FOR STREAM B-A
-------------------------
TIME SEGMENT NO. OF
ENDING VEHICLES
IN QUEUE
17.00 0.0
17.15 0.0
17.30 0.0
17.45 0.0
18.00 0.0
18.15 0.0
For
insp
ectio
n pur
pose
s only
.
Conse
nt of
copy
right
owne
r req
uired
for a
ny ot
her u
se.
EPA Export 16-10-2012:23:24:01
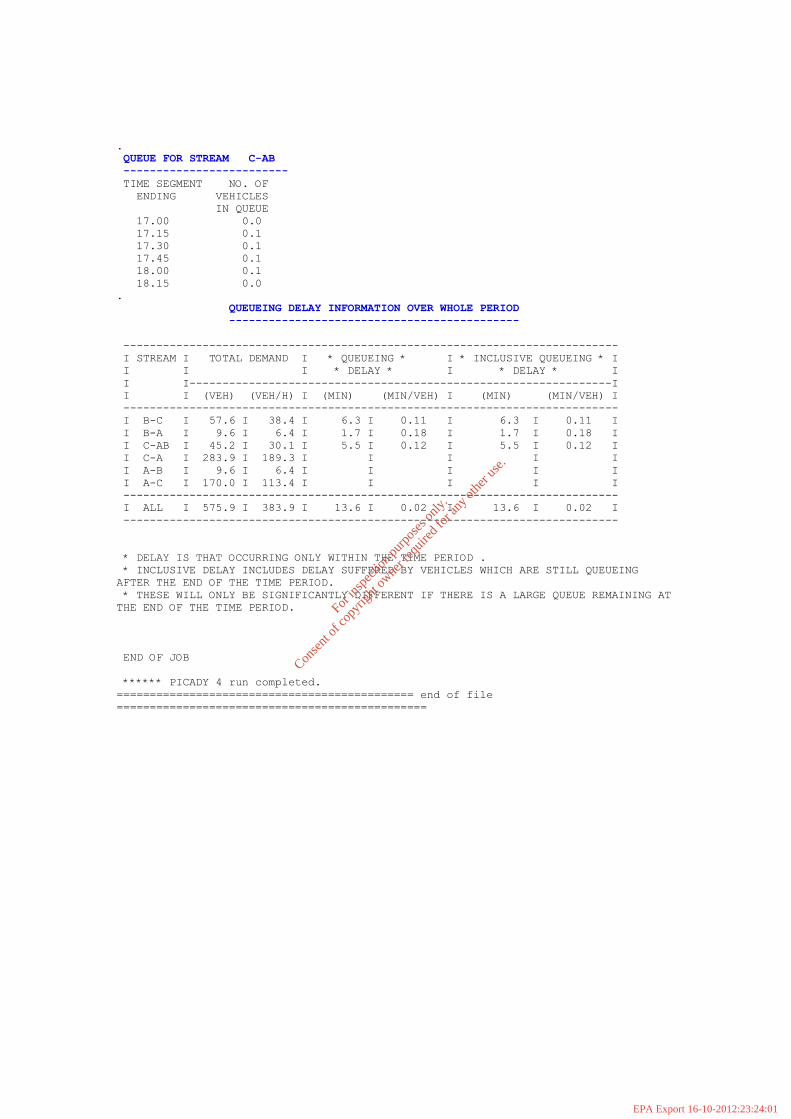
.
QUEUE FOR STREAM C-AB
-------------------------
TIME SEGMENT NO. OF
ENDING VEHICLES
IN QUEUE
17.00 0.0
17.15 0.1
17.30 0.1
17.45 0.1
18.00 0.1
18.15 0.0
.
QUEUEING DELAY INFORMATION OVER WHOLE PERIOD
--------------------------------------------
---------------------------------------------------------------------------
I STREAM I TOTAL DEMAND I * QUEUEING * I * INCLUSIVE QUEUEING * I
I I I * DELAY * I * DELAY * I
I I----------------------------------------------------------------I
I I (VEH) (VEH/H) I (MIN) (MIN/VEH) I (MIN) (MIN/VEH) I
---------------------------------------------------------------------------
I B-C I 57.6 I 38.4 I 6.3 I 0.11 I 6.3 I 0.11 I
I B-A I 9.6 I 6.4 I 1.7 I 0.18 I 1.7 I 0.18 I
I C-AB I 45.2 I 30.1 I 5.5 I 0.12 I 5.5 I 0.12 I
I C-A I 283.9 I 189.3 I I I I I
I A-B I 9.6 I 6.4 I I I I I
I A-C I 170.0 I 113.4 I I I I I
---------------------------------------------------------------------------
I ALL I 575.9 I 383.9 I 13.6 I 0.02 I 13.6 I 0.02 I
---------------------------------------------------------------------------
* DELAY IS THAT OCCURRING ONLY WITHIN THE TIME PERIOD .
* INCLUSIVE DELAY INCLUDES DELAY SUFFERED BY VEHICLES WHICH ARE STILL QUEUEING
AFTER THE END OF THE TIME PERIOD.
* THESE WILL ONLY BE SIGNIFICANTLY DIFFERENT IF THERE IS A LARGE QUEUE REMAINING AT
THE END OF THE TIME PERIOD.
END OF JOB
****** PICADY 4 run completed.
============================================= end of file
===============================================
For
insp
ectio
n pur
pose
s only
.
Conse
nt of
copy
right
owne
r req
uired
for a
ny ot
her u
se.
EPA Export 16-10-2012:23:24:01

TRL LIMITED
(C) COPYRIGHT 2001
CAPACITIES, QUEUES, AND DELAYS AT 3 OR 4-ARM MAJOR/MINOR PRIORITY JUNCTIONS
PICADY 4.1 ANALYSIS PROGRAM
RELEASE 4.0 (NOV 2003)
ADAPTED FROM PICADY/3 WHICH IS CROWN COPYRIGHT
BY PERMISSION OF THE CONTROLLER OF HMSO
--------------------------------------------------------
FOR SALES AND DISTRIBUTION INFORMATION,
PROGRAM ADVICE AND MAINTENANCE CONTACT:
TRL SOFTWARE BUREAU
TEL: CROWTHORNE (01344) 770758, FAX: 770864
EMAIL: [email protected]
--------------------------------------------------------
THE USER OF THIS COMPUTER PROGRAM FOR THE SOLUTION OF AN ENGINEERING PROBLEM IS
IN NO WAY RELIEVED OF HIS RESPONSIBILITY FOR THE CORRECTNESS OF THE SOLUTION
Run with file:-
"p:\02888 KMK Recycling Tullamore [Niall Nally, Enviroco]\05 Junction Analysis\01
Raw Analysis\
2025 Do Nothing.vpi"
(drive-on-the-left ) at 12:07:59 on Tuesday, 15 September 2009
RUN TITLE
*********
2025 Do Nothing
.MAJOR/MINOR JUNCTION CAPACITY AND DELAY
***************************************
INPUT DATA
----------
MAJOR ROAD (ARM C) --------------------- MAJOR ROAD (ARM A)
I
I
I
I
I
I
MINOR ROAD (ARM B)
ARM A IS Daingean Road
ARM B IS Cappincur Industriual Estate
ARM C IS Tullamore
STREAM LABELLING CONVENTION
---------------------------
STREAM A-B CONTAINS TRAFFIC GOING FROM ARM A TO ARM B
STREAM B-AC CONTAINS TRAFFIC GOING FROM ARM B TO ARM A AND TO ARM C
ETC.
For
insp
ectio
n pur
pose
s only
.
Conse
nt of
copy
right
owne
r req
uired
for a
ny ot
her u
se.
EPA Export 16-10-2012:23:24:02
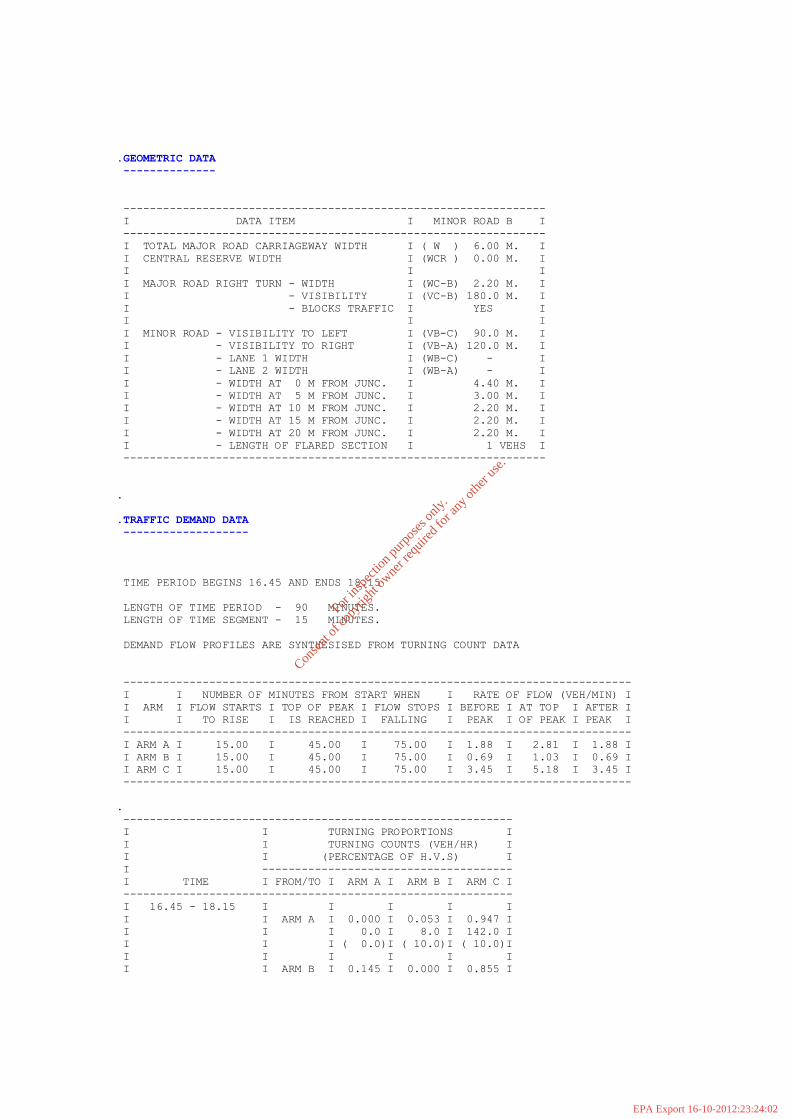
.GEOMETRIC DATA
--------------
----------------------------------------------------------------
I DATA ITEM I MINOR ROAD B I
----------------------------------------------------------------
I TOTAL MAJOR ROAD CARRIAGEWAY WIDTH I ( W ) 6.00 M. I
I CENTRAL RESERVE WIDTH I (WCR ) 0.00 M. I
I I I
I MAJOR ROAD RIGHT TURN - WIDTH I (WC-B) 2.20 M. I
I - VISIBILITY I (VC-B) 180.0 M. I
I - BLOCKS TRAFFIC I YES I
I I I
I MINOR ROAD - VISIBILITY TO LEFT I (VB-C) 90.0 M. I
I - VISIBILITY TO RIGHT I (VB-A) 120.0 M. I
I - LANE 1 WIDTH I (WB-C) - I
I - LANE 2 WIDTH I (WB-A) - I
I - WIDTH AT 0 M FROM JUNC. I 4.40 M. I
I - WIDTH AT 5 M FROM JUNC. I 3.00 M. I
I - WIDTH AT 10 M FROM JUNC. I 2.20 M. I
I - WIDTH AT 15 M FROM JUNC. I 2.20 M. I
I - WIDTH AT 20 M FROM JUNC. I 2.20 M. I
I - LENGTH OF FLARED SECTION I 1 VEHS I
----------------------------------------------------------------
.
.TRAFFIC DEMAND DATA
-------------------
TIME PERIOD BEGINS 16.45 AND ENDS 18.15
LENGTH OF TIME PERIOD - 90 MINUTES.
LENGTH OF TIME SEGMENT - 15 MINUTES.
DEMAND FLOW PROFILES ARE SYNTHESISED FROM TURNING COUNT DATA
-----------------------------------------------------------------------------
I I NUMBER OF MINUTES FROM START WHEN I RATE OF FLOW (VEH/MIN) I
I ARM I FLOW STARTS I TOP OF PEAK I FLOW STOPS I BEFORE I AT TOP I AFTER I
I I TO RISE I IS REACHED I FALLING I PEAK I OF PEAK I PEAK I
-----------------------------------------------------------------------------
I ARM A I 15.00 I 45.00 I 75.00 I 1.88 I 2.81 I 1.88 I
I ARM B I 15.00 I 45.00 I 75.00 I 0.69 I 1.03 I 0.69 I
I ARM C I 15.00 I 45.00 I 75.00 I 3.45 I 5.18 I 3.45 I
-----------------------------------------------------------------------------
.
-----------------------------------------------------------
I I TURNING PROPORTIONS I
I I TURNING COUNTS (VEH/HR) I
I I (PERCENTAGE OF H.V.S) I
I --------------------------------------
I TIME I FROM/TO I ARM A I ARM B I ARM C I
-----------------------------------------------------------
I 16.45 - 18.15 I I I I I
I I ARM A I 0.000 I 0.053 I 0.947 I
I I I 0.0 I 8.0 I 142.0 I
I I I ( 0.0)I ( 10.0)I ( 10.0)I
I I I I I I
I I ARM B I 0.145 I 0.000 I 0.855 I
For
insp
ectio
n pur
pose
s only
.
Conse
nt of
copy
right
owne
r req
uired
for a
ny ot
her u
se.
EPA Export 16-10-2012:23:24:02

I I I 8.0 I 0.0 I 47.0 I
I I I ( 10.0)I ( 0.0)I ( 10.0)I
I I I I I I
I I ARM C I 0.902 I 0.098 I 0.000 I
I I I 249.0 I 27.0 I 0.0 I
I I I ( 10.0)I ( 10.0)I ( 0.0)I
I I I I I I
-----------------------------------------------------------
TURNING PROPORTIONS ARE CALCULATED FROM TURNING COUNT DATA
DEFAULT PROPORTIONS OF HEAVY VEHICLES ARE USED
.-----------------------------------------------------------------------------------
--------------
I TIME DEMAND CAPACITY DEMAND/ PEDESTRIAN START END DELAY
GEOMETRIC DELAYI
I (VEH/MIN) (VEH/MIN) CAPACITY FLOW QUEUE QUEUE (VEH.MIN/
(VEH.MIN/ I
I (RFC) (PEDS/MIN) (VEHS) (VEHS) TIME SEGMENT)
TIME SEGMENT) I
I 16.45-17.00
I
I B-C 0.59 9.73 0.060 0.0 0.1 0.9
I
I B-A 0.10 5.72 0.017 0.0 0.0 0.3
I
I C-AB 0.45 11.76 0.038 0.0 0.1 0.8
I
I C-A 3.00
I
I A-B 0.10
I
I A-C 1.77
I
I
I
-----------------------------------------------------------------------------------
--------------
.-----------------------------------------------------------------------------------
--------------
I TIME DEMAND CAPACITY DEMAND/ PEDESTRIAN START END DELAY
GEOMETRIC DELAYI
I (VEH/MIN) (VEH/MIN) CAPACITY FLOW QUEUE QUEUE (VEH.MIN/
(VEH.MIN/ I
I (RFC) (PEDS/MIN) (VEHS) (VEHS) TIME SEGMENT)
TIME SEGMENT) I
I 17.00-17.15
I
I B-C 0.70 9.63 0.073 0.1 0.1 1.1
I
I B-A 0.12 5.55 0.022 0.0 0.0 0.3
I
I C-AB 0.57 12.05 0.047 0.1 0.1 1.1
I
I C-A 3.55
I
I A-B 0.12
I
I A-C 2.12
I
I
I
-----------------------------------------------------------------------------------
--------------
For
insp
ectio
n pur
pose
s only
.
Conse
nt of
copy
right
owne
r req
uired
for a
ny ot
her u
se.
EPA Export 16-10-2012:23:24:02

.-----------------------------------------------------------------------------------
--------------
I TIME DEMAND CAPACITY DEMAND/ PEDESTRIAN START END DELAY
GEOMETRIC DELAYI
I (VEH/MIN) (VEH/MIN) CAPACITY FLOW QUEUE QUEUE (VEH.MIN/
(VEH.MIN/ I
I (RFC) (PEDS/MIN) (VEHS) (VEHS) TIME SEGMENT)
TIME SEGMENT) I
I 17.15-17.30
I
I B-C 0.86 9.49 0.091 0.1 0.1 1.5
I
I B-A 0.15 5.32 0.027 0.0 0.0 0.4
I
I C-AB 0.75 12.44 0.060 0.1 0.1 1.5
I
I C-A 4.29
I
I A-B 0.15
I
I A-C 2.60
I
I
I
-----------------------------------------------------------------------------------
--------------
.-----------------------------------------------------------------------------------
--------------
I TIME DEMAND CAPACITY DEMAND/ PEDESTRIAN START END DELAY
GEOMETRIC DELAYI
I (VEH/MIN) (VEH/MIN) CAPACITY FLOW QUEUE QUEUE (VEH.MIN/
(VEH.MIN/ I
I (RFC) (PEDS/MIN) (VEHS) (VEHS) TIME SEGMENT)
TIME SEGMENT) I
I 17.30-17.45
I
I B-C 0.86 9.49 0.091 0.1 0.1 1.5
I
I B-A 0.15 5.32 0.027 0.0 0.0 0.4
I
I C-AB 0.75 12.44 0.060 0.1 0.1 1.5
I
I C-A 4.29
I
I A-B 0.15
I
I A-C 2.60
I
I
I
-----------------------------------------------------------------------------------
--------------
.-----------------------------------------------------------------------------------
--------------
I TIME DEMAND CAPACITY DEMAND/ PEDESTRIAN START END DELAY
GEOMETRIC DELAYI
I (VEH/MIN) (VEH/MIN) CAPACITY FLOW QUEUE QUEUE (VEH.MIN/
(VEH.MIN/ I
I (RFC) (PEDS/MIN) (VEHS) (VEHS) TIME SEGMENT)
TIME SEGMENT) I
I 17.45-18.00
I
I B-C 0.70 9.63 0.073 0.1 0.1 1.2
I
For
insp
ectio
n pur
pose
s only
.
Conse
nt of
copy
right
owne
r req
uired
for a
ny ot
her u
se.
EPA Export 16-10-2012:23:24:02

I B-A 0.12 5.55 0.022 0.0 0.0 0.3
I
I C-AB 0.57 12.05 0.047 0.1 0.1 1.1
I
I C-A 3.55
I
I A-B 0.12
I
I A-C 2.12
I
I
I
-----------------------------------------------------------------------------------
--------------
.-----------------------------------------------------------------------------------
--------------
I TIME DEMAND CAPACITY DEMAND/ PEDESTRIAN START END DELAY
GEOMETRIC DELAYI
I (VEH/MIN) (VEH/MIN) CAPACITY FLOW QUEUE QUEUE (VEH.MIN/
(VEH.MIN/ I
I (RFC) (PEDS/MIN) (VEHS) (VEHS) TIME SEGMENT)
TIME SEGMENT) I
I 18.00-18.15
I
I B-C 0.59 9.73 0.060 0.1 0.1 1.0
I
I B-A 0.10 5.72 0.017 0.0 0.0 0.3
I
I C-AB 0.45 11.76 0.039 0.1 0.1 0.8
I
I C-A 3.00
I
I A-B 0.10
I
I A-C 1.77
I
I
I
-----------------------------------------------------------------------------------
--------------
*WARNING* NO MARGINAL ANALYSIS OF CAPACITIES AS MAJOR ROAD BLOCKING MAY OCCUR
.
QUEUE FOR STREAM B-C
-------------------------
TIME SEGMENT NO. OF
ENDING VEHICLES
IN QUEUE
17.00 0.1
17.15 0.1
17.30 0.1
17.45 0.1
18.00 0.1
18.15 0.1
.
QUEUE FOR STREAM B-A
-------------------------
TIME SEGMENT NO. OF
ENDING VEHICLES
IN QUEUE
17.00 0.0
17.15 0.0
17.30 0.0
17.45 0.0
18.00 0.0
18.15 0.0
For
insp
ectio
n pur
pose
s only
.
Conse
nt of
copy
right
owne
r req
uired
for a
ny ot
her u
se.
EPA Export 16-10-2012:23:24:02

.
QUEUE FOR STREAM C-AB
-------------------------
TIME SEGMENT NO. OF
ENDING VEHICLES
IN QUEUE
17.00 0.1
17.15 0.1
17.30 0.1
17.45 0.1
18.00 0.1
18.15 0.1
.
QUEUEING DELAY INFORMATION OVER WHOLE PERIOD
--------------------------------------------
---------------------------------------------------------------------------
I STREAM I TOTAL DEMAND I * QUEUEING * I * INCLUSIVE QUEUEING * I
I I I * DELAY * I * DELAY * I
I I----------------------------------------------------------------I
I I (VEH) (VEH/H) I (MIN) (MIN/VEH) I (MIN) (MIN/VEH) I
---------------------------------------------------------------------------
I B-C I 64.4 I 43.0 I 7.2 I 0.11 I 7.2 I 0.11 I
I B-A I 11.0 I 7.3 I 2.0 I 0.18 I 2.0 I 0.18 I
I C-AB I 53.3 I 35.5 I 6.7 I 0.13 I 6.7 I 0.13 I
I C-A I 325.2 I 216.8 I I I I I
I A-B I 11.0 I 7.3 I I I I I
I A-C I 194.7 I 129.8 I I I I I
---------------------------------------------------------------------------
I ALL I 659.6 I 439.7 I 15.9 I 0.02 I 15.9 I 0.02 I
---------------------------------------------------------------------------
* DELAY IS THAT OCCURRING ONLY WITHIN THE TIME PERIOD .
* INCLUSIVE DELAY INCLUDES DELAY SUFFERED BY VEHICLES WHICH ARE STILL QUEUEING
AFTER THE END OF THE TIME PERIOD.
* THESE WILL ONLY BE SIGNIFICANTLY DIFFERENT IF THERE IS A LARGE QUEUE REMAINING AT
THE END OF THE TIME PERIOD.
END OF JOB
****** PICADY 4 run completed.
============================================= end of file
===============================================
For
insp
ectio
n pur
pose
s only
.
Conse
nt of
copy
right
owne
r req
uired
for a
ny ot
her u
se.
EPA Export 16-10-2012:23:24:02

TRL LIMITED
(C) COPYRIGHT 2001
CAPACITIES, QUEUES, AND DELAYS AT 3 OR 4-ARM MAJOR/MINOR PRIORITY JUNCTIONS
PICADY 4.1 ANALYSIS PROGRAM
RELEASE 4.0 (NOV 2003)
ADAPTED FROM PICADY/3 WHICH IS CROWN COPYRIGHT
BY PERMISSION OF THE CONTROLLER OF HMSO
--------------------------------------------------------
FOR SALES AND DISTRIBUTION INFORMATION,
PROGRAM ADVICE AND MAINTENANCE CONTACT:
TRL SOFTWARE BUREAU
TEL: CROWTHORNE (01344) 770758, FAX: 770864
EMAIL: [email protected]
--------------------------------------------------------
THE USER OF THIS COMPUTER PROGRAM FOR THE SOLUTION OF AN ENGINEERING PROBLEM IS
IN NO WAY RELIEVED OF HIS RESPONSIBILITY FOR THE CORRECTNESS OF THE SOLUTION
Run with file:-
"p:\02888 KMK Recycling Tullamore [Niall Nally, Enviroco]\05 Junction Analysis\01
Raw Analysis\
2025 Do Something.vpi"
(drive-on-the-left ) at 12:08:45 on Tuesday, 15 September 2009
RUN TITLE
*********
2025 Do Something
.MAJOR/MINOR JUNCTION CAPACITY AND DELAY
***************************************
INPUT DATA
----------
MAJOR ROAD (ARM C) --------------------- MAJOR ROAD (ARM A)
I
I
I
I
I
I
MINOR ROAD (ARM B)
ARM A IS Daingean Road
ARM B IS Cappincur Industriual Estate
ARM C IS Tullamore
STREAM LABELLING CONVENTION
---------------------------
STREAM A-B CONTAINS TRAFFIC GOING FROM ARM A TO ARM B
STREAM B-AC CONTAINS TRAFFIC GOING FROM ARM B TO ARM A AND TO ARM C
ETC.
For
insp
ectio
n pur
pose
s only
.
Conse
nt of
copy
right
owne
r req
uired
for a
ny ot
her u
se.
EPA Export 16-10-2012:23:24:02

.GEOMETRIC DATA
--------------
----------------------------------------------------------------
I DATA ITEM I MINOR ROAD B I
----------------------------------------------------------------
I TOTAL MAJOR ROAD CARRIAGEWAY WIDTH I ( W ) 6.00 M. I
I CENTRAL RESERVE WIDTH I (WCR ) 0.00 M. I
I I I
I MAJOR ROAD RIGHT TURN - WIDTH I (WC-B) 2.20 M. I
I - VISIBILITY I (VC-B) 180.0 M. I
I - BLOCKS TRAFFIC I YES I
I I I
I MINOR ROAD - VISIBILITY TO LEFT I (VB-C) 90.0 M. I
I - VISIBILITY TO RIGHT I (VB-A) 120.0 M. I
I - LANE 1 WIDTH I (WB-C) - I
I - LANE 2 WIDTH I (WB-A) - I
I - WIDTH AT 0 M FROM JUNC. I 4.40 M. I
I - WIDTH AT 5 M FROM JUNC. I 3.00 M. I
I - WIDTH AT 10 M FROM JUNC. I 2.20 M. I
I - WIDTH AT 15 M FROM JUNC. I 2.20 M. I
I - WIDTH AT 20 M FROM JUNC. I 2.20 M. I
I - LENGTH OF FLARED SECTION I 1 VEHS I
----------------------------------------------------------------
.
.TRAFFIC DEMAND DATA
-------------------
TIME PERIOD BEGINS 16.45 AND ENDS 18.15
LENGTH OF TIME PERIOD - 90 MINUTES.
LENGTH OF TIME SEGMENT - 15 MINUTES.
DEMAND FLOW PROFILES ARE SYNTHESISED FROM TURNING COUNT DATA
-----------------------------------------------------------------------------
I I NUMBER OF MINUTES FROM START WHEN I RATE OF FLOW (VEH/MIN) I
I ARM I FLOW STARTS I TOP OF PEAK I FLOW STOPS I BEFORE I AT TOP I AFTER I
I I TO RISE I IS REACHED I FALLING I PEAK I OF PEAK I PEAK I
-----------------------------------------------------------------------------
I ARM A I 15.00 I 45.00 I 75.00 I 1.88 I 2.81 I 1.88 I
I ARM B I 15.00 I 45.00 I 75.00 I 0.70 I 1.05 I 0.70 I
I ARM C I 15.00 I 45.00 I 75.00 I 3.45 I 5.18 I 3.45 I
-----------------------------------------------------------------------------
.
-----------------------------------------------------------
I I TURNING PROPORTIONS I
I I TURNING COUNTS (VEH/HR) I
I I (PERCENTAGE OF H.V.S) I
I --------------------------------------
I TIME I FROM/TO I ARM A I ARM B I ARM C I
-----------------------------------------------------------
I 16.45 - 18.15 I I I I I
I I ARM A I 0.000 I 0.053 I 0.947 I
I I I 0.0 I 8.0 I 142.0 I
I I I ( 0.0)I ( 10.0)I ( 10.0)I
I I I I I I
I I ARM B I 0.143 I 0.000 I 0.857 I
For
insp
ectio
n pur
pose
s only
.
Conse
nt of
copy
right
owne
r req
uired
for a
ny ot
her u
se.
EPA Export 16-10-2012:23:24:02
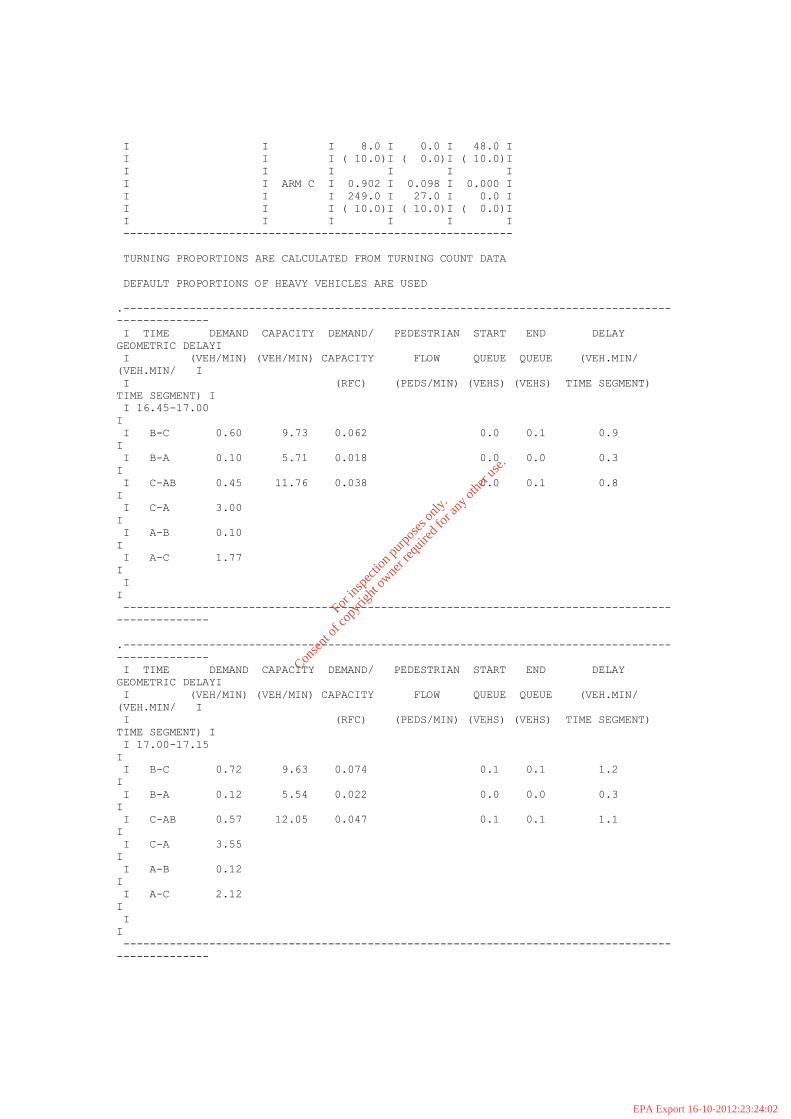
I I I 8.0 I 0.0 I 48.0 I
I I I ( 10.0)I ( 0.0)I ( 10.0)I
I I I I I I
I I ARM C I 0.902 I 0.098 I 0.000 I
I I I 249.0 I 27.0 I 0.0 I
I I I ( 10.0)I ( 10.0)I ( 0.0)I
I I I I I I
-----------------------------------------------------------
TURNING PROPORTIONS ARE CALCULATED FROM TURNING COUNT DATA
DEFAULT PROPORTIONS OF HEAVY VEHICLES ARE USED
.-----------------------------------------------------------------------------------
--------------
I TIME DEMAND CAPACITY DEMAND/ PEDESTRIAN START END DELAY
GEOMETRIC DELAYI
I (VEH/MIN) (VEH/MIN) CAPACITY FLOW QUEUE QUEUE (VEH.MIN/
(VEH.MIN/ I
I (RFC) (PEDS/MIN) (VEHS) (VEHS) TIME SEGMENT)
TIME SEGMENT) I
I 16.45-17.00
I
I B-C 0.60 9.73 0.062 0.0 0.1 0.9
I
I B-A 0.10 5.71 0.018 0.0 0.0 0.3
I
I C-AB 0.45 11.76 0.038 0.0 0.1 0.8
I
I C-A 3.00
I
I A-B 0.10
I
I A-C 1.77
I
I
I
-----------------------------------------------------------------------------------
--------------
.-----------------------------------------------------------------------------------
--------------
I TIME DEMAND CAPACITY DEMAND/ PEDESTRIAN START END DELAY
GEOMETRIC DELAYI
I (VEH/MIN) (VEH/MIN) CAPACITY FLOW QUEUE QUEUE (VEH.MIN/
(VEH.MIN/ I
I (RFC) (PEDS/MIN) (VEHS) (VEHS) TIME SEGMENT)
TIME SEGMENT) I
I 17.00-17.15
I
I B-C 0.72 9.63 0.074 0.1 0.1 1.2
I
I B-A 0.12 5.54 0.022 0.0 0.0 0.3
I
I C-AB 0.57 12.05 0.047 0.1 0.1 1.1
I
I C-A 3.55
I
I A-B 0.12
I
I A-C 2.12
I
I
I
-----------------------------------------------------------------------------------
--------------
For
insp
ectio
n pur
pose
s only
.
Conse
nt of
copy
right
owne
r req
uired
for a
ny ot
her u
se.
EPA Export 16-10-2012:23:24:02

.-----------------------------------------------------------------------------------
--------------
I TIME DEMAND CAPACITY DEMAND/ PEDESTRIAN START END DELAY
GEOMETRIC DELAYI
I (VEH/MIN) (VEH/MIN) CAPACITY FLOW QUEUE QUEUE (VEH.MIN/
(VEH.MIN/ I
I (RFC) (PEDS/MIN) (VEHS) (VEHS) TIME SEGMENT)
TIME SEGMENT) I
I 17.15-17.30
I
I B-C 0.88 9.49 0.092 0.1 0.1 1.5
I
I B-A 0.15 5.31 0.028 0.0 0.0 0.4
I
I C-AB 0.75 12.44 0.060 0.1 0.1 1.5
I
I C-A 4.29
I
I A-B 0.15
I
I A-C 2.60
I
I
I
-----------------------------------------------------------------------------------
--------------
.-----------------------------------------------------------------------------------
--------------
I TIME DEMAND CAPACITY DEMAND/ PEDESTRIAN START END DELAY
GEOMETRIC DELAYI
I (VEH/MIN) (VEH/MIN) CAPACITY FLOW QUEUE QUEUE (VEH.MIN/
(VEH.MIN/ I
I (RFC) (PEDS/MIN) (VEHS) (VEHS) TIME SEGMENT)
TIME SEGMENT) I
I 17.30-17.45
I
I B-C 0.88 9.49 0.092 0.1 0.1 1.5
I
I B-A 0.15 5.31 0.028 0.0 0.0 0.4
I
I C-AB 0.75 12.44 0.060 0.1 0.1 1.5
I
I C-A 4.29
I
I A-B 0.15
I
I A-C 2.60
I
I
I
-----------------------------------------------------------------------------------
--------------
.-----------------------------------------------------------------------------------
--------------
I TIME DEMAND CAPACITY DEMAND/ PEDESTRIAN START END DELAY
GEOMETRIC DELAYI
I (VEH/MIN) (VEH/MIN) CAPACITY FLOW QUEUE QUEUE (VEH.MIN/
(VEH.MIN/ I
I (RFC) (PEDS/MIN) (VEHS) (VEHS) TIME SEGMENT)
TIME SEGMENT) I
I 17.45-18.00
I
I B-C 0.72 9.63 0.074 0.1 0.1 1.2
I
For
insp
ectio
n pur
pose
s only
.
Conse
nt of
copy
right
owne
r req
uired
for a
ny ot
her u
se.
EPA Export 16-10-2012:23:24:02

I B-A 0.12 5.54 0.022 0.0 0.0 0.3
I
I C-AB 0.57 12.05 0.047 0.1 0.1 1.1
I
I C-A 3.55
I
I A-B 0.12
I
I A-C 2.12
I
I
I
-----------------------------------------------------------------------------------
--------------
.-----------------------------------------------------------------------------------
--------------
I TIME DEMAND CAPACITY DEMAND/ PEDESTRIAN START END DELAY
GEOMETRIC DELAYI
I (VEH/MIN) (VEH/MIN) CAPACITY FLOW QUEUE QUEUE (VEH.MIN/
(VEH.MIN/ I
I (RFC) (PEDS/MIN) (VEHS) (VEHS) TIME SEGMENT)
TIME SEGMENT) I
I 18.00-18.15
I
I B-C 0.60 9.73 0.062 0.1 0.1 1.0
I
I B-A 0.10 5.71 0.018 0.0 0.0 0.3
I
I C-AB 0.45 11.76 0.039 0.1 0.1 0.8
I
I C-A 3.00
I
I A-B 0.10
I
I A-C 1.77
I
I
I
-----------------------------------------------------------------------------------
--------------
*WARNING* NO MARGINAL ANALYSIS OF CAPACITIES AS MAJOR ROAD BLOCKING MAY OCCUR
.
QUEUE FOR STREAM B-C
-------------------------
TIME SEGMENT NO. OF
ENDING VEHICLES
IN QUEUE
17.00 0.1
17.15 0.1
17.30 0.1
17.45 0.1
18.00 0.1
18.15 0.1
.
QUEUE FOR STREAM B-A
-------------------------
TIME SEGMENT NO. OF
ENDING VEHICLES
IN QUEUE
17.00 0.0
17.15 0.0
17.30 0.0
17.45 0.0
18.00 0.0
18.15 0.0
For
insp
ectio
n pur
pose
s only
.
Conse
nt of
copy
right
owne
r req
uired
for a
ny ot
her u
se.
EPA Export 16-10-2012:23:24:02

.
QUEUE FOR STREAM C-AB
-------------------------
TIME SEGMENT NO. OF
ENDING VEHICLES
IN QUEUE
17.00 0.1
17.15 0.1
17.30 0.1
17.45 0.1
18.00 0.1
18.15 0.1
.
QUEUEING DELAY INFORMATION OVER WHOLE PERIOD
--------------------------------------------
---------------------------------------------------------------------------
I STREAM I TOTAL DEMAND I * QUEUEING * I * INCLUSIVE QUEUEING * I
I I I * DELAY * I * DELAY * I
I I----------------------------------------------------------------I
I I (VEH) (VEH/H) I (MIN) (MIN/VEH) I (MIN) (MIN/VEH) I
---------------------------------------------------------------------------
I B-C I 65.8 I 43.9 I 7.4 I 0.11 I 7.4 I 0.11 I
I B-A I 11.0 I 7.3 I 2.0 I 0.18 I 2.0 I 0.18 I
I C-AB I 53.3 I 35.5 I 6.7 I 0.13 I 6.7 I 0.13 I
I C-A I 325.2 I 216.8 I I I I I
I A-B I 11.0 I 7.3 I I I I I
I A-C I 194.7 I 129.8 I I I I I
---------------------------------------------------------------------------
I ALL I 660.9 I 440.6 I 16.1 I 0.02 I 16.1 I 0.02 I
---------------------------------------------------------------------------
* DELAY IS THAT OCCURRING ONLY WITHIN THE TIME PERIOD .
* INCLUSIVE DELAY INCLUDES DELAY SUFFERED BY VEHICLES WHICH ARE STILL QUEUEING
AFTER THE END OF THE TIME PERIOD.
* THESE WILL ONLY BE SIGNIFICANTLY DIFFERENT IF THERE IS A LARGE QUEUE REMAINING AT
THE END OF THE TIME PERIOD.
END OF JOB
****** PICADY 4 run completed.
============================================= end of file
===============================================
For
insp
ectio
n pur
pose
s only
.
Conse
nt of
copy
right
owne
r req
uired
for a
ny ot
her u
se.
EPA Export 16-10-2012:23:24:02
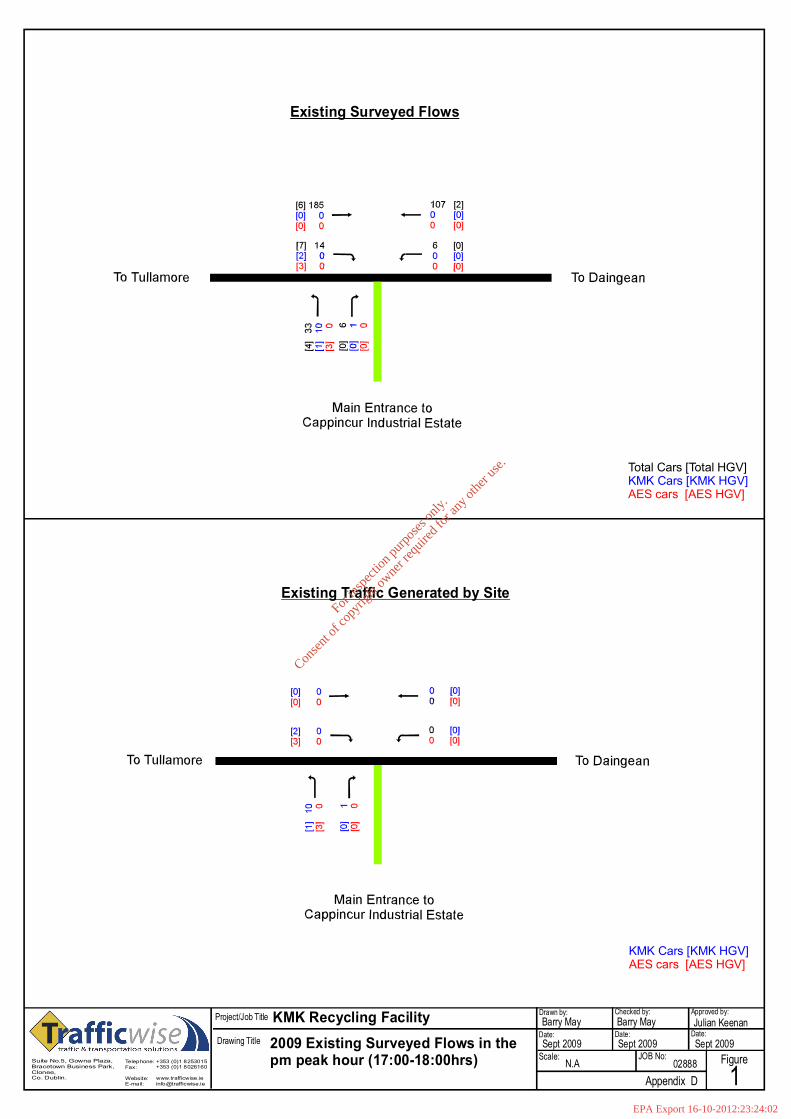
Drawing Title
Project/Job Title
Suite No.5, Gowna Plaza,Bracetown Business Park,Clonee,Co. Dublin.
+353 (0)1 8253015+353 (0)1 8026160
Drawn by: Checked by: Approved by:
Date: Date:Date:
Scale: JOB No: Figure
Julian Keenan
Sept 2009
02888N.A 1
Barry May
Sept 2009
Barry May
Sept 20092009 Existing Surveyed Flows in thepm peak hour (17:00-18:00hrs)Telephone:
Fax:
Website:E-mail: Appendix D
KMK Recycling Facility
Total Cars [Total HGV]KMK Cars [KMK HGV]AES cars [AES HGV]
Existing Surveyed Flows
KMK Cars [KMK HGV]AES cars [AES HGV]
Existing Traffic Generated by Site
For
insp
ectio
n pur
pose
s only
.
Conse
nt of
copy
right
owne
r req
uired
for a
ny ot
her u
se.
EPA Export 16-10-2012:23:24:02
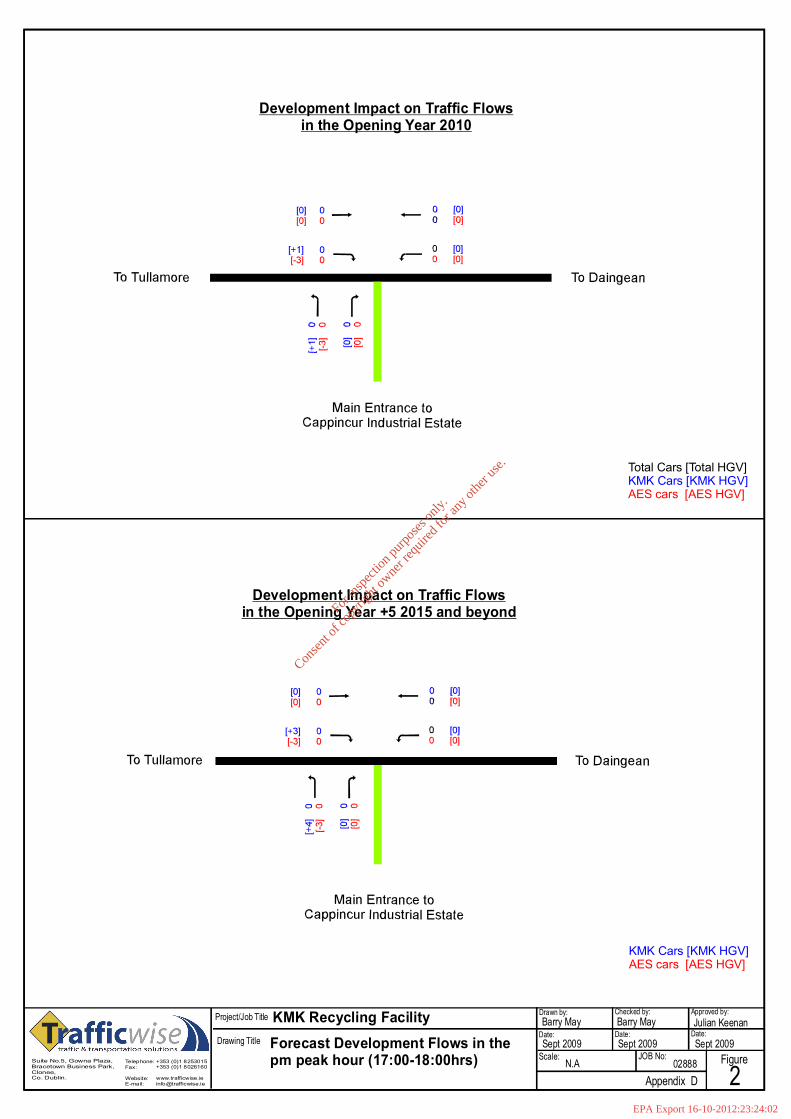
Drawing Title
Project/Job Title
Suite No.5, Gowna Plaza,Bracetown Business Park,Clonee,Co. Dublin.
+353 (0)1 8253015+353 (0)1 8026160
Drawn by: Checked by: Approved by:
Date: Date:Date:
Scale: JOB No: Figure
Julian Keenan
Sept 2009
02888N.A 2
Barry May
Sept 2009
Barry May
Sept 2009Forecast Development Flows in thepm peak hour (17:00-18:00hrs)Telephone:
Fax:
Website:E-mail: Appendix D
KMK Recycling Facility
Total Cars [Total HGV]KMK Cars [KMK HGV]AES cars [AES HGV]
KMK Cars [KMK HGV]AES cars [AES HGV]
Development Impact on Traffic Flowsin the Opening Year +5 2015 and beyond
Development Impact on Traffic Flowsin the Opening Year 2010
For
insp
ectio
n pur
pose
s only
.
Conse
nt of
copy
right
owne
r req
uired
for a
ny ot
her u
se.
EPA Export 16-10-2012:23:24:02
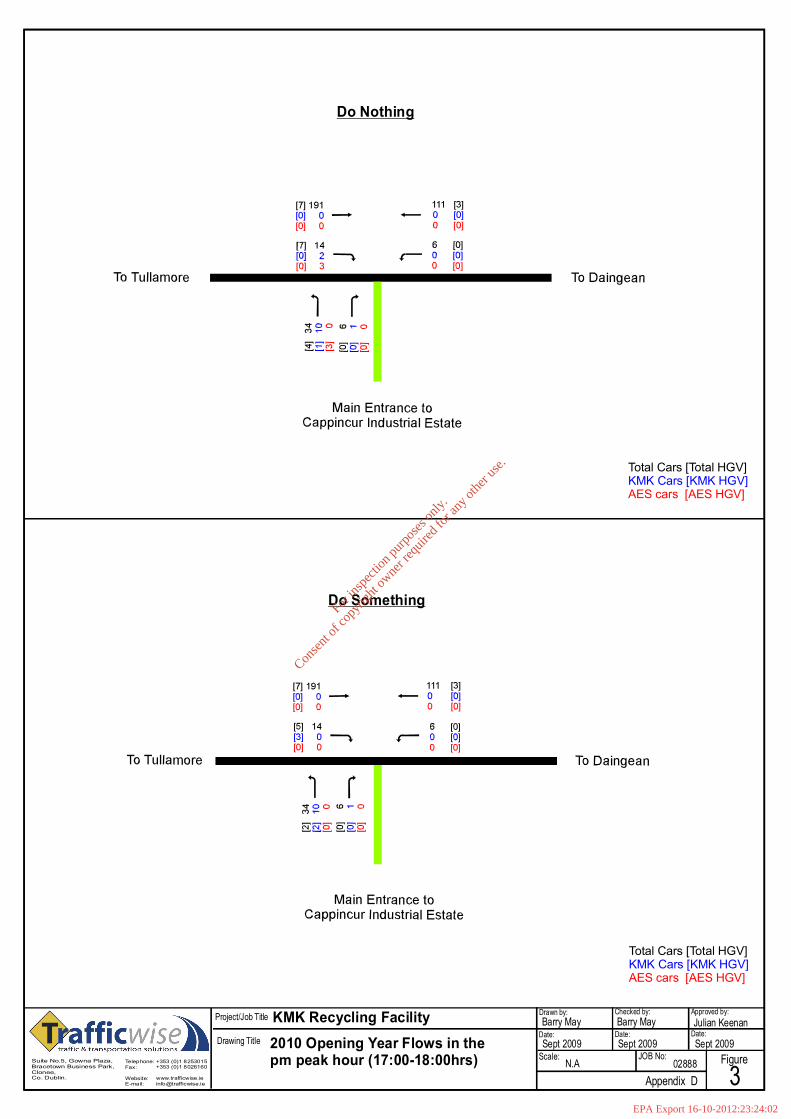
Drawing Title
Project/Job Title
Suite No.5, Gowna Plaza,Bracetown Business Park,Clonee,Co. Dublin.
+353 (0)1 8253015+353 (0)1 8026160
Drawn by: Checked by: Approved by:
Date: Date:Date:
Scale: JOB No: Figure
Julian Keenan
Sept 2009
02888N.A 3
Barry May
Sept 2009
Barry May
Sept 20092010 Opening Year Flows in thepm peak hour (17:00-18:00hrs)Telephone:
Fax:
Website:E-mail: Appendix D
KMK Recycling Facility
Total Cars [Total HGV]KMK Cars [KMK HGV]AES cars [AES HGV]
Total Cars [Total HGV]KMK Cars [KMK HGV]AES cars [AES HGV]
Do Something
Do Nothing
For
insp
ectio
n pur
pose
s only
.
Conse
nt of
copy
right
owne
r req
uired
for a
ny ot
her u
se.
EPA Export 16-10-2012:23:24:02
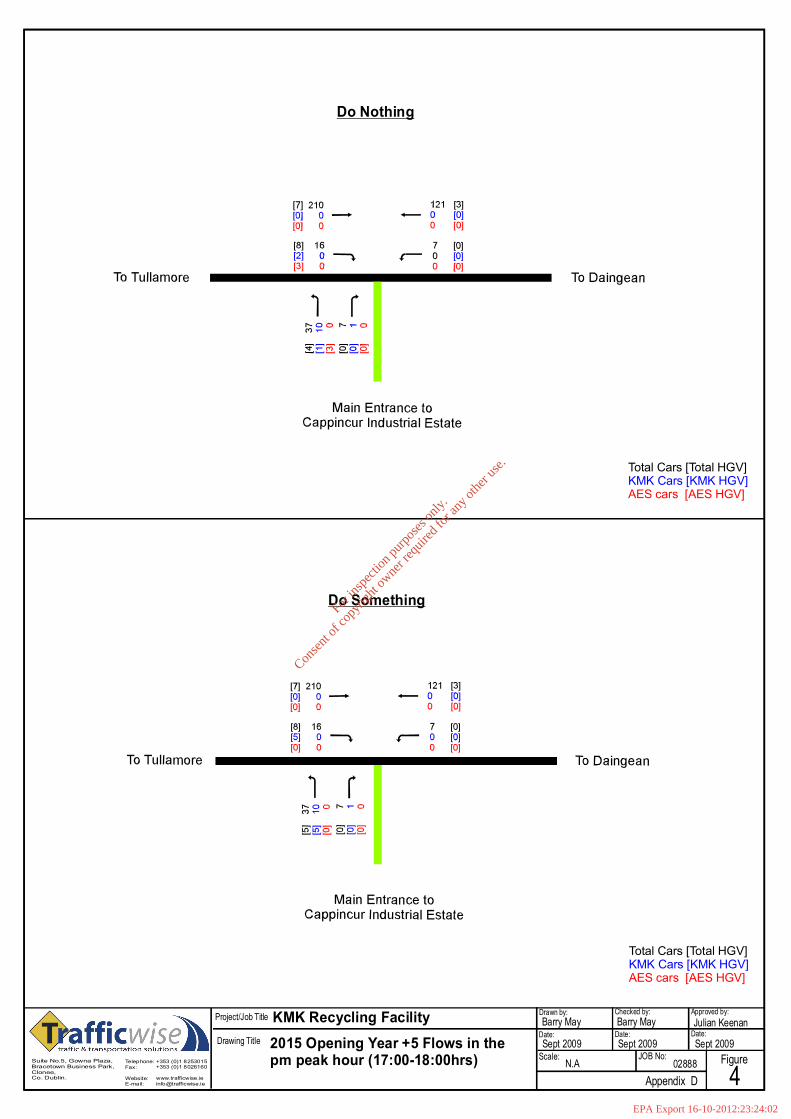
Drawing Title
Project/Job Title
Suite No.5, Gowna Plaza,Bracetown Business Park,Clonee,Co. Dublin.
+353 (0)1 8253015+353 (0)1 8026160
Drawn by: Checked by: Approved by:
Date: Date:Date:
Scale: JOB No: Figure
Julian Keenan
Sept 2009
02888N.A 4
Barry May
Sept 2009
Barry May
Sept 20092015 Opening Year +5 Flows in thepm peak hour (17:00-18:00hrs)Telephone:
Fax:
Website:E-mail: Appendix D
KMK Recycling Facility
Total Cars [Total HGV]KMK Cars [KMK HGV]AES cars [AES HGV]
Total Cars [Total HGV]KMK Cars [KMK HGV]AES cars [AES HGV]
Do Something
Do Nothing
For
insp
ectio
n pur
pose
s only
.
Conse
nt of
copy
right
owne
r req
uired
for a
ny ot
her u
se.
EPA Export 16-10-2012:23:24:02
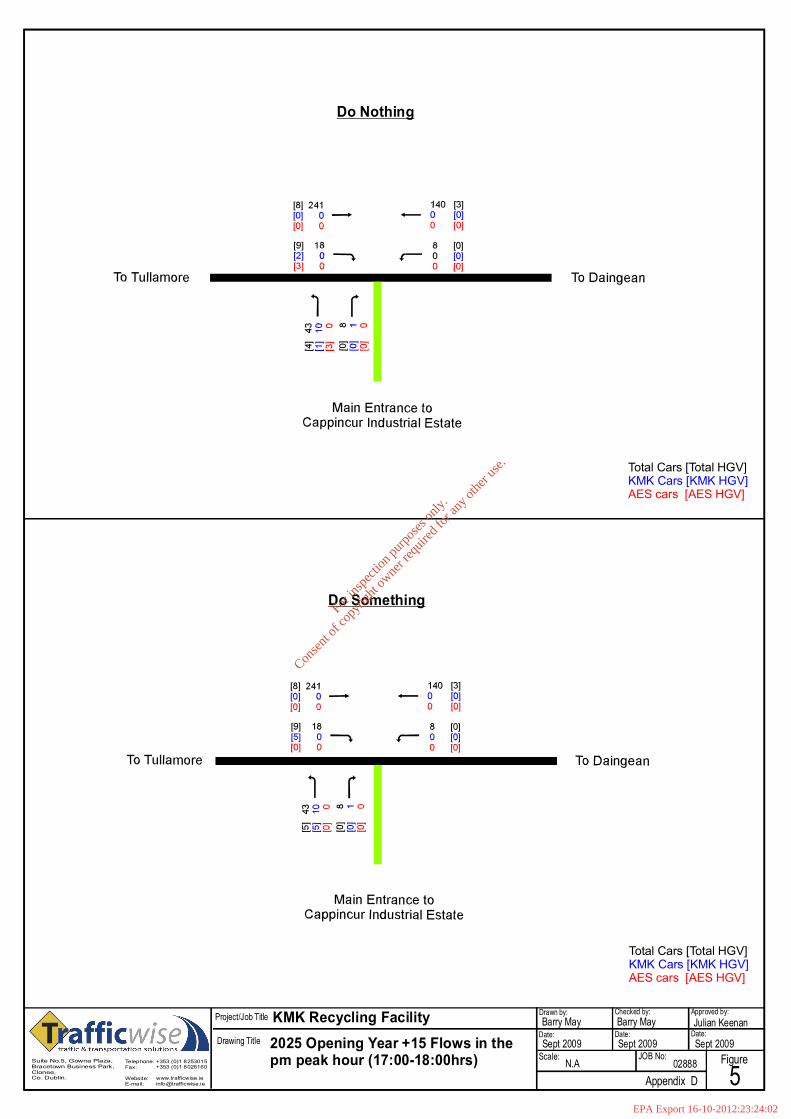
Drawing Title
Project/Job Title
Suite No.5, Gowna Plaza,Bracetown Business Park,Clonee,Co. Dublin.
+353 (0)1 8253015+353 (0)1 8026160
Drawn by: Checked by: Approved by:
Date: Date:Date:
Scale: JOB No: Figure
Julian Keenan
Sept 2009
02888N.A 5
Barry May
Sept 2009
Barry May
Sept 20092025 Opening Year +15 Flows in thepm peak hour (17:00-18:00hrs)Telephone:
Fax:
Website:E-mail: Appendix D
KMK Recycling Facility
Total Cars [Total HGV]KMK Cars [KMK HGV]AES cars [AES HGV]
Total Cars [Total HGV]KMK Cars [KMK HGV]AES cars [AES HGV]
Do Something
Do Nothing
For
insp
ectio
n pur
pose
s only
.
Conse
nt of
copy
right
owne
r req
uired
for a
ny ot
her u
se.
EPA Export 16-10-2012:23:24:02
For
insp
ectio
n pur
pose
s only
.
Conse
nt of
copy
right
owne
r req
uired
for a
ny ot
her u
se.
EPA Export 16-10-2012:23:24:02
For
insp
ectio
n pur
pose
s only
.
Conse
nt of
copy
right
owne
r req
uired
for a
ny ot
her u
se.
EPA Export 16-10-2012:23:24:02
For
insp
ectio
n pur
pose
s only
.
Conse
nt of
copy
right
owne
r req
uired
for a
ny ot
her u
se.
EPA Export 16-10-2012:23:24:02
For
insp
ectio
n pur
pose
s only
.
Conse
nt of
copy
right
owne
r req
uired
for a
ny ot
her u
se.
EPA Export 16-10-2012:23:24:02
For
insp
ectio
n pur
pose
s only
.
Conse
nt of
copy
right
owne
r req
uired
for a
ny ot
her u
se.
EPA Export 16-10-2012:23:24:02
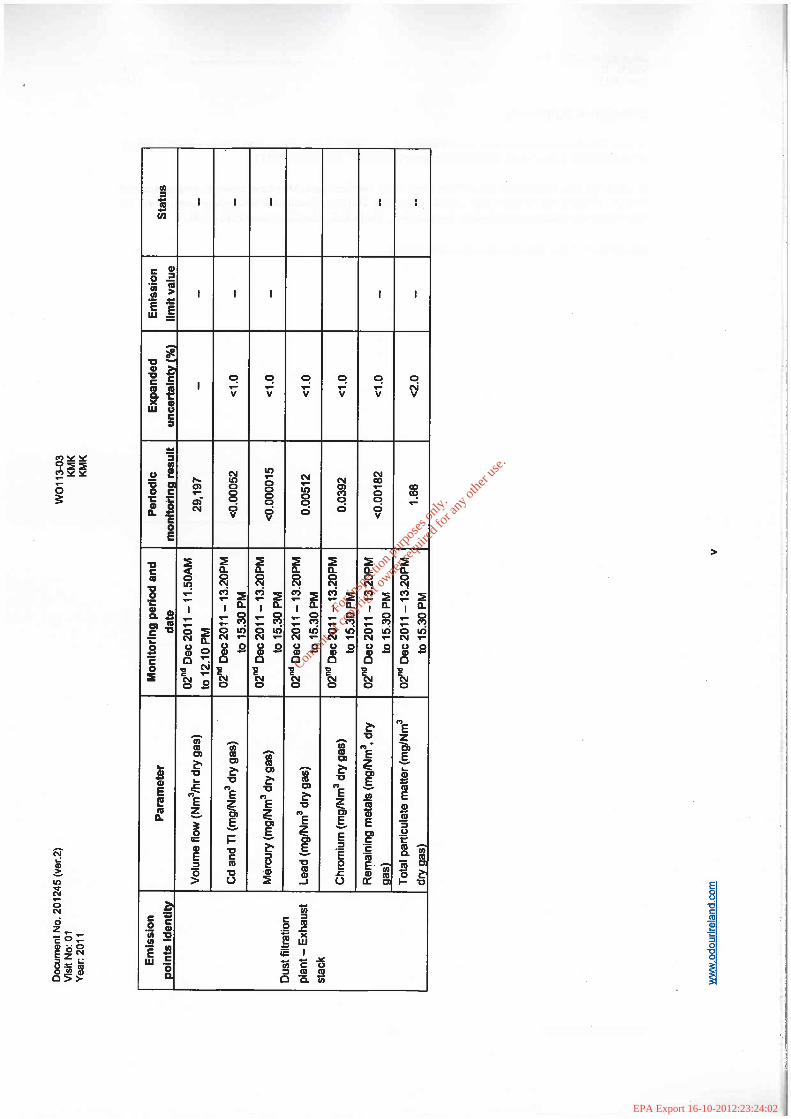
For
insp
ectio
n pur
pose
s only
.
Conse
nt of
copy
right
owne
r req
uired
for a
ny ot
her u
se.
EPA Export 16-10-2012:23:24:02
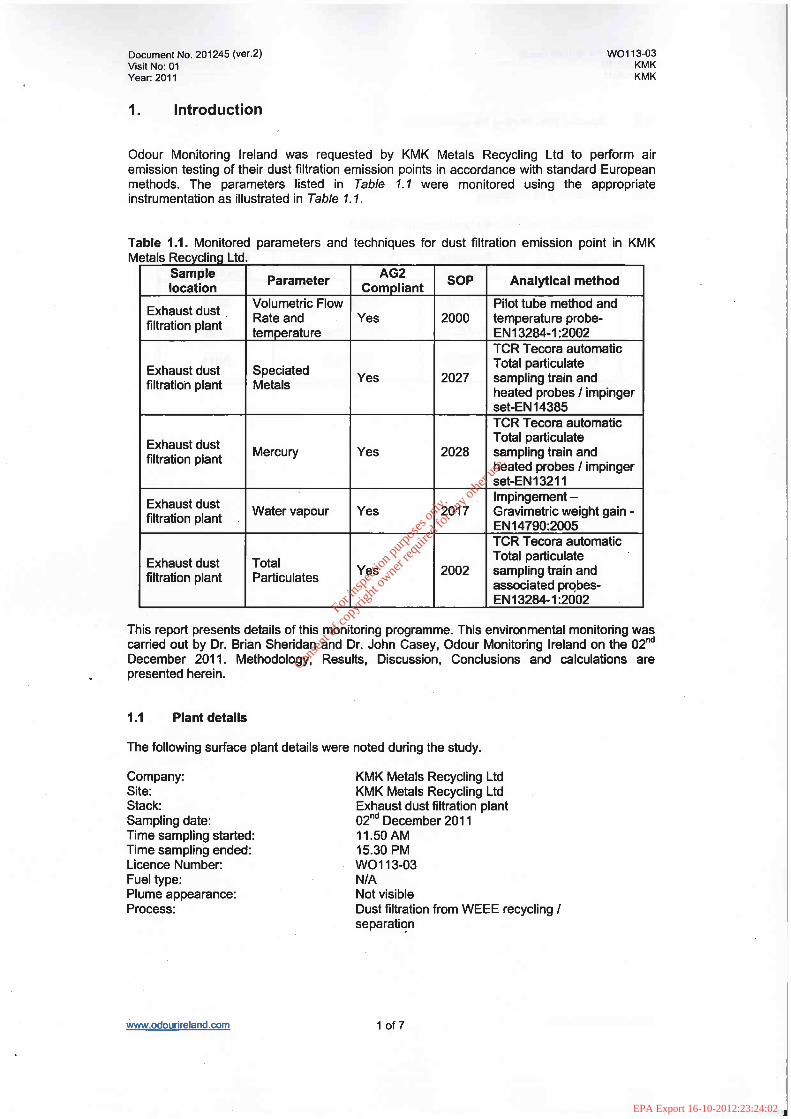
For
insp
ectio
n pur
pose
s only
.
Conse
nt of
copy
right
owne
r req
uired
for a
ny ot
her u
se.
EPA Export 16-10-2012:23:24:02
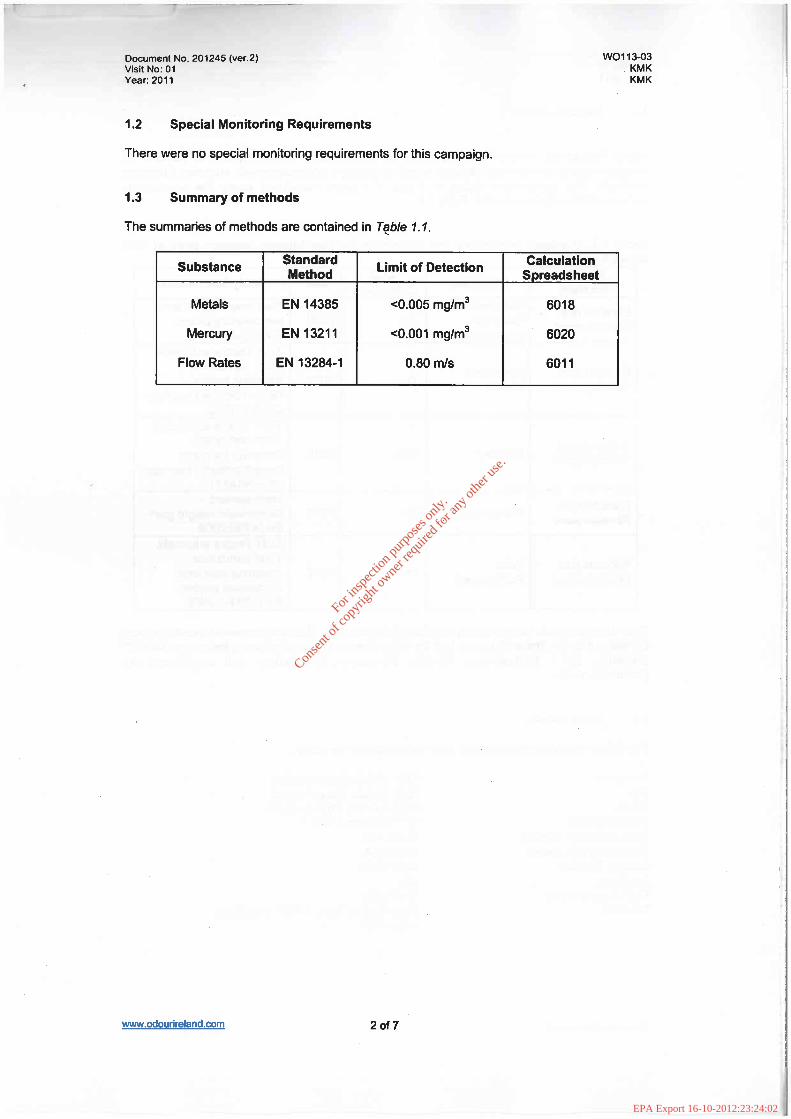
For
insp
ectio
n pur
pose
s only
.
Conse
nt of
copy
right
owne
r req
uired
for a
ny ot
her u
se.
EPA Export 16-10-2012:23:24:02
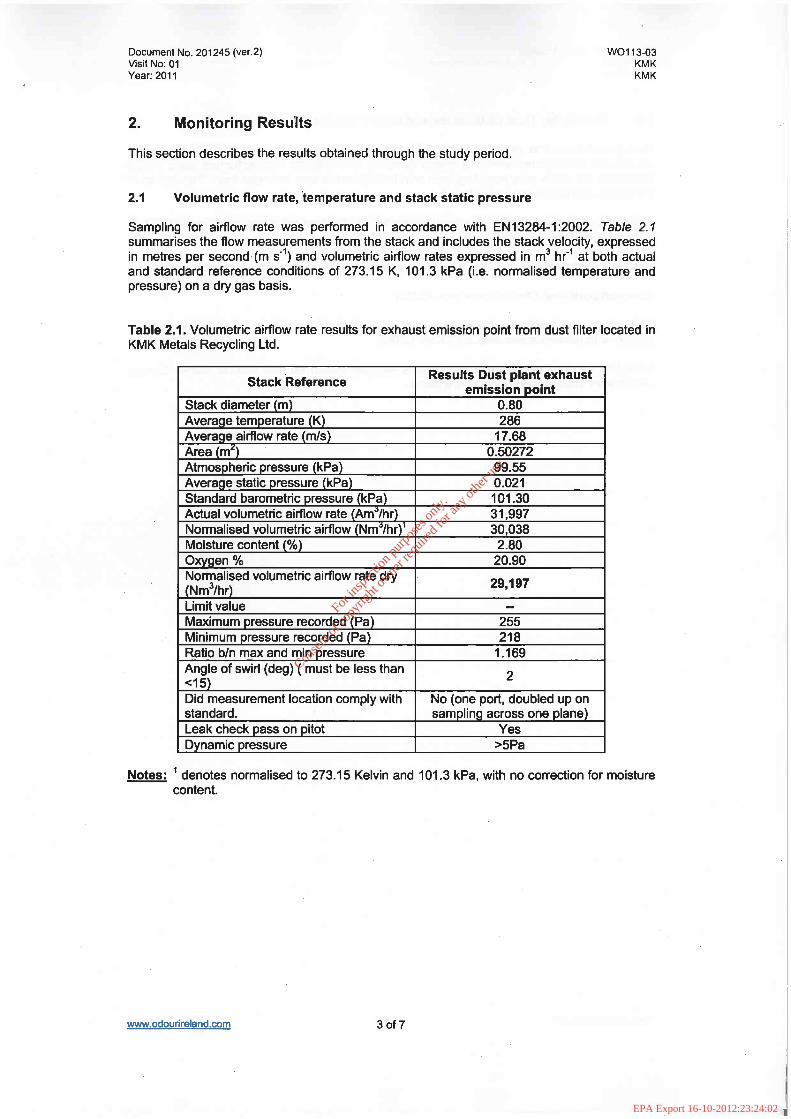
For
insp
ectio
n pur
pose
s only
.
Conse
nt of
copy
right
owne
r req
uired
for a
ny ot
her u
se.
EPA Export 16-10-2012:23:24:02
For
insp
ectio
n pur
pose
s only
.
Conse
nt of
copy
right
owne
r req
uired
for a
ny ot
her u
se.
EPA Export 16-10-2012:23:24:02
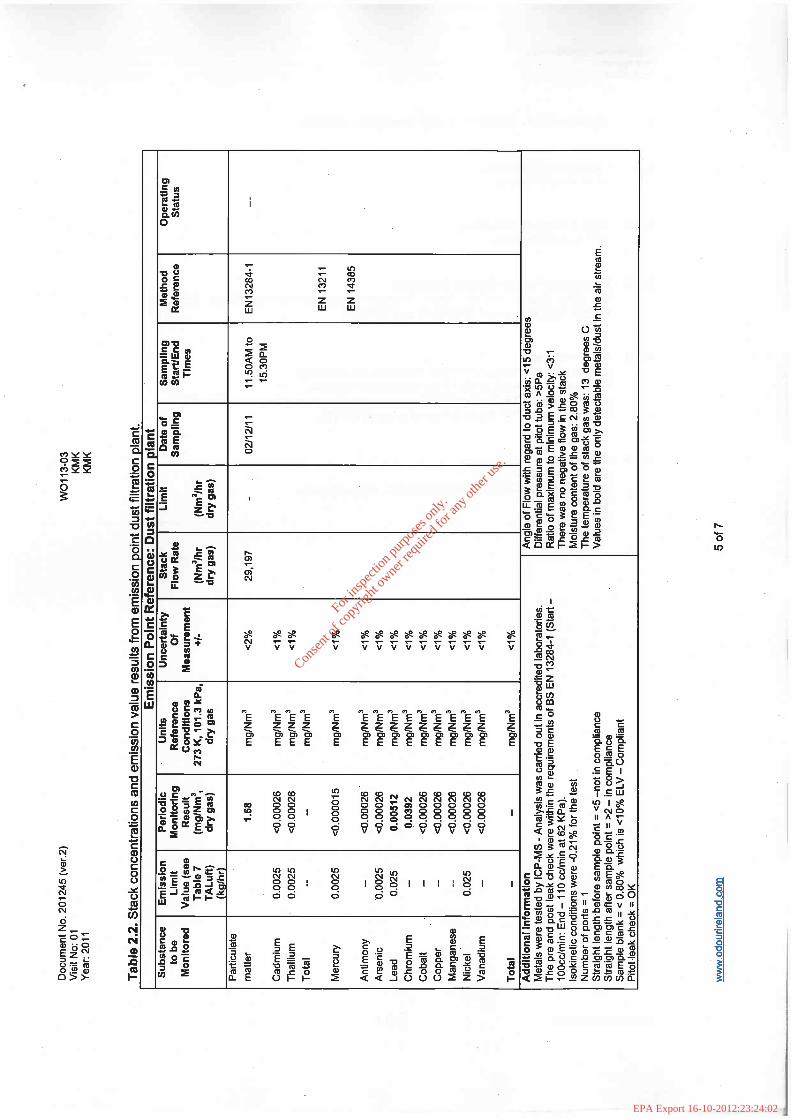
For
insp
ectio
n pur
pose
s only
.
Conse
nt of
copy
right
owne
r req
uired
for a
ny ot
her u
se.
EPA Export 16-10-2012:23:24:02
For
insp
ectio
n pur
pose
s only
.
Conse
nt of
copy
right
owne
r req
uired
for a
ny ot
her u
se.
EPA Export 16-10-2012:23:24:02
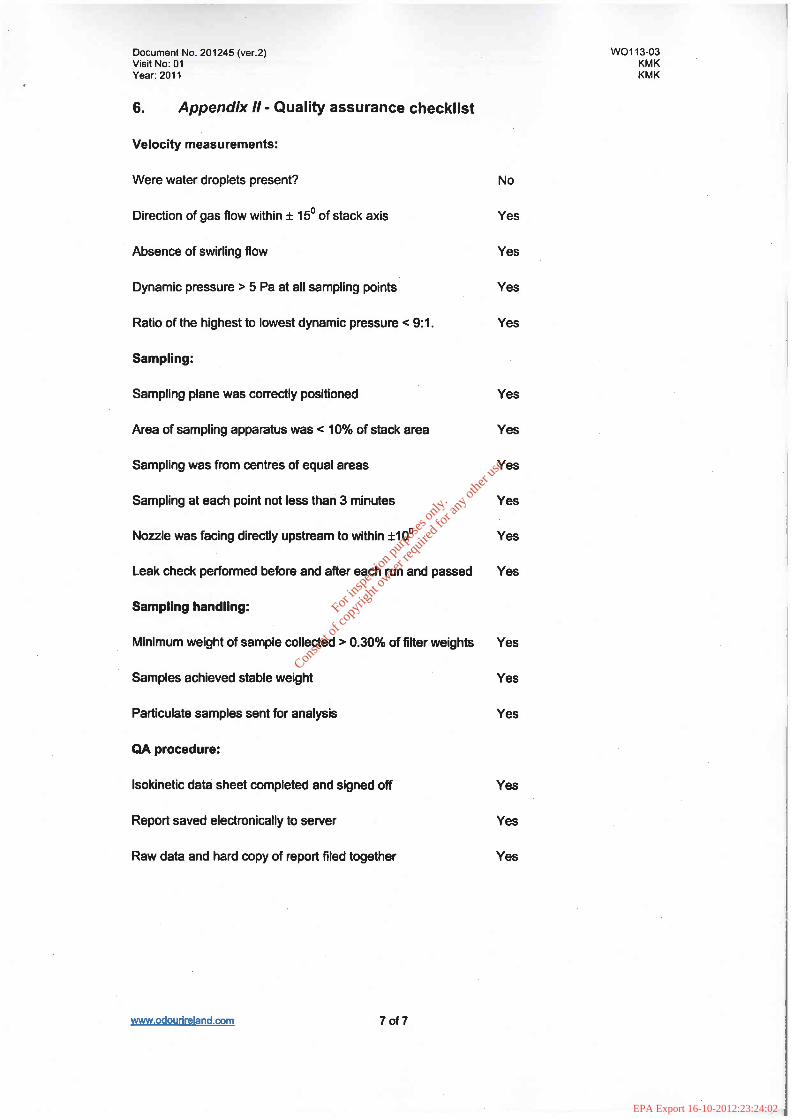
For
insp
ectio
n pur
pose
s only
.
Conse
nt of
copy
right
owne
r req
uired
for a
ny ot
her u
se.
EPA Export 16-10-2012:23:24:02

For
insp
ectio
n pur
pose
s only
.
Conse
nt of
copy
right
owne
r req
uired
for a
ny ot
her u
se.
EPA Export 16-10-2012:23:24:03
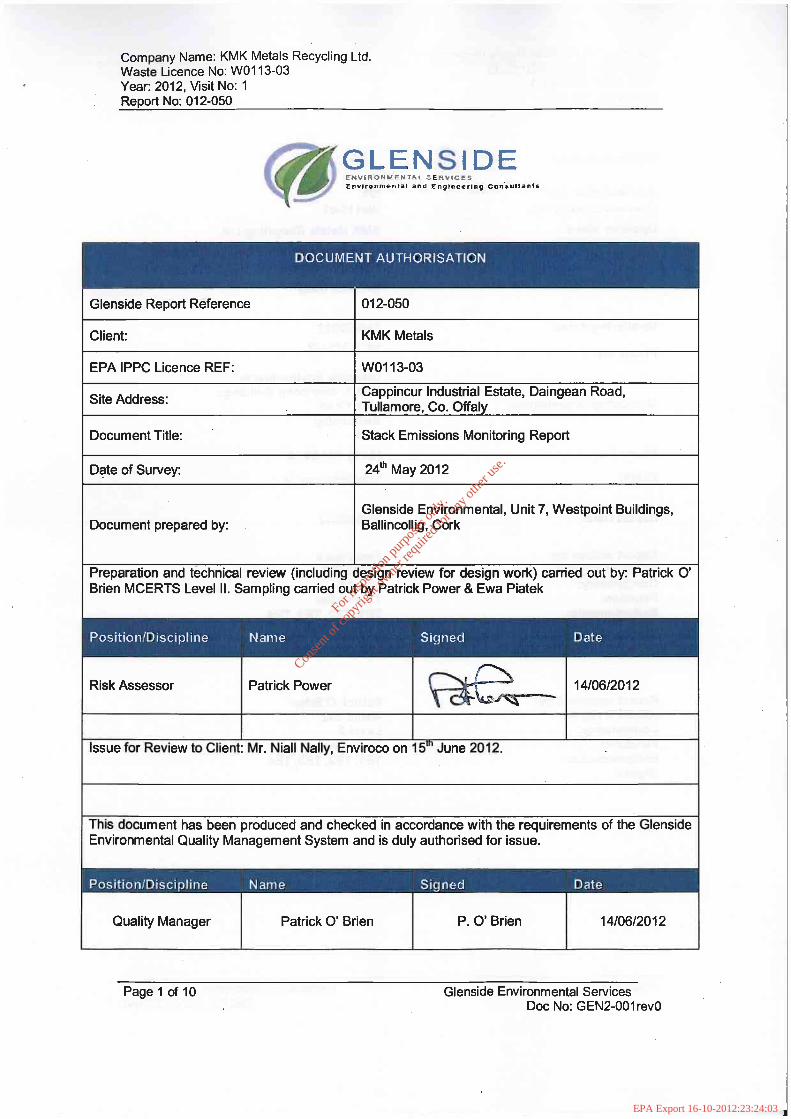
For
insp
ectio
n pur
pose
s only
.
Conse
nt of
copy
right
owne
r req
uired
for a
ny ot
her u
se.
EPA Export 16-10-2012:23:24:03
For
insp
ectio
n pur
pose
s only
.
Conse
nt of
copy
right
owne
r req
uired
for a
ny ot
her u
se.
EPA Export 16-10-2012:23:24:03
For
insp
ectio
n pur
pose
s only
.
Conse
nt of
copy
right
owne
r req
uired
for a
ny ot
her u
se.
EPA Export 16-10-2012:23:24:03
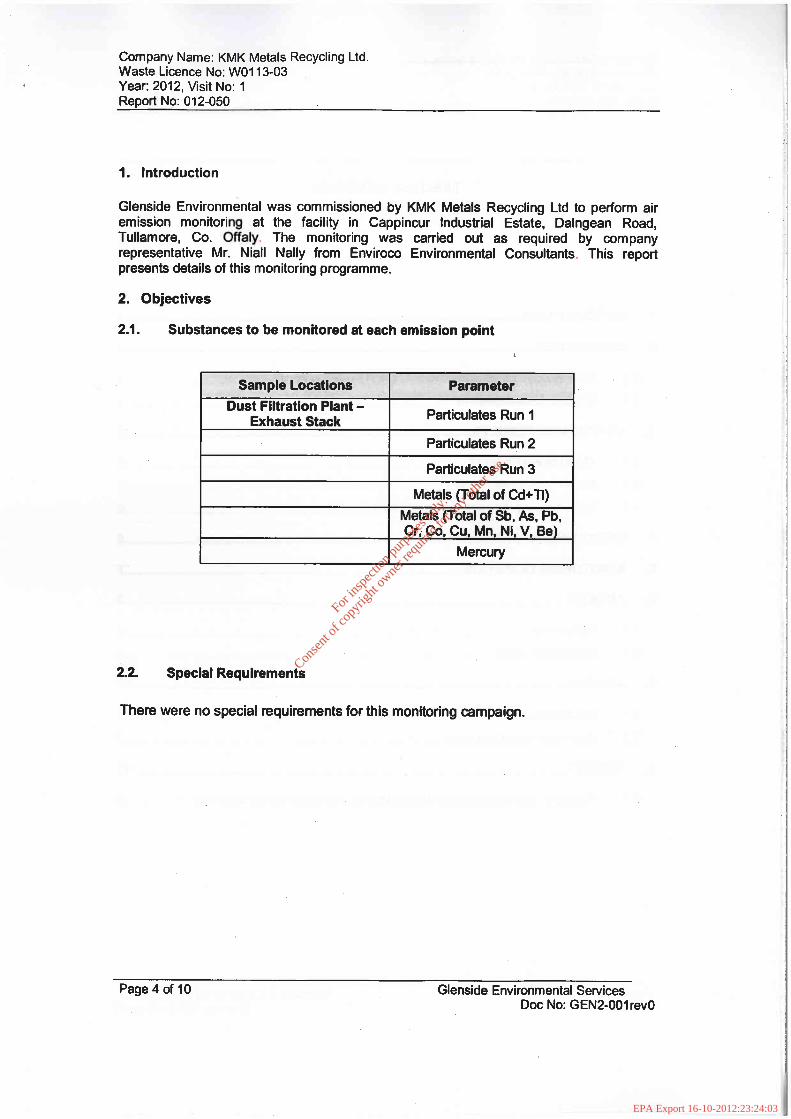
For
insp
ectio
n pur
pose
s only
.
Conse
nt of
copy
right
owne
r req
uired
for a
ny ot
her u
se.
EPA Export 16-10-2012:23:24:03
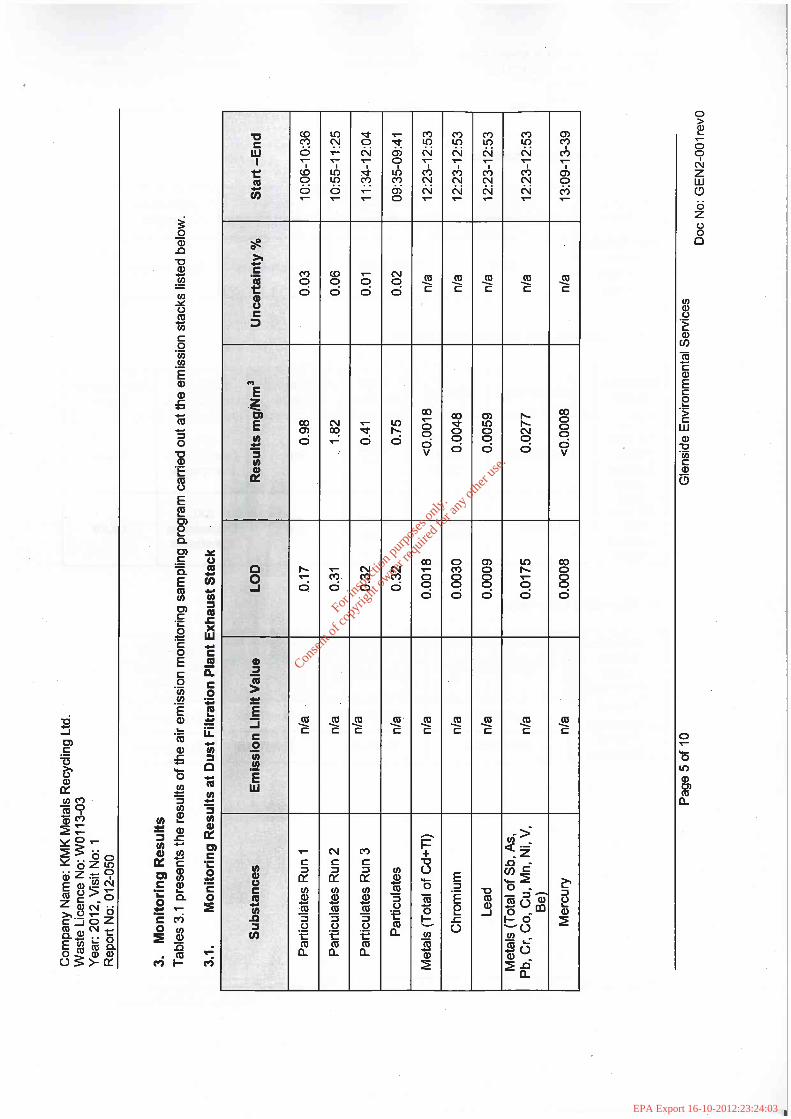
For
insp
ectio
n pur
pose
s only
.
Conse
nt of
copy
right
owne
r req
uired
for a
ny ot
her u
se.
EPA Export 16-10-2012:23:24:03
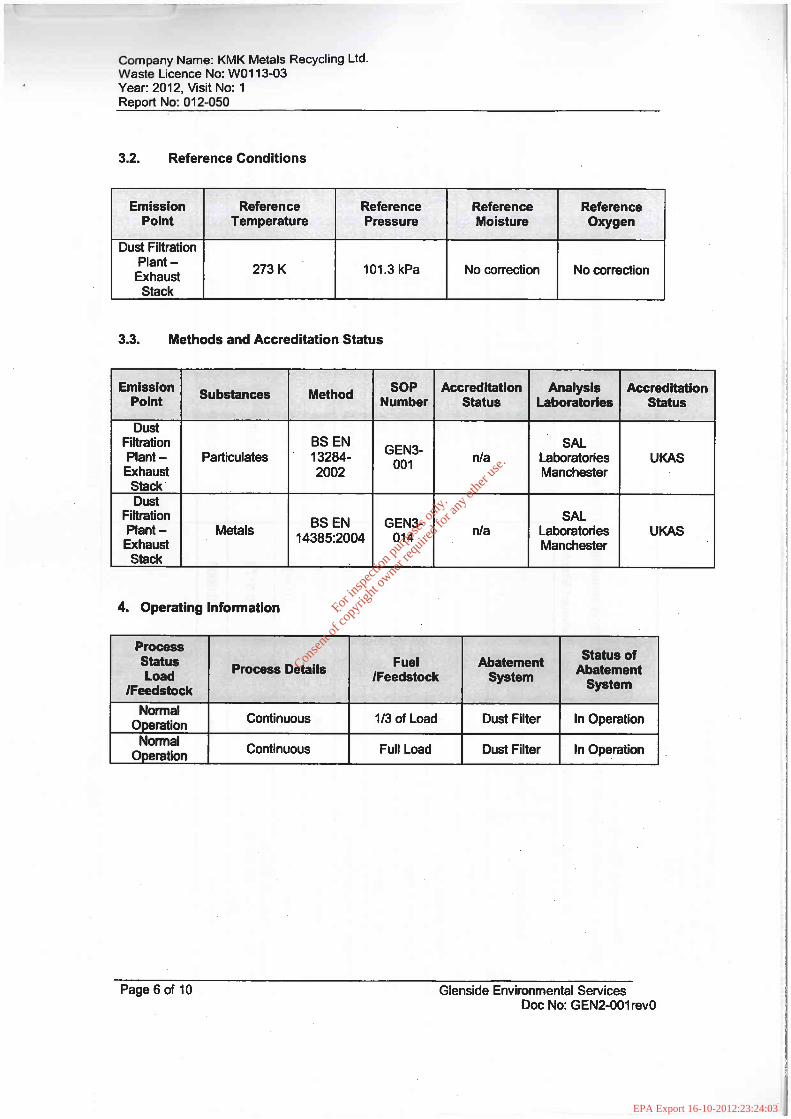
For
insp
ectio
n pur
pose
s only
.
Conse
nt of
copy
right
owne
r req
uired
for a
ny ot
her u
se.
EPA Export 16-10-2012:23:24:03
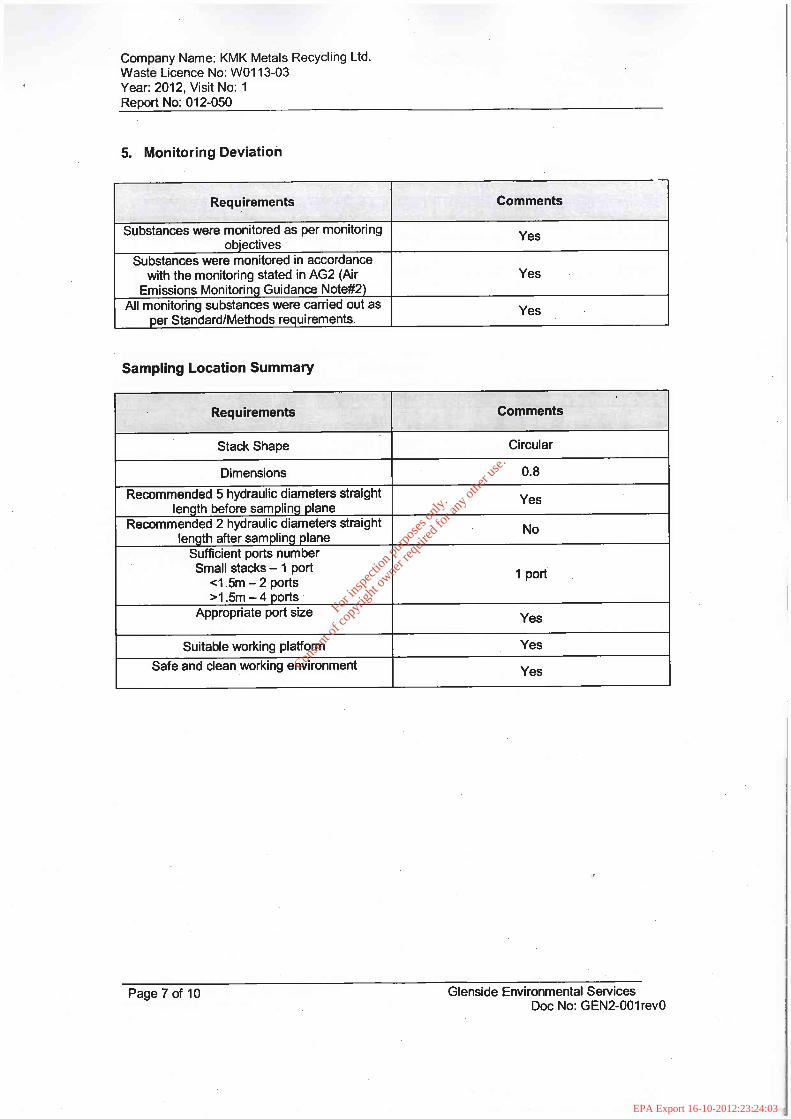
For
insp
ectio
n pur
pose
s only
.
Conse
nt of
copy
right
owne
r req
uired
for a
ny ot
her u
se.
EPA Export 16-10-2012:23:24:03
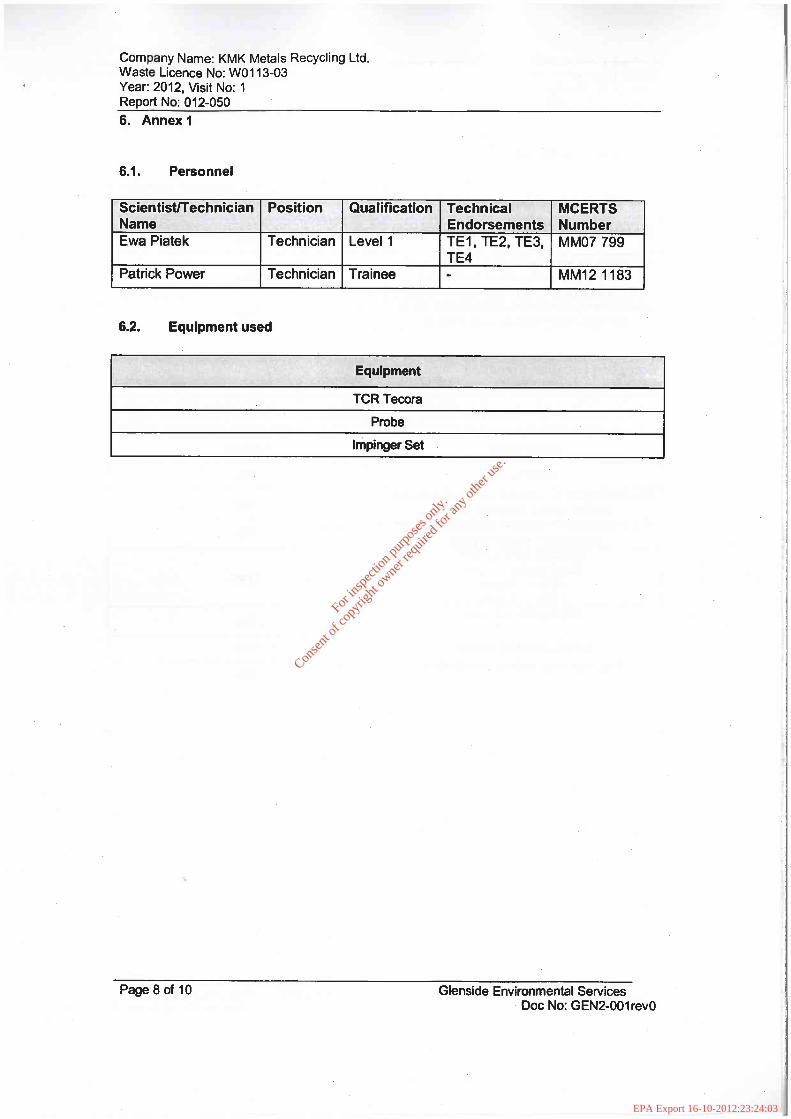
For
insp
ectio
n pur
pose
s only
.
Conse
nt of
copy
right
owne
r req
uired
for a
ny ot
her u
se.
EPA Export 16-10-2012:23:24:03
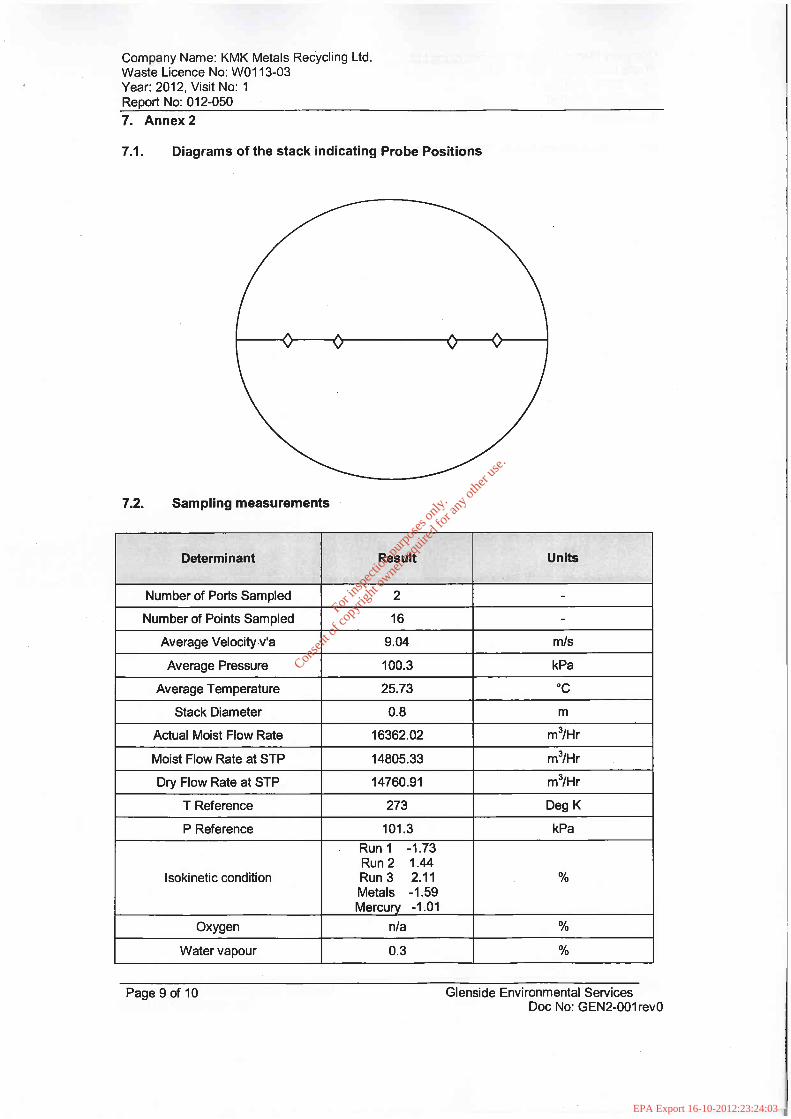
For
insp
ectio
n pur
pose
s only
.
Conse
nt of
copy
right
owne
r req
uired
for a
ny ot
her u
se.
EPA Export 16-10-2012:23:24:03
For
insp
ectio
n pur
pose
s only
.
Conse
nt of
copy
right
owne
r req
uired
for a
ny ot
her u
se.
EPA Export 16-10-2012:23:24:03
For
insp
ectio
n pur
pose
s only
.
Conse
nt of
copy
right
owne
r req
uired
for a
ny ot
her u
se.
EPA Export 16-10-2012:23:24:03
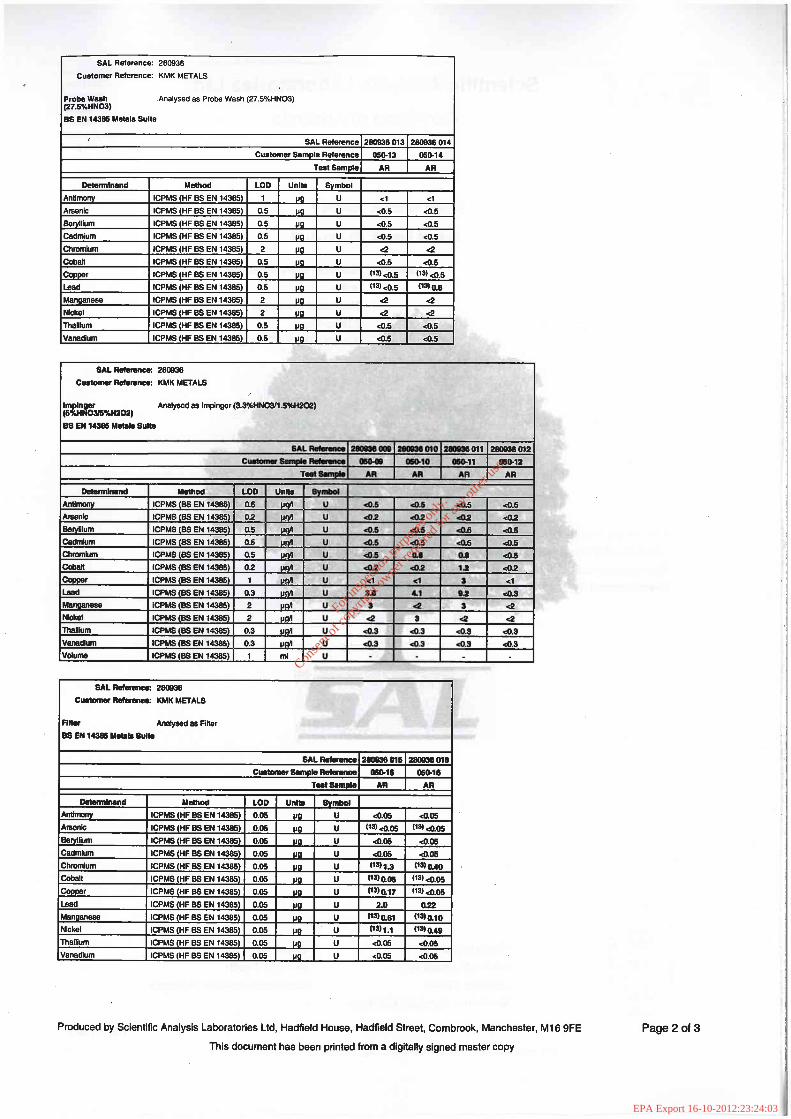
For
insp
ectio
n pur
pose
s only
.
Conse
nt of
copy
right
owne
r req
uired
for a
ny ot
her u
se.
EPA Export 16-10-2012:23:24:03
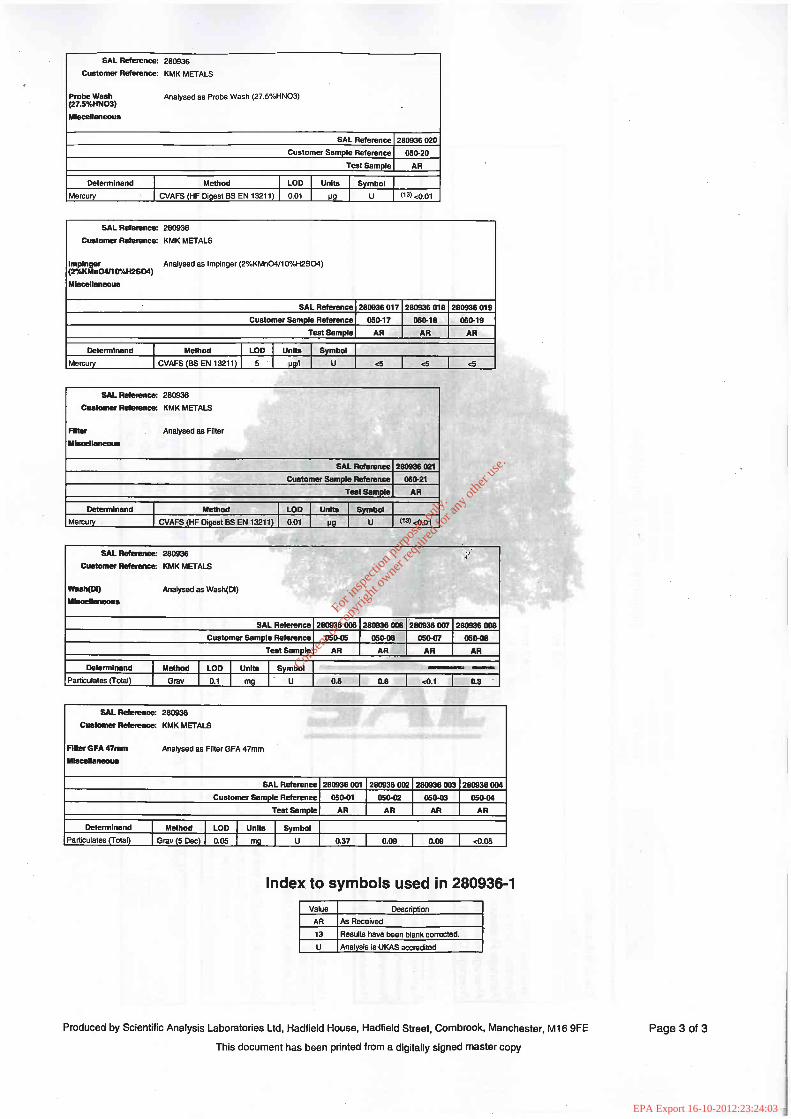
For
insp
ectio
n pur
pose
s only
.
Conse
nt of
copy
right
owne
r req
uired
for a
ny ot
her u
se.
EPA Export 16-10-2012:23:24:03
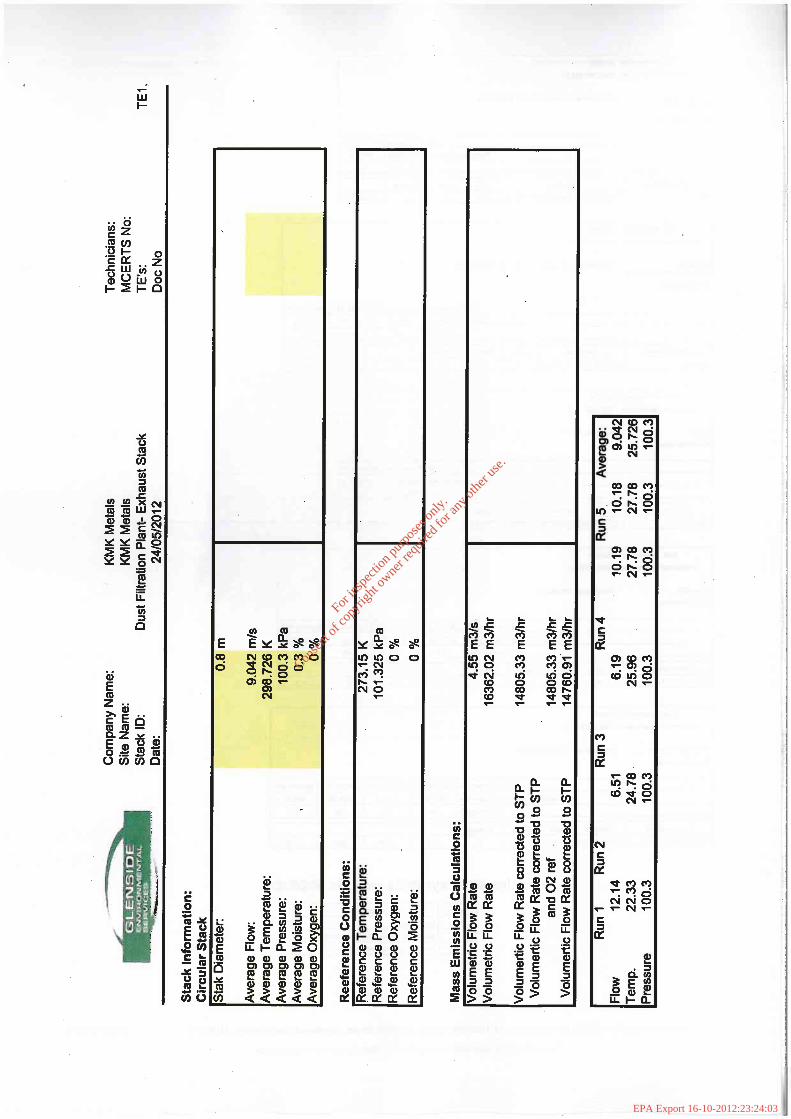
For
insp
ectio
n pur
pose
s only
.
Conse
nt of
copy
right
owne
r req
uired
for a
ny ot
her u
se.
EPA Export 16-10-2012:23:24:03
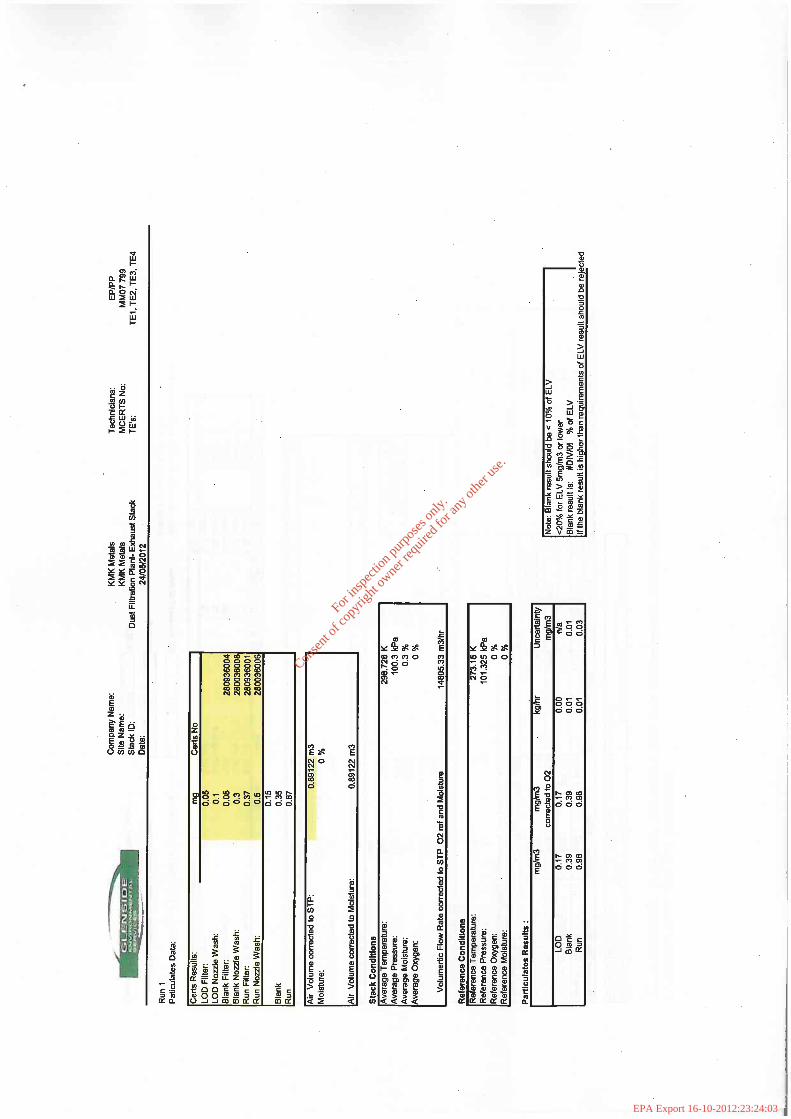
For
insp
ectio
n pur
pose
s only
.
Conse
nt of
copy
right
owne
r req
uired
for a
ny ot
her u
se.
EPA Export 16-10-2012:23:24:03
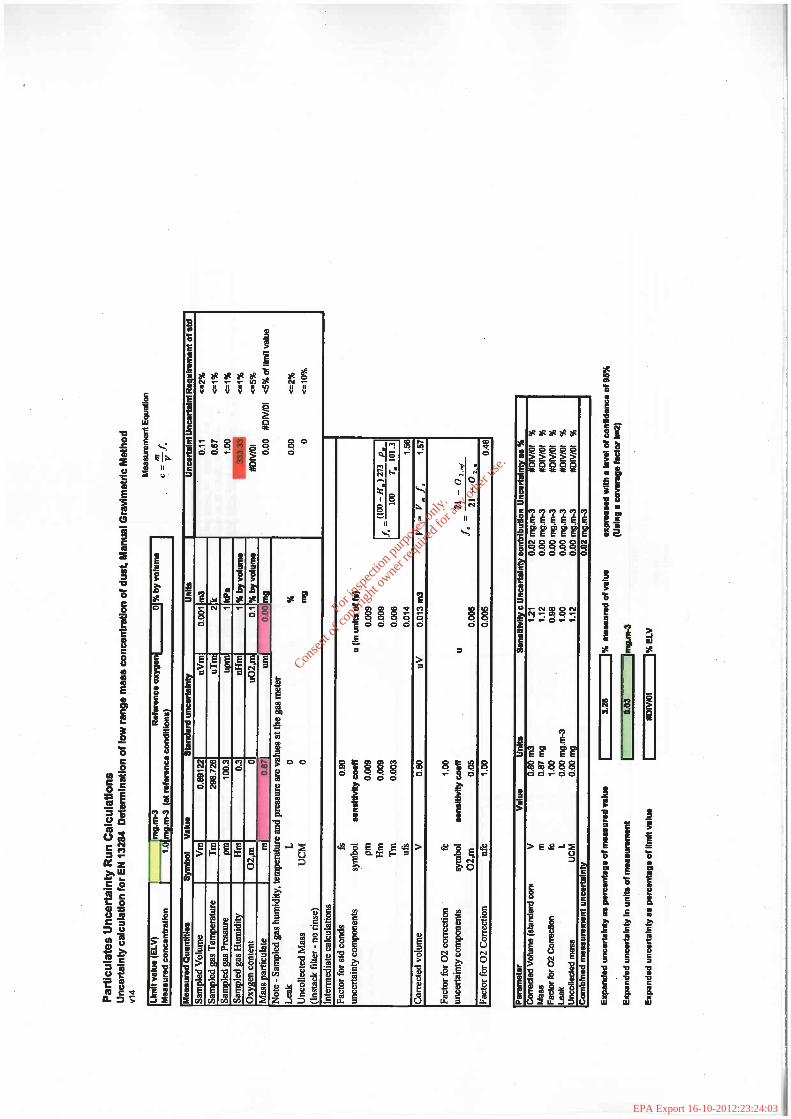
For
insp
ectio
n pur
pose
s only
.
Conse
nt of
copy
right
owne
r req
uired
for a
ny ot
her u
se.
EPA Export 16-10-2012:23:24:03
For
insp
ectio
n pur
pose
s only
.
Conse
nt of
copy
right
owne
r req
uired
for a
ny ot
her u
se.
EPA Export 16-10-2012:23:24:03
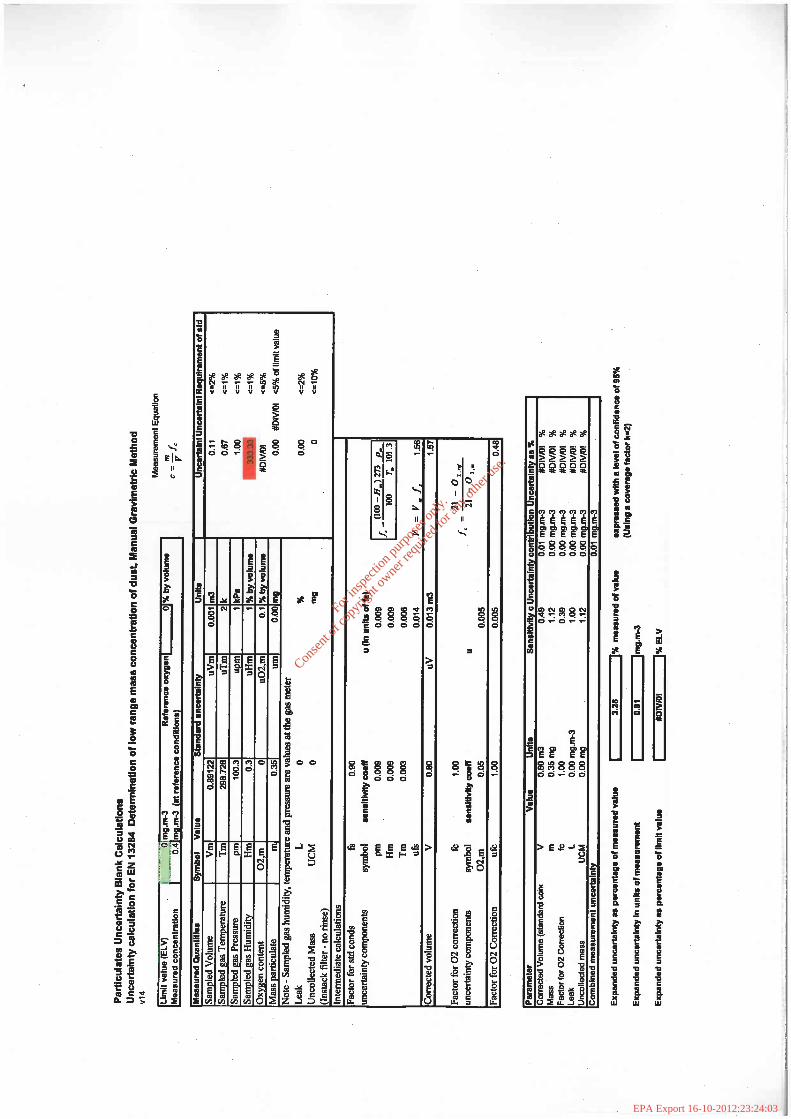
For
insp
ectio
n pur
pose
s only
.
Conse
nt of
copy
right
owne
r req
uired
for a
ny ot
her u
se.
EPA Export 16-10-2012:23:24:03
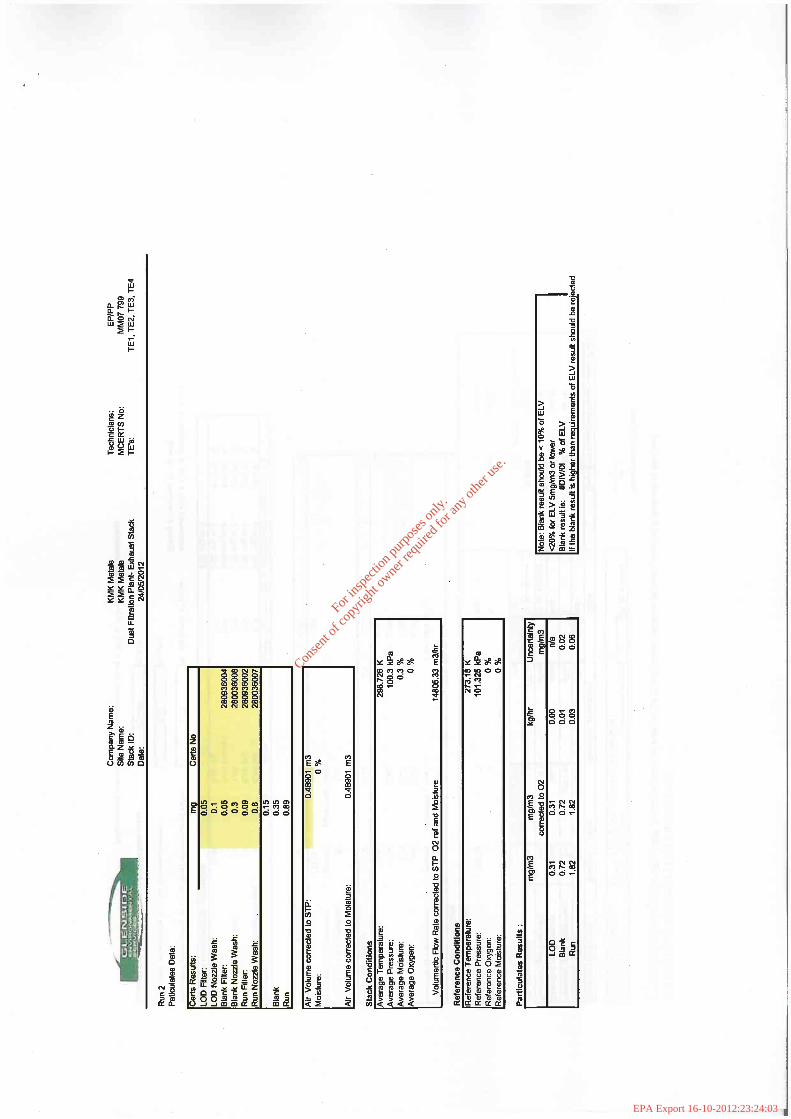
For
insp
ectio
n pur
pose
s only
.
Conse
nt of
copy
right
owne
r req
uired
for a
ny ot
her u
se.
EPA Export 16-10-2012:23:24:03
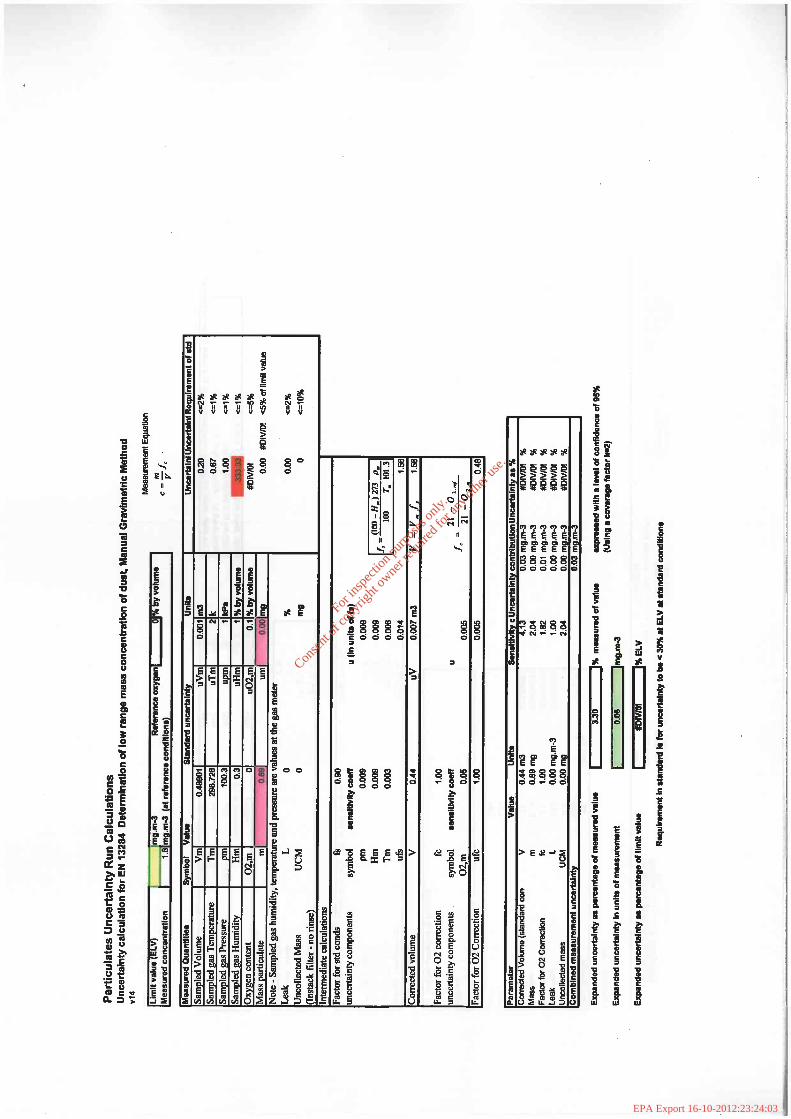
For
insp
ectio
n pur
pose
s only
.
Conse
nt of
copy
right
owne
r req
uired
for a
ny ot
her u
se.
EPA Export 16-10-2012:23:24:03
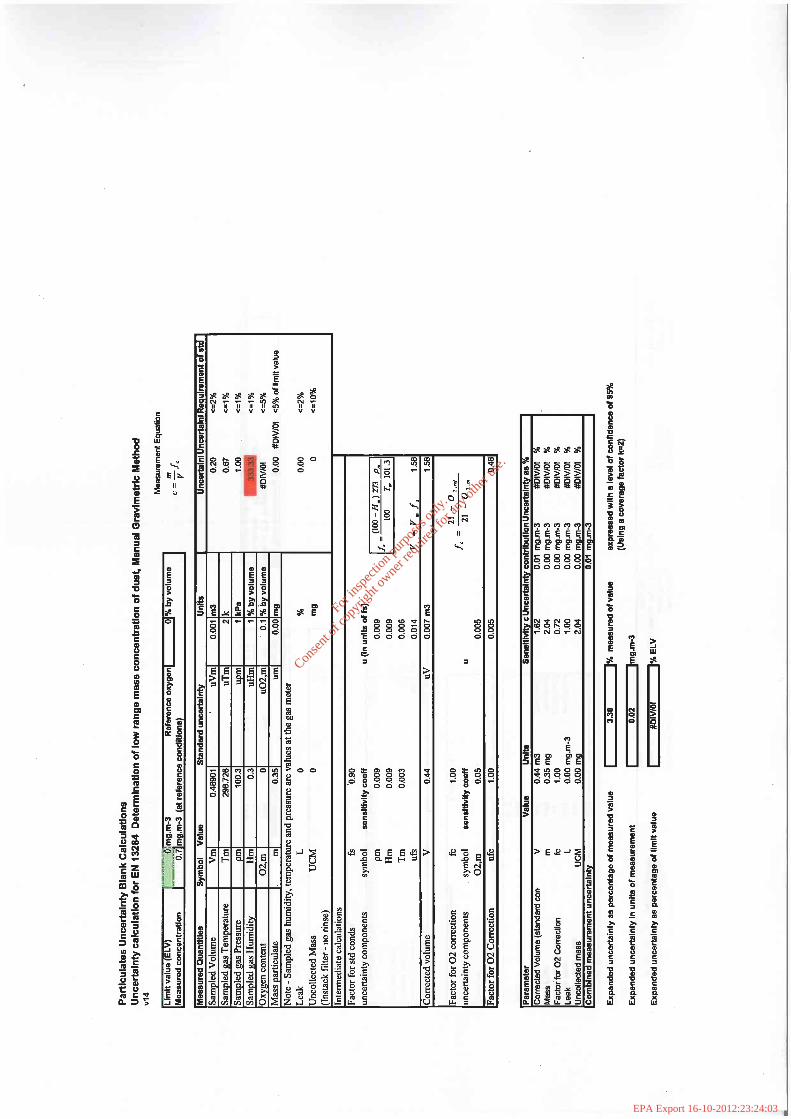
For
insp
ectio
n pur
pose
s only
.
Conse
nt of
copy
right
owne
r req
uired
for a
ny ot
her u
se.
EPA Export 16-10-2012:23:24:03
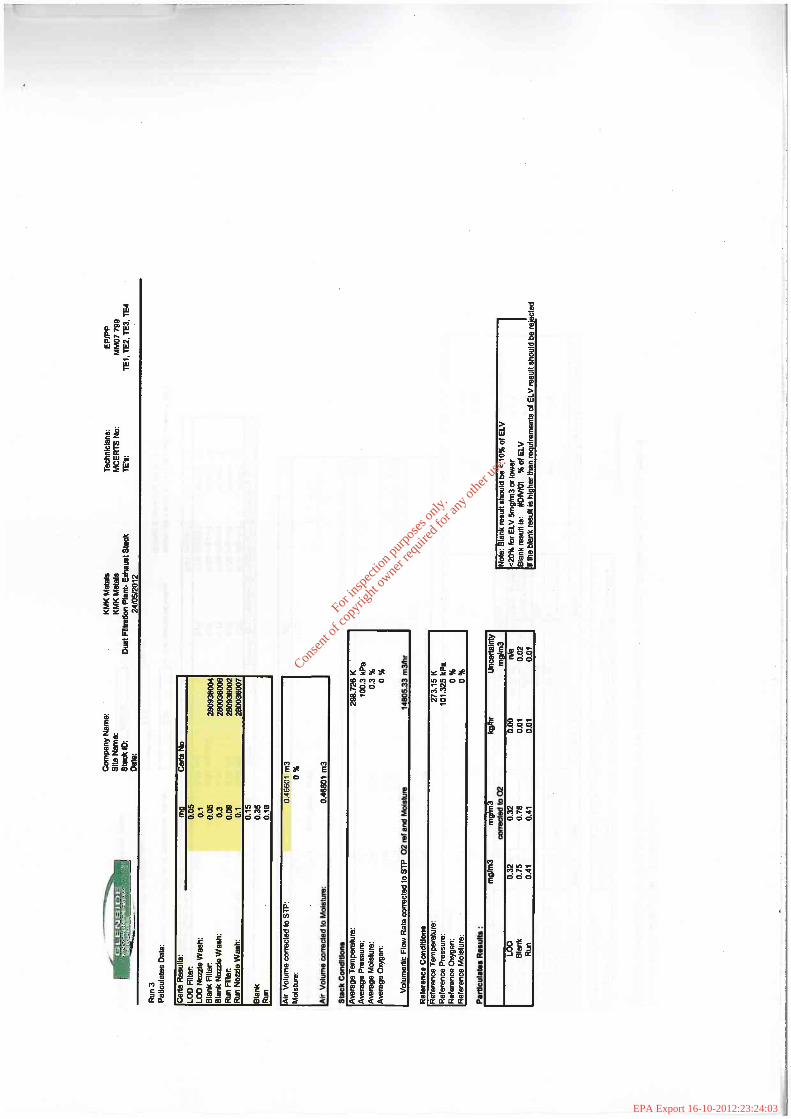
For
insp
ectio
n pur
pose
s only
.
Conse
nt of
copy
right
owne
r req
uired
for a
ny ot
her u
se.
EPA Export 16-10-2012:23:24:03
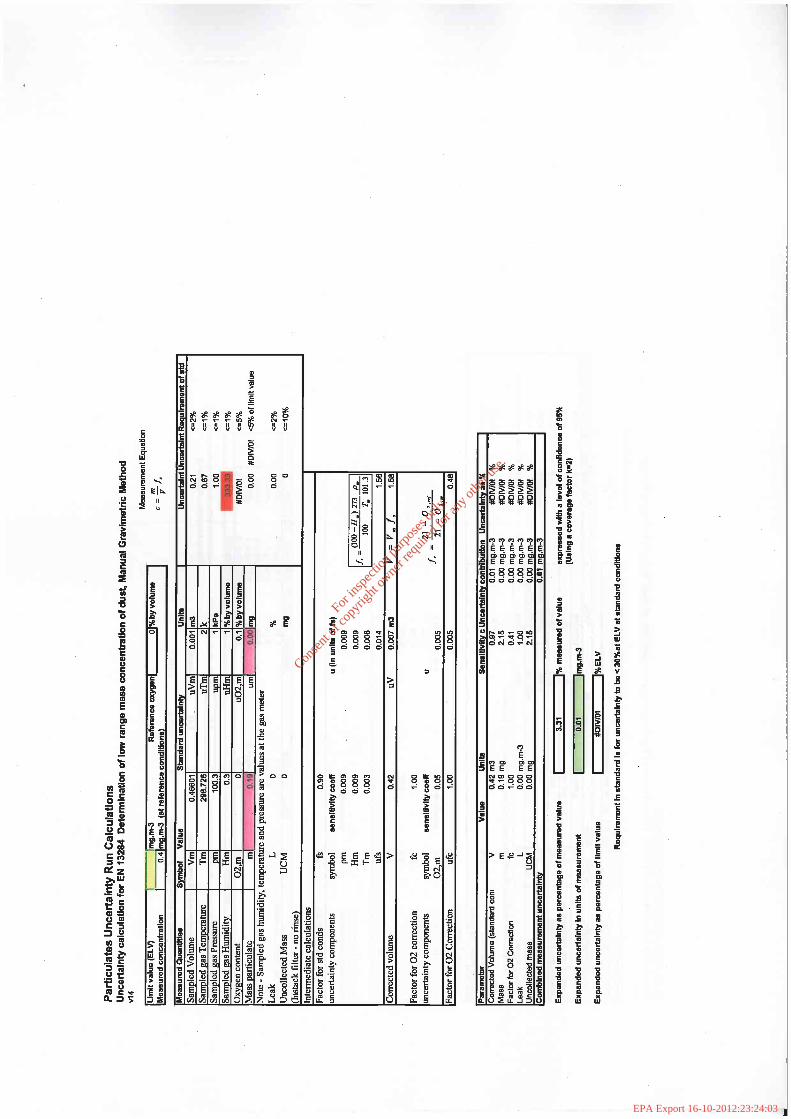
For
insp
ectio
n pur
pose
s only
.
Conse
nt of
copy
right
owne
r req
uired
for a
ny ot
her u
se.
EPA Export 16-10-2012:23:24:03
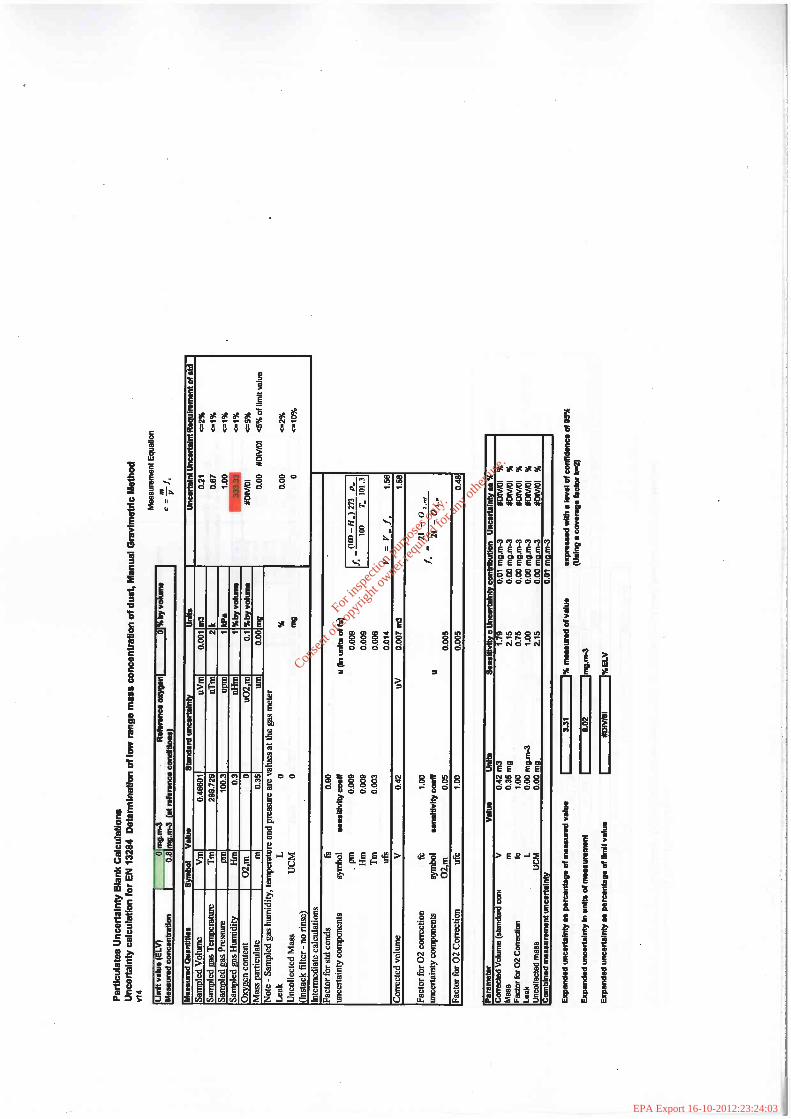
For
insp
ectio
n pur
pose
s only
.
Conse
nt of
copy
right
owne
r req
uired
for a
ny ot
her u
se.
EPA Export 16-10-2012:23:24:03

Printed on
Recycled Paper
Noise Assessment of
Stack Emission Point (A2-8) For
KKMMKK MMEETTAALLSS RREECCYYCCLLIINNGG LLTTDD..
CAPPINCUR INDUSTRIAL ESTATE, DAINGEAN
ROAD, TULLAMORE, CO. OFFALY
November 2011
For
insp
ectio
n pur
pose
s only
.
Conse
nt of
copy
right
owne
r req
uired
for a
ny ot
her u
se.
EPA Export 16-10-2012:23:24:03

November 2011 KMK METALS RECYCLING LTD
Noise Assessment of D-WEEE Plant (Building)
ENVIROCO Management Ltd I
For
insp
ectio
n pur
pose
s only
.
Conse
nt of
copy
right
owne
r req
uired
for a
ny ot
her u
se.
EPA Export 16-10-2012:23:24:03
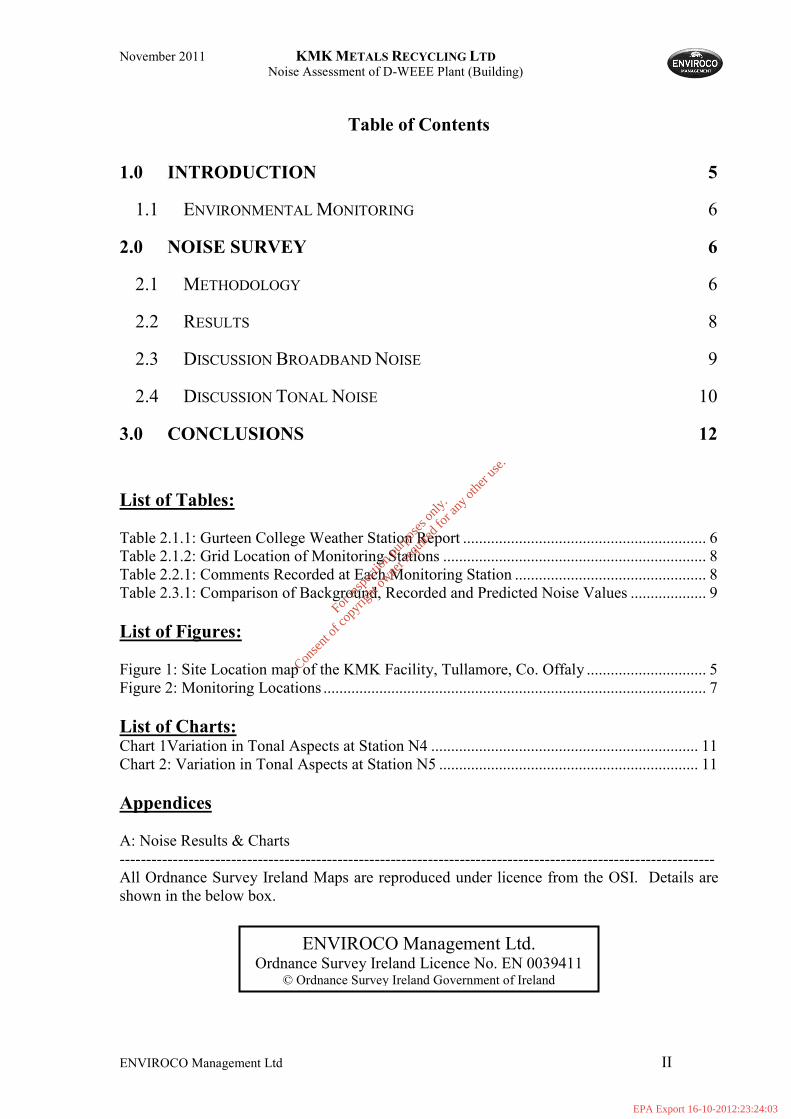
November 2011 KMK METALS RECYCLING LTD
Noise Assessment of D-WEEE Plant (Building)
ENVIROCO Management Ltd II
ENVIROCO Management Ltd. Ordnance Survey Ireland Licence No. EN 0039411
© Ordnance Survey Ireland Government of Ireland
Table of Contents
1.0 INTRODUCTION 5
1.1 ENVIRONMENTAL MONITORING 6
2.0 NOISE SURVEY 6
2.1 METHODOLOGY 6
2.2 RESULTS 8
2.3 DISCUSSION BROADBAND NOISE 9
2.4 DISCUSSION TONAL NOISE 10
3.0 CONCLUSIONS 12
List of Tables:
Table 2.1.1: Gurteen College Weather Station Report ............................................................. 6
Table 2.1.2: Grid Location of Monitoring Stations .................................................................. 8
Table 2.2.1: Comments Recorded at Each Monitoring Station ................................................ 8
Table 2.3.1: Comparison of Background, Recorded and Predicted Noise Values ................... 9
List of Figures:
Figure 1: Site Location map of the KMK Facility, Tullamore, Co. Offaly .............................. 5
Figure 2: Monitoring Locations ................................................................................................ 7
List of Charts: Chart 1Variation in Tonal Aspects at Station N4 ................................................................... 11
Chart 2: Variation in Tonal Aspects at Station N5 ................................................................. 11
Appendices
A: Noise Results & Charts
----------------------------------------------------------------------------------------------------------------
All Ordnance Survey Ireland Maps are reproduced under licence from the OSI. Details are
shown in the below box.
For
insp
ectio
n pur
pose
s only
.
Conse
nt of
copy
right
owne
r req
uired
for a
ny ot
her u
se.
EPA Export 16-10-2012:23:24:03
November 2011 KMK METALS RECYCLING LTD
Noise Assessment of D-WEEE Plant (Building)
ENVIROCO Management Ltd III
For
insp
ectio
n pur
pose
s only
.
Conse
nt of
copy
right
owne
r req
uired
for a
ny ot
her u
se.
EPA Export 16-10-2012:23:24:03
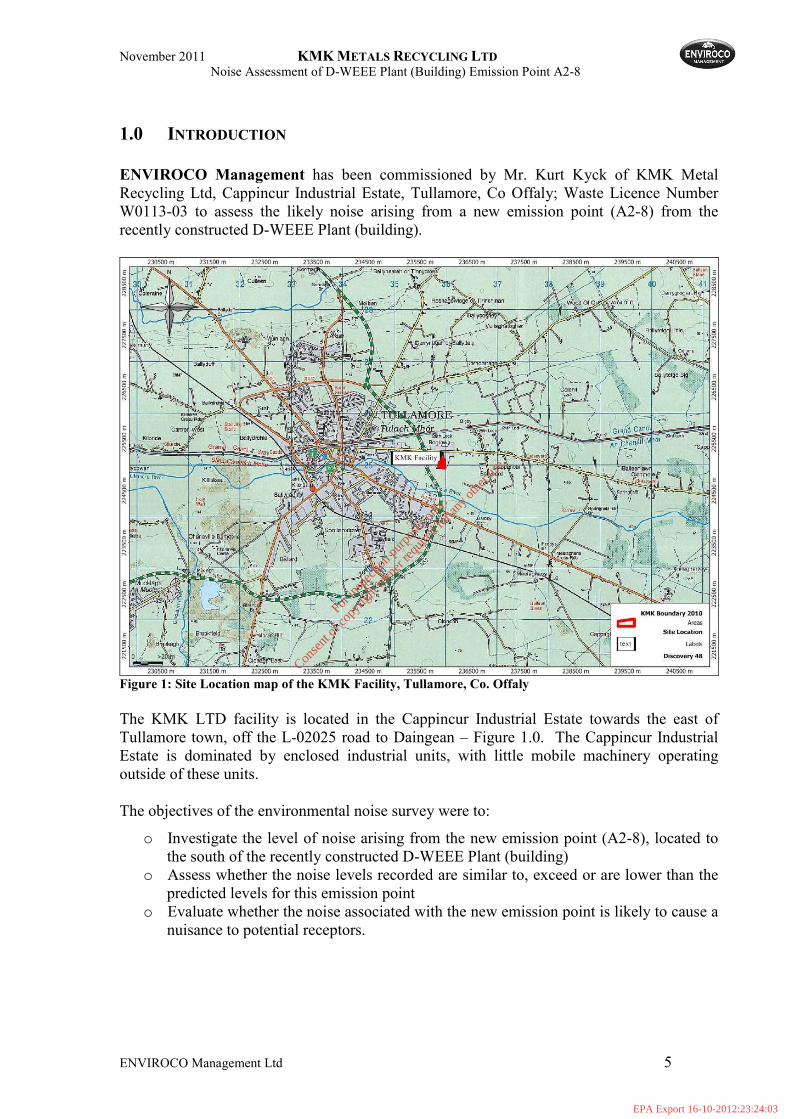
November 2011 KMK METALS RECYCLING LTD
Noise Assessment of D-WEEE Plant (Building) Emission Point A2-8
ENVIROCO Management Ltd 5
1.0 INTRODUCTION
ENVIROCO Management has been commissioned by Mr. Kurt Kyck of KMK Metal
Recycling Ltd, Cappincur Industrial Estate, Tullamore, Co Offaly; Waste Licence Number
W0113-03 to assess the likely noise arising from a new emission point (A2-8) from the
recently constructed D-WEEE Plant (building).
Figure 1: Site Location map of the KMK Facility, Tullamore, Co. Offaly
The KMK LTD facility is located in the Cappincur Industrial Estate towards the east of
Tullamore town, off the L-02025 road to Daingean – Figure 1.0. The Cappincur Industrial
Estate is dominated by enclosed industrial units, with little mobile machinery operating
outside of these units.
The objectives of the environmental noise survey were to:
o Investigate the level of noise arising from the new emission point (A2-8), located to the south of the recently constructed D-WEEE Plant (building)
o Assess whether the noise levels recorded are similar to, exceed or are lower than the predicted levels for this emission point
o Evaluate whether the noise associated with the new emission point is likely to cause a nuisance to potential receptors.
For
insp
ectio
n pur
pose
s only
.
Conse
nt of
copy
right
owne
r req
uired
for a
ny ot
her u
se.
EPA Export 16-10-2012:23:24:03
November 2011 KMK METALS RECYCLING LTD
Noise Assessment of D-WEEE Plant (Building) Emission Point A2-8
ENVIROCO Management Ltd 6
1.1 ENVIRONMENTAL MONITORING
ENVIROCO Management was commissioned by KMK Metals Recycling LTD,
Cappincur Industrial Estate, Tullamore, Co Offaly to carry out environmental noise
monitoring at the new emission point (A2-8) from the D-WEEE Plant (Building).
Monitoring occurred on the 10th November 2011. Monitoring took place during the
course of a normal working day.
2.0 NOISE SURVEY
Noise has many sources, both manmade and environmental. Noise is observer defined, as
levels unacceptable to one person may be perceived as necessary or enjoyable to another. As
such the monitoring of noise is primarily an observational discipline requiring a full
identification of the sources of possible noise and the type of sound that is been emitted
(continuous, intermittent, tonal, broad-spectrum, single source, multiple source). The
Environmental Protection Agency (EPA) has adopted a noise level (as a continuous
equivalent noise reading – Leq) of 55 dB(A) as an indicator of annoyance due to noise
arising from industrial activity.
2.1 METHODOLOGY
Noise monitoring was carried out to the International Standard ISO 1996/1
“Acoustics – Description & measurement of environmental noise”, using a Type 1
Bruel Kjaer 2250 Sound Level Meter with outdoor equipment that was fully
calibrated prior to and after the monitoring event. The meter was set to Fast Response
with an effective averaging time of 0.25sec during noise monitoring. All noise
monitoring was ‘A’ weighted which attenuates low frequencies strongly so noise
measuring is more specific to human hearing and environmental noise.
Noise monitoring was carried out on the 10th November 2011. The KMK facility in
the Cappincur Industrial Estate does not operate over night; therefore noise
monitoring was not carried out overnight. Each monitoring location is identified on
the map shown in Figure 2.1.1.
Weather conditions during sampling were; bright and sunny with a light breeze
changing to a moderate breeze as the morning progressed.
Table 2.1.1: Gurteen College Weather Station Report
REPORTS FROM GURTEEN WEATHER STATION
Date Rainfall
(mm)
Max
Temp
Min
Temp
Sunshine
(hours)
Gusts Wind speed
(knots)
10/11/2011 0.1 14.2 8.2 - - 11
The monitoring equipment was manned throughout the sampling period and
comments/notes taken to assist the interpretation and assessment of results.
For
insp
ectio
n pur
pose
s only
.
Conse
nt of
copy
right
owne
r req
uired
for a
ny ot
her u
se.
EPA Export 16-10-2012:23:24:03
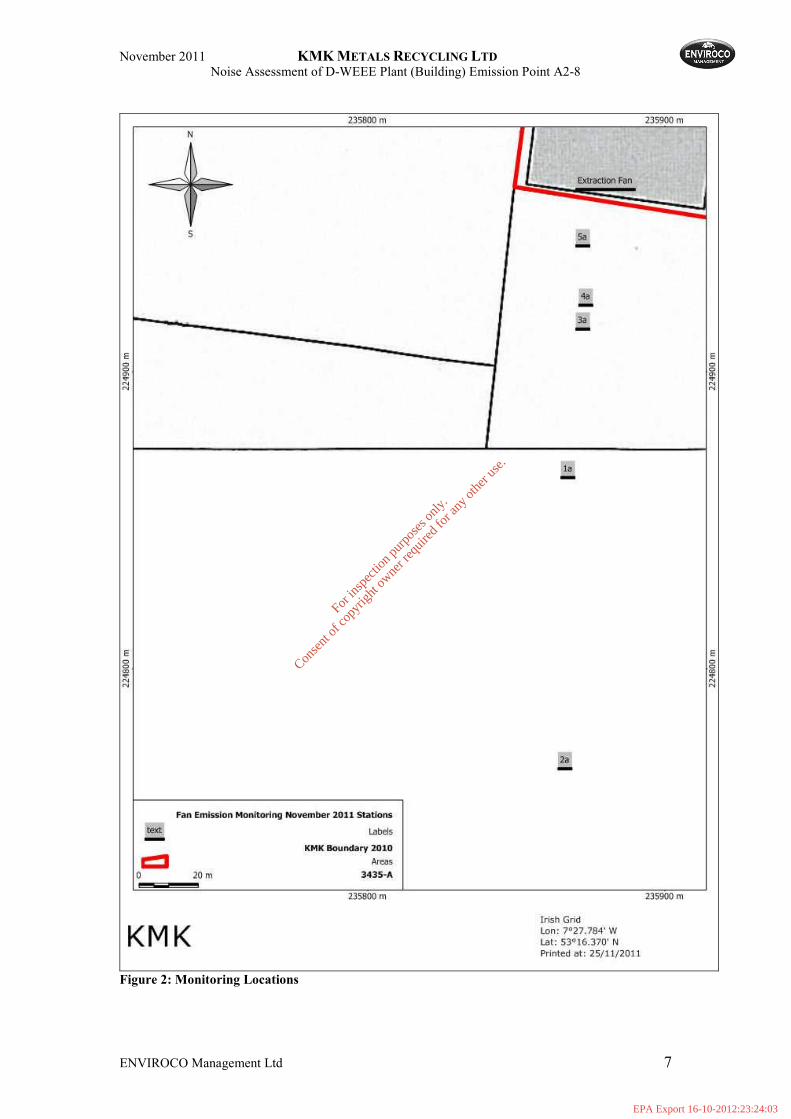
November 2011 KMK METALS RECYCLING LTD
Noise Assessment of D-WEEE Plant (Building) Emission Point A2-8
ENVIROCO Management Ltd 7
Figure 2: Monitoring Locations
For
insp
ectio
n pur
pose
s only
.
Conse
nt of
copy
right
owne
r req
uired
for a
ny ot
her u
se.
EPA Export 16-10-2012:23:24:03
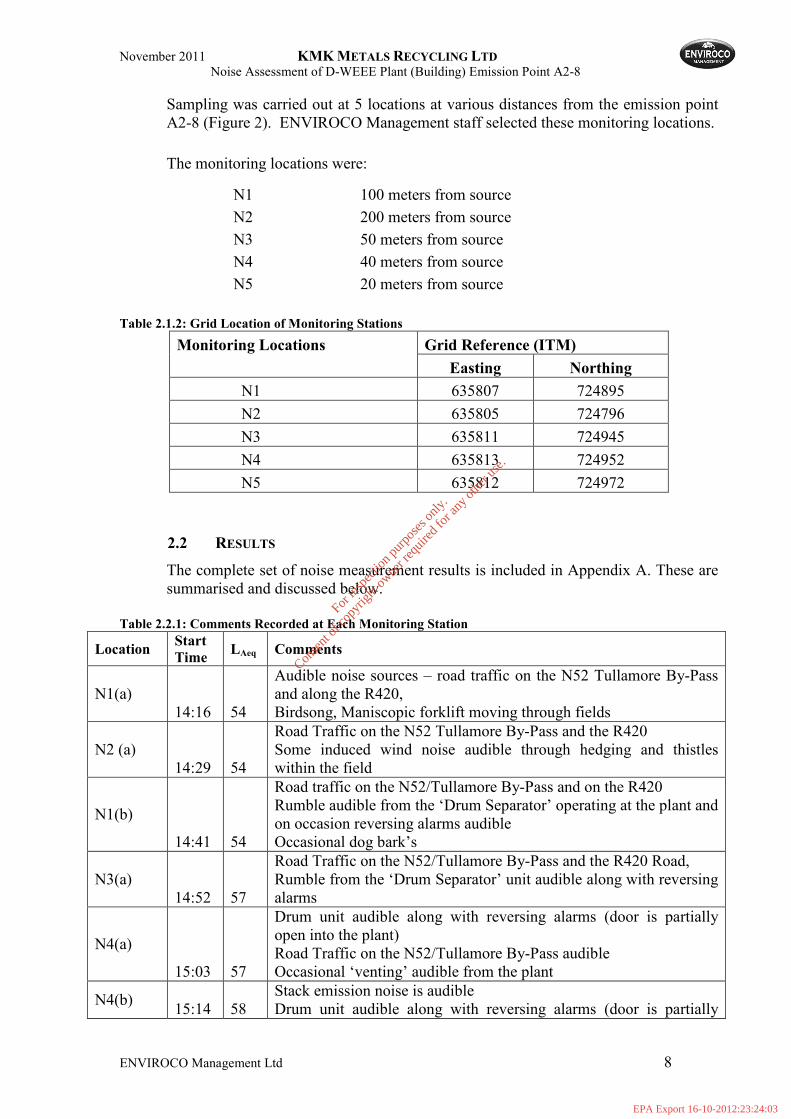
November 2011 KMK METALS RECYCLING LTD
Noise Assessment of D-WEEE Plant (Building) Emission Point A2-8
ENVIROCO Management Ltd 8
Sampling was carried out at 5 locations at various distances from the emission point
A2-8 (Figure 2). ENVIROCO Management staff selected these monitoring locations.
The monitoring locations were:
N1 100 meters from source
N2 200 meters from source
N3 50 meters from source
N4 40 meters from source
N5 20 meters from source
Table 2.1.2: Grid Location of Monitoring Stations
Grid Reference (ITM) Monitoring Locations
Easting Northing
N1 635807 724895
N2 635805 724796
N3 635811 724945
N4 635813 724952
N5 635812 724972
2.2 RESULTS
The complete set of noise measurement results is included in Appendix A. These are
summarised and discussed below.
Table 2.2.1: Comments Recorded at Each Monitoring Station
Location Start Time
LAeq Comments
N1(a)
14:16 54
Audible noise sources – road traffic on the N52 Tullamore By-Pass
and along the R420,
Birdsong, Maniscopic forklift moving through fields
N2 (a)
14:29 54
Road Traffic on the N52 Tullamore By-Pass and the R420
Some induced wind noise audible through hedging and thistles
within the field
N1(b)
14:41 54
Road traffic on the N52/Tullamore By-Pass and on the R420
Rumble audible from the ‘Drum Separator’ operating at the plant and
on occasion reversing alarms audible
Occasional dog bark’s
N3(a)
14:52 57
Road Traffic on the N52/Tullamore By-Pass and the R420 Road,
Rumble from the ‘Drum Separator’ unit audible along with reversing
alarms
N4(a)
15:03 57
Drum unit audible along with reversing alarms (door is partially
open into the plant)
Road Traffic on the N52/Tullamore By-Pass audible
Occasional ‘venting’ audible from the plant
N4(b) 15:14 58
Stack emission noise is audible
Drum unit audible along with reversing alarms (door is partially
For
insp
ectio
n pur
pose
s only
.
Conse
nt of
copy
right
owne
r req
uired
for a
ny ot
her u
se.
EPA Export 16-10-2012:23:24:03
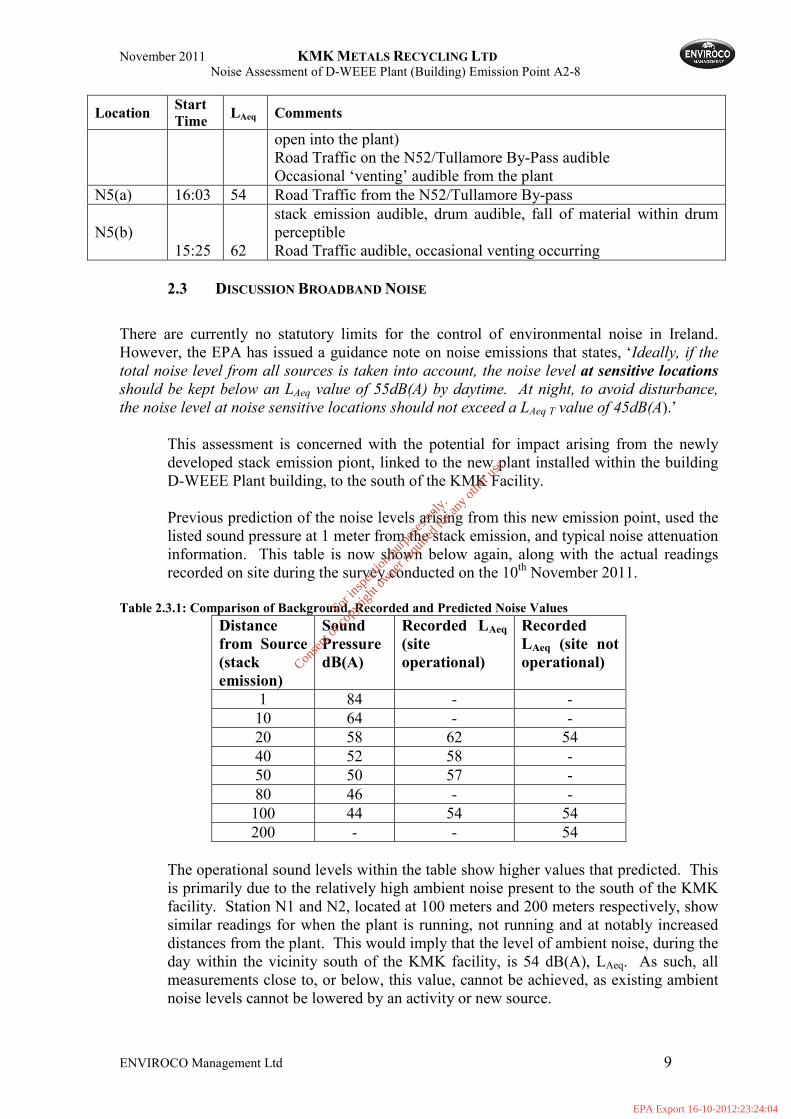
November 2011 KMK METALS RECYCLING LTD
Noise Assessment of D-WEEE Plant (Building) Emission Point A2-8
ENVIROCO Management Ltd 9
Location Start Time
LAeq Comments
open into the plant)
Road Traffic on the N52/Tullamore By-Pass audible
Occasional ‘venting’ audible from the plant
N5(a) 16:03 54 Road Traffic from the N52/Tullamore By-pass
N5(b)
15:25 62
stack emission audible, drum audible, fall of material within drum
perceptible
Road Traffic audible, occasional venting occurring
2.3 DISCUSSION BROADBAND NOISE
There are currently no statutory limits for the control of environmental noise in Ireland.
However, the EPA has issued a guidance note on noise emissions that states, ‘Ideally, if the
total noise level from all sources is taken into account, the noise level at sensitive locations
should be kept below an LAeq value of 55dB(A) by daytime. At night, to avoid disturbance,
the noise level at noise sensitive locations should not exceed a LAeq T value of 45dB(A).’
This assessment is concerned with the potential for impact arising from the newly
developed stack emission piont, linked to the new plant installed within the building
D-WEEE Plant building, to the south of the KMK Facility.
Previous prediction of the noise levels arising from this new emission point, used the
listed sound pressure at 1 meter from the stack emission, and typical noise attenuation
information. This table is now shown below again, along with the actual readings
recorded on site during the survey conducted on the 10th November 2011.
Table 2.3.1: Comparison of Background, Recorded and Predicted Noise Values
Distance
from Source
(stack
emission)
Sound
Pressure
dB(A)
Recorded LAeq
(site
operational)
Recorded
LAeq (site not
operational)
1 84 - -
10 64 - -
20 58 62 54
40 52 58 -
50 50 57 -
80 46 - -
100 44 54 54
200 - - 54
The operational sound levels within the table show higher values that predicted. This
is primarily due to the relatively high ambient noise present to the south of the KMK
facility. Station N1 and N2, located at 100 meters and 200 meters respectively, show
similar readings for when the plant is running, not running and at notably increased
distances from the plant. This would imply that the level of ambient noise, during the
day within the vicinity south of the KMK facility, is 54 dB(A), LAeq. As such, all
measurements close to, or below, this value, cannot be achieved, as existing ambient
noise levels cannot be lowered by an activity or new source.
For
insp
ectio
n pur
pose
s only
.
Conse
nt of
copy
right
owne
r req
uired
for a
ny ot
her u
se.
EPA Export 16-10-2012:23:24:04
November 2011 KMK METALS RECYCLING LTD
Noise Assessment of D-WEEE Plant (Building) Emission Point A2-8
ENVIROCO Management Ltd 10
It is normally assessed that where ambient noise levels are relatively high, it takes a
minimum of a tonal aspect or 3dB increase above the ambient for a noise source to
become noticeable. Taking an ambient measurement of 54 dB(A) this requires that
the new noise source either must show a tonal feature or be a minimum Leq of
57dB(A) to become noticeable.
At distances of 50 meters, the recorded on site Leq values show the site attenuates to
57 dB. Therefore it is likely that at distances greater than 50 meters south of the noise
source, the noise arising from the stack emission’s will not cause nuisance, and at
greater distances will not be audible above current ambient noise levels.
Higher levels of noise are present in closer proximity to the stack emission than
predicted. This is due to the following:
• The prediction was conducted based upon stack noise emission in isolation
• Monitoring recorded the stack noise emission, along with relatively high
ambient noise (approximately Leq of 54 dB(A)), existing facility noise and
facility noise arising from within the new D-WEEE Plant (building), due to
the rear roller doors been partially open.
It is understood that when the facility is fully operational, the roller doors to the rear
of the plant will not be required to be left open, which will significantly reduce the
level of noise audible from within the D-WEEE Plant (building).
2.4 DISCUSSION TONAL NOISE
Full page diagrams and information on the 1/3 octave analysis from the monitoring
event are shown in Appendix A. This chapter is interested in the likelihood or not of
a tonal noise arising from the operation of the new stack emission, erected at the
KMK facility.
The acoustician notes, show that the stack emission was only audible at 2 monitoring
events – N5 (b) at a distance of 20 meters from the facility, and at station N4(b) at 40
meters. Both of these stations were repeated when the stack emission noise was not
audible. This gave a distinct capability to assess for tonal aspects from the new stack
emission unit.
Charts 1 & 2 compare the 1/3 octave results for both stations side by side. The charts
clearly show that at both (b) events – when the stack emission noise was audible, a
notable peak occurred at 31.5 Hz.
Station N4(b) this peaks at 68dBZ, while at station N5(b) the peak occurs at 73
dB(Z). A distinctive decrease of nearly 6 dB with a doubling of distance from the
likely sound source is present.
It is therefore likely that the new emission point has a distinctive tonal feature at
31.5Hz, which decreases with distance from the stack emission point.
For
insp
ectio
n pur
pose
s only
.
Conse
nt of
copy
right
owne
r req
uired
for a
ny ot
her u
se.
EPA Export 16-10-2012:23:24:04
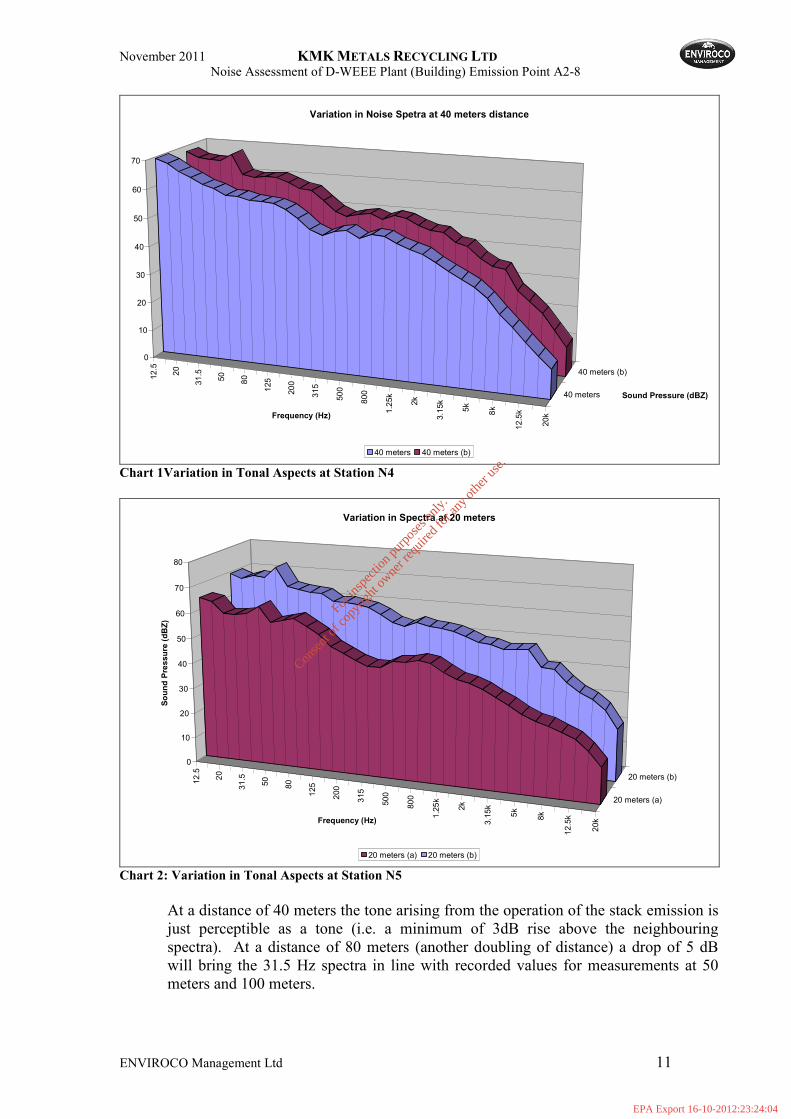
November 2011 KMK METALS RECYCLING LTD
Noise Assessment of D-WEEE Plant (Building) Emission Point A2-8
ENVIROCO Management Ltd 11
12.5
20
31.5
50
80
125
200
315
500
800
1.25k
2k
3.15k
5k
8k
12.5k
20k
40 meters
40 meters (b)
0
10
20
30
40
50
60
70
Frequency (Hz)
Sound Pressure (dBZ)
Variation in Noise Spetra at 40 meters distance
40 meters 40 meters (b)
Chart 1Variation in Tonal Aspects at Station N4
12.5
20
31.5
50
80
125
200
315
500
800
1.25k
2k
3.15k
5k
8k
12.5k
20k
20 meters (a)
20 meters (b)
0
10
20
30
40
50
60
70
80
Sound Pressure (dBZ)
Frequency (Hz)
Variation in Spectra at 20 meters
20 meters (a) 20 meters (b)
Chart 2: Variation in Tonal Aspects at Station N5
At a distance of 40 meters the tone arising from the operation of the stack emission is
just perceptible as a tone (i.e. a minimum of 3dB rise above the neighbouring
spectra). At a distance of 80 meters (another doubling of distance) a drop of 5 dB
will bring the 31.5 Hz spectra in line with recorded values for measurements at 50
meters and 100 meters.
For
insp
ectio
n pur
pose
s only
.
Conse
nt of
copy
right
owne
r req
uired
for a
ny ot
her u
se.
EPA Export 16-10-2012:23:24:04
November 2011 KMK METALS RECYCLING LTD
Noise Assessment of D-WEEE Plant (Building) Emission Point A2-8
ENVIROCO Management Ltd 12
Therefore it is not likely that the tonal aspect will affect any sensitive receptors. The
development does have a slight tonal aspect at distances up to 40 meters from the
source.
No other tonal aspects are visible on the 1/3 octave data concerning stations where the
stack emission was audible. No tones were recorded at higher frequencies (between
800 Hz to 20kHz).
3.0 CONCLUSIONS
ENVIROCO Management Ltd conducted a noise assessment in the green field to the south of
the newly constructed D-WEEE Plant (building) at the KMK facility, Tullamore.
This monitoring was carried out to assess the accuracy of predictions conducted on the basis
of a new stack emission point (A2-8) that was to be installed, and to assess whether or not
this new emission point is likely to cause a nuisance.
The land to the south of the KMK facility is currently green-field. There are no dwellings or
places of gathering located between the facility southern boundary and the R420 Tullamore
to Geashill/Portarlington Road.
Ambient noise recorded within the field, when the KMK plant was not operational, show a
LAeq value of 54 dB.
At distances greater than 50 meters, the level of noise arising from the KMK D-WEEE Plant
(building) is significantly low that it is unlikely to be a nuisance (LAeq of 57 dB).
Tonal analysis of the stack emission point (A2-8), show the presence of a tone at 31.5Hz at
20 and 40 meters distance from the stack emission.
Assessment of the data concerning recorded spectral data indicate that at further distances,
this tone is absorbed into the normal ambient and background acoustic environment. This
correlates with the broadband noise conclusion of no likely impact at distances of 50 meters
from the facility.
Levels predicted, prior to the installation of the stack emission were exceeded during the
monitoring event.
The reasons for the higher ‘real world’ levels over the prediction included –
• A higher ambient noise level than assumed in the prediction
• Roller doors to the D-WEEE Plant (building) been open during the survey period
• Activity noise from within the D-WEEE Plant (building) been audible
From the monitoring event and an assessment of the local area to the south of the facility it is
not seen that the new emission point from the D-WEEE Plant (building) will be an acoustical
nuisance. There are no dwellings in proximity; there are no roads to enable dwellings to be
likely built within proximity.
For
insp
ectio
n pur
pose
s only
.
Conse
nt of
copy
right
owne
r req
uired
for a
ny ot
her u
se.
EPA Export 16-10-2012:23:24:04

November 2011 KMK METALS RECYCLING LTD
Noise Assessment of D-WEEE Plant (Building) Emission Point A2-8
ENVIROCO Management Ltd 13
Appendix A
� Noise Results & Charts
For in
spec
tion p
urpo
ses o
nly.
Conse
nt of
copy
right
owne
r req
uired
for a
ny ot
her u
se.
EPA Export 16-10-2012:23:24:04
November 2011 KMK METALS RECYCLING LTD
Noise Assessment of D-WEEE Plant (Building) Emission Point A2-8
ENVIROCO Management Ltd 14
For
insp
ectio
n pur
pose
s only
.
Conse
nt of
copy
right
owne
r req
uired
for a
ny ot
her u
se.
EPA Export 16-10-2012:23:24:04
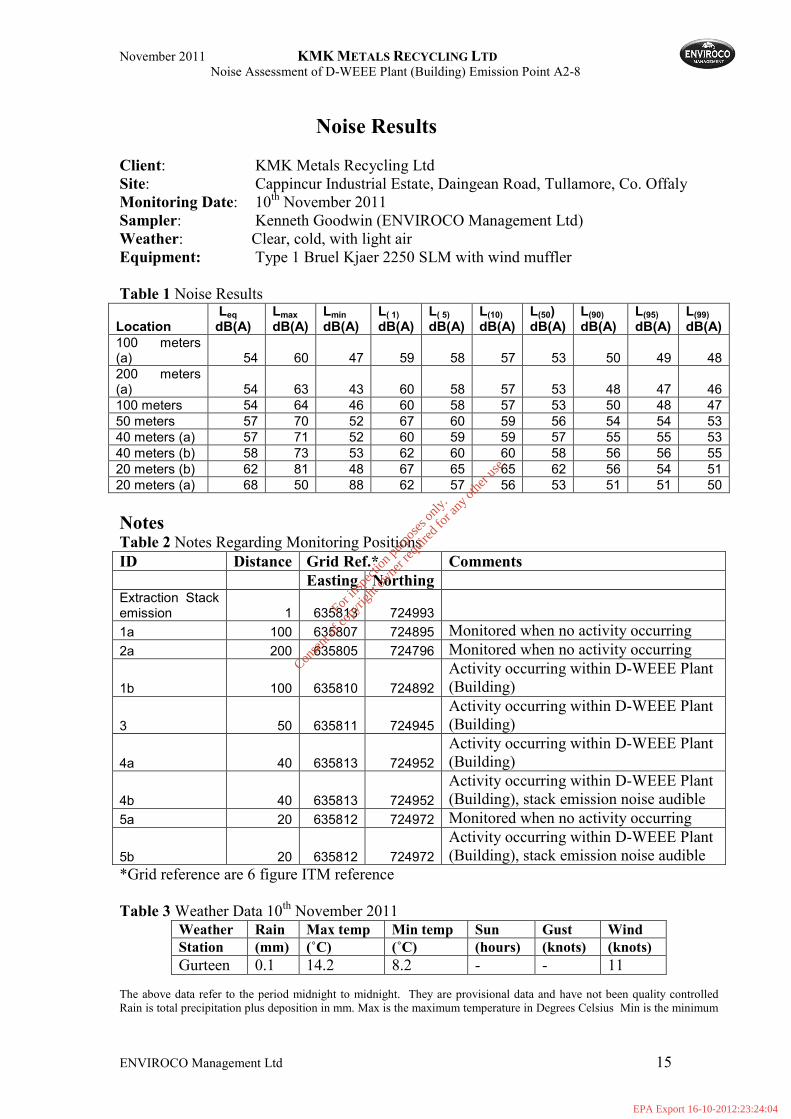
November 2011 KMK METALS RECYCLING LTD
Noise Assessment of D-WEEE Plant (Building) Emission Point A2-8
ENVIROCO Management Ltd 15
Noise Results
Client: KMK Metals Recycling Ltd
Site: Cappincur Industrial Estate, Daingean Road, Tullamore, Co. Offaly
Monitoring Date: 10th November 2011
Sampler: Kenneth Goodwin (ENVIROCO Management Ltd)
Weather: Clear, cold, with light air
Equipment: Type 1 Bruel Kjaer 2250 SLM with wind muffler
Table 1 Noise Results
Location Leq dB(A)
Lmax dB(A)
Lmin dB(A)
L( 1) dB(A)
L( 5) dB(A)
L(10) dB(A)
L(50) dB(A)
L(90) dB(A)
L(95) dB(A)
L(99) dB(A)
100 meters (a) 54 60 47 59 58 57 53 50 49 48
200 meters (a) 54 63 43 60 58 57 53 48 47 46
100 meters 54 64 46 60 58 57 53 50 48 47
50 meters 57 70 52 67 60 59 56 54 54 53
40 meters (a) 57 71 52 60 59 59 57 55 55 53
40 meters (b) 58 73 53 62 60 60 58 56 56 55
20 meters (b) 62 81 48 67 65 65 62 56 54 51
20 meters (a) 68 50 88 62 57 56 53 51 51 50
Notes Table 2 Notes Regarding Monitoring Positions
ID Distance Grid Ref.* Comments
Easting Northing Extraction Stack emission 1 635813 724993
1a 100 635807 724895 Monitored when no activity occurring
2a 200 635805 724796 Monitored when no activity occurring
1b 100 635810 724892
Activity occurring within D-WEEE Plant
(Building)
3 50 635811 724945
Activity occurring within D-WEEE Plant
(Building)
4a 40 635813 724952
Activity occurring within D-WEEE Plant
(Building)
4b 40 635813 724952
Activity occurring within D-WEEE Plant
(Building), stack emission noise audible
5a 20 635812 724972 Monitored when no activity occurring
5b 20 635812 724972
Activity occurring within D-WEEE Plant
(Building), stack emission noise audible
*Grid reference are 6 figure ITM reference
Table 3 Weather Data 10th November 2011
Weather Rain Max temp Min temp Sun Gust Wind
Station (mm) (˚C) (˚C) (hours) (knots) (knots)
Gurteen 0.1 14.2 8.2 - - 11
The above data refer to the period midnight to midnight. They are provisional data and have not been quality controlled
Rain is total precipitation plus deposition in mm. Max is the maximum temperature in Degrees Celsius Min is the minimum
For
insp
ectio
n pur
pose
s only
.
Conse
nt of
copy
right
owne
r req
uired
for a
ny ot
her u
se.
EPA Export 16-10-2012:23:24:04
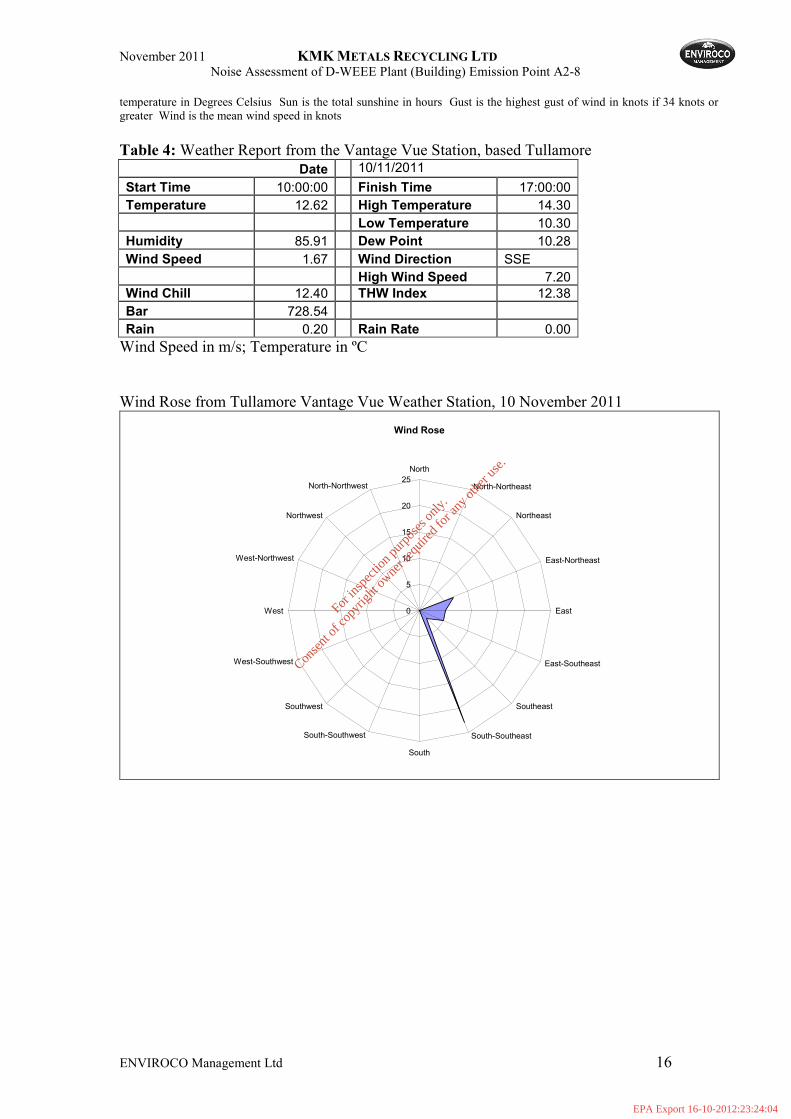
November 2011 KMK METALS RECYCLING LTD
Noise Assessment of D-WEEE Plant (Building) Emission Point A2-8
ENVIROCO Management Ltd 16
temperature in Degrees Celsius Sun is the total sunshine in hours Gust is the highest gust of wind in knots if 34 knots or
greater Wind is the mean wind speed in knots
Table 4: Weather Report from the Vantage Vue Station, based Tullamore
Date 10/11/2011
Start Time 10:00:00 Finish Time 17:00:00
Temperature 12.62 High Temperature 14.30
Low Temperature 10.30
Humidity 85.91 Dew Point 10.28
Wind Speed 1.67 Wind Direction SSE
High Wind Speed 7.20
Wind Chill 12.40 THW Index 12.38
Bar 728.54
Rain 0.20 Rain Rate 0.00
Wind Speed in m/s; Temperature in ºC
Wind Rose from Tullamore Vantage Vue Weather Station, 10 November 2011
Wind Rose
0
5
10
15
20
25
North
North-Northeast
Northeast
East-Northeast
East
East-Southeast
Southeast
South-Southeast
South
South-Southwest
Southwest
West-Southwest
West
West-Northwest
Northwest
North-Northwest
For
insp
ectio
n pur
pose
s only
.
Conse
nt of
copy
right
owne
r req
uired
for a
ny ot
her u
se.
EPA Export 16-10-2012:23:24:04
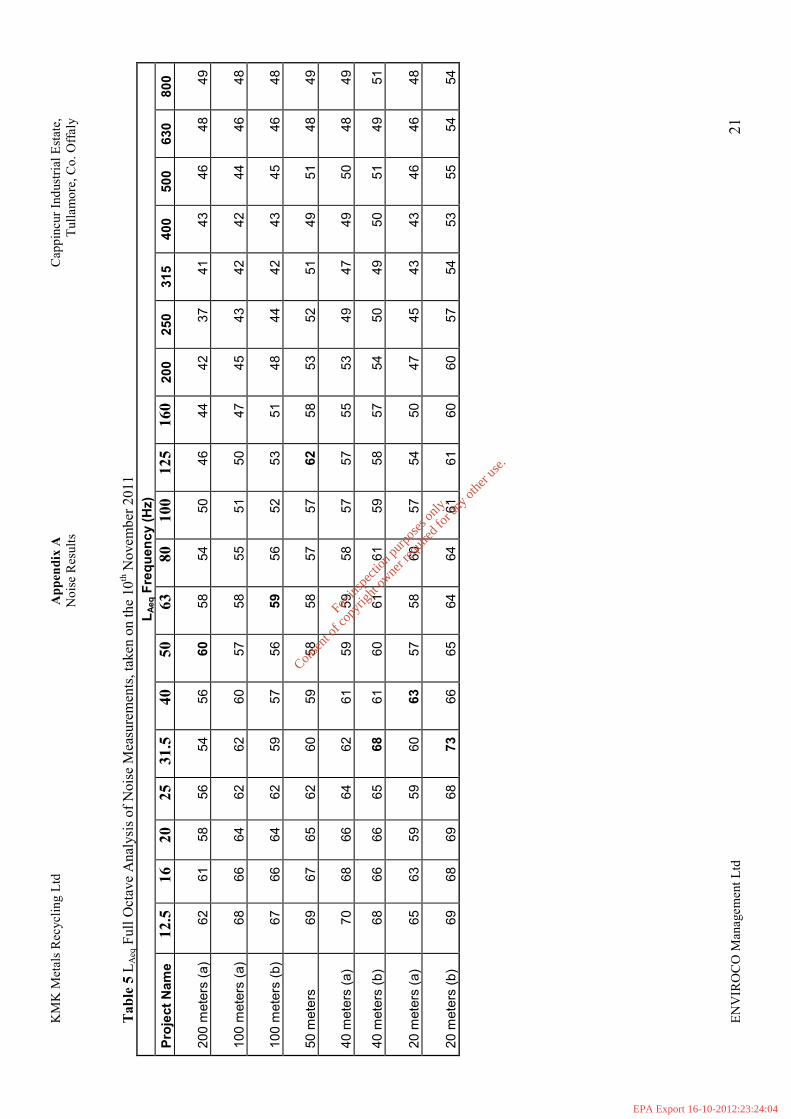
KMK Metals Recycling Ltd
Appendix A
Cappincur Industrial Estate,
Noise Results
Tullamore, Co. Offaly
ENVIROCO Management Ltd
21
Table 5 L
Aeq Full Octave Analysis of Noise Measurements, taken on the 10th November 2011
LAeq Frequency (Hz)
Project Name
12.5
16
20
25 31.5
40
50
63
80
100
125
160
200
250
315
400
500
630
800
200 meters (a)
62
61
58
56
54
56
60
58
54
50
46
44
42
37
41
43
46
48
49
100 meters (a)
68
66
64
62
62
60
57
58
55
51
50
47
45
43
42
42
44
46
48
100 meters (b)
67
66
64
62
59
57
56
59
56
52
53
51
48
44
42
43
45
46
48
50 meters
69
67
65
62
60
59
58
58
57
57
62
58
53
52
51
49
51
48
49
40 meters (a)
70
68
66
64
62
61
59
59
58
57
57
55
53
49
47
49
50
48
49
40 meters (b)
68
66
66
65
68
61
60
61
61
59
58
57
54
50
49
50
51
49
51
20 meters (a)
65
63
59
59
60
63
57
58
60
57
54
50
47
45
43
43
46
46
48
20 meters (b)
69
68
69
68
73
66
65
64
64
61
61
60
60
57
54
53
55
54
54
For
insp
ectio
n pur
pose
s only
.
Conse
nt of
copy
right
owne
r req
uired
for a
ny ot
her u
se.
EPA Export 16-10-2012:23:24:04
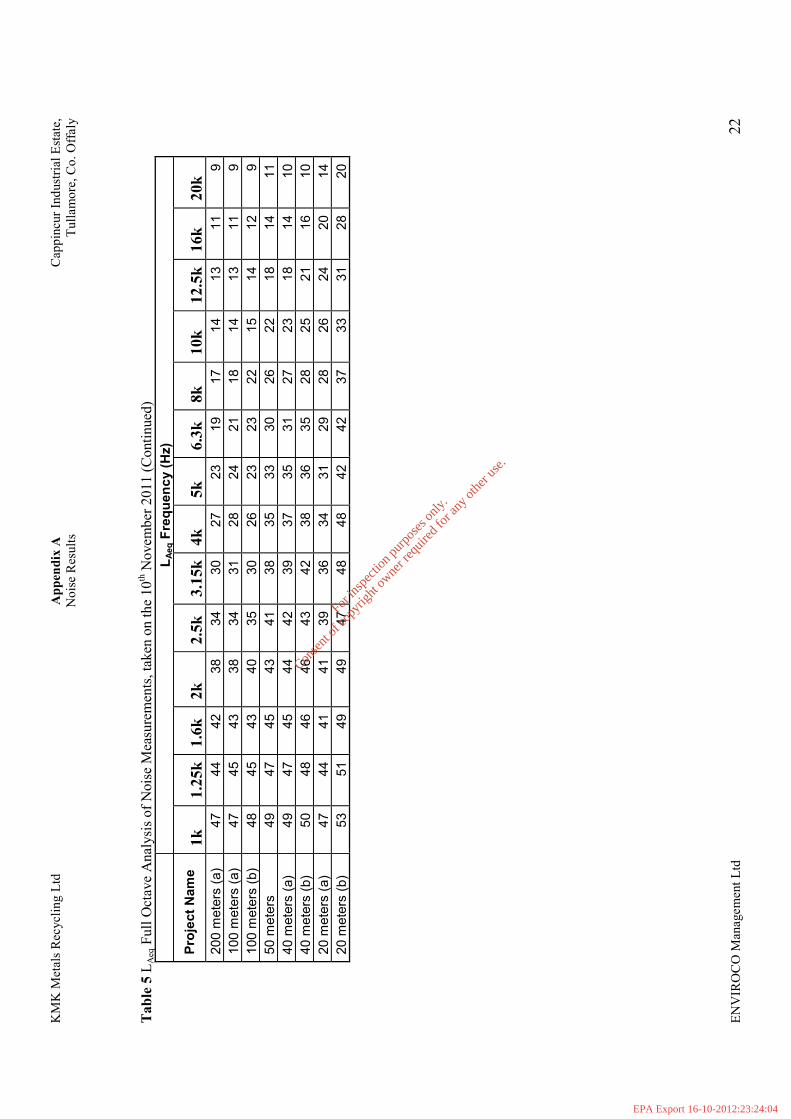
KMK Metals Recycling Ltd
Appendix A
Cappincur Industrial Estate,
Noise Results
Tullamore, Co. Offaly
ENVIROCO Management Ltd
22
Table 5 L
Aeq Full Octave Analysis of Noise Measurements, taken on the 10th November 2011 (Continued)
LAeq Frequency (Hz)
Project Name
1k
1.25k 1.6k 2k
2.5k 3.15k 4k
5k
6.3k 8k
10k
12.5k 16k
20k
200 meters (a)
47
44
42
38
34
30
27
23
19
17
14
13
11
9
100 meters (a)
47
45
43
38
34
31
28
24
21
18
14
13
11
9
100 meters (b)
48
45
43
40
35
30
26
23
23
22
15
14
12
9
50 meters
49
47
45
43
41
38
35
33
30
26
22
18
14
11
40 meters (a)
49
47
45
44
42
39
37
35
31
27
23
18
14
10
40 meters (b)
50
48
46
46
43
42
38
36
35
28
25
21
16
10
20 meters (a)
47
44
41
41
39
36
34
31
29
28
26
24
20
14
20 meters (b)
53
51
49
49
47
48
48
42
42
37
33
31
28
20
For
insp
ectio
n pur
pose
s only
.
Conse
nt of
copy
right
owne
r req
uired
for a
ny ot
her u
se.
EPA Export 16-10-2012:23:24:04
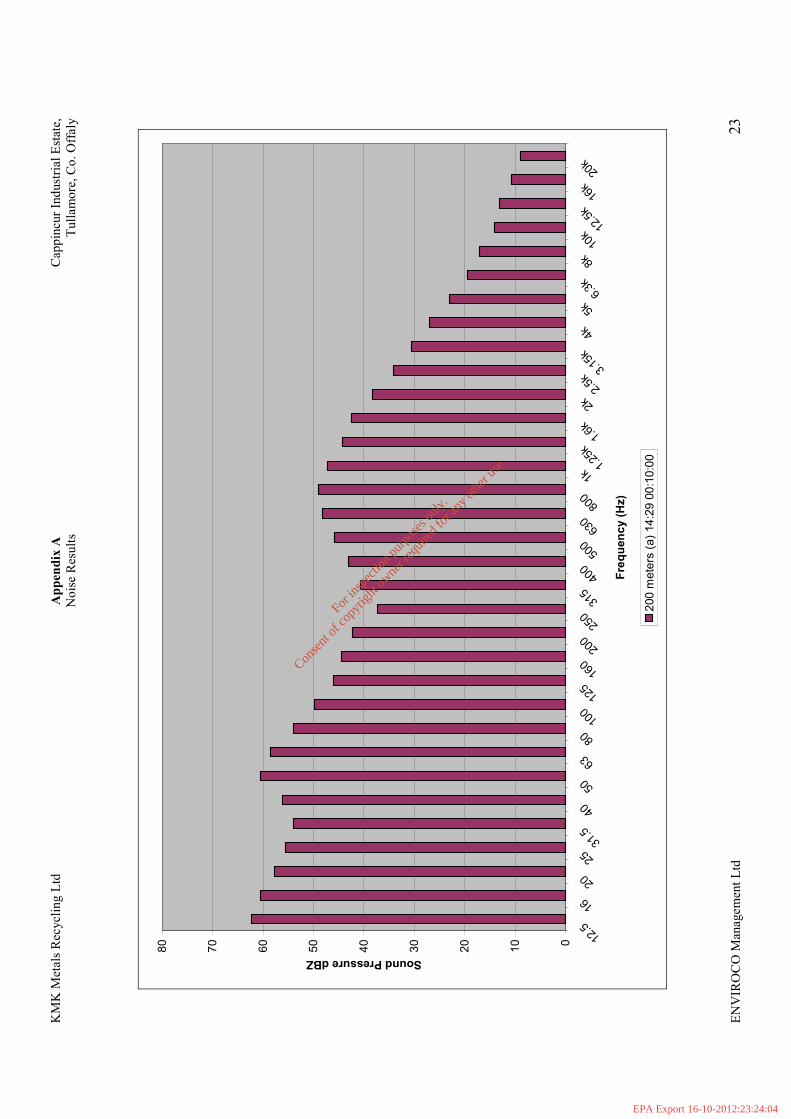
KMK Metals Recycling Ltd
Appendix A
Cappincur Industrial Estate,
Noise Results
Tullamore, Co. Offaly
ENVIROCO Management Ltd
23
0
10
20
30
40
50
60
70
80
12.5
16
20
2531
.5
40
50
63
80
100
125
160
200
250
315
400
500
630
800
1k
1.25k 1.6k
2k 2.5k
3.15k
4k
5k 6.3k
8k 10k 12.5k 16k 20k
Frequency (Hz)
Sound Pressure dBZ
200 meters (a) 14:29 00:10:00
For in
spec
tion p
urpo
ses o
nly.
Conse
nt of
copy
right
owne
r req
uired
for a
ny ot
her u
se.
EPA Export 16-10-2012:23:24:04
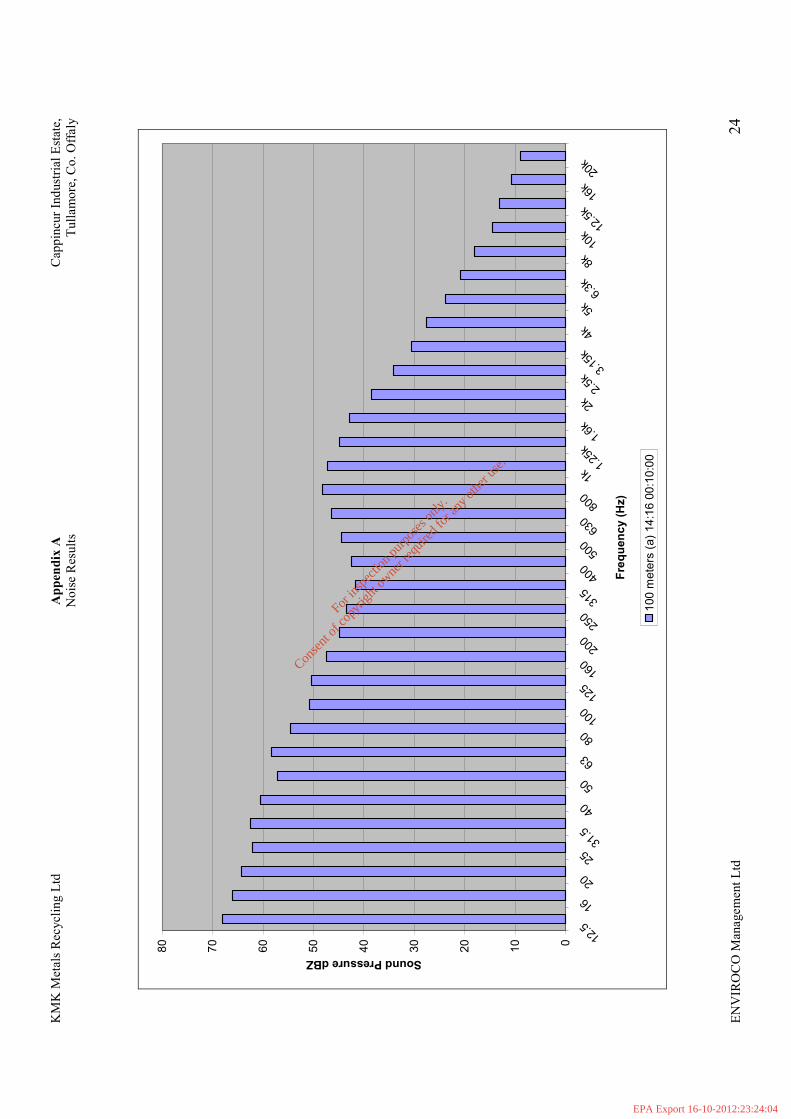
KMK Metals Recycling Ltd
Appendix A
Cappincur Industrial Estate,
Noise Results
Tullamore, Co. Offaly
ENVIROCO Management Ltd
24
0
10
20
30
40
50
60
70
80
12.5
16
20
2531
.5
40
50
63
80
100
125
160
200
250
315
400
500
630
800
1k
1.25k 1.6k
2k 2.5k
3.15k
4k
5k 6.3k
8k 10k 12.5k 16k 20k
Frequency (Hz)
Sound Pressure dBZ
100 meters (a) 14:16 00:10:00
For in
spec
tion p
urpo
ses o
nly.
Conse
nt of
copy
right
owne
r req
uired
for a
ny ot
her u
se.
EPA Export 16-10-2012:23:24:04
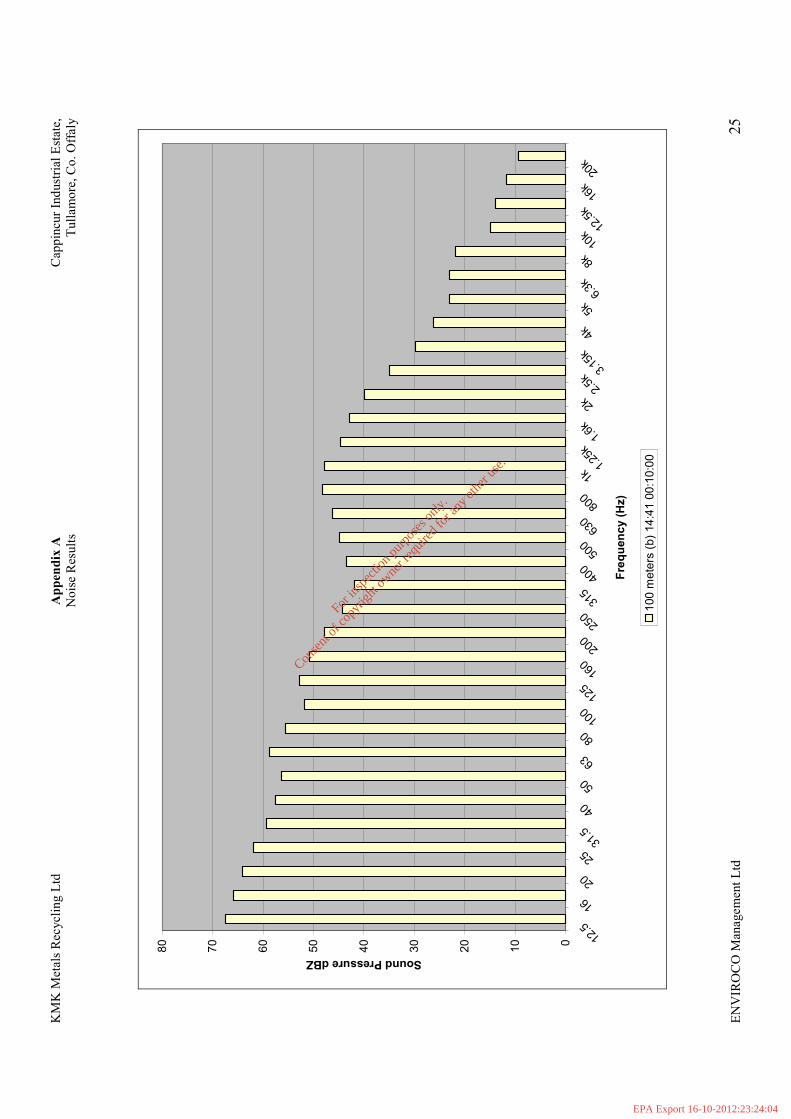
KMK Metals Recycling Ltd
Appendix A
Cappincur Industrial Estate,
Noise Results
Tullamore, Co. Offaly
ENVIROCO Management Ltd
25
0
10
20
30
40
50
60
70
80
12.5
16
20
2531
.5
40
50
63
80
100
125
160
200
250
315
400
500
630
800
1k
1.25k 1.6k
2k 2.5k
3.15k
4k
5k 6.3k
8k 10k 12.5k 16k 20k
Frequency (Hz)
Sound Pressure dBZ
100 meters (b) 14:41 00:10:00
For in
spec
tion p
urpo
ses o
nly.
Conse
nt of
copy
right
owne
r req
uired
for a
ny ot
her u
se.
EPA Export 16-10-2012:23:24:04
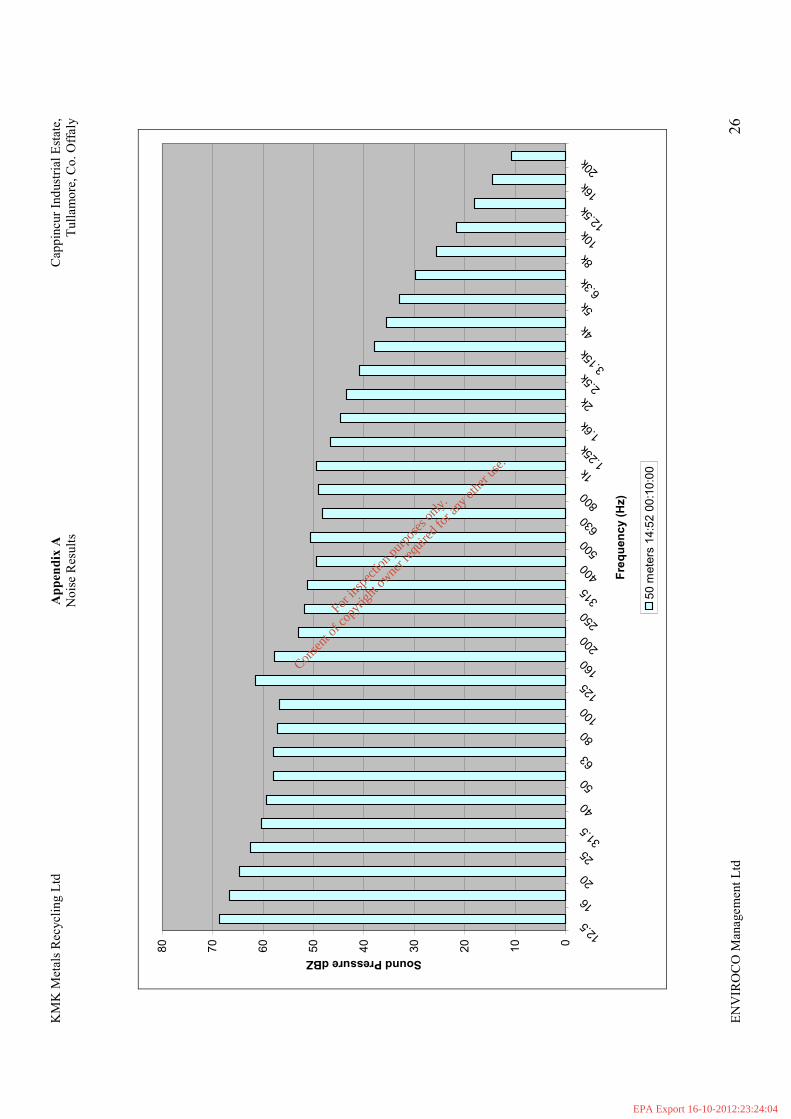
KMK Metals Recycling Ltd
Appendix A
Cappincur Industrial Estate,
Noise Results
Tullamore, Co. Offaly
ENVIROCO Management Ltd
26
0
10
20
30
40
50
60
70
80
12.5
16
20
2531
.5
40
50
63
80
100
125
160
200
250
315
400
500
630
800
1k
1.25k 1.6k
2k 2.5k
3.15k
4k
5k 6.3k
8k 10k 12.5k 16k 20k
Frequency (Hz)
Sound Pressure dBZ
50 meters 14:52 00:10:00
For in
spec
tion p
urpo
ses o
nly.
Conse
nt of
copy
right
owne
r req
uired
for a
ny ot
her u
se.
EPA Export 16-10-2012:23:24:04
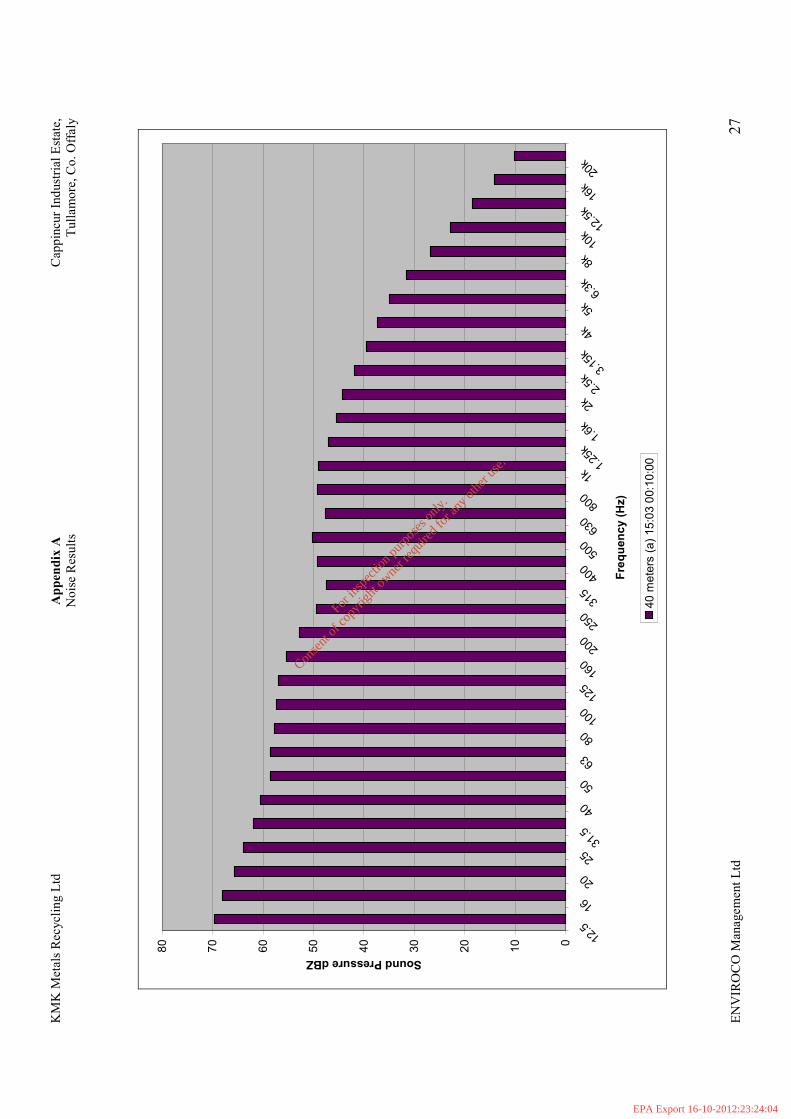
KMK Metals Recycling Ltd
Appendix A
Cappincur Industrial Estate,
Noise Results
Tullamore, Co. Offaly
ENVIROCO Management Ltd
27
0
10
20
30
40
50
60
70
80
12.5
16
20
2531
.5
40
50
63
80
100
125
160
200
250
315
400
500
630
800
1k
1.25k 1.6k
2k 2.5k
3.15k
4k
5k 6.3k
8k 10k 12.5k 16k 20k
Frequency (Hz)
Sound Pressure dBZ
40 meters (a) 15:03 00:10:00
For in
spec
tion p
urpo
ses o
nly.
Conse
nt of
copy
right
owne
r req
uired
for a
ny ot
her u
se.
EPA Export 16-10-2012:23:24:04
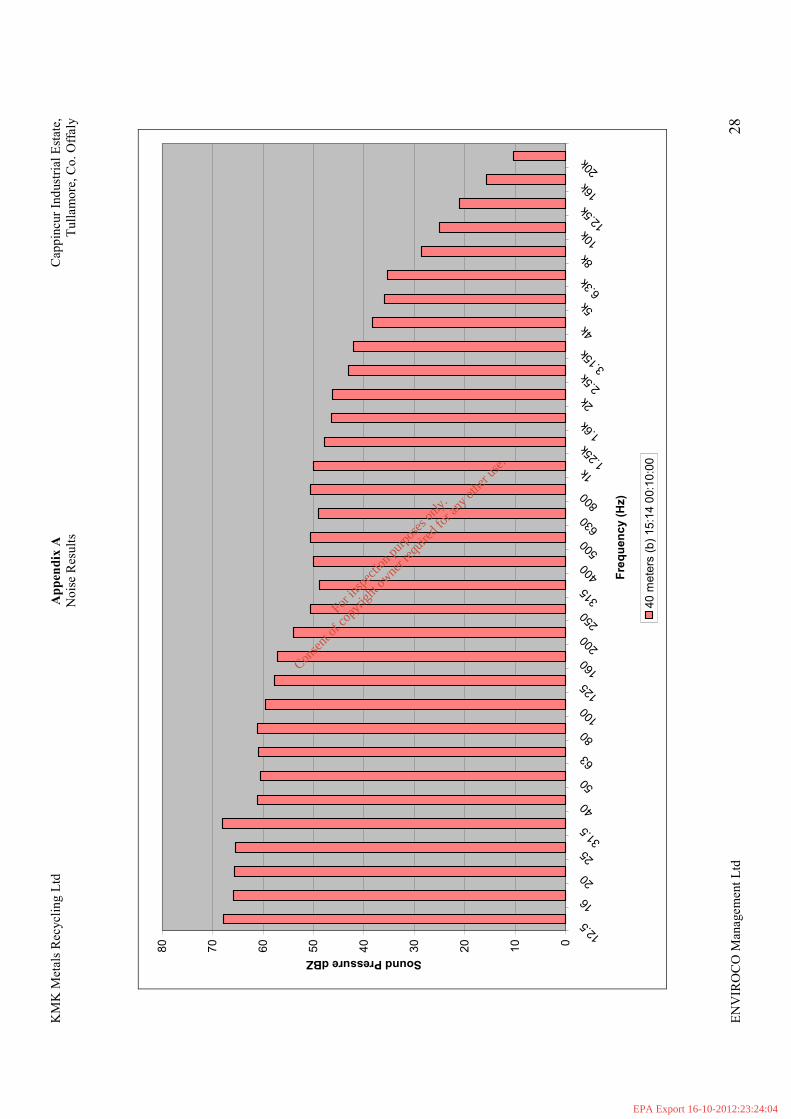
KMK Metals Recycling Ltd
Appendix A
Cappincur Industrial Estate,
Noise Results
Tullamore, Co. Offaly
ENVIROCO Management Ltd
28
0
10
20
30
40
50
60
70
80
12.5
16
20
2531
.5
40
50
63
80
100
125
160
200
250
315
400
500
630
800
1k
1.25k 1.6k
2k 2.5k
3.15k
4k
5k 6.3k
8k 10k 12.5k 16k 20k
Frequency (Hz)
Sound Pressure dBZ
40 meters (b) 15:14 00:10:00
For in
spec
tion p
urpo
ses o
nly.
Conse
nt of
copy
right
owne
r req
uired
for a
ny ot
her u
se.
EPA Export 16-10-2012:23:24:04
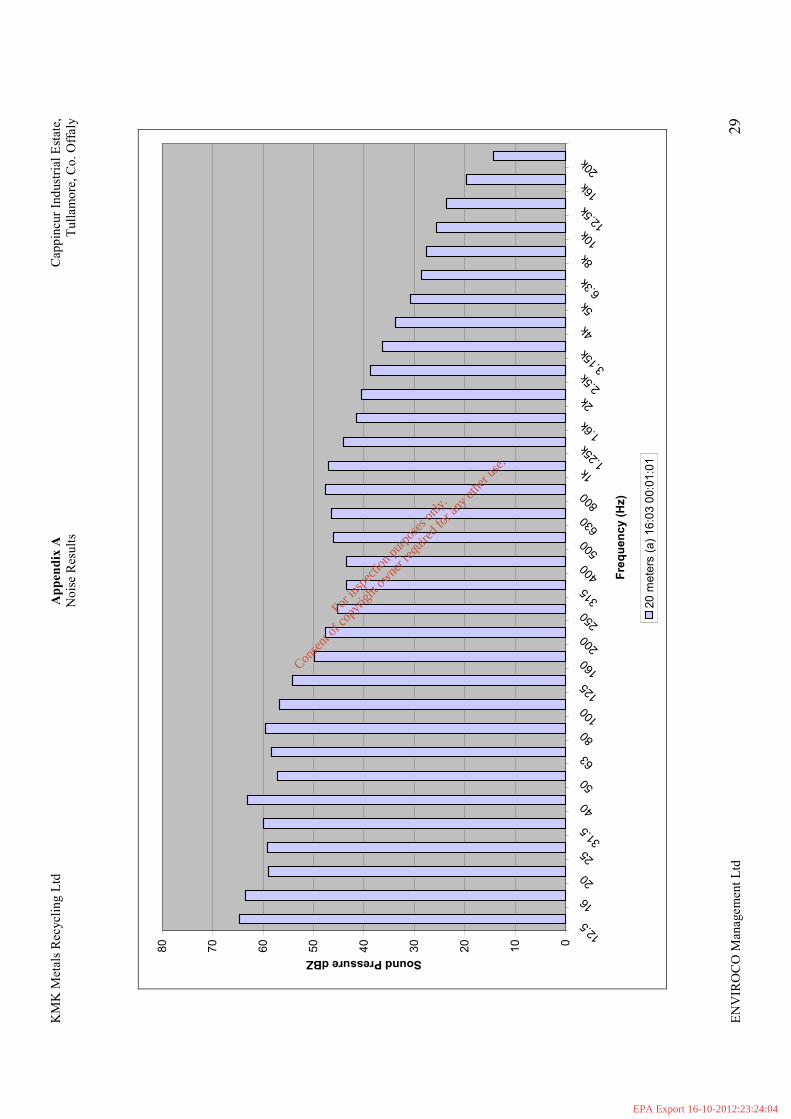
KMK Metals Recycling Ltd
Appendix A
Cappincur Industrial Estate,
Noise Results
Tullamore, Co. Offaly
ENVIROCO Management Ltd
29
0
10
20
30
40
50
60
70
80
12.5
16
20
2531
.5
40
50
63
80
100
125
160
200
250
315
400
500
630
800
1k
1.25k 1.6k
2k 2.5k
3.15k
4k
5k 6.3k
8k 10k 12.5k 16k 20k
Frequency (Hz)
Sound Pressure dBZ
20 meters (a) 16:03 00:01:01
For in
spec
tion p
urpo
ses o
nly.
Conse
nt of
copy
right
owne
r req
uired
for a
ny ot
her u
se.
EPA Export 16-10-2012:23:24:04
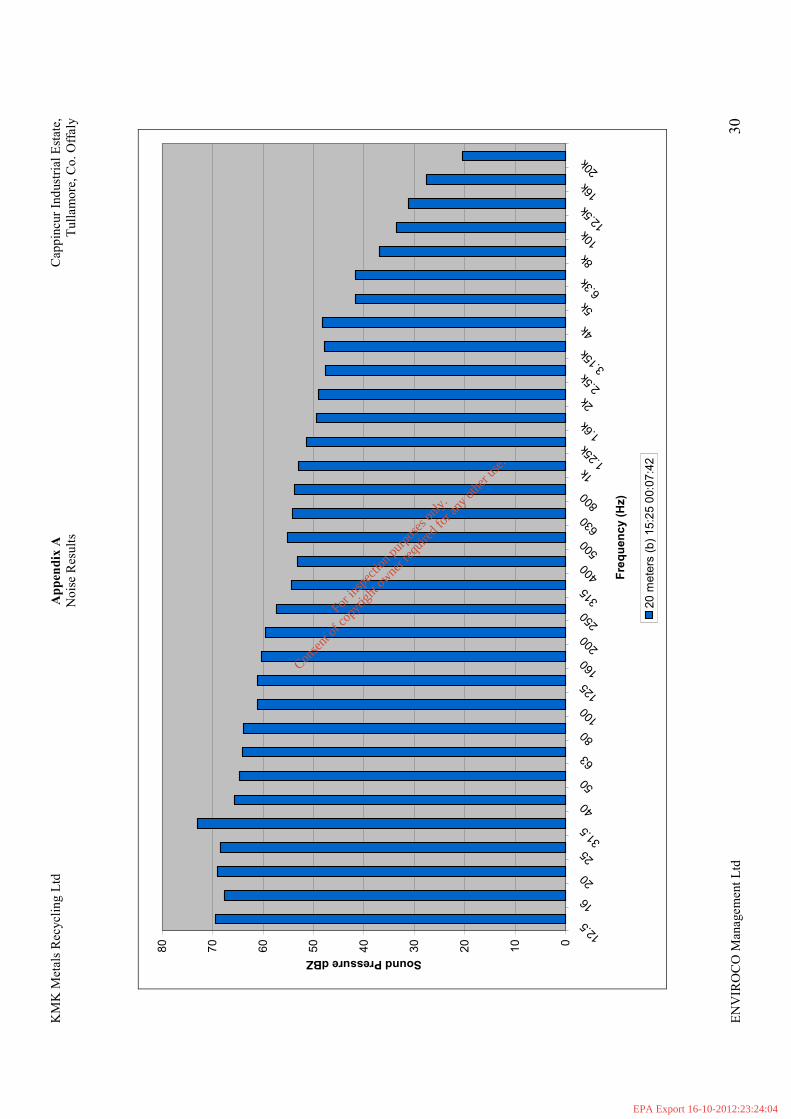
KMK Metals Recycling Ltd
Appendix A
Cappincur Industrial Estate,
Noise Results
Tullamore, Co. Offaly
ENVIROCO Management Ltd
30
0
10
20
30
40
50
60
70
80
12.5
16
20
2531
.5
40
50
63
80
100
125
160
200
250
315
400
500
630
800
1k
1.25k 1.6k
2k 2.5k
3.15k
4k
5k 6.3k
8k 10k 12.5k 16k 20k
Frequency (Hz)
Sound Pressure dBZ
20 meters (b) 15:25 00:07:42
For in
spec
tion p
urpo
ses o
nly.
Conse
nt of
copy
right
owne
r req
uired
for a
ny ot
her u
se.
EPA Export 16-10-2012:23:24:04
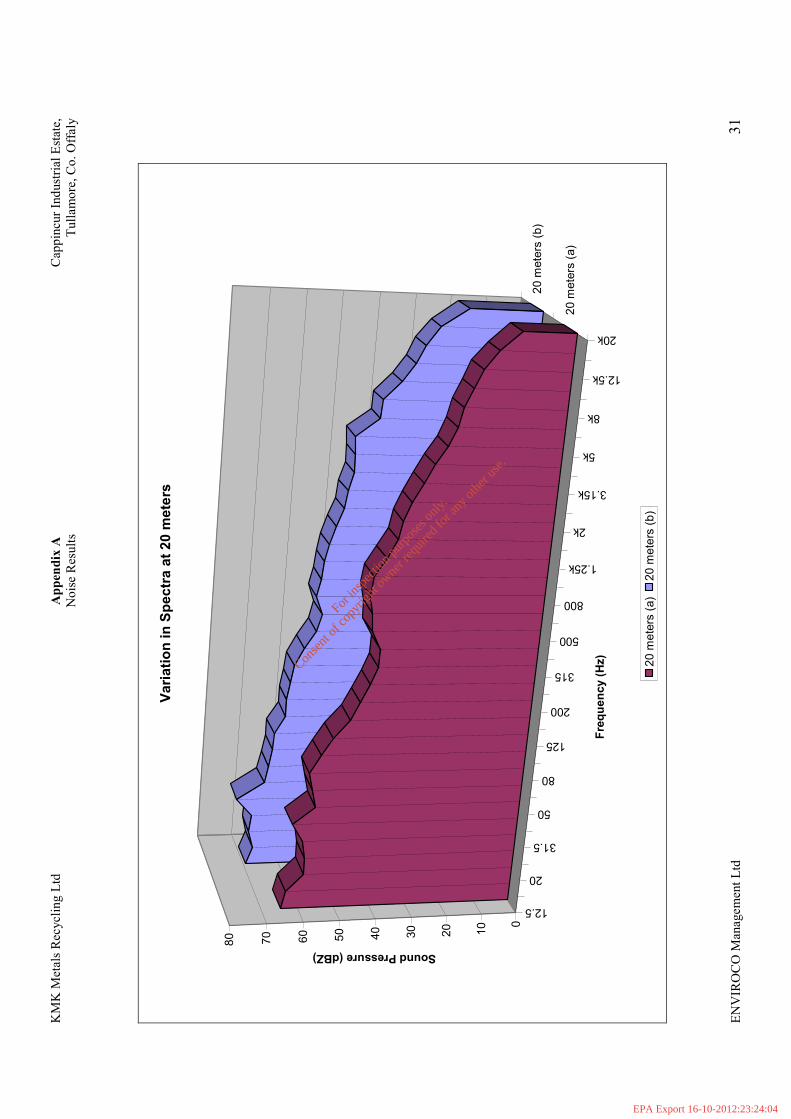
KMK Metals Recycling Ltd
Appendix A
Cappincur Industrial Estate,
Noise Results
Tullamore, Co. Offaly
ENVIROCO Management Ltd
31
12.5
20
31.5
50
80
125
200
315
500
800
1.25k
2k
3.15k
5k
8k
12.5k
20k
20 meters (a)
20 meters (b)
0
10
20
30
40
50
60
70
80
Sound Pressure (dBZ)
Frequency (Hz)
Variation in Spectra at 20 meters
20 meters (a)
20 meters (b)
For in
spec
tion p
urpo
ses o
nly.
Conse
nt of
copy
right
owne
r req
uired
for a
ny ot
her u
se.
EPA Export 16-10-2012:23:24:04
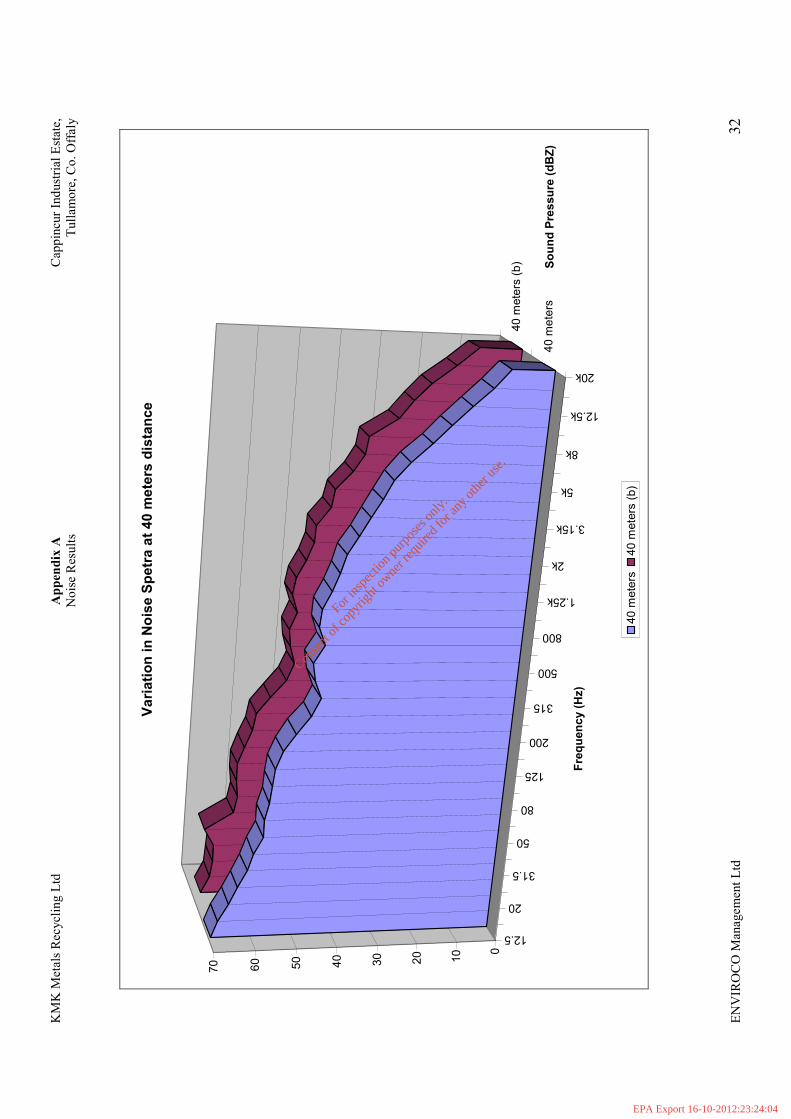
KMK Metals Recycling Ltd
Appendix A
Cappincur Industrial Estate,
Noise Results
Tullamore, Co. Offaly
ENVIROCO Management Ltd
32
12.5
20
31.5
50
80
125
200
315
500
800
1.25k
2k
3.15k
5k
8k
12.5k
20k
40 meters
40 meters (b)
0
10
20
30
40
50
60
70
Frequency (Hz)
Sound Pressure (dBZ)
Variation in Noise Spetra at 40 meters distance
40 meters
40 meters (b)
For
insp
ectio
n pur
pose
s only
.
Conse
nt of
copy
right
owne
r req
uired
for a
ny ot
her u
se.
EPA Export 16-10-2012:23:24:04