lsi the image company -...
TRANSCRIPT
L S I T H E I M A G E C O M P A N Y
2 0 0 5 A N N U A L R E P O R T
O P P O R T U N I T Y E V E R Y W H E R E N O W
255292_Cover.qxp 9/14/05 1:35 PM Page 3

Contents
Corporate Profile 2Financial Highlights 3Opportunity Everywhere Now 4-5Lighting Segment Letter 6Graphics Segment Letter 7Chairman’s Letter 8Management’s Discussion and Analysis of
Financial Condition and Results of Operations 10Financial Statements 19Notes to Consolidated Financial Statements 24Report of Management 36Report of Independent Registered
Public Accounting Firm 37Selected Financial Data 39Corporate Information and Operating Facilities 40Board of Directors, Corporate Officers
and Executive Management Inside Back Cover
OUR GROWTH WILL COME FROM CAPITALIZING ON OPPORTUNITIES IN
PRESENT AND FUTURE MARKETS
IMAGE IS OUR BUSINESS
THROUGH LIGHTING, GRAPHICS AND TECHNOLOGY
255292_Cover.qxp 10/3/05 12:01 PM Page 4
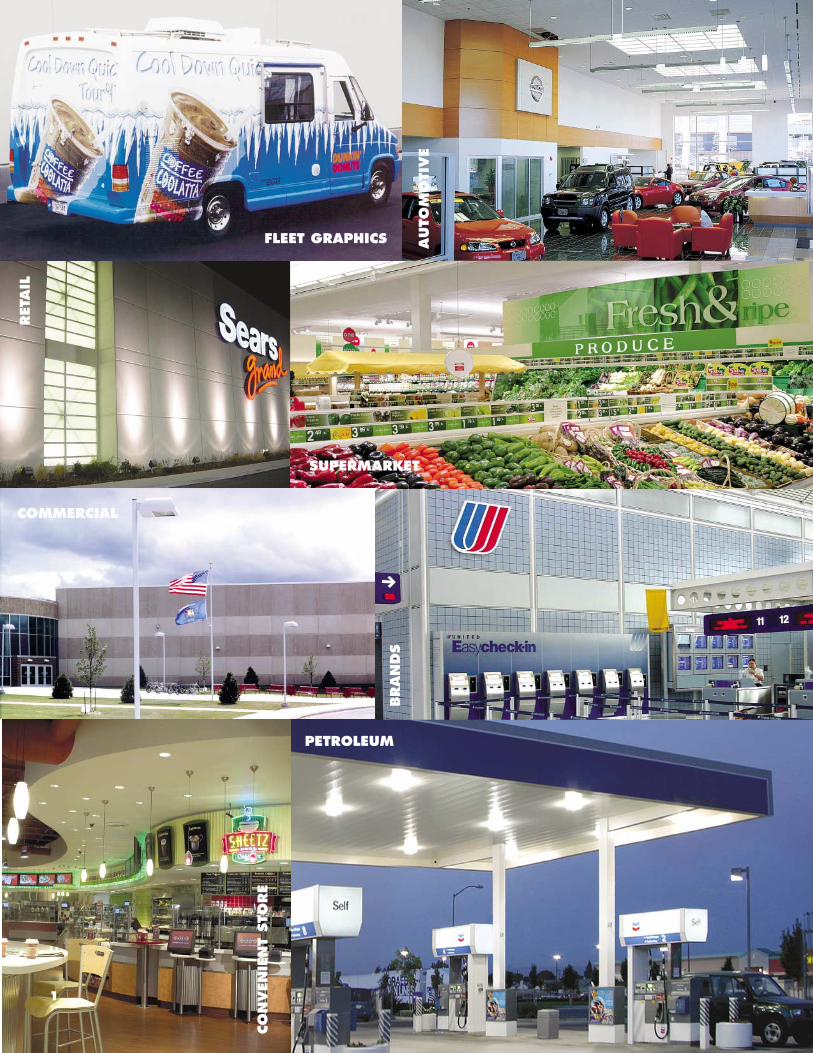
PETROLEUM
COMMERCIAL
SUPERMARKET
FLEET GRAPHICS
BRAN
DS
CO
NVEN
IEN
T STO
RE
AUTO
MO
TIVE
RET
AIL
1
255292_Guts.qxp 9/14/05 1:10 PM Page 1
2
CORPORATE PROFILE
LSI Industries is an image solutions company,combining integrated design, manufacturing, andtechnology to supply high quality lighting fixtures andgraphics elements for applications in the retail,specialty niche, and commercial markets. TheCompany’s Lighting Segment produces highperformance products dedicated to outdoor,architectural outdoor, indoor, architectural indoor andaccent/downlight applications. The Company’sGraphics Segment provides a vast array of productsand services, including signage, menu board systems,active digital signage, decorative fixturing, designsupport, and engineering and project management forcustom programs for today’s retail environment. LSI’smajor markets are the petroleum/convenience store,multi-site retail (including automobile dealerships,restaurants and national retail accounts) and thecommercial/industrial lighting markets.
“Safe Harbor” Statement under the Private Securities Litigation Reform Act of 1995
This Annual Report contains certain forward-looking statements that are subject to numerous assumptions, risksor uncertainties. The Private Securities Litigation Reform Act of 1995 provides a safe harbor for forward-looking statements. Forward-looking statements may be identified by words such as “estimates,” “anticipates,”“projects,” “plans,” “expects,” “intends,” “believes,” “seeks,” “may,” “will,” “should” or the negative versionsof those words and similar expressions, and by the context in which they are used. Such statements are basedupon current expectations of the Company and speak only as of the date made. Actual results could differmaterially from those contained in or implied by such forward-looking statements as a result of a variety of risksand uncertainties. These risks and uncertainties include, but are not limited to, the impact of competitiveproducts and services, product demand and market acceptance risks, reliance on key customers, financialdifficulties experienced by customers, the adequacy of reserves and allowances for doubtful accounts,fluctuations in operating results or costs, unexpected difficulties in integrating acquired businesses, and theability to retain key employees of acquired businesses. The Company has no obligation to update any forward-looking statements to reflect subsequent events or circumstances.IMA
GEIS
OUR
BU
SIN
ESS
255292_Guts.qxp 9/16/05 2:48 PM Page 2
3
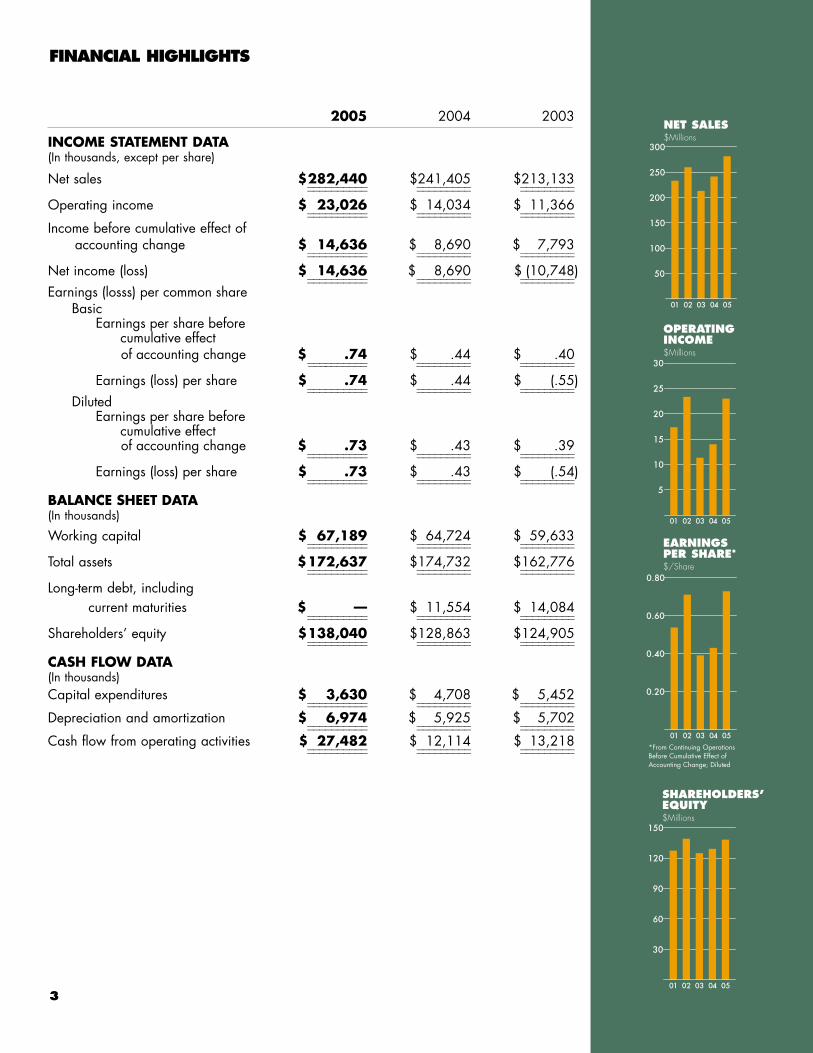
2005 2004 2003
INCOME STATEMENT DATA(In thousands, except per share)
Net sales $282,440 $241,405 $213,133__________ _________ ___________________ _________ _________
Operating income $ 23,026 $ 14,034 $ 11,366__________ _________ ___________________ _________ _________
Income before cumulative effect of accounting change $ 14,636 $ 8,690 $ 7,793__________ _________ ___________________ _________ _________
Net income (loss) $ 14,636 $ 8,690 $ (10,748)__________ _________ ___________________ _________ _________
Earnings (losss) per common share Basic
Earnings per share before cumulative effect of accounting change $ .74 $ .44 $ .40__________ _________ ___________________ _________ _________
Earnings (loss) per share $ .74 $ .44 $ (.55)__________ _________ ___________________ _________ _________
Diluted Earnings per share before
cumulative effect of accounting change $ .73 $ .43 $ .39__________ _________ ___________________ _________ _________
Earnings (loss) per share $ .73 $ .43 $ (.54)__________ _________ ___________________ _________ _________
BALANCE SHEET DATA(In thousands)
Working capital $ 67,189 $ 64,724 $ 59,633__________ _________ ___________________ _________ _________
Total assets $172,637 $174,732 $162,776__________ _________ ___________________ _________ _________
Long-term debt, including current maturities $ — $ 11,554 $ 14,084__________ _________ ___________________ _________ _________
Shareholders’ equity $138,040 $128,863 $124,905__________ _________ ___________________ _________ _________
CASH FLOW DATA(In thousands)Capital expenditures $ 3,630 $ 4,708 $ 5,452__________ _________ ___________________ _________ _________
Depreciation and amortization $ 6,974 $ 5,925 $ 5,702__________ _________ ___________________ _________ _________
Cash flow from operating activities $ 27,482 $ 12,114 $ 13,218__________ _________ ___________________ _________ _________
�� �� �� ����
���
���
��
���
���
���
�� �� �� ����
�
��
��
��
��
��
����
����
����
�� �� �� ��
���
��
�� �� �� ����
���
��
��
�
���
NET SALES$Millions
OPERATING INCOME$Millions
SHAREHOLDERS’EQUITY$Millions
EARNINGS PER SHARE*$/Share
FINANCIAL HIGHLIGHTS
*From Continuing OperationsBefore Cumulative Effect ofAccounting Change; Diluted
255292_Guts.qxp 9/14/05 1:10 PM Page 3

OPPORTUNITY
THE IMAGE
COMPANY
GROWINGTO MEET
THE NEEDS OF AN EVER
EXPANDINGMARKETPLACE
255292_Guts.qxp 9/14/05 1:10 PM Page 4

YEVERYWHERE255292_Guts.qxp 9/14/05 1:10 PM Page 5

LIGHTING
Over the last 12 months, wehave begun to share with ourcustomers and industrypartners the outline of a new
lighting group organization based on avery simple and logical strategy.Specifically, the close coordination of ourvarious lighting companies will achieveresults far beyond what these companiescan achieve independently. In fiscal2005, the LSI Lighting Solutions Plusteam began to transition this concept intoa reality.
During fiscal 2005, the lighting grouprecorded the highest level of lightingsales in the history of our company.Operating income continues to improveeven with the short-term impact of costsassociated with additional systemsimplementations and organizationalrestructuring. Our JD EdwardsOneWorld system implementation alongwith coordinated efforts in sales,engineering, manufacturing, purchasingand service are beginning to producevisible returns in terms of our ability toadapt to a changing marketplace. Wehave continued to make investments toimprove our manufacturing capacity andthroughput in each of ourlighting operations. Wehave made strongimprovements ininventory control and useour systems’ continuitybetween operations toenhance the movementof finished goods stock.We have maintained or
grown our market share position in ourestablished niche markets and havemade significant progress in expandingour presence in large commercial andindustrial lighting markets. With a stableagent sales force and new productreleases in all product categories, we arepoised to maintain this momentum infiscal 2006. While we have certainlyachieved growth in this traditional sense,we have also grown immeasurably as aunified organization building upon thefoundations long established over thealmost 30 years of LSI’s success.
We enter the new fiscal year focusedon consistent day to day performance ina challenging lighting market, while atthe same time using our unifiedcompanies to take advantage of largermore cyclical program business that isgenerated by our combined imagebusiness opportunities working with LSIGraphic Solutions Plus.
We believe our dedication to our corefundamental strategies of aggressive yetselective market penetration, constantcost control, conservative financialdisciplines and the unique advantagethat our Lighting, Graphics and
Technology capabilitiesprovide us form the basisof continued strongperformance for years tocome. The pieces are inplace, Now is the timefor us to take advantageof the OpportunityEverywhere!
Sincerely,
Scott D. ReadyPresident
LSI Lighting Solutions Plus
6
�� ����
���
��
���
���
NET SALESLightingSegment$ Millions
�� ����
��
�
�
�
OPERATINGINCOMELightingSegment$ Millions
Photography by MacWright Studio LLC
255292_Guts.qxp 9/14/05 1:10 PM Page 6
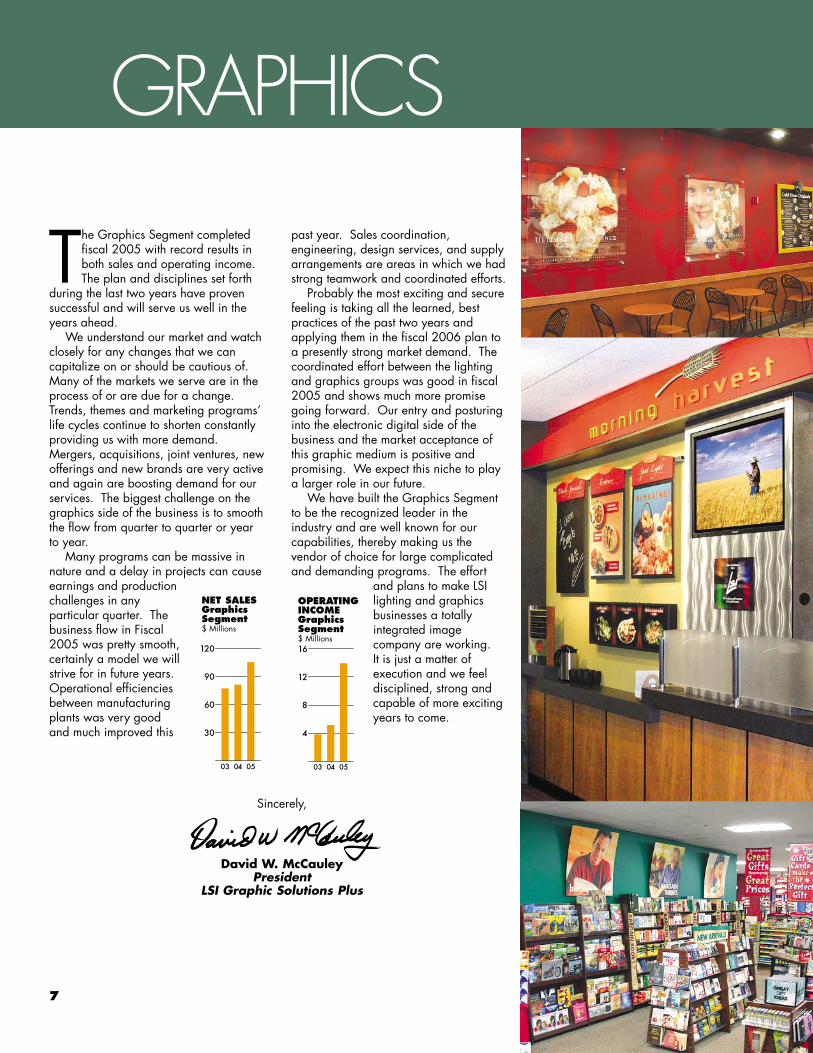
GRAPHICS
The Graphics Segment completedfiscal 2005 with record results inboth sales and operating income.The plan and disciplines set forth
during the last two years have provensuccessful and will serve us well in theyears ahead.
We understand our market and watchclosely for any changes that we cancapitalize on or should be cautious of.Many of the markets we serve are in theprocess of or are due for a change.Trends, themes and marketing programs’life cycles continue to shorten constantlyproviding us with more demand.Mergers, acquisitions, joint ventures, newofferings and new brands are very activeand again are boosting demand for ourservices. The biggest challenge on thegraphics side of the business is to smooththe flow from quarter to quarter or yearto year.
Many programs can be massive innature and a delay in projects can causeearnings and productionchallenges in anyparticular quarter. Thebusiness flow in Fiscal2005 was pretty smooth,certainly a model we willstrive for in future years.Operational efficienciesbetween manufacturingplants was very goodand much improved this
past year. Sales coordination,engineering, design services, and supplyarrangements are areas in which we hadstrong teamwork and coordinated efforts.
Probably the most exciting and securefeeling is taking all the learned, bestpractices of the past two years andapplying them in the fiscal 2006 plan toa presently strong market demand. Thecoordinated effort between the lightingand graphics groups was good in fiscal2005 and shows much more promisegoing forward. Our entry and posturinginto the electronic digital side of thebusiness and the market acceptance ofthis graphic medium is positive andpromising. We expect this niche to playa larger role in our future.
We have built the Graphics Segmentto be the recognized leader in theindustry and are well known for ourcapabilities, thereby making us thevendor of choice for large complicatedand demanding programs. The effort
and plans to make LSIlighting and graphicsbusinesses a totallyintegrated imagecompany are working. It is just a matter ofexecution and we feeldisciplined, strong andcapable of more excitingyears to come.
Sincerely,
David W. McCauleyPresident
LSI Graphic Solutions Plus
7
�� ����
���
��
��
�
NET SALESGraphicsSegment$ Millions
�� ����
��
�
��
OPERATINGINCOMEGraphicsSegment$ Millions
255292_Guts.qxp 9/14/05 1:10 PM Page 7
8
Sincerely,
Robert J. ReadyChairman, President and CEO
LSI Industries Inc.
FUTURE NOW
Last year at this time I wrote to you about why Ibelieved the future was so positive for LSI Industries.Among the reasons for my strong convictions werestrong customer relationships, innovative new
products, a success oriented management team, and asound balance sheet. Most importantly, however, werethe strategies, plans, and directions we put in place andcarefully implemented during the past several years. Thepositive converging results of these actions really startedto come together in fiscal 2005. Net sales increased17% over the prior fiscal year, and net income was up68%. Careful management of working capital and theresulting strong cash flow allowed long-term debt to beeliminated further strengthening our financial condition atfiscal year end.
Numerous improvements were made in our LightingSegment and our efforts to build brand awarenessthrough our LSI Lighting Solutions Plus and LSI GraphicSolutions Plus groups is working well. With these groupsworking together we truly do see opportunity everywhereas we capitalize on our core strategy of "Lighting +Graphics + Technology = Complete Image Solutions."Comments from our two group presidents are included intheir letters to shareholders.
Fiscal 2005 was a good year and an extra cashdividend of $0.10 per share was declared. Of evengreater significance, the Board of Directors increasednext year’s regular quarterly rate from $0.10 per shareto $0.12 per share, an increase of 20%. Over the mostrecent three years, the annual rate has increased from$0.288 to $0.40 to $0.48 per share, a cumulativeincrease of 67%, plus the most recent year-end specialcash dividend. Our most recent increase in theindicated annual rate is consistent with the Company’spolicy of setting the annual rate between 40% and 60%of expected net income for the current fiscal year. Werecognize the importance of cash dividends over thelong-term, and have been paying cash dividends on anuninterrupted and increasing rate since 1989.
Our efforts to broaden LSI’s lighting and graphicscapabilities have been successful and are, of course,on-going. At the same time, we have preserved ourstrong position in niche markets like the petroleum /convenience store market which has the potential togain re-imaging momentum later this fiscal year and intofiscal 2007. We enter fiscal 2006 with confidence –Opportunity is Everywhere.
Dear Shareholders
255292_Guts.qxp 9/14/05 1:10 PM Page 8

9
FINANCIAL RESULTS
Management’s Discussion and Analysis of Financial Condition and Results of Operations ..10
Financial Statements ..........................................19
Notes to Consolidated Financial Statements..........24
Management’s Report on Internal Control OverFinancial Reporting........................................36
Reports of Independent Registered Public Accounting Firm ..................................37 and 38
Selected Financial Data ....................................39
255292_Fin_Sept14_10am.qxd 9/14/05 1:26 PM Page 9
10
NET SALES BY BUSINESS SEGMENT
(In thousands) 2005 2004 2003
Lighting Segment $177,021 $159,748 $136,076Graphics Segment 105,419 81,657 77,057___________ _____________ _____________
$282,440 $241,405 $213,133___________ _____________ ________________________ _____________ _____________
RESULTS OF OPERATIONS
2005 Compared To 2004
Net sales of $282,440,000 in fiscal 2005 increased17% from fiscal 2004 net sales of $241,405,000.Lighting Segment net sales increased 11% to$177,021,000 and Graphics Segment net sales increased29% to $105,419,000 as compared to the prior year.Sales to the petroleum/convenience store marketrepresented 25% and 28% of fiscal 2005 and 2004 netsales, respectively. Net sales to this, the Company’s largestmarket, are reported in both the Lighting and GraphicsSegments, depending upon the product or service sold,and were up 5% from fiscal 2004 to $70.1 million. Thepetroleum/convenience store market has been, and willcontinue to be, a very important niche market for theCompany; however, if sales to other markets andcustomers increase more than net sales to this market, thenthe percentage of net sales to the petroleum/conveniencestore market would be expected to decline.
The $17.3 million increase in Lighting Segment netsales is primarily the result of an aggregate increase of$16.1 million of lighting sales to our niche markets ofpetroleum/convenience stores, automotive dealerships,quick service restaurants, and retail national accounts(including significantly increased sales to Wal-Mart Stores,Inc.), as well as a $2.6 million increase in commissionednet sales to the commercial and industrial lighting market.Net sales to Wal-Mart Stores, Inc. were approximately$30.2 million or 11% of the Company’s total net sales infiscal 2005.
The $23.8 million increase in Graphics Segment netsales is primarily the result of the effect of increasedgraphics net sales to the petroleum/convenience storemarket ($0.4 million), and increased net sales to retailstore customers (approximately $19.8 million, with over$14 million of this increase related to a national drugstore retailer for its re-branding program that is nowcomplete and approximately $7 million related to a nowcomplete menu board enhancement program).
Image and brand programs, whether full conversionsor enhancements, are important to the Company’sstrategic direction. Image programs include situationswhere our customers refurbish their retail sites around thecountry by replacing some or all of the lighting, graphicelements, menu board systems and possibly other itemsthey may source from other suppliers. These imageprograms often take several quarters to complete andinvolve both our customers’ corporate-owned sites as wellas their franchisee-owned sites, the latter of which involveseparate sales efforts by the Company with eachfranchisee. The Company may not always be able toreplace net sales immediately when a large imageconversion program has concluded. Brand programstypically occur as new products are offered or newdepartments are created within an existing retail store.Relative to net sales to a customer before and after animage or brand program, net sales during the programare typically significantly higher, depending upon howmuch of the lighting, graphics or menu board business isawarded to the Company. Sales related to a customer’simage or brand program are reported in either theLighting Segment and/or the Graphics Segment,depending upon the product and/or service provided.
The Company’s Lighting Segment increased salesprices in the second half of fiscal year 2004, and again inthe second and fourth quarters of fiscal 2005 on selectproducts in some markets the Company serves. TheCompany experienced competitive pricing pressures inmost lighting markets, thereby restricting price increases.
MANAGEMENT’S DISCUSSION AND ANALYSIS OF FINANCIAL CONDITION AND RESULTS OF OPERATIONS
255292_Fin_Sept14_10am.qxd 9/14/05 1:26 PM Page 10

11
In some markets the Company was able to increase salesprices to recover a portion of increased raw materialcosts, but generally with little or no increase in grossprofit. The rise in steel and aluminum prices in mainly thefirst eight months of fiscal 2005 caused some reduction inthe Lighting Segment’s gross profit margin as a percentageof net sales.
Gross profit of $72,296,000 in fiscal 2005increased 21% from last year, and increased as apercentage of net sales to 25.6% in fiscal 2005 ascompared to 24.7% last year. The increase in amount ofgross profit is due primarily to the 17% increase in netsales, product mix and efficiencies, partially offset byhigher inventory adjustments related to obsolete inventory,the rising raw material costs noted above, installation,freight and distribution expenses. While the Companyinstituted sales price increases on select products in thesecond half of fiscal 2004 and again in the second andfourth quarters of fiscal 2005, increased material costs,manufacturing wages, compensation and benefitsincreases ($0.6 million), competitive pricing pressures,unabsorbed manufacturing costs in the Company’s NewYork facility, and increased manufacturing expenses ($0.3 million of utilities, $0.3 million of factory supplies,$0.4 million of depreciation, and $0.4 million of repairs,maintenance and property taxes) partially offset thefavorable influences on the Company’s gross profit margin.
Selling and administrative expenses in fiscal year2005 increased $3.6 million and decreased as apercentage of net sales to 17.4% from 18.8% last year.Fiscal 2005 had increased employee compensation andbenefits expense ($2.6 million due to increased salary»rates, staffing levels and incentive compensation), a $0.6 million Graphics Segment expense related to allegedpatent infringement, increased product warranty expense($0.3 million primarily in the Lighting Segment), increasedsales commissions ($0.1 million) and increaseddepreciation expense ($0.7 million, primarily related to
the Company’s business operating system). Theseincreases were partially offset by a favorable $0.4 milliongain related to the Company’s Graphics Segment’s partialsettlement of its bankruptcy claim against Kmart, reducedoutside professional fees with outside consultants related tothe JD Edwards OneWorld business operating system andto the documentation and testing of internal controls (08 million), and a decreased provision for bad debts($0.2 million).
The Company completed its annual goodwillimpairment test as of July 1, 2004 as required byStatement of Financial Accounting Standards No. 142(SFAS No. 142), “Goodwill and Other Intangible Assets,”and recorded an impairment of $186,000 in the firstquarter of fiscal 2005. There was no impairment in fiscal2004. See Note 6 to the financial statements foradditional information.
The Company reported interest expense of$217,000 in fiscal 2005 as compared to $260,000 lastyear. The average interest rate on the Company’s line ofcredit has increased in fiscal 2005 as compared to lastyear, but the average borrowings outstanding havedecreased. The effective tax rate in fiscal 2005 was36.0% as compared to 37.0% in fiscal 2004. Thereduced effective tax rate was related to state incometaxes, partially offset by a higher federal income tax rate(35% as compared to 34.1%).
Net income increased 68% in fiscal 2005 to$14,636,000 as compared to $8,690,000 last year. Theincrease is primarily the result of increased gross profit onincreased net sales, partially offset by increased operatingexpenses, and income taxes. Diluted earnings per sharewas $0.73 in fiscal 2005 as compared to $0.43 pershare in fiscal 2004, a 70% increase. The weightedaverage common shares outstanding for purposes ofcomputing diluted earnings per share in fiscal 2005 was20,087,000 shares as compared to 20,038,000 shareslast year.
255292_Fin_Sept14_10am.qxd 9/14/05 1:26 PM Page 11
12
2004 Compared To 2003
Net sales of $241,405,000 in fiscal 2004increased 13% from fiscal 2003 net sales of$213,133,000. Lighting Segment net sales increased$23.7 million, or 17%, to $159,748,000 and GraphicsSegment net sales increased $4.6 million, or 6%, to$81,657,000 as compared to the prior year. Sales to thepetroleum/convenience store market, the Company’slargest market representing 28% and 29% of fiscal 2004and 2003 net sales, respectively, were up 9% over fiscal2003 to $66.5 million. Net sales to this market arereported in both the Lighting and Graphics Segments,depending upon the product or service sold. While sales tothis market have increased this year, the Company believesconcerns about the Middle East and the war with Iraq havehad the effect of reducing major image program spendingby the major oil companies. The petroleum/conveniencestore market has been, and will continue to be, a veryimportant niche market for the Company.
The $23.7 million increase in Lighting Segment netsales is primarily the result of an approximate$10.2 million increase in sales to the commercial/industriallighting markets (resulting, in part, from a slightimprovement in the economy, as well as good responsefrom the Company's new independent commercial salesrepresentatives), and an aggregate increase of$12.4 million of lighting sales to our niche markets ofpetroleum/convenience store, automotive dealerships,quick service restaurants, and retail national accounts(including increased sales to a major national retailer).
The $4.6 million increase in Graphics Segment netsales is primarily the result of the net effect of increasedgraphics sales to the petroleum/convenience store market($3.2 million), increased sales to a retail store customer(approximately $9.5 million), and reduced menu boardsystem sales (one quick service restaurant customer salesare down $6.4 million as their roll out program is nowconsidered complete in fiscal 2005).
Image and brand programs, whether full conversionsor enhancements, are important to the Company’sstrategic direction. Image programs include situationswhere our customers refurbish their retail sites around thecountry by replacing some or all of the lighting, graphicelements, menu board systems and possibly other itemsthey may source from other suppliers. These image
programs often take several quarters to complete andinvolve both our customers’ corporate-owned sites as wellas their franchisee-owned sites, the latter of which involveseparate sales efforts by the Company with eachfranchisee. Brand programs typically occur as newproducts are offered or new departments are createdwithin an existing retail store. Relative to net sales to acustomer before and after an image or brand program,net sales during the program are typically significantlyhigher, depending upon how much of the lighting,graphics or menu board business is awarded to theCompany. Sales related to a customer’s image or brandprogram are reported in either the Lighting Segmentand/or the Graphics Segment, depending upon theproduct and/or service provided.
While sales prices in some markets that theCompany serves were increased in the second half of theyear, inflation did not have a significant impact on sales infiscal 2004. The Company experienced competitivepricing pressures in most markets, thereby holding priceincreases to a minimum. In some markets the Companywas able to increase sales prices to recover increased rawmaterial costs, but generally with little or no increase ingross profit. The rise in steel and aluminum prices causeda reduction in the gross profit margin. Additionally, duringthis period of transition to an improving economy, incertain situations the Company has accepted lower-than-normal sales prices and lower-than-normal margins wherenecessary, in part to protect and grow market share.
Gross profit of $59,522,000 in fiscal 2004increased 8% from last year, but decreased as apercentage of net sales to 24.7% in fiscal 2004 ascompared to 25.9% last year. The increase in amount ofgross profit is due primarily to the 13% increase in netsales, product mix and efficiencies, partially offset byhigher installation, freight and distribution expenses.While the Company instituted sales price increases in thesecond half of fiscal 2004, manufacturing wages andcompensation increases that were two percentage pointsgreater than the increase in net sales, competitive pricingpressures throughout the year and increasing materialcosts in the second half contributed to the decreased grossprofit margin percentage. Selling and administrativeexpenses increased $1.7 million. Fiscal 2004 had$0.8 million lower bad debt expense (in fiscal 2003 the
255292_Fin_Sept14_10am.qxd 9/14/05 1:26 PM Page 12
13
Graphics Segment had significant additional expense dueprimarily to customer bankruptcies and cash flowdifficulties), lower legal and professional fees($0.2 million), and lower travel expense ($0.2 million).Items offsetting this reduction of expense were increasedemployee compensation ($1.7 million due to increasedsalary rates, and increased staffing levels and incentivecompensation) and outside consultant expenses($0.7 million) related to the Company’s implementation ofJD Edwards OneWorld business operating system in theCincinnati and Kentucky operations and to thedocumentation and testing of internal controls.
The Company reported interest expense of$260,000 in fiscal 2004 as compared to $378,000 lastyear. The change between years is reflective of bothreduced interest rates and reduced average outstandingborrowings on the Company’s line of credit. The effectivetax rate in fiscal 2004 was 37.0%. The fiscal 2003effective tax rate of 30.7% is the net result of a normal taxprovision of about 37.5% that was reduced when theCompany recorded federal and state income tax credits.
Income before cumulative effect of an accountingchange was $8,690,000 in fiscal 2004, a 12% increaseas compared to $7,793,000 in fiscal 2003. The increaseis primarily the result of increased gross profit onincreased net sales and decreased interest expense,partially offset by increased operating expenses andincome taxes. Diluted earnings per share, before thecumulative effect of an accounting change, was $0.43 infiscal 2004 as compared to $0.39 per share in fiscal2003. The weighted average common shares outstandingfor purposes of computing diluted earnings per share infiscal 2004 was 20,038,000 shares as compared to19,923,000 shares last year.
The Company completed the transitional goodwillimpairment test required by Statement of FinancialAccounting Standards No. 142 (SFAS No. 142),“Goodwill and Other Intangible Assets,” as ofJuly 1, 2002. This test required the Company, through anindependent appraisal firm, to assess the fair value, asdetermined on a discounted cash flow basis, of eachreporting unit that had goodwill on its balance sheet, andcompare that value to the carrying value of the reportingunit’s net assets as of July 1, 2002. The Companydetermined for the fiscal 2003 transitional goodwill
impairment test that it had eight reporting units, each ofwhich represented an acquired business that operated inthe organizational structure one level below the businesssegment level. Based upon this analysis, there was fullimpairment of the recorded net goodwill of two reportingunits in the Lighting Segment (totaling $23,593,000) andone reporting unit in the Graphics Segment (totaling$929,000). The impairment of $24,522,000, a non-cashand non-operating charge, was booked in the amount of$18,541,000, net of income taxes, as a change inaccounting method and was recorded as of the date ofadoption of SFAS No. 142, July 1, 2002. The Companyhas determined that it will perform its annual goodwillimpairment test in accordance with SFAS No. 142 as ofJuly 1st each year. There were no changes in accountingmethods and no impairment of goodwill in fiscal 2004.
The Company recorded net income of $8,690,000in fiscal 2004 as compared to a net loss of $10,748,000in fiscal 2003. The increase in 2004 is the result of the$18,541,000 goodwill impairment loss that was recordedas an accounting change in fiscal 2003, plus theincreased fiscal 2004 income before cumulative effect ofaccounting change. Diluted earnings or (loss) per sharewas $(0.54) in fiscal 2003 as compared to $0.43 pershare in fiscal 2004.
LIQUIDITY AND CAPITAL RESOURCES
The Company considers its level of cash on hand, itsborrowing capacity, its current ratio and working capitallevels to be its most important measures of short-termliquidity. For long-term liquidity indicators, the Companybelieves its ratio of long-term debt to equity and itshistorical levels of net cash flows from operating activitiesto be the most important measures.
At June 30, 2005 the Company had working capitalof $67.2 million, compared to $64.7 million atJune 30, 2004. The ratio of current assets to currentliabilities improved to 3.13 to 1 from 3 to 1. The increasein working capital was primarily related to a significantincrease in cash ($7.0 million), increased accountsreceivable ($4.2 million), and decreased accounts payable($2.5 million), partially offset by decreased inventories($8.2 million), decreased other current assets ($1.3 million)and increased accrued expenses ($1.7million). The
255292_Fin_Sept14_10am.qxd 9/14/05 1:26 PM Page 13
14
$4.2 million increase in accounts receivable is due tohigher fourth quarter fiscal 2005 net sales as compared tofourth quarter fiscal 2004. The DSO (days salesoutstanding) was 59 days at both June 30, 2005 andJune 30, 2004. With the Company’s focus on inventoryreduction in fiscal 2005, raw materials inventoriesdecreased $4.6 million, and work in process and finishedgoods inventories are down $3.6 million since the end offiscal 2004.
The Company generated $27.5 million of cash fromoperating activities in fiscal 2005 as compared to ageneration of cash of $12.1 million last year. The$15.4 million increase in net cash flows from operatingactivities in fiscal 2005 is primarily the net result ofincreased net income ($5.9 million favorable), less of anincrease in accounts receivable (unfavorable change of$1.1 million), a decrease in refundable income taxes(unfavorable change of $0.8 million), a decrease ininventories rather than the increase last year (favorablechange of $15.6 million), a decrease in other currentassets rather than the increase last year (favorable changeof $3.2 million), an aggregate $0.8 million decrease inaccounts payable and accrued expenses in fiscal 2005 ascompared to an aggregate $8.5 million increase last year(net $9.3 million unfavorable), more depreciation,amortization and goodwill impairment in fiscal 2005($1.2 million favorable), an increase in net deferredincome tax assets rather than a decrease ($1.4 millionunfavorable), and an unfavorable change of $0.3 millionrelated to distributions out of the Company’s non-qualifieddeferred compensation plan.
Net accounts and notes receivables were$46.7 million and $42.5 million at June 30, 2005 andJune 30, 2004, respectively. The 10% increase inreceivables is due to the net result of increased sales of thefourth quarter of fiscal 2005 as compared to the fourthquarter of fiscal 2004 as well as the timing of customerpayments. The Company believes that its receivables areultimately collectible or recoverable, net of certainreserves, and that aggregate allowances for doubtfulaccounts are adequate.
Inventories at June 30, 2005 declined $8.2 millionfrom June 30, 2004 levels. An inventory decrease ofabout $0.6 million occurred in the Graphics Segment,while Lighting Segment inventories decreased about$7.6 million in fiscal 2005. The $2.5 million reduction ofaccounts payable from June 30, 2004 to June 30, 2005is related to the timing of both purchases of inventory andpayments to suppliers.
Cash generated from operations and borrowingcapacity under a line of credit agreement are theCompany’s primary source of liquidity. The Company hasan unsecured $50 million revolving line of credit with itsbank group, all of which was available as ofSeptember 1, 2005. This line of credit consists of a$30 million three year committed credit facility expiring infiscal 2008 and a $20 million credit facility with anannual renewal in the third quarter of fiscal 2006. TheCompany believes that the total of available lines of creditplus cash flows from operating activities is adequate forthe Company’s fiscal 2006 operational and capitalexpenditure needs. The Company is in compliance with allof its loan covenants.
Capital expenditures of $3.6 million in fiscal 2005compare to $4.7 million in fiscal 2004. Fiscal 2005spending is primarily for tooling and equipment. TheCompany intends to expand its graphics facility in RhodeIsland, thereby increasing expected fiscal 2006 capitalexpenditures to the range of $7.0 to $8.0 million,exclusive of business acquisitions.
The Company used $17.0 million of cash related tofinancing activities in fiscal 2005 as compared to a use of$7.4 million in fiscal 2004. The $9.6 million changebetween years is primarily the net result of increased netpayments on the Company’s line of credit (unfavorable$9.0 million), increased dividend payments (unfavorable$1.6 million) pursuant to the Company’s increasedindicated annual dividend payment amount, and increasedcash flow from the exercise of stock options and issuanceof common shares pursuant to compensation programs(favorable $1.0 million). As of June 30, 2005 theCompany’s long term debt has been paid down to zero.
255292_Fin_Sept14_10am.qxd 9/14/05 1:26 PM Page 14
15
On August 24, 2005 the Board of Directors declareda regular quarterly cash dividend of $0.10 per share(approximately $1,987,000) as well as a special year-endcash dividend of $0.10 per share (approximately$1,987,000), both payable September 13, 2005 toshareholders of record on September 6, 2005. Duringfiscal 2005, the Company paid cash dividends of$6,805,000, as compared to $5,206,000 in fiscal 2004.The declaration and amount of dividends will bedetermined by the Company’s Board of Directors, in itsdiscretion, based upon its evaluation of earnings, cashflow, capital requirements and future businessdevelopments and opportunities, including acquisitions.
Carefully selected acquisitions have long been animportant part of the Company’s strategic growth plans.The Company continues to seek out, screen and evaluatepotential acquisitions that could add to the lighting orgraphics product lines or enhance the Company’s positionin selected markets. The Company believes adequatefinancing for any such investments or acquisitions will beavailable through future borrowings or through theissuance of common or preferred shares in payment foracquired businesses.
CRITICAL ACCOUNTING POLICIES AND ESTIMATES
The Company is required to make estimates andjudgments in the preparation of its financial statements thataffect the reported amounts of assets, liabilities, revenuesand expenses, and related footnote disclosures. TheCompany bases its estimates on historical experience andon various other assumptions that are believed to bereasonable under the circumstances, the results of whichform the basis for making judgments about the carryingvalues of assets and liabilities. The Company continuallyreviews these estimates and their underlying assumptions toensure they remain appropriate. The Company believes theitems discussed below are among its most significantaccounting policies because they utilize estimates about theeffect of matters that are inherently uncertain and thereforeare based on management’s judgment. Significant changesin the estimates or assumptions related to any of thefollowing critical accounting policies could possibly have amaterial impact on the financial statements.
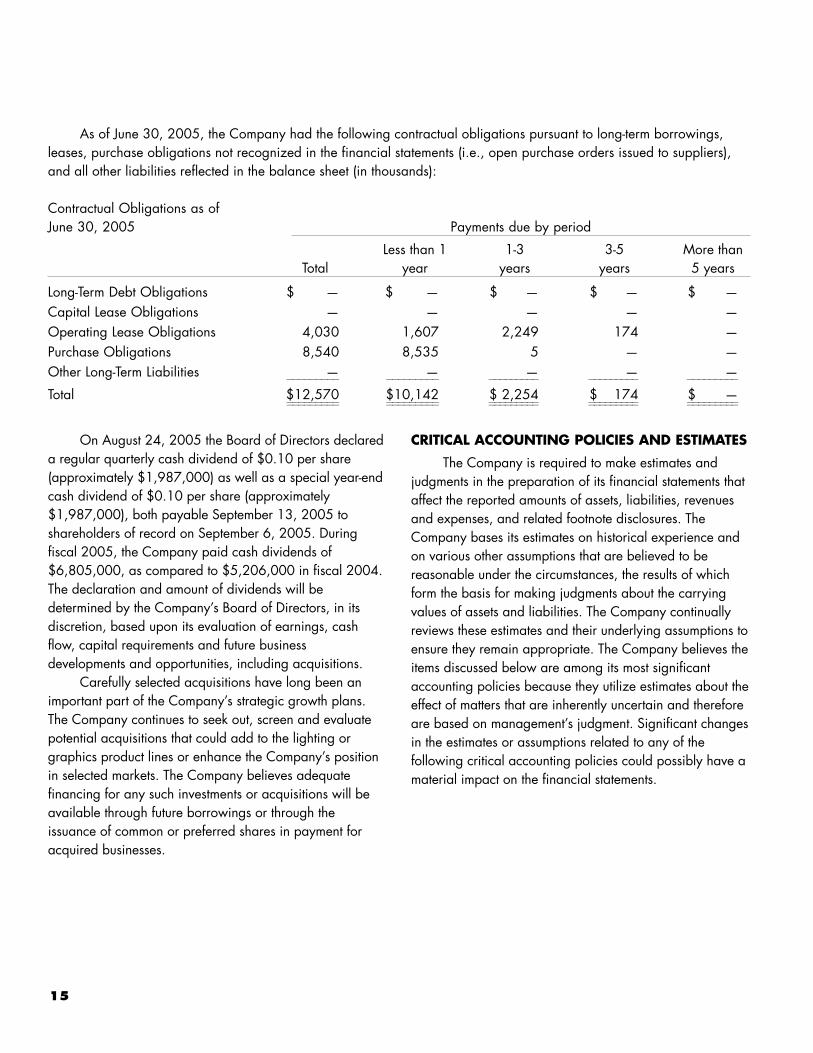
As of June 30, 2005, the Company had the following contractual obligations pursuant to long-term borrowings,leases, purchase obligations not recognized in the financial statements (i.e., open purchase orders issued to suppliers),and all other liabilities reflected in the balance sheet (in thousands):
Contractual Obligations as of June 30, 2005 Payments due by period
Less than 1 1-3 3-5 More thanTotal year years years 5 years
Long-Term Debt Obligations $ — $ — $ — $ — $ —Capital Lease Obligations — — — — —Operating Lease Obligations 4,030 1,607 2,249 174 —Purchase Obligations 8,540 8,535 5 — —Other Long-Term Liabilities — — — — —_________ _________ _________ _________ _________
Total $12,570 $10,142 $ 2,254 $ 174 $ —_________ _________ _________ _________ __________________ _________ _________ _________ _________
255292_Fin_Sept14_10am.qxd 9/14/05 1:26 PM Page 15
16
Revenue Recognition
The Company recognizes revenue in accordance withSecurities Exchange Commission Staff Accounting BulletinNo. 104, “Revenue Recognition.” Revenue is recognizedwhen title to goods and risk of loss have passed to thecustomer, there is persuasive evidence of a purchasearrangement, delivery has occurred or services have beenrendered, and collectibility is reasonably assured. Revenueis typically recognized at time of shipment. Sales arerecorded net of estimated returns, rebates and discounts.Any cash received from customers prior to the recognition ofrevenue is accounted for as a customer pre-payment and isincluded in accrued expenses.
The Company has four sources of revenue: revenuefrom product sales; revenue from the installation of product;service revenue generated from providing the integrateddesign, project and construction management, siteengineering, and site permitting; and revenue fromshipping and handling. Product revenue is recognized onproduct-only orders at the time of shipment. Productrevenue related to orders where the customer requires theCompany to install the product is generally recognizedwhen the product is installed. In some situations, productrevenue is recognized when the product is shipped, beforeit is installed, because by agreement the customer hastaken title to and risk of ownership for the product beforeinstallation has been completed. Other than normal productwarranties or the possibility of installation, the Companyhas no post-shipment responsibilities. Installation revenue isrecognized when the products have been fully installed.The Company is not always responsible for installation ofproducts it sells and has no post-installation servicecontracts or responsibilities. Service revenue fromintegrated design, project and construction management,site engineering and permitting is recognized at thecompletion of the contract with the customer. With largercustomer contracts involving multiple sites, the customermay require progress billings for completion of identifiable,time-phased elements of the work, in which case revenue isrecognized at the time of the progress billing, whichcoincides with the revenue recognition criteria. Shippingand handling revenue coincides with the recognition ofrevenue from sale of the product.
Income Taxes
The Company accounts for income taxes inaccordance with Statement of Financial AccountingStandards No. 109 (SFAS No. 109), accordingly deferredincome taxes are provided on items that are reported aseither income or expense in different time periods forfinancial reporting purposes than they are for income taxpurposes. Deferred income tax assets and liabilities arereported on the Company’s balance sheet. Significantmanagement judgment is required in developing theCompany’s income tax provision, including thedetermination of deferred tax assets and liabilities andany valuation allowances that might be required againstdeferred tax assets. Management has determined that novaluation allowances are required.
The Company operates in multiple taxingjurisdictions and is subject to audit in these jurisdictions.The Internal Revenue Service and other tax authoritiesroutinely review the Company’s tax returns. These auditscan involve complex issues which may require anextended period of time to resolve. The impact of theseexaminations on the Company’s liability for income taxescannot be presently determined. In management’s opinion,adequate provision has been made for potentialadjustments arising from these examinations.
Asset Impairment
Carrying values of goodwill and other intangibleassets with indefinite lives are reviewed at least annuallyfor possible impairment in accordance with Statement ofFinancial Accounting Standards No. 142 (SFAS No. 142),“Goodwill and Other Intangible Assets,” which wasadopted on July 1, 2002. The Company’s impairmentreview involves the estimation of the fair value of goodwilland indefinite-lived intangible assets using a discountedcash flow approach, at the reporting unit level, thatrequires significant management judgment with respect torevenue and expense growth rates, changes in workingcapital and the selection and use of an appropriatediscount rate. The estimates of fair value of reporting unitsare based on the best information available as of the dateof the assessment. The use of different assumptions would
255292_Fin_Sept14_10am.qxd 9/14/05 1:26 PM Page 16
17
increase or decrease estimated discounted future operatingcash flows and could increase or decrease an impairmentcharge. Company management uses its judgment inassessing whether assets may have become impairedbetween annual impairment tests. Indicators such asadverse business conditions, economic factors andtechnological change or competitive activities may signalthat an asset has become impaired. An impairment chargeof $24.5 million, or $18.5 million net of tax, related togoodwill was recorded in fiscal 2003 as the cumulativeeffect of an accounting change and charged againstincome. A goodwill impairment charge of $186,000 wasrecorded in fiscal 2005 resulting from the Company’s fiscal2005 SFAS No. 142 annual review. See Note 6 to thefinancial statements for further discussion.
Carrying values for long-lived tangible assets anddefinite-lived intangible assets, excluding goodwill, arereviewed for possible impairment as circumstances warrantin connection with Statement of Financial AccountingStandards No. 144 (SFAS No. 144), “Accounting for theImpairment or Disposal of Long-Lived Assets,” which wasadopted on July 1, 2002. Impairment reviews areconducted at the judgment of Company management whenit believes that a change in circumstances in the business orexternal factors warrants a review. Circumstances such asthe discontinuation of a product or product line, a suddenor consistent decline in the forecast for a product, changesin technology or in the way an asset is being used, ahistory of negative operating cash flow, or an adversechange in legal factors or in the business climate, amongothers, may trigger an impairment review. The Company’sinitial impairment review to determine if a potentialimpairment charge is required is based on an undiscountedcash flow analysis at the lowest level for which identifiablecash flows exist. The analysis requires judgment withrespect to changes in technology, the continued success ofproduct lines and future volume, revenue and expensegrowth rates, and discount rates. There were noimpairment charges related to long-lived tangible assets ordefinite-lived intangible assets recorded by the Companyduring 2005, 2004 or 2003.
Credit and Collections
The Company maintains allowances for doubtfulaccounts receivable for estimated losses resulting fromeither customer disputes or the inability of its customers tomake required payments. If the financial condition of theCompany’s customers were to deteriorate, resulting in theirinability to make the required payments, the Companymay be required to record additional allowances orcharges against income. The Company determines itsallowance for doubtful accounts by first considering allknown collectibility problems of customers’ accounts, andthen applying certain percentages against the variousaging categories of the remaining receivables. Theresulting allowance for doubtful accounts receivable is anestimate based upon the Company’s knowledge of itsbusiness and customer base, and historical trends. TheCompany also establishes allowances, at the time revenueis recognized, for returns and allowances, discounts,pricing and other possible customer deductions. Theseallowances are based upon historical trends.
NEW ACCOUNTING PRONOUNCEMENTS
In November 2004, the Financial AccountingStandards Board issued Statement of Financial AccountingStandards (SFAS) No. 151, “Inventory Costs.” Thisstatement amends Accounting Research Board (ARB)No. 43, “Inventory Pricing,” to clarify that abnormalamounts of idle facility expense, freight, handling costs,and wasted materials should be recognized as current-period charges. In addition, this statement requires thatallocation of fixed production overheads to the cost ofconversion be based on the normal capacity of theproduction facilities. SFAS No. 151 is effective for fiscalyears beginning after June 15, 2005, or the Company’s2006 fiscal year beginning July 1, 2005. The Company iscurrently evaluating the impact of this statement, but doesnot expect any significant impact on its financial conditionor results of operations when it is implemented.
255292_Fin_Sept14_10am.qxd 9/14/05 1:26 PM Page 17

18
In December 2004, the Financial AccountingStandards Board issued Statement of Financial AccountingStandards (SFAS) No. 123(R) (revised 2004), “Share-BasedPayment.” This statement establishes standards for theaccounting of transactions in which an entity exchanges itsequity instruments for goods or services, primarily when itobtains employee services in share-based paymenttransactions. SFAS No. 123(R) (revised 2004) supersedesthe Accounting Principles Board Opinion No. 25,Accounting for Stock issued to Employees. This Statementrequires public entities to measure the cost of employeeservices received in exchange for an award of equityinstruments based upon the grant date fair value of theaward, with this cost being recognized over the periodduring which an employee is required to provide theservices. This statement is effective for the first fiscal yearbeginning after June 15, 2005, or the Company’s firstquarter of fiscal 2006 which begins July 1, 2005. TheCompany is currently evaluating the impact of thisstatement, but expects the impact to be consistent with thepro forma information presented in Note 1.
In December 2004, the Financial AccountingStandards Board issued Statement of Financial AccountingStandards (SFAS) No. 153, “Exchanges of NonmonetaryAssets.” This statement addresses the measurement ofexchanges of nonmonetary assets and is effective for fiscalperiods beginning after June 15, 2005. The Company iscurrently evaluating the impact of this statement, but doesnot expect any significant impact on its financial conditionor results of operations when it is implemented.
In May 2005, the Financial Accounting StandardsBoard issued Statement of Financial Accounting Standards(SFAS) No. 154, “Accounting Changes and ErrorCorrections.” This statement replaces Accounting PrinciplesBoard (APB) Opinion No. 20, “Accounting Changes” andSFAS No. 3, “Reporting Accounting Changes in InterimFinancial Statements,” and changes the requirement for theaccounting for and reporting of a direct effect of avoluntary change in accounting principle. It also applies tochanges required by an accounting pronouncement in theinstance that the pronouncement does not include specifictransition provisions. SFAS No. 154 requires retrospectiveapplication to prior periods’ financial statements ofchanges in accounting principle, unless it is impracticableto determine either the period-specific effects or thecumulative effect of the change. This statement also requiresthat a change in depreciation, amortization, or depletionmethod for long-lived, non-financial assets be accounted foras a change in accounting estimate affected by a changein accounting principle. This statement is effective foraccounting changes and error corrections made in fiscalyears beginning after December 15, 2005, or theCompany’s first quarter of fiscal year 2007 which beginsJuly 1, 2006. The Company will comply with the provisionsof this statement for any accounting changes or errorcorrections that occur after June 30, 2006.
255292_Fin_Sept14_10am.qxd 9/14/05 1:26 PM Page 18
19
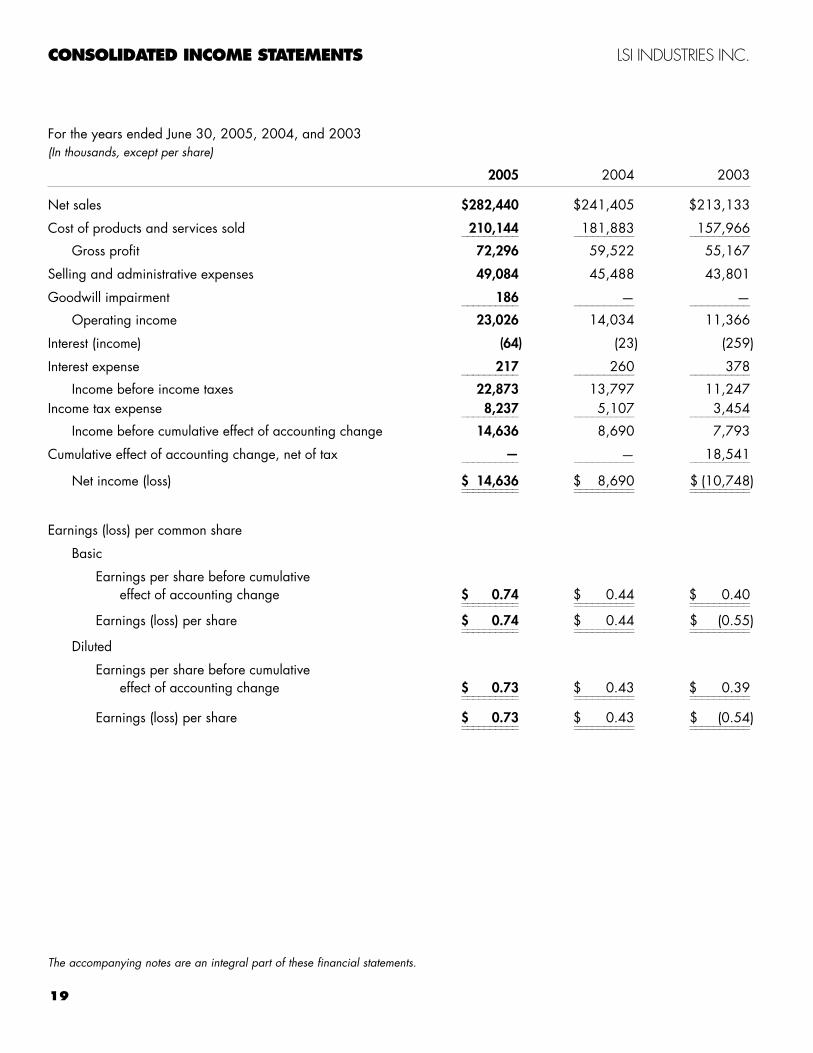
CONSOLIDATED INCOME STATEMENTS LSI INDUSTRIES INC.
For the years ended June 30, 2005, 2004, and 2003(In thousands, except per share)
2005 2004 2003
Net sales $282,440 $241,405 $213,133
Cost of products and services sold 210,144 181,883 157,966__________ __________ __________
Gross profit 72,296 59,522 55,167
Selling and administrative expenses 49,084 45,488 43,801
Goodwill impairment 186 — —__________ __________ __________
Operating income 23,026 14,034 11,366
Interest (income) (64) (23) (259)
Interest expense 217 260 378__________ __________ __________
Income before income taxes 22,873 13,797 11,247Income tax expense 8,237 5,107 3,454__________ __________ __________
Income before cumulative effect of accounting change 14,636 8,690 7,793
Cumulative effect of accounting change, net of tax — — 18,541__________ __________ __________
Net income (loss) $ 14,636 $ 8,690 $ (10,748)__________ __________ ____________________ __________ __________
Earnings (loss) per common share
Basic
Earnings per share before cumulative effect of accounting change $ 0.74 $ 0.44 $ 0.40__________ __________ ____________________ __________ __________
Earnings (loss) per share $ 0.74 $ 0.44 $ (0.55)__________ __________ ____________________ __________ __________
Diluted
Earnings per share before cumulativeeffect of accounting change $ 0.73 $ 0.43 $ 0.39__________ __________ ____________________ __________ __________
Earnings (loss) per share $ 0.73 $ 0.43 $ (0.54)__________ __________ ____________________ __________ __________
The accompanying notes are an integral part of these financial statements.
255292_Fin_Sept14_10am.qxd 9/14/05 1:26 PM Page 19
20
The accompanying notes are an integral part of these financial statements.
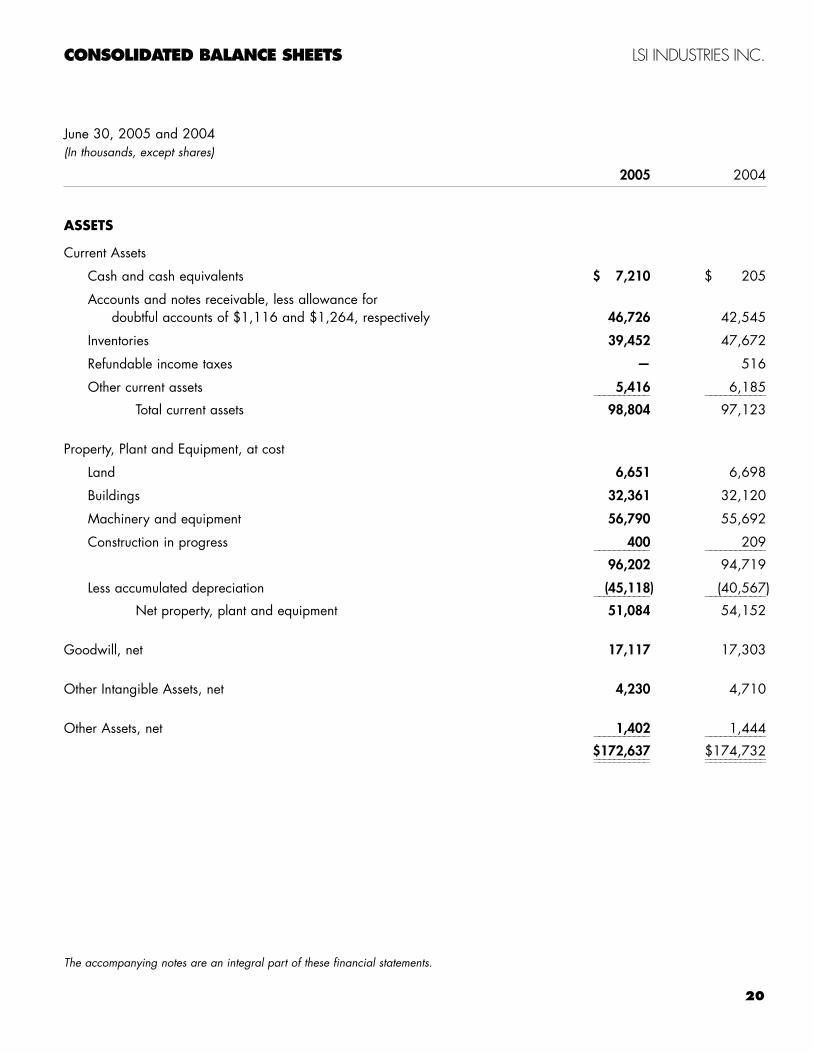
June 30, 2005 and 2004(In thousands, except shares)
2005 2004
ASSETS
Current Assets
Cash and cash equivalents $ 7,210 $ 205
Accounts and notes receivable, less allowance for doubtful accounts of $1,116 and $1,264, respectively 46,726 42,545
Inventories 39,452 47,672
Refundable income taxes — 516
Other current assets 5,416 6,185___________ ____________
Total current assets 98,804 97,123
Property, Plant and Equipment, at cost
Land 6,651 6,698
Buildings 32,361 32,120
Machinery and equipment 56,790 55,692
Construction in progress 400 209___________ ____________
96,202 94,719
Less accumulated depreciation (45,118) (40,567)___________ ____________
Net property, plant and equipment 51,084 54,152
Goodwill, net 17,117 17,303
Other Intangible Assets, net 4,230 4,710
Other Assets, net 1,402 1,444___________ ____________
$172,637 $174,732___________ _______________________ ____________
CONSOLIDATED BALANCE SHEETS LSI INDUSTRIES INC.
255292_Fin_Sept14_10am.qxd 9/14/05 1:26 PM Page 20
21
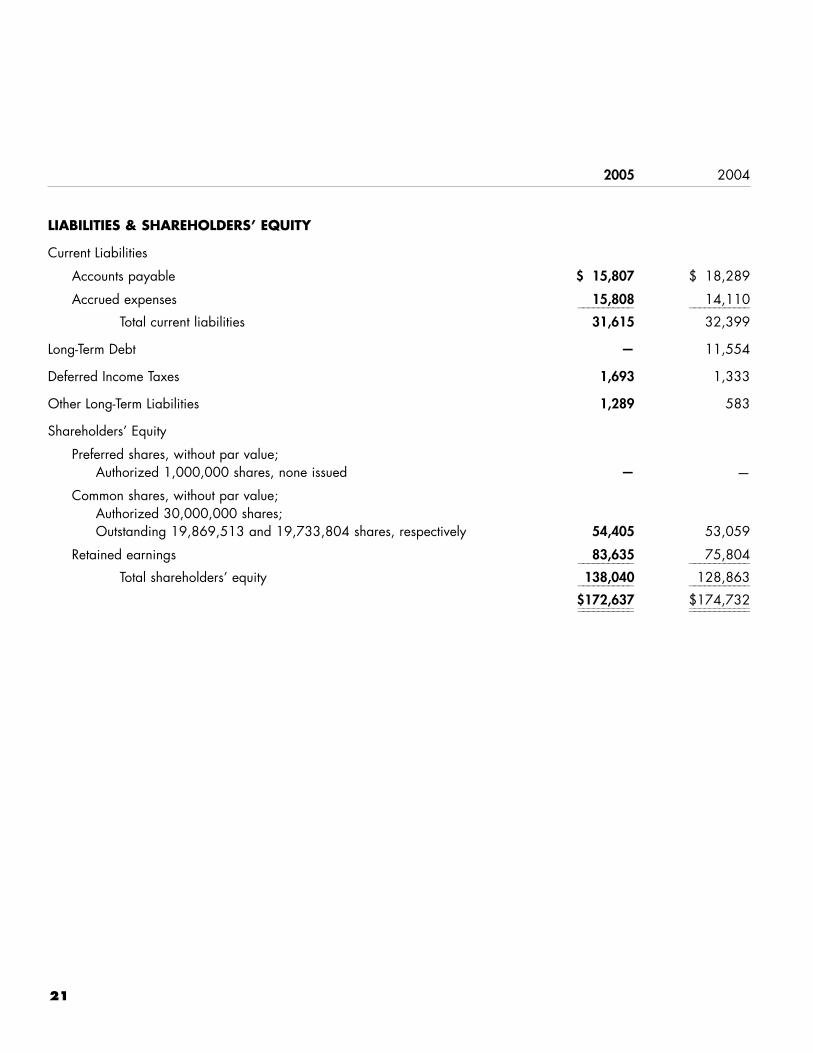
2005 2004
LIABILITIES & SHAREHOLDERS’ EQUITY
Current Liabilities
Accounts payable $ 15,807 $ 18,289
Accrued expenses 15,808 14,110___________ ____________
Total current liabilities 31,615 32,399
Long-Term Debt — 11,554
Deferred Income Taxes 1,693 1,333
Other Long-Term Liabilities 1,289 583
Shareholders’ Equity
Preferred shares, without par value; Authorized 1,000,000 shares, none issued — —
Common shares, without par value;Authorized 30,000,000 shares; Outstanding 19,869,513 and 19,733,804 shares, respectively 54,405 53,059
Retained earnings 83,635 75,804___________ ____________
Total shareholders’ equity 138,040 128,863___________ ____________
$172,637 $174,732___________ _______________________ ____________
255292_Fin_Sept14_10am.qxd 9/14/05 1:26 PM Page 21
22
The accompanying notes are an integral part of these financial statements.
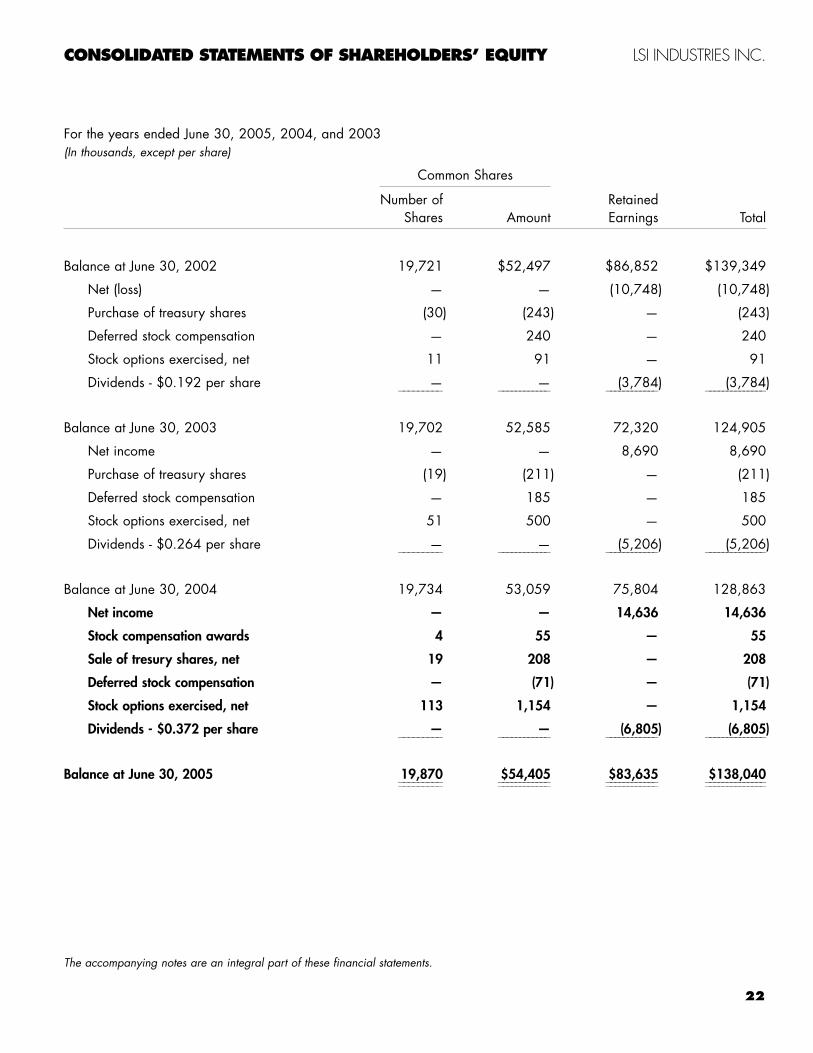
For the years ended June 30, 2005, 2004, and 2003(In thousands, except per share)
Common Shares
Number of RetainedShares Amount Earnings Total
Balance at June 30, 2002 19,721 $52,497 $86,852 $139,349
Net (loss) — — (10,748) (10,748)
Purchase of treasury shares (30) (243) — (243)
Deferred stock compensation — 240 — 240
Stock options exercised, net 11 91 — 91
Dividends - $0.192 per share — — (3,784) (3,784)_________ ____________ ____________ ______________
Balance at June 30, 2003 19,702 52,585 72,320 124,905
Net income — — 8,690 8,690
Purchase of treasury shares (19) (211) — (211)
Deferred stock compensation — 185 — 185
Stock options exercised, net 51 500 — 500
Dividends - $0.264 per share — — (5,206) (5,206)_________ ____________ ____________ ______________
Balance at June 30, 2004 19,734 53,059 75,804 128,863
Net income — — 14,636 14,636
Stock compensation awards 4 55 — 55
Sale of tresury shares, net 19 208 — 208
Deferred stock compensation — (71) — (71)
Stock options exercised, net 113 1,154 — 1,154
Dividends - $0.372 per share — — (6,805) (6,805)_________ ____________ ____________ ______________
Balance at June 30, 2005 19,870 $54,405 $83,635 $138,040_________ ____________ ____________ _______________________ ____________ ____________ ______________
CONSOLIDATED STATEMENTS OF SHAREHOLDERS’ EQUITY LSI INDUSTRIES INC.
255292_Fin_Sept14_10am.qxd 9/14/05 1:26 PM Page 22
23
The accompanying notes are an integral part of these financial statements.
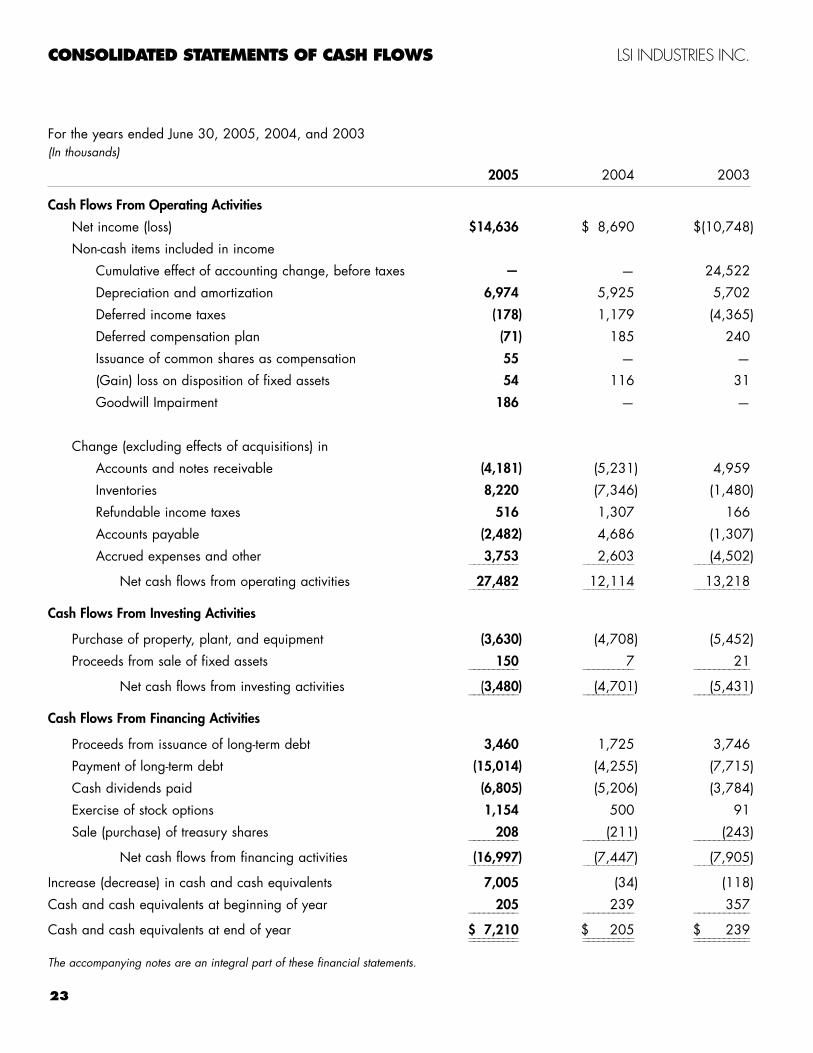
For the years ended June 30, 2005, 2004, and 2003(In thousands)
2005 2004 2003
Cash Flows From Operating Activities
Net income (loss) $14,636 $ 8,690 $(10,748)
Non-cash items included in income
Cumulative effect of accounting change, before taxes — — 24,522
Depreciation and amortization 6,974 5,925 5,702
Deferred income taxes (178) 1,179 (4,365)
Deferred compensation plan (71) 185 240
Issuance of common shares as compensation 55 — —
(Gain) loss on disposition of fixed assets 54 116 31
Goodwill Impairment 186 — —
Change (excluding effects of acquisitions) in
Accounts and notes receivable (4,181) (5,231) 4,959
Inventories 8,220 (7,346) (1,480)
Refundable income taxes 516 1,307 166
Accounts payable (2,482) 4,686 (1,307)
Accrued expenses and other 3,753 2,603 (4,502)__________ __________ ___________
Net cash flows from operating activities 27,482 12,114 13,218__________ __________ ___________
Cash Flows From Investing Activities
Purchase of property, plant, and equipment (3,630) (4,708) (5,452)
Proceeds from sale of fixed assets 150 7 21__________ __________ ___________
Net cash flows from investing activities (3,480) (4,701) (5,431)__________ __________ ___________
Cash Flows From Financing Activities
Proceeds from issuance of long-term debt 3,460 1,725 3,746
Payment of long-term debt (15,014) (4,255) (7,715)
Cash dividends paid (6,805) (5,206) (3,784)
Exercise of stock options 1,154 500 91
Sale (purchase) of treasury shares 208 (211) (243)__________ __________ ___________
Net cash flows from financing activities (16,997) (7,447) (7,905)__________ __________ ___________
Increase (decrease) in cash and cash equivalents 7,005 (34) (118)
Cash and cash equivalents at beginning of year 205 239 357__________ __________ ___________
Cash and cash equivalents at end of year $ 7,210 $ 205 $ 239__________ __________ _____________________ __________ ___________
CONSOLIDATED STATEMENTS OF CASH FLOWS LSI INDUSTRIES INC.
255292_Fin_Sept14_10am.qxd 9/14/05 1:26 PM Page 23
24
NOTES TO CONSOLIDATED FINANCIAL STATEMENTS LSI INDUSTRIES INC.
NOTE 1 - SUMMARY OF SIGNIFICANT ACCOUNTING POLICIES
Consolidation:
The consolidated financial statements include theaccounts of LSI Industries Inc. (an Ohio corporation) andits subsidiaries, all of which are wholly owned. Allsignificant intercompany transactions and balances havebeen eliminated.
Revenue recognition:
The Company has four sources of revenue: revenuefrom product sales; revenue from the installation ofproduct; service revenue generated from providing theintegrated design, project and construction management,site engineering, and site permitting; and revenue fromshipping and handling.
Product revenue is recognized on product-only ordersat the time of shipment. Product revenue related to orderswhere the customer requires the Company to install theproduct is generally recognized when the product isinstalled. In some situations, product revenue isrecognized when the product is shipped, before it isinstalled, because by agreement the customer has takentitle to and risk of ownership for the product beforeinstallation has been completed. Other than normalproduct warranties or the possibility of installation, theCompany has no post-shipment responsibilities.
Installation revenue is recognized when the productshave been fully installed. The Company is not alwaysresponsible for installation of products it sells and has nopost-installation service contracts or responsibilities.
Service revenue from integrated design, project andconstruction management, site engineering and permittingis recognized at the completion of the contract with thecustomer. With larger customer contracts involving multiplesites, the customer may require progress billings forcompletion of identifiable, time-phased elements of thework, in which case revenue is recognized at the time ofthe progress billing, which coincides with the revenuerecognition criteria.
Shipping and handling revenue coincides with therecognition of revenue from sale of the product.
Amounts received from customers prior to therecognition of revenue are accounted for as customer pre-payments and are included in accrued expenses.
Credit and Collections:
The Company maintains allowances for doubtfulaccounts receivable for estimated losses resulting fromeither customer disputes or the inability of its customers tomake required payments. If the financial condition of theCompany’s customers were to deteriorate, resulting in theirinability to make the required payments, the Companymay be required to record additional allowances orcharges against income. The Company determines itsallowance for doubtful accounts by first considering allknown collectibility problems of customers’ accounts, andthen applying certain percentages against the variousaging categories of the remaining receivables. Theresulting allowance for doubtful accounts receivable is anestimate based upon the Company’s knowledge of itsbusiness and customer base, and historical trends. TheCompany also establishes allowances, at the time revenueis recognized, for returns and allowances, discounts,pricing and other possible customer deductions. Theseallowances are based upon historical trends.
Cash and cash equivalents:
The cash balance includes cash and cash equivalentswhich have original maturities of less than three months.At June 30, 2005 and 2004 the bank balances included$8,881,000 and $916,000, respectively, in excess ofFDIC insurance limits.
Inventories:
Inventories are stated at the lower of cost or market.Cost is determined on the first-in, first-out basis.
Property, plant and equipment and relateddepreciation:
Property, plant and equipment are stated at cost.Major additions and betterments are capitalized whilemaintenance and repairs are expensed. For financialreporting purposes, depreciation is computed on thestraight-line method over the estimated useful lives of theassets as follows:
Buildings 31 –40 yearsMachinery and equipment 3 –10 yearsComputer software 3 – 8 years
255292_Fin_Sept14_10am.qxd 9/14/05 1:26 PM Page 24
25
Costs related to the purchase, internal development,and implementation of the Company’s business operatingsoftware system are either capitalized or expensed inaccordance with the American Institute of Certified PublicAccountants’ Statement of Position 98-1, “Accounting forthe Costs of Computer Software Developed or Obtainedfor Internal Use.” The current business operating softwarewas first implemented in January 2000. All costscapitalized for the business operating software are beingdepreciated over an eight year life from the date placed inservice. Other purchased computer software is beingdepreciated over periods ranging from three to five years.Leasehold improvements are depreciated over the shorterof fifteen years or the remaining term of the lease. TheCompany recorded $6,494,000 and $5,442,000 ofdepreciation expense in the years ended June 30, 2005and June 30, 2004, respectively.
Intangible assets:
Intangible assets consisting of customer lists, tradenames, patents and trademarks are recorded on theCompany’s balance sheet and are being amortized toexpense over periods ranging between twelve and fortyyears. The excess of cost over fair value of assets acquired(“goodwill”) was amortized to expense over periodsranging between fifteen and forty years through fiscal2002. Beginning in fiscal 2003, goodwill is no longeramortized, but is subject to review for impairment. Seeadditional information about goodwill and intangibles inNote 6. The Company periodically evaluates intangibleassets, goodwill and other long-lived assets for permanentimpairment. Impairments have been recorded only withrespect to goodwill (see Note 6).
Fair value of financial instruments:
The Company has financial instruments consistingprimarily of cash and cash equivalents, revolving lines ofcredit, and long-term debt. The fair value of these financialinstruments approximates carrying value because of theirshort-term maturity and/or variable, market-driven interestrates. The Company has no financial instruments withoff-balance sheet risk.
Contingencies:
The Company is party to various negotiations, customerbankruptcies, and legal proceedings arising in the normalcourse of business. In the opinion of management, theultimate disposition of these matters will not have a materialadverse effect on the Company’s financial position, results ofoperations, cash flows or liquidity. See also Note 12.
Employee benefit plans:
The Company has a defined contribution retirementplan and a discretionary profit sharing plan coveringsubstantially all of its employees, a second discretionaryprofit sharing plan covering employees of one subsidiary,and a non-qualified deferred compensation plan coveringcertain employees. The costs of employee benefit plansare charged to expense and funded annually. Total costswere $1,864,000 in 2005, $1,755,000 in 2004, and$1,500,000 in 2003. Additionally a $775,000 non-cashexpense was recorded in fiscal 2005 in accordance withvariable accounting procedures related to the deferredcompensation plan.
Advertising expense:
The Company recorded $631,000, $360,000 and$345,000 of advertising expense in 2005, 2004 and2003, respectively. Advertising costs are expensed the firsttime the advertising occurs. Expense related to printedproduct or capabilities literature, brochures, etc. is recordedon a ratable basis over the useful life of that printed media.
Income taxes:
The Company accounts for income taxes inaccordance with Statement of Financial AccountingStandards No. 109 (SFAS No. 109), accordinglydeferred income taxes are provided on items that arereported as either income or expense in different timeperiods for financial reporting purposes than they are forincome tax purposes. Deferred income tax assets andliabilities are reported on the Company’s balance sheet.See also Note 10.
255292_Fin_Sept14_10am.qxd 9/14/05 1:26 PM Page 25
26
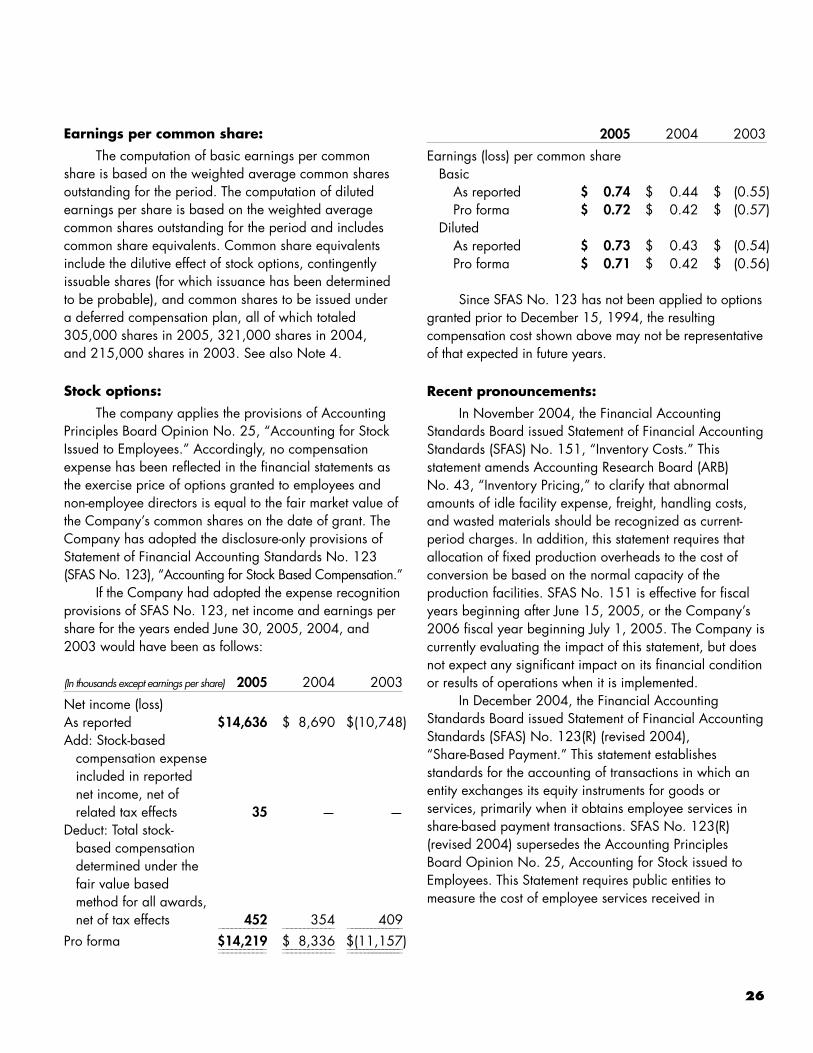
Earnings per common share:
The computation of basic earnings per commonshare is based on the weighted average common sharesoutstanding for the period. The computation of dilutedearnings per share is based on the weighted averagecommon shares outstanding for the period and includescommon share equivalents. Common share equivalentsinclude the dilutive effect of stock options, contingentlyissuable shares (for which issuance has been determinedto be probable), and common shares to be issued under a deferred compensation plan, all of which totaled305,000 shares in 2005, 321,000 shares in 2004, and 215,000 shares in 2003. See also Note 4.
Stock options:
The company applies the provisions of AccountingPrinciples Board Opinion No. 25, “Accounting for StockIssued to Employees.” Accordingly, no compensationexpense has been reflected in the financial statements asthe exercise price of options granted to employees andnon-employee directors is equal to the fair market value ofthe Company’s common shares on the date of grant. TheCompany has adopted the disclosure-only provisions ofStatement of Financial Accounting Standards No. 123(SFAS No. 123), “Accounting for Stock Based Compensation.”
If the Company had adopted the expense recognitionprovisions of SFAS No. 123, net income and earnings pershare for the years ended June 30, 2005, 2004, and2003 would have been as follows:
(In thousands except earnings per share) 2005 2004 2003
Net income (loss)As reported $14,636 $ 8,690 $(10,748)Add: Stock-based
compensation expense included in reported net income, net of related tax effects 35 — —
Deduct: Total stock-based compensation determined under thefair value basedmethod for all awards,net of tax effects 452 354 409___________ ____________ ______________
Pro forma $14,219 $ 8,336 $(11,157)___________ ____________ _________________________ ____________ ______________
2005 2004 2003
Earnings (loss) per common share Basic
As reported $ 0.74 $ 0.44 $ (0.55)Pro forma $ 0.72 $ 0.42 $ (0.57)
DilutedAs reported $ 0.73 $ 0.43 $ (0.54)Pro forma $ 0.71 $ 0.42 $ (0.56)
Since SFAS No. 123 has not been applied to optionsgranted prior to December 15, 1994, the resultingcompensation cost shown above may not be representativeof that expected in future years.
Recent pronouncements:
In November 2004, the Financial AccountingStandards Board issued Statement of Financial AccountingStandards (SFAS) No. 151, “Inventory Costs.” Thisstatement amends Accounting Research Board (ARB)No. 43, “Inventory Pricing,” to clarify that abnormalamounts of idle facility expense, freight, handling costs,and wasted materials should be recognized as current-period charges. In addition, this statement requires thatallocation of fixed production overheads to the cost ofconversion be based on the normal capacity of theproduction facilities. SFAS No. 151 is effective for fiscalyears beginning after June 15, 2005, or the Company’s2006 fiscal year beginning July 1, 2005. The Company iscurrently evaluating the impact of this statement, but doesnot expect any significant impact on its financial conditionor results of operations when it is implemented.
In December 2004, the Financial AccountingStandards Board issued Statement of Financial AccountingStandards (SFAS) No. 123(R) (revised 2004),“Share-Based Payment.” This statement establishesstandards for the accounting of transactions in which anentity exchanges its equity instruments for goods orservices, primarily when it obtains employee services inshare-based payment transactions. SFAS No. 123(R)(revised 2004) supersedes the Accounting PrinciplesBoard Opinion No. 25, Accounting for Stock issued toEmployees. This Statement requires public entities tomeasure the cost of employee services received in
255292_Fin_Sept14_10am.qxd 9/14/05 1:26 PM Page 26
27
exchange for an award of equity instruments based uponthe grant date fair value of the award, with this cost beingrecognized over the period during which an employee isrequired to provide the services. This statement is effectivefor the first fiscal year beginning after June 15, 2005, orthe Company’s first quarter of fiscal 2006 which beginsJuly 1, 2005. The Company is currently evaluating theimpact of this statement, but expects the impact to beconsistent with the pro forma information presented in thisNote 1 under “Stock options.”
In December 2004, the Financial AccountingStandards Board issued Statement of Financial AccountingStandards (SFAS) No. 153, “Exchanges of NonmonetaryAssets.” This statement addresses the measurement ofexchanges of nonmonetary assets and is effective for fiscalperiods beginning after June 15, 2005. The Company iscurrently evaluating the impact of this statement, but doesnot expect any significant impact on its financial conditionor results of operations when it is implemented.
In May 2005, the Financial Accounting StandardsBoard issued Statement of Financial Accounting Standards(SFAS) No. 154, “Accounting Changes and ErrorCorrections.” This statement replaces AccountingPrinciples Board (APB) Opinion No. 20, “AccountingChanges” and SFAS No. 3, “Reporting AccountingChanges in Interim Financial Statements,” and changesthe requirement for the accounting for and reporting of adirect effect of a voluntary change in accounting principle.It also applies to changes required by an accountingpronouncement in the instance that the pronouncementdoes not include specific transition provisions. SFAS No.154 requires retrospective application to prior periods’financial statements of changes in accounting principle,unless it is impracticable to determine either theperiod-specific effects or the cumulative effect of thechange. This statement also requires that a change indepreciation, amortization, or depletion method forlong-lived, non-financial assets be accounted for as achange in accounting estimate affected by a change inaccounting principle. This statement is effective foraccounting changes and error corrections made in fiscalyears beginning after December 15, 2005, or the
Company’s first quarter of fiscal year 2007 which beginsJuly 1, 2006. The Company will comply with theprovisions of this statement for any accounting changes orerror corrections that occur after June 30, 2006.
Comprehensive income:
The Company does not have any comprehensiveincome items other than net income.
Reclassification:
Certain reclassifications have been made to prioryear amounts in order to be consistent with the presentationfor the current year.
Use of estimates:
The preparation of the financial statements inconformity with accounting principles generally acceptedin the United States of America requires the Company tomake estimates and assumptions that affect the amountsreported in the financial statements and accompanyingnotes. Actual results could differ from those estimates.
NOTE 2 - BUSINESS SEGMENT INFORMATION
Effective July 1, 2003, the Company re-aligned itsbusiness segments and now operates in the following twobusiness segments: the Lighting Segment and the GraphicsSegment. The Company is organized such that the chiefoperating decision maker (the President and ChiefExecutive Officer) now receives financial and operatinginformation relative to these two business segments, andorganizationally, has a President of LSI Lighting SolutionsPlus and a President of LSI Graphics Solutions Plusreporting directly to him. In the seven years prior to fiscal2004, the Company reported business segments as theImage Segment and the Commercial/Industrial LightingSegment. All prior period information has been revised toreflect the Company’s new segments. The Company’s mostsignificant market is the petroleum/convenience storemarket with approximately 25%, 28%, and 29% of totalnet sales concentrated in this market in fiscal 2005, 2004,and 2003, respectively.
255292_Fin_Sept14_10am.qxd 9/14/05 1:26 PM Page 27
28
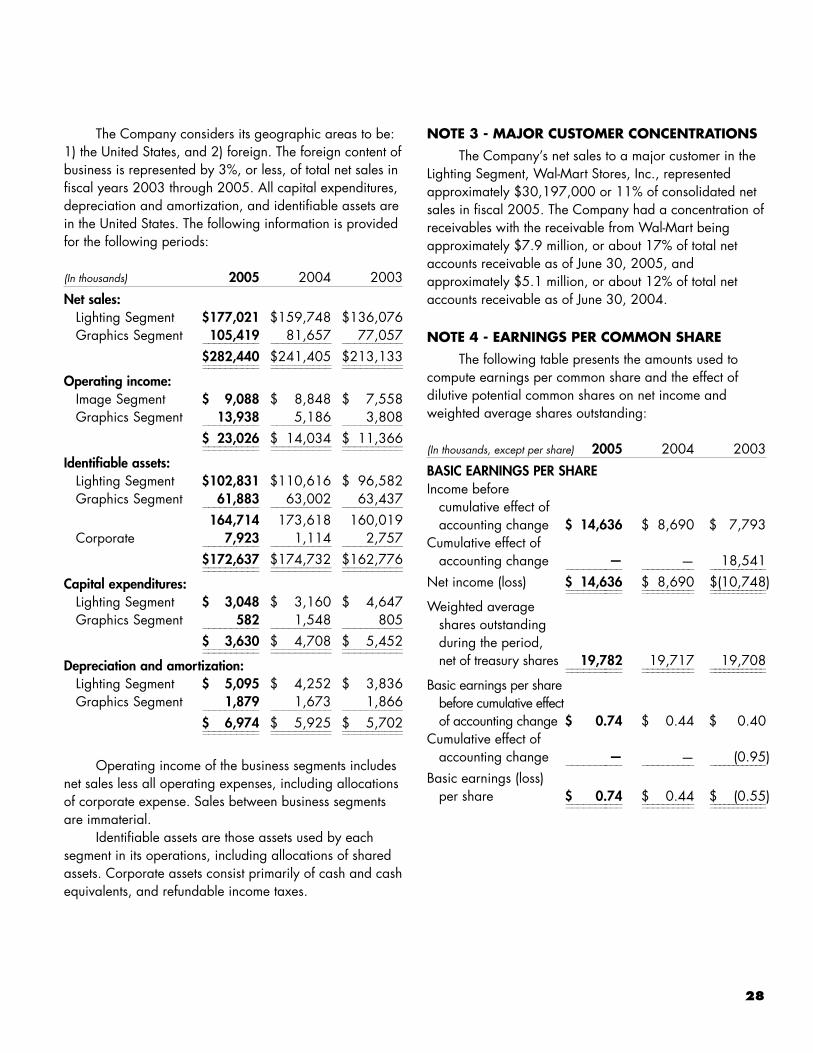
The Company considers its geographic areas to be:1) the United States, and 2) foreign. The foreign content ofbusiness is represented by 3%, or less, of total net sales infiscal years 2003 through 2005. All capital expenditures,depreciation and amortization, and identifiable assets arein the United States. The following information is providedfor the following periods:
(In thousands) 2005 2004 2003
Net sales:Lighting Segment $177,021 $159,748 $136,076Graphics Segment 105,419 81,657 77,057__________ __________ __________
$282,440 $241,405 $213,133__________ __________ ____________________ __________ __________
Operating income:Image Segment $ 9,088 $ 8,848 $ 7,558Graphics Segment 13,938 5,186 3,808__________ __________ __________
$ 23,026 $ 14,034 $ 11,366__________ __________ ____________________ __________ __________
Identifiable assets:Lighting Segment $102,831 $110,616 $ 96,582Graphics Segment 61,883 63,002 63,437__________ __________ __________
164,714 173,618 160,019Corporate 7,923 1,114 2,757__________ __________ __________
$172,637 $174,732 $162,776__________ __________ ____________________ __________ __________
Capital expenditures:Lighting Segment $ 3,048 $ 3,160 $ 4,647Graphics Segment 582 1,548 805__________ __________ __________
$ 3,630 $ 4,708 $ 5,452__________ __________ ____________________ __________ __________
Depreciation and amortization:Lighting Segment $ 5,095 $ 4,252 $ 3,836Graphics Segment 1,879 1,673 1,866__________ __________ __________
$ 6,974 $ 5,925 $ 5,702__________ __________ ____________________ __________ __________
Operating income of the business segments includesnet sales less all operating expenses, including allocationsof corporate expense. Sales between business segmentsare immaterial.
Identifiable assets are those assets used by eachsegment in its operations, including allocations of sharedassets. Corporate assets consist primarily of cash and cashequivalents, and refundable income taxes.
NOTE 3 - MAJOR CUSTOMER CONCENTRATIONS
The Company’s net sales to a major customer in theLighting Segment, Wal-Mart Stores, Inc., representedapproximately $30,197,000 or 11% of consolidated netsales in fiscal 2005. The Company had a concentration ofreceivables with the receivable from Wal-Mart beingapproximately $7.9 million, or about 17% of total netaccounts receivable as of June 30, 2005, andapproximately $5.1 million, or about 12% of total netaccounts receivable as of June 30, 2004.
NOTE 4 - EARNINGS PER COMMON SHARE
The following table presents the amounts used tocompute earnings per common share and the effect ofdilutive potential common shares on net income andweighted average shares outstanding:
(In thousands, except per share) 2005 2004 2003
BASIC EARNINGS PER SHAREIncome before
cumulative effect of accounting change $ 14,636 $ 8,690 $ 7,793
Cumulative effect of accounting change — — 18,541__________ __________ ____________
Net income (loss) $ 14,636 $ 8,690 $(10,748)__________ __________ ______________________ __________ ____________
Weighted average shares outstandingduring the period, net of treasury shares 19,782 19,717 19,708__________ __________ ______________________ __________ ____________
Basic earnings per share before cumulative effect of accounting change $ 0.74 $ 0.44 $ 0.40
Cumulative effect ofaccounting change — — (0.95)__________ __________ ____________
Basic earnings (loss)per share $ 0.74 $ 0.44 $ (0.55)__________ __________ ______________________ __________ ____________
255292_Fin_Sept14_10am.qxd 9/14/05 1:26 PM Page 28
29
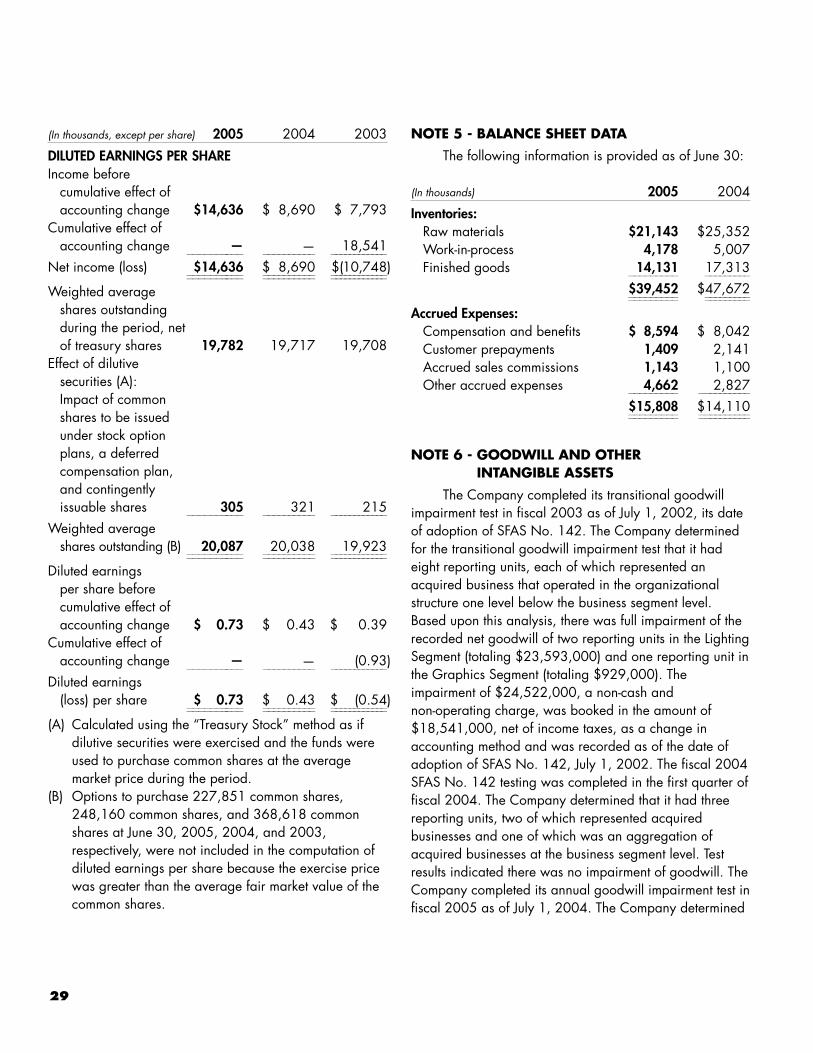
(In thousands, except per share) 2005 2004 2003
DILUTED EARNINGS PER SHAREIncome before
cumulative effect of accounting change $14,636 $ 8,690 $ 7,793
Cumulative effect ofaccounting change — — 18,541__________ __________ ____________
Net income (loss) $14,636 $ 8,690 $(10,748)__________ __________ ______________________ __________ ____________
Weighted average shares outstandingduring the period, net of treasury shares 19,782 19,717 19,708
Effect of dilutive securities (A):Impact of common shares to be issued under stock option plans, a deferred compensation plan, and contingently issuable shares 305 321 215__________ __________ ____________
Weighted average shares outstanding (B) 20,087 20,038 19,923__________ __________ ______________________ __________ ____________
Diluted earnings per share before cumulative effect of accounting change $ 0.73 $ 0.43 $ 0.39
Cumulative effect ofaccounting change — — (0.93)__________ __________ ____________
Diluted earnings (loss) per share $ 0.73 $ 0.43 $ (0.54)__________ __________ ______________________ __________ ____________
(A) Calculated using the “Treasury Stock” method as ifdilutive securities were exercised and the funds wereused to purchase common shares at the averagemarket price during the period.
(B) Options to purchase 227,851 common shares,248,160 common shares, and 368,618 commonshares at June 30, 2005, 2004, and 2003,respectively, were not included in the computation ofdiluted earnings per share because the exercise pricewas greater than the average fair market value of thecommon shares.
NOTE 5 - BALANCE SHEET DATA
The following information is provided as of June 30:
(In thousands) 2005 2004
Inventories:Raw materials $21,143 $25,352Work-in-process 4,178 5,007Finished goods 14,131 17,313_________ _________
$39,452 $47,672_________ __________________ _________
Accrued Expenses:Compensation and benefits $ 8,594 $ 8,042Customer prepayments 1,409 2,141Accrued sales commissions 1,143 1,100Other accrued expenses 4,662 2,827_________ __________
$15,808 $14,110_________ ___________________ __________
NOTE 6 - GOODWILL AND OTHER INTANGIBLE ASSETS
The Company completed its transitional goodwillimpairment test in fiscal 2003 as of July 1, 2002, its dateof adoption of SFAS No. 142. The Company determinedfor the transitional goodwill impairment test that it hadeight reporting units, each of which represented anacquired business that operated in the organizationalstructure one level below the business segment level.Based upon this analysis, there was full impairment of therecorded net goodwill of two reporting units in the LightingSegment (totaling $23,593,000) and one reporting unit inthe Graphics Segment (totaling $929,000). Theimpairment of $24,522,000, a non-cash andnon-operating charge, was booked in the amount of$18,541,000, net of income taxes, as a change inaccounting method and was recorded as of the date ofadoption of SFAS No. 142, July 1, 2002. The fiscal 2004SFAS No. 142 testing was completed in the first quarter offiscal 2004. The Company determined that it had threereporting units, two of which represented acquiredbusinesses and one of which was an aggregation ofacquired businesses at the business segment level. Testresults indicated there was no impairment of goodwill. TheCompany completed its annual goodwill impairment test infiscal 2005 as of July 1, 2004. The Company determined
255292_Fin_Sept14_10am.qxd 9/14/05 1:26 PM Page 29
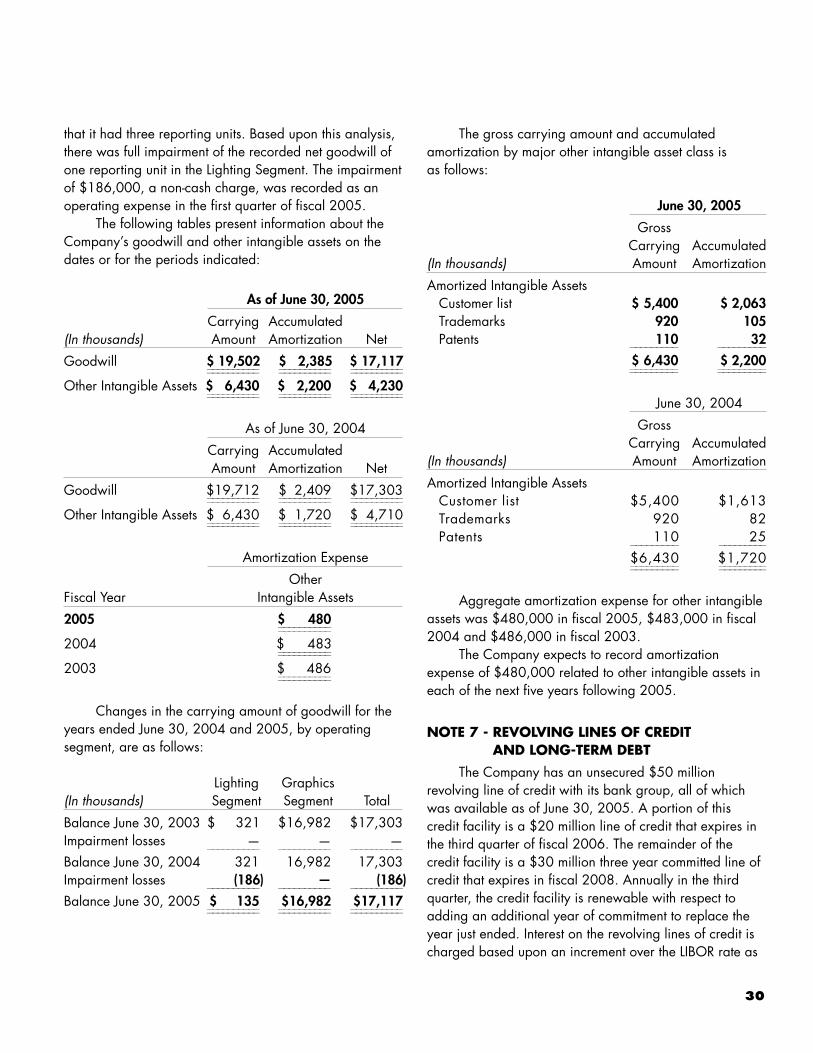
30
that it had three reporting units. Based upon this analysis,there was full impairment of the recorded net goodwill ofone reporting unit in the Lighting Segment. The impairmentof $186,000, a non-cash charge, was recorded as anoperating expense in the first quarter of fiscal 2005.
The following tables present information about theCompany’s goodwill and other intangible assets on thedates or for the periods indicated:
As of June 30, 2005
Carrying Accumulated(In thousands) Amount Amortization Net
Goodwill $ 19,502 $ 2,385 $ 17,117__________ __________ ____________________ __________ __________
Other Intangible Assets $ 6,430 $ 2,200 $ 4,230__________ __________ ____________________ __________ __________
As of June 30, 2004
Carrying AccumulatedAmount Amortization Net
Goodwill $19,712 $ 2,409 $17,303__________ __________ ____________________ __________ __________
Other Intangible Assets $ 6,430 $ 1,720 $ 4,710__________ __________ ____________________ __________ __________
Amortization Expense
Other Fiscal Year Intangible Assets
2005 $ 480____________________
2004 $ 483____________________
2003 $ 486____________________
Changes in the carrying amount of goodwill for theyears ended June 30, 2004 and 2005, by operatingsegment, are as follows:
Lighting Graphics(In thousands) Segment Segment Total
Balance June 30, 2003 $ 321 $16,982 $17,303Impairment losses — — —__________ __________ __________
Balance June 30, 2004 321 16,982 17,303Impairment losses (186) — (186)__________ __________ __________
Balance June 30, 2005 $ 135 $16,982 $17,117__________ __________ ____________________ __________ __________
The gross carrying amount and accumulatedamortization by major other intangible asset class is as follows:
June 30, 2005
GrossCarrying Accumulated
(In thousands) Amount Amortization
Amortized Intangible AssetsCustomer list $ 5,400 $ 2,063Trademarks 920 105Patents 110 32_________ _________
$ 6,430 $ 2,200_________ __________________ _________
June 30, 2004
GrossCarrying Accumulated
(In thousands) Amount Amortization
Amortized Intangible AssetsCustomer list $5,400 $1,613Trademarks 920 82Patents 110 25_________ _________
$6,430 $1,720_________ __________________ _________
Aggregate amortization expense for other intangibleassets was $480,000 in fiscal 2005, $483,000 in fiscal2004 and $486,000 in fiscal 2003.
The Company expects to record amortizationexpense of $480,000 related to other intangible assets ineach of the next five years following 2005.
NOTE 7 - REVOLVING LINES OF CREDIT AND LONG-TERM DEBT
The Company has an unsecured $50 millionrevolving line of credit with its bank group, all of whichwas available as of June 30, 2005. A portion of thiscredit facility is a $20 million line of credit that expires inthe third quarter of fiscal 2006. The remainder of thecredit facility is a $30 million three year committed line ofcredit that expires in fiscal 2008. Annually in the thirdquarter, the credit facility is renewable with respect toadding an additional year of commitment to replace theyear just ended. Interest on the revolving lines of credit ischarged based upon an increment over the LIBOR rate as
255292_Fin_Sept14_10am.qxd 9/14/05 1:26 PM Page 30
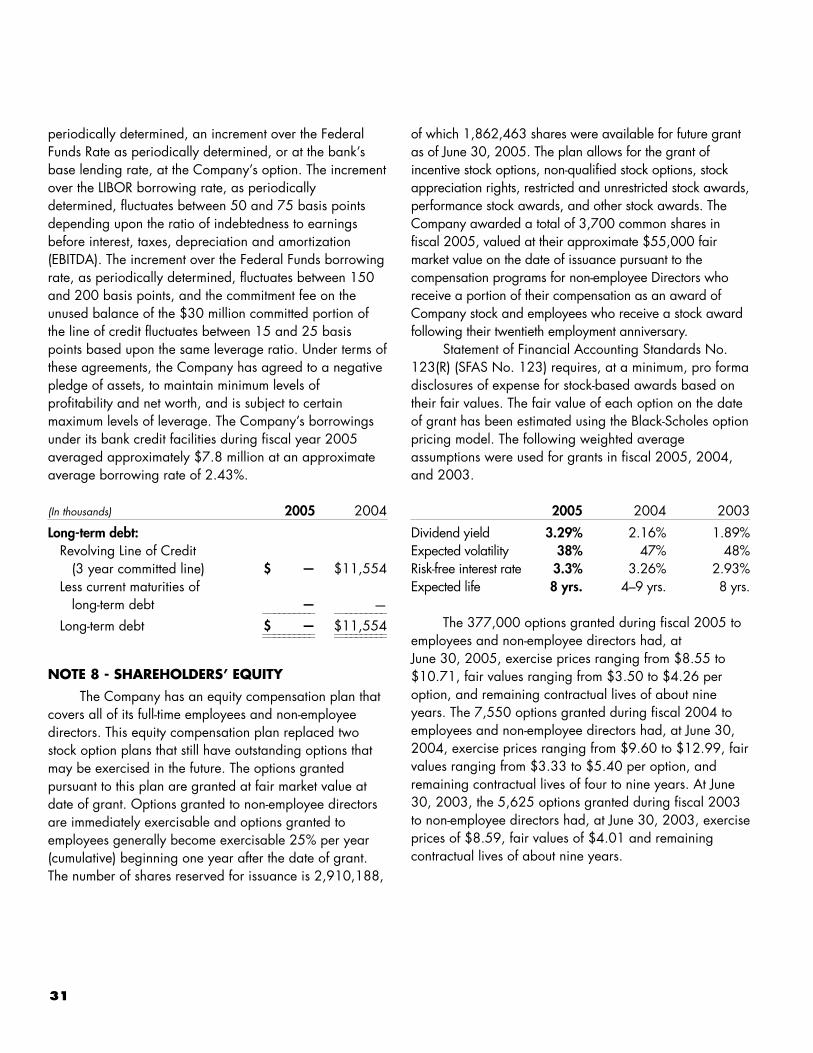
31
periodically determined, an increment over the FederalFunds Rate as periodically determined, or at the bank’sbase lending rate, at the Company’s option. The incrementover the LIBOR borrowing rate, as periodicallydetermined, fluctuates between 50 and 75 basis pointsdepending upon the ratio of indebtedness to earningsbefore interest, taxes, depreciation and amortization(EBITDA). The increment over the Federal Funds borrowingrate, as periodically determined, fluctuates between 150and 200 basis points, and the commitment fee on theunused balance of the $30 million committed portion ofthe line of credit fluctuates between 15 and 25 basispoints based upon the same leverage ratio. Under terms ofthese agreements, the Company has agreed to a negativepledge of assets, to maintain minimum levels ofprofitability and net worth, and is subject to certainmaximum levels of leverage. The Company’s borrowingsunder its bank credit facilities during fiscal year 2005averaged approximately $7.8 million at an approximateaverage borrowing rate of 2.43%.
(In thousands) 2005 2004
Long-term debt:Revolving Line of Credit
(3 year committed line) $ — $11,554Less current maturities of
long-term debt — —__________ __________
Long-term debt $ — $11,554__________ ____________________ __________
NOTE 8 - SHAREHOLDERS’ EQUITY
The Company has an equity compensation plan thatcovers all of its full-time employees and non-employeedirectors. This equity compensation plan replaced twostock option plans that still have outstanding options thatmay be exercised in the future. The options grantedpursuant to this plan are granted at fair market value atdate of grant. Options granted to non-employee directorsare immediately exercisable and options granted toemployees generally become exercisable 25% per year(cumulative) beginning one year after the date of grant.The number of shares reserved for issuance is 2,910,188,
of which 1,862,463 shares were available for future grantas of June 30, 2005. The plan allows for the grant ofincentive stock options, non-qualified stock options, stockappreciation rights, restricted and unrestricted stock awards,performance stock awards, and other stock awards. TheCompany awarded a total of 3,700 common shares infiscal 2005, valued at their approximate $55,000 fairmarket value on the date of issuance pursuant to thecompensation programs for non-employee Directors whoreceive a portion of their compensation as an award ofCompany stock and employees who receive a stock awardfollowing their twentieth employment anniversary.
Statement of Financial Accounting Standards No.123(R) (SFAS No. 123) requires, at a minimum, pro formadisclosures of expense for stock-based awards based ontheir fair values. The fair value of each option on the dateof grant has been estimated using the Black-Scholes optionpricing model. The following weighted averageassumptions were used for grants in fiscal 2005, 2004,and 2003.
2005 2004 2003
Dividend yield 3.29% 2.16% 1.89%Expected volatility 38% 47% 48%Risk-free interest rate 3.3% 3.26% 2.93%Expected life 8 yrs. 4–9 yrs. 8 yrs.
The 377,000 options granted during fiscal 2005 toemployees and non-employee directors had, atJune 30, 2005, exercise prices ranging from $8.55 to$10.71, fair values ranging from $3.50 to $4.26 peroption, and remaining contractual lives of about nineyears. The 7,550 options granted during fiscal 2004 toemployees and non-employee directors had, at June 30,2004, exercise prices ranging from $9.60 to $12.99, fairvalues ranging from $3.33 to $5.40 per option, andremaining contractual lives of four to nine years. At June30, 2003, the 5,625 options granted during fiscal 2003to non-employee directors had, at June 30, 2003, exerciseprices of $8.59, fair values of $4.01 and remainingcontractual lives of about nine years.
255292_Fin_Sept14_10am.qxd 9/14/05 1:26 PM Page 31
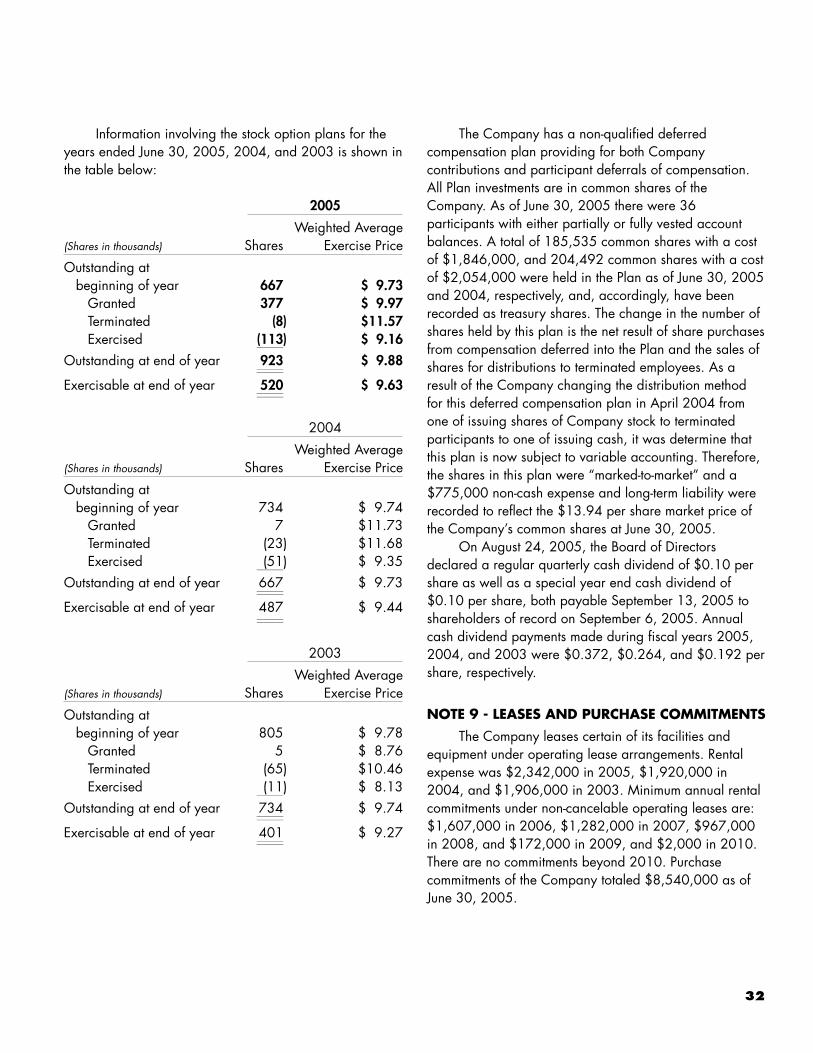
32
Information involving the stock option plans for theyears ended June 30, 2005, 2004, and 2003 is shown inthe table below:
2005
Weighted Average(Shares in thousands) Shares Exercise Price
Outstanding at beginning of year 667 $ 9.73
Granted 377 $ 9.97Terminated (8) $11.57Exercised (113) $ 9.16____
Outstanding at end of year 923 $ 9.88________
Exercisable at end of year 520 $ 9.63________
2004
Weighted Average(Shares in thousands) Shares Exercise Price
Outstanding at beginning of year 734 $ 9.74
Granted 7 $11.73Terminated (23) $11.68Exercised (51) $ 9.35____
Outstanding at end of year 667 $ 9.73________
Exercisable at end of year 487 $ 9.44________
2003
Weighted Average(Shares in thousands) Shares Exercise Price
Outstanding at beginning of year 805 $ 9.78
Granted 5 $ 8.76Terminated (65) $10.46Exercised (11) $ 8.13____
Outstanding at end of year 734 $ 9.74________
Exercisable at end of year 401 $ 9.27________
The Company has a non-qualified deferredcompensation plan providing for both Companycontributions and participant deferrals of compensation.All Plan investments are in common shares of theCompany. As of June 30, 2005 there were 36participants with either partially or fully vested accountbalances. A total of 185,535 common shares with a costof $1,846,000, and 204,492 common shares with a costof $2,054,000 were held in the Plan as of June 30, 2005and 2004, respectively, and, accordingly, have beenrecorded as treasury shares. The change in the number ofshares held by this plan is the net result of share purchasesfrom compensation deferred into the Plan and the sales ofshares for distributions to terminated employees. As aresult of the Company changing the distribution methodfor this deferred compensation plan in April 2004 fromone of issuing shares of Company stock to terminatedparticipants to one of issuing cash, it was determine thatthis plan is now subject to variable accounting. Therefore,the shares in this plan were “marked-to-market” and a$775,000 non-cash expense and long-term liability wererecorded to reflect the $13.94 per share market price ofthe Company’s common shares at June 30, 2005.
On August 24, 2005, the Board of Directorsdeclared a regular quarterly cash dividend of $0.10 pershare as well as a special year end cash dividend of$0.10 per share, both payable September 13, 2005 toshareholders of record on September 6, 2005. Annualcash dividend payments made during fiscal years 2005,2004, and 2003 were $0.372, $0.264, and $0.192 pershare, respectively.
NOTE 9 - LEASES AND PURCHASE COMMITMENTS
The Company leases certain of its facilities andequipment under operating lease arrangements. Rentalexpense was $2,342,000 in 2005, $1,920,000 in2004, and $1,906,000 in 2003. Minimum annual rentalcommitments under non-cancelable operating leases are:$1,607,000 in 2006, $1,282,000 in 2007, $967,000in 2008, and $172,000 in 2009, and $2,000 in 2010.There are no commitments beyond 2010. Purchasecommitments of the Company totaled $8,540,000 as ofJune 30, 2005.
255292_Fin_Sept14_10am.qxd 9/14/05 1:26 PM Page 32
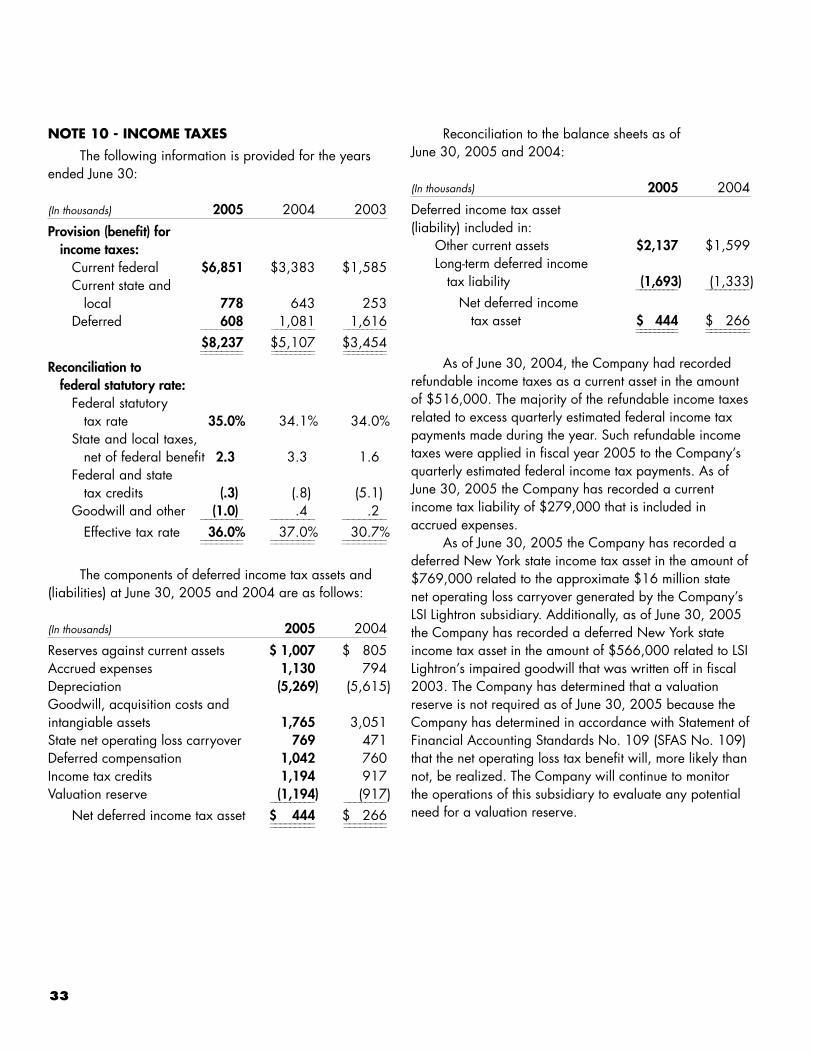
33
NOTE 10 - INCOME TAXES
The following information is provided for the yearsended June 30:
(In thousands) 2005 2004 2003
Provision (benefit) for income taxes:
Current federal $6,851 $3,383 $1,585Current state and
local 778 643 253Deferred 608 1,081 1,616________ _________ _________
$8,237 $5,107 $3,454________ _________ _________________ _________ _________
Reconciliation to federal statutory rate:
Federal statutory tax rate 35.0% 34.1% 34.0%
State and local taxes,net of federal benefit 2.3 3.3 1.6
Federal and state tax credits (.3) (.8) (5.1)
Goodwill and other (1.0) .4 .2________ ________ ________
Effective tax rate 36.0% 37.0% 30.7%________ ________ ________________ ________ ________
The components of deferred income tax assets and(liabilities) at June 30, 2005 and 2004 are as follows:
(In thousands) 2005 2004
Reserves against current assets $ 1,007 $ 805Accrued expenses 1,130 794Depreciation (5,269) (5,615)Goodwill, acquisition costs and intangiable assets 1,765 3,051State net operating loss carryover 769 471Deferred compensation 1,042 760Income tax credits 1,194 917Valuation reserve (1,194) (917)_________ ________
Net deferred income tax asset $ 444 $ 266_________ _________________ ________
Reconciliation to the balance sheets as ofJune 30, 2005 and 2004:
(In thousands) 2005 2004
Deferred income tax asset (liability) included in:
Other current assets $2,137 $1,599Long-term deferred income
tax liability (1,693) (1,333)_________ _________
Net deferred incometax asset $ 444 $ 266_________ __________________ _________
As of June 30, 2004, the Company had recordedrefundable income taxes as a current asset in the amountof $516,000. The majority of the refundable income taxesrelated to excess quarterly estimated federal income taxpayments made during the year. Such refundable incometaxes were applied in fiscal year 2005 to the Company’squarterly estimated federal income tax payments. As ofJune 30, 2005 the Company has recorded a currentincome tax liability of $279,000 that is included inaccrued expenses.
As of June 30, 2005 the Company has recorded adeferred New York state income tax asset in the amount of$769,000 related to the approximate $16 million statenet operating loss carryover generated by the Company’sLSI Lightron subsidiary. Additionally, as of June 30, 2005the Company has recorded a deferred New York stateincome tax asset in the amount of $566,000 related to LSILightron’s impaired goodwill that was written off in fiscal2003. The Company has determined that a valuationreserve is not required as of June 30, 2005 because theCompany has determined in accordance with Statement ofFinancial Accounting Standards No. 109 (SFAS No. 109)that the net operating loss tax benefit will, more likely thannot, be realized. The Company will continue to monitorthe operations of this subsidiary to evaluate any potentialneed for a valuation reserve.
255292_Fin_Sept14_10am.qxd 9/14/05 1:26 PM Page 33
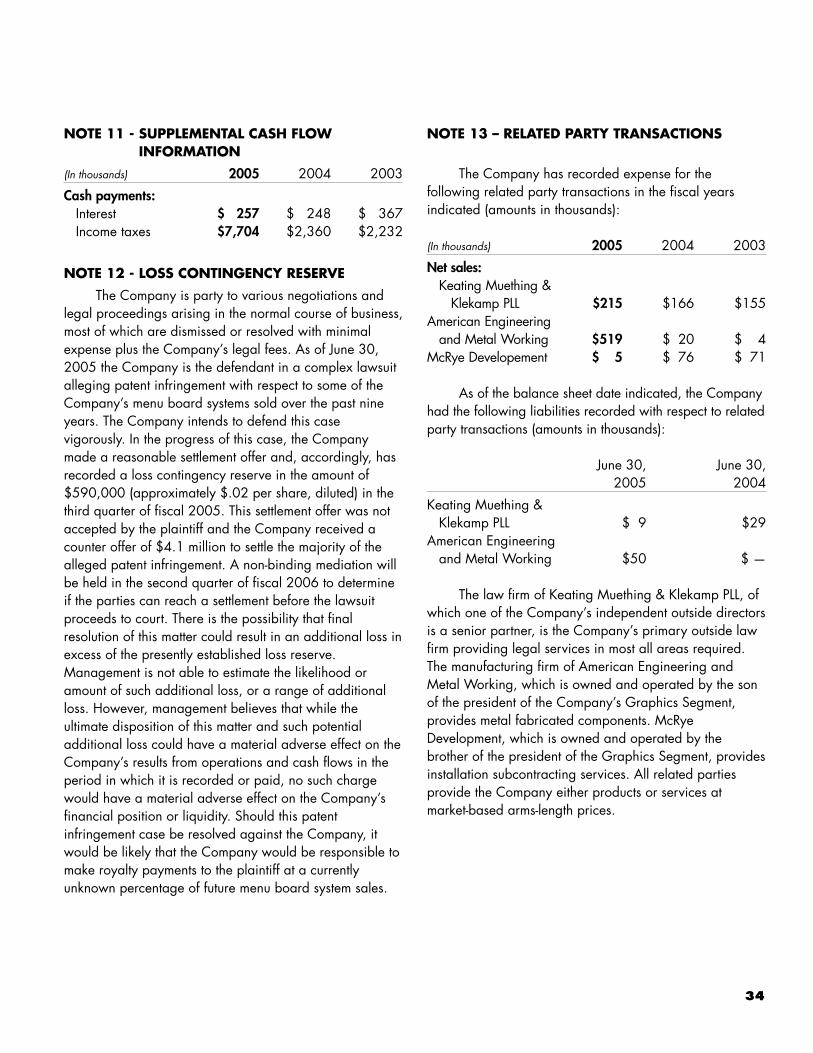
34
NOTE 11 - SUPPLEMENTAL CASH FLOWINFORMATION
(In thousands) 2005 2004 2003
Cash payments:Interest $ 257 $ 248 $ 367Income taxes $7,704 $2,360 $2,232
NOTE 12 - LOSS CONTINGENCY RESERVE
The Company is party to various negotiations andlegal proceedings arising in the normal course of business,most of which are dismissed or resolved with minimalexpense plus the Company’s legal fees. As of June 30,2005 the Company is the defendant in a complex lawsuitalleging patent infringement with respect to some of theCompany’s menu board systems sold over the past nineyears. The Company intends to defend this casevigorously. In the progress of this case, the Companymade a reasonable settlement offer and, accordingly, hasrecorded a loss contingency reserve in the amount of$590,000 (approximately $.02 per share, diluted) in thethird quarter of fiscal 2005. This settlement offer was notaccepted by the plaintiff and the Company received acounter offer of $4.1 million to settle the majority of thealleged patent infringement. A non-binding mediation willbe held in the second quarter of fiscal 2006 to determineif the parties can reach a settlement before the lawsuitproceeds to court. There is the possibility that finalresolution of this matter could result in an additional loss inexcess of the presently established loss reserve.Management is not able to estimate the likelihood oramount of such additional loss, or a range of additionalloss. However, management believes that while theultimate disposition of this matter and such potentialadditional loss could have a material adverse effect on theCompany’s results from operations and cash flows in theperiod in which it is recorded or paid, no such chargewould have a material adverse effect on the Company’sfinancial position or liquidity. Should this patentinfringement case be resolved against the Company, itwould be likely that the Company would be responsible tomake royalty payments to the plaintiff at a currentlyunknown percentage of future menu board system sales.
NOTE 13 – RELATED PARTY TRANSACTIONS
The Company has recorded expense for thefollowing related party transactions in the fiscal yearsindicated (amounts in thousands):
(In thousands) 2005 2004 2003
Net sales:Keating Muething &
Klekamp PLL $215 $166 $155American Engineering
and Metal Working $519 $ 20 $ 4McRye Developement $ 5 $ 76 $ 71
As of the balance sheet date indicated, the Companyhad the following liabilities recorded with respect to relatedparty transactions (amounts in thousands):
June 30, June 30,2005 2004
Keating Muething & Klekamp PLL $ 9 $29
American Engineering and Metal Working $50 $ —
The law firm of Keating Muething & Klekamp PLL, ofwhich one of the Company’s independent outside directorsis a senior partner, is the Company’s primary outside lawfirm providing legal services in most all areas required.The manufacturing firm of American Engineering andMetal Working, which is owned and operated by the sonof the president of the Company’s Graphics Segment,provides metal fabricated components. McRyeDevelopment, which is owned and operated by thebrother of the president of the Graphics Segment, providesinstallation subcontracting services. All related partiesprovide the Company either products or services atmarket-based arms-length prices.
255292_Fin_Sept14_10am.qxd 9/14/05 1:26 PM Page 34
35
NOTE 14 - SUMMARY OF QUARTERLY RESULTS (UNAUDITED)Quarter Ended Fiscal
(In thousands except per share data) Sept. 30 Dec. 31 March 31 June 30 Year2005
Net sales $68,335 $74,299 $67,814 $71,992 $282,440Gross profit 17,805 20,006 15,379 19,106 72,296Net Income 3,316 4,792 2,422 4,106(a) 14,636
Earnings per shareBasic $ 0.17 $ 0.24 $ 0.12 $ 0.21 $ 0.74Diluted $ 0.17 $ 0.24 $ 0.12 $ 0.20 $ 0.73
Range of share pricesHigh $ 11.62 $ 11.50 $ 12.09 $ 14.36 $ 14.36Low $ 8.40 $ 9.48 $ 9.84 $ 10.85 $ 8.40
2004Net sales $59,099 $64,116 $51,500 $66,690 $241,405Gross profit 15,223 18,231 11,810 14,258(c) 59,522Net income 2,601 4,006 920 1,163 8,690
Earnings per shareBasic $ 0.13 $ 0.20 $ 0.05 $ 0.06 $ 0.44Diluted $ 0.13 $ 0.20 $ 0.05 $ 0.06 $ 0.43(b)
Range of share pricesHigh $ 11.95 $ 13.63 $ 14.79 $ 13.03 $ 14.79Low $ 8.40 $ 10.19 $ 11.15 $ 9.00 $ 8.40
2003Net sales $56,045 $57,275 $44,228 $55,585 $213,133Gross profit 15,054 15,020 10,562 14,531 55,167Income before
cumultive effect ofaccounting change 2,215 2,687 468 2,423 7,793
Net income (loss) (16,326)(d) 2,687 468 2,423 (10,748)(d)Earnings per share before cumulative
effect of accounting changeBasic $ 0.11 $ 0.14 $ 0.02 $ 0.12 $ 0.40Diluted $ 0.11 $ 0.14 $ 0.02 $ 0.12 $ 0.39
Earnings (loss) per shareBasic $ (0.83) $ 0.14 $ 0.02 $ 0.12 $ (0.55)Diluted $ (0.82) $ 0.14 $ 0.02 $ 0.12 $ (0.54)
Range of share pricesHigh $ 14.83 $ 11.60 $ 11.29 $ 10.91 $ 14.83Low $ 7.12 $ 7.15 $ 6.59 $ 6.88 $ 6.59
(a) The fourth quarter of fiscal 2005 includes a $775,000 non-cash expense ($469,000 net of taxes) associated with “marking-to-market” the Company’scommon shares held in its non-qualified deferred compensation plan in accordance with variable accounting procedures.
(b) The total of the earnings per share for each of the four quarters does not equal the total earnings per share for the full year because the calculationsare based on the average shares outstanding during each of the individual periods.
(c) The fourth quarter of fiscal 2004 includes $1,086,000 of net unfavorable inventory adjustments in the Lighting Segment.(d) See Note 6 for discussion of an accounting change related to goodwill impairment.
At August 18, 2005, there were 385 shareholders of record. The Company believes this represents approximately3,000 beneficial shareholders.
255292_Fin_Sept14_10am.qxd 9/14/05 1:26 PM Page 35
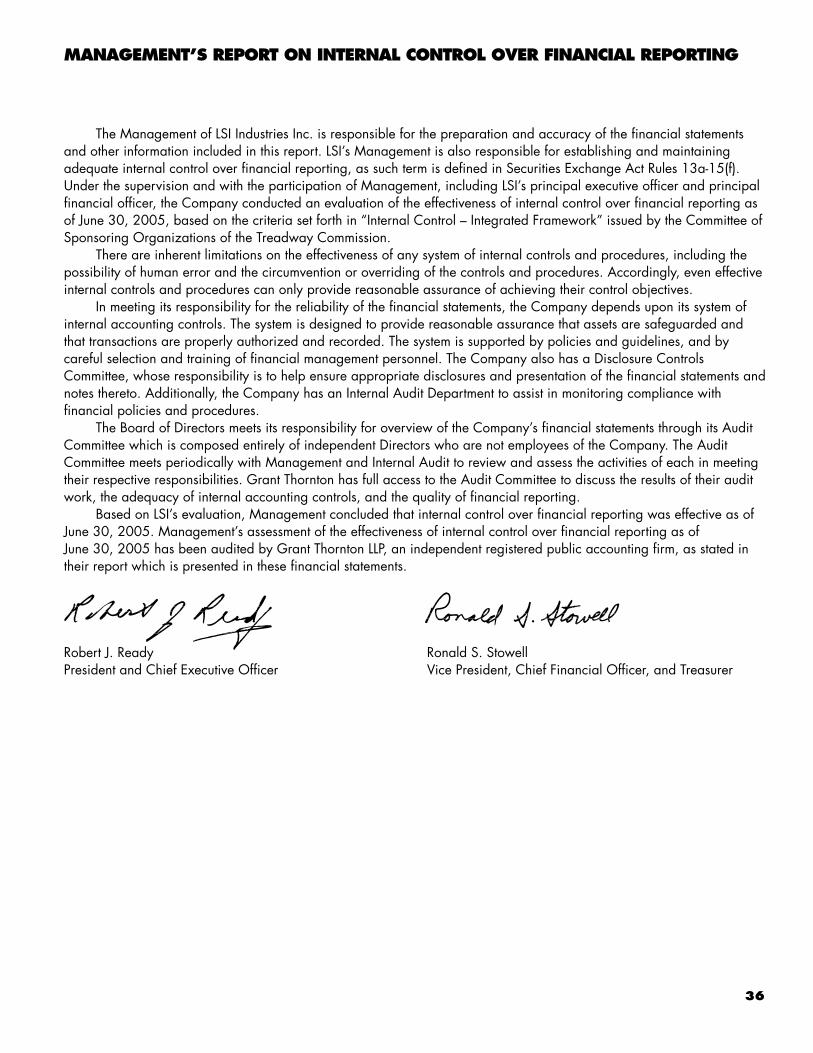
36
The Management of LSI Industries Inc. is responsible for the preparation and accuracy of the financial statementsand other information included in this report. LSI’s Management is also responsible for establishing and maintainingadequate internal control over financial reporting, as such term is defined in Securities Exchange Act Rules 13a-15(f).Under the supervision and with the participation of Management, including LSI’s principal executive officer and principalfinancial officer, the Company conducted an evaluation of the effectiveness of internal control over financial reporting asof June 30, 2005, based on the criteria set forth in “Internal Control – Integrated Framework” issued by the Committee ofSponsoring Organizations of the Treadway Commission.
There are inherent limitations on the effectiveness of any system of internal controls and procedures, including thepossibility of human error and the circumvention or overriding of the controls and procedures. Accordingly, even effectiveinternal controls and procedures can only provide reasonable assurance of achieving their control objectives.
In meeting its responsibility for the reliability of the financial statements, the Company depends upon its system ofinternal accounting controls. The system is designed to provide reasonable assurance that assets are safeguarded andthat transactions are properly authorized and recorded. The system is supported by policies and guidelines, and bycareful selection and training of financial management personnel. The Company also has a Disclosure ControlsCommittee, whose responsibility is to help ensure appropriate disclosures and presentation of the financial statements andnotes thereto. Additionally, the Company has an Internal Audit Department to assist in monitoring compliance withfinancial policies and procedures.
The Board of Directors meets its responsibility for overview of the Company’s financial statements through its AuditCommittee which is composed entirely of independent Directors who are not employees of the Company. The AuditCommittee meets periodically with Management and Internal Audit to review and assess the activities of each in meetingtheir respective responsibilities. Grant Thornton has full access to the Audit Committee to discuss the results of their auditwork, the adequacy of internal accounting controls, and the quality of financial reporting.
Based on LSI’s evaluation, Management concluded that internal control over financial reporting was effective as ofJune 30, 2005. Management’s assessment of the effectiveness of internal control over financial reporting as ofJune 30, 2005 has been audited by Grant Thornton LLP, an independent registered public accounting firm, as stated intheir report which is presented in these financial statements.
Robert J. Ready Ronald S. StowellPresident and Chief Executive Officer Vice President, Chief Financial Officer, and Treasurer
MANAGEMENT’S REPORT ON INTERNAL CONTROL OVER FINANCIAL REPORTING
255292_Fin_Sept14_10am.qxd 9/14/05 1:26 PM Page 36
37
Board of Directors andShareholders of LSI Industries Inc.
We have audited the accompanying consolidated balance sheets of LSI Industries Inc. (an Ohio Corporation) andsubsidiaries as of June 30, 2005 and 2004, and the related consolidated statements of income, stockholders’ equity, andcash flows for each of the three years in the period ended June 30, 2005. These financial statements are theresponsibility of the Company’s management. Our responsibility is to express an opinion on these financial statementsbased on our audits.
We conducted our audits in accordance with the standards of the Public Company Accounting Oversight Board(United States). Those standards require that we plan and perform the audit to obtain reasonable assurance aboutwhether the financial statements are free of material misstatement. An audit includes examining, on a test basis, evidencesupporting the amounts and disclosures in the financial statements. An audit also includes assessing the accountingprinciples used and significant estimates made by management, as well as evaluating the overall financial statementpresentation. We believe that our audits provide a reasonable basis for our opinion.
In our opinion, the consolidated financial statements referred to above present fairly, in all material respects, thefinancial position of LSI Industries Inc. and subsidiaries as of June 30, 2005 and 2004, and the results of their operationsand their cash flows for each of the three years in the period ended June 30, 2005 in conformity with accountingprinciples generally accepted in the United States of America.
We also have audited, in accordance with the standards of the Public Company Accounting Oversight Board(United States), the effectiveness of LSI Industries Inc.’s internal control over financial reporting as of June 30, 2005, basedon criteria established in Internal Control – Integrated Framework issued by the Committee of Sponsoring Organizations ofthe Treadway Commission and our report dated August 19, 2005 expressed an unqualified opinion therein.
Cincinnati, OhioAugust 19, 2005
REPORT OF INDEPENDENT REGISTERED PUBLIC ACCOUNTING FIRM
255292_Fin_Sept14_10am.qxd 9/14/05 1:26 PM Page 37
38
Board of Directors andShareholders of LSI Industries Inc.
We have audited management’s assessment, included in the accompanying Report of Management on Internal Controlover Financial Reporting, that LSI Industries Inc. (an Ohio Corporation) maintained effective internal control over financialreporting as of June 30, 2005, based on criteria established in Internal Control–Integrated Framework issued by theCommittee of Sponsoring Organizations of the Treadway Commission (the COSO criteria). LSI Industries Inc.’s managementis responsible for maintaining effective internal control over financial reporting and for its assessment of the effectiveness ofinternal control over financial reporting. Our responsibility is to express an opinion on management’s assessment and anopinion on the effectiveness of the company’s internal control over financial reporting based on our audit.
We conducted our audit in accordance with the standards of the Public Company Accounting Oversight Board(United States). Those standards require that we plan and perform the audit to obtain reasonable assurance aboutwhether effective internal control over financial reporting was maintained in all material respects. Our audit includedobtaining an understanding of internal control over financial reporting, evaluating management’s assessment, testing andevaluating the design and operating effectiveness of internal control, and performing such other procedures as weconsidered necessary in the circumstances. We believe that our audit provides a reasonable basis for our opinion.
A company’s internal control over financial reporting is a process designed to provide reasonable assuranceregarding the reliability of financial reporting and the preparation of financial statements for external purposes inaccordance with generally accepted accounting principles. A company’s internal control over financial reporting includesthose policies and procedures that (1) pertain to the maintenance of records that, in reasonable detail, accurately andfairly reflect the transactions and dispositions of the assets of the company; (2) provide reasonable assurance thattransactions are recorded as necessary to permit preparation of financial statements in accordance with generallyaccepted accounting principles, and that receipts and expenditures of the company are being made only in accordancewith authorizations of management and directors of the company; and (3) provide reasonable assurance regardingprevention or timely detection of unauthorized acquisition, use, or disposition of the company’s assets that could have amaterial effect on the financial statements.
Because of its inherent limitations, internal control over financial reporting may not prevent or detect misstatements.Also, projections of any evaluation of effectiveness to future periods are subject to the risk that controls may becomeinadequate because of changes in conditions, or that the degree of compliance with the policies or procedures maydeteriorate.
In our opinion, management’s assessment that LSI Industries Inc. maintained effective internal control over financialreporting as of June 30, 2005, is fairly stated, in all material respects, based on the COSO criteria. Also, in our opinion,LSI Industries Inc. maintained, in all material respects, effective internal control over financial reporting as ofJune 30, 2005, based on the COSO criteria.
We have also audited, in accordance with the standards of the Public Company Accounting Oversight Board(United States), the consolidated balance sheets of LSI Industries Inc. and subsidiaries as of June 30, 2005 and 2004,and the related consolidated statements of income, shareholders’ equity and cash flows for each of the three years in theperiod ended June 30, 2005 and our report dated August 19, 2005 expressed an unqualified opinion on those financialstatements.
Cincinnati, OhioAugust 19, 2005
REPORT OF INDEPENDENT REGISTERED PUBLIC ACCOUNTING FIRM
255292_Fin_Sept14_10am.qxd 9/14/05 1:26 PM Page 38
39
SELECTED FINANCIAL DATA LSI INDUSTRIES INC.
The following data has been selected from the Consolidated Financial Statements of the Company for the periods anddates indicated:
Income Statement Data:(In thousands except per share) 2005 2004 2003 2002 2001
Net sales $282,440 $241,405 $213,133 $259,261 $233,940Cost of products sold 210,144 181,883 157,966 186,838 168,471Operating expenses 49,084 45,488 43,801 49,039 48,175Goodwill impairment 186 — — — —____________ _____________ _____________ _____________ _____________
Operating income 23,026 14,034 11,366 23,384 17,294Interest (income) (64) (23) (259) (51) (630)Interest expense 217 260 378 575 607____________ _____________ _____________ _____________ _____________
Income from continuing operations before income taxes 22,873 13,797 11,247 22,860 17,317
Income taxes 8,237 5,107 3,454 8,674 6,716____________ _____________ _____________ _____________ _____________
Income from continuing operations before cumulativeeffect of accounting change and discontinued operations 14,636 8,690 7,793 14,186 10,601
Cumulative effect of accountingchange, net of tax (a) — — 18,541 — —
Discontinued operations — — — — 723____________ _____________ _____________ _____________ _____________
Net income (loss) $ 14,636 $ 8,690 $ (10,748) $ 14,186 $ 9,878____________ _____________ _____________ _____________ _________________________ _____________ _____________ _____________ _____________
Earnings per common share from continuing operations before cumulative effect of accounting change and discontinued operations
Basic $ 0.74 $ 0.44 $ 0.40 $ 0.72 $ 0.55Diluted $ 0.73 $ 0.43 $ 0.39 $ 0.71 $ 0.54
Earnings (loss) per common share Basic $ 0.74 $ 0.44 $ (0.55) $ .72 $ 0.51Diluted $ 0.73 $ 0.43 $ (0.54) $ .71 $ 0.50
Cash dividends paid per share $ 0.37 $ 0.26 $ 0.19 $ .19 $ 0.21Weighted average common shares
Basic 19,782 19,717 19,708 19,644 19,421Diluted 20,087 20,038 19,923 20,059 19,731
Balance Sheet Data:(At June 30; in thousands) 2005 2004 2003 2002 2001
Working capital $ 67,189 $ 64,724 $ 59,633 $ 55,793 $ 62,119Total assets 172,637 174,732 162,776 189,842 181,759Long-term debt, including current maturities — 11,554 14,084 18,053 23,990Shareholders’ equity 138,040 128,863 124,905 139,349 127,193
(a) See Footnote No. 6 to the financial statements.
255292_Fin_Sept14_10am.qxd 9/14/05 1:26 PM Page 39
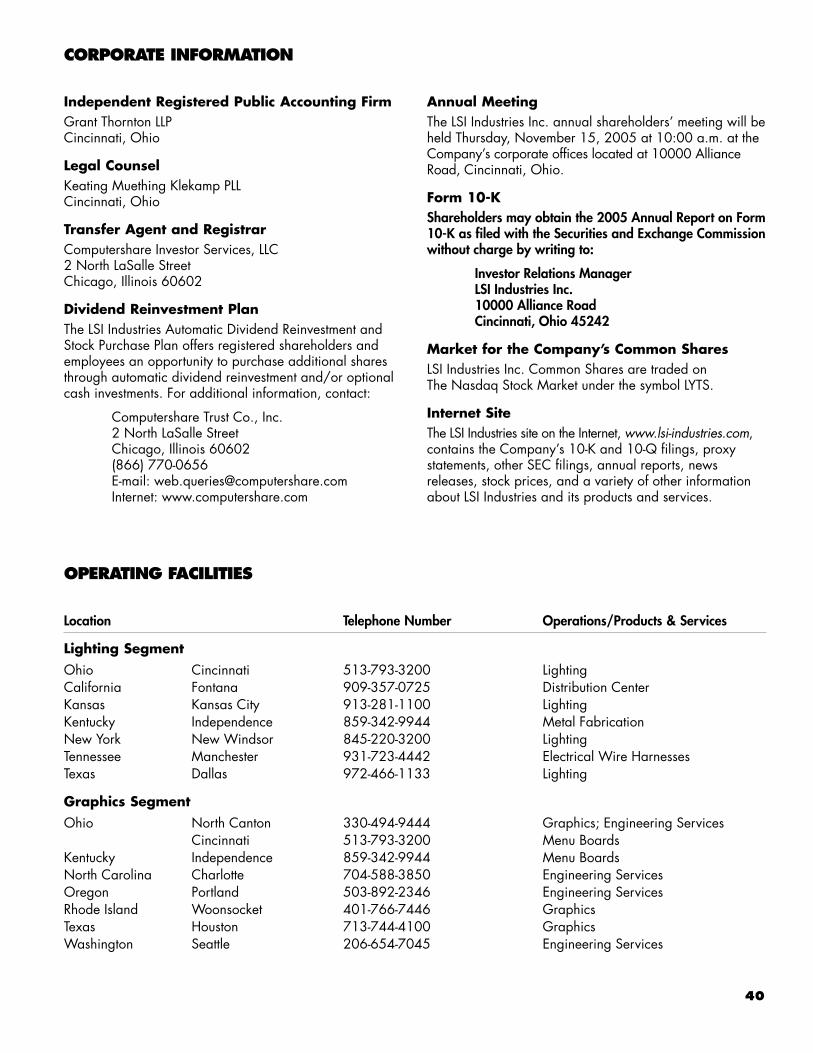
40
Location Telephone Number Operations/Products & Services
Lighting SegmentOhio Cincinnati 513-793-3200 LightingCalifornia Fontana 909-357-0725 Distribution CenterKansas Kansas City 913-281-1100 LightingKentucky Independence 859-342-9944 Metal FabricationNew York New Windsor 845-220-3200 LightingTennessee Manchester 931-723-4442 Electrical Wire HarnessesTexas Dallas 972-466-1133 Lighting
Graphics SegmentOhio North Canton 330-494-9444 Graphics; Engineering Services
Cincinnati 513-793-3200 Menu BoardsKentucky Independence 859-342-9944 Menu BoardsNorth Carolina Charlotte 704-588-3850 Engineering ServicesOregon Portland 503-892-2346 Engineering ServicesRhode Island Woonsocket 401-766-7446 GraphicsTexas Houston 713-744-4100 GraphicsWashington Seattle 206-654-7045 Engineering Services
OPERATING FACILITIES
CORPORATE INFORMATION
Independent Registered Public Accounting FirmGrant Thornton LLP Cincinnati, Ohio
Legal CounselKeating Muething Klekamp PLLCincinnati, Ohio
Transfer Agent and RegistrarComputershare Investor Services, LLC2 North LaSalle StreetChicago, Illinois 60602
Dividend Reinvestment PlanThe LSI Industries Automatic Dividend Reinvestment andStock Purchase Plan offers registered shareholders andemployees an opportunity to purchase additional sharesthrough automatic dividend reinvestment and/or optionalcash investments. For additional information, contact:
Computershare Trust Co., Inc.2 North LaSalle StreetChicago, Illinois 60602(866) 770-0656E-mail: [email protected]: www.computershare.com
Annual MeetingThe LSI Industries Inc. annual shareholders’ meeting will beheld Thursday, November 15, 2005 at 10:00 a.m. at theCompany’s corporate offices located at 10000 AllianceRoad, Cincinnati, Ohio.
Form 10-KShareholders may obtain the 2005 Annual Report on Form10-K as filed with the Securities and Exchange Commissionwithout charge by writing to:
Investor Relations Manager LSI Industries Inc.10000 Alliance Road Cincinnati, Ohio 45242
Market for the Company’s Common SharesLSI Industries Inc. Common Shares are traded on The Nasdaq Stock Market under the symbol LYTS.
Internet SiteThe LSI Industries site on the Internet, www.lsi-industries.com,contains the Company’s 10-K and 10-Q filings, proxystatements, other SEC filings, annual reports, newsreleases, stock prices, and a variety of other informationabout LSI Industries and its products and services.
255292_Fin_Sept14_10am.qxd 9/14/05 1:26 PM Page 40
BOARD OF DIRECTORS
CORPORATE OFFICERS AND EXECUTIVE MANAGEMENT
Robert J. ReadyPresident, Chief Executive Officer &
Chairman of the BoardChairman of Executive Committee
James P. SferraSecretary - LSI Industries Inc.Executive Vice President - ManufacturingMember of Executive Committee
Gary P. KreiderSenior Partner of Keating Muething Klekamp PLL
Cincinnati, OhioMember of Compensation Committee Chairman of Nominating and Corporate Governance
Committee
Dennis B. MeyerDirector of Midmark Corporation, Versailles, OhioMember of Audit CommitteeChairman of Compensation CommitteeMember of Nominating and Corporate Governance
Committee
Wilfred T. O’GaraChief Executive Officer – The O'Gara Group, Inc.
Cincinnati, OhioChairman of Audit CommitteeMember of Compensation CommitteeMember of Nominating and Corporate Governance
Committee
Mark A. SerrianneChief Executive Officer - Northlich, Inc.Member of Audit CommitteeMember of Compensation CommitteeMember of Nominating and Corporate Governance
Committee
Robert J. Ready President and Chief Executive Officer
James P. Sferra Secretary; Executive Vice President - Manufacturing
Ronald S. StowellVice President, Chief Financial Officer, and Treasurer
David W. McCauley President LSI Graphic Solutions Plus
Scott D. Ready President LSI Lighting Solutions Plus
255292_Cover.qxp 9/14/05 1:35 PM Page 5

LSI Industries Inc.10000 Alliance RoadCincinnati, Ohio 45242(513) 793-3200 • FAX (513) 791-0813www.lsi-industries.com
255292_Cover.qxp 9/14/05 1:35 PM Page 2