lshtm research online · contact address: graham ellis, medicine for the elderly,monklands...
TRANSCRIPT

LSHTM Research Online
Ellis, Graham; Gardner, Mike; Tsiachristas, Apostolos; Langhorne, Peter; Burke, Orlaith; Harwood,Rowan H; Conroy, Simon P; Kircher, Tilo; Somme, Dominique; Saltvedt, Ingvild; +4 more... Wald,Heidi; O’Neill, Desmond; Robinson, David; Shepperd, Sasha; (2017) Comprehensive geriatric assess-ment for older adults admitted to hospital. COCHRANE DATABASE OF SYSTEMATIC REVIEWS,9 (9). CD006211-. ISSN 1469-493X DOI: https://doi.org/10.1002/14651858.CD006211.pub3
Downloaded from: http://researchonline.lshtm.ac.uk/id/eprint/4650502/
DOI: https://doi.org/10.1002/14651858.CD006211.pub3
Usage Guidelines:
Please refer to usage guidelines at https://researchonline.lshtm.ac.uk/policies.html or alternativelycontact [email protected].
Available under license: Copyright the publishers
https://researchonline.lshtm.ac.uk

Cochrane Database of Systematic Reviews
Comprehensive geriatric assessment for older adults
admitted to hospital (Review)
Ellis G, Gardner M, Tsiachristas A, Langhorne P, Burke O, Harwood RH, Conroy SP, Kircher T,
Somme D, Saltvedt I, Wald H, O’Neill D, Robinson D, Shepperd S
Ellis G, Gardner M, Tsiachristas A, Langhorne P, Burke O, HarwoodRH, Conroy SP, Kircher T, SommeD, Saltvedt I,Wald H, O’Neill D, Robinson
D, Shepperd S.
Comprehensive geriatric assessment for older adults admitted to hospital.
Cochrane Database of Systematic Reviews 2017, Issue 9. Art. No.: CD006211.
DOI: 10.1002/14651858.CD006211.pub3.
www.cochranelibrary.com
Comprehensive geriatric assessment for older adults admitted to hospital (Review)
Copyright © 2017 The Cochrane Collaboration. Published by John Wiley & Sons, Ltd.

T A B L E O F C O N T E N T S
1HEADER . . . . . . . . . . . . . . . . . . . . . . . . . . . . . . . . . . . . . . .
1ABSTRACT . . . . . . . . . . . . . . . . . . . . . . . . . . . . . . . . . . . . . .
2PLAIN LANGUAGE SUMMARY . . . . . . . . . . . . . . . . . . . . . . . . . . . . . .
4SUMMARY OF FINDINGS FOR THE MAIN COMPARISON . . . . . . . . . . . . . . . . . . .
6BACKGROUND . . . . . . . . . . . . . . . . . . . . . . . . . . . . . . . . . . . .
6OBJECTIVES . . . . . . . . . . . . . . . . . . . . . . . . . . . . . . . . . . . . .
6METHODS . . . . . . . . . . . . . . . . . . . . . . . . . . . . . . . . . . . . . .
9RESULTS . . . . . . . . . . . . . . . . . . . . . . . . . . . . . . . . . . . . . . .
Figure 1. . . . . . . . . . . . . . . . . . . . . . . . . . . . . . . . . . . . . . 10
Figure 2. . . . . . . . . . . . . . . . . . . . . . . . . . . . . . . . . . . . . . 12
Figure 3. . . . . . . . . . . . . . . . . . . . . . . . . . . . . . . . . . . . . . 14
Figure 4. . . . . . . . . . . . . . . . . . . . . . . . . . . . . . . . . . . . . . 15
Figure 5. . . . . . . . . . . . . . . . . . . . . . . . . . . . . . . . . . . . . . 16
Figure 6. . . . . . . . . . . . . . . . . . . . . . . . . . . . . . . . . . . . . . 17
Figure 7. . . . . . . . . . . . . . . . . . . . . . . . . . . . . . . . . . . . . . 20
Figure 8. . . . . . . . . . . . . . . . . . . . . . . . . . . . . . . . . . . . . . 21
Figure 9. . . . . . . . . . . . . . . . . . . . . . . . . . . . . . . . . . . . . . 22
Figure 10. . . . . . . . . . . . . . . . . . . . . . . . . . . . . . . . . . . . . . 23
24DISCUSSION . . . . . . . . . . . . . . . . . . . . . . . . . . . . . . . . . . . . .
25AUTHORS’ CONCLUSIONS . . . . . . . . . . . . . . . . . . . . . . . . . . . . . . .
25ACKNOWLEDGEMENTS . . . . . . . . . . . . . . . . . . . . . . . . . . . . . . . .
26REFERENCES . . . . . . . . . . . . . . . . . . . . . . . . . . . . . . . . . . . . .
32CHARACTERISTICS OF STUDIES . . . . . . . . . . . . . . . . . . . . . . . . . . . . .
73DATA AND ANALYSES . . . . . . . . . . . . . . . . . . . . . . . . . . . . . . . . . .
Analysis 1.1. Comparison 1 CGA versus usual care, Outcome 1 Living at home (discharge). . . . . . . . . . 74
Analysis 1.2. Comparison 1 CGA versus usual care, Outcome 2 Living at home (end of follow-up 3 to 12 months). . 75
Analysis 1.3. Comparison 1 CGA versus usual care, Outcome 3 Mortality (discharge). . . . . . . . . . . . 78
Analysis 1.4. Comparison 1 CGA versus usual care, Outcome 4 Mortality (end of follow-up 3 to 12 months). . . . 79
Analysis 1.5. Comparison 1 CGA versus usual care, Outcome 5 Admission to a nursing home (discharge). . . . . 81
Analysis 1.6. Comparison 1 CGA versus usual care, Outcome 6 Admission to a nursing home (end of follow-up 3 to 12
months). . . . . . . . . . . . . . . . . . . . . . . . . . . . . . . . . . . . 82
Analysis 1.7. Comparison 1 CGA versus usual care, Outcome 7 Dependence. . . . . . . . . . . . . . . 84
Analysis 1.8. Comparison 1 CGA versus usual care, Outcome 8 Activities of daily living. . . . . . . . . . . 86
Analysis 1.9. Comparison 1 CGA versus usual care, Outcome 9 Cognitive function. . . . . . . . . . . . . 87
Analysis 1.10. Comparison 1 CGA versus usual care, Outcome 10 Length of stay. . . . . . . . . . . . . 88
Analysis 1.11. Comparison 1 CGA versus usual care, Outcome 11 Re-admissions. . . . . . . . . . . . . 89
90ADDITIONAL TABLES . . . . . . . . . . . . . . . . . . . . . . . . . . . . . . . . . .
95APPENDICES . . . . . . . . . . . . . . . . . . . . . . . . . . . . . . . . . . . . .
106WHAT’S NEW . . . . . . . . . . . . . . . . . . . . . . . . . . . . . . . . . . . . .
106HISTORY . . . . . . . . . . . . . . . . . . . . . . . . . . . . . . . . . . . . . . .
106CONTRIBUTIONS OF AUTHORS . . . . . . . . . . . . . . . . . . . . . . . . . . . . .
107DECLARATIONS OF INTEREST . . . . . . . . . . . . . . . . . . . . . . . . . . . . . .
107SOURCES OF SUPPORT . . . . . . . . . . . . . . . . . . . . . . . . . . . . . . . . .
108DIFFERENCES BETWEEN PROTOCOL AND REVIEW . . . . . . . . . . . . . . . . . . . . .
108INDEX TERMS . . . . . . . . . . . . . . . . . . . . . . . . . . . . . . . . . . . .
iComprehensive geriatric assessment for older adults admitted to hospital (Review)
Copyright © 2017 The Cochrane Collaboration. Published by John Wiley & Sons, Ltd.

[Intervention Review]
Comprehensive geriatric assessment for older adultsadmitted to hospital
Graham Ellis1a , Mike Gardner2b, Apostolos Tsiachristas2 , Peter Langhorne3 , Orlaith Burke2, Rowan H Harwood4 , Simon P Conroy5, Tilo Kircher6, Dominique Somme7, Ingvild Saltvedt8, Heidi Wald9, Desmond O’Neill10, David Robinson11 , Sasha Shepperd2c
1Medicine for the Elderly, Monklands Hospital, Airdrie, UK. 2Nuffield Department of Population Health, University of Oxford,
Oxford, UK. 3Academic Section of Geriatric Medicine, ICAMS, University of Glasgow, Glasgow, UK. 4Health Care of Older People,
Queen’s Medical Centre, Nottingham University Hospitals NHS Trust, Nottingham, UK. 5Department of Health Sciences, University
of Leicester, Leicester, UK. 6Klinik für Psychiatrie und Psychotherapie, Philipps-Universität Marburg - UKGM, Marburg, Germany.7Faculté de Médecine, Université de Rennes 1, Service de Gériatrie CHU de Rennes, Centre de Recherche sur lAction Politique en
Europe, Hôpital Pontchaillou, Rennes, France. 8Department of Neuromedicine and Movement Science, Norwegian University of
Science and Technology (NTNU), Trondheim, Norway. 9Division of Health Care Policy and Research, Department of Medicine,
University of Colorado School of Medicine, Aurora, Colorado, USA. 10Centre for Ageing, Neuroscience and the Humanities, Trinity
College, Dublin, Ireland. 11Medicine for the Elderly, St James’s Hospital, Dublin, Ireland
aJoint first author. bJoint first author. cJoint first author
Contact address: Graham Ellis, Medicine for the Elderly, Monklands Hospital, Monkscourt Avenue, Airdrie, Scotland, ML6 0JS, UK.
Editorial group: Cochrane Effective Practice and Organisation of Care Group.
Publication status and date: New search for studies and content updated (no change to conclusions), published in Issue 9, 2017.
Citation: Ellis G, Gardner M, Tsiachristas A, Langhorne P, Burke O, Harwood RH, Conroy SP, Kircher T, Somme D, Saltvedt I, Wald
H, O’Neill D, Robinson D, Shepperd S. Comprehensive geriatric assessment for older adults admitted to hospital. Cochrane Databaseof Systematic Reviews 2017, Issue 9. Art. No.: CD006211. DOI: 10.1002/14651858.CD006211.pub3.
Copyright © 2017 The Cochrane Collaboration. Published by John Wiley & Sons, Ltd.
A B S T R A C T
Background
Comprehensive geriatric assessment (CGA) is a multi-dimensional, multi-disciplinary diagnostic and therapeutic process conducted
to determine the medical, mental, and functional problems of older people with frailty so that a co-ordinated and integrated plan for
treatment and follow-up can be developed. This is an update of a previously published Cochrane review.
Objectives
We sought to critically appraise and summarise current evidence on the effectiveness and resource use of CGA for older adults admitted
to hospital, and to use these data to estimate its cost-effectiveness.
Search methods
We searched CENTRAL, MEDLINE, Embase, three other databases, and two trials registers on 5 October 2016; we also checked
reference lists and contacted study authors.
Selection criteria
We included randomised trials that compared inpatient CGA (delivered on geriatric wards or by mobile teams) versus usual care on a
general medical ward or on a ward for older people, usually admitted to hospital for acute care or for inpatient rehabilitation after an
acute admission.
1Comprehensive geriatric assessment for older adults admitted to hospital (Review)
Copyright © 2017 The Cochrane Collaboration. Published by John Wiley & Sons, Ltd.

Data collection and analysis
We followed standard methodological procedures expected by Cochrane and Effective Practice and Organisation of Care (EPOC).
We used the GRADE approach to assess the certainty of evidence for the most important outcomes. For this update, we requested
individual patient data (IPD) from trialists, and we conducted a survey of trialists to obtain details of delivery of CGA. We calculated
risk ratios (RRs), mean differences (MDs), or standardised mean differences (SMDs), and combined data using fixed-effect meta-
analysis. We estimated cost-effectiveness by comparing inpatient CGA versus hospital admission without CGA in terms of cost per
quality-adjusted life year (QALY) gained, cost per life year (LY) gained, and cost per life year living at home (LYLAH) gained.
Main results
We included 29 trials recruiting 13,766 participants across nine, mostly high-income countries. CGA increases the likelihood that
patients will be alive and in their own homes at 3 to 12 months’ follow-up (risk ratio (RR) 1.06, 95% confidence interval (CI) 1.01 to
1.10; 16 trials, 6799 participants; high-certainty evidence), results in little or no difference in mortality at 3 to 12 months’ follow-up
(RR 1.00, 95% CI 0.93 to 1.07; 21 trials, 10,023 participants; high-certainty evidence), decreases the likelihood that patients will be
admitted to a nursing home at 3 to 12 months follow-up (RR 0.80, 95% CI 0.72 to 0.89; 14 trials, 6285 participants; high-certainty
evidence) and results in little or no difference in dependence (RR 0.97, 95% CI 0.89 to 1.04; 14 trials, 6551 participants; high-certainty
evidence). CGA may make little or no difference to cognitive function (SMD ranged from -0.22 to 0.35 (5 trials, 3534 participants;
low-certainty evidence)). Mean length of stay ranged from 1.63 days to 40.7 days in the intervention group, and ranged from 1.8 days
to 42.8 days in the comparison group. Healthcare costs per participant in the CGA group were on average GBP 234 (95% CI GBP -
144 to GBP 605) higher than in the usual care group (17 trials, 5303 participants; low-certainty evidence). CGA may lead to a slight
increase in QALYs of 0.012 (95% CI -0.024 to 0.048) at GBP 19,802 per QALY gained (3 trials; low-certainty evidence), a slight
increase in LYs of 0.037 (95% CI 0.001 to 0.073), at GBP 6305 per LY gained (4 trials; low-certainty evidence), and a slight increase
in LYLAH of 0.019 (95% CI -0.019 to 0.155) at GBP 12,568 per LYLAH gained (2 trials; low-certainty evidence). The probability
that CGA would be cost-effective at a GBP 20,000 ceiling ratio for QALY, LY, and LYLAH was 0.50, 0.89, and 0.47, respectively (17
trials, 5303 participants; low-certainty evidence).
Authors’ conclusions
Older patients are more likely to be alive and in their own homes at follow-up if they received CGA on admission to hospital. We
are uncertain whether data show a difference in effect between wards and teams, as this analysis was underpowered. CGA may lead to
a small increase in costs, and evidence for cost-effectiveness is of low-certainty due to imprecision and inconsistency among studies.
Further research that reports cost estimates that are setting-specific across different sectors of care are required.
P L A I N L A N G U A G E S U M M A R Y
Comprehensive geriatric assessment for older adults admitted to hospital
What is the aim of this review?
The aim of this Cochrane Review was to find out if organised and co-ordinated specialist care (known as comprehensive geriatric
assessment, or CGA) can improve care provided to older people admitted to hospital. Researchers at Cochrane collected and analysed
all relevant studies to answer this question and included 29 trials in the review.
Key messages
Giving older people who are admitted to hospital access to specialist co-ordinated geriatric assessment (CGA) services on admission to
hospital increases the chances that they will be alive in their own homes at follow-up.
What was studied in the review?
Older people admitted to hospital may have multiple, complex, and overlapping problems. They are more prone to rapid loss of
independence during an acute illness, leading to potential admission to a nursing home. Some of this decline might be avoided if care
needs are identified appropriately and if treatment is co-ordinated and managed. Specialist co-ordinated care (known as comprehensive
geriatric assessment, or CGA) was developed to address medical, social, mental health, and physical needs with the help of a skilled
multi-disciplinary team. The aims are to maximise recovery and to return patients to previous levels of function when possible. In
hospital, CGA is carried out on a geriatric ward, or on a general ward that is visited by a specialist geriatric team.
2Comprehensive geriatric assessment for older adults admitted to hospital (Review)
Copyright © 2017 The Cochrane Collaboration. Published by John Wiley & Sons, Ltd.

What are the main results of the review?
Review authors found 29 relevant trials from nine countries that recruited 13,766 people. These studies compared CGA with routine
care for patients over 65 who were admitted to hospital. Most trials evaluated CGA that was provided on a specialised hospital ward
or across several wards by a mobile team. The review shows that older people who receive CGA rather than routine medical care after
admission to hospital are more likely to be living at home and are less likely to be admitted to a nursing home at up to a year after
hospital admission.
We found no evidence that CGA reduces risk of death during follow-up at up to a year after admission, and we noted that CGA
appeared to make little or no difference in dependence (whether patients need help for everyday activities such as feeding and walking).
We found too much variation in cognitive function and length of hospital stay to draw a conclusion. Uncertainty regarding the cost-
effectiveness analysis suggests that further research is needed.
How up-to-date is this review?
Review authors searched for studies that had been published up to 5 October 2016.
3Comprehensive geriatric assessment for older adults admitted to hospital (Review)
Copyright © 2017 The Cochrane Collaboration. Published by John Wiley & Sons, Ltd.

S U M M A R Y O F F I N D I N G S F O R T H E M A I N C O M P A R I S O N [Explanation]
Comprehensive geriatric assessment (CGA) versus admission to hospital without CGA
Patient or population: older adults admitted to hospital
Setting: unplanned hospital admissions in 9 largely high-income countries
Intervention: CGA
Comparison: usual care
Outcomes Anticipated absolute effects* (95% CI) Relative effect
(95% CI)
No. of participants
(studies)
Certainty of the evidence
(GRADE)
Risk with usual care Risk with CGA
Living at home (end of fol-
low-up 3 to 12 months)
Study populat ion RR 1.06
(1.01 to 1.10)
6799
(16 RTs)
⊕⊕⊕⊕
HIGH
561 per 1000 595 per 1000
(567 to 617)
Mortality (end of follow-up
3 to 12 months)
Study populat ion RR 1.00
(0.93 to 1.07)
10,023
(21 RTs)
⊕⊕⊕⊕
HIGH
230 per 1000 230 per 1000
(214 to 247)
Admission to a nursing
home (end of follow-up
3 to 12 months)
Study populat ion RR 0.80
(0.72 to 0.89)
6285
(14 RTs)
⊕⊕⊕⊕
HIGH
186 per 1000 151 per 1000
(136 to 169)
Dependence Study populat ion RR 0.97
(0.89 to 1.04)
6551
(14 RTs)
⊕⊕⊕⊕
HIGH
291 per 1000 282 per 1000
(259 to 302)
Cognit ive funct ion Standardised mean dif fer-
ence ranged f rom -0.22 to
0.35.
- 3534
(5 RTs)
⊕⊕©©
LOWa,
4C
om
pre
hen
sive
geria
tricasse
ssmen
tfo
ro
lder
ad
ults
ad
mitte
dto
ho
spita
l(R
evie
w)
Co
pyrig
ht
©2017
Th
eC
och
ran
eC
olla
bo
ratio
n.P
ub
lished
by
Joh
nW
iley
&S
on
s,L
td.

Length of stay Not est imable
Mean length of stay in the
control group ranged f rom
1.8 days to 42.8 days
Mean length of stay in the
intervent ion group ranged
f rom 1.63 days to 40.7 days
- 5303
(17 RTs)
⊕⊕©©
LOWa,
Cost and cost-ef fect ive-
ness
Healthcare costs per part icipant in the CGA group were
on average GBP 234 (95%CI GBP -144 to GBP 605) higher
than in the usual care group (17 trials); CGA led to 0.
012 (95% CI -0.024 to 0.048) more QALYs (3 trials), 0.
037 (95% CI 0.001 to 0.073) more LYs (4 trials), and 0.
019 (95% CI -0.019 to 0.155) more LYLAH (2 trials) per
part icipant. Costs per QALYs gained was GBP 19,802, per
LY gained was GBP 6305, and per LYLAH gained was GBP
12,568. CGA was more cost ly in 89%of 10,000 generated
ICERs and led to QALY gains in 66% of cases, LY gains
in 87% of cases, and LYLAH gains in 74% of cases. The
probability that CGA would be cost-ef fect ive at a GBP 20,
000 ceiling rat io for QALY, LY, and LYLAH was 0.50, 0.89,
and 0.47, respect ively
5303 (17 RTs) ⊕⊕©©
LOWa,
*The risk in the intervention group (and its 95% conf idence interval) is based on assumed risk in the comparison group and the relative effect of the intervent ion (and its 95%
CI).
CGA: comprehensive geriatric assessment: CI: conf idence interval; ICER: incremental cost-ef fect iveness rat io; LY: lif e year; LYLAH: lif e year living at home; OR: odds rat io;
QALY: quality-adjusted lif e year; RR: risk rat io; RT: randomised trial
GRADE Working Group grades of evidence
High certainty: We are very conf ident that the true ef fect lies close to the est imate of ef fect.
Moderate certainty: We are moderately conf ident in the ef fect est imate: The true ef fect is likely to be close to the est imate of ef fect but may be substant ially dif f erent.
Low certainty: Our conf idence in the ef fect est imate is lim ited: The true ef fect may be substant ially dif f erent f rom the est imate of ef fect.
Very low certainty: We have very lit t le conf idence in the ef fect est imate: The true ef fect is likely to be substant ially dif f erent f rom the est imate of ef fect
aThe evidence was downgraded due to imprecision and substant ial heterogeneity
5C
om
pre
hen
sive
geria
tricasse
ssmen
tfo
ro
lder
ad
ults
ad
mitte
dto
ho
spita
l(R
evie
w)
Co
pyrig
ht
©2017
Th
eC
och
ran
eC
olla
bo
ratio
n.P
ub
lished
by
Joh
nW
iley
&S
on
s,L
td.
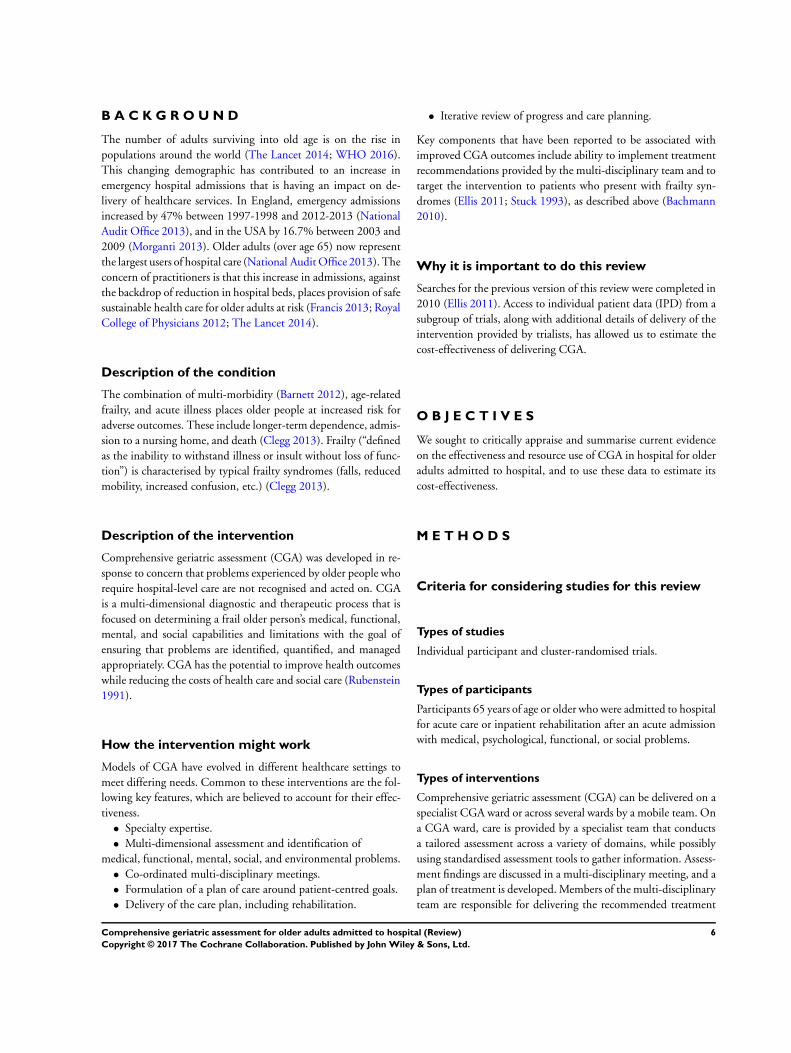
B A C K G R O U N D
The number of adults surviving into old age is on the rise in
populations around the world (The Lancet 2014; WHO 2016).
This changing demographic has contributed to an increase in
emergency hospital admissions that is having an impact on de-
livery of healthcare services. In England, emergency admissions
increased by 47% between 1997-1998 and 2012-2013 (National
Audit Office 2013), and in the USA by 16.7% between 2003 and
2009 (Morganti 2013). Older adults (over age 65) now represent
the largest users of hospital care (National Audit Office 2013). The
concern of practitioners is that this increase in admissions, against
the backdrop of reduction in hospital beds, places provision of safe
sustainable health care for older adults at risk (Francis 2013; Royal
College of Physicians 2012; The Lancet 2014).
Description of the condition
The combination of multi-morbidity (Barnett 2012), age-related
frailty, and acute illness places older people at increased risk for
adverse outcomes. These include longer-term dependence, admis-
sion to a nursing home, and death (Clegg 2013). Frailty (“defined
as the inability to withstand illness or insult without loss of func-
tion”) is characterised by typical frailty syndromes (falls, reduced
mobility, increased confusion, etc.) (Clegg 2013).
Description of the intervention
Comprehensive geriatric assessment (CGA) was developed in re-
sponse to concern that problems experienced by older people who
require hospital-level care are not recognised and acted on. CGA
is a multi-dimensional diagnostic and therapeutic process that is
focused on determining a frail older person’s medical, functional,
mental, and social capabilities and limitations with the goal of
ensuring that problems are identified, quantified, and managed
appropriately. CGA has the potential to improve health outcomes
while reducing the costs of health care and social care (Rubenstein
1991).
How the intervention might work
Models of CGA have evolved in different healthcare settings to
meet differing needs. Common to these interventions are the fol-
lowing key features, which are believed to account for their effec-
tiveness.
• Specialty expertise.
• Multi-dimensional assessment and identification of
medical, functional, mental, social, and environmental problems.
• Co-ordinated multi-disciplinary meetings.
• Formulation of a plan of care around patient-centred goals.
• Delivery of the care plan, including rehabilitation.
• Iterative review of progress and care planning.
Key components that have been reported to be associated with
improved CGA outcomes include ability to implement treatment
recommendations provided by the multi-disciplinary team and to
target the intervention to patients who present with frailty syn-
dromes (Ellis 2011; Stuck 1993), as described above (Bachmann
2010).
Why it is important to do this review
Searches for the previous version of this review were completed in
2010 (Ellis 2011). Access to individual patient data (IPD) from a
subgroup of trials, along with additional details of delivery of the
intervention provided by trialists, has allowed us to estimate the
cost-effectiveness of delivering CGA.
O B J E C T I V E S
We sought to critically appraise and summarise current evidence
on the effectiveness and resource use of CGA in hospital for older
adults admitted to hospital, and to use these data to estimate its
cost-effectiveness.
M E T H O D S
Criteria for considering studies for this review
Types of studies
Individual participant and cluster-randomised trials.
Types of participants
Participants 65 years of age or older who were admitted to hospital
for acute care or inpatient rehabilitation after an acute admission
with medical, psychological, functional, or social problems.
Types of interventions
Comprehensive geriatric assessment (CGA) can be delivered on a
specialist CGA ward or across several wards by a mobile team. On
a CGA ward, care is provided by a specialist team that conducts
a tailored assessment across a variety of domains, while possibly
using standardised assessment tools to gather information. Assess-
ment findings are discussed in a multi-disciplinary meeting, and a
plan of treatment is developed. Members of the multi-disciplinary
team are responsible for delivering the recommended treatment
6Comprehensive geriatric assessment for older adults admitted to hospital (Review)
Copyright © 2017 The Cochrane Collaboration. Published by John Wiley & Sons, Ltd.

or rehabilitation plan (such as physiotherapy, occupational ther-
apy, or medical treatment). CGA delivered by a mobile team also
includes a multi-disciplinary assessment of a patient that is per-
formed on one or more general medical wards. This is followed by
a multi-disciplinary team meeting that results in a recommended
plan for treatment with recommendations passed on to the ward
team (medical and nursing staff ). Multi-disciplinary team mem-
bers may or may not be involved in delivering direct care (e.g.
physiotherapy input).
We searched for trials that compared CGA for older people (over
65) admitted to hospital (conducted on CGA wards or by mobile
team) versus general medical care.
We excluded studies of condition-specific interventions (e.g. stroke
units, geriatric orthopaedic rehabilitation) that require special-
ist skills for assessment, acute management, and rehabilitation
(Handoll 2009; SUTC 2013).
Types of outcome measures
Primary outcomes
• Living at home (the inverse of death or institutionalisation
combined; used to describe someone who is alive and in own
home at follow-up)
Secondary outcomes
• Mortality (death)
• Admission to a nursing home
• Dependence
• Activities of daily living (as measured and reported by
trialists)
• Cognitive function
• Length of stay
• Re-admission
• Cost and cost-effectiveness
Search methods for identification of studies
Electronic searches
We searched the following databases with no restrictions (language
or date) on 5 October 2016.
• Cochrane Central Register of Controlled Trials
(CENTRAL; 2016, Issue 9) in the Cochrane Library.
• MEDLINE (including Epub Ahead of Print, In-Process &
Other Non-Indexed Citations) via OvidSP (from 1946).
• Embase via OvidSP (from 1974).
• CINAHL EbscoHOST (Cumulative Index to Nursing and
Allied Health Literature; from 1982).
• DARE (Database of Abstracts of Reviews of Effects; 2015,
Issue 2) in the Cochrane Library.
• HTA (Health Technology Assessment Database; 2016,
Issue 3) in the Cochrane Library.
We also searched these clinical trials registers on 5 October 2016.
• ClinicalTrials.gov (clinicaltrials.gov).
• WHO (World Health Organization) International Clinical
Trials Registry Platform (ICTRP) (apps.who.int/trialsearch/
Default.aspx).
We reported the search strategies in Appendix 1,
Searching other resources
We checked the reference lists of included trials and the following
related systematic reviews and meta-analyses: Bachmann 2010;
Baztan 2009; Baztan 2011; Conroy 2011; Extermann 2007; Van
Craen 2010.
Data collection and analysis
Selection of studies
One review author (MG) read all abstracts and retrieved full-text
papers for publications that appeared relevant. Two review authors
(MG, GE) independently assessed their eligibility, selected studies
for inclusion in the review according to prespecified inclusion cri-
teria, and resolved disagreements by discussion with a third review
author (SS).
Data extraction and management
Two review authors (MG, GE) independently extracted data, using
a modified version of the Cochrane good practice extraction form (
EPOC 2017a). We resolved disagreements and areas of uncertainty
by discussion with SS.
We contacted investigators of included trials by email or by tele-
phone to invite them to contribute trial data and to complete a
questionnaire to provide details about delivery of CGA. This sur-
vey included questions on the population using the service; inter-
vention characteristics (including details of core team members);
key components of the CGA intervention; and control group char-
acteristics. We sent each trialist a minimum of three reminders to
provide this information.
Survey of trialists
We contacted investigators of included trials by email or by tele-
phone to invite them to contribute trial data and to complete a
questionnaire to provide details about delivery of CGA. We sent
a minimum of three reminders to each trialist. We sent a survey
7Comprehensive geriatric assessment for older adults admitted to hospital (Review)
Copyright © 2017 The Cochrane Collaboration. Published by John Wiley & Sons, Ltd.

to trialists of the 29 trials included in the review to obtain a de-
tailed description of the CGA models evaluated in these trials.
The survey included questions on the population using the ser-
vice; intervention characteristics (including details of core team
members); key components of the CGA intervention; and control
group characteristics.
Assessment of risk of bias in included studies
Three review authors (MG, GE, SS) independently assessed risk of
bias of included trials by using the suggested risk of bias criteria and
guidance for EPOC reviews (EPOC 2017b). We resolved areas of
uncertainty or disagreement by discussion.
Measures of treatment effect
We calculated risk ratios (RRs) with 95% confidence intervals
(CIs) using fixed-effect inverse variance meta-analysis for living at
home, mortality, admission to a nursing home, and dependence
as measured by an activities of daily living scale (Deeks 2001; see
Analysis 1.7 for details).
For the continuous outcomes ’activities of daily living’ (ADLs)
and ’cognitive function’, we calculated standardised mean differ-
ences (SMDs) and for the continuous outcome ’length of stay’,
we calculated mean differences (MDs). We calculated odds ratios
(ORs) with 95% CIs for data from studies that provided individ-
ual patient data (IPD) using logistic regression meta-analysis.
Unit of analysis issues
All included trials were individual participant randomised trials.
We noted no unit of analysis issues.
Dealing with missing data
We contacted the authors of included trials to request missing
data.
Assessment of heterogeneity
We carried out tests of heterogeneity using Cochran’s Q and the
I² statistic (Cochran 1954; Higgins 2003). We did not retain a
pooled analysis if values of I² were greater than 70%. We also
considered trial characteristics such as CGA delivered by a team or
on a geriatric ward, and we grouped studies on the basis of these
characteristics.
Assessment of reporting biases
We assessed reporting bias by creating a funnel plot for the main
outcome (living at home) at 3 to 12 months’ follow-up, recognising
that when a small number of trials are included, these plots are
not necessarily indicative of publication bias.
Data synthesis
We combined published data using fixed-effect meta-analysis for
living at home, death, admitted to a nursing home, dependence,
ADLs, cognitive function, re-admissions, and length of stay. We
grouped trials by ward or by team for all outcomes, as suggested by
previous reviews (Ellis 2011; Stuck 1993). When multi-arm trials
are included (Cohen 2002 GEMC; Nikolaus 1999), we analysed
each intervention group separately and described this analysis in
the table of included trials. We calculated standardised mean dif-
ferences for the different scales used to measure ADLs and cog-
nitive function. We analysed dependence by combining a binary
definition of dependence (as defined by trials) with deterioration
in ADLs.
We conducted a meta-regression analysis by using a fixed-effect
model to assess effects of trial covariates on living at home at the
end of follow-up (3 to 12 months) (Thompson 1999). Trial co-
variates consisted of team or ward intervention; age or frailty as a
criterion for targeting delivery of CGA (frailty typically included
criteria such as geriatric syndromes, risk of nursing home admis-
sion, and functional or cognitive impairment); timing of admis-
sion from emergency department directly or after 72 hours (step-
down); and outpatient follow-up. We used post-estimation Wald
tests to derive F ratios and P values.
We used STATA version 13 and Review Manager 5 when per-
forming all analyses (Review Manager 2014; STATA 13) .
In the survey, we asked trialists to report elements of CGA that
were most critical to success; processes of care followed; and staff
profiles of the control group. We counted these elements of CGA,
and reported them in the results as a fraction of the total number
of trialists (N = 13).
Cost-effectiveness
We used length of inpatient stay (measured in days) from 17 tri-
als as the main driver of resource use (Analysis 1.10), and we
derived the costs of providing CGA from IPD provided by one
trial (Primary AMIGOS Trial, Edmans 2013; cost-effectiveness
study, Tanajewski 2015); this trial evaluated a version of CGA that
included an attending geriatrician in a medical assessment unit
and outpatient follow-up. We valued relative costs using English
unit cost prices for 2013/2014, taking a National Health Service
(NHS) perspective (NICE 2013), and we compared incremental
health outcomes of CGA versus usual care.
For trials that reported the cost of CGA, we used the following
measure of cost-effectiveness.
• We calculated quality-adjusted life-years (QALYs) by
converting Barthel Index IPD provided by Edmans 2013,
Kircher 2007, and Saltvedt 2002 to EQ-5D-3L (EuroQoL
Group Quality of Life Questionnaire based on a three-level scale)
UK scores according to Kaambwa 2013. We used data from trials
with mean Barthel scores at baseline ranging from 14.0 to 15.2,
on a scale of 0 to 20, as these were similar to scores reported in
8Comprehensive geriatric assessment for older adults admitted to hospital (Review)
Copyright © 2017 The Cochrane Collaboration. Published by John Wiley & Sons, Ltd.

the mapping study of Kaambwa 2013 (from 14.8 to 16.5, on a
scale of 0 to 20). Edmans 2013 provided IPD for the EQ-5D;
this allowed us to compare calculated QALYs based on the
Barthel index versus QALYs based on EQ-5D (Edmans 2013).
• We estimated life-years (LYs) using IPD from four trials by
calculating time to death from recruitment, expressed as a
fraction of a year (Edmans 2013; Goldberg 2013; Kircher 2007;
Saltvedt 2002).
• We created a variable called ’life years living at home’
(LYLAHs) after discharge from hospital to use as a measure of
independence and well-being in an older population; this was
based on IPD from Edmans 2013 and Goldberg 2013.
We used a decision model to estimate an incremental cost-effec-
tiveness ratio (ICER) of inpatient care with or without CGA. The
ICER is expressed as cost per QALY gained, cost per LY gained,
and cost per LYLAH gained from a health service perspective. We
multiplied the RR of living at home at the end of follow-up by
the incremental LYLAH, to adjust LYLAH with the probability
of living at home (Analysis 1.2). We presented in Table 1 the in-
put parameters used in these models. We addressed uncertainty by
performing 10,000 draws of all incremental cost and incremental
health outcome parameters using prespecified distributions, and
by recording incremental costs, incremental QALYs, incremental
LYs, and incremental LYLAHs from each draw. We plotted these
results on a cost-effectiveness plane (i.e. a scatterplot graph with
incremental costs on the y-axis and incremental effects on the x-
axis) and on a cost-effectiveness acceptability curve (i.e. a graph
that displays the probability that an intervention will be cost-ef-
fective at different values of a QALY) to display uncertainty in the
estimated ICERs.
Certainty of evidence
We graded our confidence in the evidence by creating a ’Sum-
mary of findings’ table, using the approach recommended by
the GRADE Working Group and guidance developed by EPOC
(EPOC 2017c; Guyatt 2008). We included the most important
outcomes of living at home, mortality, admission to a nursing
home, dependence, cognitive function, hospital length of stay,
and cost-effectiveness. We used methods and recommendations
described in Section 8.5 and Chapter 12 of the Cochrane Hand-book for Systematic Reviews of Interventions (Higgins 2011), along
with GRADE worksheets, to assess the certainty of evidence
(GRADEpro GDT 2015). Three review authors (MG, SS, GE)
independently assessed the certainty of evidence.
Subgroup analysis and investigation of heterogeneity
We conducted fixed-effect logistic regression meta-analyses on
IPD from five studies (N = 1767 participants) for two out-
comes: living at home and mortality (Edmans 2013; Goldberg
2013; Kircher 2007; Somme 2010; Saltvedt 2002). We analysed a
third outcome (time to death) by performing fixed-effect time-to-
event meta-analysis (Edmans 2013; Goldberg 2013; Kircher 2007;
Somme 2010). We adjusted all three meta-analyses for participant
age and sex and baseline Barthel Index by applying a threshold of
≤ 15/20 for moderate to severe disability (Rudd 1997).
We created a model for each trial, and we pooled parameters using
a weighted average. We combined log odds ratios for living at
home and death, using fixed-effect inverse variance meta-analysis
(Deeks 2001). We used Cox regression models to calculate the log
hazard ratio and its standard error for living at home and death
separately for each trial data set. We expressed the pooled effect as
the hazard ratio for inpatient CGA compared with general medical
care.
Sensitivity analysis
We ran a random-effects meta-analysis in a sensitivity analysis for
primary outcomes and compared these results with results of fixed-
effect meta-analysis (Deeks 2001; DerSimonian 1986); we also
assessed the impact of excluding three trials that included partici-
pants who were admitted from a nursing home for the outcomes
living at home and admitted to a nursing home (Asplund 2000;
McVey 1989; Rubenstein 1984). We assessed the impact of using
data at 6 months’ follow-up, rather than at 12 months’ follow-up,
for three trials (Applegate 1990; Counsell 2000; Saltvedt 2002),
for the primary outcome living at home (end of follow-up 3 to 12
months).
We performed two univariate sensitivity analyses for the cost-ef-
fectiveness analysis. In the first (van Exel 2004), we mapped EQ-
5D utilities to the Barthel Index using data from two trials that
recruited a more dependent population (mean Barthel Index of
9 at baseline) (Goldberg 2013; Somme 2010); in the second, we
used the RR for delivering CGA on a dedicated ward and ex-
cluded studies evaluating CGA delivered by mobile teams for the
outcomes living at home (Analysis 1.2); and being admitted to a
nursing home at the end of follow-up (Analysis 1.6).
R E S U L T S
Description of studies
Results of the search
We retrieved 7147 unique records and excluded 7131 records on
the basis of title and abstract screening. We retrieved the full text
of 16 potentially relevant records and excluded eight with reasons.
We identified seven new trials (from eight publications) for inclu-
sion in this review (Barnes 2012; Boustani 2012; Edmans 2013;
Goldberg 2013; Li 2015; Somme 2010; Wald 2011). This review
9Comprehensive geriatric assessment for older adults admitted to hospital (Review)
Copyright © 2017 The Cochrane Collaboration. Published by John Wiley & Sons, Ltd.

now includes 29 randomised trials. Figure 1 outlines the study
selection process.
Figure 1. PRISMA flow diagram.
10Comprehensive geriatric assessment for older adults admitted to hospital (Review)
Copyright © 2017 The Cochrane Collaboration. Published by John Wiley & Sons, Ltd.

Included studies
See Characteristics of included studies.
We included 29 randomised trials involving 13,766 participants
that examined the effectiveness of CGA provided for older adults
admitted to hospital.
Most included trials were conducted in North America: 16 in the
USA and four in Canada. Two trials were conducted in Germany
and in the UK, and single trials were reported from Australia,
China, Norway, France, and Sweden. Eleven trials targeted CGA
to the frailest or most at-risk participants (Applegate 1990; Cohen
2002 GEMC; Edmans 2013; Goldberg 2013; Kay 1992; Kircher
2007; Nikolaus 1999; Rubenstein 1984; Saltvedt 2002; White
1994; Winograd 1993), and 11 targeted CGA on the basis of
age alone (Asplund 2000; Barnes 2012; Collard 1985; Counsell
2000; Fretwell 1990; Harris 1991; Landefeld 1995; McVey 1989;
Naughton 1994; Somme 2010; Wald 2011).
Trialists delivered CGA in a dedicated geriatric ward environ-
ment in 20 trials (Applegate 1990; Asplund 2000; Barnes 2012;
Boustani 2012; Cohen 2002 GEMC; Collard 1985; Counsell
2000; Fretwell 1990; Goldberg 2013; Harris 1991; Kay 1992;
Landefeld 1995; Nikolaus 1999; Powell 1990; Rubenstein 1984;
Saltvedt 2002; Shamian 1984; Somme 2010; Wald 2011; White
1994), and by using a mobile team on a general medical ward in
eight trials (Edmans 2013; Hogan 1987; Kircher 2007; McVey
1989; Naughton 1994; Reuben 1995; Thomas 1993; Winograd
1993).
We have presented intervention components for all studies in
Figure 2.
11Comprehensive geriatric assessment for older adults admitted to hospital (Review)
Copyright © 2017 The Cochrane Collaboration. Published by John Wiley & Sons, Ltd.

Figure 2. Components of in-hospital CGA and staff profiles. Present or carried out Recommendation
made or staff accessed from general poolWhen it was unclear or was not explicitly stated in the paper, it has
been left blank.Two trials (Li 2015; Powell 1990) are excluded from , as full details of the intervention
components were not available.
12Comprehensive geriatric assessment for older adults admitted to hospital (Review)
Copyright © 2017 The Cochrane Collaboration. Published by John Wiley & Sons, Ltd.

In the AMIGOS trial (Edmans 2013; Tanajewski 2015), the in-
tervention was case management by a geriatrician at the point of
discharge from an acute medical unit, and no other staff served as
core team members. In one trial (Goldberg 2013), the CGA inter-
vention consisted of care in a specialist medical and mental health
unit that admitted people with delirium or dementia. We counted
Cohen 2002 GEMC as two trials, as the investigators used a 2 × 2
factorial design that compared care received in an inpatient geri-
atric evaluation and management unit versus usual care, followed
by outpatient care in a geriatric evaluation and management clinic
versus usual outpatient care (Cohen 2002 UCOP; Cohen 2002
GEMC). We also counted Nikolaus 1999 as two trials owing to
the different CGA interventions evaluated: CGA ward and CGA
ward plus early supported discharge intervention versus usual care
(Nikolaus 1999; Nikolaus 1999 plus ESD).
Most trials described the control group as receiving usual care.
In three trials, the control group received enhanced usual care
(Boustani 2012; Edmans 2013; Goldberg 2013), and in one trial
(Goldberg 2013), care on geriatric medical wards (70%) and gen-
eral medical wards (30%). In another study (Boustani 2012),
49% of the control group received CGA compared with 56% of
the intervention group. Nine trials provided outpatient follow-
up (Barnes 2012; Cohen 2002 GEMC; Collard 1985; Counsell
2000; Edmans 2013; Fretwell 1990; Naughton 1994; Nikolaus
1999 plus ESD; Rubenstein 1984). Duration of follow-up ranged
from 3 to 12 months.
Elements of CGA
Thirteen of the 29 trialists completed the survey (Applegate 1990;
Asplund 2000; Edmans 2013; Goldberg 2013; Hogan 1987;
Kircher 2007; Reuben 1995; Rubenstein 1984; Saltvedt 2002;
Somme 2010; Thomas 1993; Wald 2011; White 1994), and re-
ported tailoring treatment plans to the individual (13/13 trials);
holding multi-disciplinary team meetings (12/13 trials); provid-
ing clinical leadership (11/13 trials); having speciality knowledge,
experience, and competence (11/13 trials); and involving partici-
pants and carers in goal setting (10/13 trials) were the most com-
mon key components of CGA (Figure 3). In Figure 4, we detailed
the processes of care and information on staff working in the con-
trol group, as reported by the trialists. In Figure 2, we displayed
the staff profile of the CGA intervention group for comparison.
13Comprehensive geriatric assessment for older adults admitted to hospital (Review)
Copyright © 2017 The Cochrane Collaboration. Published by John Wiley & Sons, Ltd.

Figure 3. Key components of CGA reported by trialists. Components critical to success
14Comprehensive geriatric assessment for older adults admitted to hospital (Review)
Copyright © 2017 The Cochrane Collaboration. Published by John Wiley & Sons, Ltd.
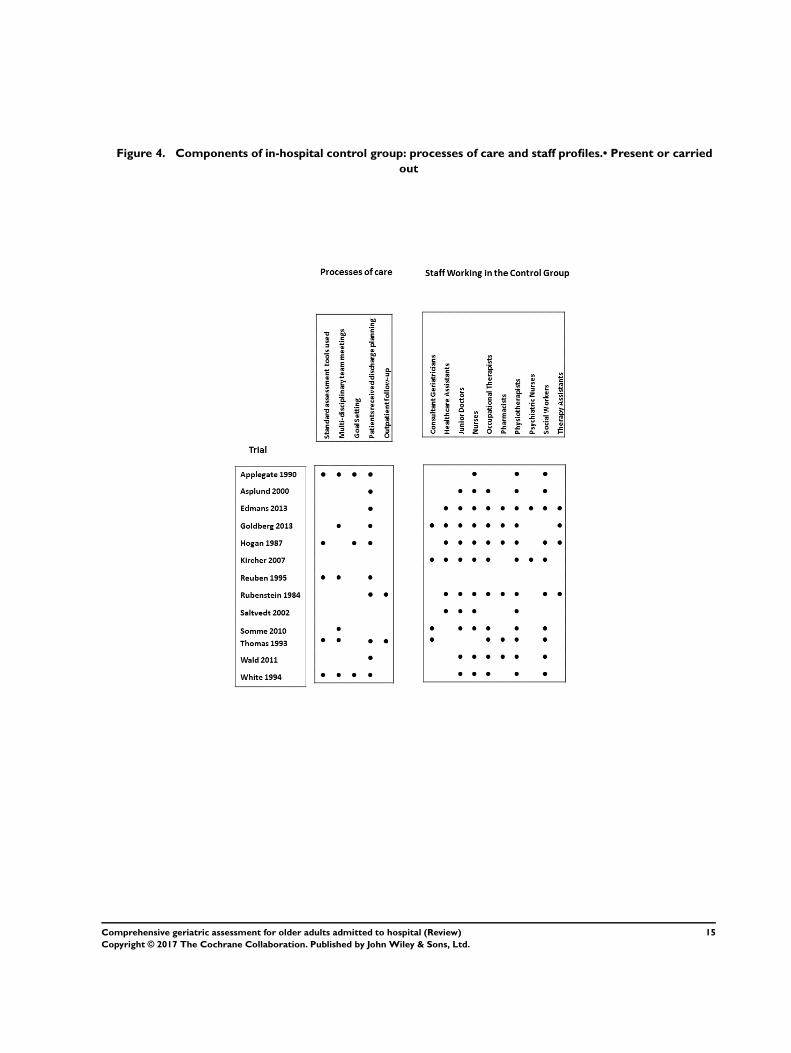
Figure 4. Components of in-hospital control group: processes of care and staff profiles.• Present or carried
out
15Comprehensive geriatric assessment for older adults admitted to hospital (Review)
Copyright © 2017 The Cochrane Collaboration. Published by John Wiley & Sons, Ltd.
Excluded studies
We excluded eight trials. Reasons for exclusion were secondary
analyses (Gharacholou 2012; Nipp 2012) of an included trial
(Cohen 2002 GEMC); a non-randomised study (Mudge 2012;
Yoo 2013a; Yoo 2013b; Yoo 2014); an ineligible intervention
(Abizanda 2011); and elective admission of participants to in-
patient care (Kehusmaa 2010). (See Characteristics of excluded
studies.)
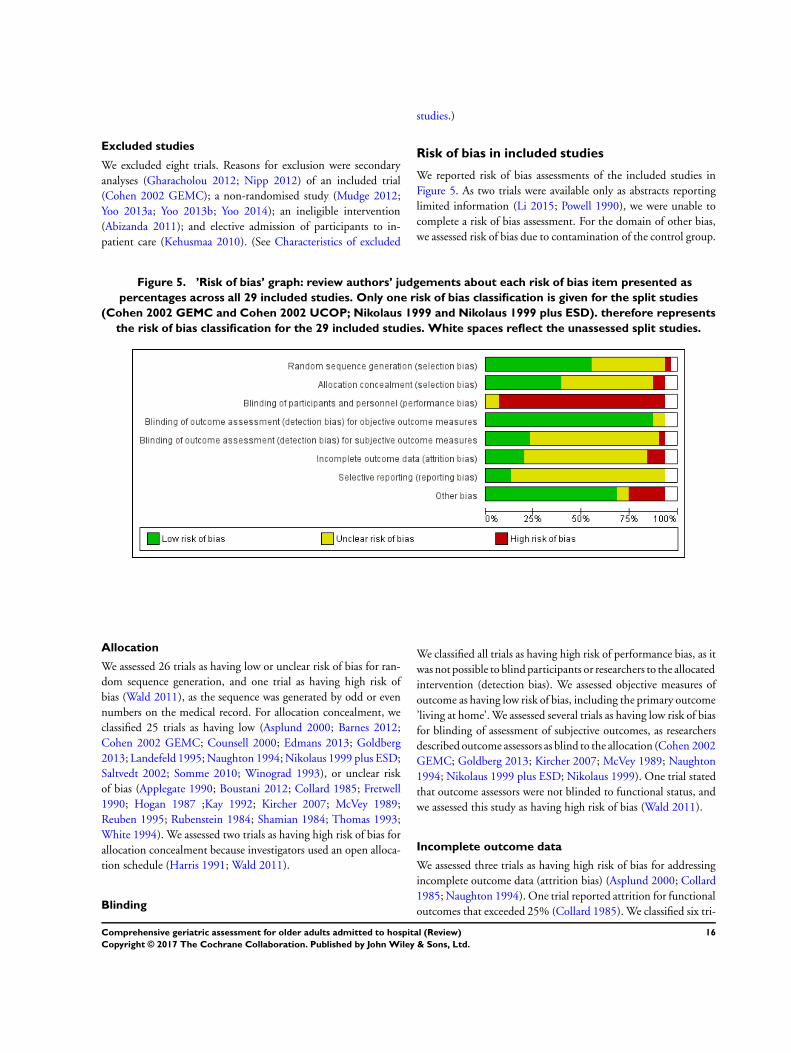
Risk of bias in included studies
We reported risk of bias assessments of the included studies in
Figure 5. As two trials were available only as abstracts reporting
limited information (Li 2015; Powell 1990), we were unable to
complete a risk of bias assessment. For the domain of other bias,
we assessed risk of bias due to contamination of the control group.
Figure 5. ’Risk of bias’ graph: review authors’ judgements about each risk of bias item presented as
percentages across all 29 included studies. Only one risk of bias classification is given for the split studies
(Cohen 2002 GEMC and Cohen 2002 UCOP; Nikolaus 1999 and Nikolaus 1999 plus ESD). therefore represents
the risk of bias classification for the 29 included studies. White spaces reflect the unassessed split studies.
Allocation
We assessed 26 trials as having low or unclear risk of bias for ran-
dom sequence generation, and one trial as having high risk of
bias (Wald 2011), as the sequence was generated by odd or even
numbers on the medical record. For allocation concealment, we
classified 25 trials as having low (Asplund 2000; Barnes 2012;
Cohen 2002 GEMC; Counsell 2000; Edmans 2013; Goldberg
2013; Landefeld 1995; Naughton 1994; Nikolaus 1999 plus ESD;
Saltvedt 2002; Somme 2010; Winograd 1993), or unclear risk
of bias (Applegate 1990; Boustani 2012; Collard 1985; Fretwell
1990; Hogan 1987 ;Kay 1992; Kircher 2007; McVey 1989;
Reuben 1995; Rubenstein 1984; Shamian 1984; Thomas 1993;
White 1994). We assessed two trials as having high risk of bias for
allocation concealment because investigators used an open alloca-
tion schedule (Harris 1991; Wald 2011).
Blinding
We classified all trials as having high risk of performance bias, as it
was not possible to blind participants or researchers to the allocated
intervention (detection bias). We assessed objective measures of
outcome as having low risk of bias, including the primary outcome
’living at home’. We assessed several trials as having low risk of bias
for blinding of assessment of subjective outcomes, as researchers
described outcome assessors as blind to the allocation (Cohen 2002
GEMC; Goldberg 2013; Kircher 2007; McVey 1989; Naughton
1994; Nikolaus 1999 plus ESD; Nikolaus 1999). One trial stated
that outcome assessors were not blinded to functional status, and
we assessed this study as having high risk of bias (Wald 2011).
Incomplete outcome data
We assessed three trials as having high risk of bias for addressing
incomplete outcome data (attrition bias) (Asplund 2000; Collard
1985; Naughton 1994). One trial reported attrition for functional
outcomes that exceeded 25% (Collard 1985). We classified six tri-
16Comprehensive geriatric assessment for older adults admitted to hospital (Review)
Copyright © 2017 The Cochrane Collaboration. Published by John Wiley & Sons, Ltd.

als as having low risk of bias for incomplete outcome data (attri-
tion bias) (Barnes 2012; Boustani 2012; Fretwell 1990; Goldberg
2013; Kircher 2007; Landefeld 1995). We classified 18 trials as
having unclear risk of bias (Applegate 1990; Cohen 2002 GEMC;
Counsell 2000; Edmans 2013; Harris 1991; Hogan 1987; Kay
1992; McVey 1989; Nikolaus 1999 plus ESD; Reuben 1995;
Rubenstein 1984; Saltvedt 2002; Shamian 1984; Somme 2010;
Thomas 1993; Wald 2011; White 1994; Winograd 1993), as in-
vestigators provided no data on attrition or exclusions.
Selective reporting
Twenty-five trials did not publish a protocol, hence we assessed
them as having unclear risk of selective reporting bias. Four tri-
als did publish protocols (Edmans 2013; Goldberg 2013; Kircher
2007; Reuben 1995), and two trials published protocols with pre-
specified outcomes (Edmans 2011; Harwood 2011).
Other potential sources of bias
We assessed risk of bias due to contamination of the control
group. A total of 21 trials provided little evidence that the con-
trol group had received CGA (Applegate 1990; Asplund 2000;
Barnes 2012; Cohen 2002 GEMC; Collard 1985; Counsell 2000;
Edmans 2013; Fretwell 1990; Harris 1991; Hogan 1987; Kay
1992; Landefeld 1995; McVey 1989; Naughton 1994; Rubenstein
1984; Saltvedt 2002; Shamian 1984; Somme 2010; Thomas 1993;
White 1994; Winograd 1993). In six trials, it is likely that the
control group received the intervention, hence we classified these
trials as having high risk of bias as to whether the study adequately
protected against contamination (Boustani 2012; Goldberg 2013;
Kircher 2007; Nikolaus 1999 plus ESD; Reuben 1995; Wald
2011). In one of these trials (Boustani 2012), 49% of the control
group versus 56% of the intervention group received CGA; we
did not include data from this trial in the meta-analysis.
We assessed publication bias by creating a funnel plot for the main
outcome living at home at the end of follow-up (Figure 6). The
Harbord test (bias = 0.87, P = 0.18) and Egger’s test (bias = 0.87,
P = 0.17) show little evidence of small-trial bias for the main
outcome living at home at the end of follow-up (3 to 12 months).
Figure 6. Funnel plot of comparison: 1 CGA versus usual care, outcome: 1.2 Living at home (end of follow-
up 3 to 12 months).
17Comprehensive geriatric assessment for older adults admitted to hospital (Review)
Copyright © 2017 The Cochrane Collaboration. Published by John Wiley & Sons, Ltd.

Effects of interventions
See: Summary of findings for the main comparison
Comprehensive geriatric assessment (CGA) versus admission to
hospital without CGA
Living at home
CGA increases the likelihood that patients will be alive and in
their own homes (’living at home’) at hospital discharge (risk ratio
(RR) 1.05, 95% confidence interval (CI) 1.01 to 1.10; 11 trials;
4346 participants (32% of the total number of participants); high-
certainty evidence; I² = 43%) (Barnes 2012; Collard 1985; Fretwell
1990; Kay 1992; Landefeld 1995; McVey 1989; Naughton 1994;
Rubenstein 1984; Wald 2011; White 1994; Winograd 1993). See
Analysis 1.1.
CGA also increases the likelihood that patients will be ’living at
home’ at 3 to 12 months’ follow-up (RR 1.06, 95% CI 1.01
to 1.10; 16 trials; 6799 participants (49% of the total number
of participants); high-certainty evidence; I² = 13%) (Applegate
1990; Asplund 2000; Cohen 2002 GEMC; Cohen 2002 UCOP;
Counsell 2000; Edmans 2013; Goldberg 2013; Kircher 2007;
Landefeld 1995; McVey 1989; Nikolaus 1999; Nikolaus 1999 plus
ESD; Rubenstein 1984; Saltvedt 2002; Somme 2010; Winograd
1993). See Analysis 1.2.
Mortality (death)
CGA results in little or no difference in mortality at discharge (RR
1.04, 95% CI 0.82 to 1.32; 11 trials; 4346 participants (32% of the
total number of participants); high-certainty evidence; I² = 16%)
(Barnes 2012; Collard 1985; Fretwell 1990; Kay 1992; Landefeld
1995; McVey 1989; Naughton 1994; Rubenstein 1984; Wald
2011; White 1994; Winograd 1993), or at 3 to 12 months’ follow-
up (RR 1.00, 95% CI 0.93 to 1.07; 21 trials; 10,023 participants
(73% of the total number of participants); high-certainty evidence;
I² = 0%) (Applegate 1990; Asplund 2000; Cohen 2002 GEMC;
Cohen 2002 UCOP; Counsell 2000; Edmans 2013; Fretwell
1990; Goldberg 2013; Harris 1991; Kircher 2007; Landefeld
1995; McVey 1989; Nikolaus 1999; Nikolaus 1999 plus ESD;
Reuben 1995; Rubenstein 1984; Saltvedt 2002; Shamian 1984;
Somme 2010; Thomas 1993; Winograd 1993). See Analysis 1.3
and Analysis 1.4.
Admission to a nursing home during follow-up
CGA decreases the likelihood that patients will be admitted to a
nursing home at discharge (RR 0.89, 95% CI 0.81 to 0.98; 12
trials; 4459 participants (32% of the total number of participants);
high-certainty evidence; I² = 31%) (Barnes 2012; Collard 1985;
Fretwell 1990; Hogan 1987; Kay 1992; Landefeld 1995; McVey
1989; Naughton 1994; Rubenstein 1984; Wald 2011; White
1994; Winograd 1993); and at 3 to 12 months’ follow-up (RR
0.80, 95% CI 0.72 to 0.89; 14 trials; 6285 participants (46%
of the total number of participants); high-certainty evidence; I²
= 3%) (Applegate 1990; Asplund 2000; Cohen 2002 GEMC;
Cohen 2002 UCOP; Counsell 2000; Edmans 2013; Goldberg
2013; Kircher 2007; Landefeld 1995; McVey 1989; Nikolaus
1999; Nikolaus 1999 plus ESD; Rubenstein 1984; Saltvedt 2002;
Winograd 1993). See Analysis 1.5 and Analysis 1.6. It is not clear
from the trials that contributed to the analysis of admission to
nursing home at discharge if participants were a new nursing home
admission, or if they had previously resided in a nursing home.
Dependence
CGA results in little or no difference in dependence (RR 0.97,
95% CI 0.89 to 1.04; 14 trials; 6551 participants (48% of
the total number of participants); high-certainty evidence; I² =
0%) (Asplund 2000; Barnes 2012; Collard 1985; Counsell 2000;
Edmans 2013; Fretwell 1990; Landefeld 1995; McVey 1989;
Nikolaus 1999; Nikolaus 1999 plus ESD; Rubenstein 1984;
Saltvedt 2002; Somme 2010; Thomas 1993). We included data
from one trial despite a large dropout rate (25.7% for interven-
tion; 44.0% for control) for this one outcome (Collard 1985).
Analysis that excludes the data from this trial has little effect on
the summary estimate (RR 0.95, 95% CI 0.88 to 1.04; 13 trials;
6122 participants (44% of the total number of participants); I² =
0%). See Analysis 1.7.
Cognitive function
A total of five trials reported cognitive function at follow-up, due
to a high level of statistical heterogeneity we did not retain the
meta-analysis (3534 participants (26% of the total number of
participants); low-certainty evidence; I2 = 73%) (Asplund 2000;
Goldberg 2013; Kircher 2007; Reuben 1995; Winograd 1993).
For cognitive function we calculated standardised mean differ-
ences to standardise the results of the studies to a uniform scale
before they could be combined. This was because the outcome
was measured in a variety of ways.The standardised mean differ-
ence ranged from -0.22 to 0.35. We are uncertain of the impact
of CGA on cognitive function, as the certainty of this evidence is
low.
Length of stay
A total of 17 trials reported length of stay data. Owing to a
high level of statistical heterogeneity, we did not retain the meta-
analysis (5303 participants (39% of the total number of par-
ticipants); low-certainty evidence; I² = 80%) (Asplund 2000;
Cohen 2002 GEMC; Cohen 2002 UCOP; Edmans 2013;
Fretwell 1990; Goldberg 2013; Harris 1991; Hogan 1987; McVey
1989; Naughton 1994; Nikolaus 1999; Nikolaus 1999 plus
ESD; Saltvedt 2002; Somme 2010; Thomas 1993; Wald 2011;
Winograd 1993). Mean hospital length of stay ranged from 3.4
18Comprehensive geriatric assessment for older adults admitted to hospital (Review)
Copyright © 2017 The Cochrane Collaboration. Published by John Wiley & Sons, Ltd.

days to 40.7 days in the CGA group, and from 3.1 days to 42.8
days in the control group, with a mean difference of -23.60 to
9.00 days. See Analysis 1.10.
Costs and cost-effectiveness
Table 2 presents the costs reported by trialists; owing to variation
in time periods (1985 to 2013) and in resources that were costed
we did not include these data in the analysis of costs. Instead, we
used length of inpatient stay, as this unit is commonly used in
costing hospital resources because it is the main driver of resource
use. We used the meta-analysis of published data from 17 trials
to estimate the incremental cost, as well as individual patient data
(IPD) from five trials to estimate incremental health outcomes of
CGA versus usual care (Edmans 2013; Goldberg 2013; Kircher
2007; Saltvedt 2002; Somme 2010). We estimated healthcare costs
(including hospitalisation and intervention costs) per participant
in the CGA group at GBP 234 higher than general medical care
without CGA (95% CI GBP -£144 to GBP 605) (17 trials; low-
certainty evidence). CGA may lead to a slight increase in QALYs
of 0.012 (95% CI -0.024 to 0.048) at GBP 19,802 per QALY
gained (3 trials provided data on QALYS and 17 trials provided
data on resource use; low-certainty evidence), a slight increase
in LYs of 0.037 (95% CI 0.001 to 0.073) at GBP 6305 per LY
gained (4 trials provided data on LYs and 17 trials provided data
on resource use; low-certainty evidence), and a slight increase in
LYLAH of 0.019 (95% CI -0.019 to 0.155) at GBP 12,568 per
LYLAH gained (2 trials provided data on LYLAH and 17 trials
provided data on resource use; low-certainty evidence) (Table 3).
The probability that CGA would be cost-effective at a GBP 20,000
ceiling ratio (which is the GBP 20,000 threshold suggested by the
National Institute for Health and Care Excellence for QALY, LY,
and LYLAH was 0.50, 0.89, and 0.47, respectively (17 trials; low-
certainty evidence) (NICE 2013).
We addressed uncertainty by performing 10,000 draws of all incre-
mental costs and incremental health outcome parameters; CGA
was more costly in 89% of 10,000 generated incremental cost-
effectiveness ratios (ICERs) and led to QALY gains in 66% of
cases, LY gains in 87% of cases, and LYLAH gains in 74% of cases.
When effectiveness is measured in LYs gained, the probability that
CGA will be cost-effective is above 90% when the ceiling ratio
is increased to GBP 25,000 or higher (Figure 7). However, the
probability that CGA will be considered cost-effective is 68% and
72% for QALY and LYLAH gained, respectively, at a ceiling ratio
of GBP 75,000 (Figure 7). We have plotted in Figure 8, Figure 9,
and Figure 10 the distribution of each draw of all incremental cost
and incremental health outcome parameters and have displayed
the uncertainty in estimated ICERs (Appendix 2).
19Comprehensive geriatric assessment for older adults admitted to hospital (Review)
Copyright © 2017 The Cochrane Collaboration. Published by John Wiley & Sons, Ltd.

Figure 7. Probability of CGA being cost-effective.
20Comprehensive geriatric assessment for older adults admitted to hospital (Review)
Copyright © 2017 The Cochrane Collaboration. Published by John Wiley & Sons, Ltd.

Figure 8. Cost-effectiveness plane with ICERs expressed as cost per QALY gained.
21Comprehensive geriatric assessment for older adults admitted to hospital (Review)
Copyright © 2017 The Cochrane Collaboration. Published by John Wiley & Sons, Ltd.

Figure 9. Cost-effectiveness plane with ICER expressed as cost per LY gained.
22Comprehensive geriatric assessment for older adults admitted to hospital (Review)
Copyright © 2017 The Cochrane Collaboration. Published by John Wiley & Sons, Ltd.

Figure 10. Cost-effectiveness plane with ICERs expressed as cost per LYLAH gained.
Activities of daily living (ADLs)
CGA probably leads to little or no difference in ADLs (SMD 0.04,
95% CI -0.06 to 0.15; 7 trials; 1445 participants (10% of the
total number of participants); moderate-certainty evidence; I² =
0%) (Applegate 1990; Goldberg 2013; Nikolaus 1999; Nikolaus
1999 plus ESD; Somme 2010; Thomas 1993; Winograd 1993).
See Analysis 1.8.
Re-admission
CGA results in little or no difference in re-admission to hospital
(RR 1.02, 95% CI 0.94 to 1.11; 13 trials; 6698 participants (49%
of the total number of participants); high-certainty evidence; low
heterogeneity; I² =0%) (Asplund 2000; Barnes 2012; Counsell
2000; Edmans 2013; Goldberg 2013; Kircher 2007; Landefeld
1995; Nikolaus 1999; Nikolaus 1999 plus ESD; Rubenstein 1984;
Saltvedt 2002; Wald 2011; White 1994). See Analysis 1.11.
Results from meta-regression
CGA delivery on wards or by teams
Differences in effectiveness of CGA delivery between wards and
teams on living at home were uncertain, as this analysis was un-
derpowered (at discharge: F = 1.91, P = 0.20, N = 8 trials ward,
N = 3 trials team; end of follow-up (3 to 12 months): F = 3.54, P
= 0.08, N = 12 trials ward, N = 4 trials team).
Age or frailty as a criterion for targeting delivery of CGA
Differences in effectiveness between age and frailty as a criterion
for targeting CGA delivery on living at home were uncertain (at
discharge: F = 0.18, P = 0.68, N = 7 trials age, N = 4 trials frailty;
end of follow-up (3 to 12 months): F = 0.98, P = 0.34, N = 5 trials
age, N = 11 trials frailty).
Timing of admission from emergency department (direct or
stepdown)
Differences in effectiveness of CGA delivery between direct and
stepdown admission from emergency department on living at
home were uncertain (at discharge: F = 0.51, P = 0.49, N = 6 trials
direct, N = 4 trials stepdown; end of follow-up (3 to 12 months):
F = 0.45, P = 0.51, N = 4 trials direct, N = 7 trials stepdown).
23Comprehensive geriatric assessment for older adults admitted to hospital (Review)
Copyright © 2017 The Cochrane Collaboration. Published by John Wiley & Sons, Ltd.

Outpatient follow-up
Differences in effectiveness of CGA delivery between outpatient
follow-up and no outpatient follow-up on living at home were
uncertain (at end of follow-up: F = 0.17, P = 0.69, N = 5 trials
outpatient follow-up, N = 7 trials no outpatient follow-up).
Subgroup analysis using IPD
Results of subgroup analysis using IPD indicate that in the five
trials providing IPD (1692 participants (12% of the total num-
ber of participants); adjusted for age, sex, and frailty) there was
little or no difference in the odds of living at home at the end
of follow-up for participants in the intervention group versus the
control group (odds ratio (OR) 0.95, 95% CI 0.74 to 1.24; I² =
0%; Edmans 2013; Goldberg 2013; Kircher 2007; Somme 2010;
Saltvedt 2002) (Table 4; Table 5; Table 6). Similarly, results on
mortality indicate little or no difference in the odds of mortality
at end of follow-up (OR 0.92, 95% CI 0.70 to 1.21; I² = 0%).
Time-to-event meta-analysis allowed for the possibility that each
trial may have a different baseline hazard function; results show
little or no difference in the time to death (hazard ratio (HR) 0.88,
95% CI 0.72 to 1.08) (Appendix 3).
Sensitivity analysis
Re-running analyses using random-effects rather than fixed-effect
models had little effect on associations between intervention and
primary or secondary outcome measures (data not shown). Re-
running the analysis while excluding trials that did not omit nurs-
ing home admissions at baseline had little effect on associations
between intervention and admission to a nursing home at 3 to 12
months’ follow-up (data not shown). Also, re-running the analysis
for living at home at 3 to 12 months’ follow-up by using data from
6 months’ rather than from 12 months’ follow-up for three trials
that reported both lengths of follow-up, had little effect on the
association (data not shown). CGA became more cost-effective
when incremental QALYs for a more dependent population were
calculated on the basis of data from two trials (Goldberg 2013;
Somme 2010). We also calculated cost per LYLAH gained using
the summary estimate for living at home that was derived from
trials evaluating CGA delivered on a specialist ward and by a mo-
bile team. We found that CGA delivered on a specialist ward is
slightly more cost-effective.
D I S C U S S I O N
Summary of main results
See Summary of findings for the main comparison
We included 29 randomised trials evaluating the effectiveness of
comprehensive geriatric assessment (CGA) versus inpatient care
without CGA. Older people admitted to hospital who receive
CGA may be more likely to survive and return home (16 trials,
6799 participants) and were less likely to be admitted to a nursing
home during 3 to 12 months’ follow-up (14 trials, 6285 partici-
pants). We are uncertain whether results show a difference in effect
between wards and teams, as this analysis was underpowered. Ev-
idence for the cost-effectiveness analysis is of low-certainty owing
to imprecision and inconsistency among studies.
Overall completeness and applicability ofevidence
The included trials were published between 1984 and 2013, and
were conducted in nine countries - most (16 trials) in the USA.
Delivery of healthcare services and the role of the CGA will in-
evitably have evolved during this period. Despite this, CGA has
maintained a central position in delivery of person-centred health
care for older people with frailty. Findings from the survey of trial-
ists suggest more commonalities than differences in the way CGA
is organised and delivered but some variation in the way the in-
tervention was implemented. In one trial (Goldberg 2013), the
CGA ward was a specialist medical and mental health unit, and in
another (Edmans 2013), the intervention consisted of case man-
agement by a geriatrician at the point of discharge. In most trials,
the control group received care on the general medical ward, and
in two trials (Goldberg 2013; Kircher 2007), control group care
could include a dedicated ward for older people. Social care costs,
which were relevant to evaluation of CGA, were not included in
the cost-effectiveness analysis because of lack of reliable data. Ap-
plying these findings to other settings would require re-estima-
tion of the model based on context-specific unit costs and utilities
(Shemilt 2011).
Certainty of evidence
We judged the certainty of evidence as high for the outcome ’liv-
ing at home’ and for mortality, admission to a nursing home, and
dependency. Overall risk of bias was low, and trials showed consis-
tency, except in cognitive function and hospital length of stay. A
limitation of this review is that we received individual patient data
(IPD) from only 5 of 29 trials, hence this subgroup analysis was not
representative of the 29 included trials. We judged the certainty
of evidence to be low for the cost-effectiveness analysis owing to
imprecision and inconsistency. We derived outcomes in the cost-
effectiveness analysis from five trials providing IPD, and we based
hospitalisation costs on data from 17 trials reporting length of stay
data and providing low-certainty evidence. We based the cost of
CGA delivery on one trial and found no data for social care costs.
The effect of CGA delivered by teams is uncertain, and subgroup
analysis of the effect of ward-delivered versus team-delivered CGA
was underpowered (Appendix 4).
24Comprehensive geriatric assessment for older adults admitted to hospital (Review)
Copyright © 2017 The Cochrane Collaboration. Published by John Wiley & Sons, Ltd.
Potential biases in the review process
We limited publication bias by conducting an extensive search that
included different databases of published articles and sources of
unpublished literature. One review author screened all search re-
sults and generated a long list (using an overly inclusive approach),
from which two review authors independently selected eligible
studies.
Agreements and disagreements with otherstudies or reviews
The findings of this review are consistent with those of the first
systematic review on CGA (Stuck 1993); this review reported that
CGA increased the likelihood that patients will be living at home
at follow-up, and that control over medical recommendations and
extended outpatient follow-up were likely to improve health out-
comes. Subsequently, several published systematic reviews pro-
vided consistent findings (Bachmann 2010; Baztan 2009; Ellis
2005; Van Craen 2010). A review of CGA assessment performed
to improve outcomes for frail older people who were rapidly dis-
charged from acute hospital care (up to 72 hours) included five
trials (2287 participants) and found little evidence of benefit for
this type of CGA intervention in terms of mortality, institutionali-
sation, re-admission, functional outcomes, quality of life, and cog-
nition (Conroy 2011). Another systematic review looked at effects
of hospital-wide interventions (CGA wards, CGA teams, nursing
care models, and structural changes in physical environment) pro-
vided to improve care for frail older patients and did not identify
a single best hospital-wide intervention (Bakker 2011). Large un-
certainty surrounding cost-effectiveness results is consistent with
trial-based economic evaluation (Melis 2008; Tanajewski 2015).
A U T H O R S ’ C O N C L U S I O N S
Implications for practice
Comprehensive geriatric assessment offers benefit for the increas-
ing numbers of older people with frailty admitted to inpatient
care. Most trials have evaluated CGA on a discrete ward. Although
it has been suggested that having control over implementing rec-
ommendations of the multi-disciplinary team in a ward setting
is likely to increase success, the number of trials in the subgroup
of trials evaluating CGA teams were insufficient to confirm a dif-
ference of effect. We conducted a survey of trialists to attempt to
identify the elements of CGA that are considered important; 13 of
the 29 trialists completed the survey, and 10 to 13 of these agreed
that critical elements of CGA include tailored treatment plans,
clinical leadership, knowledge and experience, multi-disciplinary
team meetings, and involvement of patients and carers in goal set-
ting. We found that CGA may be slightly more costly to the health
service than usual care without CGA. However, our analysis did
not include the cost of home or social care. CGA may be cost-
effective, although with low certainty of evidence, and further re-
search that reports cost estimates that are setting-specific across
different sectors of care are required.
Implications for research
Questions remain over effects of delays to specialist geriatric care,
benefits of targeting CGA to older adults with frailty, effects
of CGA wards versus teams, and cost-effectiveness. Future trials
should provide a clear description of the elements of the geriatric
intervention, and should make individual participant data avail-
able for subsequent meta-analysis. We recommend standardised
outcome assessments for these trials. We developed the outcome
measurement ’life year living at home’ as an indicator of inde-
pendence and well-being. This outcome aligns with the primary
outcome used in this review. Further research conducted to test
the robustness of the LYLAH and use of alternative methods for
valuing outcomes of interventions in older people would be ben-
eficial.
A C K N O W L E D G E M E N T S
The review authors would like to acknowledge the help and sup-
port of the Cochrane Effective Practice and Organisation of Care
(EPOC) editorial group, and would like to thank the EPOC infor-
mation specialist (Paul Miller) for running the searches. We would
like to thank the peer reviewers for their contributions: Luke Vale,
Joshua Vogel, Andreas Stuck, Paul Miller, Sofia Massa, and Julia
Worswick.
We would like to acknowledge peer review contributions to the
previous version of this review from Pierre Durieux, Stephen
Chalcroft, Sasha Shepperd, and Craig Ramsay; and funding from
the National Institute for Health Research, via Cochrane Infras-
tructure funding to the Effective Practice and Organisation of
Care Group (EPOC Group), and the NIHR grant (12/5003//01;
“How to Implement Cost-Effective Comprehensive Geriatric As-
sessment”) that supported this review update.
The views and opinions expressed therein are those of the review
authors and do not necessarily reflect those of the Systematic Re-
views Programme, NIHR, NHS, or the Department of Health.
25Comprehensive geriatric assessment for older adults admitted to hospital (Review)
Copyright © 2017 The Cochrane Collaboration. Published by John Wiley & Sons, Ltd.

R E F E R E N C E S
References to studies included in this review
Applegate 1990 {published data only}∗ Applegate WB, Miller ST, Graney MJ, Elam JT, Burns
R, Akins DE. A randomized, controlled trial of a geriatric
assessment unit in a community rehabilitation hospital.
New England Journal of Medicine 1990;322:1572–8.
Miller ST, Applegate WB, Elam JT, Graney MJ. Influence
of diagnostic classification on outcomes and charges in
geriatric assessment and rehabilitation. Journal of the
American Geriatrics Society 1994;42:11–5.
Asplund 2000 {published data only}
Asplund K, Gustafsen Y, Jacobsson C, Bucht G, Wahlin A,
Peterson J, et al. Geriatric-based versus general wards for
older acute medical patients: a randomised comparison
of outcomes and use of resources. Journal of the American
Geriatrics Society 2000;48:1381–8.
Barnes 2012 {published and unpublished data}
Barnes DE, Palmer RM, Kresevic DM, Fortinsky RH,
Kowal J, Chren M-M, Landefeld CS. Acute care for elders
unit produced shorter hospital stays at lower cost while
maintaining patients’ functional status. Health Affairs 2012;
31(6):1227–36.
Boustani 2012 {published and unpublished data}
Boustani MA, Campbell NL, Khan BA, Abernathy G,
Zawahiri M, Campbell T, et al. Enhancing care for
hospitalised older adults with cognitive impairment: a
randomised controlled trial. Journal of General InternalMedicine 2012;27(5):561–7.
Cohen 2002 GEMC {published data only}∗ Cohen HJ, Feussner JR, Weinberger M, Carnes M,
Hamdy RC, Hsieh F, et al. A controlled trial of inpatient
and outpatient geriatric evaluation and management. New
England Journal of Medicine 2002;346:905–12.
Cohen 2002 UCOP {published data only}∗ Cohen HJ, Feussner JR, Weinberger M, Carnes M,
Hamdy RC, Hsieh F, et al. A controlled trial of inpatient
and outpatient geriatric evaluation and management. NewEngland Journal of Medicine 2002;346:905–12.
Collard 1985 {published data only}
Bachman SS, Collard AF, Greenberg JN, Fountain E,
Huebner TW, Kimball B, et al. An innovative approach
to geriatric acute care delivery: the Choate-Symmes
experience. Hospital & Health Services Administration 1987;
November:509–20.∗ Collard AF, Bachman SS, Beatrice DF. Acute care delivery
for the geriatric patient: an innovative approach. QuarterlyReview Bulletin 1985;June:180–5.
Counsell 2000 {published data only}
Counsell SR, Holder CM, Liebenauer LL, Palmer
RM, Fortinsky RH, Kresevic DM, et al. Effects of a
multicomponent intervention on functional outcomes
and process of care in hospitalised older patients: a
randomised controlled trial of acute care for elders (ACE)
in a community hospital. Journal of the American GeriatricsSociety 2000;48:1572–81.
Edmans 2013 {published and unpublished data}∗ Edmans J, Bradshaw L, Franklin M, Gladman J. Specialist
geriatric medical assessment for patients discharged from
hospital acute assessment units: randomised controlled trial.
BMJ 2013;347:doi: 10.1136/bmj.f5874.
Tanajewski L, Franklin M, Gkoutouras G, Berdunov
V, Edmans J, Conroy S, et al. Cost-effectiveness of a
specialist geriatric medical intervention for frail older people
discharged from acute medical units: economical evaluation
in a two-centre randomised controlled trial (AMIGOS).
PLOS ONE 2015;10(5):doi:10.1371/journal.
Fretwell 1990 {published data only}∗ Fretwell MD, Raymond PM, McGarvey ST, Owens
N, Traines M, Silliman RA, et al. The senior care study.
A controlled trial of a consultative / unit based geriatric
assessment program in acute care. Journal of the American
Geriatrics Society 1990;38:1073–81.
Silliman RA, McGarvey ST, Raymond PM, Fretwell MD.
Senior care study: does inpatient interdisciplinary geriatric
assessment help the family caregivers of acutely ill older
patients?. Journal of the American Geriatrics Society 1990;38
(4):461–6.
Goldberg 2013 {published and unpublished data}
Goldberg SE, Bradshaw LE, Kearney FC, Russell C,
Whittamore KH, Foster PER, et al. Care in specialist
medical and mental health unit compared with standard
care for older people with cognitive impairment admitted
to general hospital: randomised controlled trial (NIHR
TEAM trial). BMJ 2013;347:doi: 10.1136/bmj.f4132.
Harris 1991 {published data only}
Harris RD, Henschke PJ, Popplewell PY, Radford AJ, Bond
MJ, Turnbull RJ, et al. A randomised study of outcomes
in a defined group of acutely ill elderly patients managed
in a geriatric assessment unit or a general medical unit.
Australian and New Zealand Journal of Medicine 1991;21:
230–4.
Hogan 1987 {published data only}
Hogan DB, Fox RA, Badley BWD, Mann OE. Effect of a
geriatric consultation service on management of patients in
an acute care hospital. Canadian Medical Association Journal1987;April:713–7.
Kay 1992 {published data only}
Kay G, MacTavish M, Moffat C, Lau G. Development and
evaluation of a geriatric assessment unit in a community
hospital. Fall 1992;16(3):2–9.
Kircher 2007 {published data only}
Kircher TJ, Wormstall H, Muller PH, Schwarzler F,
Buchkremer G, Wild K, et al. A randomised trial of a
geriatric evaluation and management consultation services
in frail hospitalised patients. Age & Ageing 2007;36:36–42.
MEDLINE: 932
26Comprehensive geriatric assessment for older adults admitted to hospital (Review)
Copyright © 2017 The Cochrane Collaboration. Published by John Wiley & Sons, Ltd.

Landefeld 1995 {published data only}
Covinsky KE, King JT, Quinn LM, Siddique R, Palmer R,
Kresevic DM, et al. Does acute care for elders units increase
hospital costs? A cost analysis using the hospital perspective.
Journal of the American Geriatrics Society 1997;45:729–34.
MEDLINE: 941
Covinsky KE, Palmer R, Kresevic DM, Kahana E, Counsell
C, Fortinsky RH, et al. Improving functional outcomes
in older patients: lessons from an acute care for elders
unit. Journal on Quality Improvement 1998;24(2):63–76.
MEDLINE: 942∗ Landefeld CS, Palmer RM, Krescevic DM, Fortinsky
RH, Kowal J. A randomised trial of care in a hospital
medical unit especially designed to improve the functional
outcomes of acutely ill older patients. New England Journal
of Medicine 1995;332:1338–44.
Li 2015 {published and unpublished data}
Li TR, Li Y, Zhang L, Tan AJ. Effects of comprehensive
geriatric assessment intervention on Chinese Han older
patients with multiple chronic comorbidities. Journal of theAmerican Geriatrics Society 2015;63:S397–8.
McVey 1989 {published data only}
Allen CA, Becker PM, McVey LJ, Saltz CC, Feussner
JR, Cohen HJ. A randomized, controlled clinical trial
of a geriatric consultation team. Compliance with
recommendations. JAMA 1986;255(19):2617–21.
MEDLINE: 929
Becker PM, McVey LJ, Saltz CC, Feussner JR, Cohen HJ.
Hospital-acquired complications in a randomised controlled
clinical trial of a geriatric consultation team. JAMA 1987;
17:2313–7.∗ McVey LJ, Becker PM, Saltz CC, Feussner JR, Cohen HJ.
Effect of a geriatric consultation team on functional status
of elderly hospitalized patients. Annals of Internal Medicine
1989;110(1):79–84. MEDLINE: 927
Saltz CC, McVey LJ, Becker PM, Feussner JR, Cohen
HJ. Impact of a geriatric consultation team on discharge
placement and repeat hospitalization. The Gerontologist
1988;28(3):344–50. MEDLINE: 928
Naughton 1994 {published data only}
Naughton BJ, Moran MB, Feinglass J, Falconer J, Williams
ME. Reducing hospital costs for the geriatric patient
admitted from the emergency department: a randomized
trial. Journal of the American Geriatrics Society 1994;41:
1045–9.
Nikolaus 1999 {published data only}
Nikolaus T, Specht-Leible N, Bach M, Oster P, Schuerf G.
A randomised trial of comprehensive geriatric assessment
and home intervention in the care of hospitalised patients.
Age & Ageing 1999;28:543–50.
Nikolaus 1999 plus ESD {published data only}
Nikolaus T, Specht-Leible N, Bach M, Oster P, Schuerf G.
A randomised trial of comprehensive geriatric assessment
and home intervention in the care of hospitalised patients.
Age & Ageing 1999;28:543–50.
Powell 1990 {published data only}
Powell C, Montgomery P. The age study: the admission of
geriatric patients through emergency. Age & Ageing 1990;
19(Suppl):21–2. MEDLINE: 933
Reuben 1995 {published data only}
Reuben DB, Borok GM, Wolde-Tsadik G, Ershoff DH,
Fishman LK, Ambrosini VL, et al. A randomised trial
of comprehensive geriatric assessment in the care of
hospitalised patients. New England Journal of Medicine1995;332:1345–50.
Rubenstein 1984 {published data only}
Rubenstein LZ, Josephson KR, Harker JO, Miller DK,
Wieland DG. The Sepulveda GEU Study revisited: long-
term outcomes, use of services, and costs. Ageing Clinical &
Experimental Research 1995;7:212–7. MEDLINE: 936∗ Rubenstein LZ, Josephson KR, Wieland DG, English PA,
Sayre JA, Kane RL. Effectiveness of a geriatric evaluation
unit. New England Journal of Medicine 1984;311:1664–70.
MEDLINE: 935
Rubenstein LZ, Wieland GD, Josephson KR, Rosbrook
B, Sayre J, Kane RL. Improved survival for frail elderly
inpatients on a geriatric evaluation unit (GEU): who
benefits?. Journal of Clinical Epidemiology 1988;41:441–9.
Saltvedt 2002 {published data only}
Saltvedt I, Jordhoy M, Opdahl Mo ES, Fayers P, Kaasa S,
Sletvold O, et al. Randomised trial of in-hospital geriatric
intervention: impact on function and morale [Sletvold O].
Gerontology 2006;52:223–30.∗ Saltvedt I, Opdahl Mo ES, Fayers P, Kaasa S, Sletvold
O. Reduced mortality in treating acutely sick, frail older
patients in a geriatric evaluation and management unit.
A prospective randomised trial. Journal of the American
Geriatrics Society 2002;50:792–8.
Saltvedt I, Spigset O, Ruths S, Fayers P, Kaasa S, Sletvold O.
Patterns of drug prescription in a geriatric evaluation and
management unit as compared with the general medical
wards: a randomised study. European Journal of ClinicalPharmacology 2005;61:921–8.
Satvedt I, Saltnes T, Opdahl Mo ES, Fayers P, Kaasa S,
Sletvold O. Acute geriatric intervention increases the
number of patients able to live at home. A prospective
randomised study. Aging Clinical and Experimental Research
2004;16(4):300–6.
Shamian 1984 {published data only}
Shamian J, Clarfield AM, Maclean J. A randomized trial of
intra-hospital relocation of geriatric patients in a tertiary-
care teaching hospital. Journal of the American GeriatricsSociety 1984;32:794–800. MEDLINE: 937
Somme 2010 {published and unpublished data}
Somme D, Andrieux N, Guerot E, Lahjibi-Paulet H,
Lazarovici C, Gisselbrecht M, et al. Loss of autonomy
among elderly patients after a stay in a medical intensive care
unit (ICU): a randomised study of the benefit of transfer to
a geriatric ward. Archives of Gerontology and Geriatrics 2010;
50:e36–e40.
27Comprehensive geriatric assessment for older adults admitted to hospital (Review)
Copyright © 2017 The Cochrane Collaboration. Published by John Wiley & Sons, Ltd.

Thomas 1993 {published data only}
Thomas DR, Brahan R, Haywood BP. Inpatient
community-based geriatric assessment reduces subsequent
mortality. Journal of the American Geriatrics Society 1993;
41:101–4.
Wald 2011 {published and unpublished data}
Wald HL, Glasheen JJ, Guerrasio J, Youngwerth JM,
Cumbler EU. Evaluation of a hospitalist-run acute care for
the elderly service. Journal of Hospital Medicine 2011;6(6):
313–21.
White 1994 {published data only}
White SJ, Powers JS, Knight JR, Harrell D, Varnell L,
Vaughn C, et al. Effectiveness of an inpatient geriatric
service in a university hospital. Journal of the Tennessee
Medical Association 1994;87:425–8.
Winograd 1993 {published data only}
Winograd CH, Gerety MB, Lai NA. A negative trial
of inpatient geriatric consultation. Archives of InternalMedicine 1993;153:2017–23.
References to studies excluded from this review
Abizanda 2011 {published and unpublished data}
Abizanda P, Leon M, Dominguez-Martin L, Lozano-Berrio
V, Romero L, Luengo C, et al. Effects of a short-term
occupational therapy intervention in an acute geriatric unit.
A randomized clinical trial. Maturitas 2011;69(3):273–8.
Borok 1994 {published data only}
Borok GM, Reuben DB, Zendle LJ, Ershoff DH,
Wolde-Tsadik G. Rationale and design of a multi-centre
randomized trial of comprehensive geriatric assessment
consultation for hospitalised patients in an RMO. Journal ofthe American Geriatrics Society 1994;42(5):536–44.
Boult 1994 {published data only}
Boult C, Boult L, Murphy C, Ebbitt B, Luptak M.
Controlled trial of outpatient geriatric evaluation and
management. Journal of the American Geriatrics Society1994;42(5):465–70.
Campion 1983 {published data only}
Campion EW, Jette A, Berkman B. Interdisciplinary
geriatric consultation service: a controlled trial. Journal of
the American Geriatrics Society 1983;31(12):792–6.
Cole 1991 {published data only}
Cole MG, Fenton FR, Engelsmann F, Mansouri I.
Effectiveness of geriatric psychiatry consultation in an acute
care hospital: a randomized clinical trial. Journal of theAmerican Geriatrics Society 1991;39(12):1183–8.
Cunliffe 2004 {published data only}
Cunliffe AL, Gladman JRF, Husbands SL, Miller P, Dewey
ME, Harwood RH. Sooner and healthier: a randomised
controlled trial and interview study of an early discharge
rehabilitation service for older people. Age & Ageing 2004;
33:246–52.
Epstein 1990 {published data only}
Epstein AM, Hall JA, Fretwell M, Feldstein M, DeCiantis
ML. Consultative geriatric assessment for ambulatory
patients. JAMA 1990;263(4):538–44.
Fleming 2004 {published data only}
Fleming SA, Blake H, Gladman JRF, Hart E, Lymberry
M, Dewey ME, et al. A randomised controlled trial of
a care home rehabilitation service to reduce long-term
institutionalisation for elderly people. Age & Ageing 33;4:
384–90.
Garåsen 2007 {published data only}
Garåsen H, Windspoll R, Johnsen R. Intermediate care at a
community hospital as an alternative to prolonged general
hospital care for elderly patients: a randomised controlled
trial. BMC Public Health 2007;7:68.
Gayton 1987 {published data only}
Gayton D, Wood-Dauphinee S, de Lorimer M, Tousignant
P, Hanley J. Trial of a geriatric consultation team in an
acute care hospital. Journal of the American Geriatrics Society
1987;35(8):726–36.
Germain 1995 {published data only}
Germain M, Knoeffel F, Wieland D, Rubenstein LZ. A
geriatric assessment and intervention team for hospital
inpatients awaiting transfer to a geriatric unit: a randomized
trial. Aging - Clinical and Experimental Research 1995;7(1):
55–60.
Gharacholou 2012 {published and unpublished data}
Gharacholou SM, Sloane R, Cohen HJ, Schmader KE.
Geriatric inpatient units in the care of hospitalized frail
adults with a history of heart failure. International Journal ofGerontology 2012;6(2):112–6.
Gill 2003 {published data only}
Gill TM, Baker DI, Gottschalk M, Gahbauer EA,
Charpentier PA, de Regt PT, et al. A rehabilitation
programme for physically frail community living older
persons. Archives of Physical Medicine and Rehabilitation
2003;84:394–404.
Gill TM, McGloin JM, Gahbauer EA, Shepard DM,
Bianco LM. Two recruitment strategies for a clinical trial of
physically frail community-living older persons. Journal of
the American Geriatrics Society 2001;49:1039–45.
Harari 2007 {published data only}
Harari D, Martin FC, Buttery A, O’Neill S, Hopper A.
The older persons’ assessment and liaison team ’OPAL’:
evaluation of comprehensive geriatric assessment in acute
medical inpatients. Age & Ageing 2007;36(6):670–5.
Hogan 1990 {published data only}
Hogan DB. Impact of geriatric consultation services for
elderly patients admitted to acute care hospitals. Canadian
Journal on Aging 1990;9(1):35–44.
Hogan DB, Fox RA. A prospective controlled trial of a
geriatric consultation team in an acute-care hospital. Age &Ageing 1990;19:107–13.
Karppi 1995 {published data only}
Karppi P. Effects of a geriatric inpatient unit on elderly
home-care patients: a controlled trial. Aging Clinical and
Experimental Research 1995;7:207–11.
Karppi P, Tilvis R. Effectiveness of a Finnish geriatric
inpatient assessment. Two-year follow-up of a randomized
28Comprehensive geriatric assessment for older adults admitted to hospital (Review)
Copyright © 2017 The Cochrane Collaboration. Published by John Wiley & Sons, Ltd.

clinical trial on community-dwelling patients. Scandinavian
Journal of Primary Health Care 1995;13(2):93–8.
Kehusmaa 2010 {published and unpublished data}
Kehusmaa S, Autti-Ramao I, Valaste M, Hinkka K,
Rissanen P. Economic evaluation of a geriatric rehabilitation
programme: a randomised controlled trial. Journal of
Rehabilitation Medicine 2010;42(10):949–55.
Landi 1997 {published data only}
Landi F, Zuccala G, Bernabei R, Cocchi A, Manigrasso L,
Tafani A, et al. Physiotherapy and occupational therapy: a
geriatric experience in the acute care hospital. American
Journal of Physical Medicine and Rehabilitation 1997;76(1):
38–42.
Ledesert 1994 {published data only}
Ledesert B, Lombrail P, Yeni P, Carbon C, Brodin M. The
impact of a comprehensive multi-dimensional geriatric
assessment programme on duration of stay in a French acute
medical ward. Age & Ageing 1994;23:223–7.
Liem 1986 {published data only}
Liem PH, Chernoff R, Carter WJ. Geriatric rehabilitation
unit: a 3-year outcome evaluation. Journal of Gerontology1986;41(1):44–50.
Meissner 1989 {published data only}
Meissner P, Andolsek K, Mears PA, Fletcher B. Maximising
the functional status of geriatric patients in an acute
community hospital setting. The Gerontologist 1989;29(4):
524–8.
Miller 1996 {published data only}
Miller DK, Lewis L, Nork MJ, Morley JE. Controlled
trial of a geriatric case-finding and liaison service in an
emergency department. Journal of the American Geriatrics
Society 1996;44(5):513–20.
Mudge 2006 {published data only}
Mudge A, Laracy S, Richter K, Denaro C. Controlled
trial of multidisciplinary care teams for acutely ill medical
inpatients: enhanced multidisciplinary care. Internal
Medicine Journal 2006;36:558–63.
Mudge 2012 {published and unpublished data}
Mudge AM, Denaro CP, O’Rourke P. Improving hospital
outcomes in patients admitted from residential aged care:
results from a controlled trial. Age and Ageing 2012;41(5):
670–3.
Nipp 2012 {published and unpublished data}
Nipp R, Sloane R, Rao AV, Schmader KE, Cohen HJ.
Role of pain medications, consultants and other services
in improved pain control of elderly adults with cancer in
geriatric evaluation and management units. Journal of theAmerican Geriatrics Society 2012;60(10):1912–7.
Retornaz 2007 {published data only}
Retornaz F, Seux V, Sourial N, Braud AC, Monette J,
Bergman H, et al. Comparison of health and functional
status between older inpatients with and without cancer
admitted to a Geriatric/Internal Medicine Unit. The
Journals of Gerontology 2007;62A:917–22.
Reuben 1992 {published data only}
Reuben DB, Wolde-Tsadik G, Pardamean B, Hammond
B, Borok GM, Rubenstein LZ, et al. The use of targeting
criteria in hospitalized HMO patients: results from the
demonstration phase of the Hospitalised Older Persons
Evaluation (HOPE) study. Journal of the American GeriatricsSociety 1992;40:482–8.
Rubin 1992 {published data only}
Rubin CD, Sizemore MT, Loftis PA, Adams-Huet B,
Anderson RJ. The effect of geriatric evaluation and
management on medicare reimbursement in a large public
hospital: a randomized clinical trial. Journal of the AmericanGeriatrics Society 1992;40:989–95.
Rubin CD, Sizemore MT, Loftis PA, Loret de Mola
N. Randomized controlled trial of outpatient geriatric
evaluation and management in a large public hospital.
Journal of the American Geriatrics Society 1993;41(10):
1023–8.
Trentini 2001 {published data only}
Trentini M, Semeraro S, Motta M. Effectiveness of geriatric
evaluation and care. One-year results of a multicenter
randomized clinical trial. Aging - Clinical and Experimental
Research 2001;13(5):395–405.
Volicer 1994 {published data only}
Volicer L, Collard A, Hurley A, Bishop C, Kern D, Karon
S. Impact of special care unit for patients with advanced
Alzheimer’s disease on patient discomfort and costs. Journalof the American Geriatrics Society 1994;42:597–603.
Yoo 2013a {published and unpublished data}
Yoo JW, Kim S, Seol H, Kim SJ, Yang JM Ryu WS, et al.
Effects of an internal medicine floor interdisciplinary team
on hospital and clinical outcomes of seniors with acute
medical illness. Geriatrics and Gerontology International
2013;13(4):942–8.
Yoo 2013b {published and unpublished data}
Yoo JW, Nakagawa S, Kim S. Delirium and transition to a
nursing home of hospitalized older adults: a controlled trial
of assessing the interdisciplinary team-based geriatric care
and care coordinated by non-geriatrics specialist physicians.
Geriatrics and Gerontology International 2013;13(2):342–50.
Yoo 2014 {published and unpublished data}
Yoo JW, Seol H, Kim SJ, Yang JM, Ryu WS, Min TD, et
al. Effects of hospitalist-directed interdisciplinary medicine
floor service on hospital outcomes for seniors with acute
medical illness. Geriatrics and Gerontology International
2014;14(1):71–7.
Young 2005 {published data only}
Green J, Young J, Forster A. Background to the post-acute
care trial of community hospital rehabilitation for older
people. International Journal of Therapy and Rehabilitation
2006;13(2):66–73.
Green J, Young J, Forster A, Mallinder K, Bogle S, Lowson
K, et al. Effects of locality based community hospital care
29Comprehensive geriatric assessment for older adults admitted to hospital (Review)
Copyright © 2017 The Cochrane Collaboration. Published by John Wiley & Sons, Ltd.

on independence in older people needing rehabilitation:
randomised controlled trial. BMJ 2005;331:317–22.
O’Reilly J, Lowson K, Young J, Forster A, Green J, Small N.
A cost effectiveness analysis within a randomised controlled
trial of post-acute care of older people in a community
hospital. BMJ 2006;333:228.
Small N, Green J, Spink J, Forster A, Lowson K, Young J.
The patient experience of community hospital - the process
of care as a determinant of satisfaction. Journal of Evaluation
in Clinical Practice 2007;13(1):95–101.
Young J, Forster A, Green J, Bogle S. Post-acute transfer of
older people to intermediate care services: the sooner the
better?. Age & Ageing 2007;36(5):589–92.
Young J, Green J, Forster A, Small N, Lowson K, Bogle S, et
al. Postacute care for older people in community hospitals:
a multicenter randomized, controlled trial. Journal of theAmerican Geriatrics Society 2007;55(12):1995–2002.
Additional references
Bachmann 2010
Bachmann S, Finger C, Huss A, Egger M, Stuck AE,
Clough-Gorr KM. In patient rehabilitation specifically
designed for geriatric patients: systematic review and meta-
analysis of randomised controlled trials. BMJ 2010;340:
c1718.
Bakker 2011
Bakker FC, Robben SHM, Olde Rikkert MGM. Effects of
hospital-wide interventions to improve care for frail older
inpatients: a systematic review. BMJ Quality and Safety
2011;doi:10.1136:/bmjqs.2010.047183.
Barnett 2012
Barnett K, Mercer SW, Norbury M, Watt G, Wyke
S, Guthrie B. Epidemiology of multimorbidity and
implications for health care, research, and medical
education: a cross-sectional study. Lancet 2012;380:37–43.
Baztan 2009
Baztán JJ, Suárez-García FM, López-Arrieta J, Rodríguez-
Mañas L, Rodríguez-Artalejo F. Effectiveness of acute
geriatric units on functional decline, living at home, and
case fatality among older patients admitted to hospital for
acute medical disorders: meta-analysis. BMJ 2009;338:b50.
Baztan 2011
Baztan JJ, Suarez-Garcia FM, Lopez-Arrieta J, Rodriguez-
Manaz L. Efficiency of acute geriatric units: a meta-analysis
of controlled studies. Revista Española de Geriatría y
Gerontología 2011;46:186–92.
Clegg 2013
Clegg A, Young J, Illiffe S, Olde Rikkert M, Rockwood K.
Frailty in elderly people. Lancet 2013;381(9868):752–62.
Cochran 1954
Cochran WG. The combination of estimates from different
experiments. Biometrics 1954;10:101–29.
Conroy 2011
Conroy SP, Stevens T, Parker SG, Gladman JRF. A
systematic review of comprehensive geriatric assessment
to improve outcomes for frail older people being rapidly
discharged from acute hospital: ’interface geriatrics’. AgeAgeing 2011;40:436–43.
Deeks 2001
Deeks J, Altman D, Bradburn MJ. Statistical methods for
examining heterogeneity and combining results from several
studies in meta-analysis. Egger M, Davey Smith G, AltmanDG, editors. Systematic Reviews in Health Care. Meta-
analysis in Context. New York, New York: Wiley, 2001:
285–312.
DerSimonian 1986
DerSimonian R, Laird N. Meta-analysis in clinical trials.
Controlled Clinical Trials 1986;7:177–88.
Edmans 2011
Edmans J, Conroy S, Harwood R, Lewis S, Elliot R,
Logan P, et al. Acute medical unit comprehensive geriatric
assessment intervention study (AMIGOS). Trials 2011;12:
200.
Ellis 2011
Ellis G, Whitehead MA, O’Neill D, Langhorne P,
Robinson D. Comprehensive geriatric assessment for
older adults admitted to hospital. Cochrane Database
of Systematic Reviews 2011, Issue 7. DOI: 10.1002/
14651858.CD006211.pub2
Ellis 2005
Ellis G, Langhorne P. Comprehensive geriatric assessment
for older hospital patients. British Medical Bulletin 2005;
71:45–59.
EPOC 2017a
Effective Practice, Organisation of Care (EPOC). Data
collection form. EPOC resources for review authors, 2017.
Available from epoc.cochrane.org/epoc-resources-review-
authors.
EPOC 2017b
Effective Practice, Organisation of Care (EPOC). Suggested
risk of bias criteria for EPOC reviews. EPOC resources for
review authors, 2017. Available from epoc.cochrane.org/
epoc-specific-resources-review-authors.
EPOC 2017c
Effective Practice, Organisation of Care (EPOC). EPOC
worksheets for preparing a ’Summary of findings’ table
using GRADE. EPOC resources for review authors, 2017.
Available from epoc.cochrane.org/epoc-specific-resources-
review-authors.
Extermann 2007
Extermann M, Hurria A. Comprehensive geriatric
assessment for older patients with cancer. Journal of ClinicalOncology 2007;25(14):1824–31.
Francis 2013
Francis R. Report of the Mid Staffordshire NHS FoundationTrust Public Inquiry. London: The Stationary Office, 2013.
GRADEpro GDT 2015 [Computer program]
McMaster University (developed by Evidence Prime).
GRADEpro GDT. Version accessed prior to 10 August
30Comprehensive geriatric assessment for older adults admitted to hospital (Review)
Copyright © 2017 The Cochrane Collaboration. Published by John Wiley & Sons, Ltd.
2017. Hamilton (ON): McMaster University (developed
by Evidence Prime), 2015.
Guyatt 2008
Guyatt GH, Oxman AD, Vist G, Kunz R, Falck-Ytter Y,
Alonso-Coello P, et al. GRADE Working Group. GRADE:
an emerging consensus on rating quality of evidence and
strength of recommendations. BMJ 2008;336:924–6.
Handoll 2009
Handoll HHG, Cameron ID, Mak JCS, Finnegan TP.
Multidisciplinary rehabilitation for older people with hip
fractures. Cochrane Database of Systematic Reviews 2009,
Issue 4. DOI: 10.1002/14651858.CD007125.pub2
Harwood 2011
Harwood RH, Goldberg SE, Whittamore KH, Russell C,
Gladman JRF, Jones RG, et al. Medical Crises in Older
People Study Group (MCOP). Evaluation of a medical
and mental health unit compared with standard care for
older people whose emergency admission to an acute
general hospital is complicated by concurrent ’confusion’: a
controlled clinical trial. TEAM: Trial of an Elderly Acute
care Medical and mental health unit. Trials 2011;12:123.
Higgins 2003
Higgins JPT, Thompson SG, Deeks JJ, Altman DG.
Measuring inconsistency in meta-analysis. BMJ 2003;327:
557–60.
Higgins 2011
Higgins JP, Green S, editor(s). Cochrane Handbook of
Systematic Reviews of Interventions Version 5.1.0 (updated
March 2011). The Cochrane Collaboration, 2011.
Available from handbook.cochrane.org. www.cochrane–
handbook.org: The Cochrane Collaboration.
Kaambwa 2013
Kaambwa B, Billingham L, Bryan S. Mapping utility
scores from the Barthel index. European Journal of HealthEconomics 2013;14:231–41.
Melis 2008
Melis RJF, Adang E, Teerenstra S, van Eijken MIJ, Wimo
A, van Achterberg T, et al. Multidimensional geriatric
assessment: back to the future: cost-effectiveness of a
multidisciplinary intervention model for community-
dwelling frail older people. Journals of Gerontology, Series A.Biological Sciences and Medical Sciences 2008;63(3):275–82.
Morganti 2013
Morganti KG, Bauhoff S, Blanchard JC, Abir M, Iyer
N, Smith AC, et al. The evolving role of emergency
departments in the United States, 2013. www.rand.org/
content/dam/rand/pubs/research reports/RR200/RR280/
RAND RR280.pdf (accessed 20 May 2016).
National Audit Office 2013
National Audit Office (NAO). Report by the Comptroller
and Auditor General. Emergency admissions to hospital:
managing the demand. National Audit Office 30 October
2013.
NICE 2013
NICE National Institute for Health and Care Excellence.
Process and methods guides. Guide to the methods of
technology appraisal, 2013. publications.nice.org.uk/pmg9
4 April 2013:1–102.
Review Manager 2014 [Computer program]
Nordic Cochrane Centre, The Cochrane Collaboration.
Review Manager 5 (RevMan 5). Version 5.3. Copenhagen:
Nordic Cochrane Centre, The Cochrane Collaboration,
2014.
Royal College of Physicians 2012
Royal College of Physicians. Hospitals on the Edge? The
time for action. A report by the Royal College of Physicians
2012;www.rcplondon.ac.uk/guidelines-policy/hospitals-
edge-time-action:1–8.
Rubenstein 1991
Rubenstein LZ, Stuck AE, Siu AL, Wieland D. Impact
of geriatric evaluation and management programs on
defined outcomes: overview of the evidence. Journal of the
American Geriatrics Society. 1991; Vol. 39:8S–16S.
Rudd 1997
Rudd AG, Wolfe CDA, Tilling K, Beech R. Randomised
controlled trial to evaluate early discharge scheme for
patients with stroke. BMJ 1997;315:1039–44.
Shemilt 2011
Shemilt I, Mugford M, Byford S, Drummond M, Eisenstein
E, Knapp M, et al. Chapter 15: Incorporating economics
evidence. In: Higgins JP, Green S, editor(s). Cochrane
Handbook for Systematic Reviews of Interventions Version
5.1.0 (updated March 2011). The Cochrane Collaboration,
2011. Available from handbook.cochrane.org.
STATA 13 [Computer program]
StataCorp. Stata Statistical Software: Release 13.. College
Station, TX: StataCorp LP, 2013.
Stuck 1993
Stuck AE, Siu AL, Wieland D, Adams J, Rubenstein LZ.
Comprehensive geriatric assessment: a meta-analysis of
controlled trials. Lancet 1993;342:1032–6.
SUTC 2013
Stroke Unit Trialists’ Collaboration. Organised inpatient
(stroke unit) care for stroke. Cochrane Database of
Systematic Reviews 2013, Issue 9. DOI: 10.1002/
14651858.CD000197
Tanajewski 2015
Tanajewski L, Franklin M, Ghountouras G, Berdunov
V, Edmans J, Conroy S, et al. Cost-effectiveness of a
specialist geriatric medical intervention for frail older
people discharged from acute medical units: economic
evaluation in a two-centre randomised controlled trial
(AMIGOS). PLOS ONE 2015;10(5):doi:10.1371/
journal.pone.0121340.
The Lancet 2014
Editorial. Global elderly care in crisis. The Lancet 2014;
383:doi:10.1016/S0140–6736(14)60463-3.
31Comprehensive geriatric assessment for older adults admitted to hospital (Review)
Copyright © 2017 The Cochrane Collaboration. Published by John Wiley & Sons, Ltd.

Thompson 1999
Thompson SG, Sharp SJ. Explaining heterogeneity in meta-
analysis: a comparison of methods. Statistics in Medicine
1999;18:2693–708.
Van Craen 2010
Van Craen K, Braes T, Wellens N, Denhaerynck K,
Flamaing J, Moons P, et al. The effectiveness of inpatient
geriatric evaluation and management units: a systematic
review and meta-analysis. Journal of the American Geriatrics
Society 2010;58:83–92.
van Exel 2004
van Exel NJ, Scholte op Reimer WJ, Koopmanschap
MA. Assessment of post-stroke quality of life in cost-
effectiveness studies: the usefulness of the Barthel index and
the EuroQoL-5D. Quality of Life Research 2004;13:427–33.
WHO 2016
World Health Organization. World Health Statistics 2016:
Monitoring Health for the SDGs, Sustainable DevelopmentGoals. Geneva, Switzerland: WHO Press, 2016.
References to other published versions of this review
Ellis 2011
Ellis G, Whitehead MA, O’Neill D, Langhorne P,
Robinson D. Comprehensive geriatric assessment for
older adults admitted to hospital. Cochrane Databaseof Systematic Reviews 2011, Issue 7. DOI: 10.1002/
14651858.CD006211.pub2∗ Indicates the major publication for the study
32Comprehensive geriatric assessment for older adults admitted to hospital (Review)
Copyright © 2017 The Cochrane Collaboration. Published by John Wiley & Sons, Ltd.

C H A R A C T E R I S T I C S O F S T U D I E S
Characteristics of included studies [ordered by study ID]
Applegate 1990
Methods Year: 1990
Location: Memphis, Tennessee, USA (1500-bed rehabilitation hospital)
Team/ward?: ward
Timing: stepdown
Trial method: randomised trial
Participants Number (total): 155
Mean age: 78.8 years
Male:female proportion: 24% male
Inclusion criteria: > 65 years of age; at risk for nursing home placement and/or func-
tional impairment
(Some patients younger than 65 were considered if they met the criteria)
Exclusion criteria: unstable medical conditions; short-term monitoring required; sur-
vival < 6 months; serious chronic mental impairment; nursing home placement inevitable
Interventions Team members: specialist nurse, ward nurses, social workers, physiotherapists, occupa-
tional therapists, dieticians, speech and language pathologists, audiologists, psychologists
Team organisation: comprehensive assessment, multi-disciplinary meetings at least
weekly, regular use of standard assessment tools
Control: usual care provided by physicians
Outcomes Mortality
ADLs
Days spent in nursing homes
Mood
Cognition at 6 months and at 1 year
Trial conclusions: improved function, reduced nursing home admission
Notes
Risk of bias
Bias Authors’ judgement Support for judgement
Random sequence generation (selection
bias)
Low risk Computer-generated random number se-
quences stratified by participant risk of
nursing home admission
Allocation concealment (selection bias) Unclear risk Method of allocation concealment not de-
scribed
Blinding of participants and personnel
(performance bias)
High risk Blinding of participants and personnel not
possible
33Comprehensive geriatric assessment for older adults admitted to hospital (Review)
Copyright © 2017 The Cochrane Collaboration. Published by John Wiley & Sons, Ltd.

Applegate 1990 (Continued)
Blinding of outcome assessment (detection
bias) for objective outcome measures
Low risk Outcome measures (e.g. living at home)
unlikely to be influenced by lack of blind-
ing
Blinding of outcome assessment (detection
bias) for subjective outcome measures
Unclear risk Few details of outcome assessors given
Incomplete outcome data (attrition bias)
All outcomes
Unclear risk Insufficient recording of attritions/exclu-
sions
Selective reporting (reporting bias) Unclear risk No a priori documentation found to judge
this item
Other bias Low risk Little evidence of contamination of control
group
Asplund 2000
Methods Year: 2000
Location: Umea, Sweden (University Hospital)
Team/ward?: ward
Timing: direct from emergency ward
Trial method: randomised trial
Participants Number (total): 413
Mean age: 81 years
Male:female proportion: 40% male
Inclusion criteria: patients over 70 admitted acutely
Exclusion criteria: patients requiring specialist unit (ICU, CCU, stroke)
Interventions Team members: senior geriatrician, ward nurses, social workers, physiotherapists, occu-
pational therapists, dieticians
Team organisation: comprehensive assessment
Control: 2 internal mixed medical wards, each with 30 beds, where acutely ill patients
from local hospital catchment area constituted the majority of patients
Outcomes Global outcome (death, institutionalisation, dependence, or psychological outcomes)
Death
Institutionalisation
Barthel Index
Cognitive function
Psychological outcomes
Trial conclusions: reduced institutionalisation
Notes
Risk of bias
34Comprehensive geriatric assessment for older adults admitted to hospital (Review)
Copyright © 2017 The Cochrane Collaboration. Published by John Wiley & Sons, Ltd.

Asplund 2000 (Continued)
Bias Authors’ judgement Support for judgement
Random sequence generation (selection
bias)
Unclear risk Sequence generation not described, al-
though block randomisation described in
detail
Allocation concealment (selection bias) Low risk Sealed opaque envelopes
Blinding of participants and personnel
(performance bias)
High risk Blinding of participants and personnel not
possible
Blinding of outcome assessment (detection
bias) for objective outcome measures
Low risk Outcome measures (e.g. living at home)
unlikely to be influenced by lack of blind-
ing
Blinding of outcome assessment (detection
bias) for subjective outcome measures
Unclear risk Few details of outcome assessors given
Incomplete outcome data (attrition bias)
All outcomes
High risk Analysis per protocol
Selective reporting (reporting bias) Unclear risk No a priori documentation found to judge
this item
Other bias Low risk Little evidence of contamination of control
group
Barnes 2012
Methods Randomised trial
Participants 1632 participants (858 intervention, 774 control)
Mean age: 81 years
Male:female proportion: 33.3% male
Inclusion criteria: patients ≥ 70 years of age admitted to general medical service
Exclusion criteria: admitted to intensive care units/other speciality units, electively;
length of stay < 2 days
Interventions Intervention team members: attending geriatrician, trained nursing, social workers,
physiotherapists
Intervention team organisation: comprehensive assessment, at least weekly MDT meet-
ings, assessment tools, protocols, ward environment, outpatient follow-up
Control: general inpatient unit, where younger and older patients resided together
Outcomes Alive and in own home
Death
Re-admission
Activities of daily living
35Comprehensive geriatric assessment for older adults admitted to hospital (Review)
Copyright © 2017 The Cochrane Collaboration. Published by John Wiley & Sons, Ltd.

Barnes 2012 (Continued)
Length of stay
Resource use
Trial conclusions: resulted in reduced length of stay and in cost savings
Notes
Risk of bias
Bias Authors’ judgement Support for judgement
Random sequence generation (selection
bias)
Low risk Computer-generated random numbers
Allocation concealment (selection bias) Low risk Sequentially numbered opaque sealed envelopes
Blinding of participants and personnel
(performance bias)
High risk Blinding of participants not possible, blinding of services not
possible
Blinding of outcome assessment (detection
bias) for objective outcome measures
Low risk Objective outcome measures (e.g. living at home) unlikely to be
influenced by lack of blinding
Blinding of outcome assessment (detection
bias) for subjective outcome measures
Unclear risk No details of outcome assessors given
Incomplete outcome data (attrition bias)
All outcomes
Low risk No missing data reported
Selective reporting (reporting bias) Unclear risk No protocol available
Other bias Low risk Little evidence of contamination of control group
Boustani 2012
Methods Randomised trial
Participants 424 participants (225 intervention, 199 control)
Mean age: 77 years
Male:female proportion: 32.2% male
Inclusion criteria: > 65 years of age; screening for cognitive impairment; hospitalised;
English speaking
Exclusion criteria: no cognitive impairment; non-English speaking; aphasic; non-re-
sponsive
Interventions Intervention team members: attending geriatrician, trained nurses, social workers, phys-
iotherapists, occupational therapists, pharmacists
Intervention team organisation: comprehensive assessment, assessment tools and pro-
tocols
Control: patients admitted under physician care
36Comprehensive geriatric assessment for older adults admitted to hospital (Review)
Copyright © 2017 The Cochrane Collaboration. Published by John Wiley & Sons, Ltd.

Boustani 2012 (Continued)
Outcomes Alive and in own home
Death
Re-admission
Length of stay
Trial conclusions: no change in physician behaviour or in process of care
Notes
Risk of bias
Bias Authors’ judgement Support for judgement
Random sequence generation (selection
bias)
Unclear risk Insufficient information about the sequence generation process
Allocation concealment (selection bias) Unclear risk Method of concealment not described
Blinding of participants and personnel
(performance bias)
High risk Blinding of participants not possible, blinding of services not
possible
Blinding of outcome assessment (detection
bias) for objective outcome measures
Low risk Objective measures (e.g. living at home) unlikely to be influ-
enced by lack of blinding
Blinding of outcome assessment (detection
bias) for subjective outcome measures
Unclear risk Few details of outcome assessors given
Incomplete outcome data (attrition bias)
All outcomes
Low risk No missing data reported
Selective reporting (reporting bias) Unclear risk No protocol available
Other bias High risk Evidence of contamination of control group, 49% of which re-
ceived CGA
37Comprehensive geriatric assessment for older adults admitted to hospital (Review)
Copyright © 2017 The Cochrane Collaboration. Published by John Wiley & Sons, Ltd.
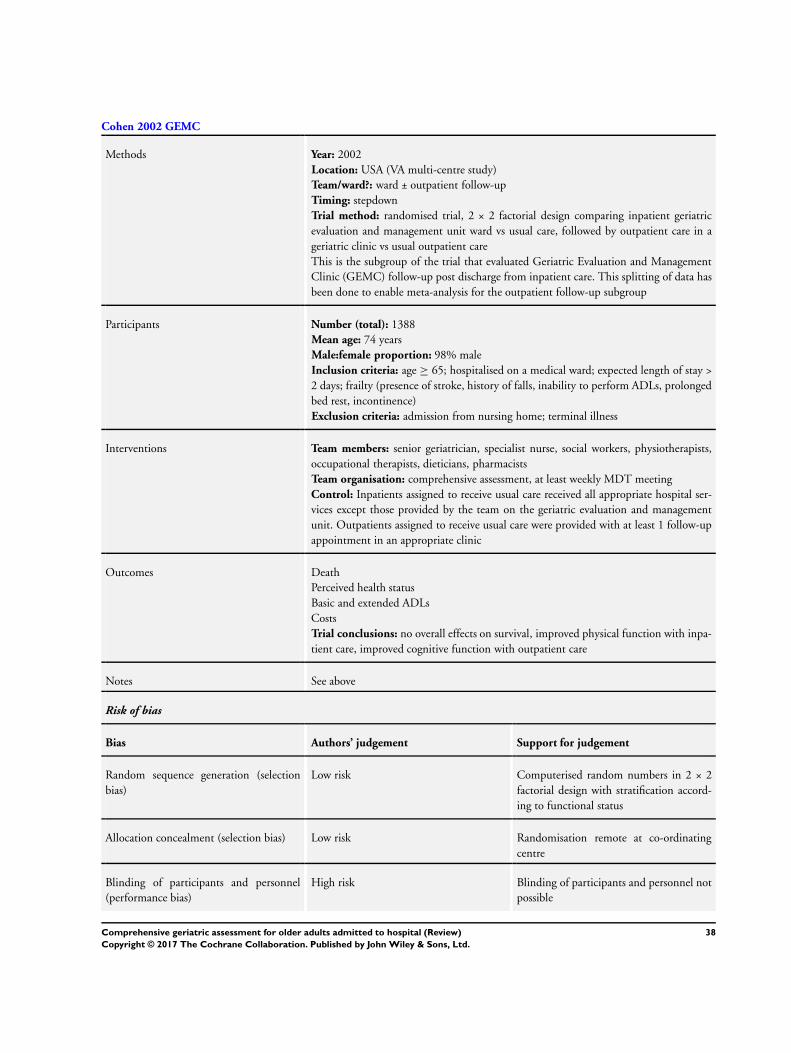
Cohen 2002 GEMC
Methods Year: 2002
Location: USA (VA multi-centre study)
Team/ward?: ward ± outpatient follow-up
Timing: stepdown
Trial method: randomised trial, 2 × 2 factorial design comparing inpatient geriatric
evaluation and management unit ward vs usual care, followed by outpatient care in a
geriatric clinic vs usual outpatient care
This is the subgroup of the trial that evaluated Geriatric Evaluation and Management
Clinic (GEMC) follow-up post discharge from inpatient care. This splitting of data has
been done to enable meta-analysis for the outpatient follow-up subgroup
Participants Number (total): 1388
Mean age: 74 years
Male:female proportion: 98% male
Inclusion criteria: age ≥ 65; hospitalised on a medical ward; expected length of stay >
2 days; frailty (presence of stroke, history of falls, inability to perform ADLs, prolonged
bed rest, incontinence)
Exclusion criteria: admission from nursing home; terminal illness
Interventions Team members: senior geriatrician, specialist nurse, social workers, physiotherapists,
occupational therapists, dieticians, pharmacists
Team organisation: comprehensive assessment, at least weekly MDT meeting
Control: Inpatients assigned to receive usual care received all appropriate hospital ser-
vices except those provided by the team on the geriatric evaluation and management
unit. Outpatients assigned to receive usual care were provided with at least 1 follow-up
appointment in an appropriate clinic
Outcomes Death
Perceived health status
Basic and extended ADLs
Costs
Trial conclusions: no overall effects on survival, improved physical function with inpa-
tient care, improved cognitive function with outpatient care
Notes See above
Risk of bias
Bias Authors’ judgement Support for judgement
Random sequence generation (selection
bias)
Low risk Computerised random numbers in 2 × 2
factorial design with stratification accord-
ing to functional status
Allocation concealment (selection bias) Low risk Randomisation remote at co-ordinating
centre
Blinding of participants and personnel
(performance bias)
High risk Blinding of participants and personnel not
possible
38Comprehensive geriatric assessment for older adults admitted to hospital (Review)
Copyright © 2017 The Cochrane Collaboration. Published by John Wiley & Sons, Ltd.
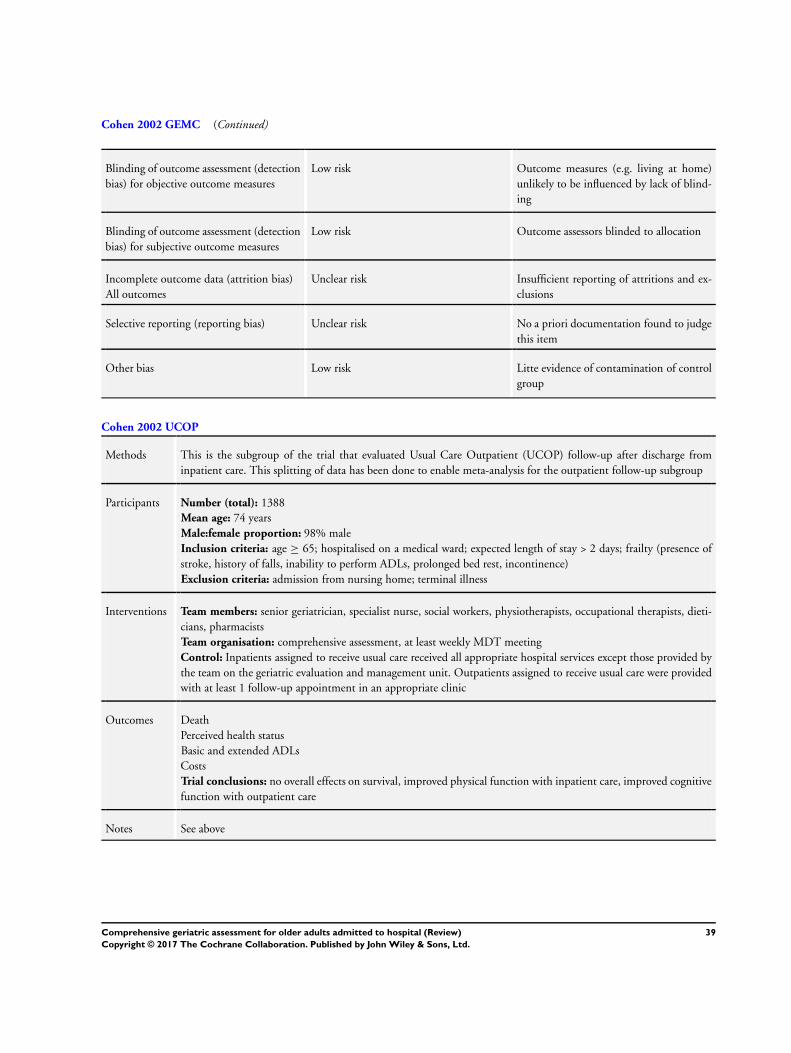
Cohen 2002 GEMC (Continued)
Blinding of outcome assessment (detection
bias) for objective outcome measures
Low risk Outcome measures (e.g. living at home)
unlikely to be influenced by lack of blind-
ing
Blinding of outcome assessment (detection
bias) for subjective outcome measures
Low risk Outcome assessors blinded to allocation
Incomplete outcome data (attrition bias)
All outcomes
Unclear risk Insufficient reporting of attritions and ex-
clusions
Selective reporting (reporting bias) Unclear risk No a priori documentation found to judge
this item
Other bias Low risk Litte evidence of contamination of control
group
Cohen 2002 UCOP
Methods This is the subgroup of the trial that evaluated Usual Care Outpatient (UCOP) follow-up after discharge from
inpatient care. This splitting of data has been done to enable meta-analysis for the outpatient follow-up subgroup
Participants Number (total): 1388
Mean age: 74 years
Male:female proportion: 98% male
Inclusion criteria: age ≥ 65; hospitalised on a medical ward; expected length of stay > 2 days; frailty (presence of
stroke, history of falls, inability to perform ADLs, prolonged bed rest, incontinence)
Exclusion criteria: admission from nursing home; terminal illness
Interventions Team members: senior geriatrician, specialist nurse, social workers, physiotherapists, occupational therapists, dieti-
cians, pharmacists
Team organisation: comprehensive assessment, at least weekly MDT meeting
Control: Inpatients assigned to receive usual care received all appropriate hospital services except those provided by
the team on the geriatric evaluation and management unit. Outpatients assigned to receive usual care were provided
with at least 1 follow-up appointment in an appropriate clinic
Outcomes Death
Perceived health status
Basic and extended ADLs
Costs
Trial conclusions: no overall effects on survival, improved physical function with inpatient care, improved cognitive
function with outpatient care
Notes See above
39Comprehensive geriatric assessment for older adults admitted to hospital (Review)
Copyright © 2017 The Cochrane Collaboration. Published by John Wiley & Sons, Ltd.

Collard 1985
Methods Year: 1987
Location: Boston, Massachusetts, USA (2 community hospitals)
Team/ward?: ward
Timing: direct
Trial method: randomised trial (1:2 allocation, treatment:control)
Participants Number (total): 695
Mean age: 78 years
Male:female proportion: 40% male (approx.)
Inclusion criteria: > 65 years of age; under the care of a participating physician; medical
or surgical admissions
Exclusion criteria: none given
Interventions Team members: ward nurses, social workers, senior physician, physiotherapist, occupa-
tional therapist
Team organisation: at least weekly multi-disciplinary meetings, specialised ward envi-
ronment, comprehensive assessment, protocolised care, standardised assessment tools
Control: care on one of the traditional medical/surgical units
Outcomes Death
Length of stay
Complications
Institutionalisation
Dependence
Self-rated health
Trial conclusions: no conclusions drawn
Notes
Risk of bias
Bias Authors’ judgement Support for judgement
Random sequence generation (selection
bias)
Unclear risk Insufficient information about the se-
quence generation process
Allocation concealment (selection bias) Unclear risk Method of allocation concealment not de-
scribed
Blinding of participants and personnel
(performance bias)
High risk Blinding of participants and personnel not
possible
Blinding of outcome assessment (detection
bias) for objective outcome measures
Low risk Objective measures (e.g. living at home)
unlikely to be influenced by lack of blind-
ing
Blinding of outcome assessment (detection
bias) for subjective outcome measures
Unclear risk Few details of outcome assessors given
40Comprehensive geriatric assessment for older adults admitted to hospital (Review)
Copyright © 2017 The Cochrane Collaboration. Published by John Wiley & Sons, Ltd.

Collard 1985 (Continued)
Incomplete outcome data (attrition bias)
All outcomes
High risk Significant differences in outcome rates for
some outcomes. Mortality recorded at the
end of follow-up, along with institutional-
isation. For other outcomes such as depen-
dence, data incomplete with high dropout
rates
Selective reporting (reporting bias) Unclear risk No a priori documentation found to judge
this item
Other bias Low risk Little evidence of contamination of control
group
Counsell 2000
Methods Year: 2000
Location: Akron City, Ohio, USA (Community Teaching Hospital)
Team/ward?: ward
Timing: direct (ACE)
Trial method: randomised trial
Participants Number (total): 1531
Mean age: 80 years
Male:female proportion: 40% male (approximately)
Inclusion criteria: community-dwelling persons ≥ 70 years of age admitted to medical
or family practice service
Exclusion criteria: transferred from other hospital or nursing home; required speciality
unit admission; elective admissions; LOS < 2 days
Interventions Team members: senior geriatrician, specialist nurse, ward nurses, social workers, phys-
iotherapists
Team organisation: comprehensive assessment, at least weekly multi-disciplinary meet-
ings, standardised assessment tools, specialised ward environment, protocolised care
Control: usual care units with attending resident physician
Outcomes Death
Activities of daily living
Institutionalisation
Dependence
Trial conclusions: improved combined outcomes of functional decline or nursing home
admission in intervention group
Notes
Risk of bias
Bias Authors’ judgement Support for judgement
41Comprehensive geriatric assessment for older adults admitted to hospital (Review)
Copyright © 2017 The Cochrane Collaboration. Published by John Wiley & Sons, Ltd.

Counsell 2000 (Continued)
Random sequence generation (selection
bias)
Low risk Computer-generated random number se-
quence
Allocation concealment (selection bias) Low risk Sequentially numbered opaque envelopes
Blinding of participants and personnel
(performance bias)
High risk Blinding of participants and personnel not
possible
Blinding of outcome assessment (detection
bias) for objective outcome measures
Low risk Outcome measures (e.g. living at home)
unlikely to be influenced by lack of blind-
ing
Blinding of outcome assessment (detection
bias) for subjective outcome measures
Unclear risk Insufficient information to permit judge-
ment
Incomplete outcome data (attrition bias)
All outcomes
Unclear risk Insufficient reporting of attritions/exclu-
sions
Selective reporting (reporting bias) Unclear risk No a priori documentation found to judge
this item
Other bias Low risk Little evidence of contamination of control
group
Edmans 2013
Methods Randomised trial
Participants 433 participants (216 intervention, 217 control)
Mean age: 83 years
Male:female proportion: 37% male
Inclusion criteria: patient discharged from an acute medical unit within 72 hours of
attending hospital; ≥ 70 years of age; identified as at heightened risk for future health
problems (score ≥ 2/6 on the identification of seniors at risk tool)
Exclusion criteria: not a resident in the hospital catchment area; lacking mental capacity
to give informed consent and without a consultee any exceptional reason cited by acute
medical unit staff why patients should not be recruited; participation in other related
studies
Interventions Intervention team members: attending geriatrician
Intervention team organisation: comprehensive assessment, outpatient follow-up
Control: usual care on the medical unit before recruitment; assessment and treatment by
a consultant physician and attending medical team; some patients referred to multi-dis-
ciplinary team (physiotherapist, occupational therapist, and nurse); general practitioner
responsible for all participant aftercare
42Comprehensive geriatric assessment for older adults admitted to hospital (Review)
Copyright © 2017 The Cochrane Collaboration. Published by John Wiley & Sons, Ltd.

Edmans 2013 (Continued)
Outcomes Alive and in own home
Death
Institutionalisation
Dependence
Re-admission
Activities of daily living
Resource use
Death or dependence
Trial conclusions: no effects on participant outcomes or service use
Notes
Risk of bias
Bias Authors’ judgement Support for judgement
Random sequence generation (selection
bias)
Low risk Randomisation sequence via randomly permuted blocks of ran-
domly varying sizes
Allocation concealment (selection bias) Low risk Central allocation web-based (Nottingham Clinical Trials Sup-
port Unit)
Blinding of participants and personnel
(performance bias)
High risk Blinding of participants not possible; blinding of service not
possible
Blinding of outcome assessment (detection
bias) for objective outcome measures
Low risk Objective outcome measures (e.g. mortality, living at home) un-
likely to be influenced by lack of blinding
Blinding of outcome assessment (detection
bias) for subjective outcome measures
Unclear risk Few details of outcome assessors given
Incomplete outcome data (attrition bias)
All outcomes
Unclear risk Withdrawal of 16 participants (5 in the control group and 11 in
the intervention group), but reasons for withdrawal not given
Selective reporting (reporting bias) Low risk Nearly all prespecified outcomes (including primary outcome)
stated in the protocol included in the review
Other bias Low risk Little evidence of contamination of control group
43Comprehensive geriatric assessment for older adults admitted to hospital (Review)
Copyright © 2017 The Cochrane Collaboration. Published by John Wiley & Sons, Ltd.
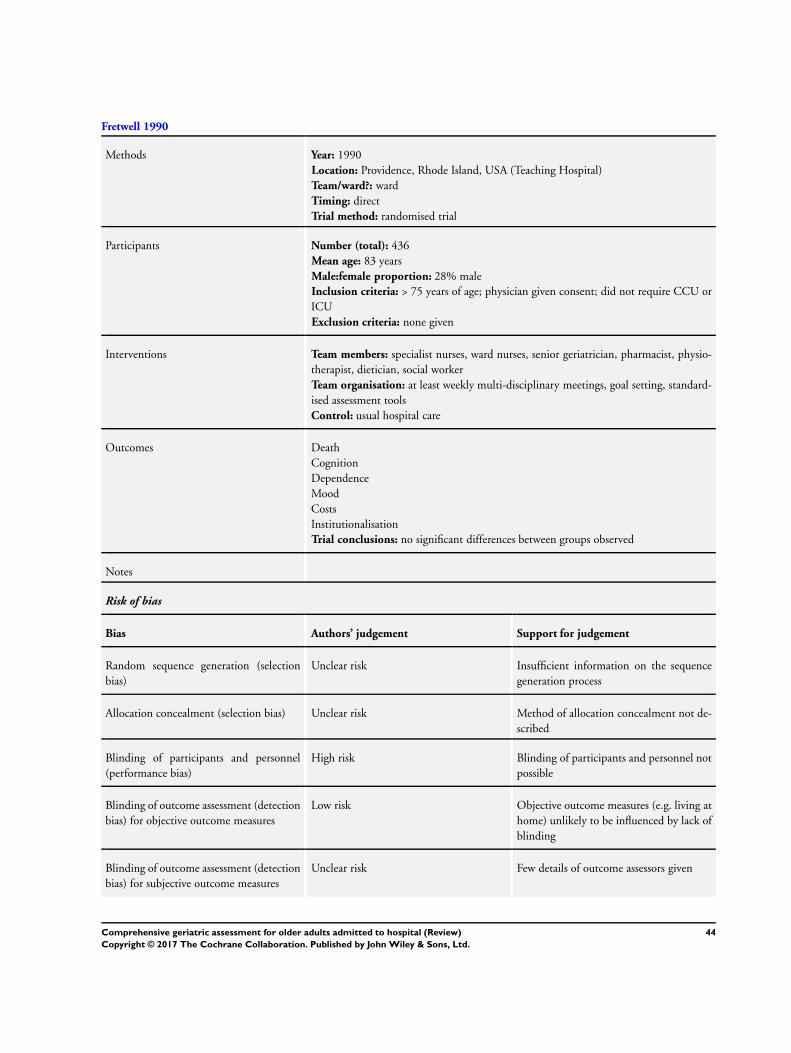
Fretwell 1990
Methods Year: 1990
Location: Providence, Rhode Island, USA (Teaching Hospital)
Team/ward?: ward
Timing: direct
Trial method: randomised trial
Participants Number (total): 436
Mean age: 83 years
Male:female proportion: 28% male
Inclusion criteria: > 75 years of age; physician given consent; did not require CCU or
ICU
Exclusion criteria: none given
Interventions Team members: specialist nurses, ward nurses, senior geriatrician, pharmacist, physio-
therapist, dietician, social worker
Team organisation: at least weekly multi-disciplinary meetings, goal setting, standard-
ised assessment tools
Control: usual hospital care
Outcomes Death
Cognition
Dependence
Mood
Costs
Institutionalisation
Trial conclusions: no significant differences between groups observed
Notes
Risk of bias
Bias Authors’ judgement Support for judgement
Random sequence generation (selection
bias)
Unclear risk Insufficient information on the sequence
generation process
Allocation concealment (selection bias) Unclear risk Method of allocation concealment not de-
scribed
Blinding of participants and personnel
(performance bias)
High risk Blinding of participants and personnel not
possible
Blinding of outcome assessment (detection
bias) for objective outcome measures
Low risk Objective outcome measures (e.g. living at
home) unlikely to be influenced by lack of
blinding
Blinding of outcome assessment (detection
bias) for subjective outcome measures
Unclear risk Few details of outcome assessors given
44Comprehensive geriatric assessment for older adults admitted to hospital (Review)
Copyright © 2017 The Cochrane Collaboration. Published by John Wiley & Sons, Ltd.

Fretwell 1990 (Continued)
Incomplete outcome data (attrition bias)
All outcomes
Low risk Attrition rates after entry clearly described
and balanced and apparently negligible
Selective reporting (reporting bias) Unclear risk No a priori documentation found to judge
this item
Other bias Low risk Little evidence of contamination of control
group
Goldberg 2013
Methods Randomised trial
Participants 600 participants (310 intervention, 290 control)
Mean age: 85 years
Male:female proportion: 48% male
Inclusion criteria: emergency medical admissions; > 65 years of age; identified by physi-
cians as “confused”
Exclusion criteria: patients with clinical need for another specialist service (such as
critical care, surgery, or stroke unit)
Interventions Intervention team members: attending geriatrician, trained nurses, physiotherapists,
occupational therapists, speech and language therapists
Intervention team organisation: comprehensive assessment, assessment tools, ward
environment
Control: 5 acute geriatric medical wards and 6 general medical wards; practice on geriatric
medical wards based on comprehensive geriatric assessment; general experience of staff
members in management of delirium and dementia; mental health support provided on
request from visiting psychiatrists on a consultation basis
Outcomes Alive and in own home
Death
Re-admission
Activities of daily living
Cognitive status
Length of stay
Trial conclusions: improved experience and satisfaction, health outcomes or resource
use not improved
Notes
Risk of bias
Bias Authors’ judgement Support for judgement
Random sequence generation (selection
bias)
Low risk Computer-generated random number sequence with permuted
block design
45Comprehensive geriatric assessment for older adults admitted to hospital (Review)
Copyright © 2017 The Cochrane Collaboration. Published by John Wiley & Sons, Ltd.

Goldberg 2013 (Continued)
Allocation concealment (selection bias) Low risk Randomisation concealed from clinical staff who allocated par-
ticipants
Blinding of participants and personnel
(performance bias)
High risk Research staff who collected baseline data not blinded to alloca-
tion
Blinding of outcome assessment (detection
bias) for objective outcome measures
Low risk Outcome assessors blinded to allocation
Blinding of outcome assessment (detection
bias) for subjective outcome measures
Low risk Outcome assessors blinded to allocation
Incomplete outcome data (attrition bias)
All outcomes
Low risk Missing outcome data balanced across the 2 groups, and missing
health status outcome data imputed
Selective reporting (reporting bias) Low risk Published study protocol available, and prespecified outcomes
(primary and secondary) reported in the study
Other bias High risk Patients recruited after randomisation led to imbalances at base-
line of 11 wards in standard care and 5 in acute geriatric medical
wards, hence potential contamination of control group
Harris 1991
Methods Year: 1991
Location: Adelaide, Australia
Team/ward?: ward
Timing: direct from emergency department
Trial method: randomised trial
Participants Number (total): 267
Mean age: 78 years
Male:female proportion: 40% male (approx)
Inclusion criteria: > 70 years of age; non-elective; not re-admitted; non-nursing home
dwellers; resident of Southern Health Region
Exclusion criteria: none given
Interventions Team members: senior geriatrician, social workers, occupational therapists, physiother-
apists, ward nurses
Team organisation: not specified
Control: 2 general medical units
Outcomes Death
Institutionalisation
Dependency
Cognitive status
Length of stay
46Comprehensive geriatric assessment for older adults admitted to hospital (Review)
Copyright © 2017 The Cochrane Collaboration. Published by John Wiley & Sons, Ltd.

Harris 1991 (Continued)
Trial conclusions: no evidence of benefit from admission to a geriatric assessment unit
for unselected adults > 70 years of age
Notes
Risk of bias
Bias Authors’ judgement Support for judgement
Random sequence generation (selection
bias)
Unclear risk Insufficient information about the se-
quence generation process
Allocation concealment (selection bias) High risk Cards selected in sequence; open with error
rates recorded
Blinding of participants and personnel
(performance bias)
High risk Blinding of participants and personnel not
possible
Blinding of outcome assessment (detection
bias) for objective outcome measures
Low risk Objective measures (e.g. living at home)
unlikely to be influenced by lack of blind-
ing
Blinding of outcome assessment (detection
bias) for subjective outcome measures
Unclear risk Few details of outcome assessors given
Incomplete outcome data (attrition bias)
All outcomes
Unclear risk Insufficient reporting of attritions/exclu-
sions
Selective reporting (reporting bias) Unclear risk No a priori documentation found to judge
this item. Data presented in some cases in
graphical form only
Other bias Low risk Little evidence of contamination of control
group
Hogan 1987
Methods Year: 1987
Location: Halifax, Canada (Community Hospital)
Team/ward?: team
Timing: stepdown
Trial method: randomised trial
Participants Number (total): 113
Mean age: 82 years
Male:female proportion: 30% male (approx)
Inclusion criteria: all patients > 75 years of age admitted to Department of Medicine on
an emergency basis with confusional state; impaired mobility; falls; urinary incontinence;
47Comprehensive geriatric assessment for older adults admitted to hospital (Review)
Copyright © 2017 The Cochrane Collaboration. Published by John Wiley & Sons, Ltd.

Hogan 1987 (Continued)
polypharmacy; living in a nursing home; admission within previous 3 months
Exclusion criteria: ICU; stroke; permission refused by patient or attending physician
Interventions Team members: senior geriatrician, specialist nurse, physiotherapists
Team organisation: comprehensive assessment, at least weekly MDT
Control: usual care
Outcomes Death
Institutionalisation
Cognitive status
Re-admission
Length of stay
Costs
Trial conclusions: improved cognitive status, reduced polypharmacy, reduced short-
term mortality demonstrated
Notes
Risk of bias
Bias Authors’ judgement Support for judgement
Random sequence generation (selection
bias)
Low risk Random number generation
Allocation concealment (selection bias) Unclear risk Insufficient information on allocation con-
cealment process
Blinding of participants and personnel
(performance bias)
High risk Blinding of participants and personnel not
possible
Blinding of outcome assessment (detection
bias) for objective outcome measures
Low risk Outcome measures (e.g. living at home)
unlikely to be influenced by lack of blind-
ing
Blinding of outcome assessment (detection
bias) for subjective outcome measures
Unclear risk Few details of outcome assessors given
Incomplete outcome data (attrition bias)
All outcomes
Unclear risk Insufficient reporting of attritions/exclu-
sions
Selective reporting (reporting bias) Unclear risk No a priori documentation found to judge
this item
Other bias Low risk Little evidence of contamination of control
group
48Comprehensive geriatric assessment for older adults admitted to hospital (Review)
Copyright © 2017 The Cochrane Collaboration. Published by John Wiley & Sons, Ltd.

Kay 1992
Methods Year: 1992
Location: Toronto, Canada (Community Hospital)
Team/ward?: ward
Timing: stepdown
Trial method: randomised trial (participants ’randomly assigned’)
Participants Number (total): 59
Mean age: 81 years
Male:female proportion: 45% male
Inclusion criteria: > 70 years of age; medically stable; possible acute confusion; func-
tional impairment; multiple geriatric problems
Exclusion criteria: medically unstable; chronic cognitive impairment; independent
Interventions Team members: specialist nurses, social workers, occupational therapists, physiothera-
pists, pharmacists, dietician
Team organisation: comprehensive assessment, at least weekly MDT, standardised as-
sessment tools
Control: traditional acute care
Outcomes Institutionalisation
Activities of daily living
Cognitive function
Trial conclusions: inadequate evidence of benefit from a geriatric assessment unit
Notes
Risk of bias
Bias Authors’ judgement Support for judgement
Random sequence generation (selection
bias)
Unclear risk Insufficient information about the se-
quence generation process
Allocation concealment (selection bias) Unclear risk Allocation concealment not described
Blinding of participants and personnel
(performance bias)
High risk Blinding of participants and personnel not
possible
Blinding of outcome assessment (detection
bias) for objective outcome measures
Low risk Objective measures (e.g. living at home)
unlikely to be influenced by lack of blind-
ing
Blinding of outcome assessment (detection
bias) for subjective outcome measures
Unclear risk Few details of outcome assessors given
Incomplete outcome data (attrition bias)
All outcomes
Unclear risk Insufficient reporting of attritions/exclu-
sions
49Comprehensive geriatric assessment for older adults admitted to hospital (Review)
Copyright © 2017 The Cochrane Collaboration. Published by John Wiley & Sons, Ltd.

Kay 1992 (Continued)
Selective reporting (reporting bias) Unclear risk No a priori documentation found to judge
this item
Other bias Low risk Little evidence of contamination of control
group
Kircher 2007
Methods Year: 2007
Location: Tubingen, Germany
Team/ward?: team
Timing: stepdown
Trial method: multi-centre randomised trial with separate control group for external
comparison
Participants Number (total): 435
Mean age: 78 years
Male:female proportion: 33% male (approx)
Inclusion criteria: > 65 years of age with evidence of functional impairment; potential
breakdown of the home situation
Exclusion criteria: nursing home patients; independent patients with no functional
impairment; terminal condition; severe dementia; not able to speak German; living >
60 miles from the hospital
Interventions Team members: senior geriatrician, social worker, specialist nurse plus other associated
healthcare professionals as required
Team organisation: comprehensive assessment and treatment recommendations, at least
weekly multi-disciplinary meetings, discharge planning, follow-up telephone calls
Control: appropriate hospital services except those provided by the consultation team
Outcomes Death
Institutionalisation
Activities of daily living
Cognition
Mood
Number of drugs
Trial conclusions: Care provided by CGA teams did not improve rehospitalisation or
nursing home admission
Notes
Risk of bias
Bias Authors’ judgement Support for judgement
Random sequence generation (selection
bias)
Low risk Computer random number generator in
feedback from trialist
50Comprehensive geriatric assessment for older adults admitted to hospital (Review)
Copyright © 2017 The Cochrane Collaboration. Published by John Wiley & Sons, Ltd.

Kircher 2007 (Continued)
Allocation concealment (selection bias) Unclear risk Insufficient detail about allocation conceal-
ment process
Blinding of participants and personnel
(performance bias)
High risk Blinding of participants and personnel not
possible
Blinding of outcome assessment (detection
bias) for objective outcome measures
Low risk Outcome measures (e.g. living at home)
unlikely to be influenced by lack of blind-
ing
Blinding of outcome assessment (detection
bias) for subjective outcome measures
Low risk Outcome assessors blinded to allocation
Incomplete outcome data (attrition bias)
All outcomes
Low risk Missing outcome data balanced (e.g. living
at home) across intervention groups
Selective reporting (reporting bias) Low risk Primary outcomes reported in prior docu-
mentation (grant application sent by trial-
ist)
Other bias High risk Evidence of contamination of control
group
Landefeld 1995
Methods Year: 1995
Location: Cleveland, Ohio, USA (Teaching Hospital)
Team/ward?: ward (ACE)
Timing: direct
Trial method: randomised trial
Participants Number (total): 651
Mean age: 80 years
Male:female proportion: 35% male (approx)
Inclusion criteria: patients ≥ 70 years of age admitted for general medical care
Exclusion criteria: patients admitted to a speciality unit - ICU, cardiology, telemetry,
oncology
Interventions Team members: attending geriatrician, trainee geriatrician, ward nurses, social workers,
physiotherapists, occupational therapists, dieticians
Team organisation: at least weekly MDT, use of standardised assessment tools, proto-
colised care, specialised ward environment
Control: usual care provided by physicians and nurses in acute care medical units
Outcomes Death
Institutional care
Cognition
Dependence
51Comprehensive geriatric assessment for older adults admitted to hospital (Review)
Copyright © 2017 The Cochrane Collaboration. Published by John Wiley & Sons, Ltd.

Landefeld 1995 (Continued)
Trial conclusions: fewer patients discharged to a nursing home, improved functional
outcomes at discharge
Notes
Risk of bias
Bias Authors’ judgement Support for judgement
Random sequence generation (selection
bias)
Low risk Computer-generated random numbers
Allocation concealment (selection bias) Low risk Allocation administered by staff member
remote to study
Blinding of participants and personnel
(performance bias)
High risk Blinding of participants and personnel not
possible
Blinding of outcome assessment (detection
bias) for objective outcome measures
Low risk Outcome measures (e.g. living at home)
unlikely to be influenced by lack of blind-
ing
Blinding of outcome assessment (detection
bias) for subjective outcome measures
Unclear risk Few details of outcome assessors given
Incomplete outcome data (attrition bias)
All outcomes
Low risk Multiple data sources used to collect miss-
ing data
Analysis by intention-to-treat; attrition bal-
anced and small overall
Selective reporting (reporting bias) Unclear risk No a priori documentation found to judge
this item
Other bias Low risk Little evidence of contamination of control
group
Li 2015
Methods Randomised trial
Participants 100 participants (50 intervention, 50 control)
Mean age: uncertain
Male:female proportion: uncertain
Inclusion criteria: patients ≥ 65 years of age with multiple geriatric conditions admitted
to hospital
Exclusion criteria: uncertain
52Comprehensive geriatric assessment for older adults admitted to hospital (Review)
Copyright © 2017 The Cochrane Collaboration. Published by John Wiley & Sons, Ltd.

Li 2015 (Continued)
Interventions Intervention team members: unknown
Intervention organisation: CGA intervention, consultation intervention, conventional
therapy
Control: conventional therapy
Outcomes Activities of daily living
Cognitive status
Trial conclusions: improvements in function and quality of life
Notes Only abstract available
Risk of bias
Bias Authors’ judgement Support for judgement
Random sequence generation (selection
bias)
Unclear risk Insufficient information as only abstract available
Allocation concealment (selection bias) Unclear risk Insufficient information as only abstract available
Blinding of participants and personnel
(performance bias)
Unclear risk Insufficient information as only abstract available
Blinding of outcome assessment (detection
bias) for objective outcome measures
Unclear risk Insufficient information as only abstract available
Blinding of outcome assessment (detection
bias) for subjective outcome measures
Unclear risk Insufficient information as only abstract available
Incomplete outcome data (attrition bias)
All outcomes
Unclear risk Insufficient information as only abstract available
Selective reporting (reporting bias) Unclear risk Insufficient information as only abstract available
Other bias Unclear risk Insufficient information as only abstract available
McVey 1989
Methods Year: 1989
Location: Durham, North Caroina, USA (VA Centre)
Team/ward?: team
Timing: acute (within 48 hours)
Trial method: randomised trial
Participants Number (total): 178
Mean age: 81 years
Male:female proportion: 96% male
53Comprehensive geriatric assessment for older adults admitted to hospital (Review)
Copyright © 2017 The Cochrane Collaboration. Published by John Wiley & Sons, Ltd.

McVey 1989 (Continued)
Inclusion criteria: patients ≥ 75 years of age
Exclusion criteria: admitted to ICU; had previously received geriatric care; expected
length of stay < 48 hours
Interventions Team members: senior geriatrician, trainee geriatrician, specialist nurse, social worker
Team organisation: comprehensive assessment and recommendations made, at least
weekly multi-disciplinary meetings, standardised assessment tools
Control: usual care.
Outcomes Activities of daily living/dependence
Institutionalisation
Death
Trial conclusions: no significant effect on functional decline
Notes
Risk of bias
Bias Authors’ judgement Support for judgement
Random sequence generation (selection
bias)
Low risk Computerised randomisation scheme
Allocation concealment (selection bias) Unclear risk Allocation concealment not described
Blinding of participants and personnel
(performance bias)
High risk Blinding of participants and personnel not
possible
Blinding of outcome assessment (detection
bias) for objective outcome measures
Low risk Objective measures (e.g. living at home)
unlikely to be influenced by lack of blind-
ing
Blinding of outcome assessment (detection
bias) for subjective outcome measures
Low risk Outcome assessors blinded to the alloca-
tion.
Incomplete outcome data (attrition bias)
All outcomes
Unclear risk Insufficient reporting of attritions/exclu-
sions
Selective reporting (reporting bias) Unclear risk No a priori documentation found to judge
this item
Other bias Low risk No clear evidence of contamination of con-
trol group
54Comprehensive geriatric assessment for older adults admitted to hospital (Review)
Copyright © 2017 The Cochrane Collaboration. Published by John Wiley & Sons, Ltd.

Naughton 1994
Methods Year: 1994
Location: Chicago, Illinois, USA (Urban Teaching Hospital)
Team/ward?: team
Timing: direct from emergency department
Trial method: randomised trial
Participants Number (total): 111
Mean age: 80 years
Male:female proportion: 40% male (approx)
Inclusion criteria: patients 70 years of age admitted from ED to medicine service; did
not regularly receive care from attending internist on staff at study hospital at time of
admission
Exclusion criteria: admission to ITU; transferred to a surgical service
Interventions Team members: senior geriatrician, social worker, specialist nurse, physiotherapist
Team organisation: Geriatrician and social worker make up core GEM team, with nurse
specialist and physiotherapist as required. Carried out systematic evaluation of partici-
pants’ medical, mental, functional, and psychosocial status and needs. Team conference
2 to 3 times weekly
Control: usual care by medical house staff and an attending physician; services of social
workers and discharge planners available on request
Outcomes Death
Institutionalisation
Costs
Length of stay
Trial conclusions: reduced hospital costs
Notes
Risk of bias
Bias Authors’ judgement Support for judgement
Random sequence generation (selection
bias)
Unclear risk Random number sequence with permuted
block design
Allocation concealment (selection bias) Low risk Opaque sealed sequential envelopes
Blinding of participants and personnel
(performance bias)
High risk Blinding of participants and personnel not
possible
Blinding of outcome assessment (detection
bias) for objective outcome measures
Low risk Outcome measures (e.g. living at home)
unlikely to be influenced by lack of blind-
ing
Blinding of outcome assessment (detection
bias) for subjective outcome measures
Low risk Outcome assessor blinded to allocation
55Comprehensive geriatric assessment for older adults admitted to hospital (Review)
Copyright © 2017 The Cochrane Collaboration. Published by John Wiley & Sons, Ltd.
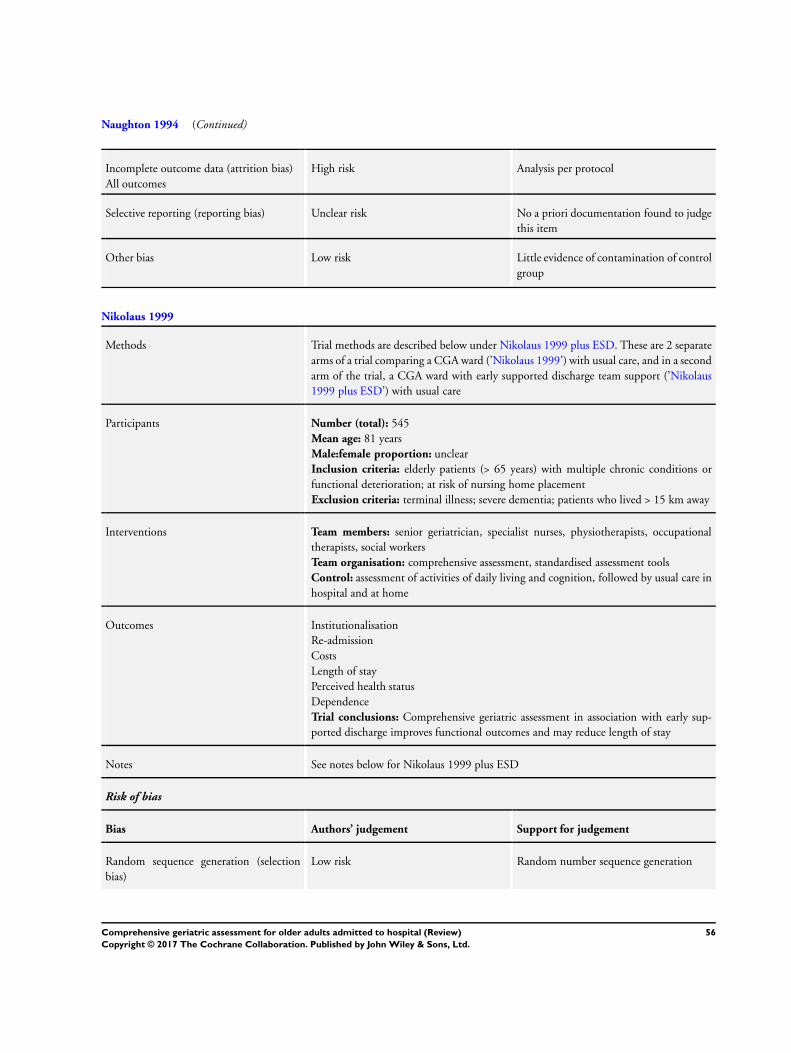
Naughton 1994 (Continued)
Incomplete outcome data (attrition bias)
All outcomes
High risk Analysis per protocol
Selective reporting (reporting bias) Unclear risk No a priori documentation found to judge
this item
Other bias Low risk Little evidence of contamination of control
group
Nikolaus 1999
Methods Trial methods are described below under Nikolaus 1999 plus ESD. These are 2 separate
arms of a trial comparing a CGA ward (’Nikolaus 1999’) with usual care, and in a second
arm of the trial, a CGA ward with early supported discharge team support (’Nikolaus
1999 plus ESD’) with usual care
Participants Number (total): 545
Mean age: 81 years
Male:female proportion: unclear
Inclusion criteria: elderly patients (> 65 years) with multiple chronic conditions or
functional deterioration; at risk of nursing home placement
Exclusion criteria: terminal illness; severe dementia; patients who lived > 15 km away
Interventions Team members: senior geriatrician, specialist nurses, physiotherapists, occupational
therapists, social workers
Team organisation: comprehensive assessment, standardised assessment tools
Control: assessment of activities of daily living and cognition, followed by usual care in
hospital and at home
Outcomes Institutionalisation
Re-admission
Costs
Length of stay
Perceived health status
Dependence
Trial conclusions: Comprehensive geriatric assessment in association with early sup-
ported discharge improves functional outcomes and may reduce length of stay
Notes See notes below for Nikolaus 1999 plus ESD
Risk of bias
Bias Authors’ judgement Support for judgement
Random sequence generation (selection
bias)
Low risk Random number sequence generation
56Comprehensive geriatric assessment for older adults admitted to hospital (Review)
Copyright © 2017 The Cochrane Collaboration. Published by John Wiley & Sons, Ltd.

Nikolaus 1999 (Continued)
Allocation concealment (selection bias) Low risk Sealed opaque envelopes
Blinding of participants and personnel
(performance bias)
High risk Blinding of participants and personnel not
possible
Blinding of outcome assessment (detection
bias) for objective outcome measures
Low risk Outcome measures (e.g. living at home)
unlikely to be influenced by lack of blind-
ing
Blinding of outcome assessment (detection
bias) for subjective outcome measures
Low risk Outcome assessors blinded to allocation
Incomplete outcome data (attrition bias)
All outcomes
Unclear risk Insufficient reporting of attritions/exclu-
sions
Selective reporting (reporting bias) Unclear risk No a priori documentation found to judge
this item
Other bias High risk Possible contamination of control group
Nikolaus 1999 plus ESD
Methods Year: 1999
Location: Heidelberg, Germany (University Hospital)
Team/ward?: ward
Timing: acute (within 48 hours)
Trial method: randomised trial with 2 intervention arms - geriatric assessment and management with early supported
discharge (home intervention team) or geriatric assessment alone versus usual care
Participants Number (total): 545
Mean age: 81 years
Male:female proportion: unclear
Inclusion criteria: elderly patients (> 65 years) with multiple chronic conditions or functional deterioration; at risk
of nursing home placement
Exclusion criteria: terminal illness; severe dementia; patients who lived > 15 km away
Interventions Team members: senior geriatrician, specialist nurses, physiotherapists, occupational therapists, social workers. (Home
intervention team consisted of 3 nurses, a physiotherapist, an occupational therapist, a social worker, and secretarial
support.)
Team organisation: comprehensive assessment, standardised assessment tools, outpatient follow-up (HIT team)
Control: assessment of activities of daily living and cognition, followed by usual care in hospital and at home
Outcomes Institutionalisation
Re-admission
Costs
Length of stay
Perceived health status
Dependence
57Comprehensive geriatric assessment for older adults admitted to hospital (Review)
Copyright © 2017 The Cochrane Collaboration. Published by John Wiley & Sons, Ltd.

Nikolaus 1999 plus ESD (Continued)
Trial conclusions: Comprehensive geriatric assessment in association with early supported discharge improves func-
tional outcomes and may reduce length of stay
Notes For analysis, this study was divided into the 2 interventions: CGA ward plus early supported discharge (ESD) and
CGA ward with no ESD
Powell 1990
Methods Year: 1990
Location: Manitoba, Canada
Team/ward?: ward
Timing: direct
Trial method: randomised trial
Participants Number (total): 203
Mean age: uncertain
Male:female proportion: uncertain
Inclusion criteria: acute medical admissions over 74 years
Exclusion criteria: requiring psychiatric or surgical care
Interventions Team members: unknown
Team organisation: unknown
Control: internal general medicine wards
Outcomes Death
Institutionalisation
Cognitive function
Depression
Dependence
Trial conclusions: non-significant differences in favour of the treatment group
Notes Only abstract available
Risk of bias
Bias Authors’ judgement Support for judgement
Random sequence generation (selection
bias)
Unclear risk Insufficient information as only abstract
available
Allocation concealment (selection bias) Unclear risk Insufficient information as only abstract
available
Blinding of participants and personnel
(performance bias)
Unclear risk Insufficient information as only abstract
available
Blinding of outcome assessment (detection
bias) for objective outcome measures
Unclear risk Insufficient information as only abstract
available
58Comprehensive geriatric assessment for older adults admitted to hospital (Review)
Copyright © 2017 The Cochrane Collaboration. Published by John Wiley & Sons, Ltd.

Powell 1990 (Continued)
Blinding of outcome assessment (detection
bias) for subjective outcome measures
Unclear risk Insufficient information as only abstract
available
Incomplete outcome data (attrition bias)
All outcomes
Unclear risk Insufficient information as only abstract
available
Selective reporting (reporting bias) Unclear risk Insufficient information as only abstract
available
Other bias Unclear risk Insufficient information as only abstract
available
Reuben 1995
Methods Year: 1995
Location: Los Angeles, California, USA (multi-centre HMO)
Team/ward?: team
Timing: stepdown
Trial method: multi-centre randomised trial
Participants Number (total): 2353
Mean age: 78 years
Male:female proportion: 53% male (approx)
Inclusion criteria: > 65 years of age with 1 of 13 criteria: stroke, immobility, impairment
ADL, malnutrition, incontinence, confusion or dementia, prolonged bed rest, falls,
depression, social or family problems, unplanned re-admission, new fracture, > 80 years
of age
Exclusion criteria: admitted for terminal care; lived outside HMO area; did not speak
English; were admitted from a nursing home
Interventions Team members: senior geriatrician, nurse specialist, social workers, physiotherapists
Team organisation: comprehensive assessment, at least weekly MDT, standardised as-
sessment tools, outpatient follow-up
Control: usual care
Outcomes Death
Institutionalisation
Dependency
Cognitive status
Perceived health status
Trial conclusions: no significant differences identified in mortality, functional status,
or perceived health
Notes
Risk of bias
Bias Authors’ judgement Support for judgement
59Comprehensive geriatric assessment for older adults admitted to hospital (Review)
Copyright © 2017 The Cochrane Collaboration. Published by John Wiley & Sons, Ltd.

Reuben 1995 (Continued)
Random sequence generation (selection
bias)
Low risk Random number tables in blocks of 4
Allocation concealment (selection bias) Unclear risk Allocation concealment not described in
sufficient detail
Blinding of participants and personnel
(performance bias)
High risk Blinding of participants and personnel not
possible
Blinding of outcome assessment (detection
bias) for objective outcome measures
Low risk Outcome measures (e.g. for living at home)
unlikely to be influenced by lack of blind-
ing
Blinding of outcome assessment (detection
bias) for subjective outcome measures
Unclear risk Few details of outcome assessors given.
Incomplete outcome data (attrition bias)
All outcomes
Unclear risk Insufficient reporting of attritions/exclu-
sions
Selective reporting (reporting bias) Low risk Prior documented description of trial de-
sign and rationale differs little from the trial
Other bias High risk Possible contamination of control group
Rubenstein 1984
Methods Year: 1984
Location: Los Angeles, California, USA (VA hospital)
Team/ward?: ward
Timing: stepdown
Trial method: randomised trial
Participants Number (total): 123
Mean age: 78 years
Male:female proportion: 96% male
Inclusion criteria: patients > 65 years of age still in hospital 1 week after admission with
persistent medical, functional, or psychosocial problem
Exclusion criteria: severe dementia or disabling disease resistant to further medical man-
agement; no social supports; functioning well and would definitely return to community
Interventions Team members: senior geriatrician, trainee geriatrician, specialist nurses, ward nurses,
social workers, physiotherapists, occupational therapists, dietician, audiologists, dentists,
psychologists
Team organisation: at least weekly MDT meetings, standardised assessment tools, out-
patient follow-up
Control: acute care services including 3 acute care mixed medical wards
60Comprehensive geriatric assessment for older adults admitted to hospital (Review)
Copyright © 2017 The Cochrane Collaboration. Published by John Wiley & Sons, Ltd.

Rubenstein 1984 (Continued)
Outcomes Death
Institutionalisation
Costs
Cognitive status
Morale
Trial conclusions: reduced mortality, reduced institutionalisation, improved functional
status and morale
Notes
Risk of bias
Bias Authors’ judgement Support for judgement
Random sequence generation (selection
bias)
Unclear risk Insufficient information on random se-
quence generation
Allocation concealment (selection bias) Unclear risk Insufficient information on allocation con-
cealment
Blinding of participants and personnel
(performance bias)
High risk Blinding of personnel and participants not
possible.
Blinding of outcome assessment (detection
bias) for objective outcome measures
Low risk Outcome measures (e.g. for living at home)
unlikely to be influenced by lack of blind-
ing
Blinding of outcome assessment (detection
bias) for subjective outcome measures
Unclear risk Few details of outcome assessors given
Incomplete outcome data (attrition bias)
All outcomes
Unclear risk Insufficient reporting of attritions/exclu-
sions
Selective reporting (reporting bias) Unclear risk No a priori documentation found to judge
this item
Other bias Low risk Little evidence of contamination of control
group
Saltvedt 2002
Methods Year: 2002
Location: Trondheim, Norway (University Hospital)
Team/ward?: ward
Timing: acute
Trial method: randomised trial
61Comprehensive geriatric assessment for older adults admitted to hospital (Review)
Copyright © 2017 The Cochrane Collaboration. Published by John Wiley & Sons, Ltd.

Saltvedt 2002 (Continued)
Participants Number (total): 254
Mean age: 82 years
Male:female proportion: 35% male (approx)
Inclusion criteria: frail patients > 75 years of age with acute impairment of ADL,
imbalance, dizziness, impaired mobility, chronic disability, weight loss, falls, confusion,
depression, malnutrition, vision or hearing impairment, mild or moderate dementia,
urinary incontinence, social or family problems, polypharmacy
Exclusion criteria: nursing home patients; fully independent; cancer with metastasis;
severe dementia
Interventions Team members: senior geriatrician, trainee geriatrician, specialist nurse, social workers,
physiotherapists, occupational therapists, dentists
Team organisation: at least weekly MDTs, protocolised care, early mobilisation
Control: usual care on general medical ward
Outcomes Mortality
Trial conclusions: reduction in short-term mortality, no difference in long-term mor-
tality
Notes
Risk of bias
Bias Authors’ judgement Support for judgement
Random sequence generation (selection
bias)
Low risk Provided by independent research office us-
ing permuted block randomisation with
unknown and varied block size
Allocation concealment (selection bias) Low risk Opaque sealed envelopes
Blinding of participants and personnel
(performance bias)
High risk Blinding of participants and personnel not
possible.
Blinding of outcome assessment (detection
bias) for objective outcome measures
Low risk Outcome measures (e.g. living at home)
unlikely to be influenced by lack of blind-
ing
Blinding of outcome assessment (detection
bias) for subjective outcome measures
Unclear risk Few details of outcome assessors given
Incomplete outcome data (attrition bias)
All outcomes
Unclear risk Insufficient reporting of attritions/exclu-
sions
Selective reporting (reporting bias) Unclear risk No a priori documentation found to judge
this item
62Comprehensive geriatric assessment for older adults admitted to hospital (Review)
Copyright © 2017 The Cochrane Collaboration. Published by John Wiley & Sons, Ltd.
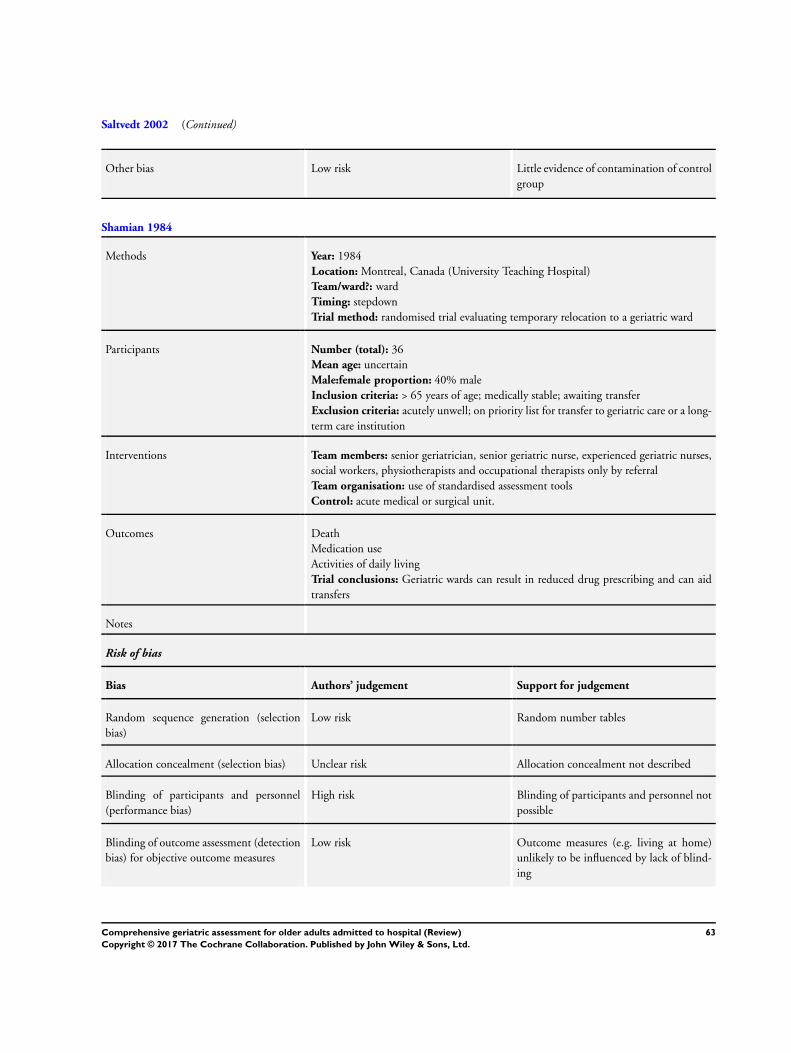
Saltvedt 2002 (Continued)
Other bias Low risk Little evidence of contamination of control
group
Shamian 1984
Methods Year: 1984
Location: Montreal, Canada (University Teaching Hospital)
Team/ward?: ward
Timing: stepdown
Trial method: randomised trial evaluating temporary relocation to a geriatric ward
Participants Number (total): 36
Mean age: uncertain
Male:female proportion: 40% male
Inclusion criteria: > 65 years of age; medically stable; awaiting transfer
Exclusion criteria: acutely unwell; on priority list for transfer to geriatric care or a long-
term care institution
Interventions Team members: senior geriatrician, senior geriatric nurse, experienced geriatric nurses,
social workers, physiotherapists and occupational therapists only by referral
Team organisation: use of standardised assessment tools
Control: acute medical or surgical unit.
Outcomes Death
Medication use
Activities of daily living
Trial conclusions: Geriatric wards can result in reduced drug prescribing and can aid
transfers
Notes
Risk of bias
Bias Authors’ judgement Support for judgement
Random sequence generation (selection
bias)
Low risk Random number tables
Allocation concealment (selection bias) Unclear risk Allocation concealment not described
Blinding of participants and personnel
(performance bias)
High risk Blinding of participants and personnel not
possible
Blinding of outcome assessment (detection
bias) for objective outcome measures
Low risk Outcome measures (e.g. living at home)
unlikely to be influenced by lack of blind-
ing
63Comprehensive geriatric assessment for older adults admitted to hospital (Review)
Copyright © 2017 The Cochrane Collaboration. Published by John Wiley & Sons, Ltd.

Shamian 1984 (Continued)
Blinding of outcome assessment (detection
bias) for subjective outcome measures
Unclear risk Few details of outcome assessors given
Incomplete outcome data (attrition bias)
All outcomes
Unclear risk Insufficient reporting of attritions/exclu-
sions
Selective reporting (reporting bias) Unclear risk No a priori documentation found to judge
this item
Other bias Low risk Little evidence of contamination of control
group
Somme 2010
Methods Randomised trial
Participants 45 participants (24 intervention, 21 control)
Mean age: 81 years
Male:female proportion: 42% male
Inclusion criteria: patients ≥ 75 years; scheduled for transfer from ICU
Exclusion criteria: residence more than 50 km from hospital; language or cognitive
disorders ruling out informed consent; transfer to ICU from an acute ward (preventing
randomisation after ICU stay); need for highly specialised treatments (i.e. cardiac surgery,
neurosurgery, and invasive cardiac examinations)
Interventions Intervention team members: attending geriatrician, trained nurses, social workers, phys-
iotherapists, dieticians, psychologists
Intervention team organisation: comprehensive assessment, at least weekly MDT meet-
ings, assessment tools, ward environment
Control: standard ward with similar numbers of nurses and nursing assistants on each
ward. An occupational therapist from the functional rehabilitation unit intervenes on
demand
Outcomes Alive and in own home
Dependence
Activities of daily living
Trial conclusions: previous function determined degree of recovery but trial inconclusive
for effectiveness
Notes
Risk of bias
Bias Authors’ judgement Support for judgement
Random sequence generation (selection
bias)
Unclear risk No details given on sequence generation
64Comprehensive geriatric assessment for older adults admitted to hospital (Review)
Copyright © 2017 The Cochrane Collaboration. Published by John Wiley & Sons, Ltd.

Somme 2010 (Continued)
Allocation concealment (selection bias) Low risk Allocation concealed by use of an on-site computer system in
a statistical unit not involved in patient care (feedback from
trialist)
Blinding of participants and personnel
(performance bias)
High risk Blinding of participants and personnel not possible
Blinding of outcome assessment (detection
bias) for objective outcome measures
Low risk Objective outcome measures (e.g. living at home) unlikely to be
influenced by lack of blinding
Blinding of outcome assessment (detection
bias) for subjective outcome measures
Low risk Outcome assessors blinded for follow-up questionnaire assess-
ment
Incomplete outcome data (attrition bias)
All outcomes
Unclear risk Insufficient recording of attrition/exclusions
Selective reporting (reporting bias) Unclear risk No details of study protocol
Other bias Low risk Little evidence of contamination of control group
Thomas 1993
Methods Year: 1993
Location: Winston-Salem, North Carolina, USA (Community Hospital)
Team/ward?: team
Timing: acute (within 48 hours)
Trial method: randomised trial
Participants Number (total): 132
Mean age: 77 years
Male:female proportion: 35% (approx)
Inclusion criteria: all patients > 70 years of age
Exclusion criteria: refusal of patients; ICU; CCU; obvious terminal illness; renal
haemodialysis; place of residence more than 50 miles from hospital
Interventions Team members: senior geriatrician, geriatric nurse specialist, social worker, dietician,
pharmacist, physiotherapist
Team organisation: comprehensive assessment, recommendations made in patient
charts, follow-up visits vs assessment with no recommendations in the control group
Control group: usual care and no follow-up visits
Outcomes Death
Dependence
Trial conclusions: short-term reductions in mortality that still remain at 1 year, addi-
tional trends toward better functional status and reduced re-admission
Notes
65Comprehensive geriatric assessment for older adults admitted to hospital (Review)
Copyright © 2017 The Cochrane Collaboration. Published by John Wiley & Sons, Ltd.

Thomas 1993 (Continued)
Risk of bias
Bias Authors’ judgement Support for judgement
Random sequence generation (selection
bias)
Low risk Computer-generated random numbers
Allocation concealment (selection bias) Unclear risk Allocation concealment not described
Blinding of participants and personnel
(performance bias)
High risk Blinding of participants and personnel not
possible
Blinding of outcome assessment (detection
bias) for objective outcome measures
Low risk Outcome measures (e.g. living at home)
unlikely to be influenced by lack of blind-
ing
Blinding of outcome assessment (detection
bias) for subjective outcome measures
Unclear risk Few details of outcome assessors given
Incomplete outcome data (attrition bias)
All outcomes
Unclear risk Insufficient reporting of attritions/exclu-
sions
Selective reporting (reporting bias) Unclear risk No a priori documentation found to judge
this item
Other bias Low risk Little evidence of contamination of control
group
Wald 2011
Methods Quasi-randomised trial
Participants 217 participants (122 intervention, 95 control)
Mean age: 81 years
Male:female proportion: 45% male
Inclusion criteria: patients ≥ 70 years of age; admitted to Anschutz Inpatient Pavilion
(AIP) of University Colorado Hospital (UCH)
Exclusion criteria: patients admitted to a medicine subspeciality service (such as car-
diology, pulmonary, or oncology); transferred to or from the Hospital-ACE or control
services to another service (e.g. intensive care unit, orthopaedic surgery service)
Interventions Intervention team members: trained nurses, social workers, physiotherapists, occupa-
tional therapists, pharmacists
Intervention team organisation: comprehensive assessment, at least weekly MDT meet-
ings, assessment tools, ward environment
Control: general medical services consisting of a hospitalist, a general internist, or an
internal medicine subspecialist attending physician with 1 medical resident, 1 intern,
and medical students
66Comprehensive geriatric assessment for older adults admitted to hospital (Review)
Copyright © 2017 The Cochrane Collaboration. Published by John Wiley & Sons, Ltd.

Wald 2011 (Continued)
Outcomes Alive and in own home
Death
Re-admission
Length of stay
Resource use
Trial conclusions: improvements in process but not in resource use; no impact on clinical
outcomes
Notes This was a quasi-randomised trial. Participants were randomised to the Hospitalist-
ACE service or to usual care according to the last digit of their medical record number.
Participants were included on an intention-to-treat basis if they could not access specialist
beds
Risk of bias
Bias Authors’ judgement Support for judgement
Random sequence generation (selection
bias)
High risk Odd and even numbers from medical record number
Allocation concealment (selection bias) High risk Unconcealed allocation
Blinding of participants and personnel
(performance bias)
High risk Participants and personnel not blinded
Blinding of outcome assessment (detection
bias) for objective outcome measures
Low risk Objective outcome measures (e.g. mortality, living at home)
unlikely to be influenced by lack of blinding
Blinding of outcome assessment (detection
bias) for subjective outcome measures
High risk Physicians/outcome assessors not blinded
Incomplete outcome data (attrition bias)
All outcomes
Unclear risk Insufficient recordings of attritions/exclusions
Selective reporting (reporting bias) Unclear risk No protocol provided
Other bias High risk Possible contamination of control group, as ACE residents
rotate on UCH general medical services
67Comprehensive geriatric assessment for older adults admitted to hospital (Review)
Copyright © 2017 The Cochrane Collaboration. Published by John Wiley & Sons, Ltd.

White 1994
Methods Year: 1994
Location: Nashville, Tennessee, USA (University Hospital)
Team/ward?: ward
Timing: stepdown from acute wards
Trial method: randomised trial
Participants Number (total): 40
Mean age: 76.5 years
Male:female proportion: 37%
Inclusion criteria: ≥ 65 years of age; medically stable; “potential for making improve-
ment in physical, functional or psychological function”; complicated discharge or await-
ing placement. Terminal patients accepted
Exclusion criteria: not explicitly stated
Interventions Team members: senior geriatrician, geriatric nurse specialist, social worker, dietician,
pharmacist, physiotherapist, occupational therapist, speech and language therapist
Team organisation: admission to a 6-bedded stepdown ward, weekly multi-disciplinary
meetings, full comprehensive assessment, therapy and discharge planning, review of
medications and appropriate limits on investigations
Control: usual care group reviewed by senior nurse and geriatrician, recommendations
made to the usual care team
Outcomes Death
Nursing home admission
Functional status
30-Day re-admission and costs
Trial conclusions: CGA is cost-effective and improves patient outcomes without in-
creasing length of stay
Notes
Risk of bias
Bias Authors’ judgement Support for judgement
Random sequence generation (selection
bias)
Low risk Random numbers table
Allocation concealment (selection bias) Unclear risk insufficient details of allocation conceal-
ment
Blinding of participants and personnel
(performance bias)
High risk Blinding of participants and personnel not
possible.
Blinding of outcome assessment (detection
bias) for objective outcome measures
Low risk Outcome measures (e.g. living at home)
unlikely to be influenced by lack of blind-
ing
68Comprehensive geriatric assessment for older adults admitted to hospital (Review)
Copyright © 2017 The Cochrane Collaboration. Published by John Wiley & Sons, Ltd.

White 1994 (Continued)
Blinding of outcome assessment (detection
bias) for subjective outcome measures
Unclear risk Few details of outcome assessors given
Incomplete outcome data (attrition bias)
All outcomes
Unclear risk Insufficient reporting of attritions/exclu-
sions
Selective reporting (reporting bias) Unclear risk No a priori documentation found to judge
this item
Other bias Low risk Little evidence of contamination of control
group
Winograd 1993
Methods Year: 1993
Location: Palo Alto, California, USA (VA Teaching Hospital)
Team/ward?: team
Timing: stepdown
Trial method: randomised trial
Participants Number (total): 197
Mean age: 76 years
Male:female proportion: 100% male
Inclusion criteria: all male patients ≥ 65 years of age; expected to stay > 96 hours;
within 2-hour drive; not enrolled in geriatric/rehab programme; functionally impaired
“frailty”; confusion; dependence in ADLs; polypharmacy; stressed caregiver system
Exclusion criteria: independent; permanent nursing home resident; life expectancy < 6
months
Interventions Team members: senior geriatrician, trainee geriatrician, specialist nurse, social work,
dietician
Team organisation: comprehensive assessment, standardised assessment tools
Control: usual care, not evaluated by the consultation team
Outcomes Death
Institutionalisation
Cognition
Dependence
Trial conclusions: no evidence of benefit from geriatric consultation team
Notes
Risk of bias
Bias Authors’ judgement Support for judgement
Random sequence generation (selection
bias)
Low risk Random number table with variable block
permutation
69Comprehensive geriatric assessment for older adults admitted to hospital (Review)
Copyright © 2017 The Cochrane Collaboration. Published by John Wiley & Sons, Ltd.

Winograd 1993 (Continued)
Allocation concealment (selection bias) Low risk Sequentially numbered opaque sealed en-
velopes
Blinding of participants and personnel
(performance bias)
High risk Blinding of participants and personnel not
possible
Blinding of outcome assessment (detection
bias) for objective outcome measures
Low risk Outcome measures (e.g. living at home)
unlikely to be influenced by lack of blind-
ing
Blinding of outcome assessment (detection
bias) for subjective outcome measures
Unclear risk Few details of outcome assessors given
Incomplete outcome data (attrition bias)
All outcomes
Unclear risk Insufficient reporting of attritions/exclu-
sions
Selective reporting (reporting bias) Unclear risk No a priori documentation found to judge
this item
Other bias Low risk Little evidence of contamination of control
group
ACE: acute care for elders
ADLs: activities of daily living
CCU: coronary care unit
CGA: comprehensive geriatric assessment
ED: emergency department
ESD: early supported discharge
GEM: geriatric evaluation and management
HIT: home intervention team
HMO: health maintenance organisation
ICU: intensive care unit
ITU: intensive treatment unit
LOS: length of stay
MDT: multi-disciplinary team
Characteristics of excluded studies [ordered by study ID]
Study Reason for exclusion
Abizanda 2011 Occupational therapy intervention rather than comprehensive geriatric assessment intervention
Borok 1994 Clinical trial of an inpatient geriatric consultation service
70Comprehensive geriatric assessment for older adults admitted to hospital (Review)
Copyright © 2017 The Cochrane Collaboration. Published by John Wiley & Sons, Ltd.

(Continued)
Boult 1994 Trial of outpatient geriatric evaluation and management
Campion 1983 Clinical trial of an interdisciplinary consultation service
Cole 1991 Evaluation of inpatient geriatric psychiatry
Cunliffe 2004 Randomised trial of early supported discharge
Epstein 1990 Trial of outpatient geriatric assessment and management
Fleming 2004 Randomised trial of geriatric rehabilitation in a care home setting for postacute care
Garåsen 2007 Randomised study comparing postacute (intermediate) care in a community hospital as opposed to an acute
hospital. Whilst the description of intermediate care is similar to CGA, this appears to be a trial of timing and
setting, rather than a care approach (e.g. CGA vs general medical care)
Gayton 1987 Clinical trial
Germain 1995 Randomised trial of a geriatric consultation team before transfer to a geriatric ward
Gharacholou 2012 Secondary analysis from earlier trial
Gill 2003 Randomised trial of outpatient rehabilitation
Harari 2007 Before-after study of a geriatric screening and liaison before potential transfer to a geriatric ward
Hogan 1990 Clinical trial of an interdisciplinary consultation service
Karppi 1995 Randomised trial comparing admission to a geriatric unit vs usual care at home (control group not admitted)
Kehusmaa 2010 Participants admitted electively to inpatient care
Landi 1997 Clinical trial of multi-disciplinary care in a geriatric unit
Ledesert 1994 Case-controlled study
Liem 1986 Uncontrolled study
Meissner 1989 Non-randomised clinical trial with case and control cohorts
Miller 1996 Clinical trial of a consultation service in the emergency department
Mudge 2006 Clinical trial of a multi-disciplinary team
Mudge 2012 Not a randomised trial
Nipp 2012 Secondary analysis from earlier trial
71Comprehensive geriatric assessment for older adults admitted to hospital (Review)
Copyright © 2017 The Cochrane Collaboration. Published by John Wiley & Sons, Ltd.

(Continued)
Retornaz 2007 Retrospective comparison of patients with cancer only
Reuben 1992 Prospective cohort study evaluating targeting of criteria to identify older at-risk adults
Rubin 1992 Randomised trial of outpatient geriatric care management and treatment programme
Trentini 2001 Randomised trial of outpatient geriatric assessment
Volicer 1994 Case-controlled study of a specialist dementia care unit
Yoo 2013a Not a randomised trial
Yoo 2013b Not a randomised trial
Yoo 2014 Not a randomised trial
Young 2005 Randomised study of comparison between Community Hospital care (CGA) and District General Hospital
care (CGA)
CGA: comprehensive geriatric assessment
72Comprehensive geriatric assessment for older adults admitted to hospital (Review)
Copyright © 2017 The Cochrane Collaboration. Published by John Wiley & Sons, Ltd.

D A T A A N D A N A L Y S E S
Comparison 1. CGA versus usual care
Outcome or subgroup titleNo. of
studies
No. of
participants Statistical method Effect size
1 Living at home (discharge) 11 4346 Risk Ratio (M-H, Fixed, 95% CI) 1.05 [1.01, 1.10]
1.1 Ward 8 3853 Risk Ratio (M-H, Fixed, 95% CI) 1.06 [1.02, 1.11]
1.2 Team 3 493 Risk Ratio (M-H, Fixed, 95% CI) 0.95 [0.85, 1.07]
2 Living at home (end of follow-up
3 to 12 months)
16 6799 Risk Ratio (M-H, Fixed, 95% CI) 1.06 [1.01, 1.10]
2.1 Ward 12 5705 Risk Ratio (M-H, Fixed, 95% CI) 1.07 [1.03, 1.12]
2.2 Team 4 1094 Risk Ratio (M-H, Fixed, 95% CI) 0.97 [0.88, 1.07]
3 Mortality (discharge) 11 4346 Risk Ratio (M-H, Fixed, 95% CI) 1.04 [0.82, 1.32]
3.1 Ward 8 3853 Risk Ratio (M-H, Fixed, 95% CI) 1.00 [0.77, 1.29]
3.2 Team 3 493 Risk Ratio (M-H, Fixed, 95% CI) 1.29 [0.72, 2.31]
4 Mortality (end of follow-up 3 to
12 months)
21 10023 Risk Ratio (M-H, Fixed, 95% CI) 1.00 [0.93, 1.07]
4.1 Ward 15 6444 Risk Ratio (M-H, Fixed, 95% CI) 0.99 [0.91, 1.09]
4.2 Team 6 3579 Risk Ratio (M-H, Fixed, 95% CI) 1.01 [0.90, 1.14]
5 Admission to a nursing home
(discharge)
12 4459 Risk Ratio (M-H, Fixed, 95% CI) 0.89 [0.81, 0.98]
5.1 Ward 8 3853 Risk Ratio (M-H, Fixed, 95% CI) 0.87 [0.79, 0.96]
5.2 Team 4 606 Risk Ratio (M-H, Fixed, 95% CI) 1.05 [0.80, 1.39]
6 Admission to a nursing home
(end of follow-up 3 to 12
months)
14 6285 Risk Ratio (M-H, Fixed, 95% CI) 0.80 [0.72, 0.89]
6.1 Ward 11 5512 Risk Ratio (M-H, Fixed, 95% CI) 0.77 [0.69, 0.86]
6.2 Team 3 773 Risk Ratio (M-H, Fixed, 95% CI) 1.44 [0.91, 2.30]
7 Dependence 14 6551 Risk Ratio (M-H, Fixed, 95% CI) 0.97 [0.89, 1.04]
7.1 ADL 9 2420 Risk Ratio (M-H, Fixed, 95% CI) 1.06 [0.94, 1.19]
7.2 Decline in ADL 5 4131 Risk Ratio (M-H, Fixed, 95% CI) 0.91 [0.83, 1.01]
8 Activities of daily living 7 1445 Std. Mean Difference (IV, Fixed, 95% CI) 0.04 [-0.06, 0.15]
8.1 Ward 5 1116 Std. Mean Difference (IV, Fixed, 95% CI) 0.08 [-0.04, 0.20]
8.2 Team 2 329 Std. Mean Difference (IV, Fixed, 95% CI) -0.08 [-0.30, 0.14]
9 Cognitive function 5 Std. Mean Difference (IV, Fixed, 95% CI) Totals not selected
9.1 Ward 2 Std. Mean Difference (IV, Fixed, 95% CI) 0.0 [0.0, 0.0]
9.2 Team 3 Std. Mean Difference (IV, Fixed, 95% CI) 0.0 [0.0, 0.0]
10 Length of stay 17 Mean Difference (IV, Fixed, 95% CI) Totals not selected
10.1 Ward 11 Mean Difference (IV, Fixed, 95% CI) 0.0 [0.0, 0.0]
10.2 Team 6 Mean Difference (IV, Fixed, 95% CI) 0.0 [0.0, 0.0]
11 Re-admissions 13 6698 Risk Ratio (M-H, Fixed, 95% CI) 1.02 [0.94, 1.11]
11.1 Ward 11 5992 Risk Ratio (M-H, Fixed, 95% CI) 1.01 [0.92, 1.11]
11.2 Team 2 706 Risk Ratio (M-H, Fixed, 95% CI) 1.07 [0.90, 1.28]
73Comprehensive geriatric assessment for older adults admitted to hospital (Review)
Copyright © 2017 The Cochrane Collaboration. Published by John Wiley & Sons, Ltd.

Analysis 1.1. Comparison 1 CGA versus usual care, Outcome 1 Living at home (discharge).
Review: Comprehensive geriatric assessment for older adults admitted to hospital
Comparison: 1 CGA versus usual care
Outcome: 1 Living at home (discharge)
Study or subgroup CGA Control Risk Ratio Weight Risk Ratio
n/N n/N M-H,Fixed,95% CI M-H,Fixed,95% CI
1 Ward
Rubenstein 1984 (1) 46/63 32/60 2.4 % 1.37 [ 1.03, 1.81 ]
Collard 1985 (2) 163/218 319/477 14.6 % 1.12 [ 1.01, 1.24 ]
Fretwell 1990 (3) 129/221 110/215 8.1 % 1.14 [ 0.96, 1.35 ]
Kay 1992 (4) 16/30 17/29 1.3 % 0.91 [ 0.58, 1.43 ]
White 1994 (5) 14/20 7/20 0.5 % 2.00 [ 1.03, 3.88 ]
Landefeld 1995 (6) 260/327 233/324 17.1 % 1.11 [ 1.01, 1.21 ]
Wald 2011 (7) 83/122 64/95 5.3 % 1.01 [ 0.84, 1.22 ]
Barnes 2012 (8) 537/858 490/774 37.6 % 0.99 [ 0.92, 1.07 ]
Subtotal (95% CI) 1859 1994 86.9 % 1.06 [ 1.02, 1.11 ]
Total events: 1248 (CGA), 1272 (Control)
Heterogeneity: Chi2 = 13.41, df = 7 (P = 0.06); I2 =48%
Test for overall effect: Z = 2.66 (P = 0.0079)
2 Team
McVey 1989 (9) 61/93 64/92 4.7 % 0.94 [ 0.77, 1.15 ]
Winograd 1993 68/99 74/98 5.4 % 0.91 [ 0.76, 1.08 ]
Naughton 1994 (10) 39/51 44/60 3.0 % 1.04 [ 0.84, 1.29 ]
Subtotal (95% CI) 243 250 13.1 % 0.95 [ 0.85, 1.07 ]
Total events: 168 (CGA), 182 (Control)
Heterogeneity: Chi2 = 0.96, df = 2 (P = 0.62); I2 =0.0%
Test for overall effect: Z = 0.86 (P = 0.39)
Total (95% CI) 2102 2244 100.0 % 1.05 [ 1.01, 1.10 ]
Total events: 1416 (CGA), 1454 (Control)
Heterogeneity: Chi2 = 17.62, df = 10 (P = 0.06); I2 =43%
Test for overall effect: Z = 2.22 (P = 0.026)
Test for subgroup differences: Chi2 = 3.24, df = 1 (P = 0.07), I2 =69%
0.2 0.5 1 2 5
Favours control Favours CGA
74Comprehensive geriatric assessment for older adults admitted to hospital (Review)
Copyright © 2017 The Cochrane Collaboration. Published by John Wiley & Sons, Ltd.

(1) Trials recruited participants living in a nursing home at admission and living at home
(2) Trials recruited participants living in a nursing home at admission and living at home
(3) Trials recruited participants living in a nursing home at admission and living at home
(4) Trials recruited participants living in a nursing home at admission and living at home
(5) Trials recruited participants living in a nursing home at admission and living at home
(6) Trials recruited participants living in a nursing home at admission and living at home
(7) Trials recruited participants living in a nursing home at admission and living at home
(8) Trials recruited participants living in a nursing home at admission and living at home
(9) Trials recruited participants living in a nursing home at admission and living at home
(10) Trials recruited participants living in a nursing home at admission and living at home
Analysis 1.2. Comparison 1 CGA versus usual care, Outcome 2 Living at home (end of follow-up 3 to 12
months).
Review: Comprehensive geriatric assessment for older adults admitted to hospital
Comparison: 1 CGA versus usual care
Outcome: 2 Living at home (end of follow-up 3 to 12 months)
Study or subgroup CGA Control Risk Ratio Weight Risk Ratio
n/N n/N M-H,Fixed,95% CI M-H,Fixed,95% CI
1 Ward
Rubenstein 1984 (1) 35/63 22/60 1.2 % 1.52 [ 1.02, 2.26 ]
Applegate 1990 (2) 55/78 43/77 2.3 % 1.26 [ 0.99, 1.61 ]
Landefeld 1995 (3) 218/327 194/324 10.3 % 1.11 [ 0.99, 1.25 ]
Nikolaus 1999 (4) 114/179 56/93 3.9 % 1.06 [ 0.87, 1.29 ]
Nikolaus 1999 plus ESD (5) 118/181 55/92 3.9 % 1.09 [ 0.89, 1.33 ]
Asplund 2000 (6) 121/190 134/223 6.5 % 1.06 [ 0.91, 1.23 ]
Counsell 2000 (7) 474/767 485/764 25.7 % 0.97 [ 0.90, 1.05 ]
Cohen 2002 GEMC (8) 200/346 185/346 9.8 % 1.08 [ 0.95, 1.24 ]
Saltvedt 2002 (9) 60/127 55/127 2.9 % 1.09 [ 0.83, 1.43 ]
Cohen 2002 UCOP (10) 217/348 185/348 9.8 % 1.17 [ 1.03, 1.33 ]
0.5 0.7 1 1.5 2
Favours control Favours CGA
(Continued . . . )
75Comprehensive geriatric assessment for older adults admitted to hospital (Review)
Copyright © 2017 The Cochrane Collaboration. Published by John Wiley & Sons, Ltd.
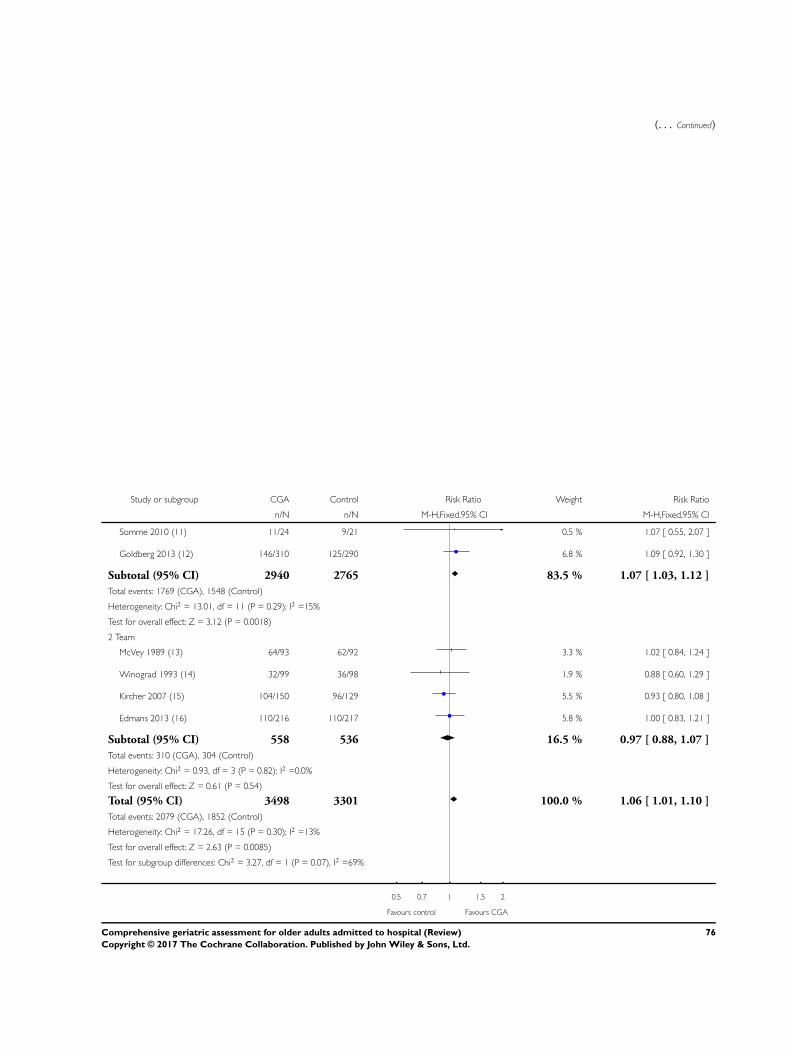
(. . . Continued)
Study or subgroup CGA Control Risk Ratio Weight Risk Ratio
n/N n/N M-H,Fixed,95% CI M-H,Fixed,95% CI
Somme 2010 (11) 11/24 9/21 0.5 % 1.07 [ 0.55, 2.07 ]
Goldberg 2013 (12) 146/310 125/290 6.8 % 1.09 [ 0.92, 1.30 ]
Subtotal (95% CI) 2940 2765 83.5 % 1.07 [ 1.03, 1.12 ]
Total events: 1769 (CGA), 1548 (Control)
Heterogeneity: Chi2 = 13.01, df = 11 (P = 0.29); I2 =15%
Test for overall effect: Z = 3.12 (P = 0.0018)
2 Team
McVey 1989 (13) 64/93 62/92 3.3 % 1.02 [ 0.84, 1.24 ]
Winograd 1993 (14) 32/99 36/98 1.9 % 0.88 [ 0.60, 1.29 ]
Kircher 2007 (15) 104/150 96/129 5.5 % 0.93 [ 0.80, 1.08 ]
Edmans 2013 (16) 110/216 110/217 5.8 % 1.00 [ 0.83, 1.21 ]
Subtotal (95% CI) 558 536 16.5 % 0.97 [ 0.88, 1.07 ]
Total events: 310 (CGA), 304 (Control)
Heterogeneity: Chi2 = 0.93, df = 3 (P = 0.82); I2 =0.0%
Test for overall effect: Z = 0.61 (P = 0.54)
Total (95% CI) 3498 3301 100.0 % 1.06 [ 1.01, 1.10 ]
Total events: 2079 (CGA), 1852 (Control)
Heterogeneity: Chi2 = 17.26, df = 15 (P = 0.30); I2 =13%
Test for overall effect: Z = 2.63 (P = 0.0085)
Test for subgroup differences: Chi2 = 3.27, df = 1 (P = 0.07), I2 =69%
0.5 0.7 1 1.5 2
Favours control Favours CGA
76Comprehensive geriatric assessment for older adults admitted to hospital (Review)
Copyright © 2017 The Cochrane Collaboration. Published by John Wiley & Sons, Ltd.

(1) 12 months follow-up
(2) 12 months follow-up
(3) 3 months follow-up
(4) CGA ward only intervention; 12 months follow-up
(5) CGA ward plus early supported discharge intervention; 12 months follow-up
(6) 3 months follow-up
(7) 12 months follow-up
(8) CGA inpatient unit+GEMC clinic follow-up; 12 months follow-up
(9) Individual participant data at 12 months follow-up
(10) CGA inpatient unit+usual care outpatient; 12 months follow-up
(11) Individual participant data at 3 months follow-up
(12) Individual participant data at 90 days follow-up
(13) 6 months follow-up
(14) 12 months follow-up
(15) Individual participant data at 12 months follow-up
(16) Individual participant data at 90 days follow-up
77Comprehensive geriatric assessment for older adults admitted to hospital (Review)
Copyright © 2017 The Cochrane Collaboration. Published by John Wiley & Sons, Ltd.

Analysis 1.3. Comparison 1 CGA versus usual care, Outcome 3 Mortality (discharge).
Review: Comprehensive geriatric assessment for older adults admitted to hospital
Comparison: 1 CGA versus usual care
Outcome: 3 Mortality (discharge)
Study or subgroup CGA Control Risk Ratio Weight Risk Ratio
n/N n/N M-H,Fixed,95% CI M-H,Fixed,95% CI
1 Ward
Rubenstein 1984 9/63 9/60 7.3 % 0.95 [ 0.41, 2.24 ]
Collard 1985 8/218 39/477 19.4 % 0.45 [ 0.21, 0.94 ]
Fretwell 1990 22/221 20/215 16.1 % 1.07 [ 0.60, 1.90 ]
Kay 1992 2/30 0/29 0.4 % 4.84 [ 0.24, 96.66 ]
White 1994 0/20 0/20 Not estimable
Landefeld 1995 24/327 24/324 19.1 % 0.99 [ 0.57, 1.71 ]
Wald 2011 1/122 0/95 0.4 % 2.34 [ 0.10, 56.84 ]
Barnes 2012 40/858 27/774 22.5 % 1.34 [ 0.83, 2.16 ]
Subtotal (95% CI) 1859 1994 85.2 % 1.00 [ 0.77, 1.29 ]
Total events: 106 (CGA), 119 (Control)
Heterogeneity: Chi2 = 7.28, df = 6 (P = 0.30); I2 =18%
Test for overall effect: Z = 0.03 (P = 0.97)
2 Team
McVey 1989 7/93 8/92 6.4 % 0.87 [ 0.33, 2.29 ]
Winograd 1993 14/99 6/98 4.8 % 2.31 [ 0.93, 5.77 ]
Naughton 1994 3/51 5/60 3.6 % 0.71 [ 0.18, 2.81 ]
Subtotal (95% CI) 243 250 14.8 % 1.29 [ 0.72, 2.31 ]
Total events: 24 (CGA), 19 (Control)
Heterogeneity: Chi2 = 2.94, df = 2 (P = 0.23); I2 =32%
Test for overall effect: Z = 0.87 (P = 0.39)
Total (95% CI) 2102 2244 100.0 % 1.04 [ 0.82, 1.32 ]
Total events: 130 (CGA), 138 (Control)
Heterogeneity: Chi2 = 10.67, df = 9 (P = 0.30); I2 =16%
Test for overall effect: Z = 0.32 (P = 0.75)
Test for subgroup differences: Chi2 = 0.65, df = 1 (P = 0.42), I2 =0.0%
0.01 0.1 1 10 100
Favours CGA Favours control
78Comprehensive geriatric assessment for older adults admitted to hospital (Review)
Copyright © 2017 The Cochrane Collaboration. Published by John Wiley & Sons, Ltd.

Analysis 1.4. Comparison 1 CGA versus usual care, Outcome 4 Mortality (end of follow-up 3 to 12 months).
Review: Comprehensive geriatric assessment for older adults admitted to hospital
Comparison: 1 CGA versus usual care
Outcome: 4 Mortality (end of follow-up 3 to 12 months)
Study or subgroup CGA Control Risk Ratio Weight Risk Ratio
n/N n/N M-H,Fixed,95% CI M-H,Fixed,95% CI
1 Ward
Rubenstein 1984 (1) 15/63 29/60 2.6 % 0.49 [ 0.29, 0.82 ]
Shamian 1984 (2) 1/20 1/16 0.1 % 0.80 [ 0.05, 11.82 ]
Fretwell 1990 (3) 57/221 46/215 4.1 % 1.21 [ 0.86, 1.69 ]
Applegate 1990 (4) 16/78 19/77 1.7 % 0.83 [ 0.46, 1.49 ]
Harris 1991 (5) 22/97 49/170 3.2 % 0.79 [ 0.51, 1.22 ]
Landefeld 1995 (6) 42/327 40/324 3.6 % 1.04 [ 0.69, 1.56 ]
Nikolaus 1999 (7) 30/179 16/93 1.9 % 0.97 [ 0.56, 1.69 ]
Nikolaus 1999 plus ESD (8) 33/181 16/92 1.9 % 1.05 [ 0.61, 1.80 ]
Counsell 2000 (9) 241/767 223/764 19.8 % 1.08 [ 0.92, 1.25 ]
Asplund 2000 (10) 21/190 17/223 1.4 % 1.45 [ 0.79, 2.67 ]
Cohen 2002 GEMC (11) 79/346 73/346 6.5 % 1.08 [ 0.82, 1.43 ]
Saltvedt 2002 (12) 35/127 43/127 3.8 % 0.81 [ 0.56, 1.18 ]
Cohen 2002 UCOP (13) 71/348 74/348 6.6 % 0.96 [ 0.72, 1.28 ]
Somme 2010 (14) 11/24 11/21 1.0 % 0.88 [ 0.48, 1.59 ]
Goldberg 2013 (15) 68/310 71/290 6.5 % 0.90 [ 0.67, 1.20 ]
Subtotal (95% CI) 3278 3166 64.7 % 0.99 [ 0.91, 1.09 ]
Total events: 742 (CGA), 728 (Control)
Heterogeneity: Chi2 = 14.70, df = 14 (P = 0.40); I2 =5%
Test for overall effect: Z = 0.13 (P = 0.89)
2 Team
McVey 1989 (16) 17/93 23/92 2.1 % 0.73 [ 0.42, 1.28 ]
Winograd 1993 (17) 41/99 35/98 3.1 % 1.16 [ 0.81, 1.65 ]
Thomas 1993 (18) 7/68 13/64 1.2 % 0.51 [ 0.22, 1.19 ]
Reuben 1995 (19) 347/1337 258/1016 26.0 % 1.02 [ 0.89, 1.17 ]
Kircher 2007 (20) 27/150 20/129 1.9 % 1.16 [ 0.68, 1.97 ]
Edmans 2013 (21) 14/216 12/217 1.1 % 1.17 [ 0.55, 2.48 ]
0.02 0.1 1 10 50
Favours CGA Favours control
(Continued . . . )
79Comprehensive geriatric assessment for older adults admitted to hospital (Review)
Copyright © 2017 The Cochrane Collaboration. Published by John Wiley & Sons, Ltd.
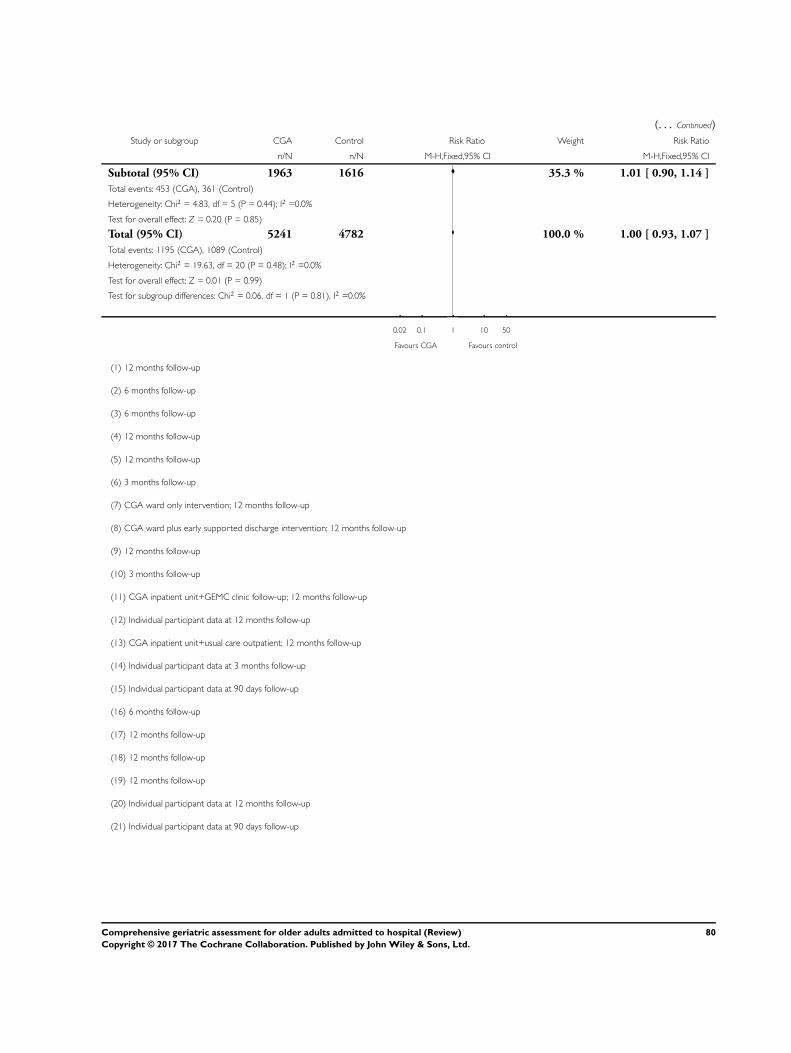
(. . . Continued)
Study or subgroup CGA Control Risk Ratio Weight Risk Ratio
n/N n/N M-H,Fixed,95% CI M-H,Fixed,95% CI
Subtotal (95% CI) 1963 1616 35.3 % 1.01 [ 0.90, 1.14 ]
Total events: 453 (CGA), 361 (Control)
Heterogeneity: Chi2 = 4.83, df = 5 (P = 0.44); I2 =0.0%
Test for overall effect: Z = 0.20 (P = 0.85)
Total (95% CI) 5241 4782 100.0 % 1.00 [ 0.93, 1.07 ]
Total events: 1195 (CGA), 1089 (Control)
Heterogeneity: Chi2 = 19.63, df = 20 (P = 0.48); I2 =0.0%
Test for overall effect: Z = 0.01 (P = 0.99)
Test for subgroup differences: Chi2 = 0.06, df = 1 (P = 0.81), I2 =0.0%
0.02 0.1 1 10 50
Favours CGA Favours control
(1) 12 months follow-up
(2) 6 months follow-up
(3) 6 months follow-up
(4) 12 months follow-up
(5) 12 months follow-up
(6) 3 months follow-up
(7) CGA ward only intervention; 12 months follow-up
(8) CGA ward plus early supported discharge intervention; 12 months follow-up
(9) 12 months follow-up
(10) 3 months follow-up
(11) CGA inpatient unit+GEMC clinic follow-up; 12 months follow-up
(12) Individual participant data at 12 months follow-up
(13) CGA inpatient unit+usual care outpatient; 12 months follow-up
(14) Individual participant data at 3 months follow-up
(15) Individual participant data at 90 days follow-up
(16) 6 months follow-up
(17) 12 months follow-up
(18) 12 months follow-up
(19) 12 months follow-up
(20) Individual participant data at 12 months follow-up
(21) Individual participant data at 90 days follow-up
80Comprehensive geriatric assessment for older adults admitted to hospital (Review)
Copyright © 2017 The Cochrane Collaboration. Published by John Wiley & Sons, Ltd.

Analysis 1.5. Comparison 1 CGA versus usual care, Outcome 5 Admission to a nursing home (discharge).
Review: Comprehensive geriatric assessment for older adults admitted to hospital
Comparison: 1 CGA versus usual care
Outcome: 5 Admission to a nursing home (discharge)
Study or subgroup CGA Control Risk Ratio Weight Risk Ratio
n/N n/N M-H,Fixed,95% CI M-H,Fixed,95% CI
1 Ward
Rubenstein 1984 (1) 8/63 19/60 3.0 % 0.40 [ 0.19, 0.85 ]
Collard 1985 (2) 47/218 119/477 11.5 % 0.86 [ 0.64, 1.16 ]
Fretwell 1990 (3) 70/221 85/215 13.3 % 0.80 [ 0.62, 1.03 ]
Kay 1992 (4) 12/30 12/29 1.9 % 0.97 [ 0.52, 1.79 ]
White 1994 (5) 6/20 13/20 2.0 % 0.46 [ 0.22, 0.97 ]
Landefeld 1995 (6) 43/327 67/324 10.4 % 0.64 [ 0.45, 0.90 ]
Wald 2011 (7) 38/122 31/95 5.4 % 0.95 [ 0.65, 1.41 ]
Barnes 2012 (8) 281/858 257/774 41.7 % 0.99 [ 0.86, 1.13 ]
Subtotal (95% CI) 1859 1994 89.1 % 0.87 [ 0.79, 0.96 ]
Total events: 505 (CGA), 603 (Control)
Heterogeneity: Chi2 = 13.90, df = 7 (P = 0.05); I2 =50%
Test for overall effect: Z = 2.76 (P = 0.0057)
2 Team
Hogan 1987 (9) 23/57 22/56 3.4 % 1.03 [ 0.65, 1.62 ]
McVey 1989 (10) 25/93 20/92 3.1 % 1.24 [ 0.74, 2.06 ]
Winograd 1993 17/99 18/98 2.8 % 0.93 [ 0.51, 1.71 ]
Naughton 1994 (11) 9/51 11/60 1.6 % 0.96 [ 0.43, 2.14 ]
Subtotal (95% CI) 300 306 10.9 % 1.05 [ 0.80, 1.39 ]
Total events: 74 (CGA), 71 (Control)
Heterogeneity: Chi2 = 0.59, df = 3 (P = 0.90); I2 =0.0%
Test for overall effect: Z = 0.37 (P = 0.71)
Total (95% CI) 2159 2300 100.0 % 0.89 [ 0.81, 0.98 ]
Total events: 579 (CGA), 674 (Control)
Heterogeneity: Chi2 = 15.95, df = 11 (P = 0.14); I2 =31%
Test for overall effect: Z = 2.46 (P = 0.014)
Test for subgroup differences: Chi2 = 1.64, df = 1 (P = 0.20), I2 =39%
0.2 0.5 1 2 5
Favours CGA Favours control
81Comprehensive geriatric assessment for older adults admitted to hospital (Review)
Copyright © 2017 The Cochrane Collaboration. Published by John Wiley & Sons, Ltd.

(1) Trials recruited participants living in a nursing home at admission and living at home
(2) Trials recruited participants living in a nursing home at admission and living at home
(3) Trials recruited participants living in a nursing home at admission and living at home
(4) Trials recruited participants living in a nursing home at admission and living at home
(5) Trials recruited participants living in a nursing home at admission and living at home
(6) Trials recruited participants living in a nursing home at admission and living at home
(7) Trials recruited participants living in a nursing home at admission and living at home
(8) Trials recruited participants living in a nursing home at admission and living at home
(9) Trials recruited participants living in a nursing home at admission and living at home
(10) Trials recruited participants living in a nursing home at admission and living at home
(11) Trials recruited participants living in a nursing home at admission and living at home
Analysis 1.6. Comparison 1 CGA versus usual care, Outcome 6 Admission to a nursing home (end of follow-
up 3 to 12 months).
Review: Comprehensive geriatric assessment for older adults admitted to hospital
Comparison: 1 CGA versus usual care
Outcome: 6 Admission to a nursing home (end of follow-up 3 to 12 months)
Study or subgroup CGA Control Risk Ratio Weight Risk Ratio
n/N n/N M-H,Fixed,95% CI M-H,Fixed,95% CI
1 Ward
Rubenstein 1984 (1) 13/63 9/60 1.6 % 1.38 [ 0.64, 2.98 ]
Applegate 1990 (2) 7/78 15/77 2.6 % 0.46 [ 0.20, 1.07 ]
Landefeld 1995 (3) 67/327 90/324 15.7 % 0.74 [ 0.56, 0.97 ]
Nikolaus 1999 (4) 35/179 21/93 4.8 % 0.87 [ 0.54, 1.40 ]
Nikolaus 1999 plus ESD (5) 30/181 21/92 4.8 % 0.73 [ 0.44, 1.19 ]
Asplund 2000 (6) 48/190 72/223 11.5 % 0.78 [ 0.57, 1.07 ]
Counsell 2000 (7) 52/767 56/764 9.7 % 0.92 [ 0.64, 1.33 ]
Cohen 2002 GEMC (8) 67/346 88/346 15.3 % 0.76 [ 0.58, 1.01 ]
Cohen 2002 UCOP (9) 60/348 89/348 15.4 % 0.67 [ 0.50, 0.90 ]
0.2 0.5 1 2 5
Favours CGA Favours control
(Continued . . . )
82Comprehensive geriatric assessment for older adults admitted to hospital (Review)
Copyright © 2017 The Cochrane Collaboration. Published by John Wiley & Sons, Ltd.

(. . . Continued)
Study or subgroup CGA Control Risk Ratio Weight Risk Ratio
n/N n/N M-H,Fixed,95% CI M-H,Fixed,95% CI
Saltvedt 2002 (10) 16/127 16/127 2.8 % 1.00 [ 0.52, 1.91 ]
Goldberg 2013 (11) 45/222 65/230 11.1 % 0.72 [ 0.51, 1.00 ]
Subtotal (95% CI) 2828 2684 95.3 % 0.77 [ 0.69, 0.86 ]
Total events: 440 (CGA), 542 (Control)
Heterogeneity: Chi2 = 6.57, df = 10 (P = 0.77); I2 =0.0%
Test for overall effect: Z = 4.54 (P < 0.00001)
2 Team
McVey 1989 (12) 12/93 7/92 1.2 % 1.70 [ 0.70, 4.12 ]
Kircher 2007 (13) 24/150 15/129 2.8 % 1.38 [ 0.75, 2.51 ]
Edmans 2013 (14) 5/153 4/156 0.7 % 1.27 [ 0.35, 4.66 ]
Subtotal (95% CI) 396 377 4.7 % 1.44 [ 0.91, 2.30 ]
Total events: 41 (CGA), 26 (Control)
Heterogeneity: Chi2 = 0.19, df = 2 (P = 0.91); I2 =0.0%
Test for overall effect: Z = 1.55 (P = 0.12)
Total (95% CI) 3224 3061 100.0 % 0.80 [ 0.72, 0.89 ]
Total events: 481 (CGA), 568 (Control)
Heterogeneity: Chi2 = 13.47, df = 13 (P = 0.41); I2 =3%
Test for overall effect: Z = 3.96 (P = 0.000075)
Test for subgroup differences: Chi2 = 6.67, df = 1 (P = 0.01), I2 =85%
0.2 0.5 1 2 5
Favours CGA Favours control
(1) 12 months follow-up
(2) 12 months follow-up
(3) 3 months follow-up
(4) CGA ward only intervention; 12 months follow-up
(5) CGA ward plus early supported discharge intervention; 12 months follow-up
(6) 3 months follow-up. In some trials admission to a nursing home included other hospital or sheltered living
(7) 12 months follow-up
(8) CGA inpatient unit+GEMC clinic follow-up; 12 months follow-up
(9) CGA inpatient unit+usual care outpatient; 12 months follow-up
(10) 6 months follow-up
(11) 90 days follow-up
(12) 6 months follow-up
(13) 12 months follow-up
(14) 90 days follow-up
83Comprehensive geriatric assessment for older adults admitted to hospital (Review)
Copyright © 2017 The Cochrane Collaboration. Published by John Wiley & Sons, Ltd.
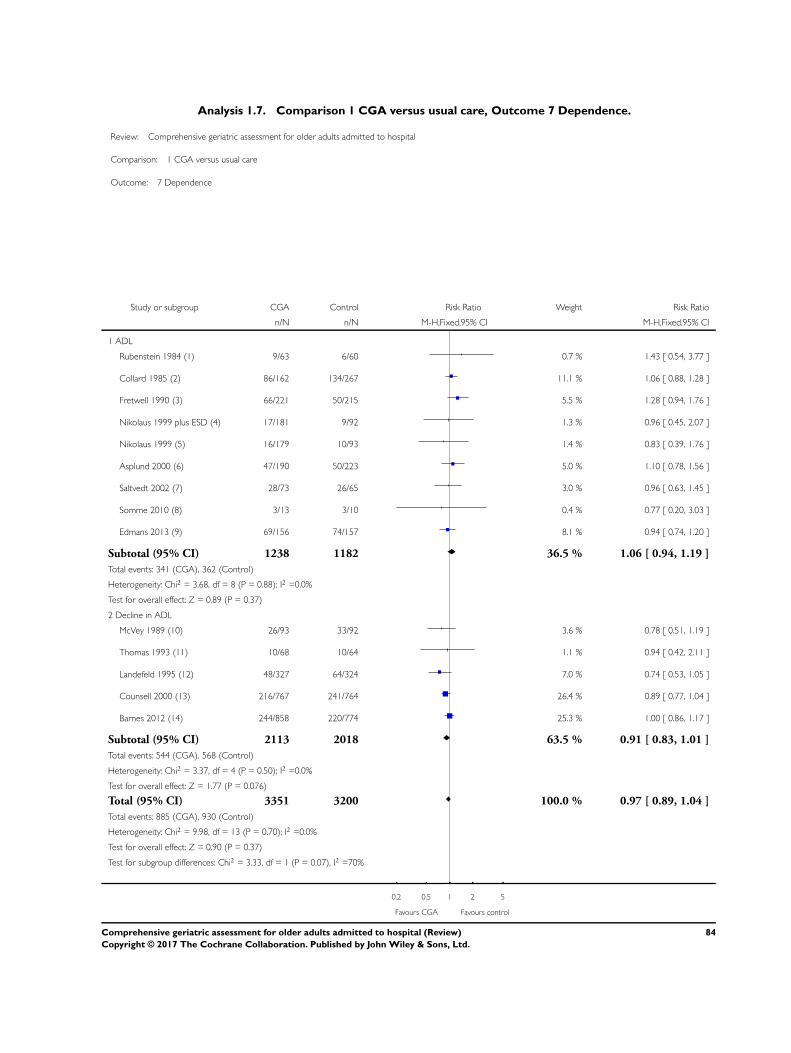
Analysis 1.7. Comparison 1 CGA versus usual care, Outcome 7 Dependence.
Review: Comprehensive geriatric assessment for older adults admitted to hospital
Comparison: 1 CGA versus usual care
Outcome: 7 Dependence
Study or subgroup CGA Control Risk Ratio Weight Risk Ratio
n/N n/N M-H,Fixed,95% CI M-H,Fixed,95% CI
1 ADL
Rubenstein 1984 (1) 9/63 6/60 0.7 % 1.43 [ 0.54, 3.77 ]
Collard 1985 (2) 86/162 134/267 11.1 % 1.06 [ 0.88, 1.28 ]
Fretwell 1990 (3) 66/221 50/215 5.5 % 1.28 [ 0.94, 1.76 ]
Nikolaus 1999 plus ESD (4) 17/181 9/92 1.3 % 0.96 [ 0.45, 2.07 ]
Nikolaus 1999 (5) 16/179 10/93 1.4 % 0.83 [ 0.39, 1.76 ]
Asplund 2000 (6) 47/190 50/223 5.0 % 1.10 [ 0.78, 1.56 ]
Saltvedt 2002 (7) 28/73 26/65 3.0 % 0.96 [ 0.63, 1.45 ]
Somme 2010 (8) 3/13 3/10 0.4 % 0.77 [ 0.20, 3.03 ]
Edmans 2013 (9) 69/156 74/157 8.1 % 0.94 [ 0.74, 1.20 ]
Subtotal (95% CI) 1238 1182 36.5 % 1.06 [ 0.94, 1.19 ]
Total events: 341 (CGA), 362 (Control)
Heterogeneity: Chi2 = 3.68, df = 8 (P = 0.88); I2 =0.0%
Test for overall effect: Z = 0.89 (P = 0.37)
2 Decline in ADL
McVey 1989 (10) 26/93 33/92 3.6 % 0.78 [ 0.51, 1.19 ]
Thomas 1993 (11) 10/68 10/64 1.1 % 0.94 [ 0.42, 2.11 ]
Landefeld 1995 (12) 48/327 64/324 7.0 % 0.74 [ 0.53, 1.05 ]
Counsell 2000 (13) 216/767 241/764 26.4 % 0.89 [ 0.77, 1.04 ]
Barnes 2012 (14) 244/858 220/774 25.3 % 1.00 [ 0.86, 1.17 ]
Subtotal (95% CI) 2113 2018 63.5 % 0.91 [ 0.83, 1.01 ]
Total events: 544 (CGA), 568 (Control)
Heterogeneity: Chi2 = 3.37, df = 4 (P = 0.50); I2 =0.0%
Test for overall effect: Z = 1.77 (P = 0.076)
Total (95% CI) 3351 3200 100.0 % 0.97 [ 0.89, 1.04 ]
Total events: 885 (CGA), 930 (Control)
Heterogeneity: Chi2 = 9.98, df = 13 (P = 0.70); I2 =0.0%
Test for overall effect: Z = 0.90 (P = 0.37)
Test for subgroup differences: Chi2 = 3.33, df = 1 (P = 0.07), I2 =70%
0.2 0.5 1 2 5
Favours CGA Favours control
84Comprehensive geriatric assessment for older adults admitted to hospital (Review)
Copyright © 2017 The Cochrane Collaboration. Published by John Wiley & Sons, Ltd.

(1) Personal Self-Maintenance Scale (PSMS) at 12 months, dependency 0-2
(2) Self-rated mobility at discharge, dependency cut-off not specified
(3) Katz at 6 months, dependency cut-off ≥4 dependencies
(4) CGA ward plus early supported discharge intervention; Barthel at 12 months, dependency cut-off not specified
(5) CGA ward only intervention; Barthel at 12 months, dependency cut-off not specified
(6) Barthel at 3 months, dependency cut-off < 15
(7) Barthel at 12 months, dependency ≤15 using individual participant data
(8) Barthel at 3 months, dependency ≤15 using individual participant data
(9) Barthel at 90 days, dependency ≤15 using individual participant data
(10) Decline in ADL from baseline to discharge
(11) Decline in ADL from baseline to 6 months
(12) Decline in ADL from admission to discharge
(13) Decline in ADL from baseline to discharge
(14) Decline in ADL from baseline to discharge
85Comprehensive geriatric assessment for older adults admitted to hospital (Review)
Copyright © 2017 The Cochrane Collaboration. Published by John Wiley & Sons, Ltd.

Analysis 1.8. Comparison 1 CGA versus usual care, Outcome 8 Activities of daily living.
Review: Comprehensive geriatric assessment for older adults admitted to hospital
Comparison: 1 CGA versus usual care
Outcome: 8 Activities of daily living
Study or subgroup CGA Control
Std.Mean
Difference Weight
Std.Mean
Difference
N Mean(SD) N Mean(SD) IV,Fixed,95% CI IV,Fixed,95% CI
1 Ward
Applegate 1990 (1) 78 1.1 (1.9) 77 0.64 (2.3) 11.1 % 0.22 [ -0.10, 0.53 ]
Nikolaus 1999 (2) 179 92.6 (14.3) 93 91.1 (15.9) 17.7 % 0.10 [ -0.15, 0.35 ]
Nikolaus 1999 plus ESD (3) 181 91.8 (14.4) 92 91.1 (15.9) 17.6 % 0.05 [ -0.20, 0.30 ]
Somme 2010 24 75.6 (28.4) 21 64.6 (26.9) 3.2 % 0.39 [ -0.20, 0.98 ]
Goldberg 2013 187 11.6 (5.6) 184 11.6 (5.7) 26.8 % 0.0 [ -0.20, 0.20 ]
Subtotal (95% CI) 649 467 76.3 % 0.08 [ -0.04, 0.20 ]
Heterogeneity: Chi2 = 2.46, df = 4 (P = 0.65); I2 =0.0%
Test for overall effect: Z = 1.33 (P = 0.18)
2 Team
Winograd 1993 99 3.6 (2) 98 4 (2.1) 14.2 % -0.19 [ -0.47, 0.09 ]
Thomas 1993 68 14.3 (3.5) 64 14 (3) 9.5 % 0.09 [ -0.25, 0.43 ]
Subtotal (95% CI) 167 162 23.7 % -0.08 [ -0.30, 0.14 ]
Heterogeneity: Chi2 = 1.61, df = 1 (P = 0.20); I2 =38%
Test for overall effect: Z = 0.72 (P = 0.47)
Total (95% CI) 816 629 100.0 % 0.04 [ -0.06, 0.15 ]
Heterogeneity: Chi2 = 5.70, df = 6 (P = 0.46); I2 =0.0%
Test for overall effect: Z = 0.81 (P = 0.42)
Test for subgroup differences: Chi2 = 1.63, df = 1 (P = 0.20), I2 =39%
-1 -0.5 0 0.5 1
Favours Control Favours CGA
(1) Walking was used as a proxy for ADL
(2) CGA ward only intervention
(3) CGA ward plus early supported discharge intervention
86Comprehensive geriatric assessment for older adults admitted to hospital (Review)
Copyright © 2017 The Cochrane Collaboration. Published by John Wiley & Sons, Ltd.

Analysis 1.9. Comparison 1 CGA versus usual care, Outcome 9 Cognitive function.
Review: Comprehensive geriatric assessment for older adults admitted to hospital
Comparison: 1 CGA versus usual care
Outcome: 9 Cognitive function
Study or subgroup CGA Control
Std.Mean
Difference
Std.Mean
Difference
N Mean(SD) N Mean(SD) IV,Fixed,95% CI IV,Fixed,95% CI
1 Ward
Asplund 2000 (1) 169 26 (5.19) 206 24 (7.41) 0.31 [ 0.10, 0.51 ]
Goldberg 2013 (2) 163 15.172 (8.535) 167 14.76 (9.473) 0.05 [ -0.17, 0.26 ]
2 Team
Winograd 1993 (3) 99 24.3 (7.1) 98 21.4 (9.2) 0.35 [ 0.07, 0.63 ]
Reuben 1995 (4) 1337 72.3 (26.1) 1016 70.6 (26.8) 0.06 [ -0.02, 0.15 ]
Kircher 2007 (5) 150 25 (4.44) 129 26 (4.44) -0.22 [ -0.46, 0.01 ]
-1 -0.5 0 0.5 1
Favours Control Favours CGA
(1) Cognitive function was measured by MMSE. We calculated the SD in Asplund and Kircher using the estimate IQR=1.35 SDs.
(2) Cognitive function was measured by MMSE. Individual participant data
(3) Cognitive function was measured by MMSE.
(4) Cognitive function was measured by mental health index. For Reuben we used the formula SD = sqrt(N) x (Upper limit-Lower limit)/3.92.
(5) Cognitive function was measured by MMSE.
87Comprehensive geriatric assessment for older adults admitted to hospital (Review)
Copyright © 2017 The Cochrane Collaboration. Published by John Wiley & Sons, Ltd.

Analysis 1.10. Comparison 1 CGA versus usual care, Outcome 10 Length of stay.
Review: Comprehensive geriatric assessment for older adults admitted to hospital
Comparison: 1 CGA versus usual care
Outcome: 10 Length of stay
Study or subgroup CGA ControlMean
DifferenceMean
Difference
N Mean(SD) N Mean(SD) IV,Fixed,95% CI IV,Fixed,95% CI
1 Ward
Fretwell 1990 221 11.6 (12.2) 215 12.8 (15.8) -1.20 [ -3.85, 1.45 ]
Harris 1991 97 10.9 (7.9) 170 9.8 (7.8) 1.10 [ -0.86, 3.06 ]
Nikolaus 1999 plus ESD (1) 181 33.5 (21.5) 93 42.7 (20.4) -9.20 [ -14.40, -4.00 ]
Nikolaus 1999 (2) 179 40.7 (24.1) 92 42.7 (20.4) -2.00 [ -7.46, 3.46 ]
Asplund 2000 190 5.9 (5.7) 223 7.3 (5.7) -1.40 [ -2.50, -0.30 ]
Cohen 2002 UCOP (3) 348 22.7 (27.9) 348 15.2 (23.8) 7.50 [ 3.65, 11.35 ]
Cohen 2002 GEMC (4) 346 23.8 (25.3) 346 14.8 (23.3) 9.00 [ 5.38, 12.62 ]
Saltvedt 2002 (5) 127 21.3071 (17.1444) 127 13.22 (17.3562) 8.09 [ 3.84, 12.33 ]
Somme 2010 (6) 17 19.2353 (12.5675) 18 42.83 (84.2819) -23.60 [ -62.99, 15.79 ]
Wald 2011 122 3.4 (2.7) 95 3.1 (2.7) 0.30 [ -0.42, 1.02 ]
Goldberg 2013 (7) 310 17.003 (18.085) 290 16.52 (17.302) 0.48 [ -2.35, 3.31 ]
2 Team
Hogan 1987 57 15.8 (12.7) 56 14.2 (13.3) 1.60 [ -3.20, 6.40 ]
McVey 1989 88 20.2 (26.5) 90 16.6 (14.9) 3.60 [ -2.73, 9.93 ]
Thomas 1993 68 9 (7.5) 64 10.1 (7.6) -1.10 [ -3.68, 1.48 ]
Winograd 1993 99 24.8 (22) 98 26.7 (33) -1.90 [ -9.74, 5.94 ]
Naughton 1994 51 5.4 (5.5) 60 7 (7) -1.60 [ -3.93, 0.73 ]
Edmans 2013 (8) 205 1.639 (2.506) 212 1.85 (5.504) -0.22 [ -1.03, 0.60 ]
-50 -25 0 25 50
Favours CGA Favours control
(1) CGA ward plus early supported discharge intervention
(2) CGA ward only intervention
(3) CGA inpatient unit+usual care outpatient
(4) CGA inpatient unit+GEMC clinic follow-up
(5) Individual Participant Data
(6) Individual participant data
(7) Individual participant data
(8) Individual participant data
88Comprehensive geriatric assessment for older adults admitted to hospital (Review)
Copyright © 2017 The Cochrane Collaboration. Published by John Wiley & Sons, Ltd.

Analysis 1.11. Comparison 1 CGA versus usual care, Outcome 11 Re-admissions.
Review: Comprehensive geriatric assessment for older adults admitted to hospital
Comparison: 1 CGA versus usual care
Outcome: 11 Re-admissions
Study or subgroup CGA Control Risk Ratio Weight Risk Ratio
n/N n/N M-H,Fixed,95% CI M-H,Fixed,95% CI
1 Ward
Rubenstein 1984 22/63 30/60 3.8 % 0.70 [ 0.46, 1.06 ]
White 1994 4/20 7/20 0.9 % 0.57 [ 0.20, 1.65 ]
Landefeld 1995 104/327 109/324 13.5 % 0.95 [ 0.76, 1.18 ]
Nikolaus 1999 (1) 64/179 33/93 5.4 % 1.01 [ 0.72, 1.41 ]
Nikolaus 1999 plus ESD (2) 59/181 32/92 5.2 % 0.94 [ 0.66, 1.33 ]
Asplund 2000 61/182 61/217 6.9 % 1.19 [ 0.89, 1.60 ]
Counsell 2000 161/767 138/764 17.1 % 1.16 [ 0.95, 1.43 ]
Saltvedt 2002 46/127 42/127 5.2 % 1.10 [ 0.78, 1.54 ]
Wald 2011 15/122 9/95 1.3 % 1.30 [ 0.59, 2.84 ]
Barnes 2012 88/858 83/774 10.8 % 0.96 [ 0.72, 1.27 ]
Goldberg 2013 99/310 101/290 12.9 % 0.92 [ 0.73, 1.15 ]
Subtotal (95% CI) 3136 2856 82.9 % 1.01 [ 0.92, 1.11 ]
Total events: 723 (CGA), 645 (Control)
Heterogeneity: Chi2 = 9.06, df = 10 (P = 0.53); I2 =0.0%
Test for overall effect: Z = 0.23 (P = 0.82)
2 Team
Kircher 2007 84/150 65/129 8.6 % 1.11 [ 0.89, 1.39 ]
Edmans 2013 (3) 71/215 68/212 8.5 % 1.03 [ 0.78, 1.35 ]
Subtotal (95% CI) 365 341 17.1 % 1.07 [ 0.90, 1.28 ]
Total events: 155 (CGA), 133 (Control)
Heterogeneity: Chi2 = 0.19, df = 1 (P = 0.67); I2 =0.0%
Test for overall effect: Z = 0.77 (P = 0.44)
Total (95% CI) 3501 3197 100.0 % 1.02 [ 0.94, 1.11 ]
Total events: 878 (CGA), 778 (Control)
Heterogeneity: Chi2 = 9.74, df = 12 (P = 0.64); I2 =0.0%
Test for overall effect: Z = 0.50 (P = 0.62)
Test for subgroup differences: Chi2 = 0.33, df = 1 (P = 0.56), I2 =0.0%
0.2 0.5 1 2 5
Favours CGA Favours control
89Comprehensive geriatric assessment for older adults admitted to hospital (Review)
Copyright © 2017 The Cochrane Collaboration. Published by John Wiley & Sons, Ltd.

(1) CGA ward only intervention
(2) CGA ward plus early supported discharge intervention
(3) Individual participant data
A D D I T I O N A L T A B L E S
Table 1. Parameters used in the decision model for the economic evaluation
Value Standard error Distribution Alpha Beta Source
Probabilities
Risk ratio: liv-
ing at home (end
of follow-up on
ward)
1.070 0.92 Gamma 1.34 0.80 Main meta-analysis
Risk ratio: living
at home (end of
follow-
up on ward and
by team)
1.060 1.20 Gamma 0.78 1.36 Main meta-analysis
Risk ratio: ad-
mitted to a nurs-
ing home (end
of follow-up on
ward)
0.780 0.06 Gamma 173.99 0.00 Main meta-analysis
Risk ra-
tio: admitted to
a nursing home
(end of follow-
up on ward and
by team)
0.810 0.06 Gamma 207.55 0.00 Main meta-analysis
Resource utili-
sation
Mean difference
in length of stay
in hospital
0.029 0.22 Normal Main meta-analysis
Mean length of
stay in a nursing
home after dis-
49.91 8.12 Gamma 38 1 Saltvedt
90Comprehensive geriatric assessment for older adults admitted to hospital (Review)
Copyright © 2017 The Cochrane Collaboration. Published by John Wiley & Sons, Ltd.

Table 1. Parameters used in the decision model for the economic evaluation (Continued)
charge - CGA
Mean length of
stay in a nursing
home after dis-
charge - UC
40.87 8.44 Gamma 23 2 Saltvedt
Health
outcomes
Mean difference
in LYLAH
0.009 0.022 Normal Meta-analysis based on IPD (Edmans, Saltvedt)
Mean difference
in QALY
0.012 0.019 Normal Meta-analysis based on IPD (Edmans, Kircher,
Saltvedt)
Mean difference
in QALY (severe
patients)
0.018 0.024 Normal Meta-analysis based on IPD (Goldberg, Somme)
Mean difference
in time to death
13.061 6.664 Normal Meta-analysis based on IPD (Edmans, Goldberg,
Kircher, Saltvedt)
Unit costs
Cost of bed day
in hospital
874 Weighted average of elective and non-elective hos-
pitalisation based on national reference costs 2013/
2014
Cost of nursing
home day
77 Personal social services: Expenditure and unit costs,
England - 2013-14, final release: Unit costs by
CASSR
Cost of CGA per
patient
208 8.929 Gamma 543 0 Tanajewski et al. 2015, AMIGOS trial
Mean difference in QALY was based on mapping the IPD for the Barthel from three trials (Edmans 2013; Kircher 2007; Saltvedt
2002).
In Saltvedt 2002, baseline Barthel Index was assessed 1.7 days after inclusion in the control group and at 3.5 days in the intervention
group.
In Saltvedt 2002, baseline Barthel Index was self-reported in the control group and was performance-based in the intervention group.
91Comprehensive geriatric assessment for older adults admitted to hospital (Review)
Copyright © 2017 The Cochrane Collaboration. Published by John Wiley & Sons, Ltd.

Table 2. Cost data reported by trials
Cost analysis
Trial Year Country Treatment arm Costs Comments
Cohen 2002 USA
(US Dollars)
Geriatric Unit + Usual
Care Outpatient
36,592 (1844 SD) Di-
rect cost comparison sep-
arated into institutional
costs and costs estimated
for nursing home admis-
sions based on standard-
ised HMO rates
Usual Care Inpatient +
Usual Care Outpatient
(Control)
38,624 (2037)
Geriatric Unit + Geriatric
Outpatient
35,935 (1829)
Usual Care Inpa-
tient + Geriatric Outpa-
tient (Control)
35,951 (1827)
Collard 1985 USA
(US Dollars)
Choate (Experimental) 4015.17 (SE 0.03) Direct cost comparison
(hospital costs only)
Choate (Control) 4545.13 (SE 0.03)
Symmes (Experimental) 3591.42 (SE 0.03)
Symmes (Control) 4155.54 (SE 0.02)
Fretwell 1990 USA
(US Dollars)
Experiment 3148 (7210 SD) Direct cost comparison
(hospital costs only)
Control 4163 (18,406)
Applegate 1990 USA
(US Dollars)
Geriatric Unit (Rehab
Diagnosis)
32,978 (35,130 SD) Health and social care
costs up to 1 year after
randomisation
Geriatric Unit (Medical/
Surgical Diagnosis)
25,846 (29,628)
Usual Care (Rehab/Diag-
nosis)
18,409 (16,555)
Usual Care (Medical/
Surgical Diagnosis)
15,248 (13,152)
Asplund 2000 Sweden
(Swedish Kronar)
Experiment 10,800 (9300 - 12,300
IQR)
Direct cost comparison
(hospital costs only)
Control 12,800 (11,500 - 14,
100)
92Comprehensive geriatric assessment for older adults admitted to hospital (Review)
Copyright © 2017 The Cochrane Collaboration. Published by John Wiley & Sons, Ltd.

Table 2. Cost data reported by trials (Continued)
Counsell 2000 USA
(US Dollars)
Experiment 5640 Included in experimen-
tal group costs are costs
of renovation of geriatric
unitControl 5754
Hogan 1987 Canada
(Canadian Dollars)
Experiment 98.36 Monthly costings for
physician services only
Control 77.68
Landefeld 1995 USA
(US Dollars)
Experiment 6608 Direct cost comparison
(hospital costs only)
Control 7240
Nikolaus 1999 Germany
(Deutschmark)
Geriatric Unit + ESD 3,365,000 (1,922,400) Costs for hospital care
and nursing homes (es-
timated as costs per 100
people per year)
Geriatric Unit only 3,983,000 (2,276,000)
Control 4,145,000
Rubenstein 1984 USA
(US Dollars)
Experiment 22,597 Costs per year survived
including hospital and
nursing home costsControl 27,826
Naughton 1994 USA
(US Dollars)
Experiment 4525 (5087 SD) Direct cost comparison
(hospital costs only)
Control 6474 (7000)
White 1994 USA
(US Dollars)
Experiment 23,906 Direct cost comparison
(hospital costs only)
Control 45,189
Barnes 2012 USA
(US Dollars)
Experiment 9477 Direct cost comparison
(hospital costs only)
Control 10,451
Edmans 2013 UK
(UK Pounds)
Experiment 4475 (95% CI 3901 to
5141)
Care cost + intervention
cost up to 90 days after
hospital dischargeControl 4,057 (95% CI 3367 to
4882)
Wald 2011 USA
(US Dollars)
Experiment 24,617 (15,828 SD) Direct cost comparison
(hospital costs only)
Control 21,488 (13,407 SD)
Owing to variation in time periods (1985 to 2013) and resources costed, these data are not used in the analysis of costs.
93Comprehensive geriatric assessment for older adults admitted to hospital (Review)
Copyright © 2017 The Cochrane Collaboration. Published by John Wiley & Sons, Ltd.

Table 3. Results from main cost-effectiveness analysis
Incremen-
tal healthcare costs
(95% CI)
Incremental out-
comes (95% CI)
ICER Probability of CGA
being more costly
Probability of CGA
being more costly
and more effective
Prob-
ability of CGA being
cost-effective at GBP
20,000 ceiling ratio
Cost-utility analysis (outcome is QALY)
GBP 234
(-144 to 605)
0.012
(-0.024 to 0.048)
GBP 19,802 0.89 0.66 0.50
Cost-effectiveness analysis (outcome is LY)
GBP 234
(-144 to 605)
0.037
(0.001 to 0.073)
GBP 6305 0.89 0.87 0.89
Cost-effectiveness analysis (outcome is LYLAH)
GBP 234
(-144 to 605)
0.019
(-0.019 to 0.155)
GBP 12,568 0.89 0.74 0.47
Table 4. Outcome living at home: FE meta-analysis (intervention vs control) adjusting for baseline Barthel measures (binary),
age, and sex
Study OR 95% lower 95% upper % weight
Edmans 0.711 0.376 1.346 16.39
Goldberg 1.147 0.821 1.603 59.66
Kircher 0.733 0.359 1.496 13.11
Somme 0.339 0.018 6.396 0.77
Saltvedt 0.79 0.35 1.783 10.07
Overall effect 0.954 0.737 1.236 100
In Saltvedt 2002, baseline Barthel Index was assessed 1.7 days after inclusion in the control group and at 3.5 days in the intervention
group
Also in this trial, baseline Barthel Index was self-reported in the control group and was performance-based in the intervention group.
This trial showed an impact on mortality and living at home at 3 to 6 months. For consistency, however, data from 12-month outcomes
are provided
94Comprehensive geriatric assessment for older adults admitted to hospital (Review)
Copyright © 2017 The Cochrane Collaboration. Published by John Wiley & Sons, Ltd.

Table 5. Outcome death: FE meta-analysis (intervention vs control) adjusting for baseline Barthel measures (binary), age, and
sex
Study OR 95% lower 95% upper % weight
Edmans 0.965 0.412 2.259 10.49
Goldberg 0.915 0.621 1.349 50.41
Kircher 0.852 0.379 1.916 11.55
Somme 0.784 0.231 2.664 5.08
Saltvedt 0.989 0.553 1.769 22.47
Overall effect 0.922 0.7 1.214 100
In Saltvedt 2002, baseline Barthel Index was assessed 1.7 days after inclusion in the control group and at 3.5 days in the intervention
group
Also in this trial, baseline Barthel Index was self-reported in the control group and was performance-based in the intervention group.
This trial showed an impact on mortality and living at home at 3 to 6 months. For consistency, however, data from 12-month outcomes
are provided
Table 6. Outcome time to event (death): FE meta-analysis (intervention vs control) adjusted for age, sex, and Barthel baseline
(binary)
Hazard ratio SE 95% CI lower 95% CI upper P value
Treatment 0.883 0.091 0.723 1.080 0.227
Age 0.996 0.008 0.980 1.012 0.597
Sex 0.955 0.122 0.743 1.227 0.718
Barthel BL 0.648 0.117 0.455 0.922 0.016
In Saltvedt 2002, baseline Barthel Index was assessed 1.7 days after inclusion in the control group and at 3.5 days in the intervention
group
Also in this trial, baseline Barthel Index was self-reported in the control group and was performance-based in the intervention group
95Comprehensive geriatric assessment for older adults admitted to hospital (Review)
Copyright © 2017 The Cochrane Collaboration. Published by John Wiley & Sons, Ltd.

A P P E N D I C E S
Appendix 1. Search strategy
MEDLINE (OVID)
Epub Ahead of Print, In-Process & Other Non-Indexed Citations, Ovid MEDLINE(R) Daily and Ovid MEDLINE(R), 1946 to
Present
No. Search terms Results
1 Geriatric Assessment/ 20041
2 Health Services for the Aged/ 15592
3 Needs Assessment/ 24005
4 Risk Assessment/ 192072
5 exp Diagnostic Services/ 128462
6 “Health Services Needs and Demand”/ 46254
7 exp Health Services/ 1711370
8 exp “Delivery of Health Care”/ 857276
9 exp “Outcome and Process Assessment (Health Care)”/ 801899
10 ((multidisciplinary or multi-disciplinary) adj5 assess*).tw. 1662
11 3 or 4 or 5 or 6 or 7 or 8 or 9 or 10 2954861
12 geriatrics/ 27726
13 11 and 12 7054
14 1 or 2 or 13 39955
15 ((geriatric or elderly or old age) adj5 consultation).tw. 281
16 ((geriatric or elderly or old age) adj5 evaluation).tw. 1749
17 ((geriatric or elderly or old age) adj5 assess*).tw. 6892
18 (gemu or gemus).tw. 28
19 14 or 15 or 16 or 17 or 18 45416
20 randomized controlled trial.pt. 403861
96Comprehensive geriatric assessment for older adults admitted to hospital (Review)
Copyright © 2017 The Cochrane Collaboration. Published by John Wiley & Sons, Ltd.

(Continued)
21 controlled clinical trial.pt. 89971
22 randomized.ab. 332029
23 placebo.ab. 165079
24 drug therapy.fs. 1808615
25 randomly.ab. 239897
26 trial.ab. 342879
27 groups.ab. 1501977
28 20 or 21 or 22 or 23 or 24 or 25 or 26 or 27 3628791
29 exp animals/ not humans.sh. 4171020
30 28 not 29 3119676
31 19 and 30 8308
Embase (OVID)
Embase 1974 to 2016 October 04
No. Search terms Results
1 Geriatric Assessment/ 10710
2 Health Services for the Aged/ 31734
3 Needs Assessment/ 18142
4 Risk Assessment/ 377468
5 exp Diagnostic Services/ 23147
6 “Health Services Needs and Demand”/ 114362
7 exp Health Services/ 3999339
8 exp “Delivery of Health Care”/ 2248768
9 exp “Outcome and Process Assessment (Health Care)”/ 1119631
10 ((multidisciplinary or multi-disciplinary) adj5 assess*).tw. 2728
97Comprehensive geriatric assessment for older adults admitted to hospital (Review)
Copyright © 2017 The Cochrane Collaboration. Published by John Wiley & Sons, Ltd.

(Continued)
11 3 or 4 or 5 or 6 or 7 or 8 or 9 or 10 4875561
12 geriatrics/ 39394
13 11 and 12 12908
14 1 or 2 or 13 53049
15 ((geriatric or elderly or old age) adj5 consultation).tw. 457
16 ((geriatric or elderly or old age) adj5 evaluation).tw. 2560
17 ((geriatric or elderly or old age) adj5 assess*).tw. 10413
18 (gemu or gemus).tw. 30
19 14 or 15 or 16 or 17 or 18 61413
20 crossover procedure/ 45508
21 double blind procedure/ 127571
22 single blind procedure/ 21272
23 randomized controlled trial/ 391709
24 (random* or trial or placebo* or crossover or “cross over” or (
(singl* or doubl*) adj1 (blind* or mask*)) or assign* or allocat*
or volunteer*).tw
1790347
25 20 or 21 or 22 or 23 or 24 1865543
26 (exp animals/ or nonhuman/) not human/ 5853159
27 25 not 26 1630698
28 19 and 27 6789
The Cochrane Library (Wiley)
No. Search terms Results
#1 [mh “geriatric assessment”] 1144
#2 [mh “health services for the aged”] 494
98Comprehensive geriatric assessment for older adults admitted to hospital (Review)
Copyright © 2017 The Cochrane Collaboration. Published by John Wiley & Sons, Ltd.

(Continued)
#3 [mh “needs assessment”] 323
#4 [mh “risk assessment”] 7949
#5 [mh “diagnostic services”] 5345
#6 [mh “health services needs and demand”] 444
#7 [mh “health services”] 74700
#8 [mh “delivery of health care”] 37934
#9 [mh “outcome and process assessment (health care)”] 104909
#10 ((multidisciplinary or multi-disciplinary) near assess*):ti,ab,
kw
132
#11 {or #3-#10} 176514
#12 [mh geriatrics] 203
#13 [mh aged] 1124
#14 #12 or #13 1315
#15 #11 and #14 821
#16 ((geriatric or elderly or old age) near consultation):ti,ab,kw 57
#17 ((geriatric or elderly or old age) near evaluation):ti,ab,kw 336
#18 ((geriatric or elderly or old age) near assess*):ti,ab,kw 2005
#19 {or #1-#2, #15-#18} 3214
CINAHL (EBSCO)
No. Search terms Results
S1 (MH “geriatric assessment+”) 10,474
S2 (MH “health services for the aged”) 4,545
S3 (MH “needs assessment”) 9,411
S4 (MH “patient assessment”) 10,286
99Comprehensive geriatric assessment for older adults admitted to hospital (Review)
Copyright © 2017 The Cochrane Collaboration. Published by John Wiley & Sons, Ltd.

(Continued)
S5 (MH “nursing assessment”) 15,059
S6 (MH “diagnostic services+”) 45,759
S7 (MH “risk assessment”) 38,708
S8 (MH “diagnostic services+”) 45,759
S9 (MH “health services needs and demand”) 12,786
S10 (MH “health services+”) 591,682
S11 (MH “health care delivery, integrated”) 5,210
S12 (MH “health care delivery”) 25,064
S13 (MH “outcome assessment”) 18,800
S14 (MH “process assessment (health care)”) 3,240
S15 TI (((multidisciplinary or multi-disciplinary) n5 assess)) or
AB (((multidisciplinary or multi-disciplinary) n5 assess))
77
S16 S3 OR S4 OR S5 OR S6 OR S7 OR S8 OR S9 OR S10 OR
S11 OR S12 OR S13 OR S14 OR S15
673,380
S17 (MH “geriatrics”) 2,752
S18 S16 AND S17 703
S19 TI (((geriatric or elderly or old age) n5 consultation)) or AB (
((geriatric or elderly or old age) n5 consultation))
113
S20 TI (((geriatric or elderly or old age) n5 evaluation)) or AB ((
(geriatric or elderly or old age) n5 evaluation))
574
S21 TI (((geriatric or elderly or old age) n5 assess*)) or AB (((geri-
atric or elderly or old age) n5 assess*))
2,696
S22 TI (gemu or gemus) or AB (gemu or gemus) 7
S23 S1 OR S2 OR S18 OR S19 OR S20 OR S21 OR S22 17,417
S24 PT randomized controlled trial 30,144
S25 PT clinical trial 52,635
100Comprehensive geriatric assessment for older adults admitted to hospital (Review)
Copyright © 2017 The Cochrane Collaboration. Published by John Wiley & Sons, Ltd.

(Continued)
S26 TI ( randomis* or randomiz* or randomly) OR AB ( ran-
domis* or randomiz* or randomly)
108,883
S27 (MH “Clinical Trials+”) 132,848
S28 (MH “Random Assignment”) 32,911
S29 S24 OR S25 OR S26 OR S27 OR S28 190,857
S30 S23 AND S29 1,321
ClinicalTrials.gov
“comprehensive geriatric assessment”
WHO International Clinical Trials Registry Platform (ICTRP)
comprehensive geriatric assessment
Appendix 2. Methods used in the cost-effectiveness analysis
The aim of the cost-effectiveness analysis was to examine whether health outcomes and costs differ between those who received inpatient
CGA and those admitted to hospital but did not receive CGA.
Costs
An NHS perspective was taken, as suggested in the NICE guidance for health economic evaluations (NICE 2013). We included
hospitalisation costs and the costs of delivering CGA. Hospitalisation costs were based on the meta-analysis of mean length of stay in
hospital (N = 17 studies) (Analysis 1.10) and were valued using English unit cost prices 2013/2014. The unit cost of a hospital bed day
was calculated as the weighted average cost of elective and non-elective hospital admissions reported in the National Reference Costs
2013/14. Costs of delivering CGA per patient were based on data reported in one trial (Primary AMIGOS Trial, Edmans 2013; cost-
effectiveness study, Tanajewski 2015), which evaluated a version of CGA that included an attending geriatrician and outpatient follow-
up.
Outcomes
The effectiveness of delivering inpatient CGA was measured by three health outcomes:
• Quality-adjusted life years (QALYs) were calculated using individual patient data (IPD) from three trials that assessed patient
functioning/dependency with the the Barthel Index (Edmans 2013; Kircher 2007; Saltvedt 2002). We converted the Barthel Index to
EQ-5D-3L UK utilities, based on methods described by Kaambwa 2013, to calculate QALYs. We selected studies with mean Barthel
scores at baseline that were similar to the population in the Kaambwa 2013 study (Barthel score range from 14.8 to 16.5, on a scale
of 0 to 20). We used the IPD provided by Edmans 2013 to validate the mapping exercise, by comparing the QALYs calculated using
the Bartel Index to QALYs based on EQ-5D -3L using IPD from Edmans 2013, as this study provided data for the EQ-5D and
the Barthel Index. A meta-analysis using a fixed-effect model was performed to estimate incremental QALYs (results are presented in
Supplementary Table 4.1 (see below).
Supplementary Table 4.1: Pooled estimate of incremental QALYs (non-severe patients with a mean Barthel Index score from 14.8 to
16.5)
101Comprehensive geriatric assessment for older adults admitted to hospital (Review)
Copyright © 2017 The Cochrane Collaboration. Published by John Wiley & Sons, Ltd.

Study Weighted mean difference 95% confidence interval % weight
Edmans 2013 0.014 -0.041 to 0.070 44.13
Kircher 2007 -0.024 -0.096 to 0.048 26.09
Saltvedt 2002 0.038 -0.029 to 0.106 29.78
I-V pooled WMD 0.012 -0.025 to 0.048 100.00
Heterogeneity Chi² = 1.55 (df = 2) P = 0.461
I² (variation in WMD attributable to heterogeneity) = 0.0%
Test of WMD = 0: z = 0.62, P = 0.537
• Life years (LYs) were estimated using the IPD from four trials to calculate time to death (TTD) from randomisation in each trial arm
(Edmans 2013; Goldberg 2013; Kircher 2007; Saltvedt 2002). A meta-analysis using a fixed-effect model was performed to estimate
the pooled mean difference in TTD between patients who had received CGA and those who had not. Results of the meta-analysis are
presented in Supplementary Table 4.2. The pooled mean difference in TTD was then divided by 365 (days in a year) to calculate LYs.
Supplementary Table 4.2: Pooled estimate of incremental time to death
Study Weighted mean difference 95% confidence interval % weight
Edmans 2013 -41.486 -115.539 to 32.567 9.04
Goldberg 2013 -8.325 -37.922 to 21.272 56.57
Kircher 2007 1.087 -60.808 to 62.982 12.94
Saltvedt 2002 99.632 51.576 to 147.688 21.46
I-V pooled WMD 13.061 -9.200 to 35.322 100.00
Heterogeneity Chi² = 16.70 (df = 3) P = 0.001
I² (variation in WMD attributable to heterogeneity) = 82.0%
Test of WMD = 0: z = 1.15, P = 0.250
• We developed a health outcome, ’life years living at home’ (LYLAHs) after discharge from hospital, as a measure of independence and
well-being in an older population. LYLAHs were calculated from the IPD from two trials (Edmans 2013; Goldberg 2013) by dividing
the days living at home after hospital discharge for these two study populations by the study follow-up period. A meta-analysis using a
fixed-effect model was performed to estimate incremental LYLAHs. Results are presented in Supplementary Table 4.3.
102Comprehensive geriatric assessment for older adults admitted to hospital (Review)
Copyright © 2017 The Cochrane Collaboration. Published by John Wiley & Sons, Ltd.

Supplementary Table 4.3: Pooled estimate of incremental LYLAH
Study Weighted mean difference 95% confidence interval % weight
Edmans 2013 -0.005 -0.051 to 0.040 60.12
Saltvedt 2002 0.053 -0.003 to 0.109 39.88
I-V pooled WMD 0.018 -0.018 to 0.053 100.00
Heterogeneity Chi² = 2.48 (df = 1) P = 0.115
I² (variation in WMD attributable to heterogeneity) = 59.8%
Test of WMD = 0: z = 0.98, P = 0.325
Cost-effectiveness
A decision model was constructed in Excel to calculate the incremental cost-effectiveness ratio (ICER) of inpatient CGA compared
with inpatient care without CGA. The ICER was expressed as cost per QALY, cost per LY gained, and cost per LYLAH gained from the
NHS perspective (i.e. including only hospitalisation costs and costs of CGA delivery). The model was constructed to perform Monte
Carlo simulations based on predefined distributions of input parameters. The model incorporates information from hospital discharge
to the end of each trial’s follow-up period or death of patient (whichever comes first) and follows the patient’s pathway in terms of
residence during follow-up.
The summary estimate for the main outcome living at home at the end of follow-up of 3 to 12 months (RR 1.07, 95% CI 1.03 to
1.12) (Analysis 1.2) was used in the decision model. The RR was multiplied by the incremental LYLAH to adjust LYLAH with the
probability of living at home. We did not do this for life years gained, as the summary estimate (Analysis 1.4) (RR being dead at the
end of the follow-up period) was 1, and it would not be appropriate to adjust life years by the probability of death. Input parameters
used in these models are presented in Table 2. Uncertainty about input parameters of the model was addressed by performing 10,000
draws of all incremental cost and incremental health outcome parameters using prespecified distributions and recording incremental
costs, incremental QALYs, incremental LYs, and incremental LYLAHs from each draw. These results were plotted on cost-effectiveness
planes and cost-effectiveness acceptability curves to display uncertainty in the estimated ICERs.
Sensitivity analysis
Two univariate sensitivity analyses were performed for the cost-effectiveness analysis. In the first, we calculated incremental QALYs for
a more dependent population (mean Barthel Index of 9 at baseline) (Goldberg 2013; Somme 2010). In this sensitivity analysis, EQ-
5D-3L utilities were mapped to the Barthel Index using a formula provided in van Exel 2004; which was based on a more dependent
population of older people who were recovering from a stroke (also mean Barthel Index of 9 at baseline). A meta-analysis using a fixed-
effect model was performed to estimate (pooled) incremental QALYs based on the two trials. Results of this analysis are presented in
Supplementary Table 4.4.
Supplementary Table 4.4: Pooled estimate of incremental QALYs (severe patients)
103Comprehensive geriatric assessment for older adults admitted to hospital (Review)
Copyright © 2017 The Cochrane Collaboration. Published by John Wiley & Sons, Ltd.

Study Weighted mean difference 95% confidence interval % weight
Goldberg 2013 0.017 -0.031 0.065 96.09
Somme 2010 0.048 -0.190 0.286 3.91
I-V pooled WMD 0.018 -0.029 0.065 100.00
Heterogeneity Chi² = 0.06 (df = 1) P = 0.805
I² (variation in WMD attributable to heterogeneity) = 0.0%
Test of WMD = 0: z = 0.77, P = 0.441
In the second univariate sensitivity analysis, we used the summary estimate (Analysis 1.2.1) for delivering CGA only on a dedicated
ward (i.e. excluding CGA delivered by teams across wards) for the outcome living at home at the end of follow-up.
Appendix 3. Individual participant data analysis details
1) There were two randomisation groups in the Kircher dataset and one non-randomised external comparison group. The comparison
group was not used in our review.
2) There were three participants in the Kircher dataset with time to death recorded after follow-up. Of these three participants, one
was in the ‘comparison’ group and therefore not included in our analysis. For the other two, their status was updated to ‘alive’ for the
analysis.
3) There were two participants in Kircher with typos in the recording of date of death. These were treated as missing dates in the
analysis.
Appendix 4. GRADE evidence profile for preparing the summary of findings table
Comparison: CGA on a ward (need and age related admission) of older people vs inpatient care without CGA
Certainty assessment of evidence for each outcome
No. of studies Design Risk of bias Inconsistency Indirectness* Imprecision Other[†] Certainty
(overall score)[‡]
Outcome: Living at home (end of follow-up 3 to 12 months)
16 studies
N = 6799
RT
(4)
No serious risk
of bias
No serious in-
consistency
Direct measure No serious im-
precision
Little evidence
of small study
bias
(4) High cer-
tainty
Outcome: Mortality (end of follow-up 3 to 12 months)
104Comprehensive geriatric assessment for older adults admitted to hospital (Review)
Copyright © 2017 The Cochrane Collaboration. Published by John Wiley & Sons, Ltd.

(Continued)
21 studies
N = 10023
RT
(4)
No serious risk
of bias
No serious in-
consistency
Direct measure No serious im-
precision
Little evidence
of small study
bias
(4) High cer-
tainty
Outcome: Admission to a nursing home (end of follow-up 3 to 12 months)
14 studies
N = 6285
RT
(4)
No serious risk
of bias
No serious in-
consistency
Direct measure No serious im-
precision
Little evidence
of small study
bias
(4) High cer-
tainty
Outcome: Dependence
14 studies
N = 6551
RT
(4)
No serious risk
of bias
No serious in-
consistency
Direct measure No serious im-
precision
Little evidence
of small study
bias
(4) High cer-
tainty
Outcome: Cognitive function
5 studies
N = 3534
RT
(4)
No serious risk
of bias
-1.0 (serious in-
consistency)
SMDs used -1.0 (serious
imprecision)
Little evidence
of small study
bias
(3) Low cer-
tainty
Outcome: Length of stay
17 studies RT
(4)
No serious risk
of bias
-1.0 (serious in-
consistency)
Direct measure -1.0 (serious
imprecision)
Little evidence
of small study
bias
(2) Low cer-
tainty
Outcome: Cost-effectiveness
Hospitalisation costs based on length of stay data
17 studies RT
(4)
-1.0 (serious in-
consistency)
-1.0 (serious
imprecision)
(2) Low cer-
tainty
Outcome: Activities of daily living (ADL)
7 studies
N = 1445
RT
(4)
No serious risk
of bias
No serious in-
consistency
Direct measure -1.0 (serious
imprecision)
Little evidence
of small study
bias
(3) Moderate
certainty
Outcome: Re-admissions
13 studies
N = 6698
RT
(4)
No serious risk
of bias
No serious in-
consistency
Direct measure No serious im-
precision
Little evidence
of small study
bias
(4) High cer-
tainty
Footnotes:
RT: Randomised trial
Indirectness* includes consideration of
105Comprehensive geriatric assessment for older adults admitted to hospital (Review)
Copyright © 2017 The Cochrane Collaboration. Published by John Wiley & Sons, Ltd.

· Indirect (between-study) comparisons
· Indirect (surrogate) outcomes
· Applicability (study populations, interventions, or comparisons that are different from those of interest)
[†] Other considerations for downgrading include publication bias. Other considerations for upgrading include a strong association
with no plausible confounders, a dose-response relationship, and, if all plausible confounders or biases would decrease the size of the
effect (if there is evidence of an effect), or increase it if there is evidence of no harmful effect (safety)
[‡] 4 High = This research provides a very good indication of the likely effect. The likelihood that the effect will be substantially
different** is low.
3 Moderate = This research provides a good indication of the likely effect. The likelihood that the effect will be substantially different**
is moderate.
2 Low = This research provides some indication of the likely effect. However, the likelihood that it will be substantially different** is
high.
1 Very low = This research does not provide a reliable indication of the likely effect. The likelihood that the effect will be substantially
different** is very high.
W H A T ’ S N E W
Last assessed as up-to-date: 5 October 2016.
Date Event Description
7 December 2016 New citation required but conclusions have not
changed
We have added 7 new trials (3451 participants) to the
review. The review now includes 29 trials
This review now includes a fixed-effect logistic regres-
sion meta-analysis of individual participant data from
5 trials, a cost-effectiveness analysis, and a survey of
trialists. We have detailed changes in authorship and
methods used in ’Differences between protocol and re-
view’
7 December 2016 New search has been performed We conducted a new search in October 2016. We iden-
tified 7 new studies and included them in this review
H I S T O R Y
Protocol first published: Issue 4, 2006
Review first published: Issue 7, 2011
Date Event Description
12 November 2008 Amended Made minor changes
12 November 2008 Amended Converted to new review format
106Comprehensive geriatric assessment for older adults admitted to hospital (Review)
Copyright © 2017 The Cochrane Collaboration. Published by John Wiley & Sons, Ltd.

C O N T R I B U T I O N S O F A U T H O R S
GE conceived and wrote the original review and provided a clinical perspective, co-wrote and commented on drafts of the review, and
is a co-applicant on the NIHR grant (12/5003//01; “How to Implement Cost-Effective Comprehensive Geriatric Assessment”) that
supported this review update.
MG led the update of the review, read through titles and abstracts to identify studies for inclusion, extracted data from the included
studies, and contacted study authors for clarification and trialists to invite them to contribute their trial data and complete a survey.
MG set up the IPD database and cleaned the incoming data. MG updated the assessment of risk of bias of all 29 studies included in
the review, and produced the first draft for comment by coauthors.
OB, MG, AT, and SS wrote a detailed statistical plan of analysis for this update, which was peer reviewed. OB conducted statistical
analysis using IPD; MG conducted statistical analysis using published data for the meta-regression; and AT conducted the cost-
effectiveness analysis.
MG and GE agreed on studies for inclusion and extracted data.
MG, GE, and SS selected main outcomes, graded the certainty of evidence, and contacted trialists to invite them to join the review
group and contribute their trial data.
MG and SS generated the ’Summary of findings’ table.
SS is the CI for the NIHR grant (12/5003//01; “How to Implement Cost-Effective Comprehensive Geriatric Assessment”) that funded
the update of this review via IPD, a survey of trialists, and a cost-effectiveness analysis; she supervised the analysis, worked with MG
to produce the first draft of the update, revised subsequent drafts, and is the guarantor.
DS, HW, IS, RH, SC, and TK provided IPD and commented on a draft of the updated review.
D E C L A R A T I O N S O F I N T E R E S T
Graham Ellis: none known.
Mike Gardner: none known.
Apostolos Tsiachristas: none known.
Peter Langhorne: none known.
Orlaith Burke: none known.
Rowan H Harwood: trialist.
Simon P Conroy: trialist.
Tilo Kircher: trialist.
Dominique Somme: trialist.
Ingvild Saltvedt: trialist.
Heidi Wald: trialist.
Desmond O’Neill: none known.
David Robinson: none known.
Sasha Shepperd: none known.
107Comprehensive geriatric assessment for older adults admitted to hospital (Review)
Copyright © 2017 The Cochrane Collaboration. Published by John Wiley & Sons, Ltd.

S O U R C E S O F S U P P O R T
Internal sources
• No internal sources of support were sought, UK.
External sources
• NIHR, UK.
(12/5003//01; “How to Implement Cost-Effective Comprehensive Geriatric Assessment”)
D I F F E R E N C E S B E T W E E N P R O T O C O L A N D R E V I E W
In the previous version of the review (Ellis 2011), review authors used the odds ratio as a summary estimate; owing to the high number
of events, we have used the risk ratio in this update. We have accessed individual patient data (IPD; five studies) and have obtained
from the trialists additional details of delivery of the intervention. This has allowed us to estimate the cost-effectiveness of delivering
CGA.
For this update, MA Whitehead is no longer a co-review author. New review authors include Mike Gardner, Apostolos Tsiachristas,
Orlaith Burke, Heidi Wald, Rowan Harwood, Tilo Kircher, Dominique Somme, Ingvild Saltvedt, Simon Conroy, and Sasha Shepperd.
I N D E X T E R M S
Medical Subject Headings (MeSH)
∗Frail Elderly; ∗Hospitalization; ∗Outcome and Process Assessment (Health Care); Comprehensive Health Care [∗methods]; Emer-
gencies; Geriatric Assessment [∗methods]; Independent Living [statistics & numerical data]; Mortality
MeSH check words
Aged; Humans
108Comprehensive geriatric assessment for older adults admitted to hospital (Review)
Copyright © 2017 The Cochrane Collaboration. Published by John Wiley & Sons, Ltd.