lrl economic impact rcc oct 09
TRANSCRIPT

US Army Corps of Engineers
BUILDING STRONG®
Economic Impact of the Louisville District
COL Keith Landry, PhD, PECommanderLouisville DistrictUS Army Corps of Engineers
5 October 2009

BUILDING STRONG®FY 08
Bottom Line Up Front
USACE projects are value added► Benefits to the nation exceed costs to taxpayers► Infuse investment in the projects’ regions► Corps sustained economic output and savings totaled to $7.2 B
• Over 5.6 times LRL’s operating budget of $1.28 B• Provides 35,000 jobs
Economic models that fully account for effects of Navigation and Flood Risk Management projects are forthcoming
► Navigation model expected in December of 2009► FRM model anticipated late 2010 / early 2011

BUILDING STRONG®FY 08
Who We Serve

BUILDING STRONG®FY 08
LRL Projects
Operates 16 Locks & 8 waterway dams on OR Implemented 65 flood risk management systems $927M in Construction 18 million (+) recreation visits $375.5M spent within 30 miles of sites Directly employed 1,100 workers
► $80M in employee compensation

BUILDING STRONG®FY 08
LRL’s Impact on the Nation
$2,855.92**Navigation
$601.88**FRM
35,111*
870
9,807
2,173
22,261
Jobs Supported
$7,284.34*
$122.45
$643.94
$263.81
$2,796.34
Economic Impact (millions)Category
ConstructionEmployee
Compensation
Recreation
O&M
TOTAL*Reported Navigation and FRM figures are economic savings estimates. Economic models are being revised to account for the multiplier effects of navigation and FRM benefits. This current analysis should be considered a lower bound estimate of LRL’s impact.

BUILDING STRONG®FY 08
“Economic Impact” Defined
Expenditure categories account for economic output generated or supported by Corps spending; project benefit categories are in terms of efficiency savings and prevented flood damages.
Jobs – employees of Corps, project beneficiaries, suppliers, sustained by recreation sites, etc.

BUILDING STRONG®FY 08
Taylorsville Lake, KY
€
IL
IN OH
KY
Louisville
T
T
TT
12
OLMSTED L&D
MARKLAND L&D
JOHN T. MYERS
SMITHLAND L&D
OHIO
RIV
ER
RIV
ER
L&D 53 T
L&D
NEWBURGH L&DCANNELTONMcALPINE L&DW
AB
AS
H
L&D 52
TTTT
T
T

BUILDING STRONG®FY 08
Impact of Taylorsville Lake
Multipurpose lake project ►Flood Risk Reduction / Recreation / Water
Quality
796,893 visits to the Corps lake in FY 08►Average spending of $20.99 per visit
$11M (+) spent within 30 miles of the lake
BUILDING STRONG®FY 08
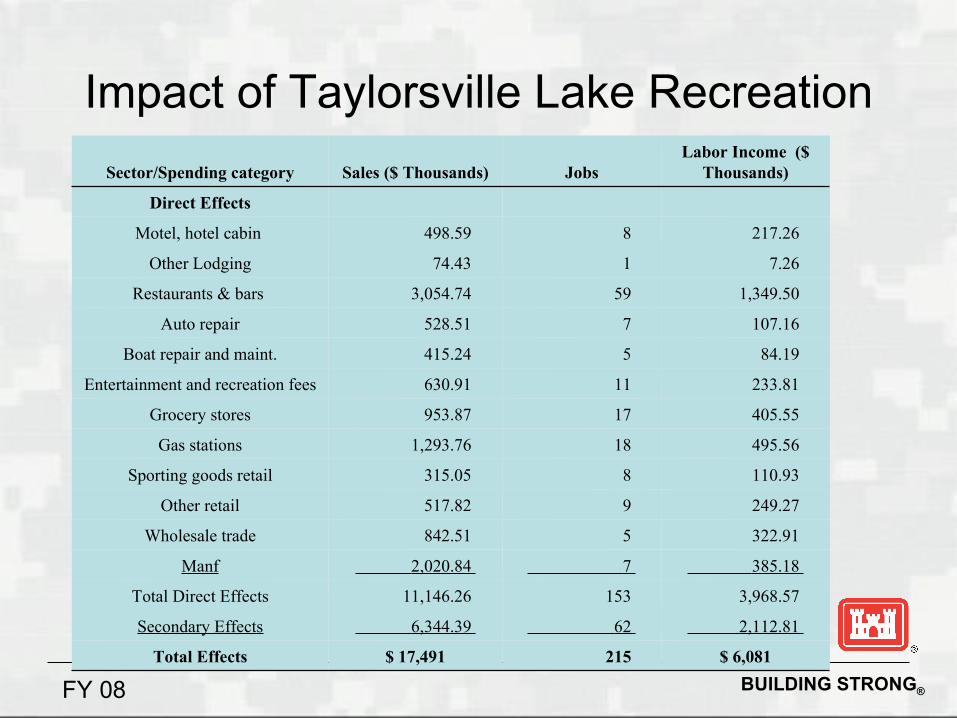
Impact of Taylorsville Lake Recreation
$ 6,081 215 $ 17,491Total Effects
2,112.81 62 6,344.39 Secondary Effects
3,968.57 153 11,146.26 Total Direct Effects
385.18 7 2,020.84 Manf
322.91 5 842.51 Wholesale trade
249.27 9 517.82 Other retail
110.93 8 315.05 Sporting goods retail
495.56 18 1,293.76 Gas stations
405.55 17 953.87 Grocery stores
233.81 11 630.91 Entertainment and recreation fees
84.19 5 415.24 Boat repair and maint.
107.16 7 528.51 Auto repair
1,349.50 59 3,054.74 Restaurants & bars
7.26 1 74.43 Other Lodging
217.26 8 498.59 Motel, hotel cabin
Direct Effects
Labor Income ($ Thousands)JobsSales ($ Thousands)Sector/Spending category

BUILDING STRONG®FY 08
Impact of Taylorsville Lake
215$17.49321$26.11Recreation
6$.7711$1.56O&M
Category
National Economic Impact $M
National Jobs
Supported
Regional Economic Impact $M
Regional Jobs
Supported
Construction $.09 1 $.05 1Employee
Compensation $1.03 11 $.42 9
FRM $10.55* * $10.55* *
Total 39.34* * $32.29* 231*
*Complete multiplier and job effects are not yet available for this category

BUILDING STRONG®FY 08
FRM Benefits Nationwide

BUILDING STRONG®FY 08
Impact of Ft. Knox

BUILDING STRONG®FY 08
Impact of Ft. Knox
$186.5M of construction activity 19 Projects
►Includes the Human Resource Center of Excellence
Ft. Knox’s area offices employ 45►$3M (+) in compensation
BUILDING STRONG®FY 08
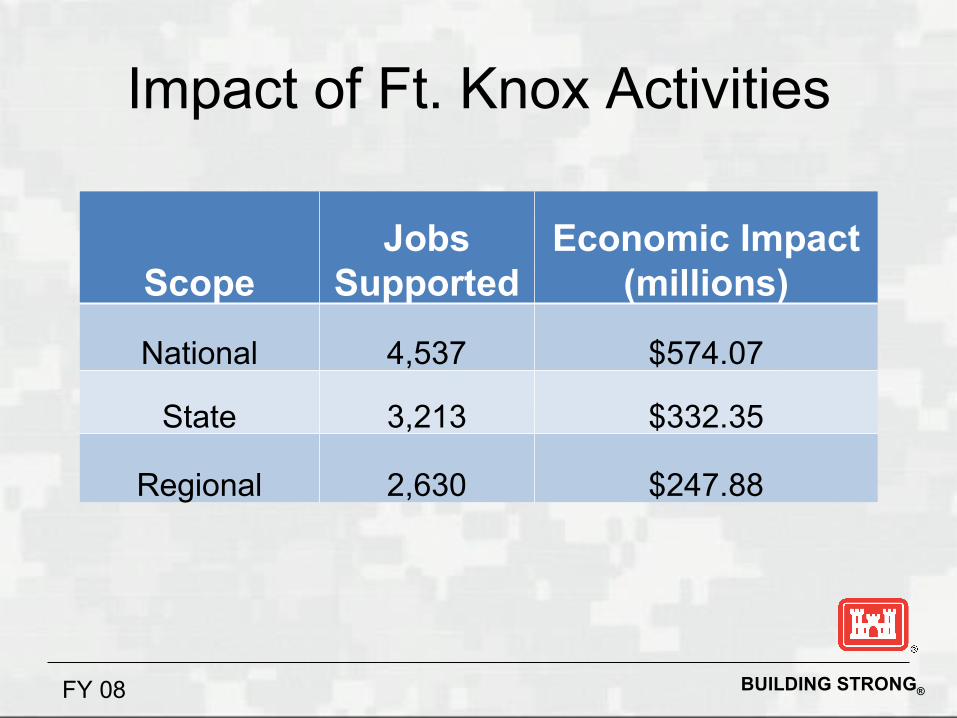
Impact of Ft. Knox Activities
ScopeJobs
SupportedEconomic Impact
(millions)
National 4,537 $574.07
State 3,213 $332.35
Regional 2,630 $247.88

BUILDING STRONG®FY 08
Impact of Wright-Patterson AFB
BUILDING STRONG®FY 08
Impact of Wright-Patterson AFB
$44M of construction activity►16 Projects►Includes BRAC facility upgrades
Wright Patterson offices employ 30►$2M (+) in compensation

BUILDING STRONG®FY 08
Impact of Wright-Patterson AFB
ScopeJobs
SupportedEconomic Impact
(millions)
National 1,116 $139.73
State 796 $80.09
Regional 719 $70.84

BUILDING STRONG®FY 08
Impact of Scott AFB

BUILDING STRONG®FY 08
Impact of Scott AFB
$34M of construction activity►10 Projects►Includes construction of Airman’s Dormitory
Scott project office employs 11►$1M in compensation

BUILDING STRONG®FY 08
Impact of Scott AFB
ScopeJobs
SupportedEconomic Impact
(millions)
National 856 $106.87
State 608 $61.60
Regional 499 $45.88

BUILDING STRONG®FY 08
Impact of Fort Campbell
BUILDING STRONG®FY 08
Impact of Fort Campbell
$158M of construction activity►33 Projects►Includes Second Brigade Combat Team
Complex
Fort Campbell project office employs 53►$3M in compensation

BUILDING STRONG®FY 08
Impact of Fort Campbell
ScopeJobs
SupportedEconomic Impact
(millions)
National 3,822 $488.56
State 2,753 $282.36
Regional 2,255 $210.49
BUILDING STRONG®FY 08
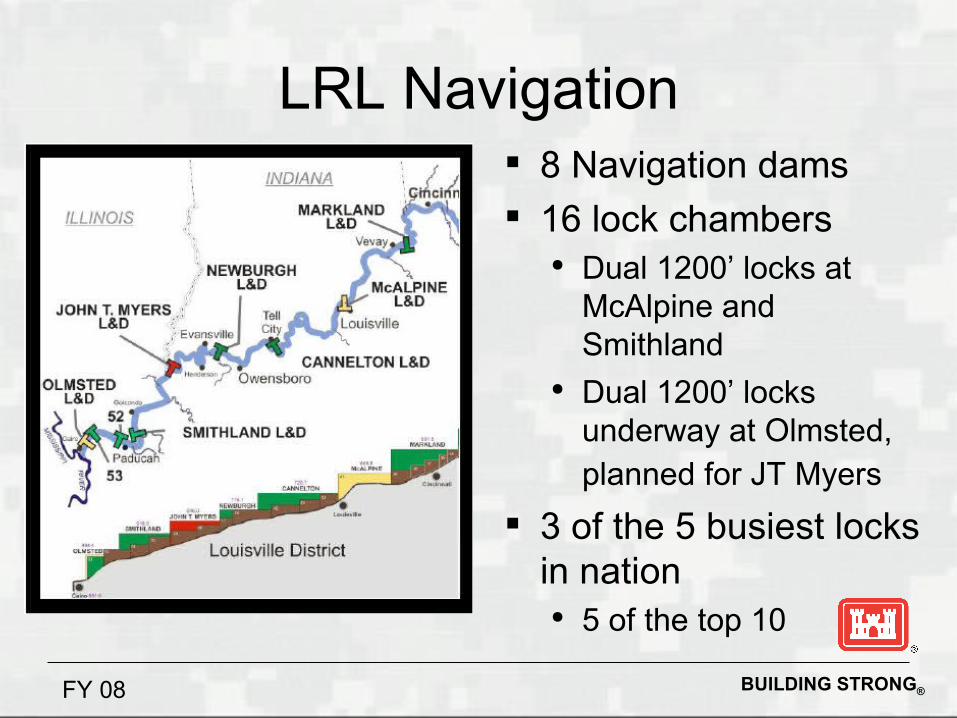
LRL Navigation 8 Navigation dams 16 lock chambers
● Dual 1200’ locks at McAlpine and Smithland
● Dual 1200’ locks underway at Olmsted, planned for JT Myers
3 of the 5 busiest locks in nation● 5 of the top 10

BUILDING STRONG®FY 08
LRL Navigation
1313McAlpine L/D
42L/D 5211L/D 53
76Newburgh L/D 67J.T. Myers L/D 53Smithland L/D
L/D Tonnage Rank Savings Rank
Cannelton L/D 12 12
Markland L/D 17 15
Ranked against 171 Lock and Dam project in the US
Inland Navigation Lock Projects: Estimations of Value and Main Chamber Closure Costs. Prepared by Navigation Economic PDT

BUILDING STRONG®FY 08
Navigation Benefits
Increased transportation efficiency► Reduces operating costs for private businesses
• Average savings of $17 per ton using LRL waterways versus alternative means of transportation
Benefits passed onto consumers and back to producers► More coal, cheaper coal, lower energy bills
Fuel tax puts much of the cost of waterway navigation on those who benefit most
► Deposited into fund that pays for half of infrastructure improvements
► Encourages efficient use of waterway system

BUILDING STRONG®FY 08
Navigation Benefits
Weighted Average
Other
Iron & Steel
Ores & Minerals
Chemicals
Grains
Aggregates
Petrol
Coal
Commodity
$17.05
$26.12
$33.77
$30.03
$50.32
$15.08
$11.25
$28.75
$8.16
Average Savings Per Ton
Savings from using LRL waterways versus next best transportation option

BUILDING STRONG®FY 08
Navigation Benefits
More efficient transportation reduces traffic and pollution► 14.2 million metric tons less of CO2 emissions nationwide in
2005 than if trucks had been used► Equivalent to removing 2,730,769 cars from the road► Or, 2.1 million metric tons fewer than if trains were used;
403,846 cars Carefully selected and timed dredging minimizes impact
on marine species► Dredged materials can be used to create new animal habitat
Hydroelectricity plants on Corps dams provide green energy alternative
► Two are located at LRL dams with two more under construction

BUILDING STRONG®FY 08
Navigation Benefits

BUILDING STRONG®FY 08
Transportation Efficiency

BUILDING STRONG®FY 08
Olmsted Locks and Dam
€
IL
INOH
KY
Louisville
T
T
TT
1
2
OLMSTED L&D
MARKLAND L&D
JOHN T. MYERS
SMITHLAND L&D
OHIO
RIV
ER
RIV
ER
L&D 53 T
L&D
NEWBURGH L&DCANNELTON McALPINE L&DW
AB
AS
H
L&D 52
TTT
T
T
T

BUILDING STRONG®FY 08
Olmsted Locks and Dam
Total construction cost exceeds $2 Billion► Benefit-Cost ratio of 11.6
Will Replace L/D 53 and L/D 52► L/D 53 average annual non-additive savings are
$1,139,346,000► More annual savings than any other USACE lock; L/D
52 is fourth in the US► Temporary locks built in 1969 and 1979 have
significantly exceeded their 15 year design life► Replacement will reduce delays and ensure pool
longevity

BUILDING STRONG®FY 08
Impact of Olmsted Locks & Dam
Category
National Economic
Impact
National Jobs
Supported
Regional Economic
Impact
Regional Jobs
Supported
Construction $280.44 2,215 $60.20 724
Employee Compensation $7.23 48 $.69 31
Total $287.67 2,263 $60.89 755

BUILDING STRONG®FY 08
McAlpine Locks & Dam
€
IL
IN OH
KY
Louisville
T
T
TT
12
OLMSTED L&D
MARKLAND L&D
JOHN T. MYERS
SMITHLAND L&D
OHIO
RIV
ER
RIV
ER
L&D 53 T
L&D
NEWBURGH L&DCANNELTONMcALPINE L&DW
AB
AS
H
L&D 52
TTT
T
T
T

BUILDING STRONG®FY 08
Impact of McAlpine L&D
Recently completed $429M expansion► Benefit-Cost ratio of 2.8
28 employees work at McAlpine► Over $2.3M in compensation
Pool provides recreation opportunities to over 100,000 annual visitors► Spending roughly $2M in the region
Average non-additive annual transportation savings of $657,667,000► 13th most savings of any US lock

BUILDING STRONG®FY 08
Impact of McAlpine L&D
36$2.9453$4.32Recreation
****Navigation
11$1.3520$2.76O&M
Category
National Economic
Impact
National Jobs
Supported
Regional Economic
Impact
Regional Jobs
Supported
Construction $105.4 833 $61.4 587Employee
Compensation $6.89 52 $2.84 44
Total $119.38* 957* $68.53* 678*
*Complete multiplier and job effects are not yet available for this category
BUILDING STRONG®FY 08
Impact of McAlpine L&D
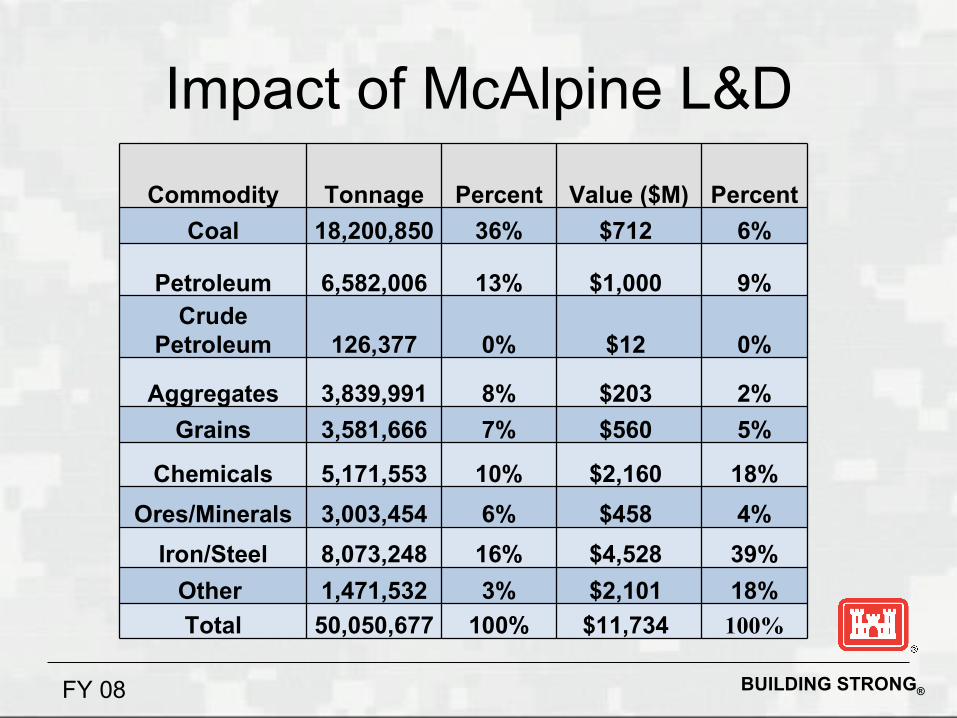
100%
18%
39%
4%
18%
5%
2%
0%
9%
6%
PercentCommodity Tonnage Percent Value ($M)
Coal 18,200,850 36% $712
Petroleum 6,582,006 13% $1,000 Crude
Petroleum 126,377 0% $12
Aggregates 3,839,991 8% $203
Grains 3,581,666 7% $560
Chemicals 5,171,553 10% $2,160
Ores/Minerals 3,003,454 6% $458
Iron/Steel 8,073,248 16% $4,528
Other 1,471,532 3% $2,101
Total 50,050,677 100% $11,734

BUILDING STRONG®FY 08
Top Congressional Districts Receiving Through McAlpine

BUILDING STRONG®FY 08
Top Congressional Districts Shipping Through McAlpine

BUILDING STRONG®FY 08
LRL’s Impact on the Louisville Metropolitan Statistical Area
The region receives benefits from seven flood risk management projects
► Including Taylorsville Lake and several local protection projects► Nearly $13M of damages were prevented
Ships or receives 7 million tons of goods through LRL navigation works
More than $68M spent staffing and maintaining local activities

BUILDING STRONG®FY 08
LRL’s Impact on the Louisville Metropolitan Statistical Area
$20.43251Recreation
$12.95**FRM**Navigation
$5.1743O&M
Category Jobs SupportedEconomic Impact
(millions)
Construction 3,262 $318.61Employee
Compensation 1,247 $71.59
Total 4,803* $428.75**Complete multiplier and job effects are not yet available for this category

BUILDING STRONG®FY 08
LRL’s Impact on Cincinnati Metropolitan Statistical Area
The region receives benefits from nine flood risk management projects►Newport, Covington, Cincinnati, Mill Creek►$56M in prevented damages
Ships or receives 14 million tons of goods through LRL navigation works
More than $4M spent staffing and maintaining local projects

BUILDING STRONG®FY 08
LRL’s Impact on Cincinnati Metropolitan Statistical Area
$51.75605Recreation
$56**FRM**Navigation
$7.8266O&M
CategoryJobs
SupportedEconomic
Impact (millions)
Construction 67 $6.8Employee
Compensation 49 $1.32
Total 786* $123.69**Complete multiplier and job effects are not yet available for this category

BUILDING STRONG®FY 08
LRL’s Impact on KY-02
$189M in construction spending► Fort Knox
$146M in spending by visitors to Corps Lakes The region receives benefits from six flood risk
management projects► Including Taylorsville Lake and Barren River Lake► $28.5M in prevented damages
Ships or receives 11 million tons of goods through LRL navigation works
More than $13M spent staffing and maintaining regional projects
BUILDING STRONG®FY 08
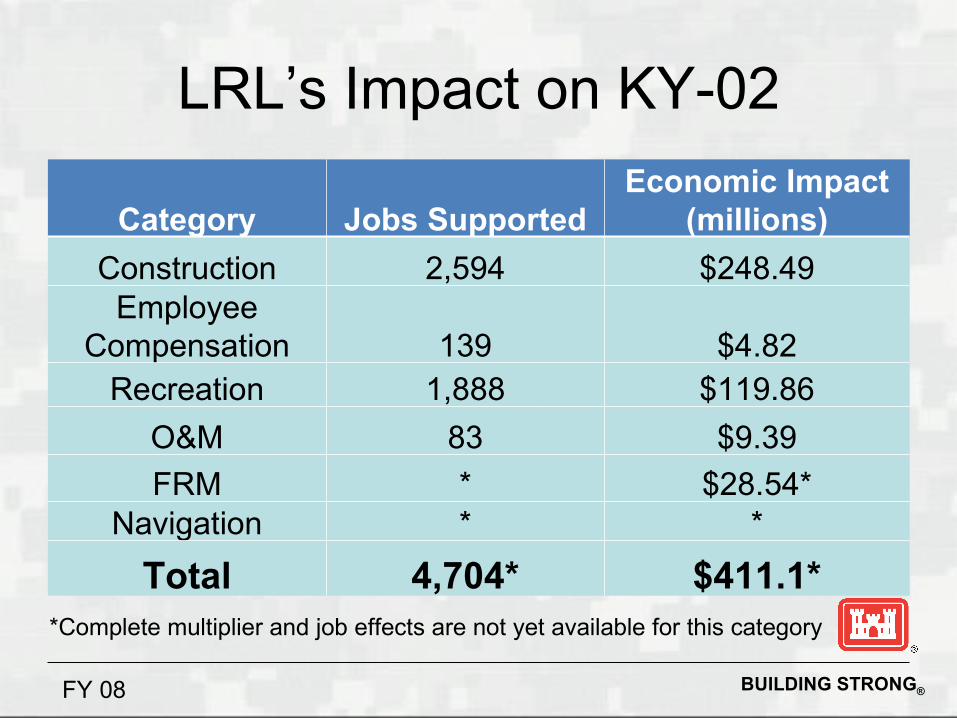
LRL’s Impact on KY-02
$119.861,888Recreation
$28.54**FRM**Navigation
$9.3983O&M
Category Jobs SupportedEconomic Impact
(millions)
Construction 2,594 $248.49Employee
Compensation 139 $4.82
Total 4,704* $411.1**Complete multiplier and job effects are not yet available for this category

BUILDING STRONG®FY 08
LRL’s Impact on the Commonwealth of KY
LRL builds and maintains dozens of projects across the Commonwealth►Over 125 construction projects in FY 08
totaled $410M in expenditures►Buoyed by its Louisville presence, the Corps
directly employed 930 workers• $67M in compensation outlays
►Serviced by 16 FRM systems, 12 recreation sites, 16 Lock chambers

BUILDING STRONG®FY 08
LRL’s Impact on the Commonwealth of KY
$57.34**FRM
24.91207O&M
**Navigation
CategoryJobs
SupportedEconomic Impact
(millions)
Construction 6,853 $711.12Employee
Compensation 1,500 $88.26
Recreation 4,588 $282.24
Total 13,149* $1,163.87**Complete multiplier and job effects are not yet available for this category
BUILDING STRONG®FY 08
LRL’s Impact on the Commonwealth of KY
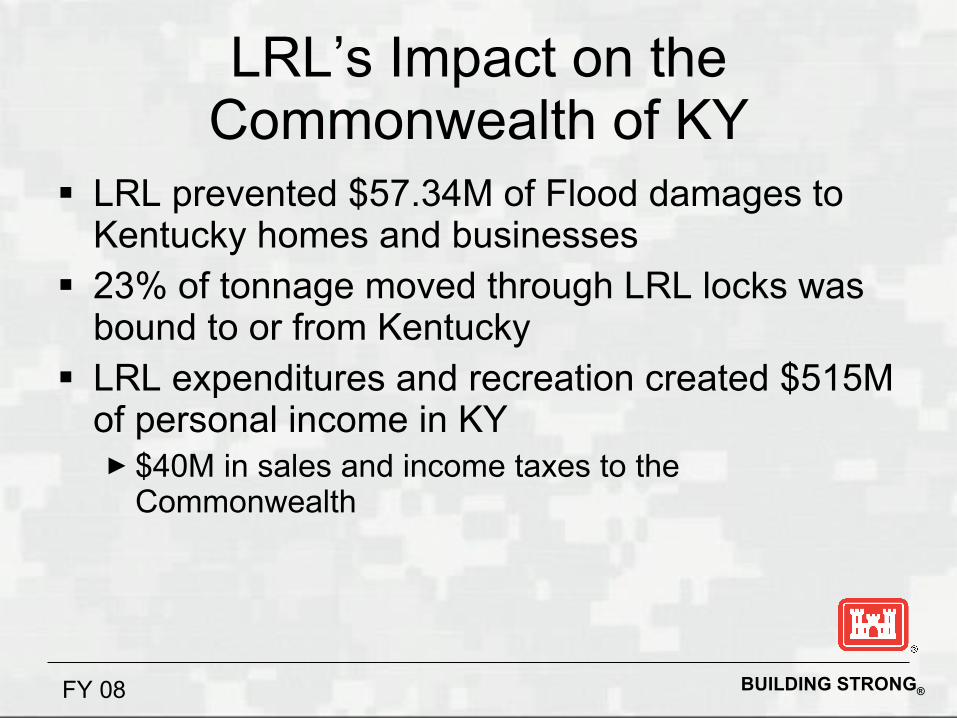
LRL prevented $57.34M of Flood damages to Kentucky homes and businesses
23% of tonnage moved through LRL locks was bound to or from Kentucky
LRL expenditures and recreation created $515M of personal income in KY► $40M in sales and income taxes to the
Commonwealth
BUILDING STRONG®FY 08
LRL’s Impact on the Commonwealth of KY
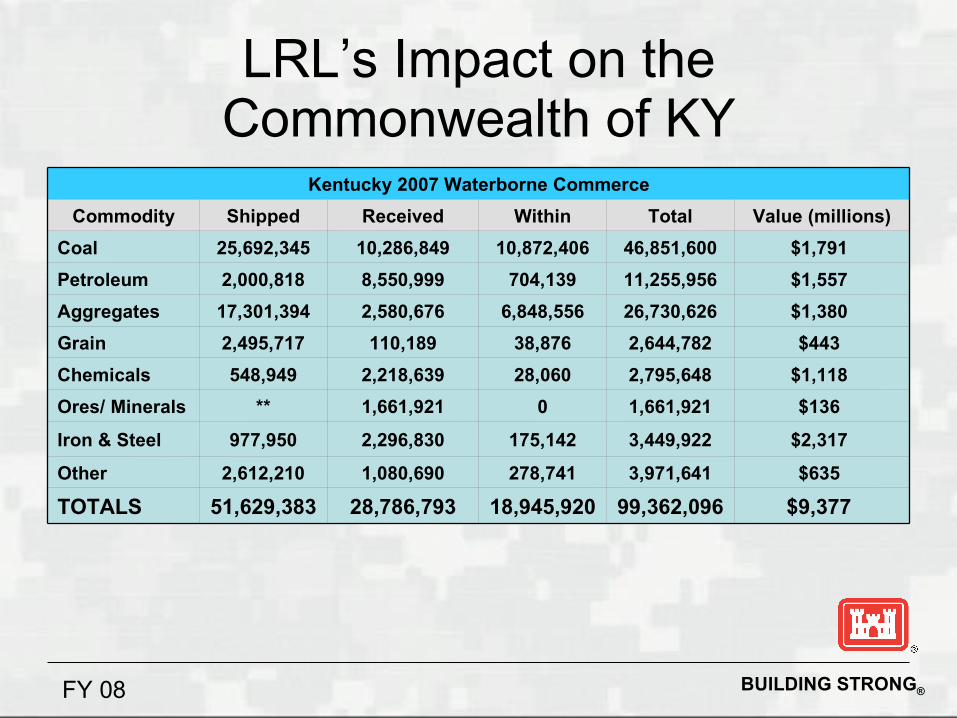
$9,377 99,362,09618,945,92028,786,79351,629,383TOTALS
$635 3,971,641278,7411,080,6902,612,210Other
$2,317 3,449,922175,1422,296,830977,950Iron & Steel
$136 1,661,92101,661,921**Ores/ Minerals
$1,118 2,795,64828,0602,218,639548,949Chemicals
$443 2,644,78238,876110,1892,495,717Grain
$1,380 26,730,6266,848,5562,580,67617,301,394Aggregates
$1,557 11,255,956704,1398,550,9992,000,818Petroleum
$1,791 46,851,60010,872,40610,286,84925,692,345Coal
Value (millions)TotalWithinReceivedShippedCommodity
Kentucky 2007 Waterborne Commerce

BUILDING STRONG®FY 08
Value of Commodities

BUILDING STRONG®FY 08
Conclusions
Even without FRM and Navigation multiplier effects, the results show LRL has a large impact on local and national economies
LRL navigation produces considerable economic savings
► Completion of current modernization will ensure benefits do not erode due to aging locks and dams
FRM reduces flood damages to families and businesses► Multipurpose lakes also provide recreation opportunities
Military construction supports national defense while adding a significant number of jobs to local communities
Federally induced output buttresses regional economies