lqt-de003 guidelines on represemtative drug sampling
TRANSCRIPT

7/30/2019 LQT-De003 Guidelines on Represemtative Drug Sampling
http://slidepdf.com/reader/full/lqt-de003-guidelines-on-represemtative-drug-sampling 1/60
EUROPEAN NETWORK OF FORENSIC SCIENCE INSTITUTES
DRUGS WORKING GROUP
GUIDELINES ON REPRESENTATIVE
DRUG SAMPLING

7/30/2019 LQT-De003 Guidelines on Represemtative Drug Sampling
http://slidepdf.com/reader/full/lqt-de003-guidelines-on-represemtative-drug-sampling 2/60

7/30/2019 LQT-De003 Guidelines on Represemtative Drug Sampling
http://slidepdf.com/reader/full/lqt-de003-guidelines-on-represemtative-drug-sampling 3/60
EUROPEAN NETWORK OF FORENSIC SCIENCE INSTITUTES
DRUGS WORKING GROUP
GUIDELINES ON REPRESENTATIVE
DRUG SAMPLING

7/30/2019 LQT-De003 Guidelines on Represemtative Drug Sampling
http://slidepdf.com/reader/full/lqt-de003-guidelines-on-represemtative-drug-sampling 4/60

7/30/2019 LQT-De003 Guidelines on Represemtative Drug Sampling
http://slidepdf.com/reader/full/lqt-de003-guidelines-on-represemtative-drug-sampling 5/60
Index
Foreword 4
Chapter 1 - Introduction 6
Chapter 2 - Definitions 8
Chapter 3 - Representative sampling techniques 10
Chapter 4 - Arbitrary sampling 12
Chapter 5 - Statistical sampling methods 14
Chapter 6 - Considerations and recommendations 30
Chapter 7 - Estimation of weight 38
List of contributors 42
References 44
Appendix A - List of tables 46
List of figures 47
Appendix B - Software instructions 48
Appendix C - Executive summary presented as
an advice to PCWG 2003 52
Appendix D - Abbreviations 56
THIS DOCUMENT INCLUDES A MACRO FOR CALCULATIONS
(file ENFSI Sampling Software Version 1_7 date 230204;
latest version available via website www.ENFSI.org)

7/30/2019 LQT-De003 Guidelines on Represemtative Drug Sampling
http://slidepdf.com/reader/full/lqt-de003-guidelines-on-represemtative-drug-sampling 6/60
In the ENFSI Working Group (WG) Drugs, quality assurance (QA) and best
practice are important topics. QA is an extensive field where a lot of
documentation and various guidelines are already available. For this
reason, the WG Drugs meeting in Krakow in 2000 decided to focus on a
number of other topics that were more or less specific for the WG Drugs.
So far, two targets were chosen, the first one being sampling (sampling
strategy), the second one being drugs reference compounds.
In the Madrid meeting of 2001, many members of the WG showed their
interest and offered help with the realisation of a manual or a discussion
document on sampling. Out of these members the steering committee
composed a subcommittee with - for practical reasons - a limited number
of colleagues. The composition was such that members had own practical
experience with at least one of the sampling methods. A first draft was
sent in March 2002 by email and presented in May 2002 at the WG
meeting in Oslo. The comments, discussions and responses resulted inthe document that is presented here and was adopted at
the ENFSI WG Drugs meeting in Istanbul 2003.
The primary task of the subcommittee was to identify and describe
common sampling procedures. From this, a discussion could be initiated
whether there was a sampling method that was superior to the other
ones. In the meantime it became clear that a mere collection of possible
sampling strategies was not sufficient. So, on the EU level a samplingproposal was submitted by the Spanish presidency (2002) to the Drugs
Trafficking Working Party; it comprised the use of an arbitrary sampling
method as the EU standard; later the proposal was extended with
another (different) method. Since ENFSI’s Working Group Drugs was
working on sampling, the discussion of the proposal was postponed.
From that time on, there seemed parallel lines between the development
of the ENFSI sampling document and an ENFSI advice on sampling to the
Police Co-operation Working Group (PCWG). During the Greek presidency an ENFSI advice on this matter was urgently requested, as decisions had
to be made by June 2003.
EUROPEAN NETWORK OF FORENSIC SCIENCE INSTITUTES - DRUGS WORKING GROUP
Foreword
4

7/30/2019 LQT-De003 Guidelines on Represemtative Drug Sampling
http://slidepdf.com/reader/full/lqt-de003-guidelines-on-represemtative-drug-sampling 7/60
The WG steering committee was pleased to have, as requested, the draft
sampling document (except foreword and introduction) ready in spring
2003. This document formed the basis of the advice, which was
formulated and accepted by both the sampling subcommittee and the WG steering committee. The (draft) document and the advice were
presented by the WG’s chairman to the PCWG on June 17th 2003 in
Brussels. In the course of the year 2003 the introduction,
the foreword and the computer programs were added and some text
corrections were made. This version and the slightly reformulated
sampling advice was approved by the ENFSI board on November 21-22nd
and sent to the PCWG, followed by a presentation on Dec 4th, 2003 in
Brussels.
The steering committee is proud of the realisation of this sampling
document.
We wish to express our thanks to the chairperson and members of the
subcommittee on sampling for their excellent work.
The ENFSI WG Drugs,
Dr Henk Huizer
(Chairperson 2000-2002)
Dr Erkki Sippola
(Chairperson 2002-)
GUIDELINES ON REPRESENTATIVE DRUG SAMPLING - FOREWORD
5

7/30/2019 LQT-De003 Guidelines on Represemtative Drug Sampling
http://slidepdf.com/reader/full/lqt-de003-guidelines-on-represemtative-drug-sampling 8/60
The sampling document describes a number of sampling methods,
from arbitrary methods to methods with a statistical background.
The document focuses on sampling in cases where large numbers of
relatively homogeneous material are available. It does not deal with
so-called tactical sampling, which may be applied for house-searches or
in clandestine laboratory investigations. These cases are characterised by
different materials, sometimes in different amounts, different packages
and/or sometimes with different suspects; these cases are considered asso specific and so dependent on the situation (also in legal aspects) that
a guideline would be inadequate in many cases. Thus, the document
contains a number of sampling strategies for cases with large numbers of
items of relatively homogeneous material. However, from the descriptions
of the sampling methods, it is not automatically clear which strategy
should be preferred (or would be optimum). This is mainly due to the fact
that it is not possible to define a sampling strategy, if the requirements
have not been defined. This is the main reason why it was decided torefrain from giving advice at local, regional or national level.
ENFSI cannot give such a fine-tuned advice as is possible in a specific
agreement between prosecutor, police, and chemist and laboratory
management.
However, at the EU level, an advice was requested and the steering
committee felt that if one group were competent to produce one, it
would be the ENFSI WG Drugs. The resulting advice for internationalcases is mainly based on a number of aspects, which are discussed in the
chapter ‘Considerations and Recommendations’. Here, the advantages
and disadvantages of various methods, also in relation with sampling
practice, are brought up. It seems that a Bayesian approach is a
reasonable one in many cases, but its complexity might be a major
drawback, especially for court. Luckily enough, the hypergeometric and
Bayesian approaches appear to show more or less the same results in
cases where no prior probability is used.
EUROPEAN NETWORK OF FORENSIC SCIENCE INSTITUTES - DRUGS WORKING GROUP
Chapter 1
Introduction
6

7/30/2019 LQT-De003 Guidelines on Represemtative Drug Sampling
http://slidepdf.com/reader/full/lqt-de003-guidelines-on-represemtative-drug-sampling 9/60
Since sampling is often carried out by police and customs, we did not
want to give an advice where the number of samples must be calculated
for each separate case; this would be confusing and bother them with
computers or lists with Bayesian and hypergeometric tables. Thereforethe final sampling advice just mentions the (minimum) number of samp-
les to be taken (5, 8 or 11, the number of samples being dependent on the
circumstances). The forensic laboratory can then,
if necessary, perform the final evaluation and probability calculations.
The subcommittee on sampling has studied and considered sampling
procedures and drafted and finalised this document. But also many other
members and steering committee members have contributed either by their written response or comments in any other form; their suggestions
and support were a fruitful input for the subcommittee. We wish to
express our thanks to the contributors and their laboratory management.
We are convinced that the members of the ENFSI WG Drugs and other
colleagues working in the field of drug analysis will benefit from this
work; it provides them with a reference on which they can develop an
appropriate good working practice.
Dr. Sergio Schiavone
Chairperson of the Sampling Subcommittee
November 2003
GUIDELINES ON REPRESENTATIVE DRUG SAMPLING - CHAPTER 1 INTRODUCTION
7

7/30/2019 LQT-De003 Guidelines on Represemtative Drug Sampling
http://slidepdf.com/reader/full/lqt-de003-guidelines-on-represemtative-drug-sampling 10/60
1. Seizure
The entire quantity of items seized. This may consist of a single
population or a number of populations.
2. Population
The collection of items under discussion. A population may be real or
hypothetical; finite or infinite; homogeneous or heterogeneous.
For the purposes of this booklet, the term population will refer to a real,finite homogeneous population unless otherwise specified.
3. Package
A container for a single unit, a number of units or a number of other
sub-packages.
4. Unit
A single individual element of a population (e.g. a single tablet or a singlepackage containing powder etc.).
5. Sample
A unit or a number of units selected from a population.
6. Mean
This is the average value of a set of measurements. The mean can refer to
either:(i) The arithmic mean of a population. This is the true mean calculated
from the entire population.
It is denoted by
or
(ii) The arithmetic mean of a sample. This is an estimate of calculated
from a sample of the population.
It is denoted by X
Unless otherwise stated, the term ‘mean’ will refer to the arithmetic
mean of a sample as described in 6 (ii).
EUROPEAN NETWORK OF FORENSIC SCIENCE INSTITUTES - DRUGS WORKING GROUP
Chapter 2
Definitions
8

7/30/2019 LQT-De003 Guidelines on Represemtative Drug Sampling
http://slidepdf.com/reader/full/lqt-de003-guidelines-on-represemtative-drug-sampling 11/60
7. Standard Deviation
This is a measure of the variation in the values of a set of measurements.
The standard deviation can refer to either:
(i) The standard deviation of a population. This is the true standarddeviation calculated from the entire population.
It is denoted by
or
(ii) The standard deviation of a sample. This is an estimate of calculated
from a sample of the population.
It is denoted by s
Unless otherwise stated, the term ‘standard deviation’ will refer to thestandard deviation of a sample as described in 7 (ii).
Symbols
P = probability
N = population size
N 1 = number of positives in the population
n = sample size
X = number of positives in the samplex = the value of number of positives in the sample
r = n – x = the value of the number of negatives in the sample
= proportion of positives in the population
K = threshold number of positives guaranteed in the population
k = K/N = ratio of positives guaranteed in the population
␣ = threshold index for evaluation of confidence
(1 – ␣ )*100% = confidence level
a = first parameter of beta functionb = second parameter of beta function
Y = number of positives in the unexamined units
= the arithmetic mean in the population
X = the arithmetic mean in the sample
= the standard deviation in the population
s = the standard deviation in the sample
w = the total weight in the sample
W = total estimated weight in the population P corr = correction factor in weight estimation
Q corr = correction factor in weight estimation
GUIDELINES ON REPRESENTATIVE DRUG SAMPLING - CHAPTER 2 DEFINITIONS
9
O– = N 1 N

7/30/2019 LQT-De003 Guidelines on Represemtative Drug Sampling
http://slidepdf.com/reader/full/lqt-de003-guidelines-on-represemtative-drug-sampling 12/60
A representative sampling procedure can be performed on a population
of units with sufficient similar external characteristics (e.g. size, colour).
The decision on how to perform it is left to the discretion of the
examiner. An example about what is meant by similar external
characteristics is very important. Considering a group of heroin street
doses, which are packed in similar packaging, we can apply a sampling
rule to this population. So, if you have 100 street doses with different
groups of external characteristics, you have to separate your 100 streetdoses in as many groups as dissimilarities. Each group will be considered
as a whole population and will be sampled alone. In some rare cases,
although the external characteristics look the same, when we open
the units (sampling), we may notice huge differences in the powder
appearance among the units. In this case, you have to stop the sampling
procedure according to the above mentioned criteria. In general it
happens when you don’t look thoroughly at the external characteristics
of the packages.
The theoretical way to select a truly random, unbiased representative
sample from a population is to individually number each item in the
population and then use a random number generator to choose which
item to select. This is not possible in practice, especially not for large
populations containing many thousands of units.
When sampling, we must ensure that two principles are maintained:
1. the properties of the sample are a true reflection of the properties of the population from which the samples were taken.
2. each unit in the population has an equal chance of being selected.
In reality, it is more difficult to adhere to these principles than it first
seems. As was mentioned before, the decision in selecting the samples is
left to the discretion of the examiner because, when the population is
high, it is impossible to number all the units and use a protocol based on
a random selection of numbers. So, considering a subjective choice,
it happens that sometimes the expert tends to choose similar sized units,instead of running a real random sampling.
EUROPEAN NETWORK OF FORENSIC SCIENCE INSTITUTES - DRUGS WORKING GROUP
Chapter 3
Representative sampling techniques
10

7/30/2019 LQT-De003 Guidelines on Represemtative Drug Sampling
http://slidepdf.com/reader/full/lqt-de003-guidelines-on-represemtative-drug-sampling 13/60
The practical solution is quite easy: after having observed that the
external characteristics are the same, you can put all the units in a “black
box” (plastic bag or any other idea) and take out your sample without
choosing. This kind of solution can be applied to practical cases such asseizures of a thousand heroin street doses in similar external packages or
a thousand tablets. In this case you can apply this “black box” sampling
method to eliminate (or at least reduce to a minimum) any bias that may
be introduced by the person selecting the samples. When we refer to a
“black box” method we mean any method that will prevent the sampler
from consciously selecting a specific item from the population.
These methods are not standardised yet and we can refer to the example
given above.
GUIDELINES ON REPRESENTATIVE DRUG SAMPLING - CHAPTER 3 REPRESENTATIVE SAMPLING TECHNIQUES
11
7/30/2019 LQT-De003 Guidelines on Represemtative Drug Sampling
http://slidepdf.com/reader/full/lqt-de003-guidelines-on-represemtative-drug-sampling 14/60
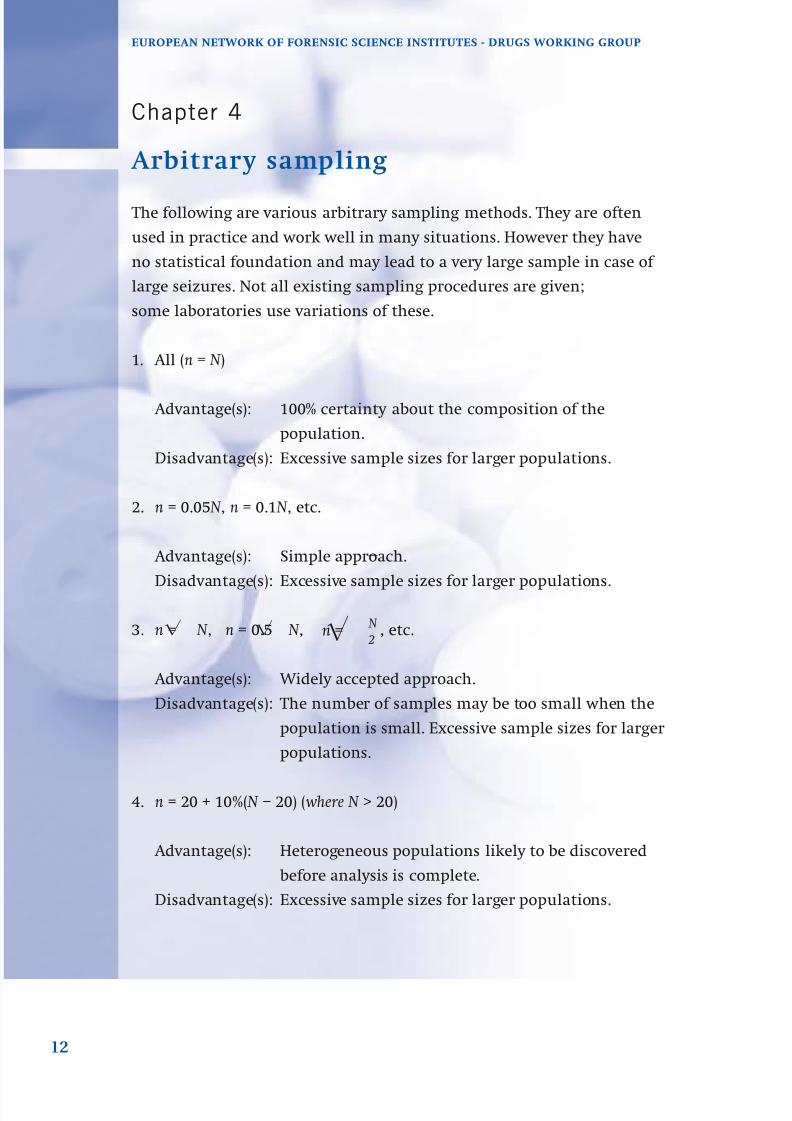
The following are various arbitrary sampling methods. They are often
used in practice and work well in many situations. However they have
no statistical foundation and may lead to a very large sample in case of
large seizures. Not all existing sampling procedures are given;
some laboratories use variations of these.
1. All (n = N )
Advantage(s): 100% certainty about the composition of the
population.
Disadvantage(s): Excessive sample sizes for larger populations.
2. n = 0.05 N , n = 0.1 N , etc.
Advantage(s): Simple approach.
Disadvantage(s): Excessive sample sizes for larger populations.
3. n = N , n = 0.5 N , , etc.
Advantage(s): Widely accepted approach.
Disadvantage(s): The number of samples may be too small when the
population is small. Excessive sample sizes for larger
populations.
4. n = 20 + 10%( N – 20) (where N > 20)
Advantage(s): Heterogeneous populations likely to be discovered
before analysis is complete.
Disadvantage(s): Excessive sample sizes for larger populations.
EUROPEAN NETWORK OF FORENSIC SCIENCE INSTITUTES - DRUGS WORKING GROUP
Chapter 4
Arbitrary sampling
12
n = N 2

7/30/2019 LQT-De003 Guidelines on Represemtative Drug Sampling
http://slidepdf.com/reader/full/lqt-de003-guidelines-on-represemtative-drug-sampling 15/60
5. for N < x n = N
x ≤ N ≤ y n = z
N > y n = N
(where x, y and z are arbitrary numbers; x < y and x ≤ z < y)
Advantage(s): United Nations Drug Control Program recommended
method (x = 10, y = 100, z = 10).
Disadvantage(s): Excessive sample sizes for larger populations.
6. n = 1
Advantage(s): Minimum amount of work.Disadvantage(s): Least amount of information on the characteristics of
the seizure.
GUIDELINES ON REPRESENTATIVE DRUG SAMPLING - CHAPTER 4 ARBITRARY SAMPLING
13

7/30/2019 LQT-De003 Guidelines on Represemtative Drug Sampling
http://slidepdf.com/reader/full/lqt-de003-guidelines-on-represemtative-drug-sampling 16/60
EUROPEAN NETWORK OF FORENSIC SCIENCE INSTITUTES - DRUGS WORKING GROUP
Chapter 5
Statistical sampling methods
14
Introduction
The methods discussed in this chapter provide statistically founded
ways to determine the sample size. The first two methods concern a
frequentist approach, while the third method describes a Bayesian
approach.
The assumption behind a frequentist approach is that a fixed butunknown proportion of the seizure contains drugs. The proportion of
drugs in a sample (= the sampled units) can estimate this seizure
proportion. The proportion of drugs in the sample will, however,
vary over different samples. Therefore, the frequentist methods provide
a confidence, (1 – ␣)100% (for instance 95% if ␣ is selected to be 0.05),
that with a given sample proportion the seizure proportion is at least
k100% (for instance 90% if k is selected to be 0.9). In other words,
one would be correct about a seizure containing at least 90% drugs in95 out of 100 cases.
The assumption behind a Bayesian approach is that the sample
proportion is known and fixed. This proportion is used to calculate
probabilities on certain values of the unknown seizure proportion that at
that point is still assumed variable. With this approach it is possible to
incorporate some knowledge about the seizure that you may possibly
have. The seizure proportion is not known but often some ideas aboutthis proportion exist. For instance, if all plants in a hemp nursery appear
similar they probably are all hemp plants. It is also possible that there is
no clue about the amount and type of drugs in a seizure. These various
forms of prior information will result in different mathematical models
to estimate a desired sample size in the Bayesian approach.

7/30/2019 LQT-De003 Guidelines on Represemtative Drug Sampling
http://slidepdf.com/reader/full/lqt-de003-guidelines-on-represemtative-drug-sampling 17/60
1. The hypergeometric distribution
Application
The probability that a sample of size n contains X positives (unitscontaining illegal drugs), given that the population of size N contains N 1positives, can be calculated by
P ( X = x| N 1, N , n) =
This is the hypergeometric distribution. The first (and mostly used)
frequentist method is based on this distribution.
In sampling drug units, the numbers of positives, N 1, and negatives, N – N 1are unknown. To determine these numbers exactly the whole seizure has
to be analysed. If some uncertainty is allowed, the hypergeometric
distribution can be used to calculate a sample size of n units that have to be analysed such that at least K (= kN ) units are positive with (1 – ␣)100%
confidence. For instance, calculate n such that with 95% confidence
at least 90% of the packages contains illegal drugs. These choices of
the numbers for ␣ and k depend on laboratory guidelines, costs, legal
requirements and so on.
If the choices about ␣ and k are made and if an assumption is made
about the number of positives to be expected in the sample (usually x),the sample size n can be solved from the above formula. Take for the
cumulative probability P ( X ≥ x) = (1 – ␣) and for N 1 = K . Table 5.1 (tables are
listed in appendix A) provides the required sample sizes for some
standard choices of ␣ and k with different population sizes, if all sampled
units are believed to be positive. Table 5.2 provides the same information
if 1 or 2 of the sampled units are expected to be negative (contain no
drugs). Sample sizes can also be calculated with a macro in software such
as Excel
®
, as included in this document (latest version will be madeavailable via the www.enfsi.org).
GUIDELINES ON REPRESENTATIVE DRUG SAMPLING - CHAPTER 5 STATISTICAL SAMPLING METHODS
15
P ( X = x| N 1, N , n) =
N 1x
N – N 1n – x(
N
n( )

7/30/2019 LQT-De003 Guidelines on Represemtative Drug Sampling
http://slidepdf.com/reader/full/lqt-de003-guidelines-on-represemtative-drug-sampling 18/60
Example 1
Suppose that a population contains 100 packages. To guarantee with 95%
confidence that at least 90% of the packages contains illegal drugs,
a sample of 23 packages has to be drawn and all of these packages have to
contain illegal drugs (see Table 5.1).
The assumption that all sampled units contain drugs is often made.
This assumption can be made because this is learned from many years of
experience in the field, or simply by reasoning that it makes no sense to
EUROPEAN NETWORK OF FORENSIC SCIENCE INSTITUTES - DRUGS WORKING GROUP
16
Table 5.1 Hypergeometric distribution.
Required sample size to guarantee with 95% or 99% confidence that the seizure
contains at least a proportion of k drugs, if expected that all sampled units
contain drugs.
population 95% confidence 99% confidence
size N k =0.5 k =0.7 k =0.9 k =0.5 k =0.7 k =0.9
10 3 5 8 4 6 9
20 4 6 12 5 9 15
30 4 7 15 6 10 20
40 4 7 18 6 10 23
50 4 8 19 6 11 26
60 4 8 20 6 11 28
70 5 8 21 7 12 30
80 5 8 22 7 12 31
90 5 8 23 7 12 32
100 5 8 23 7 12 33
200 5 9 26 7 13 38
300 5 9 27 7 13 40
400 5 9 27 7 13 41
500 5 9 28 7 13 41
600 5 9 28 7 13 42
700 5 9 28 7 13 42
800 5 9 28 7 13 42
900 5 9 28 7 13 43
1000 5 9 28 7 13 43
5000 5 9 29 7 13 44
10000 5 9 29 7 13 44

7/30/2019 LQT-De003 Guidelines on Represemtative Drug Sampling
http://slidepdf.com/reader/full/lqt-de003-guidelines-on-represemtative-drug-sampling 19/60
mix the drugs with no-drugs, apart from maybe a layer of distraction
material on top. However, occasionally one or more units in the sample
may not contain drugs. In that case, the guaranteed confidence or the
minimum proportion drugs in the population drops. Figure 5.1 shows for
the sample size of 23, that the confidence to guarantee a proportion drugsof at least 90% drops from 95% to about 77% if one sampled unit did not
contain drugs instead of 0 ( N =100). Alternatively and probably more useful
for presentation at the court, the probability can be maintained at 95%
GUIDELINES ON REPRESENTATIVE DRUG SAMPLING - CHAPTER 5 STATISTICAL SAMPLING METHODS
17
Table 5.2 Hypergeometric distribution.
Required sample size to guarantee with 95% or 99% confidence that the seizure
contains at least a proportion of k drugs, if expected that either 1 or 2 sampled
units do not contain drugs (1 or 2 negatives).
Population 95% confidence 99% confidence
size N k=0.5 k=0.7 k=0.9 k=0.5 k=0.7 k=0.9
1 neg 2 neg 1 neg 2 neg 1 neg 2 neg 1 neg 2 neg 1 neg 2 neg 1 neg 2 neg
10 5 5 7 7 9 9 5 5 7 7 9 9
20 6 8 10 13 17 18 8 10 12 14 18 18
30 7 9 11 14 22 27 8 11 14 17 25 27
40 7 9 12 15 26 32 9 11 15 18 30 35
50 7 10 12 16 29 36 9 12 16 20 34 41
60 7 10 12 16 31 39 9 12 16 20 38 45
70 7 10 13 17 32 41 10 12 17 21 40 48
80 7 10 13 17 34 43 10 12 17 21 42 51
90 7 10 13 17 35 45 10 13 17 21 44 54
100 7 10 13 17 36 46 10 13 17 22 46 56
200 8 10 14 18 40 53 10 13 18 24 54 67
300 8 10 14 19 42 55 10 13 19 24 57 71
400 8 11 14 19 43 57 10 13 19 24 58 74
500 8 11 14 19 44 58 10 14 19 24 59 75
600 8 11 14 19 44 58 10 14 19 25 60 76
700 8 11 14 19 44 59 11 14 19 25 61 77
800 8 11 14 19 44 59 11 14 19 25 61 77
900 8 11 14 19 45 59 11 14 19 25 61 78
1000 8 11 14 19 45 59 11 14 19 25 62 78
5000 8 11 14 19 46 59 11 14 20 25 64 81
10000 8 11 14 19 46 61 11 14 20 25 64 81

7/30/2019 LQT-De003 Guidelines on Represemtative Drug Sampling
http://slidepdf.com/reader/full/lqt-de003-guidelines-on-represemtative-drug-sampling 20/60
and then the minimum proportion of drugs calculated. Figure 5.2 shows
that the guaranteed proportion at a confidence of 95% drops from 90% to
84 % (for sample size = 23, one negative instead of 0, N =100). Table 5.2
shows that a sample of 36 was needed to guarantee with 95% confidencethat at least 90% of the population contained drugs if one negative in the
sample was assumed beforehand.
It is statistically not correct to sample another 13 units on top of 23 if one
of these 23 –upon analysis– does not contain drugs. Before sampling a
decision should be made how many negatives in the sample are expected.
Afterwards, when one or more sampled units are found to be negative
this has consequences for the confidence and/or the proportion levels. This property makes the sampling with the hypergeometric distribution
(and other frequentist methods) hard to understand intuitively.
EUROPEAN NETWORK OF FORENSIC SCIENCE INSTITUTES - DRUGS WORKING GROUP
18
Figure 5.1
Confidence against sample size (N = 100; k = 0.9) for 0, 1, and 2 negatives.
Lines - ᭹ - for 0 negatives; - ᭺ - for 1 negative; - ᭢ - for 2 negatives
sample size (n)
0 10 20 30 40
c o n f i d e n
c e ( 1 - ␣ )
0.0
0.2
0.4
0.6
0.8
1.0
n = 23

7/30/2019 LQT-De003 Guidelines on Represemtative Drug Sampling
http://slidepdf.com/reader/full/lqt-de003-guidelines-on-represemtative-drug-sampling 21/60
Example 2
If it is sufficient to guarantee with a high probability (say 95%) that drugs
are present in the majority (> 50%) of the exhibit (of 100), then only a
sample of 5 is necessary provided that no negative is found (see Table 5.1).
Theory
This section is for those who want more background information on the
hypergeometric distribution and the calculation of the table values.
The hypergeometric distribution, and thus the theory below, assumes
that samples are taken without replacement. The sample size to be taken
from a population of size N is calculated by testing the null hypothesisthat the number of positives in the population is less than K against the
alternative hypothesis that the number of positives is at least K .
GUIDELINES ON REPRESENTATIVE DRUG SAMPLING - CHAPTER 5 STATISTICAL SAMPLING METHODS
19
Figure 5.2
Proportion of drug in seizure against sample size (N = 100; P = 0.95) for 0, 1, and
2 negatives expected. Lines - ᭹ - for 0 negatives; - ᭺ - for 1 negative; - ᭢ - for 2 negatives
sample size (n)
0 10 20 30 40
p r o p o r t i o n d
r u g s
0.0
0.2
0.4
0.6
0.8
1.0
n = 23

7/30/2019 LQT-De003 Guidelines on Represemtative Drug Sampling
http://slidepdf.com/reader/full/lqt-de003-guidelines-on-represemtative-drug-sampling 22/60
H 0 : N 1 < K en H 1 : N 1 ≥ K
To prosecute people for all the seized units it is desired that N 1 ≥ K .
Evidence has to be found to reject the null-hypothesis. However, no bigmistakes are allowed. This means that the probability that the null
hypothesis is rejected, while it is true, should be small, say ␣100%.
This provides a confidence level of (1 – ␣)100%. The hypotheses are tested
with the number of positives in the sample, X , as the test statistic.
The null-hypothesis is rejected when X is larger than a certain number.
If this number is taken as the number of positives expected in the
sample, x, then, n should be selected such that
P ( X ≥ x| N 1 < K ) ≤ ␣
In words, the sample size n should be selected such that under the null-
hypothesis the probability that the number of positives in the sample is
larger than x, is smaller than ␣. This hypergeometric distribution
decreases as N 1 decreases, therefore all probabilities with values for N 1 < K
are smaller than the probability where N 1 < K – 1. Thus, select n such that
P ( X ≥ x| N 1 < K ) = ≤ ␣
When x = n, this reduces to
≤ ␣
This is
( K – 1)!( N – n)! ( K – 1)(k – 2)...( K – n)P0 = = ≤ ␣
( K – n – 1)! N ! N ( N – 1)...( N – n + 1)
For one “negative” in the sample the inequality reduces to
n( N – K + 1)P0[1+ ] ≤ ␣( K – n)
EUROPEAN NETWORK OF FORENSIC SCIENCE INSTITUTES - DRUGS WORKING GROUP
20
P ( X ≥ x| N 1 < K ) = ≤ ␣
K – 1i
N – K + 1n – i( )
N
n
n
i=x
≤ ␣
K – 1
n
N – K + 1
0( ) N
n
( K – 1)!( N – n)! ( K – 1)(k – 2)...( K – n) P 0 = = ≤ ␣
( K – n – 1)! N ! N ( N – 1)...( N – n + 1)
n( N – K + 1) P 0 [1+ ≤ ␣( K – n)
H 0 : N 1 < K and H 1 : N 1 ≥ K
P ( X ≥ x| N 1 < K ) ≤ ␣

7/30/2019 LQT-De003 Guidelines on Represemtative Drug Sampling
http://slidepdf.com/reader/full/lqt-de003-guidelines-on-represemtative-drug-sampling 23/60
and for two “negatives” the inequality reduces to
n( N – K + 1) (n – 1)( N – K )and so on.
2. The binomial distribution
Application
This is the second method using a frequentist approach. It is an easier
method, but can only be used in special cases. The binomial distribution
assumes sampling with replacement. This means that a unit is placed
back after it is sampled and analysed before the next unit is sampled.Of course this is not practiced in drugs sampling. However, in situations
where the seizure is very large (at least 50, preferably larger) and the
sample is relatively small the hypergeometric distribution can be
approximated by the less complex binomial distribution. In that case,
the probability that a sample of size n contains X positives (units
containing illegal drugs), given that the population of size N contains a
proportion of positives, is
n P ( X = x|O–,n)=( )O–x(1 – O–)n-x
x
Similarly, as with the hypergeometric distribution, the binomial
distribution can be used to calculate a sample size n such that with
(1 – ␣)100% confidence can be stated that at least a proportion of k100% is
positive. The calculations with the binomial distribution are easier than
the ones with the hypergeometric distribution. However, it should be
kept in mind that the binomial distribution is an approximation. The sample size estimated with it will be slightly overestimated.
Only in very large seizures (sometimes of several thousands) the sample
sizes calculated from both distributions will be exactly equal.
If no negatives are expected the sample size n, that with (1 – ␣)100%
confidence can be stated that at least a proportion of k100% is positive,
can be calculated by the minimum value for which
log ␣n ≤log O–
GUIDELINES ON REPRESENTATIVE DRUG SAMPLING - CHAPTER 5 STATISTICAL SAMPLING METHODS
21
O– = N 1 N
n( N – K + 1) (n – 1)( N – K ) P 0[1+ 1+ }] ≤ ␣
( K – n) 2( K – n + 1)
n P ( X = x|O–,n) = ( O–x(1 – O–)n-x
x
log ␣n ≤log O–

7/30/2019 LQT-De003 Guidelines on Represemtative Drug Sampling
http://slidepdf.com/reader/full/lqt-de003-guidelines-on-represemtative-drug-sampling 24/60
regardless of the population size. If negatives are found in the sample
conclusions have to be adapted in a similar way as with the
hypergeometric distribution. Again tables or the included software
can be used.
Example 1
A large seizure is made. Experienced police people can see that this is
most probably all heroin. Even if only half of it is heroin this will still be
a large seizure. Therefore a sample that guarantees with 95% confidence
that at least 50% of the seizure is drugs may be sufficient. Table 5.3 shows
that in that case the sample size will be 5, if no negatives are assumed.
Example 2
To guarantee with 95 % confidence that at least 90% of the pills contain
drugs a sample of 29 should be drawn (if no negatives in the sample are
assumed). Compare this with the hypergeometric distribution when a
sample has to be drawn from a population of 100. Then the sample size is
only 23. Only when the population is as large as 1600, the results from
the binomial distribution are coinciding with that of the hypergeometric
distribution for this particular values of (1 – ␣)100% and k.
Theory
The theory behind the binomial distribution is similar to that of the
hypergeometric distribution. The hypotheses are
H 0 : O– < k
H 1 : O– ≥ k
EUROPEAN NETWORK OF FORENSIC SCIENCE INSTITUTES - DRUGS WORKING GROUP
22
Table 5.3 Binomial distribution.
Required sample size to guarantee with 95% or 99% confidence that the seizure
contains at least a proportion of k drugs if expected that 0, 1 or 2 sampled units
do not contain drugs (0, 1 or 2 negatives). Use this only for large seizures.
population 95% confidence 99% confidence
size N k =0.5 k =0.7 k =0.9 k =0.5 k =0.7 k =0.9
0 negatives 5 9 29 7 13 44
1 negative 8 14 46 11 20 64
2 negatives 11 19 61 14 25 81

7/30/2019 LQT-De003 Guidelines on Represemtative Drug Sampling
http://slidepdf.com/reader/full/lqt-de003-guidelines-on-represemtative-drug-sampling 25/60
To select n, the equation to be solved is
n P ( X ≥ x|O– < k) = ( )O–x(1 – O–)n-x ≤ ␣
x
Thus in case x = n, the equation to be solved is
O–n ≤ ␣
That is, find the minimum value for which
log ␣n ≤
log O–
The binomial distribution is an approximation of the hypergeometric
distribution. The value for n found with the binomial distribution
will always be equal to or greater than the value found with the
hypergeometric distribution.
3. Bayesian approach
Application Within the Bayesian approach (like the frequentist approach) a
distinction can be made between sampling with replacement and
sampling without replacement. Again sampling with replacement is
easier and can be used as an approximation for situations where
the population size is at least 50 and the sample relatively small.
Here, an overestimate is not such a problem as with the binomial
distribution. That is why the sampling with replacement approximation
is much more used in the Bayesian approach.
Bayesians assume that, although the population proportion is not known,
there may be some ideas about the size of this proportion. These ideas are
represented by a probability distribution p(O–), the so-called prior
distribution of the proportion. This uncertain knowledge is combined
with the information provided by the sample to a so-called posterior
distribution of the proportions, given the sample results. With this
posterior distribution it is possible to calculate directly the probability that the proportion of drugs is at least k (given the sample results) without
using tests or confidence intervals. This is because Bayesians calculate
P (O– > k|x,n) directly instead of P ( X > x|O– > k,n) as the frequentists do.
GUIDELINES ON REPRESENTATIVE DRUG SAMPLING - CHAPTER 5 STATISTICAL SAMPLING METHODS
23
n P ( X ≥ x|O– < k) = ( O–x(1 – O–)n-x ≤ ␣
x
n
i=x
O–n ≤ ␣
log ␣n ≤
log O–

7/30/2019 LQT-De003 Guidelines on Represemtative Drug Sampling
http://slidepdf.com/reader/full/lqt-de003-guidelines-on-represemtative-drug-sampling 26/60
Seizure containing more than 50 units
If a population is large ( N > 50) and the sample is relatively small compared
to the population, the probability density function for the proportion O– of
positives, given that a sample of sizen
containsx
positives is
O–x+a–1(1 – O–)n–x+b–1
ƒ(O–|x,n,a,b) = Be(x + a, n – x + b) = B(x + a,n – x + b)
This is the beta distribution with parameters x + a and n – x + b.
The parameters a and b have to be selected beforehand based on prior
knowledge or assumptions about O–. The prior knowledge together with
the information about the data (the sample size n and number of
positives in the sample x) form the above presented posterior distribution. Be stands for the beta distribution and B stands for the beta function.
For more details see the theory section.
The probability that the population proportion is larger than k can be
calculated with P (O– > k|x,n). This can be used to select a sample size n such
that the probability that O– > k is (1 – ␣)100%. For instance, select n such that
the probability is 95% that at least 90% of the pills contains illegal drugs.
The calculations are independent of the population size. Calculations onthe beta distribution to find such an n can best be carried out with the aid
of a computer program. Table 5.4 is based on computer calculations with
the macro included in this document. Like in the frequentist methods you
have to assume beforehand what the number of positives in your sample
will be, and adapt your conclusions if afterwards this number is not
correct. Again in most cases no negatives will be expected.
Besides the expected number of positives in the sample, a prior distributionhas to be selected. In general this is a beta distribution. One suggestion is to
take both parameters a and b equal to 1, if there is no prior idea about the
contents of the pills. The prior distribution then equals the uniform
distribution. Another suggestion is to take them both equal to 0.5 if there is
a prior that either all pills contain drugs or no pills at all contain drugs.
Take b = 1, and a = 3 (or even higher) if there is a prior belief, based on visual
inspection and experience or so, that probably all is drugs. For instance,
100 similar packages are found, all containing powder with exactly thesame type of white colour, same structure and all having the same weight.
Sampling a hemp nursery may even be a more extreme case.
EUROPEAN NETWORK OF FORENSIC SCIENCE INSTITUTES - DRUGS WORKING GROUP
24
O– x+a–1(1 – O–)n–x+b–1
(O–|x,n,a,b) = Be (x + a, n – x + b) = B(x + a,n – x + b)

7/30/2019 LQT-De003 Guidelines on Represemtative Drug Sampling
http://slidepdf.com/reader/full/lqt-de003-guidelines-on-represemtative-drug-sampling 27/60
Example 1
To be sure, without any prior knowledge (see Table 5.4 with a=1, b=1,
0 negatives), with 95% probability that at least 90% of all pills contain
illegal drugs, a sample of size 28 is needed with the Bayesian approach.
This is higher than with the hypergeometric distribution, where only 23
(see Table 5.1) samples are needed. However, if it is very clear that we aredealing with drugs, and we combine this with the practical knowledge
that then probably all are drugs the sample size drops to 26 (a = 3, b =1)
even 19 (a = 10, b = 1; note: calculated value, not shown in a table).
GUIDELINES ON REPRESENTATIVE DRUG SAMPLING - CHAPTER 5 STATISTICAL SAMPLING METHODS
25
Table 5.4 Beta distribution (with parameters x + a and n – x + b ).
Required sample size to guarantee with a probability of 95% or 99% that the
seizure contains at least a proportion of k drugs if expected that 0, 1, or 2 sampled
units do not contain drugs (0, 1 or 2 negatives). A large seizure is assumed(N > 50). Use (a=1, b=1) if no prior information is known, (a=0.5, b=0.5) if it is
reasonable to assume that either everything is drugs or nothing is drugs
(a=3, b=1, or more extreme values) if there are reasons to believe that all or most
of the seizure contains drugs.
a = 1 95% confidence 99% confidence
b = 1 k=0.5 k=0.7 k=0.9 k=0.5 k=0.7 k=0.9
0 negatives 4 8 28 6 12 43
1 negative 7 13 45 10 19 63
2 negatives 10 18 60 13 24 80
a = 3 95% confidence 99% confidence
b = 1 k=0.5 k=0.7 k=0.9 k=0.5 k=0.7 k=0.9
0 negatives 2 6 26 4 10 41
1 negative 5 11 43 8 17 61
2 negatives 8 16 58 11 22 78
a = 0.5 95% confidence 99% confidence
b = 1 k=0.5 k=0.7 k=0.9 k=0.5 k=0.7 k=0.9
0 negatives 3 6 18 5 10 32
1 negative 6 12 38 9 17 55
2 negatives 9 17 54 12 22 73

7/30/2019 LQT-De003 Guidelines on Represemtative Drug Sampling
http://slidepdf.com/reader/full/lqt-de003-guidelines-on-represemtative-drug-sampling 28/60
Example 2
To guarantee with a probability of 95% that at least half of the seizure
contains drugs, only a sample size of 4 is needed (when no negatives are
expected in the sample). In very extreme cases this number can bereduced or increased by one or two. In general, to guarantee at least
50% of drugs (with a probability of 95%) a sample size of 4 is an easy
guideline.
Seizure containing less than 50 units
If the seizure is small ( N < 50), it is better to look at the number of
positives in the unexamined units instead of the proportion of positives.
The probability density function for the number of positives in theunexamined units Y , given that a sample of size n contains x positives is.
⌫(n+a+b)( )⌫(y+x+a)⌫(N–x–y+b) ƒ(Y |x,n,( N – n),a,b) =
⌫(x+a)⌫(n–x+b)⌫(N+a+b)
This is the beta-binomial distribution.
The probability that the number of positives in the unexamined pills is
larger than y can be calculated with P (Y ≥ y|x,n, N ). This can be used toselect a sample size n such that the probability that Y > y is (1 – ␣)100%.
Calculations on the beta-binomial distribution to find such an n have to
be done with a computer (statistical software, Excel macro) or at least a
scientific calculator. Like in the frequentist methods you have to assume
beforehand what the number of positives in your sample will be,
and adapt your conclusions if afterwards this number is not correct.
Again in most cases no negatives will be expected.
In contrast to the binomial Bayesian method for large seizures,
the calculated sample size for small seizures depends on the seizure size.
Furthermore, calculations on the proportion can not be very precise,
because of the small numbers. Therefore it is probably best to use the
hypergeometric distribution for small seizures or alternatively use the
sample sizes calculated with the Bayesian method for large seizures as an
approximation for small seizures.
EUROPEAN NETWORK OF FORENSIC SCIENCE INSTITUTES - DRUGS WORKING GROUP
26
⌫(n+a+b)( ) ⌫(y+x+a)⌫(N–x–y+b)(Y |x,n,( N – n),a,b) =
⌫(x+a)⌫(n–x+b)⌫(N+a+b)
N – n y

7/30/2019 LQT-De003 Guidelines on Represemtative Drug Sampling
http://slidepdf.com/reader/full/lqt-de003-guidelines-on-represemtative-drug-sampling 29/60
Theory
This section is for those who want to know where the numbers in the
tables come from.
The Bayes approach allows the use of prior information about a para-
meter (such as the drug proportion in a seizure); by combining this prior
information with the results from the sampling, it comes to a posterior
information about that parameter. Let O– be the parameter of interest and
x the data from the sample; the Bayes theorem is then:
P (x|O–) p(O–) P (O–|x) =
P (x)
This is often rewritten as Bayes formula
P (O–|x) ϰ L(O–|x) p(O–)
Here, p(O–) is the prior distribution, representing the uncertainty about
the knowledge of O–. If no knowledge or ideas exist about O–, any value
(between 0 and 1, if O– is a proportion) is as likely as any other. Then p(O–) is
a uniform distribution. This is a special case of the beta distribution.
In general, a beta distribution with parameters a and b is assumed.
The beta distribution Be(a, b) is given by
O–a–1(1 – O–)b–1
ƒ(O–|a,b)= B(a,b)
with the beta function B(a,b) =1
2
∫ ya–1(1 – y)b–1dy.
This can also be written as B(a,b)=⌫(a)⌫(b)/⌫(a+b), where we have used thegamma function ⌫.
In case of no prior belief about the seizure a and b both equal to 1
(the uniform distribution). In case more information is available,
for instance, all units of the seizure show the same (visual)
characteristics, other values of a and b have to be used. If all pills look
similar it is most likely that all pills contain drugs or no pills at all
contain drugs, then a = 0.5 and b = 0.5. If there is a founded suspicionthat drugs are involved, so that O– is very likely high, a could be 3 and
b = 1, or even stronger: a = 10, and b = 1. In the estimation of the value
for a, the results of spot tests could also be considered.
GUIDELINES ON REPRESENTATIVE DRUG SAMPLING - CHAPTER 5 STATISTICAL SAMPLING METHODS
27
P (x|O–) p(O–) P (O–|x) =
P (x)
P (O–|x) ϰ L(O–|x) p(O–)
O–a–1(1 – O–)b–1
(O–|a,b)= B(a,b)
B(a,b) =1
0
∫ ya–1(1 – y)b–1dy.

7/30/2019 LQT-De003 Guidelines on Represemtative Drug Sampling
http://slidepdf.com/reader/full/lqt-de003-guidelines-on-represemtative-drug-sampling 30/60
In Bayes formula L(O–|x) is the likelihood function. This function contains
information about the data. In fact it is the same probability function as
the frequentists use when N >50 (the binomial distribution), except that it
is the data (x) that are assumed constant and the parameter O– is assumed variable.
The likelihood function combines with the prior information to the
posterior distribution of the proportion O– given the data
O–x+a–1(1 – O–)n–x+b–1
ƒ(O–|x,n,a,b) = Be(x + a,n – x + b) = B(x+a,n – x + b)
If all sampled pills contain drugs (x = n) this isO–n+a–1(1 – O–)b–1
ƒ(O–|n,n,a,b) = Be(n + a,b) = B(n + a,b)
To calculate the sample size n such that with a probability of (1 – ␣)100%
at least k100% of all pills contains drugs, the equation
(1 – ␣)100%
has to be solved.
The same Bayesian theory concerning Bayes theorem is true for the case
of small seizures. Then the distribution of P (Y | N – n,O–) is binomial.
When this is combined with the prior beta distribution for O– the
resulting posterior distribution of P (Y |n, N – n,O–,a,b) is beta-binomial.
EUROPEAN NETWORK OF FORENSIC SCIENCE INSTITUTES - DRUGS WORKING GROUP
28
O–x+a–1(1 – O–)n–x+b–1
(O–|x,n,a,b) = Be(x + a,n – x + b) = B(x+a,n – x + b)
O–n+a–1(1 – O–)b–1
(O–|n,n,a,b) = Be(n + a,b) = B(n + a,b)
P(O– > k|n,n,a,b) =1
k
∫O–n+a–1(1 – O–)b–1dO–/ B(n + a,b) =

7/30/2019 LQT-De003 Guidelines on Represemtative Drug Sampling
http://slidepdf.com/reader/full/lqt-de003-guidelines-on-represemtative-drug-sampling 31/60
GUIDELINES ON REPRESENTATIVE DRUG SAMPLING - CHAPTER 5 STATISTICAL SAMPLING METHODS
29

7/30/2019 LQT-De003 Guidelines on Represemtative Drug Sampling
http://slidepdf.com/reader/full/lqt-de003-guidelines-on-represemtative-drug-sampling 32/60
In the previous chapters a number of sampling strategies were (briefly)
described. Although advantages and disadvantages of certain methods
were given, no real preference was mentioned. This chapter attempts to
bring up a number of considerations about the use of (some of)
the methods and to mention and discuss a number of related aspects,
with the aim to support laboratories in the selection of their
recommended method(s) or ‘best practice’.
The basis of sampling
The basis of sampling is that the composition found in the samples taken
reflects, in principle, the composition of the whole lot. As a consequence,
only a fraction of the total packages in a seizure can be investigated.
Sampling is an intentional choice to refrain from doing things to
(unnecessary or impossible) perfection, for reasons of efficiency and cost
effectiveness. As an example: if one sample out of a population of 10 istaken, and the analysis of the sample shows cocaine, the hypothesis that
this is the only one containing cocaine is much more unlikely (10%) than
the hypothesis that the majority of the 10 items contains cocaine
(more than 50%).
The aim of sampling
Actually, a sampling strategy is fully dependent on the question and thusthe problem that has to be solved. There may be different needs for
prosecution of possession, production, or trafficking. The question
usually arises from the national law, or from a national policy (habit) or
sometimes directly from the prosecutor’s opinion or from the police staff.
EUROPEAN NETWORK OF FORENSIC SCIENCE INSTITUTES - DRUGS WORKING GROUP
Chapter 6
Considerations and recommendations
30

7/30/2019 LQT-De003 Guidelines on Represemtative Drug Sampling
http://slidepdf.com/reader/full/lqt-de003-guidelines-on-represemtative-drug-sampling 33/60
Simplified, in a sequence of increasing workload:
i) Is a drug present? Minimal sampling (this may require 1 positive
result).
ii) Is a drug present in (more than) a specified proportion of the items?Increased sampling.
iii) Is a drug present in all the items? Maximum sampling (this will
require full analysis of all items, which will lead to unrealistic costs,
especially for large number of units).
It is clear that, for large seizures, the situation ii) is widely considered as
a reasonable approach, often allowing a scientist to include a statistical
approach. In this case, we can choose the desired confidence level.
An increase in confidence from 95% to 99% will result in an increase of the number of samples to be taken; depending on the conditions, it could
mean more than doubling. In statistics 95 % is very common and widely
accepted; for this reason we advise to adopt this 95% confidence as the
standard.
Law of Diminishing Returns
Except with fixed national sampling policies, a leading question in allstatistical approaches is what (minimum) proportion of the lot at least
must be proven ‘positive’ for drugs. This has a strong influence on the
number of samples to be taken. It includes the questions why and at what
costs? The Table 6.1 shows the number of samples to be taken for
GUIDELINES ON REPRESENTATIVE DRUG SAMPLING - CHAPTER 6 CONSIDERATIONS
31
Table 6.1 Hypergeometric distribution.
Number of samples to be taken for describing (with 95% confidence) a certain
proportion of drugs in a seizure, assuming 0 negatives in the sample.
Proportion For a seizure For a seizure
of seizure at least consisting consisting
positive for drugs of 100 units of 1000 units
50% 5 5
60% 6 6
70% 8 9
80% 12 14
90% 23 28
95% 39 56

7/30/2019 LQT-De003 Guidelines on Represemtative Drug Sampling
http://slidepdf.com/reader/full/lqt-de003-guidelines-on-represemtative-drug-sampling 34/60
declaring a certain proportion (%) in the seizure positive for drugs, with a
95% confidence (assuming the whole sample is found positive for drugs).
Clearly, the higher the requested positive proportion, the higher the
sample size has to be. However, over a certain proportion (70-80%),a relative small increase in proportion requires a relative large increase in
the number of samples, as is generally known as the “Law of Diminishing
Returns”. This is also clearly demonstrated graphically in Figure 5.2;
for a proportion of over 70-80% the slope is declining, indicating a
negative cost-benefit ratio. Equilibrium has to be found between the costs
of exponential increasing sample sizes and the increase in the
guaranteed drugs proportion gained from this.
Hypergeometric and Bayesian methods
Although many different methods are in use, the hypergeometric
approach seems to be the most widely accepted one; it has been
well-described and is one of the two recommended by the UNDCP
(renamed in UNODC) and SWGDRUG. This does not mean that this
approach should automatically be adopted by ENFSI. In the first place,
the aim of this ENFSI document is to look for practical methods that are‘fit for the purpose’ in Europe. Secondly, the hypergeometric method is
quite rigid and results often in a very large – sometimes superfluous-
number of samples; for this reason a number of European laboratories
chose the Bayesian approach; this method allows the use of other
relevant, so-called prior information (e.g. external characteristics).
The main problem with the hypergeometric method is that it is blind.
It does not take into account additional aspects. Visual inspection,smelling, pre-testing etc. can contribute to the investigation of the
seizure, but there is no way to incorporate this in the hypergeometric
approach. This problem can be best demonstrated with an example.
When investigating a hemp field of 5000 plants, hypergeometric tables
show a number of 29 samples to be taken. That seems a bit much,
especially for an expert who has been working with hemp for years,
he smells it, notices the lamps, the nutrition, the books about hemp
nursery and so on; and if the suspect admits that he is breeding hemp.Do we still need those 29 samples? In many of these cases a single
sampling looks sufficient. More abstractly formulated: in cases where
more information is contributing, the strict use of the hypergeometric
EUROPEAN NETWORK OF FORENSIC SCIENCE INSTITUTES - DRUGS WORKING GROUP
32

7/30/2019 LQT-De003 Guidelines on Represemtative Drug Sampling
http://slidepdf.com/reader/full/lqt-de003-guidelines-on-represemtative-drug-sampling 35/60
approach leads to an unrealistic high number of samples. The friction
between the hypergeometric model and the reality is also demonstrated
when we approach the hemp field from the other side. Let’s say that 29
samples have been taken and all were hemp indeed. The hypergeometricconclusion has to be that there is a 95% probability that at least 90% of
the plants are hemp indeed. This conclusion sounds unrealistic and by all
means too low (even ridiculous) for those having been in the hemp field
or seen the pictures. Again a friction is felt between the mathematical
approach and the ‘common sense’.
The Bayesian approach can incorporate above-mentioned additional
information in its model, by the use of a prior distribution. In general theprior distribution is a beta distribution with parameters ‘a’ and ‘b’.
The more additional information, in the sense that is clear that we are
dealing with drugs and that all units contain drugs, the higher the
parameter ‘a’ should be. When the plants all look the same, and can be
visually identified as hemp, and the assumption that all the plants consist
of another plant can be rejected, a very high value for ‘a’ may be selected
(e.g. 40). Then the number of samples to be taken will be 1 indeed.
The choice of the exact value of ‘a
’, however, may be a subject for discussionsince there is no standard rule available. A similar but less evident situation
is in the case of a body packer (“mule”) seized at the airport, arriving from a
South American destination, with 80 of these plastic and rubber wrapped
packages. Upon collection they all seem to be similar. Opening of 2 of them
shows a white powder. Both are sent for laboratory investigation.
The difference with the hemp field is a lower information value of the
powder, the similarity lies in the conditions and situations. Within the
framework of the Bayesian approach, a prior distribution with a high valuefor ‘a’, but much lower than in the previous case, can be chosen.
The importance of experience in a profession is generally recognised;
this expertise can not be linked to the hypergeometric distribution.
So, already Sutherland in 1992 mentioned that in cases with large
numbers of packages, containing similar material upon visual inspection,
they always all appeared to contain the same drug (Note: This considera-
tion is in qualitative analysis only!). In import/export cases, by its naturethe seizure is logically composed of drugs; experience in The Netherlands
shows that mixtures with non-drugs were extremely rare; as an
indication, in many ten-thousands of cases only one case was found
GUIDELINES ON REPRESENTATIVE DRUG SAMPLING - CHAPTER 6 CONSIDERATIONS
33

7/30/2019 LQT-De003 Guidelines on Represemtative Drug Sampling
http://slidepdf.com/reader/full/lqt-de003-guidelines-on-represemtative-drug-sampling 36/60
where some negative samples were present. This experience can be linked
to the Bayesian approach; however, there are no standard rules for it (yet).
The hypergeometric distribution can successfully be used in court in acase such as the body packer. The defence may argue that maybe the 78
other packages that were not measured do not contain drugs. However,
the probability that only the two measured packages contain drugs is
( )( )( )
about 3 in 10000. This is a very small probability. If the fact that allpackages of all body packers measured always contained drugs is
incorporated and the Bayesian approach is used, this probability will be
even much smaller.
In general, it can be stated that Bayesian methods should be preferred
when much prior information is available, even though one can argue
that they imply subjective prior beliefs. In situations where one wants to
be completely free of subjective hypotheses or where there is hardly any prior information available, frequentist methods (hypergeometric and
binomial) seem attractive because they are easier to understand and to
explain. However, they always provide sample sizes on the very safe side.
This has the advantage that the defence in court can hardly object to it,
but the costly disadvantage of (often) too many samples, as shown in the
above mentioned two examples. The binomial models are not designed
for small seizures. For these, only the Bayesian (with beta-binomial
distribution) and the hypergeometric models are applicable, the latter being more widely applied.
When the majority (at least 50%) of all units should be guaranteed to
contain drugs the results of the hypergeometric distribution and the
Bayesian method do not differ that much. Only in very extreme cases
(like with the hemp plants) the Bayesian method provides lower sample
sizes. In most other cases the sample size will be around 5.
Practical aspects The sampling of tablets may give some specific complications.
What is a realistic sampling of 2000 tablets, all in one bag, all with
the same external characteristics including all the same logo?
EUROPEAN NETWORK OF FORENSIC SCIENCE INSTITUTES - DRUGS WORKING GROUP
34
( ) (( )
22
780
80
2
= 0.000316

7/30/2019 LQT-De003 Guidelines on Represemtative Drug Sampling
http://slidepdf.com/reader/full/lqt-de003-guidelines-on-represemtative-drug-sampling 37/60
Again the hypergeometric approach would lead to 29 samples (for 90%
proportion and 95% probability). Intuitively, this is a large number, and
intuitively it is very unlikely that negative samples will be present in the
whole lot. A question to be considered is the previous situation, but now the 2000 similar tablets are not in one bag, but in 4 bags with each 500
tablets. Does this mean 4 times 29 samples, giving a total of 116 samples?
From a purely statistical standpoint, maybe yes. From a practical
standpoint probably “no”. From the standpoint of cost effectiveness also
probably not. The statistically correct approach would be to combine
the 4 packages (only allowed with similar material) and then sample
accordingly; this approach has also disadvantages.
In addition to the collection of (numerous) samples it has been discussed
how to treat a high number of samples in the laboratory. In some
laboratories it is common practice to do a spot test on all, maybe then
TLC on all or on a large selection, and then – when no differences have
been found – end with a very selective analytical technique on only a
small number of samples. This strategy looks reasonable, but so far,
a solid statistical basis has not yet been presented. However, it can be
expected that the approach fits within the Bayesian approach. If so, muchlaboratory work can be avoided. SWGDRUG however, recommends the
full analysis of all samples, if statistical conclusions must be drawn.
In addition, another strategy is mentioned where sub-samples are all
tested with a screening technique; followed by a full analysis of one
sub-sample and a mixture of all other sub-samples. The latter strategy will
be difficult to explain in terms of statistics.
‘Bulking‘of samples may be described as the preparation of one mixture,composed of a number of samples. If bulking can be arranged in such a
way that the composition of the mixture reflects the total composition,
it seems a very effective strategy to reduce workload. Such a mixture may
be easy to prepare. A disadvantage will appear in relatively inhomogene-
ous lots; by definition bulking shows the average and no information
about the specific item (although some improvement in this aspect could
be obtained by a prior investigation with spot tests).
GUIDELINES ON REPRESENTATIVE DRUG SAMPLING - CHAPTER 6 CONSIDERATIONS
35

7/30/2019 LQT-De003 Guidelines on Represemtative Drug Sampling
http://slidepdf.com/reader/full/lqt-de003-guidelines-on-represemtative-drug-sampling 38/60
Sampling strategies must be relatively easy in order to be practical.
This requirement is not really met by the UNDCP or SWGDRUG guide-
lines. From a table, a number of samples must be read, and on some
unknown grounds a decision must be made if it is expected that one ortwo of the samples will not contain drugs. The basis of such an
expectation is unclear. So, it would probably mean that a first sample set
is collected, analyzed, and that, if negative samples have been found,
a re-sampling will be done. That seems rather complicated and even
impossible if the seizure is destroyed immediately after the sampling.
And always using a standard sampling strategy as if 2 negatives are
expected leads to an increase in the number of samples (always 50-60);
this may seem a bit exaggerated when in almost all cases no negatives arefound. Especially when police or customs are doing the sampling,
they should be guided by easy-to-understand instructions. In that context,
tables or computer programs are less attractive. Some colleagues have
solved the problem by the instruction to always take a fixed number of
samples, (e.g. 25).
Is there an optimum sampling strategy
In the preceding chapters a number of approaches have been described
for sampling plus some considerations about appropriate strategies.
From them, however, it can not be concluded which strategy is the
optimum one and under which conditions. This is because many relevant
aspects play a role, including differences in type of drugs, size of drug
seizures, and aim of the investigation, experience of the drug chemists
and courts, and economical constraints.
Having recognized this, the subcommittee on sampling and the steering
committee of the WG Drugs have decided to refrain from any advice on
sampling on the national or regional level. There, an appropriate choice
should be made from the strategies described; the main aim here is that
a strategy meets the needs for the prosecution and courts in their specific
situation, thereby considering costs and laboratory management aspects.
As mentioned in the introduction, for cases with an internationalcharacter ENFSI as an international body has been asked by the EU
(PCWG) to give an advice on sampling. This advice has been formulated by
the steering committee and the sampling committee; the basis for this
EUROPEAN NETWORK OF FORENSIC SCIENCE INSTITUTES - DRUGS WORKING GROUP
36

7/30/2019 LQT-De003 Guidelines on Represemtative Drug Sampling
http://slidepdf.com/reader/full/lqt-de003-guidelines-on-represemtative-drug-sampling 39/60
advice were the strategies and aspects brought up in this document,
thereby considering both scientific and practical aspects. This advice is
included and explained in Appendix C.
GUIDELINES ON REPRESENTATIVE DRUG SAMPLING - CHAPTER 6 CONSIDERATIONS
37

7/30/2019 LQT-De003 Guidelines on Represemtative Drug Sampling
http://slidepdf.com/reader/full/lqt-de003-guidelines-on-represemtative-drug-sampling 40/60
The Student t -distribution, relative to d ƒ degrees of freedom (see Table 7.1),
can be used to calculate an interval that contains with (1 – ␣)100%
probability the weight of a drug unit in a population.
Application
Using the Student-t distribution theory, we can estimate the average
weight of a drug unit in a population within a given confidence(1 – ␣)100% .
EUROPEAN NETWORK OF FORENSIC SCIENCE INSTITUTES - DRUGS WORKING GROUP
Chapter 7
Estimation of weight
38
dƒ
␣0.05 0.01
1 12.706 63.657
2 4.303 9.925
3 3.182 5.841
4 2.776 4.604
5 2.571 4.032
6 2.447 3.707
7 2.365 3.499
8 2.306 3.355
9 2.262 3.250
10 2.228 3.169
11 2.201 3.106
12 2.179 3.055
13 2.160 3.012
14 2.145 2.977
15 2.131 2.947
16 2.120 2.921
17 2.110 2.898
dƒ
␣0.05 0.01
18 2.101 2.878
19 2.093 2.861
20 2.086 2.845
21 2.080 2.831
22 2.074 2.819
23 2.069 2.807
24 2.064 2.797
25 2.060 2.787
26 2.056 2.779
27 2.052 2.771
28 2.048 2.763
29 2.045 2.756
30 2.042 2.750
40 2.021 2.704
60 2.000 2.660
120 1.980 2.617
ϱ 1.960 2.576
Table 7.1 Student-t distribution.
The solving values of the equation for some degrees of freedom dƒ and a threshold
index ␣.

7/30/2019 LQT-De003 Guidelines on Represemtative Drug Sampling
http://slidepdf.com/reader/full/lqt-de003-guidelines-on-represemtative-drug-sampling 41/60
This can be expressed by the following relation:
s s X – t
␣≤ ≤ X + t
␣ n n
where:
= the average weight of the drug unit in the population;
X = the average weight of the drug unit in the sample;
s = the standard deviation of the measurements;
n = the sample size;
and t ␣
is the solving value of the Student-t distribution with d ƒ = n – 1
degrees of freedom within the confidence coefficient ␣ (Table 7.1).
In practice, an appropriate software application can be used to assist with the determination of the confidence interval applied to the
estimated weight of the drug unit.
In common practice, an acceptance criterion is that the sampling
results are taken into consideration if the ratio between the standard
deviation s and the average weight X _
of a drug unit in the sample is less
than 0.1 (RSD<10%). Otherwise, an increase of the sample size is
required in order to reach the target percentage. (If this cannot be
reached because the sample weight is not a normally distributedrandom variable, we could be forced to weigh the entire exhibit,
not using statistical inference any more).
The estimation of the total weight of the exhibit (W ) can be obtained
by multiplication by N of the average value and the standard deviation
as follows.
If w = NX _
and = Ns, then the estimation of the total weight W is
The same approach can be used for the estimation of the total weight of
illicit drug in an exhibit, after quantification of the drug present in each
sample unit.
GUIDELINES ON REPRESENTATIVE DRUG SAMPLING - CHAPTER 7 ESTIMATION OF WEIGHT
39
w – –––––––t ␣
≤ W ≤ w + –––––––t ␣
n n
s s X – t
␣ ≤ ≤ X + t ␣ n n
w – –––––––t ␣ ≤ W ≤ w + –––––––t ␣ n n

7/30/2019 LQT-De003 Guidelines on Represemtative Drug Sampling
http://slidepdf.com/reader/full/lqt-de003-guidelines-on-represemtative-drug-sampling 42/60
If r negative results are obtained after the analysis of the drug units,
for the estimation weight of the total (positive) drug exhibit,
n – r
a corrector factor P corr = ––––– should be used:n
nMoreover, for a population where –– > 0.1, a further correction factor
N
Q corr = –––––
should be applied, giving:
Example 1
Let’s suppose that an exhibit of suspected heroin is contained in
100 packages. We want to estimate the average weight of a drug unit
in the population with a probability of 95%.
According to the applied representative sampling theory, followingthe example indicated in the paragraph about the hypergeometric
distribution, a sample of 23 units is taken and each of them weighed
and analysed.
The average net weight of the powder in the 23 units is X – = 0.265 g with
the standard deviation s of 0.023 g. Since the error is 8.7%, the acceptance
criterion is satisfied.
The value of t ␣
from the Table 7.1 is 2.074, the corrector factor Q corr is
0.877 and the estimate weight for the total exhibit W is:
(26.500 – 0.873) g ≤ W ≤ (26.500 + 0.873) g
If one negative result is obtained after the analysis of the drug units,
the correction factors are P corr = 35/36 and Q corr = 0.800. So assuming,
for the sake of this example, that the additional sample size does not
change the values of X _
and s, then the estimate weight for the total
positive drug exhibit is W 1 is:(25.764 – 0.605) g ≤ W 1 ≤ (25.764 + 0.605) g
EUROPEAN NETWORK OF FORENSIC SCIENCE INSTITUTES - DRUGS WORKING GROUP
40
P corr P corr
P corr w – ––––––– t ␣ ≤ W ≤ P corr w + ––––––– t
␣
n n
Q corr = ––––– N–n
N
P corr P corr
P corr w – Q corr ––––––– t ␣ ≤ W ≤ P corr w +Q corr ––––––– t
␣
n n

7/30/2019 LQT-De003 Guidelines on Represemtative Drug Sampling
http://slidepdf.com/reader/full/lqt-de003-guidelines-on-represemtative-drug-sampling 43/60
In the same way, if two negatives results are obtained, the correction
factors are P corr = 44/46 and Q corr = 0.735. So we have
(25.348 – 0.480) g ≤ W 2 ≤ (25.348 + 0.480) g
Theory
The t -Student distribution theory may solve problems of estimation
of the average of a number of measurements n.
The definition of the t -Student distribution, relative to d ƒ degrees
of freedom, is:
If ␣ is a threshold index, the value t ␣
according to which the probability
calculated between – t ␣ and t
␣ is equal to 1 – ␣, can be calculated from
the following equation:
The solving values of the equation for some values of d ƒ and ␣ are listed
in Table 7.1.
GUIDELINES ON REPRESENTATIVE DRUG SAMPLING - CHAPTER 7 ESTIMATION OF WEIGHT
41
⌫
[(dƒ + 1)
ƒ (t ) = ––––––––––––––––––– 1+
1
- –(dƒ+1)
2
1–– 2dƒ
⌫ ––– dƒ 2
dƒ t 2–––
t ␣
P ␣
= 1– ␣ = ∫ 1+ dt
– t ␣
⌫ (dƒ + 1)
–––––––––––––––––––
1–– 2
dƒ ⌫ ––– dƒ
2
dƒ
t 2–––
1- – (dƒ+1)
2

7/30/2019 LQT-De003 Guidelines on Represemtative Drug Sampling
http://slidepdf.com/reader/full/lqt-de003-guidelines-on-represemtative-drug-sampling 44/60
Sergio SCHIAVONE (Chairman of the Sampling Subcommittee)
Raggruppamento Carabinieri Investigazioni Scientifiche,
Reparto di Roma, Sezione di Chimica
Via Aurelia 511, 00165 Roma, Italia
Phone 0039-06-66394656,
Fax 0039-06-66394748,
e-mail [email protected]
Martine PERRIN
Institut de Recherche Criminelle de la Gendarmerie Nationale,
Department Toxicologie
1, Boulevard Theophile Sueur, F-93111, Rosny Sous Bois Cedex, France
Phone 0033-1-49355079,
Fax 0033-1-49355027,
e-mail [email protected]
Hugh COYLE (also macro development)
Forensic Science Laboratory,
Department of Justice, Equality and Law Reform, Garda Headquarters
Phoenix Park, Dublin 8, Ireland
e-mail [email protected]
Henk HUIZER
Netherlands Forensic Institute Volmerlaan 17, 2288 GD Rijswijk, Netherlands (till Oct 15th, 2004)
e-mail [email protected]
Annabel BOLCK
Netherlands Forensic Institute
Volmerlaan 17, 2288 GD Rijswijk, Netherlands (till Oct 15th, 2004)
e-mail: [email protected]
EUROPEAN NETWORK OF FORENSIC SCIENCE INSTITUTES - DRUGS WORKING GROUP
List of contributers
42

7/30/2019 LQT-De003 Guidelines on Represemtative Drug Sampling
http://slidepdf.com/reader/full/lqt-de003-guidelines-on-represemtative-drug-sampling 45/60
Bruno CARDINETTI
Raggruppamento Carabinieri Investigazioni Scientifiche,
Reparto di Roma, Sezione di Balistica
Via Aurelia 511, 00165 Roma, ItaliaPhone 0039-06-66394668,
Fax 0039-06-66394748,
e-mail: [email protected]
Note: This document ‘Guidelines on representative drug sampling’ is an
ENFSI WG Drugs document, which means that all the rights are given to
the WG steering committee; the steering committee has the right to
propose changes and to have the document updated at any time.
However, the document will contain, in this chapter, the names of all
colleagues and their laboratories that have contributed in writing.
GUIDELINES ON REPRESENTATIVE DRUG SAMPLING - LIST OF CONTRIBUTERS
43

7/30/2019 LQT-De003 Guidelines on Represemtative Drug Sampling
http://slidepdf.com/reader/full/lqt-de003-guidelines-on-represemtative-drug-sampling 46/60
Aitken C.G.G., “Sampling - How big a sample?”,
Journal of Forensic Sciences, JFSCA, 1999, 44(4), 750-760.
Aitken C., Bring J., Leonard T., Papasouliotis O.,
“Estimation of quantities of drugs handled and the burden of proof”,
Statist. Soc ., 1997, 160(2), 333-350.
Amraoui Y., Allio I., Garcia C., Perrin M., ”Echantillonnage etinterprétation : application aux produits de saisie analysés par un
laboratoire de toxicologie”, ATA, 2001, vol XIII, n°4, 265-274.
Azoury M., Grader-Sageev D., Avraham S., “Evaluation of Sampling
Procedure for Heroin Street Doses”, Journal of Forensic Sciences,
JFSCA, 1998, 43 (6), 1203-1207.
Clark A.B., Clark C.B., “Sampling of Multi-unit Drug Exhibits”, Journal of Forensic Sciences, JFSCA, 1990, 35 (3), 713-719.
Colon M., Rodriguez G., Diaz R.O., “Representative Sampling of “street”
Drug Exhibits”, Journal of Forensic Sciences, JFSCA, 1993, 38(3), 641-648.
Coulson S.A., Coxon A., Buckleton J.S., “How many Samples from
a Drug Seizure Need to be analysed”, Journal of Forensic Sciences,
JFSCA, 2001, 46(6), 1456-1461.
Frank, R.S., Hinkley, S.W. and Hoffman, C.G., “Representative Sampling
of Drug Seizures in Multiple Containers”, Journal of Forensic Sciences,
JFSCA, 1991, 36 (2), 350-357.
Masson (Ed.) ”Initiation aux méthodes de la statistique et du calcul des
probabilités”, Paris, 1996 ;179-180.
Miller J., “Statistics and chemometrics for analytical chemistry”,
4th Edition, Pearson education limited, Harlow, 2000.
EUROPEAN NETWORK OF FORENSIC SCIENCE INSTITUTES - DRUGS WORKING GROUP
References
44

7/30/2019 LQT-De003 Guidelines on Represemtative Drug Sampling
http://slidepdf.com/reader/full/lqt-de003-guidelines-on-represemtative-drug-sampling 47/60
Sutherland G.,J., “Sampling and Identifying Multiple Discrete Objects
containing Drugs,” Analog, Australasian Forensic Drug Analysis Bulletin,
Vol. 14, No. 1, January 1992, 9-12
SWGDRUG, “Sampling seized Drugs for Qualitative Analysis”,
www.swgdrug.org
Tzidony D., Ravreby M., ”Statistical Approach to Drug Sampling :
A Case Study”, Journal of Forensic Sciences, JFSCA, 1992, 37(6), 1541-1549.
UNDCP “Recommended Methods for Testing Illicit Ring-Substituted
Amphetamine Derivatives”, ST/NAR/12, 1987.
UNDCP “Recommended Methods for Testing Opium, Morphine and
Heroin”, ST/NAR/29/Rev.1, 1998.
GUIDELINES ON REPRESENTATIVE DRUG SAMPLING - REFERENCES
45

7/30/2019 LQT-De003 Guidelines on Represemtative Drug Sampling
http://slidepdf.com/reader/full/lqt-de003-guidelines-on-represemtative-drug-sampling 48/60
Table 5.1 Hypergeometric distribution. Required sample size to
guarantee with 95% or 99% confidence that the seizure contains at least
a proportion of k drugs, if expected that all sampled units contain drugs.
Table 5.2 Hypergeometric distribution. Required sample size to
guarantee with 95% or 99% confidence that the seizure contains at least
a proportion of k drugs, if expected that either 1 or 2 sampled units do
not contain drugs (1 or 2 negatives).
Table 5.3 Binomial distribution. Required sample size to guarantee with
95% or 99% confidence that the seizure contains at least a proportion of
k drugs if expected that 0, 1 or 2 sampled units do not contain drugs
(0, 1 or 2 negatives). Use this only for large seizures.
Table 5.4 Beta distribution (with parameters x + a and n – x + b ).
Required sample size to guarantee with a probability of 95% or 99%that the seizure contains at least a proportion of k drugs if expected that
0, 1, or 2 sampled units do not contain drugs (0, 1 or 2 negatives).
A large seizure is assumed ( N > 50). Use (a=1, b=1) if no prior information
is known, (a=0.5, b=0.5) if it is reasonable to assume that either
everything is drugs or nothing is drugs (a=3, b=1, or more extreme values)
if there are reasons to believe that all or most of the seizure contains
drugs.
Table 6.1 Hypergeometric distribution. Number of samples to be taken
for describing (with 95% confidence) a certain proportion of drugs in a
seizure, assuming 0 negatives in the sample.
Table 7.1 Student-t distribution. The solving values of the equation for
some degrees d ƒ of freedom and a threshold index ␣.
EUROPEAN NETWORK OF FORENSIC SCIENCE INSTITUTES - DRUGS WORKING GROUP
Appendix A
Tables
46
pag.16
17
22
25
31
38

7/30/2019 LQT-De003 Guidelines on Represemtative Drug Sampling
http://slidepdf.com/reader/full/lqt-de003-guidelines-on-represemtative-drug-sampling 49/60
Figures
Figure 5.1 Confidence against sample size ( N = 100; k = 0.9) for 0, 1, and
2 negatives. Lines -᭹- for 0 negatives; -᭺- for 1 negative; -᭢- for 2 negatives
Figure 5.2 Proportion of drug in seizure against sample size
( N = 100; P = 0.95) for 0, 1, and 2 negatives expected.
Lines -᭹- for 0 negatives; -᭺- for 1 negative; -᭢- for 2 negatives
GUIDELINES ON REPRESENTATIVE DRUG SAMPLING - APPENDIX A TABLES AND FIGURES
47
pag.18
19

7/30/2019 LQT-De003 Guidelines on Represemtative Drug Sampling
http://slidepdf.com/reader/full/lqt-de003-guidelines-on-represemtative-drug-sampling 50/60
The software is a Microsoft Excel 2000 application. You will need to have
the ‘Analysis ToolPak’ add-in installed (select: Tools / Add ins… / Analysis
ToolPak). The ‘protection’ option (without a password) is enabled so that
users may only enter data in specific required cells. This protection
option can be disabled if you wish to experiment with the package.
Excel can handle numbers up to about 1E+308. If a number (either in a
result or an intermediate calculation) exceeds this value, then anoverflow error occurs and a ‘#NUM’ error result is returned. Users must
be aware of this when dealing with large numbers. For example:
100000 tablets, 0.99 confidence, k = 0.99, expected negatives = 2 will give
an invalid result for the sample size. No laboratory would ever use such
unrealistic levels. However users should be aware of the limitations of
the software.
The graph is for display purposes only. The sample size scale is set from1 to 100 as this range will cover most results.
Hypergeometric Sampling
1. The Excel sheet has five tabs at the bottom (Instructions,
Hypergeometric, Bayesian, Binomial and Estimation of Weight).
2. Select the Hypergeometric tab.
3. Enter the desired values for steps 1, 2, 3 and 4.4. The required sample size will be given at step 5 (cell B5).
The Excel hypergeometric distribution function used here is as follows:
P = HYPGEOMDIST ((n-r), n, (N*k)-1, N)
This gives the probability of finding n-r positives in a sample of size n
taken from a population N containing N*k-1 positives.
EUROPEAN NETWORK OF FORENSIC SCIENCE INSTITUTES - DRUGS WORKING GROUP
Appendix B
Software instructions
48

7/30/2019 LQT-De003 Guidelines on Represemtative Drug Sampling
http://slidepdf.com/reader/full/lqt-de003-guidelines-on-represemtative-drug-sampling 51/60
In the case of 0 negatives expected (r = 0):
If P gives the probability of finding n positives, then 1- P gives the
probability of not finding this number of positives. In other words 1- P
gives the probability of finding at least one negative. A sample size n ischosen to give a value for 1- P which exceeds the desired confidence level
(1 – ␣).
Note: It may happen that a number of samples have been taken,
assuming that there would be zero negatives; however, upon analysis one
of the samples appeared to be negative. What can then be said about the
proportion of the seizure that is positive for drugs? The macro can also
calculate this proportion. (Note: depending on the setting of your Excelprogram, points or commas must be used for decimals)
Scenario:
Seizure of 1000 tablets
Proportion of positives = 0.9
Expected negatives = 0
Confidence level = 0.95
This requires a sample size of 28.
Suppose you have analysed these 28 tablets and found one negative,
what proportion of the seizure can you still be 0.95 confident to contain
positives?
Step 1: Start at the begin position. Scroll down until sample size 28 is
visible on the screen (This has a current probability value of 0.951419384)Step 2: Change the ‘expected negatives’ value from 0 to 1.
(This will reduce the probability value for sample size 28 to 0.793866654)
Step 3: Reduce the value for ‘proportion of positives’ continuously until
the probability for sample size 28 reaches or exceeds 0.95 again
(this happens when k=0.84)
Therefore we can be 95% confident that 84% of the seizure contains
positives.
GUIDELINES ON REPRESENTATIVE DRUG SAMPLING - APPENDIX B SOFTWARE INSTRUCTIONS
49

7/30/2019 LQT-De003 Guidelines on Represemtative Drug Sampling
http://slidepdf.com/reader/full/lqt-de003-guidelines-on-represemtative-drug-sampling 52/60
Bayesian Sampling
1. Select the Bayesian tab.
2. Enter the desired values for steps 1, 2, 3, 4, 5 and 6.
Note 1: Although population size is not used in the calculations for the
beta distribution, it is necessary to enter the population size so that the
software can decide whether to use beta or beta-binomial distribution in
the calculations.
Note 2: The values selected for steps 2 and 3 (a and b values) will depend
on the analyst’s prior knowledge or assumptions about O–.3. The required sample size will be given at step 7 (cell B7).
N > = 50
The Excel beta distribution function used here is as follows:
P (O–>k)=BETADIST (k,a +(n-r ), b + r , lower limit for k, upper limit for k).
N
< 50The ⌫(x) function can be calculated in Excel by using a combination of the EXP
and GAMMALN worksheet functions as follows:
GAMMALN(x) = LN( ⌫(x))
The EXP function is the inverse of the LN function therefore:
EXP(GAMMALN(x)) = ⌫(x)
This function is incorporated into the beta-binomial distribution
equation as follows:
P (Y>=y)=
( EXP(GAMMALN(n+a+b))*COMBIN( N-n,y) * EXP(GAMMALN( y+x+a)) *
EXP(GAMMALN( N-x-y+b) ) / ( EXP(GAMMALN(x+a) *
EXP(GAMMALN(n-x+b)) * EXP(GAMMALN( N+a+b) )
Binomial Sampling
1. Select the Binomial tab.
2. Enter the desired values for steps 1, 2 and 3.
3. The required sample size will be given in step 4 (cell B4).
EUROPEAN NETWORK OF FORENSIC SCIENCE INSTITUTES - DRUGS WORKING GROUP
50

7/30/2019 LQT-De003 Guidelines on Represemtative Drug Sampling
http://slidepdf.com/reader/full/lqt-de003-guidelines-on-represemtative-drug-sampling 53/60
The Excel binomial distribution function used here is as follows:
P = BINOMDIST (n-r, n, k, FALSE)
Estimation of Weights
1. Select the Estimation of Weight tab.
2. Enter the desired values for steps 1 to 6.
3. The confidence interval is given in cells B12: D12
The confidence interval is calculated as follows:
C.I. = mean weight ± t *s/ √n
In the event of any negatives being detected in the samples, a correction
factor (n-r )/n is applied as follows:
C.I. = (mean weight) * (n-r )/n ± (t *s/ √n) * (n-r )/n
For smaller populations where n/N > 0.1 a further correction factor
√((N-n)/N ) is applied giving:
C.I. = (mean weight) * (n-r )/n ± (t *s/ √n) * (n-r )/n* √(( N-n)/ N )
Note: This software has not yet been validated
GUIDELINES ON REPRESENTATIVE DRUG SAMPLING - APPENDIX B SOFTWARE INSTRUCTIONS
51

7/30/2019 LQT-De003 Guidelines on Represemtative Drug Sampling
http://slidepdf.com/reader/full/lqt-de003-guidelines-on-represemtative-drug-sampling 54/60
Executive summary. Presented by Kimmo Himberg, ENFSI chairman,
to the EU Police Co-operation WG dated November 26th, 2003
Sampling on the national / regional / laboratory level
Sampling is a strategy and its intensity is highly dependent on the
ultimate purpose of the results, the original question, and the final aimsof the investigation. National laws and legal practices dictate most of
them. In practice, sampling is not strictly defined and thus regional
police forces, courts and the laboratories have the possibility to develop
their own sampling strategies. Sampling should be fit for the purpose,
i.e. it should be satisfactory for the customer, easy to understand, adapted
to the workload of the laboratory, and cost effective. Further, experience
with the local drugs market should be taken into consideration.
For sampling in regional or national level, a general rule seldom yieldsperfect solution. In other words, a general sampling advice may result
almost by definition in too few or too many samples; too few samples
being insufficient, and too many samples wasting time and money.
In conclusion, the ENFSI advice on sampling cannot override those rules
defined on national or regional level.
Thus, ENFSI considers that no specific sampling procedure should be
recommended on the national level. It is up to the national authoritiesto choose and develop an appropriate fine-tuned sampling strategy,
satisfactory to and accepted by all relevant parties (police, prosecutors,
courts). However, ENFSI strongly recommends documentation of the
sampling strategy and, when appropriate, providing the police and/or
customs with written instructions.
EUROPEAN NETWORK OF FORENSIC SCIENCE INSTITUTES - DRUGS WORKING GROUP
Appendix C
ENFSI guidelines on representative
sampling of drugs
52

7/30/2019 LQT-De003 Guidelines on Represemtative Drug Sampling
http://slidepdf.com/reader/full/lqt-de003-guidelines-on-represemtative-drug-sampling 55/60
Sampling on the international level
ENFSI has been asked to consider sampling of large seizures with clearly
international aspects, e.g. in cases where suspects are located in morethan one country. It was felt as necessary to have a reasonable strategy
that is broadly supported by the forensic laboratories in EU countries and
that can be used as a guideline for police and customs officers.
Also here the starting point is the sampling strategy. Since the final
purpose of the results of sampling and the subsequent chemical analysis
are unknown and may vary from case to case, only a general strategy can
be recommended.
As mentioned above, there is no single perfect solution; any sampling
strategy is by definition a compromise between level of perfection and
workload, and strongly driven by the various needs. As a consequence,
there is no single strategy fully supported by all parties involved.
Nevertheless, ENFSI seeks a solution with a broad support, giving
individual European organisations the possibility to do more in cases
where they consider that as appropriate. In particular cases the forensicchemist has to explain the principles of sampling. This is especially
important when applying approaches such as the Bayesian theory,
which may be difficult to be understood by a layman.
The ENFSI advice on the sampling strategy for international cases:
a) must have a basis easy to explain in terms of statistics;
b) must be practical and easy to understand, also when used by thepolice and customs officers;
c) must be realistic, and not result in an increase in the workload of
the laboratories (i.e. enable acceptable turn round times);
d) must be defendable in court.
GUIDELINES ON REPRESENTATIVE DRUG SAMPLING - APPENDIX C ENFSI GUIDELINES
53

7/30/2019 LQT-De003 Guidelines on Represemtative Drug Sampling
http://slidepdf.com/reader/full/lqt-de003-guidelines-on-represemtative-drug-sampling 56/60
Based on these requirements, ENFSI advises that the minimum
standard to be included for sampling of large international cases
should:
1. result in a detailed report on the seizure (description of samples,
sample numbers, weights, packages, origin, external characteristics,
appearance, pictures, etc.) by the law enforcement authorities,
for the use by the forensic experts and the court.
2. utilise a sampling technique based on the hypergeometric or Bayesian
methods with 95 % confidence level and 50 % proportion level
(at least half of the items).
Note 1: This means that a minimum of 5 samples must be taken for
chemical investigation, if it is expected that all sampled units contain
drugs.
Note 2: If re-sampling is not possible, 8 samples are recommended.
These 8 samples are based on the possible (but unlikely) finding that
1 of these samples appears to be negative. In that case still 50 % of the
packages can be guaranteed to be positive for drugs.
Note 3: If the material gives rise to some doubt, at least 11 samples are
recommended. This is based on the possible (but unlikely) finding that
2 of these samples appear to be negative. In that case still 50 % of the
packages can be guaranteed to be positive for drugs.
Note 4: If a forensic laboratory carries out the sampling or the
sub-sampling the number of samples can be influenced by the actualfindings of the chemical analysis. Hypergeometric or Bayesian tables
can be used to calculate the sample size.
The document ENFSI Guidelines on Representative Drug Sampling
contains detailed descriptions of various sampling techniques.
EUROPEAN NETWORK OF FORENSIC SCIENCE INSTITUTES - DRUGS WORKING GROUP
54

7/30/2019 LQT-De003 Guidelines on Represemtative Drug Sampling
http://slidepdf.com/reader/full/lqt-de003-guidelines-on-represemtative-drug-sampling 57/60
GUIDELINES ON REPRESENTATIVE DRUG SAMPLING - APPENDIX C ENFSI GUIDELINES
55

7/30/2019 LQT-De003 Guidelines on Represemtative Drug Sampling
http://slidepdf.com/reader/full/lqt-de003-guidelines-on-represemtative-drug-sampling 58/60
ENFSI European Network of Forensic Science Institutes
EU European Union
QA Quality Assurance
TLC Thin-layer Chromatography
SWGDRUG Scientific Working Group on Drugs
UNDCP United Nations Drug Control Program
UNODC United Nations Office on Drugs and Crime
WG Working Group
EUROPEAN NETWORK OF FORENSIC SCIENCE INSTITUTES - DRUGS WORKING GROUP
Appendix D
Abbreviations
56

7/30/2019 LQT-De003 Guidelines on Represemtative Drug Sampling
http://slidepdf.com/reader/full/lqt-de003-guidelines-on-represemtative-drug-sampling 59/60

7/30/2019 LQT-De003 Guidelines on Represemtative Drug Sampling
http://slidepdf.com/reader/full/lqt-de003-guidelines-on-represemtative-drug-sampling 60/60
E-mail: [email protected]
Website: www.enfsi.org