lp - vote 05 - 5pspp - provincial treasury budget/2005...7 the need to intensify the fight against...
TRANSCRIPT

PROVINCIAL TREASURY
Strategic Plan for 2005 to 2010
March 2005

2
FOREWORD The province – through the Second Growth and Development Strategy – enters the second decade of democracy resolved to continue to improve the quality of life of the population of Limpopo, grow the economy of the province, attain regional integration, enhance innovation and competitiveness and improve the institutional efficiency and effectiveness of government. The improvement of allocative efficiency of budgets, the strengthening of intergovernmental fiscal relations, strong and requisite corporate governance and the expansion of transparency in the area of financial management, are key strategic objectives of the Provincial Treasury. This year is not only the first year of second decade of democracy; it is also the fiftieth year of the Freedom Charter. Democratic South Africa celebrates the sound foundation of its own democracy – The Freedom Charter. In the spirit of this celebration Treasury shall, this year, reach out to the people of this province so that the journey of the budget and budgetary allocations is travelled together. In this way the relevance of budgetary allocations shall be enhanced. H. J. MASHAMBA MEMBER OF EXECUTIVE COUNCIL PROVINCIAL TREASURY

3
CONTENT PART A 1 Strategic Overview 1.1 Vision 1.2 Mission 1.3 Core Values 1.4 Legislatives Mandates 1.5 Sectoral Situation Analysis 1.6 HIV / AIDS Prevalance 1.7 The Skill level 1.8 Dependency Index and Level of Unemployment 1.9 Socio Economic Indictors 1.10 Financial Management PART B: Programme and Sub-Programs 2 Programme 1: Corporate Governance 2.1 Sub-Programme: Corporate Services 2.1.1 Situation analysis 2.1.2 Polocies,Priorities and Strategic Objectives 2.1.3 Strategic Objectives By Sub-Sub-Programme 2.1.3.1 Sub-Sub-Progrmme: Employment Relations 2.1.3.2 Sub-Sub-Programme: Human Resource development 2.1.3.3 Sub-Sub-Programme: Transformation Services 2.1.3.4 Sub-Sub-Programme: Government Information Technology Office 2.1.3.5 Sub-Programme: Legal Service 2.1.4 Analysis of Constrains and Measures Planned to Overcome Them 2.1.5 Planned Quality Improvement 2.2 Sub-Programme: Financial Mangement 2.2.1 Situation Analysis 2.2.2 Policies, priorities and strategic Objectives 2.2.3 Analysis of Constrains and Measures Planned to Overcome Them 2.3 Sub-Programme: Communication Service 2.3.2 Policies, priorities and strategic Objectives 2.4 Sub-Programme: Security and Risk Management Services 2.4.1 Situation Analysis 2.4.2 Policies, priorities and strategic Objectives
2.4.3 Analysis of Constrains and Measures Planned to Overcome Them 2.4.3 Description of Planned Quality Improvement 2.5 Situation Analysis 2.5.1 Policies, priorities and strategic Objectives 2.6 Programme 2 :Budget Services and Intergovernmental Relations 2.6.1 Sub-Programme: Policy Research and Management 2.6.2 Sub-Programme: Fiscal Policy 2.6.2.1 Sub-Sub-Programme: Fiscal Development and Budget allocation 2.6.2.2 Sub-Sub-Programme: Assets Restructuring Unit 2.6.2.3 Sub-Sub-Programme: Public Finance 2.6.3 Sub-Programme: Intergovernmental Relation 2.6.3.1 Sub-Sub-Programme: Financial Planning and Budget Management 2.6.3.2 Sub-Sub-Programme: Accounting and Reporting 2.6.3.3 Sub-Sub-Programme: Compliance and Capacity Building 2.7 Programme:3 Assets, Liabilities and System Management 2.7.1 Sub-Programme: Assets and Liabilities Management 2.7.1.1 Sub-Sub-Programme: Physical Asset Management 2.7.1.2 Sub-Sub-Programme: Banking and Cash Management 2.7.1.3 Sub-Sub-Programme: Liabilities Management 2.7.2 Sub-Programme: Financial Systems 2.7.2.1 Sub-Sub-Programme: Financial Systems Development 2.7.2.2 Sub-Sub-Programme: FINEST SUPPORT 2.7.2.3 Sub-Sub-Programme: BAS SUPPORT 2.7.2.4 Sub-Sub-Programme: Business Process and Help Desk 2.8 Programme 4: Financial Governance 2.8.1 Sub-Programme: Accounting Services 2.8.1.1 Sub-Sub-Programme: Governance and Compliance 2.8.1.2 Sub-Sub-Programme: Internal Control and Risk Management 2.8.1.3 Sub-Sub-Programme: Provincial Financial Training 2.8.1 Sub-Programme: Supply Chain Management 2.8.2.1 Sub-Sub-Programme: Policy Administration 2.8.2.2 Sub-Sub-Programme: Supply Chain Management implantation 2.8.2.3 Sub-Sub-Programme: Demand and acquisition Management 2.9 Analysis of Constrains and Measures Planned to Overcome Them

4
1. STRATEGIC OVERVIEW
1.1. VISION
LEADER IN FISCAL POLICY AND FINANCIAL MANAGEMENT SERVICE EXCELLENCE 1.2. MISSION
TO ATTAIN AND MAINTAIN EFFECTIVE FINANCIAL RESOURCE MOBILISATION, EQUITABLE ALLOCATION OF FUNDS AND SOUND CORPORATE GOVERNANCE
1.3. CORE VALUES
CORE VALUE Dynamism • Innovation
• Service Driven • Vibrancy • Motivated workforce
Ubuntu • Batho Pele
• Morals • Ethics • Collegiality

5
CORE VALUE Professionalism • Commitment
• Leadership • Ethics • Service • Turnaround times • Productivity • Integrity/honesty • Planning • Capacitated workforce
Accessibility/Transparency • Communication
• Honesty • Ease of access
1.4. LEGISLATIVE MANDATES
• Constitution of the Republic of South Africa • Public Finance Management Act • Borrowing Powers of Provincial Governments Act • Intergovernmental Fiscal Relations Act • Municipal Finance Management Act • Public Service Act • Other relevant legislation and policies of Executive Council, Budget Council and National Cabinet
1.5. SITUATIONAL ANALYSIS
Demographic Profile The Population Pyramid of Limpopo The age distribution of the population in Limpopo resembles the typical broad-base pyramid of developing countries, with a large portion of the population in
the younger age groups and a steadily decreasing proportion in the older age groups (Figure 1).

6
The population of the Limpopo province is, however, younger than that of the country as a whole. The population ratio declines from the 20 – 24 years age group. It would appear that the productive age groups migrate to other provinces. This implies the flight of skill as well as demand on resources for the educational, recreational and developmental interventions challenge. On the other hand if also offers an opportunity for growth and long term sustainable competitiveness.
Another distinctive feature of the province is that Limpopo has the highest female/male ratio in the country. Females account for 54,6% of the population in the province while the national average is 52.2%. The PGDS and the implementation thereof take cognisance of these demographic features and attempt to use these attributes as an asset. Further implications of the Population Pyramid of Limpopo are that large investment in education and training should be match by large investment in a fight against HIV/Aids as well as against poverty and hunger. This calls for a comprehensive approach to development.
Figure 1: Percentage (%) of population of Limpopo by Age Group and Gender:
0.3
0.60.6
1.11.2
1.31.2
1.72.2
2.63.2
3.34.1
4.8
6.77.3
6.95.7 5.7
6.97.1
6.64.1
2.92.3
2.11.7
1.51.2
0.80.70.60.5
0.30.2
0.1
10.00 8.00 6.00 4.00 2.00 0.00 2.00 4.00 6.00 8.00
0-4 yrs
5-9 yrs
10-14 yrs
15-19 yrs
20-24 yrs
25-29 yrs
30-34 yrs
35-39 yrs
40-44 yrs
45-49 yrs
50-54 yrs
55-59 yrs
60-64 yrs
65-69 yrs
70-74 yrs
75-79 yrs
80-84 yrs
85+
Females Males
Source: Statistics South Africa: Census 2001
1.5. HIV/Aids Prevalence
The period 1990 to 1993 the provincial HIV had similar trend as the National average. Since 1994 there has been a consistent widening of the gap between the national and the provincial prevalence rates. Limpopo’s prevalence has consistently remained below the national rate for a period of seven years to. Figure 2 below shows that as at 2001 the prevalence rate stood at 17.5% in Limpopo as against the national rate of 27.9%.

7
The need to intensify the fight against the HIV and Aids cannot be over emphasised. The province, through the Human Resources Development Strategy invests substantially in the skills development of the young its population. One of the major risks against the Human Resources Development Strategy of the province, and indeed the Provincial Growth and Development Strategy itself, is the inability of this young population of the province to mature into a high economic productive life due to illness caused by HIV/Aids.
Figure 2: HIV Prevalance In Limpopo
NATIONAL VS. LIMPOPO HIV TRENDS 2001
3.044.89
7.96 8.2
11.4 11.4313.2
14.515.6
17.5
7.57
10.44
14.1716.01
22.8 22.424.5 24.8
26.527.9
4.12.56
0.550.53
4.252.42
1.350.76
0
5
10
15
20
25
30
1990 1991 1992 1993 1994 1995 1996 1997 1998 1999 2000 2001 2002 2003
Limpopo National
1.6. The Skill Level
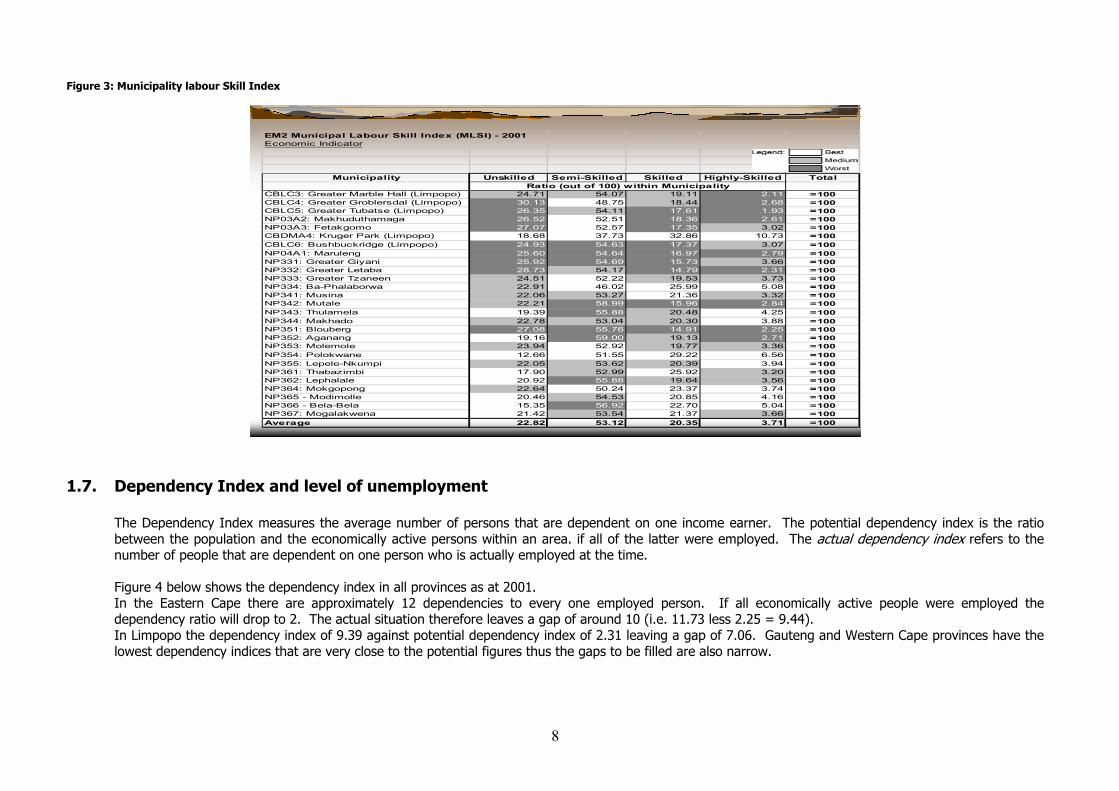
The averages for the Unskilled, Semi – Skilled, Skilled and Highly Skilled labour force in Limpopo in 2001 are 22.82%, 53.12%, 20.35% and 3.71% respectively. Eleven municipalities register significantly above average percentage in the unskilled category and fourteen municipalities have above average ratio in the semi skilled category. Only seven municipalities have above average percentage in the skilled category and five municipalities have a significantly above average percentage in the highly skilled category. See Figure 3 bellow.
8
Figure 3: Municipality labour Skill Index
EM2 Municipal Labour Skill Index (MLSI) - 2001Economic Indicator
Municipality Unskilled Semi-Skilled Skilled Highly-Skilled Total
CBLC3: Greater Marble Hall (Limpopo) 24.71 54.07 19.11 2.11 =100CBLC4: Greater Groblersdal (Limpopo) 30.13 48.75 18.44 2.68 =100CBLC5: Greater Tubatse (Limpopo) 26.35 54.11 17.61 1.93 =100NP03A2: Makhuduthamaga 26.52 52.51 18.36 2.61 =100NP03A3: Fetakgomo 27.07 52.57 17.35 3.02 =100CBDMA4: Kruger Park (Limpopo) 18.68 37.73 32.86 10.73 =100CBLC6: Bushbuckridge (Limpopo) 24.93 54.63 17.37 3.07 =100NP04A1: Maruleng 25.60 54.64 16.97 2.79 =100NP331: Greater Giyani 25.92 54.69 15.73 3.66 =100NP332: Greater Letaba 28.73 54.17 14.79 2.31 =100NP333: Greater Tzaneen 24.51 52.22 19.53 3.73 =100NP334: Ba-Phalaborwa 22.91 46.02 25.99 5.08 =100NP341: Musina 22.06 53.27 21.36 3.32 =100NP342: Mutale 22.21 58.99 15.96 2.84 =100NP343: Thulamela 19.39 55.88 20.48 4.25 =100NP344: Makhado 22.78 53.04 20.30 3.88 =100NP351: Blouberg 27.08 55.76 14.91 2.25 =100NP352: Aganang 19.16 59.00 19.13 2.71 =100NP353: Molemole 23.94 52.92 19.77 3.36 =100NP354: Polokwane 12.66 51.55 29.22 6.56 =100NP355: Lepele-Nkumpi 22.05 53.62 20.39 3.94 =100NP361: Thabazimbi 17.90 52.99 25.92 3.20 =100NP362: Lephalale 20.92 55.88 19.64 3.56 =100NP364: Mokgopong 22.64 50.24 23.37 3.74 =100NP365 - Modimolle 20.46 54.53 20.85 4.16 =100NP366 - Bela-Bela 15.35 56.92 22.70 5.04 =100NP367: Mogalakwena 21.42 53.54 21.37 3.66 =100Average 22.82 53.12 20.35 3.71 =100
Ratio (out of 100) within Municipality
1.7. Dependency Index and level of unemployment
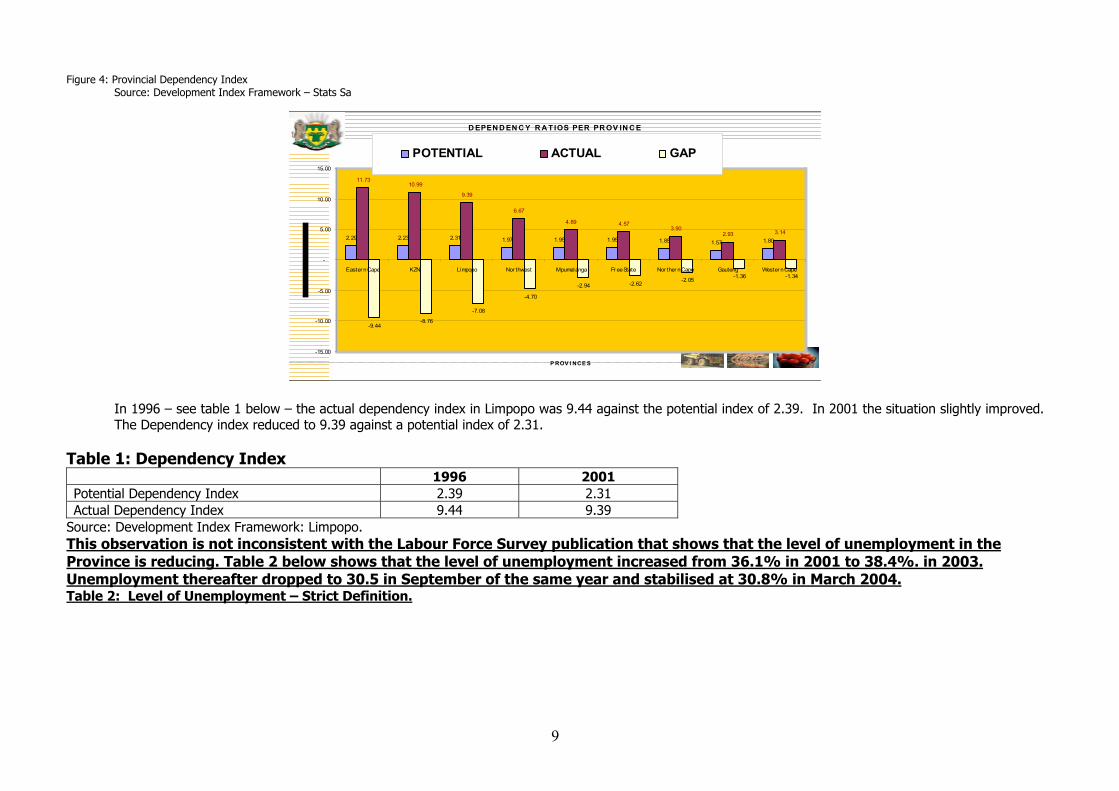
The Dependency Index measures the average number of persons that are dependent on one income earner. The potential dependency index is the ratio between the population and the economically active persons within an area. if all of the latter were employed. The actual dependency index refers to the number of people that are dependent on one person who is actually employed at the time.
Figure 4 below shows the dependency index in all provinces as at 2001. In the Eastern Cape there are approximately 12 dependencies to every one employed person. If all economically active people were employed the dependency ratio will drop to 2. The actual situation therefore leaves a gap of around 10 (i.e. 11.73 less 2.25 = 9.44). In Limpopo the dependency index of 9.39 against potential dependency index of 2.31 leaving a gap of 7.06. Gauteng and Western Cape provinces have the lowest dependency indices that are very close to the potential figures thus the gaps to be filled are also narrow.
9
Figure 4: Provincial Dependency Index Source: Development Index Framework – Stats Sa
D EPEN D EN C Y R A TIOS PER PR OV IN C E
2.29 2.23 2.31 1.97 1.95 1.95 1.85 1.57 1.80
11.7310.99
9.39
6.67
4.89 4.573.90
2.93 3.14
-9.44-8.76
-7.08
-4.70
-2.94 -2.62-2.05
-1.36 -1.34
-15.00
-10.00
-5.00
-
5.00
10.00
15.00
Easter n Cape KZN Limpopo Nor thwest Mpumalanga Fr ee State Nor ther n Cape Gauteng Wester n Cape
P ROV I NCE S
POTENTIAL ACTUAL GAP
In 1996 – see table 1 below – the actual dependency index in Limpopo was 9.44 against the potential index of 2.39. In 2001 the situation slightly improved. The Dependency index reduced to 9.39 against a potential index of 2.31.
Table 1: Dependency Index 1996 2001 Potential Dependency Index 2.39 2.31 Actual Dependency Index 9.44 9.39
Source: Development Index Framework: Limpopo. This observation is not inconsistent with the Labour Force Survey publication that shows that the level of unemployment in the Province is reducing. Table 2 below shows that the level of unemployment increased from 36.1% in 2001 to 38.4%. in 2003. Unemployment thereafter dropped to 30.5 in September of the same year and stabilised at 30.8% in March 2004. Table 2: Level of Unemployment – Strict Definition.

10
Unemployment rate (strict definition) among 15-65
27.830.8Mar 2004
28.430.5Sep 2003
31.238.4Mar 2003
29.536.12001
South South AfricaAfrica
%%
LimpopoLimpopo%%
Labour force Labour force surveysurvey
Notwithstanding the downward trend of the level of unemployment as stated above, the dependency indices in the Sekhukhune and Bohlabela District Municipalities are significantly higher than the already unacceptably high provincial dependency index of 9.39. (See Figure 5) In Sekhukhune District Municipality for every one person that is employed there are 19 other dependencies while in Bohlabela there are 11. Mopani and Waterberg have 6.7 and 4.4 dependency ratios respectively. Vhembe and Capricorn District Municipalities, though slightly below average, have also unacceptably high levels of dependency indices of 8.7 and 7.8 respectively.

11
Figure 5: Limpopo dependency ratio per district: 2001
4.4
6.7
7.8
8.7
11.2
19.0
0.0 5.0 10.0 15.0 20.0
Waterberg
Mopani
Capricorn
Vhembe
Bohlabela
Sekhukhune
Source: Development Index Framework: Limpopo. 1.8. Socio Economic Indicators
The economy of the Limpopo province constituted 6.5% of the total economy of the country in 2002, compared to 5.7% in 1995 (see

12
Figure 6). For the period 1996 to 2002 the economy of the province has been growing at an annual average rate of 4%, which is higher than national
average. However, the 2003 Gross Domestic Product Per Region shows that the economic growth rate has dropped to below national average.
The strengthening of the Rand has the effect of the reduction of commodity prices in rand terms. This development led to the slowing down of the pace of investment in the mining sector in the province, especially in the Dilokong area where major investments in the platinum mines are taking place. However, the platinum dollar price served so minimise an impact that could have been serious in the short term. The following chart shows the price of platinum in dollar terms. The platinum price spiked at the level of $940 an ounce during the first quarter of 2004 and thereafter declined to $780 an ounce in the middle of 2004 and improved gradually to $840 an ounce during the month of October 2004.
During the first quarter of 2004 the Rand/Dollar exchange rate peaked at the level of R7.32 per USD and subsequently dropped to bottom up at R5.92 and then rose slightly to around R6.30 in October this year. The strengthening of the South African Currency against the USD minimised the profitability of the commodity driven sectors such as mining. The low level of the gold price in the bullion market affected the gold mining companies in South Africa resulting in the realisation of negative growth.

13
The improved price performance in the platinum markets served as a natural hedge of the losses that would have been realised due to the strengthening of the rand. Notwithstanding this hedge, there has been a suspension of some of the expansion programmes by the platinum producing corporations, especially in Limpopo and more specifically in the Dilokong Corridor. This latter development has the potential to retard the provincial economic growth rate.

14
Figure 6: Provincial contribution to the national GDP: 2002
Limpopo6.5%
Western Cape14.2%
Eastern Cape7.9%
Northern Cape2.0%
Free State5.7%
KwaZulu-Natal16.4%
North-West6.6%
Gauteng33.8%
Mpumalanga6.9%
Source: Macro-Economic Indicators, Statistics South Africa: GDPR 2002
Figure 7 shows the relative contribution of the various sectors in 1995 and 2002, where Mining and Quarrying, General Government Services, Finance, Real Estate and Business Services, have seen the highest growth rates. Despite this, the structure of the economy has remained the same in that the relative contribution of Agriculture, Manufacturing, and Construction has remained low.

15
Figure 7: Provincial GDP in 1995 and 2002: R millions
0
5000
10000
15000
20000
1995 1119 5134 1534 1125 858 4415 1991 5139 1526 5371
2002 1794 15786 2777 1807 1503 8584 6231 10978 3367 13234
Agricul-ture Mining
Manufac-turing
Electri-city & water
Construc-tion Trade
Transport and
telecommu
Finance and real estate
Commnty services Govrnmnt
Source: Macro-Economic Indicators, Statistics South Africa: GDPR 2002
From 1995-2002 the province has registered significant achievements regarding economic growth (Figure ) in various sectors of the economy. The foundation of these achievements has been the significant number of policies and legislative framework aimed at deepening democracy and ensuring economic transformation of the province that has been developed and adopted over the past ten years. The emergence of a strong factor driven economy characterises this growth phenomenon that has been unable to create the much needed jobs in the province. The challenge therefore is to transform the economy which depended on the primary sector activity to the one driven by the services and manufacturing sector. Despite this marked improvement in the economic growth rate of the province, the employment growth rate is generally low, especially in Bohlabela and Sekhukhune. These districts are economically the weakest, but have large populations. This gives rise to a very high dependency ratio in both these districts, namely 11 and 19 respectively (

16
Notwithstanding the downward trend of the level of unemployment as stated above, the dependency indices in the Sekhukhune and Bohlabela District Municipalities are significantly higher than the already unacceptably high provincial dependency index of 9.39. (See Figure 5)
In Sekhukhune District Municipality for every one person that is employed there are 19 other dependencies while in Bohlabela there are 11. Mopani and Waterberg have 6.7 and 4.4 dependency ratios respectively. Vhembe and Capricorn District Municipalities, though slightly below average, have also unacceptably high levels of dependency indices of 8.7 and 7.8 respectively.

17
Figure above). The implication thereof is that each individual employed, in addition to him/ herself, has to support 11 or 19 other people depending on the district. Such a high dependency index stunts domestic investment and lowers the quality of life of the populace. In order to correct the structural challenges of the provincial economy, the second stage of Provincial Growth and Development Strategy seeks to grow the economy out of the factor driven stage through the increase of investment in the manufacturing and tertiary industries. The Provincial Growth and Development Strategy establish seven industrial clusters that are built on the first stage of the Provincial Growth and Development Strategy. The industrial clusters follow a value chain approach and will improve the capacity of the economy to create employment opportunities, raise the competitiveness and investment rating of the province, integrate all of government’s spheres to focus on areas that hold potential for optimum impact, enhance partnership of the public and the private sector for development and align the interventions of various public development institutions. The clusters being established by the Provincial Growth and Development Strategy are the following: -
• Platinum mining cluster on the Dilokong Corridor between Polokwane and Burgersfort (Sekhukhune district) and also in the Waterberg district • Coal mining and petrochemical cluster at Lephalale on the East-West Corridor (Waterberg district) • Fruit and Vegetable (horticulture) cluster in Vhembe, Mopani and Bohlabela • Logistics cluster in Polokwane (Capricorn district) • Red and White meat cluster on all the corridors (all districts) • Eight tourism sub-clusters at a number of high-potential destinations • Forestry cluster in the Mopani and Vhembe districts.
1.9. Financial Management
The financial performance of the provincial administration has improved over the years through improvement of financial systems and capacity building. The financial statements for the provincial departments have been qualified until the financial year 2001/02.
The major cause of the audit qualifications were the outstanding ledger balances remaining in the old financial control system (FCS) which were cleared during the financial year 2002/03. Furthermore the bill to write off the unauthorised expenditure for the financial control system era is in process.
While it is important to note that the audit outcomes for all the departments must be improved the province has moved from 100% qualification to 9 unqualified and only 1 disclaimer and in 2003/04 there was only one qualification.

18
Outcomes for 2003/04
In 2002/03 the province spent 98.1% of its allocated available budget, while in 2003/04 the provincial spending was 97.6% of the annual budget of the annual available budget of R22,315 billion resulting in under-spending of R538,677 million. The spending has decreased by 0.05% compared to the spending in 2002/03 where 98.1% was spent by departments. Table 2 below shows the annual provincial expenditure for the year 2003/04.
Table 2: Annual Provincial Expenditure for financial year 2003/04
Original Adjusted % Actual % of Variance
Budget Budget Adjusted Expend Budget Amount % Var
Department
Premier 189,337
191,978 1.4%
180,744 94.1%
11,234 5.9%
Education 8,511,801
8,732,036 2.5%
8,141,092 93.2%
590,944 6.8%
Agriculture 788,004
804,641 2.1%
786,391 97.7%
18,250 2.3%
Health 3,465,572
3,596,694 3.6%
3,724,393 103.6%
(127,699) -3.6%
Transport 371,165
374,201 0.8%
384,094 102.6%
(9,893) -2.6%
Public Works 1,243,639
1,319,090 5.7%
1,320,794 100.1%
(1,704) -0.1%
Safety, Security & Liason 12,895
13,312 3.1%
13,216 99.3%
96 0.7%
Welfare 4,979,752
5,385,260 7.5%
5,442,776 101.1%
(57,516) -1.1%
Legislature 70,980
74,845 5.2%
63,212 84.5%
11,633 15.5%
Local Government 824,936
878,338 6.1%
845,596 96.3%
32,742 3.7%
Finance & Econ Dev, 864,143
893,627 3.3%
826,134 92.4%
67,493 7.6%
Sports, Arts & Culture 50,626
51,491 1.7%
48,394 94.0%
3,097 6.0%
Total Expenditure
21,372,850
22,315,513 4.2%
21,776,836 97.6%
538,677 2.4%
The departments of Education, Agriculture, Local Government, Finance and Economic Development and Premier have the tendency of under-spent their budgets annually.

19
Furthermore, in the last two years the departments of Health, Welfare and Public Works overspent their budgets for the last two years.
Financial Management at Local Government The Auditor General report on Local Government audits highlighted problems of non-submission of financial statements. In the financial year 2003/04 fifteen out of twenty six municipalities did not succeed to submit their annual financial statements in time to the Auditor General. As at 21 January 2005, Annual Financial Statements of nine municipalities were still outstanding. Three municipalities’ Annual Financial Statements for 2002/03 financial year were still outstanding as of 21 January 2005. Two out of six District Municipalities submitted their annual financial statements for the 2003/0f financial year in time. Two out of the four District Municipalities that failed to meet the deadline for the submission of financial statements, still had their financial statements outstanding as of the 21 January 2005. Strategic focus of Provincial Treasury There are three key developments that have major implications for the role of Limpopo Treasury this year and over the MTEF period. These are: -
The coming into effect of the Municipal Finance Management Act The implementation of the Provincial Growth and Development Strategy The continued implementation of the Public Finance Management Act
The coming into effect of the Municipal Finance Management Act is another milestone in the strengthening of local government. In the light of the situational analysis stated above the Limpopo Treasury is urgently build requisite capacity in order to be able to assist the municipalities to meet the requirements of the act.
The Provincial Growth and Development Strategy expresses the following key objectives: -
The improvement of the quality of life of the population of Limpopo; Growing the economy of the province; Attain regional integration; Enhance innovation and competitiveness; Improve the institutional efficiency and effectiveness of government.
These objectives require strong intergovernmental relations and fiscal management that advances allocative efficiencies in order to bring about optimum outcomes. Treasury shall bring about innovations in order to leverage available resources and through a co-ordinated effort attract relevant partnerships for development.

20
In December 2004 the re-configuration of provincial departments resulted in the establishment of the Provincial Treasury as a stand alone department. Previously the department was constituted a branch of the Department of Finance and Economic Development. Four main programmes have been developed: -
• Corporate Governance • Budget Services and Intergovernmental Fiscal Relations • Assets, Liabilities and Systems Management • Financial Governance

21
PART B 2. PROGRAMME 1: CORPORATE GOVERNANCE Corporate Governance is aimed at developing and implementing sound corporate governance systems and policies for Provincial Treasury as a Department. The programme is structured into the following sub-programmes:-
- Corporate Services; - Financial Management; - Communications; and - Risk Management and Security Services
2.1 SUB-PROGRAMME – CORPORATE SERVICES 2.1.1 SITUATION ANALYSIS A strong Corporate Services division that is aligned to the functional strategies of the Department and also supporting the overall strategy of the Department is a pre-requisite for attainment of the vision for the Provincial Treasury. Corporate Services’ main purpose in relation to the above would be to strengthen the dynamism of the Department for continuous improvement and also provide management and administrative support functions which include amongst others the following:
Human Resource Management to attract, develop and retain competent staff; Improvement of service delivery through strategic planning, performance management and organizational development and change management; Fleet, facilities and general records management; Executive management structure, responsible for strategy and policy formulation; Management of information and knowledge to support each core function’s information requirements to ensure service delivery; and Management of Legal Services and Labour relations within the Department.
Corporate Services has been inadequately resourced and structured in the past year. Structural problems, capacity and inadequate funds have to a larger extent reduced the ability of this sub-programme to respond to challenges and service delivery requirements posed by external environment, new legislation and additional core functions within the Department. However, the above mentioned problem has since been addressed by adopting a new structure for the division in line with legislation to enable support for delivery of Departmental strategic plan.

22
There are however still key challenges facing this sub-programme over this strategic plan period. The key challenges are the following:-
The implementation of Learnership and Internship programme in line with National Cabinet Decision of 2003; Even though progress has been made towards the achievement of a representative workforce, the present statistics still demonstrate that while females
occupy a large percentage of positions at lower levels, the management echelon in other divisions is not fully representative of population profile especially in terms of females. Attracting and recruiting disabled people is still one of the challenging aspect that the Department is facing;
The new Performance Management System has been zoomed in but full implementation of this new performance appraisal method, is still a challenge (i.e.) linking the Departmental strategy and component level objectives with individual performance goals;
Monitoring and evaluation of constitutional principles as well as performance outputs against set indicators within the Department, and the impact it has to public needs is also still a challenge;
Full implementation of the new regional model to ensure facilitation of regional developments as well as redesigning new business processes and control systems for the Department is another challenge;
Human resources not strongly focusing on delivery of service based on what the customer really wants; but the workforce that is focusing on compliance requirements is also another challenge for this sub-programme;
Provision of adequate resources to enable all the new Directorates adopted for the sub-programme (among others, legal services) to function adequately; and
No reliable baseline information for use on the departmental outputs of the Balance Scorecard;
2.1.2 POLICIES, PRIORITIES AND STRATEGIC OBJECTIVES The strategic goals and objectives of Corporate Services as aligned to the Governance and Administration Cluster priorities and the Department’s goals are as follows: Strategic Goal 1 Investment in education and training for service delivery, quality of life, and labour mobility for employees
Strategic objectives:
Provide financial assistance to external students; Implement Learnerships on core functions of the Department; Develop guidelines for systematic mentoring, career development and retention of skills; and Develop and implement internship programme.
Strategic Goal 2 Improved service delivery and health standards of all employees within Department
Strategic Objectives:
Co-ordinate the development and implementation of Service Improver Tool for all branches; To conduct an impact assessment on HIV/AIDS; and To conduct workplace analysis survey.

23
Strategic Goal 3 Effective departmental management and work organisation and strengthening of the interface to meet strategic service delivery objectives
Strategic Objectives: To rationalise District and Head office roles and responsibilities in terms of the newly created structure; To design business processes and control systems compatible to the new structure; and To develop a good corporate governance system for the Department including parastatals,
Strategic Goal 4 Improve the Implementation of PMS
Strategic Objectives: To accelerate the implementation of Performance Management System to penetrate all branches; To clarify and refine Departmental outputs of the Balanced Scorecard; To link the Departmental strategy and component level objectives with individual performance goals; and To develop a Departmental monitoring and evaluation system.
Strategic Goal 5 Effective Management of information and records within the Department
Strategic Objectives: Develop an information master system plan aligned to strategy of the Department; and Ensure restoration of records and retainment of knowledge within Department.

24
2.1.3 STRATEGIC OBJECTIVES BY SUB-SUB-PROGRAMME 2.1.3.1 SUB-SUB-PROGRAMME: EMPLOYMENT RELATIONS
Measurable Objective
Performance Measure / Indicator
Base Year 2004/05
Year 1 2005/06
Year 2 2006/07
Year 3 2007/08
Year 4 2008/09
Year 5 2009/10
Organisational performance enhancement
Work efficiency Attraction and retention of competent staff Operational PMS fully implemented Integrated HR Information Management System
Develop an organisational performance management policy Develop an operational PMS Revise organisational structure for dept. Workflow improvement Develop 10 HR policies Develop an integrated HR plan Clear backlogs on service benefits Update manual HR records system
Implement organisational performance management policy Implement operational PMS (departmental) Revise organisational structure for dept Workflow improvement Develop and implement HR policies Implement integrated HR plan Develop HR Management Information System
Alignment of PMS to Balanced Scorecard Implement operational PMS (departmental) Revise organisational structure for dept Workflow improvement Implement integrated HR plan Develop HR Management Information System Outsource development of records management and document archiving system
Alignment of PMS to Balanced Scorecard Implement operational PMS (departmental) Revise organisational structure for dept Workflow improvement Implement integrated HR plan Develop HR Management Information System and roll out to districts Outsource development of records management and document archiving system
Alignment of PMS to Balanced Scorecard Implement operational PMS (departmental) Revise organisational structure for dept Workflow improvement Implement integrated HR plan Implementation of the HR Management Information System Outsource development of records management and document archiving system
Alignment of PMS to Balanced Scorecard Implement operational PMS (departmental) Revise organisational structure for dept Workflow improvement Implement integrated HR plan Implementation of the HR Management Information System Implementation of the Records Management System

25
2.1.3.2 SUB-SUB-PROGRAMME: HUMAN RESOURCES DEVELOPMENT
Measurable Objective
Performance Measure or Indicator
Base year 2004/05
Year 1 2005/06
Year 2 2006/07
Year 3 2007/08
Year 4 2008/09
Year 5 2009/10
Skills enhancement for improved service delivery
Workplace Skills Plan fully implemented Bursary Scheme implemented internship and learnership programmes fully implemented
Grant 25% of the bursary budget to prospective students Grant bursary to 40 new applicants[serving officials] in the field of financial management, commerce Conclude 5% intake of interns as stipulated in the DPSA circular No. 1 of 2003 Finalise the development of learnership in Financial Management
Develop guidelines for various systematic mentoring, career development and retention of skills Grant 30% of the bursary budget to prospective students Grant bursary to 40 new applicants[serving officials] Conclude 5% intake of interns as stipulated in the DPSA circular No. 1 of 2003 Implement the learnership identified in base year
Conclude 5% intake of interns as stipulated in the DPSA circular No. 1 of 2003 Grant 35% of the bursary budget to prospective students Grant bursary to 40 new applicants[serving officials] Develop learnership in Project Management, records management and secretarial services
Conclude 5% intake of interns as stipulated in the DPSA circular No. 1 of 2003 Grant 40% of the bursary budget to prospective students Grant bursary to 40 new applicants[serving officials]
Conclude 5% intake of interns as stipulated in the DPSA circular No. 1 of 2003 Grant 45% of the bursary budget to prospective students Grant bursary to 40 new applicants[serving officials]
Conclude 5% intake of interns as stipulated in the DPSA circular No. 1 of 2003 Grant 50% of the bursary budget to prospective students Grant bursary to 40 new applicants[serving officials]

26
2.1.3.3 SUB-SUB-PROGRAMME: TRANSFORMATION SERVICES
Measurable Objectives
Performance Measure or Indicator
Base year 2004/2005
Year 1 2005/2006
Year 2 2006/2007
Year 3 2007/2008
Year 4 2008/2009
Year 5 2009/2010
Enhanced public service delivery
Employee wellness Safe and healthy work environment Representative workforce Service delivery excellence
Implement Employee Assistance Programme EAP needs assessment per chief directorate and districts. Implement KAP Survey recommendations Implement Occupational Safety and Health Programme Develop and implement Employment Equity Plan Review departmental service standards
Implement Employee Assistance Programme Develop and implement Employment Equity Plan Implement Occupational Safety and Health Programme Develop and implement Employment Equity Plan Develop and implement service delivery improvement programme per unit.
Implement Employee Assistance Programme Develop and implement Employment Equity Plan Conduct KAP Survey Implement Occupational Safety and Health Programme Develop and implement Employment Equity Plan Develop and implement service delivery improvement programme per unit.
Implement Employee Assistance Programme Develop and implement Employment Equity Plan Implement KAP Survey recommendations Implement Occupational Safety and Health Programme Develop and implement Employment Equity Plan Develop and implement service delivery improvement programme per unit.
Implement Employee Assistance Programme Develop and implement Employment Equity Plan Implement Occupational Safety and Health Programme Develop and implement Employment Equity Plan Develop and implement service delivery improvement programme per unit.
Implement Employment Assistance Programme Implement Occupational Safety and Health Programme Develop and implement Employment Equity Plan Develop and implement service delivery improvement programme per unit.

27
Measurable Objectives
Performance Measure or Indicator
Base year 2004/2005
Year 1 2005/2006
Year 2 2006/2007
Year 3 2007/2008
Year 4 2008/2009
Year 5 2009/2010
Co-ordinate implementation of special programmes
Co-ordinate implementation of special programmes
Co-ordinate implementation of special programmes
Co-ordinate implementation of special programmes
Co-ordinate implementation of special programmes
Co-ordinate implementation of special programmes
2.1.3.4 SUB-SUB-PROGRAMME: GOVERNMENT INFORMATION TECHNOLOGY OFFICE (GITO)
Measurable Objectives
Performance measure or Indicator
Base Year 2004/05
Year 1 2005/06
Year 2 2006/07
Year 3 2007/08
Year 4 2008/09
Year 5 2009/10
A reliable electronic communication system
Operational Master System Plan fully implemented
Align Information support with departmental business requirements Outsource Development of Master System Plan Upgrade Local Area Network for Ismini Towers, districts and regional offices Network management for the new office
Maintenance of departmental website Maintenance of the intranet Upgrade Local Area Network for Finance House and districts from hubs to switches Installation of an automated help desk system
Maintenance of departmental website Maintenance of the intranet Maintain Local Area Network at Head Office & Regional offices
Maintenance of departmental website Maintenance of the intranet Maintain Local Area Network at Head Office & Regional Offices
Maintenance of departmental website Maintenance of the intranet Maintain Local Area Network
Maintenance of departmental website Maintenance of the intranet Maintain Local Area Network

28
building Develop E-system for Tribal & Trust Account Develop E-systems Business Registration and Liquor Licensing Management System Develop departmental intranet and installation of firewalls in all districts
Installation of automated fax solution

29
2.1.3.5 SUB-PROGRAMME: LEGAL SERVICES
Measurable Objectives
Performance Measure for Indicator
Base Year 2004/05
Year 1 (targets) 2005/06
Year 2 (targets) 2006/07
Year 3 (targets) 2007/08
Year 4 (targets) 2008/09
Year 5 (targets) 2009/10
Good governance
Labour stability Efficient legal administration
Awareness and understanding of labour relations issues Full and sound protection of the Department’s interests in agreements, legal opinions and litigation Procurement of legal material for the library
Awareness and understanding of labour relations issues 20% implementation of the policy on disciplinary measures at management level 20% implementation of grievance procedures Full and sound protection of the Department’s interests in agreements, legal opinions and litigation Establish a constitutionally and legally sound index of Legislation Procurement of legal material for the library
Awareness and understanding of labour relations issues 40% implementation of the policy on disciplinary measures at management level 40% implementation of grievance procedures Full and sound protection of the Department’s interests in agreements, legal opinions and litigation Maintain a constitutionally and legally sound index of Legislation Procurement of legal material for the library
Awareness and understanding of labour relations issues 60% implementation of the policy on disciplinary measures at management level 60% implementation of grievance procedures Full and sound protection of the Department’s interests in agreements, legal opinions and litigation Maintain a constitutionally and legally sound index of Legislation Procurement of legal material for the library
Awareness and understanding of labour relations issues 80% implementation of the policy on disciplinary measures at management level 80% implementation of grievance procedures Full and sound protection of the Department’s interests in agreements, legal opinions and litigation Maintain a constitutionally and legally sound index of Legislation Procurement of legal material for the library
Awareness and understanding of labour relations issues 100% implementation of the policy on disciplinary measures at management level 100% implementation of grievance procedures Full and sound protection of the Department’s interests in agreements, legal opinions and litigation Maintain a constitutionally and legally sound index of Legislation Procurement of legal material for the library

30
2.1.4 ANALYSIS OF CONSTRAINTS AND MEASURES PLANNED TO OVERCOME THEM
The major constraints which will be experienced under this Programme will be shortages in capacity on performance of certain projects which require high level skills and experience from the present personnel attached to the Programme.
The Programmes would deal with these constraints by executing some of the projects through collaborations and partnerships with institutions. In some instances the Programme will outsource the projects, and getting the assistance of a professional service whilst ensuring that responsibility is retained by the Programme.
In addition, the Programme will recruit personnel with competencies required, and also provide accelerated training programme to recruit those who are short of skills and competencies required.
The following are some of the projects wherein capacity problems are envisaged:
Workplace analysis surveys; The implementation of the learnerhip and internship programme; HIV/AIDS impact assessment; Development of the Departmental Master System Plan; Change management project – to ensure full scale implementation of the regional model; Legal advisory service compatible to Department’s core function or business; and Development of the monitoring and evaluation system for the Department.
2.1.5 PLANNED QUALITY IMPROVEMENT MEASURES
The focus of this Programme’s services is supposed to be responsive to the Departmental core branches to enable them deliver on the Departmental strategy as opposed to the traditional way of doing things. There is also a requirement that services from Corporate Services be viewed differently by business units within the Department.
As a result of the above the Programme would make the following interventions to improve the quality of all services performed by Corporate and Transformation Programme:
The Programme will adopt the Service Level Agreement (SLA) method, which will be used to govern the relationship between Corporate Services and all other Business units. The SLA will ensure that the services, service levels are negotiated by both the Business units and Corporate Services. This will ensure that all services from Corporate Services are provided on a pull rather than push basis, and support the overall strategy of the Department.
In designing the service levels or quality for all services within the Programme, different legislation and policies parameters with respect to each service will be adhered to.

31
In addition to the SLA, the Programme will need to have an accelerated Capacity building programme for employees within Corporate Services on specific critical areas of services. The reason for this is that lack of capacity in certain services (within Corporate Services) is a high risk factor to an extent that such risk could have a negative impact on the overall quality of the Core functions for the Department.

32
2.2 SUB-PROGRAMME: FINANCIAL MANAGEMENT
Financial management sub-programme is divided into four sub-sub-programmes; namely:- • Budget Management; • Expenditure and Debt Management; • Supply Chain Management; and • Strategic Planning.
2.2.1 SITUATION ANALYSIS
Since the development of the Department to present structure in 2001, the Chief Financial Officer position was never filled for a considerable amount of time. There was no one who could ensure the training and development of staff members within the Financial Management Branch. Also, when Treasury positions where evaluated a lot of the expertise from Financial Management were lost.
Lack of development of most staff members has resulted in the decreasing of staff morale. Since Financial Management is the backbone of any organization and is the cornerstone to set the tone of the whole organization, there is a need to instill new hope and motivation to most employees within this branch.
This branch renders the following key support functions: - Budget management; - Procurement and Stores management; - Expenditure and Debt management; and - Co-ordination of the strategic plan

33
2.2.2 POLICIES, PRIORITIES AND STRATEGIC OBJECTIVES
Measurable Objectives
Performance Measure or Indicator
Year 0 2004/05
Year 1 2005/06
Year 2 2006/07
Year 3 2007/08
Year 4 2008/09
Year 5 2009/10
Establish and maintain effective, efficient and transparent systems of financial and risk management and internal control
• Obtain an unqualified audit opinion without matters of emphasis
• Favourable
audit opinion on the design and operating effectiveness of internal controls;
• Settle all
contractual obligations and pay all money owing within 30 days or as per agreement;
• Improved
revenue collection
• Compliance
with section 42 and section 43 of the PFMA;
• Risk
Management
Obtain unqualified audit report without matters of emphasis Per visit by Provincial Internal Audit & annually by Audit Committee Clear all payment backlogs Collect all monies due to the department; Ongoing Formulation and implement of the
Unqualified audit report without matters of emphasis Per visit by Provincial Internal Audit & annually by Audit Committee Implement payment system in line with provisions of PFMA Collect all monies due to the department; Ongoing Implement of the risk management
Unqualified audit report without matters of emphasis Per visit by Provincial Internal Audit & annually by Audit Committee Implement payment system in line with provisions of PFMA Collect all monies due to the department; Ongoing Review and update the risk
Unqualified audit report without matters of emphasis Per visit by Provincial Internal Audit & annually by Audit Committee Implement payment system in line with provisions of PFMA Collect all monies due to the department; Ongoing Review and update the risk
Unqualified audit report without matters of emphasis Per visit by Provincial Internal Audit & annually by Audit Committee Implement payment system in line with provisions of PFMA Collect all monies due to the department; Ongoing Review and update the risk
Unqualified audit report without matters of emphasis Per visit by Provincial Internal Audit & annually by Audit Committee Implement payment system in line with provisions of PFMA Collect all monies due to the department; Ongoing Review and update the risk
34
Measurable Objectives
Performance Measure or Indicator
Year 0 2004/05
Year 1 2005/06
Year 2 2006/07
Year 3 2007/08
Year 4 2008/09
Year 5 2009/10
Strategy in place.
• Zero balance of
the suspense accounts
• Updated
financial policies
• A system for
properly evaluating all major capital projects.
risk management strategy Appointment of a Service Provider Revisit policies for various types of expenditures like traveling, cell-phone, IT etc. Develop policies and procedures that enable the department to make informed decisions on the viability of investing in major capital projects.
strategy Clearance of all outstanding backlogs on suspense accounts As required Roll-out framework
management strategy As required
management strategy As required
management strategy As required
management strategy As required
Sound budgeting and budgetary control practices
• No commitment
of the department to a liability for which money has not been appropriated;
• Expenditure in
accordance with the vote of
Start reviewing on completion of next IYM report. Review upon completion of next IYM report. Start rolling out awareness on completion of
Expenditure is in line with original or revised appropriation. 80% alignment to department strategic plan. Completed awareness to employees of
Expenditure in line with original or revised appropriation. 85% alignment to department strategic plan. Compliance with the correct policies and
Expenditure in line with original or revised appropriation. 90% alignment to department strategic plan. Compliance with the correct policies and
Expenditure in line with original or revised appropriation. 95% alignment to department strategic plan. Compliance with the correct policies and
Expenditure in line with original or revised appropriation. 100% alignment to department strategic plan. Compliance with the correct policies and

35
Measurable Objectives
Performance Measure or Indicator
Year 0 2004/05
Year 1 2005/06
Year 2 2006/07
Year 3 2007/08
Year 4 2008/09
Year 5 2009/10
the department and the main divisions within the vote;
• Effective and
appropriate system to prevent unauthorised, irregular and fruitless and wasteful expenditure at various branches and levels;
• Efficient
management of budget
various policies mentioned above Regularly conduct budget workshops with branches and districts. Completion and timely submission of IYM
correct policies and procedures followed in expending funds. Ongoing Completion and timely submission of IYM
procedures Ongoing Completion and timely submission of IYM
procedures Ongoing Completion and timely submission of IYM
procedures Ongoing Completion and timely submission of IYM
procedures Ongoing Completion and timely submission of IYM
Robust system of expenditure and performance management
• Alignment of departmental budgets to strategic objectives;
• Policies and
procedures for quarterly reporting in place
Start rolling out awareness on completion of various policies mentioned above. Establish a system of reporting on financial and non-financial performance.
70% alignment to department strategic objectives.
80% alignment to department strategic objectives.
90% alignment to department strategic objectives.
95% alignment to department strategic objectives.
100% alignment to department strategic objectives.

36
Measurable Objectives
Performance Measure or Indicator
Year 0 2004/05
Year 1 2005/06
Year 2 2006/07
Year 3 2007/08
Year 4 2008/09
Year 5 2009/10
Maintenance of an appropriate procurement and provisioning system which is fair; equitable; transparent; competitive and cost-effective.
• A well capacitated Supply Chain Management Unit
Start moving towards operating independently and seeking advice from SCM Office as and when required.
100% independent
100% independent
100% independent
100% independent
100% independent
2.2.3 Analysis of constraints and measures planned to overcome them The major constraints experienced by this Branch are a lack of required financial skills. This results in the inability to exercise proper financial management and therefore ensure validity, accuracy and completeness of financial records and reports. This constraint will be dealt with mainly by attracting and retaining people from the private sector who have the necessary skills. We would also enter into performance agreements with employees which also look into their growth and development needs.

37
2.3 SUB-PROGRAMME: COMMUNICATION SERVICES
2.3.1 SITUATION ANALYSIS
The services provided by the Programme although salient are ethereal. As such, the end product is not quantifiable although have qualitative features. However, the medium in which it is expressed can be quantified in terms of: Packaged departmental products and services
Mainstream media supplementary inserts Advertisements and Advertorials Market demand research and testing
Communication Services Press Agentry and Media Relations Below and above line promotions Publicity Issues Management Community Relations Image and Corporate Identity Management Information Management
Internal and External Newsletter Website.

38
2.3.2 POLICIES, PRIORITIES AND STRATEGIC OBJECTIVES
Measurable objectives
Performance measure or
indicator
Base year 2004/05
Year 1 2005/06
Year 2 2006/07
Year 3 2007/08
Year 4 2008/09
Year 5 2009/10
To promote the corporate image of the department
Implementation of a corporate identity programme
Strengthening the capacity of department to influence the public agenda
Production of departmental literature materials such as newsletters, Annual report, Brochures and In-house news Portray the department as efficient by improving its corporate identity
Production of departmental literature materials such as newsletters, Annual report, Brochures and In-house news Portray the department as efficient by improving its corporate identity
Production of departmental literature materials such as newsletters, Annual report, Brochures and In-house news Portray the department as efficient by improving its corporate identity
Production of departmental literature materials such as newsletters, Annual report, Brochures and In-house news Portray the department as efficient by improving its corporate identity
Production of departmental literature materials such as newsletters, Annual report, Brochures and In-house news Portray the department as efficient by improving its corporate identity
Production of departmental literature materials such as newsletters, Annual report, Brochures and In-house news Portray the department as efficient by improving its corporate identity
Co-ordination of Official International relations programmes
Implementation of partnership programmes with stakeholders
Co-ordination of Official International relations programmes
Implementation of partnership programmes with stakeholders
Co-ordination of Official International relations programmes
Implementation of partnership programmes with stakeholders
Co-ordination of Official International relations programmes Implementation of partnership programmes with stakeholders
Co-ordination of Official International relations programmes
Implementation of partnership programmes with stakeholders
Co-ordination of Official International relations programmes
Implementation of partnership programmes with stakeholders

39
Measurable objectives
Performance measure or
indicator
Base year 2004/05
Year 1 2005/06
Year 2 2006/07
Year 3 2007/08
Year 4 2008/09
Year 5 2009/10
Implementation of Website programme Implementation of media relations programs Implementation of unmediated communication programmes Implementation of community outreach programmes Implementation of Multi-Media Campaigns programmes
Implementation of Website programme Implementation of media relations programs Implementation of unmediated communication programmes Implementation of community outreach programmes Implementation of Multi-Media Campaigns programmes
Implementation of Website programme Implementation of media relations programs Implementation of unmediated communication programmes Implementation of community outreach programmes Implementation of Multi-Media Campaigns programmes
Implementation of Website programme Implementation of media relations programs Implementation of unmediated communication programmes Implementation of community outreach programmes Implementation of Multi-Media Campaigns programmes
Implementation of Website programme Implementation of media relations programs Implementation of unmediated communication programmes Implementation of community outreach programmes Implementation of Multi-Media Campaigns programmes
Implementation of Website programme Implementation of media relations programs Implementation of unmediated communication programmes Implementation of community outreach programmes Implementation of Multi-Media Campaigns programmes

40
2.4 SUB-PROGRAMME: SECURITY AND RISK MANAGEMENT SERVICES
2.4.1 SITUTATIONAL ANALYSIS The overall programme and services are aimed at the secure protection and minimizing risks the department is exposed to regarding the personnel, assets, information, information systems as well as departmental liabilities. The implementation of the Minimum Information Security Standards (MISS) and risk assessments are to ensure a condition of security in the Department, as required by the MISS and the Executive Council. The directorate is newly established which had a detrimental impact on the performance due to the personnel constraints. The challenges are to appoint adequate personnel to provide the mentioned services and ensure an efficient awareness programme regarding security and risk management within the macro and micro departmental environment.

41
2.4.2 Policies, Priorities and Strategic Objectives
Measurable objective
Performance Measure / Indicator
Base year 2004/2005 Year 1
2005/2006
Year 2 2006/2007
Year 3 2007/2008
Year 4 2008/2009
Year 5 2009/2010
A condition of safety and security within the department
MISS policies in place iro: • Personnel • Documents • Information • Information
Technology • Access control
Development of MISS policies iro: • Personnel • Documents • Information • Information
Technology • Access control
Acquisition and installation of security equipment for Environmental Affairs and Ismini Towers
Monitor Implementation of the MISS Policy Acquisition and installation of security equipment for Finance House and Capricorn District
Monitor Implementation of the MISS Policy Acquisition and installation of security equipment for Sekhukhune and Vhembe Districts
Monitor Implementation of the MISS Policy Acquisition and installation of security equipment for Mopani and Bohlabela Districts
Monitor Implementation of the MISS Policy Acquisition and installation of security equipment for Waterberg District
Monitor Implementation of the MISS Policy
A corrupt free corporate environment
Reduction in the number of reported cases of corporate corruption and fraud
Develop investigation strategy and implement investigation strategy to reduce the number of reported cases of corporate corruption and fraud by 5% Develop fraud prevention and response plan
Implement investigation strategy to reduce the number of reported cases of corporate corruption and fraud by 10% Implement fraud prevention and response plan
Implement investigation strategy to reduce acts of corporate corruption and fraud by 15% Implement fraud prevention and response plan
Implement investigation strategy to reduce acts of corporate corruption and fraud by 20% Implement fraud prevention and response plan
Implement investigation strategy to reduce acts of corporate corruption and fraud by 25% Implement fraud prevention and response plan
Implement investigation strategy to reduce acts of corporate corruption and fraud by 25% Implement fraud prevention and response plan
A comprehensive and effective system of firearms control
Full compliance with the Firearms Control Act, 60 of 2000
Develop policy on firearm management Finalisation of firearm audit and re-distribution in accordance with needs assessment
Finalise development of policy on firearm management
Implementation of policy on firearm management
Implementation of policy on firearm management
Implementation of policy on firearm management
Implementation of policy on firearm management

42
2.4.3 ANALYSIS OF CONSTRAINTS AND MEASURES PLANNED TO OVERCOME THEM: The directorate is newly established with critical personnel shortages to provide the required services. The structure has been approved and posts advertised. The personnel shortages have the result that security and risk awareness is not at the required standard. The envisaged appointments will rectify the situation and lead to an efficient condition of security and risk assessment process.
2.4.4 DESCRIPTION OF PLANNED QUALITY IMPROVEMENT MEASURES:
The directorate is newly established but will the following services be provided in phases to ensure an efficient condition of security and risk management as well as awareness thereof in the department. The audit of standards, compliance and implementation regarding the security condition of personnel, documents, physical, assets/liabilities, communication and Information technology within the macro and micro environment of the department

43
2.5 SITUATION ANALYSIS FOR TREASURY’s CORE FUNCTIONS Main objective is to be an effective Treasury that provides professional services to all Provincial Departments and Public Entities, in line with the Provincial Growth and Development Strategy. In order to ensure that these services are rendered effectively, Treasury is guided by National norms and standards as applicable in the various regulations but with specific reference to the Constitution, Public Finance Management Act, Preferential Procurement Policy Framework Act and Municipal Finance Management Act. To achieve the above mentioned objectives, Treasury has the following main functions:- BUDGET SERVICES AND INTER-GOVERNMENTAL RELATIONS To administer Provincial and Municipal budget and expenditure ASSETS, LIABILITIES AND SYSTEMS MANAGEMENT To manage governmental assets and liabilities FINANCIAL GOVERNANCE To administer Accounting services and supply chain management

44
2.5.1 POLICIES, PRIORITIES AND STRATEGIC OBJECTIVES
The policies, priorities and strategic objectives of the Department are catered for in the respective programmes tabled below.
2.6 PROGRAMME 2: BUDGET SERVICES AND INTERGOVERNMENTAL RELATIONS This programme is subdivided into three sub-programmes as follows:-
Policy Research and Management, Fiscal Policy Intergovernmental Relations
2.6.1 SUB-PROGRAMME: POLICY RESEARCH AND MANAGEMENT Measurable Objectives
Performance measure/
Indicator
Base Year 2004/05
Year 1 2005/06
Year 2 2006/07
Year 3 2007/08
Year 4 2008/09
Year 5 2009/10
Inform policy development in the Provincial Treasury
Approved Policies Set up institutions for policy research and analysis
Develop requisite provincial fiscal policies in line with PFMA
Implement policies
Implement policies and evaluate impact
Implement policies and evaluate impact
Implement policies and evaluate impact
Statistics on socio-economic trends
Have a database Draw plans on structure
Develop a structure
Implement policies
Implement policies and evaluate impact
Implement policies and evaluate impact
Implement policies and evaluate impact

45
2.6.2 SUB-PROGRAMME: FISCAL POLICY 2.6.2.1 SUB-SUB-PROGRAMME: FISCAL DEVELOPMENT AND BUDGET ALLOCATION 2.6.2.2 SUB-SUB-PROGRAMME: ASSET RESTRUCTURING UNIT RESTRUCTURING MANAGEMENT
Measurable Objective
Performance Measure or indicator
Year 0 2004/05
Year 1 2005/06
Year 2 2006/07
Year 3 2007/08
Year 4 2008/09
Year 5 2009/2010
Efficient utilization of provincial assets and services.
Restructuring of provincial assets and services
Conduct feasibility study for the commercialization of 15 Provincial game reserves
Develop Terms Of Reference for the commercialisation process
Capacity building in contract management
Facilitate contract management
Facilitate contract management
Facilitate contract management
Conduct feasibility study
Capacity building in contract
Facilitate contract management
Facilitate contract management
Facilitate contract management
Facilitate contract management
Facilitate the promulgation of the Provincial Appropriation Acts Implement the Provincial Budgetary Framework.
Facilitate the promulgation of the Provincial Appropriation Acts Implement the Provincial Budgetary Framework.
Facilitate the promulgation of the Provincial Appropriation Acts Implement the Provincial Budgetary Framework.
Facilitate the promulgation of the Provincial Appropriation Acts Implement the Provincial Budget Framework.
Facilitate the promulgation of the Provincial Appropriation Acts Implement the Provincial Budget Framework.
Facilitate the promulgation of the Provincial Appropriation Acts Develop Provincial Budgetary Framework for allocation of funds.
Allocations were made in line with National and Provincial priorities.
Provincial MTEF budget in line with Provincial and National priorities.
Sound financial management in the Province
Year 5 2009/10
Year 4 2008/09
Year 3 2007/08
Year 2 2006/07
Year 1 2005/06
Base Year 2004/05
2003/04 Year 1
Performance measure/ Indicator
Measurable Objectives

46
for the Development of Hans Hoheisen facility
management
Development of contract management structure for the breeding of rare species with other institutions (DOD and BEE)
Capacity building in contract management
Facilitate contract management
Facilitate contract management
Facilitate contract management
Facilitate contract management
Conduct feasibility study for the establishment of Limpopo Shared Service Centre
Facilitate the establishment of the Limpopo Shared Service Centre
Facilitate the establishment of the Limpopo Shared Service Centre
Conduct feasibility study for facilities management of Limpopo Traffic Training College Development of a business plan for the repositioning of Limpopo Traffic Training College
Development of Terms of Reference
Capacity Building in contract management
Facilitation of Contract Management
Facilitation of Contract management
Facilitate contract management
Conduct feasibility study for the restructuring of Further Education Training College
Development of Terms of Reference
Capacity Building in contract management
Facilitation of Contract management
Facilitation of Contract Management
Facilitate contract management
Development of feasibility study and Terms of Reference for the
Capacity building in contract management
Facilitate contract management
Facilitate contract management
Facilitate contract management
Facilitate contract management

47
procurement of Great North Transport (GNT))
Development of feasibility study and Terms of Reference for the procurement of Limpopo Fleet and Emergency Services Vehicles (EMS).
Capacity building in contract management
Facilitate contract management
Facilitate contract management
Facilitate contract management
Facilitate contract management
Conduct feasibility study for the outsourcing of Yellow Fleet Development of the Asset Management Plan
Development of Terms of Reference (TOR) for the outsourcing of Yellow Fleet
Capacity building in contract management
Facilitate contract management
Facilitate contract management
Facilitate contract management
Development of feasibility study and Terms of Reference (TOR) for the procurement of Penge Hospital
Capacity building in contract management
Facilitate contract management
Facilitate contract management
Facilitate contract management
Facilitate contract management
Development of Provincial District Strategy
Facilitation of the implementation of the strategy
Development of Corporate Governance Framework.
Capacity building in contract management

48
CAPITAL PROJECTS APPRAISALS AND CORPORATE AND FINANCIAL MODELLING ANALYST
Measurable Objective
Performance measure/ Indicator
Year 0 2004/05
Year 1 2005/06
Year 2 2006/07
Year 3 2007/08
Year 4 2008/09
Year 5 2009/10
Efficient utilization of capital budget
Correct allocation of capital budget
Develop Procedure Manual on capital appraisal for education, health, roads, agriculture, local government and transport
Evaluation of appraisal for capital projects
Finalise development of Procedure Manual on capital appraisal for agriculture, local government and transport
Evaluation of appraisal for capital projects
Evaluation of appraisal for capital projects
Evaluation of appraisal for capital projects
Evaluation of appraisal for capital projects
Evaluation of appraisal for capital projects

49
2.6.2.3 SUB-SUB-PROGRAMME: PUBLIC FINANCE
Measurable Objectives
Performance Measure/Indicat
or
Year 0 2004/05
Year 1 2005/06
Year 2 2006/07
Year 3 2007/08
Year 4 2008/09
Year 5 2009/10
Sound financial management in the Province
Targeted expenditure in line with provincial priorities
Monitor expenditure trends in line with policy priorities
Monitor expenditure trends in line with policy priorities
Monitor expenditure trends in line with policy priorities
Monitor expenditure trends in line with policy priorities
Monitor expenditure trends in line with policy priorities
Monitor expenditure trends in line with policy priorities
Consolidation of IGFR report
Consolidation of IGFR report
Consolidation of IGFR report
Consolidation of IGFR report
Consolidation of IGFR report
Consolidation of IGFR report
Measurable Objective
Performance measure/Indicat
or
Year 0 2004/05
Year 1 2005/06
Year 2 2006/07
Year 3 2007/08
Year 4 2008/09
Year 5 2009/10
Improved infrastructure planning
Establishment of a centre of excellence
Implementation of IDIP Toolkit in education and health departments.
Alignment of CAM with IDIP Toolkit.
Development of curriculum on investment appraisal
Implementation of IDIP Toolkit in transport, agriculture, local government and public works
Finalise implementation of IDIP Toolkit in transport, agriculture, local government and public works
Monitor implementation of CAM and IDIP Toolkit
Monitor implementation of CAM and IDIP Toolkit
Monitor implementation of CAM and IDIP Toolkit

50
2.6.2.3 SUB-SUB-PROGRAMME: PUBLIC FINANCE
Measurable Objectives
Performance Measure/ Indicator
Year 0 2004/05
Year 1 2005/06
Year 2 2006/07
Year 3 2007/08
Year 4 2008/09
Year 5 2009/10
Sound Financial Management in the Province
Improved provincial own revenue collection
Finalize development of Provincial Revenue Policy & Strategy.
Monitor implementation of Provincial Revenue Policy & Strategy.
Monitor implementation of Provincial Revenue Policy & Strategy.
Monitor implementation of Provincial Revenue Policy & Strategy.
Monitor implementation of Provincial Revenue Policy & Strategy.
Monitor implementation of Provincial Revenue Policy & Strategy
Develop Provincial Debt Collection Policy & Strategy.
Finalize development of Provincial Debt Collection Policy & Strategy.
Monitor implementation of Provincial Debt Collection Policy & Strategy.
Monitor implementation of Provincial Debt Collection Policy & Strategy.
Monitor implementation of Provincial Debt Collection Policy & Strategy.
Monitor implementation of Provincial Debt Collection Policy & Strategy.
Monitor implementation of Provincial Debt Collection Policy & Strategy.
Monitor implementation of Provincial Debt Collection Policy & Strategy.

51
2.6.3 SUB-PROGRAMME: INTERGOVERMENTAL RELATIONS 2.6.3.1 SUB-SUB-PROGRAMME: FINANCIAL PLANNING AND BUDGET MANAGEMENT
Measurable Objectives
Performance Measure or Indicator
Year 0 2004/05
Year 1 2005/06
Year 2 2006/07
Year 3 2007/08
Year 4 2008/09
Year 5 2009/10
Sound and sustainable management of financial affairs of spheres of local government
Implementation of budget reforms by municipalities
Conduct needs analysis on municipal budgeting process
Implementation of multi year budgeting by all high category municipalities
Implementation of multi year budgeting by all medium category municipalities
Implementation of multi year budgeting by all low category municipalities
Implementation of multi year budgeting by all municipalities
Implementation of multi year budgeting by all municipalities
Facilitate preparation of budget by municipalities
Facilitate alignment of budget for high category municipalities with the Integrated Development Plans 50% implementation of budget formats
Facilitate alignment of budget for medium category municipalities with the Integrated Development Plans 80% implementation of budget formats
Facilitate alignment of budget for 60% of low category municipalities with the Integrated Development Plans 100% implementation of budget formats
Facilitate alignment of budget for the remaining low category municipalities with the Integrated Development Plans Monitor preparation of budget by municipalities
Facilitate alignment of budget with the municipal Integrated Development Plans Monitor preparation of budget by municipalities

52
2.6.3.2 SUB-SUB-PROGRAMME: ACCOUNTING AND REPORTING
Measurable Objectives
Performance Measure or Indicator
Year 0 2004/05
Year 1 2005/06
Year 2 2006/07
Year 3 2007/08
Year 4 2008/09
Year 5 2009/10
Sound and sustainable management of financial affairs of spheres of local government
Implementation of sound accounting norms and practices
Facilitate preparation of financial reports by municipalities
Facilitate implementation of reporting requirements by 65% of the municipalities
Facilitate implementation of reporting requirements by 90% of the municipalities
Facilitate implementation of reporting requirements by all of the municipalities
Facilitate implementation of reporting requirements by all of the municipalities
Facilitate implementation of reporting requirements by all of the municipalities
Unqualified audit report
Facilitate preparation of outstanding financial statements
25% of municipalities to obtain unqualified audit report Facilitate preparation of financial statements
40% of municipalities to obtain unqualified audit report Facilitate preparation of financial statements
60% of municipalities to obtain unqualified audit report Facilitate preparation of financial statements
80% of municipalities to obtain unqualified audit report Facilitate preparation of financial statements
All municipalities to obtain unqualified audit report Facilitate preparation of financial statements
Improved application of the supply chain management
Facilitate development of the supply chain management policies
Facilitate implementation of the supply chain management policies by high category municipalities
Facilitate implementation of the supply chain management policies by medium category municipalities
Facilitate implementation of the supply chain management policies by low category municipalities
Facilitate implementation of the supply chain management policies by municipalities
Facilitate implementation of the supply chain management policies by municipalities

53
2.6.3.3 SUB-SUB-PROGRAMME: COMPLIANCE AND CAPACITY BUILDING
Measurable Objectives
Performance Measure or Indicator
Year 0 2004/05
Year 1 2005/06
Year 2 2006/07
Year 3 2007/08
Year 4 2008/09
Year 5 2009/10
Sound and sustainable management of financial affairs within the local government spheres
Improved financial management in municipalities
Facilitate development of MFMA Implementation Plans by municipalities Conduct MFMA workshops
Monitor implementation of MFMA Implementation Plans by municipalities Conduct MFMA workshops
Monitor implementation of MFMA Implementation Plans by municipalities
Monitor implementation of MFMA Implementation Plans by municipalities
Monitor implementation of MFMA Implementation Plans by municipalities
Monitor implementation of MFMA Implementation Plans by municipalities
Skills enhancement
Conduct skills audit
Facilitate training according to skills development plan
Facilitate training according to skills development plan
Facilitate training according to skills development plan
Facilitate training according to skills development plan
Facilitate training according to skills development plan

54
2.7 PROGRAMME 3: ASSETS, LIABILITIES AND SYSTEMS MANAGEMENT This programme is subdivided into three sub-programmes as follows:-
Asset and Liabilities Management Financial Systems
2.7.1 SUB-PROGRAMME: ASSETS AND LIABILITIES MANAGEMENT
2.7.1.1 SUB-SUB-PROGRAMME: PHYSICAL ASSETS MANAGEMENT
Measurable Objectives
Performance Measure or Indicator
Base year 2004/05
Year 1 2005/06
Year 2 2006/07
Year 3 2007/08
Year 4 2008/09
Year 5 2009/10
Sound financial management in the province
Asset Management Strategy in place
Develop and roll-out Asset Management Strategy Facilitate development of Asset Registers in all Provincial Departments.Post-implementation Stock-takes Prepare consolidated report on asset management
Implement Asset Management Strategy Asset Registers in all Provincial Departments Prepare consolidated report on asset management
Implement Asset Management Strategy Updating of the Asset Management System Prepare consolidated report on asset management
Implement Asset Management Strategy Updating of the Asset Management System Prepare consolidated report on asset management
Implement Asset Management Strategy Updating of the Asset Management System Prepare consolidated report on asset management
Implement Asset Management Strategy
Updating of the Asset Management System Prepare consolidated report on asset management

55
2.7.1.2 SUB-SUB-PROGRAMME: BANKING AND CASH MANAGEMENT
Measurable Objectives
Performance Measure or Indicator
Base year 2004/05
Year 1 2005/06
Year 2 2006/07
Year 3 2007/08
Year 4 2008/09
Year 5 2009/10
Sound financial management in the province
Sound implementation of cash management norms and standards
Develop Cash Management Framework Develop the cash flow management monitoring tool
Implementation of the Cash Management Framework Implement the monitoring tool
Implementation of the Cash Management Framework Implement the monitoring tool
Implementation of the Cash Management Framework Implement the monitoring tool
Implementation of the Cash Management Framework Implement the monitoring tool
Implementation of the Cash Management Framework Implement the monitoring tool
Decrease in bank charges
Develop policy to decrease of bank charges
Implement policy to decrease of bank charges
Implement policy to decrease bank charges
Implement policy to decrease bank charges
Implement policy to decrease bank charges
Implement policy to decrease bank charges

56
2.7.1.3 SUB-SUB-PROGRAMME: LIABILITIES MANAGEMENT
Measurable Objectives
Performance Measure or Indicator
Year 0 2004/05
Year 1 2005/06
Year 2 2006/07
Year 3 2007/08
Year 4 2008/09
Year 5 2009/10
Sound Financial management
Provincial borrowing framework in place
Develop policy on Provincial borrowing in accordance with the borrowing powers of provincial government
Facilitate raising of loans
Facilitate raising of loans
Facilitate raising of loans
Facilitate raising of loans
Facilitate raising of loans
2.7.2 SUB-PROGRAMME: FINANCIAL SYSTEMS 2.7.2.1 SUB-SUB-PROGRAMME: FINANCIAL SYSTEMS DEVELOPMENT
Measurable Objectives
Performance Measure or Indicator
Year 0 2004/05
Year 1 2005/06
Year 2 2006/07
Year 3 2007/08
Year 4 2008/09
Year 5 2009/10
Sound financial management in the province
Reliable financial system
Development of the FINEST modules, i.e.
Travel Accounts
receivable Inventory Activity based
costing Supply chain
management
Development of the FINEST modules, i.e.
Management information and practical reporters
Receipt printing solution
Update FINEST modules
Update FINEST modules
Update FINEST modules
Update FINEST modules
Co-ordinate implementation of the Vulindlela system
Roll-out the system to Departments

57
Acquisition of the new computer mainframe
Upgrading of the computer mainframe
Upgrading of the computer mainframe
Upgrading of the computer mainframe
Upgrading of the computer mainframe
Upgrading of the computer mainframe
Interfacing of financial systems
Development of interface between FINEST and PERSAL/ HIS/NATIS/ LSM
Development of interface between FINEST and Provincial Banker/ Liquor license system/business registration system
Development of interface between FINEST and new systems
Development of interface between FINEST and new systems
Development of interface between FINEST and new systems
Development of interface between FINEST and new systems

58
2.7.2.2 SUB-SUB-PROGRAMME: FINEST SUPPORT
Measurable Objectives
Performance Measure or Indicator
Year 0 2004/05
Year 1 2005/06
Year 2 2006/07
Year 3 2007/08
Year 4 2008/09
Year 5 2009/10
Sound financial management in the province
Reliable financial system
Development of the FINEST policies and procedures
Monitor implementation of FINEST policies and procedures
Monitor implementation of FINEST policies and procedures
Monitor implementation of FINEST policies and procedures
Monitor implementation of FINEST policies and procedures
Monitor implementation of FINEST policies and procedures
Reduced number of exceptions
Maintenance of parity between financial systems
Maintenance of parity between financial systems
Maintenance of parity between financial systems
Maintenance of parity between financial systems
Maintenance of parity between financial systems
Maintenance of parity between financial systems
Establish provincial user support forum
2.7.2.3 SUB-SUB-PROGRAMME : BAS AND PERSAL SUPPORT
Measurable Objectives
Performance Measure or Indicator
Year 0 2004/05
Year 1 2005/06
Year 2 2006/07
Year 3 2007/08
Year 4 2008/09
Year 5 2009/10
Sound financial management in the province
Reliable financial system
Implement new standard chart of accounts (SCOA)
Implement version 2 of standard chart of accounts
Maintain systems and implement new versions of SCOA
Maintain systems and implement new versions of SCOA
Maintain systems and implement new versions of SCOA
Maintain systems and implement new versions of SCOA
Development of the PERSAL and BAS policies and procedures
Monitor implementation of PERSAL and BAS policies and procedures
Monitor implementation of PERSAL and BAS policies and procedures
Monitor implementation of PERSAL and BAS policies and procedures
Monitor implementation of PERSAL and BAS policies and procedures
Monitor implementation of PERSAL and BAS policies and procedures
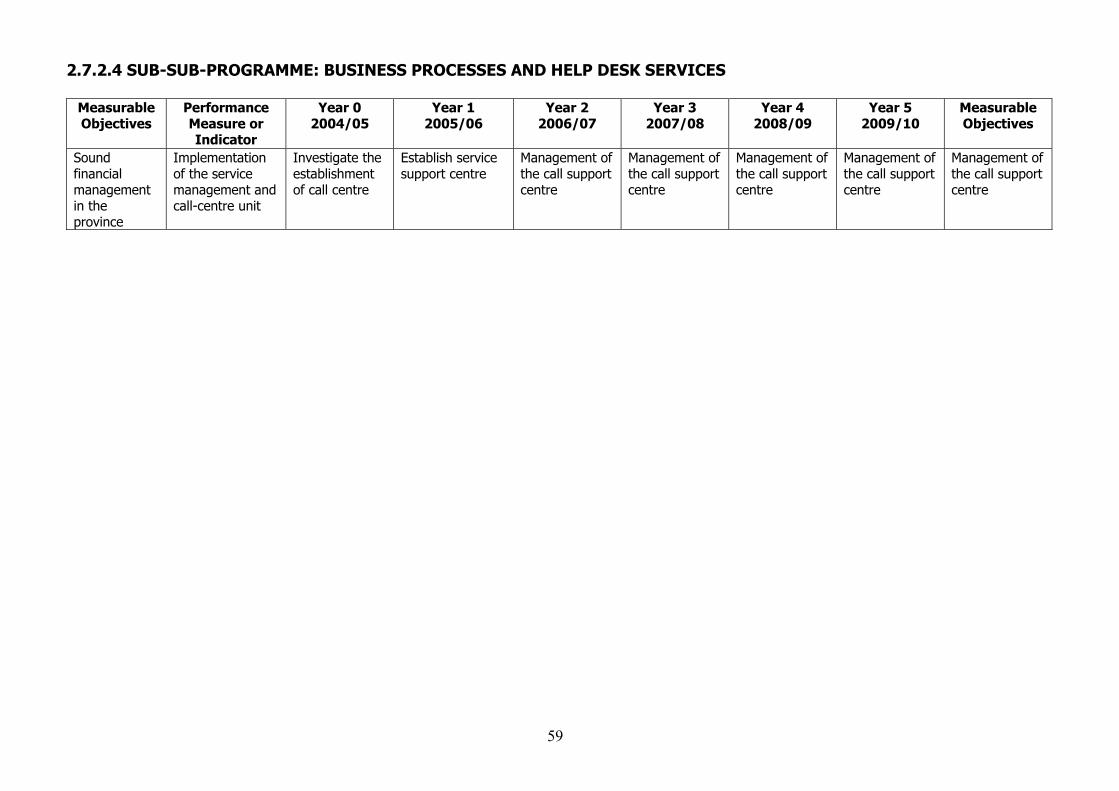
59
2.7.2.4 SUB-SUB-PROGRAMME: BUSINESS PROCESSES AND HELP DESK SERVICES
Measurable Objectives
Performance Measure or Indicator
Year 0 2004/05
Year 1 2005/06
Year 2 2006/07
Year 3 2007/08
Year 4 2008/09
Year 5 2009/10
Measurable Objectives
Sound financial management in the province
Implementation of the service management and call-centre unit
Investigate the establishment of call centre
Establish service support centre
Management of the call support centre
Management of the call support centre
Management of the call support centre
Management of the call support centre
Management of the call support centre

60
2.8 PROGRAMME 4: FINANCIAL GOVERNANCE This programme is subdivided into three sub-programmes as follows:-
Accounting Services; and Supply Chain Management Office
2.8.1 SUB-PROGRAMME: ACCOUNTING SERVICES
2.8.1.1 SUB-SUB-PROGRAMME: GOVERNANCE AND COMPLIANCE
Measurable Objectives
Performance Measure or Indicator
Base year 2004/05
Year 1 2005/06
Year 2 2006/07
Year 3 2007/08
Year 4 2008/09
Year 5 2009/10
Sound financial management in the Province
Implementation of sound accounting policies, norms and standards
Develop Provincial Treasury accounting policies, norms and standards Implement GRAP 1,2,3
Implement Provincial Treasury accounting policies, norms and standards Implement GRAP statements on:-Inventories, Leases, Investment, Property, Plant and Equipment, Consolidated and separate Financial Statements, Investment in Associates, Interest in Joint Ventures
Implement Provincial Treasury accounting policies, norms and standards Implementation of GRAP Statements
Implement Provincial Treasury accounting policies, norms and standards Implementation of GRAP norms and standards
Implement Provincial Treasury accounting policies, norms and standards Implementation of GRAP norms and standards
Implement Provincial Treasury accounting policies, norms and standards Implementation of GRAP norms and standards

61
Unqualified Audit Reports
Capacity building in financial management to ensure effective and efficient accounting practices Clear 85% of the Suspense Accounts backlog (1999-2004)
Capacity building in financial management to ensure effective and efficient accounting practices Clear 15% of the Suspense Accounts backlog (1999-2004)
Capacity building in financial management to ensure effective and efficient accounting practices
Capacity building in financial management to ensure effective and efficient accounting practices
Capacity building in financial management to ensure effective and efficient accounting practices
Capacity building in financial management to ensure effective and efficient accounting practices

62
Consolidated Annual Financial Statements for Provincial Departments
Prepare Consolidated Annual Financial Statements for Provincial Departments for 2003/04 and implement SCOPA resolutions for 2002/03
Prepare Consolidated Annual Financial Statements for Provincial Departments for 2004/05 and implement SCOPA resolutions for 2003/04
Prepare Consolidated Annual Financial Statements for Departments for 2005/06 and implement SCOPA resolutions for 2004/05
Prepare Consolidated Annual Financial Statements for Departments for 2006/07and implement SCOPA resolutions for 2005/06
Prepare Consolidated Annual Financial Statements for Departments for 2007/08 and implement SCOPA resolutions for 2006/07
Prepare Consolidated Annual Financial Statements for Departments for 2008/09 and implement SCOPA resolutions for 2007/08
Prepare annual Provincial Revenue Fund Statement
Prepare annual Provincial Revenue Fund Statement
Prepare annual Provincial Revenue Fund Statement
Prepare annual Provincial Revenue Fund Statement
Prepare annual Provincial Revenue Fund Statement
Prepare annual Provincial Revenue Fund Statement
Prepare 2002/03 and 2003/04 Financial Statements
Prepare Annual Financial Statements for 2004/05
Prepare Annual Financial Statements for 2005/06
Prepare Annual Financial Statements for 2006/07
Prepare Annual Financial Statements for 2007/08
Prepare Annual Financial Statements for 2008/09
Acquisition of a computerized system for Trust Fund
Implement the computerized system for Trust Fund
Updating of the computerized system
Updating of the computerized system
Updating of the computerized system
Updating of the computerized system
Clearance of Inactive tribal levies and trust accounts
Clearance of Inactive tribal levies and trust accounts
Clearance of Inactive tribal levies and trust accounts
Clearance of Inactive tribal levies and trust accounts
Clearance of Inactive tribal levies and trust accounts
Clearance of Inactive tribal levies and trust accounts

63
2.8.1.2 SUB-SUB-PROGRAMME: INTERNAL CONTROL AND RISK MANAGEMENT
Measurable Objectives
Performance Measure or Indicator
Year 0 2004/05
Year 1 2005/06
Year 2 2006/07
Year 3 2007/08
Year 4 2008/09
Year 5 2009/10
Risk Assessment Strategies
Risk Management Policy
Courses applied for the officials suitably capacitated
Document in place to ensure proper monitoring of risks
Monitor and implement the risk policy and strategies
Revise the strategies and assessment policy
Monitor and implant the revised strategies
Monitor and implement the risk assessments and policies
Internal Control Measures
Effective Internal Control Systems
Assessment of department’s internal control systems
Provincial Internal Control Guide and Policy
Monitor the internal control functions in the departments
Revise the Internal control measures Strategies
Implement the revised control Measures
Monitor the internal control measures and systems
Capacity Building
Effective Personnel
Strategise capacity building mechanism per departmental need
Guide manual on the capacitating of officials in the province
Monitor the effectiveness of the exercise through visitations and assessments
Revise the handbook to suit the departmental needs and strategies
Capacity building through courses and on the job training
Monitor effectiveness of the strategies through visitations and assessments.

64
2.8.1.3 SUB-SUB-PROGRAMME: PROVINCIAL FINANCIAL TRAINING
Measurable Objectives
Performance Measure or Indicator
Base year 2004/05
Year 1 2005/06
Year 2 2006/07
Year 3 2007/08
Year 4 2008/09
Year 5 2009/10
Sound financial management in the province
Skills Development and enhancement
Develop a Skills Development Strategy Develop a Skills Development Plan Training of officials according to skills development plan Prepare Skills Audit Report Develop the quality control monitoring tool
Training of officials according to skills development plan Prepare Skills Audit Report Implementation of the quality control monitoring tool Establish Resource Center
Training of officials according to skills development plan Prepare Skills Audit Report Implementation of the quality control monitoring tool
Training of officials according to skills development plan Prepare Skills Audit Report Implementation of the quality control monitoring tool
Training of officials according to skills development plan Prepare Skills Audit Report Implementation of the quality control monitoring tool
Training of officials according to skills development plan Prepare Skills Audit Report Implementation of the quality control monitoring tool

65
2.8.2 SUB-PROGRAMME: SUPPLY CHAIN MANAGEMENT OFFICE 2.8.2.1 SUB-SUB-PROGRAMME: POLICY ADMINISTRATION
Measurable Objectives
Performance Measure/ Indicator
Year 0 2004/05
Year 1 2005/06
Year 2 2006/07
Year3 2007/08
Year 4 2008/09
Year 5 2009/10
Fair, equitable, transparent and cost effective procurement and provisioning administration systems
Provincial Treasury policies and procedures on Supply Chain Management in place
Development of Supply Chain Management policies, guidelines and procedures
Updating of Supply Chain Management policies, guidelines and procedures
Updating of Supply Chain Management policies, guidelines and procedures
Updating of Supply Chain Management policies, guidelines and procedures
Updating of Supply Chain Management policies, guidelines and procedures
Updating of Supply Chain Management policies, guidelines and procedures
2.8.2.2 SUB-SUB-PROGRAMME: SUPPLY CHAIN MANAGEMENT IMPLEMENTATION
Measurable Objectives
Performance Measure/ Indicator
Year 0 2004/05
Year 1 2005/06
Year 2 2006/07
Year3 2007/08
Year 4 2008/09
Year 5 2009/10
Fair, equitable, transparent and cost effective procurement and provisioning administration systems
Improved application of the provisions of PFMA, PPPFA, BBBEA and SCM Policies and procedures
Develop reporting standards, norms and format Capacity building on Supply Chain Management
Monitor implementation of Supply Chain Management policies, guidelines and procedures Capacity building on Supply Chain Management
Monitor implementation of Supply Chain Management policies, guidelines and procedures Capacity building on Supply Chain Management
Monitor implementation of Supply Chain Management policies, guidelines and procedures Capacity building on Supply Chain Management
Monitor implementation of Supply Chain Management policies, guidelines and procedures Capacity building on Supply Chain Management
Monitor implementation of Supply Chain Management policies, guidelines and procedures Capacity building on Supply Chain Management

66
2.8.2.3 SUB-SUB-PROGRAMME: DEMAND AND ACQUISITION MANAGEMENT
Measurable Objectives
Performance Measure/ Indicator
Year 0 2004/05
Year 1 2005/06
Year 2 2006/07
Year3 2007/08
Year 4 2008/09
Year 5 2009/10
Measurable Objectives
Fair, equitable, transparent, cost effective and competitive procurement administration
Achievement of value for money
Arrangements and conclusion of transversal contracts
Development of bid specifications on transversal contracts Management of transversal contracts Develop vendor database for all the commodities covered in the transversal contracts Conclusion of outstanding adhoc contracts
Development of bid specifications on transversal contracts Management of transversal contracts Updating of the vendor database
Development of bid specifications on transversal contracts Management of transversal contracts Updating of the vendor database
Development of bid specifications on transversal contracts Management of transversal contracts Updating of the vendor database
Development of bid specifications on transversal contracts Management of transversal contracts Updating of the vendor database
Development of bid specifications on transversal contracts Management of transversal contracts Updating of the vendor database

67
2.9 ANALYSIS OF CONSTRAINTS AND MEASURES TO OVERCOME THEM The major constraint to this Branch has been the delay in the implementation of the structure as informed by the Organisational Development process. These structural problems and lack of capacity have to a larger extent reduced the ability of this programme to respond to the challenges and service delivery requirements posed by external environment, new legislations and additional demands by our clients at all levels. Whilst the problem has been addressed partly by the re-arrangement of certain functions for instance and grouping of similar functions under the same specific directorates, there is still a need to speed-up the process of approving the proposed structure.