lowry park zoo water resources master plan · lowry park zoo water resources master plan 13-d-000...
TRANSCRIPT
LOWRY PARK ZOOWATER RESOURCES MASTER PLAN
13-D-00052for CITY OF TAMPA
NOVEMBER 2015
LPZ Water Resources Master Plan November 2015 TOC - 1
TABLE OF CONTENTS
1.0 INTRODUCTION AND PROJECT BACKGROUND ............................................................. 1
1.1 Project Objective....................................................................................................................1
1.2 Background Information about Tampa’s Lowry Park Zoo ..........................................................1
1.3 Other Master Plans for the Zoo ..............................................................................................1
1.4 Information Used to Develop this Water Resources Master Plan ............................................2
2.0 EXISTING CONDITIONS ............................................................................................... 2
2.1 Updated Infrastructure Map and Operational Diagram...........................................................2
2.2 Estimated Remaining Physical Life of Infrastructure ...............................................................3
2.3 Existing Water Sources and Uses ............................................................................................4
2.3.1 Well Water Sources and Uses ...................................................................................................................... 5 2.3.2 City-supplied Potable Water Uses ................................................................................................................ 6
2.4 Existing Stormwater Systems and System Capacity Analysis ...................................................7
2.4.1 Modeling Approach ...................................................................................................................................... 8 2.4.2 Model Assumptions ..................................................................................................................................... 8 2.4.3 Modeling Results & Findings ........................................................................................................................ 8
2.5 Existing Wastewater Systems ................................................................................................9
2.5.1 Zoo Wastewater Discharged to City’s Sanitary Sewer ................................................................................. 9 2.5.2 City of Tampa Sanitary Sewer Capacity Analysis ........................................................................................ 10 2.5.3 Zoo’s Onsite Industrial Wastewater Treatment System ............................................................................ 10
2.6 Historical Nitrogen and Fecal Loadings Discharged via D-001 ................................................ 11
2.7 Existing Surface Water Improvement and Management Ponds ............................................. 13
2.8 Existing Manure Management ............................................................................................. 14
3.0 OVERVIEW, SCORING, AND RANKING OF POTENTIAL PROJECTS ................................ 14
4.0 RECOMMENDED PROJECTS ....................................................................................... 16
4.1 Restoration of SWIM Ponds by City ...................................................................................... 16
4.1.1 Permitting Restoration of SWIM Ponds ..................................................................................................... 16
LPZ Water Resources Master Plan November 2015 TOC - 2
4.1.2 Conceptual Cost Estimate for Restoring SWIM Ponds ............................................................................... 16 4.1.3 Incorporating SWIM Ponds into Zoo Grounds for Environmental Education ............................................ 17
4.2 Targeted Diversion of Clean Stormwater to Rain Gardens ..................................................... 17
4.2.1 Permitting Rain Gardens ............................................................................................................................ 18 4.2.2 Conceptual Cost Estimate of Rain Gardens ................................................................................................ 18 4.2.3 Public Education Opportunities for Rain Gardens ..................................................................................... 18
4.3 Storage and Reuse of Treated Lake Sharon Wastewater ....................................................... 19
4.3.1 Permitting Storage and Reuse of Treated Lake Sharon Wastewater ......................................................... 20 4.3.2 Conceptual Cost Estimate for Storage and Reuse of Treated Lake Sharon Wastewater ........................... 23 4.3.3 Public Education Opportunities for Storage and Reuse of Treated Lake Sharon Wastewater .................. 23
4.4 Storage and Reuse of Diverted Clean Stormwater from Zoo Entrance Area ........................... 24
4.4.1 Permitting Storage and Reuse of Clean Stormwater ................................................................................. 24 4.4.2 Conceptual Cost Estimate for Storage and Reuse of Clean Stormwater .................................................... 25 4.4.3 Public Education Opportunities for Storage and Reuse of Clean Stormwater ........................................... 26
5.0 NEXT STEPS AND OTHER RECOMMENDATIONS ......................................................... 26
FIGURES

LPZ Water Resources Master Plan November 2015 Page 1
1.0 INTRODUCTION AND PROJECT BACKGROUND
Tampa’s Lowry Park Zoo (the Zoo) has identified being a leader in conservation as one of its core values. In addition to the Zoo’s work in conservation of endangered species around the world, the Zoo is interested in developing and implementing a holistic and progressive approach to conservation of water. Realizing the value of water resources to the Tampa Bay Area and the State of Florida, the Zoo decided to pursue funding to support the development of a water resources master plan. The Zoo submitted a Cooperative Funding Initiative (CFI) proposal to the Southwest Florida Water Management District (SWFWMD). Through the CFI process, SWFWMD and project owners (also called cooperators) cooperate on a water management project with both entities typically paying 50% of the project cost. Acknowledging the importance of the project, the City of Tampa (the City) provided the matching funds for the CFI project and became the cooperator and project manager. As the CFI cooperator and project manager, the City retained Greenman-Pedersen, Inc. (GPI) to develop this water resources master plan. Although the City is the cooperator and project manager, the City directed GPI to perform the project from the Zoo’s perspective.
1.1 Project Objective
The objective of this project is to improve water-use efficiency within the Zoo and the quality of water discharged by the Zoo through the creation of a Water Resources Master Plan (Plan). The Master Plan is intended to evaluate viable water-quality and reuse options that, when implemented, will reduce pollutants discharged by the Zoo to Hamilton Creek, a tributary to the Hillsborough River that discharges to Tampa Bay.
1.2 Background Information about Tampa’s Lowry Park Zoo
Tampa’s Lowry Park Zoo is one of the most popular zoos in the southeastern US, with over 800,000 visitors annually. The Zoo originated in the 1930s as a municipal department with a small collection of Florida native species. It grew gradually throughout the next four decades, but struggled to meet the developing professional standards of modern zoos. In 1982, community leaders created the Lowry Park Zoo Association to take over management of the Zoo for the City of Tampa with the goal of creating a world-class zoo through a public-private partnership. The Association then became the Lowry Park Zoological Society of Tampa, Inc., as it remains today. Working with a national zoo designer, the Society was able to create a modern, 24-acre facility that opened to the public in 1988. Accreditation by the Association of Zoos and Aquariums (AZA) came shortly after in 1990, and it was most recently reaccredited in March 2015. Since 1982, the Zoo has added additional areas, namely Wallaroo (2001) and Africa (2003).
1.3 Other Master Plans for the Zoo
Development of two other Zoo master plans ran concurrent with GPI’s development of this water resources master plan. Those plans included an Interpretive/Evaluation Master Plan, and a Land Use/Facilities Master Plan. Because the plans were developed concurrently, information was not shared between those plans and the water resources master plan.

LPZ Water Resources Master Plan November 2015 Page 2
1.4 Information Used to Develop this Water Resources Master Plan
The following data sources were used in the development of this Plan.
• As-builts from the 2001 construction of the Zoo’s Wallaroo Exhibit, the 2005 construction of the Africa Exhibit, and other relevant drawings were used by Vickstrom Engineering Services (VES) to develop a map of the Zoo’s existing water, wastewater, and stormwater infrastructure;
• One year of historical water and wastewater billing data - October 2013 through November 2014;
• One year of metered monthly withdrawal volumes from on-site groundwater wells;
• Two years of historical Discharge Monitoring Reports;
• The Zoo’s industrial wastewater treatment permit and associated regulatory correspondence; and
• Institutional knowledge from Zoo personnel and VES, the engineering firm typically contracted by the Zoo.
2.0 EXISTING CONDITIONS
The Zoo was constructed in several phases:
• The original footprint of the Zoo, referred to as ‘Old Zoo,’ was constructed in 1986;
• Wallaroo was constructed in 2000 and 2001;
• Africa was constructed in 2003;
• Safari Lodge was constructed in Africa in 2008; and
• The Hospital and Commissary were constructed in 2014 at the northwestern edge of Old Zoo.
2.1 Updated Infrastructure Map and Operational Diagram
As part of this project, VES updated an existing map of water, wastewater, and stormwater infrastructure in CAD. The map was provided to the Zoo and to the City as a PDF. The PDF of the map, provided herein as Figure 1, includes the capability of turning layers on and off. This feature is helpful in distinguishing between the various built phases of the Zoo.
Although wells are indicated on the infrastructure map, with the exception of the well-water lines that serve the Africa Exhibit (leading from Well ID #6), as-builts showing piping from the wells to the end uses could not be located by VES. Similarly, as-builts showing most of the potable water systems in Old Zoo could not be located. Another shortcoming of available information included stormwater infrastructure in the southwest extent of Old Zoo. Therefore, these areas of the map are missing the respective infrastructure. Although most visible stormwater inlets were surveyed, those that are submerged in exhibit pools were not accessible and therefore not surveyed. The submerged inlets that are shown on the map, were identified by digitizing as-builts. The most reliable information in the map is the location of accessible stormwater infrastructure, wells, and potable-water meters, as those elements were surveyed.
GPI converted VES’ CAD file (.DWG) to a GIS file format (.gdb) so that GPI could use the information to inform its conceptual design of recommended projects which are presented in Section 4 of this master plan. This project included the design of a geodatabase schema, the schematic of which was delivered to the City and the Zoo as a separate deliverable. The deliverable was accepted by the Zoo and the City,

LPZ Water Resources Master Plan November 2015 Page 3
and may serve as a guide to geodatabase development should the City and/or Zoo decide to move forward with the development of a geodatabase for the Zoo.
The operational flow diagram provided as Figure 2 serves as a water-resources overview of pools located within habitats. A summary of the diagram is provided below:
• Except for the elephant and the pygmy hippo pools, all habitat pools indicated in the diagram are located in Old Zoo. Elephant and pygmy hippo pools are located in Africa.
• Except for penguin, stingray, and pygmy hippo, all exhibit pools use well water as their source.
• Penguin, stingray, and pygmy hippo, and elephant pools drain to City’s sanitary system. With the exception of the elephant pool, these pools have treatment systems that include filters, and filter backwash is discharged to City’s sanitary system.
• Except for penguin and stingray pools, in Old Zoo, there are two methods of habitat-pool discharges as indicated in the diagram: “pool drop” and “storm,’ where “storm” means storm overflow. Old Zoo exhibit pools include control structures to prevent habitats from flooding during heavy rains, which is what is meant by “storm” in the diagram. For exhibits in Old Zoo, habitat pools also include bottom inlets that are normally closed – these are referred to as “pool drops.” These normally-closed inlets are opened periodically to drain and clean the pools on a controlled schedule. Water that is discharged from the control structure during rains and water that is intentionally discharged by opening the valves drains into Lake Sharon where it is treated as industrial wastewater by the Zoo. Because the source water for these pools is well water, and because the pools discharge to Lake Sharon, the Zoo’s only water/wastewater operational costs associated with these pools include pumping the well water and maintaining the Lake Sharon wastewater treatment system.
• Several of the exhibit pools have filter systems that discharge backwash water to Lake Sharon. The exception to this is penguin, stingray, and manatee exhibits, which discharge backwash to the City’s sanitary sewer system.
2.2 Estimated Remaining Physical Life of Infrastructure
Based on the construction dates of these phases, and published physical-life estimates for various pipe materials, GPI calculated an extremely simplified estimate of remaining physical life of Zoo piping infrastructure (see Table 1). It is important to note that physical life is one of the least important factors that affects physical integrity of infrastructure. Because the subject project did not include a condition assessment, one was not conducted. Therefore, these estimates will need to serve as surrogate values until a proper condition assessment is afforded.

LPZ Water Resources Master Plan November 2015 Page 4
Table 1. Estimated Remaining Physical Life of Zoo Piping Infrastructure
2.3 Existing Water Sources and Uses
The Zoo has two water sources: City-supplied potable water and self-supplied well water. In general, well water is used for irrigation and to fill pools that are in exhibits, and potable water is used to meet all other needs, including cleaning of exhibits. Each of these sources and their uses are discussed in the following subsections.
Zoo AreaYr
Built System
Pressure or
Gravity Material Est. Life
Physical Life Consumed
(%)
Physical Life Remaining
(%)
Est. Remaining Life (years)
Pot., Fire P unk unk unk unk unk
SS G unk unk unk unk unk
ST G RCP 75 39% 61% 46
Pot., Fire P PVC 100 15% 85% 85
SS G PVC 100 15% 85% 85
ST G HDPE 100 15% 85% 85
Pot., Fire P PVC 100 14% 86% 86
SS G PVC 100 14% 86% 86
ST G HDPE 100 14% 86% 86
Pot. P PVC, DIP 100 12% 88% 88
Fire P PVC, DIP 100 12% 88% 88
Well P PVC 100 12% 88% 88
SS G PVC 100 12% 88% 88
SS FM P PVC 100 12% 88% 88
ST G HDPE 100 12% 88% 88
ST G RCP 75 16% 84% 63
Pot., Fire P PVC 100 7% 93% 93
SS G PVC 100 7% 93% 93
ST G RCP 75 9% 91% 68
ST G HDPE 100 7% 93% 93
Pot., Fire P PVC 100 1% 99% 99
SS FM P PVC 100 1% 99% 99
SS G PVC 100 1% 99% 99
ST G HDPE 100 1% 99% 99
Notes:
Pot. = potable water SS FM = sanitary sewer force mainFire - fire protection SS = sanitary sewerST = storm sewer
Hospital/Commissary
SafariLodge
2014
2008
2003
Old Zoo
Africa
WallarooPhase II
WallarooPhase I
2001
1986
2000

LPZ Water Resources Master Plan November 2015 Page 5
2.3.1 Well Water Sources and Uses
Generally, well water is used for irrigation (which is rather limited) and to supply pools that are part of the animals’ habitats. Metered and permitted water use volumes from October 2013 through September 2014 (period of analysis) are shown in Table 2.
Table 2. Well Water Sources and Uses
Irrigation Sources and Uses
The Zoo did not have an irrigation technician on staff until recently and the new technician is in the process of identifying and repairing irrigation heads and controllers. The technician stated that all irrigation controllers that he had identified to date were supplied by well water. He also stated that to his knowledge, all water used for irrigation is supplied by well water. Irrigation plans dating back to 1986 indicate irrigation mains being connected to six water meters at the Zoo. It is unknown if these meters were Zoo-owned sub-meters or City water meters as the plans did not indicate source water (City-supplied or well). If these were originally City water meters, it is possible that some or all irrigation has been discontinued from those meters. The Zoo does have one active but unused City-metered irrigation connection. Based on water-use information for that meter, it appears that the meter was installed approximately May 2014 and was used only for the month of June 2014 to establish landscaping installed as part of the 2014 construction of the Hospital and Commissary. Although the meter is known to exist through water-bill information, the water meter could not be located in the field. Although all (or at least most) irrigation source water is well water, which well supplies which irrigation controller/landscaped area is unknown except for the parking lot, which is irrigated by the Sligh well. The maintenance manager for the Zoo stated that at one time, the Zoo attempted to use water discharged from the Lake Sharon treatment system for irrigation, but the project was discontinued due to inadequate water pressure and also due to concerns of the water coming into contact with animals.
DistrictID # Zoo ID Status
Diameter(in.) Use Type Metered?
Metered Avg GPD2
Metered Avg gal/mo.
Aquatic habitat fillLawn & LandscapeAquatic habitat fillLawn & LandscapeAquatic habitat fillLawn & LandscapeAquatic habitat fillLawn & Landscape
7 Sligh Existing 4 Lawn & Landscape No Unknown Unknown1 1 Capped 4 N/A N/A4 4 Plugged 6 N/A N/A
YesExisting 6
YesExisting 6
YesExisting 6
5 Otter
Existing 4
3 Manatee1
6 Africa
1. Zoo staff indicated that average daily use is about 180 Kgals/day, and that peak daily use may be as much as 200 Kgal/day. The 180 Kgal/day (avg.) and 200 Kgal/day (peak) estimates are based on Zoo-reported volume of backwash tank and number of tank turnovers per day.
2. Period of Analysis for Manatee and Otter Wells is Oct 2013 - Sept 2014. Period of Analysis for Africa well is Jul 2014 - Jun 2015.
63,965
99,936
4,847
Unknown
1,946,000
3,039,725
147,417
Unknown
Notes :
2 Croc No

LPZ Water Resources Master Plan November 2015 Page 6
Landscaping in the Zoo is mature and canopy trees are abundant. These are favorable conditions for low plant-irrigation needs. The technician stated that he typically does not irrigate until sod and plants begin to show signs of stress. Based on information provided by the technician, and because there are too many unknowns about the irrigation system at this time, GPI did not further evaluate irrigation uses during the course of this project.
Manatee Well Source and Uses
The Manatee well is used for irrigation and to supply the Manatee Exhibit and Manatee Hospital, which consist of interconnected pools with isolation gates. Water in these pools is continually filtered and treated by the Manatee life support system (LSS) which consists of six sand filters and ozone water treatment. Zoo staff estimate that average daily backwash volumes can be as high as 180 Kgal/day, with peak daily volumes as high as 200 Kgal/day. The 180- and 200-Kgal/day estimates are based on Zoo-reported volume of the backwash tank and number of tank turnovers per day. The Zoo is in the process of evaluating improvements to the LSS as part of a different project. Resulting improvements may reduce backwash needs.
Otter Well Source and Uses
The Otter well is used for irrigation and to supply all animal exhibits/habitats in Old Zoo with the exception the Manatee Exhibit, which is supplied by the Manatee well; and the Penguin and Stingray pools, which are supplied by City potable water. Metered withdrawals from October 2013 through September 2014 indicate an average daily withdrawal of 100 Kgal/day.
Africa Well Source and Uses
The Africa well is used within the Africa Exhibit for irrigation and to fill the Elephant pool. Metered withdrawals from July 2014 through June 2015 indicate an average daily withdrawal of 5 Kgal/day.
2.3.2 City-supplied Potable Water Uses
The Zoo has eight active potable-water accounts with the City of Tampa. One of the accounts (Account No. 0071734-001-05) has three meters associated with the account, so the Zoo has 10 active potable-water meters. Table 3 includes a list of each active meter along with the average monthly use and to which areas of the Zoo the meter provides service. The table is sorted by descending use. The first four accounts are more relevant to this project than the others (shaded in light grey). The last two meters (shaded in dark grey) will not be further considered because their metered use is insignificant. Areas served by Meter #1 and Meter #2 were identified through meter locations and water service lines on the Zoo map provided by VES. Meter #4 serves Old Zoo, which was assumed by process of elimination. Drawings provided by VES did not include water-system pipes in Old Zoo because source construction plans could not be located. Meter #5 likely serves more than the Manatee Fountain and the Administration Building (located West of the Main Entrance), but these were the only two facilities shown in the map to have service from Meter #5.

LPZ Water Resources Master Plan November 2015 Page 7
Table 3. Potable Water Accounts and Uses
Water Meters Not in Table 3
Meter #7 and Meter #6 on the map are sub-meters installed by the Zoo. Meter #7 measures water use for the flume ride.
Potable-water Uses
Pools in Habitats/Exhibits: The Zoo uses well water for irrigation and for all animal exhibits/habitats with the exception penguin, stingray, and pygmy hippo exhibits which are supplied by City potable water. The penguin pool is served from Meter #2, stingray from Meter #4, and pygmy hippo from Meter #1.
Washdown Water in Habitats/Exhibits: All water used to clean exhibit areas is potable water. The Zoo’s maintenance manager indicated that washdown water is likely half of the Zoo’s potable-water use. Washdown refers to frequent cleaning of exhibit areas, which includes heavy use when cleaning exhibit pools after they have been drained. During a site visit, GPI observed the moat in the colobus monkey exhibit being cleaned with a large hose (similar to a fire hose) after it had been drained.
Other Animal-welfare Uses: All of the drinking water consumed by the animals is potable water. Also, potable water is used when preparing food for the animals.
Maintenance Uses: Potable water is used to clean golf carts, the Safari Tram and other Zoo assets on an as-needed basis.
Domestic Uses: Restrooms, restaurants, hand sinks, and water fountains throughout the Zoo use potable water.
2.4 Existing Stormwater Systems and System Capacity Analysis
The Zoo consists of three stormwater basins: Africa, Wallaroo, and Old Zoo (the original footprint of the Zoo). The Africa exhibit and runoff from the sidewalk along Patterson Avenue, drain to a pond across North Boulevard. Wallaroo drains to a pond located between the Events Pavilion and the Zoo School near the entrance to the Zoo. Old Zoo is unique in that stormwater in that part of the Zoo drains to Lake Sharon which serves as both stormwater containment and also as a wastewater holding pond. The
Meter Serial No. Account #
Avg. Use(Kgal/mo.)
Map Meter #
Avg. Use3
(gal/mo.) Meter Provides Service to
31945071 0071734-001-5 748 4 748,000 Old Zoo4102644 0338054-001-2 344 1 343,581 All of Africa except Patas Monkey1100024 0311905-001-0 285 2 284,739 All of Wallaroo plus Patas Monkey in Africa
31816098 0071735-001-2 116 5 115,628 Manatee Fountain, Admin. Bld., possibly more13066340 0071734-001-5 17 8 17,000 Commissary and Hospital
4107518 0071735-007-4 31 11 30,668 Zoo School6111399 0071735-004-3 21 10 20,757 Zoo School North7117291 0401070-001-1 4 9 3,989 School Annex
319487631 0071734-001-5 0 NL4 Insignificant Possibly Commissary landscaping120428632 0325799-002-5 0 NL4 Insignificant Acct. name = Elephant House; Cust. Class = Res.
Notes1. Meter installed May 2014 to establish landscape around new Commissary in June 2014, then use was discontinued.
3. Avg. use calculated from from Aug 2014 - Jul 2015 for Meter #8, and from Oct 2013 - Sep 2014 for all other meters.
4. NL = meter could not be located in the field
2. Billing records include "Elephant House" in the account name, and list Customer Class as Residential. Only use indicated was 1,000 gallons in Nov 2013.

LPZ Water Resources Master Plan November 2015 Page 8
Africa and Wallaroo stormwater ponds; and Lake Sharon are indicated on Figure 1. Stormwater draining to Lake Sharon consists of stormwater that is relatively clean (runoff from roofs and sidewalks, referred to herein as “clean stormwater”) and stormwater with high levels of fecal matter from exhibits (referred to herein as “dirty stormwater”). Figure 1 delineates clean from dirty stormwater in Old Zoo using orange and red line work, respectively.
As part of this master planning effort, the existing stormwater conveyance systems for Old Zoo and for the Africa Exhibit were analyzed. The purpose of the analysis was to evaluate the performance of the pipe systems for those two drainage basins in order to determine if there were significant deficiencies within the piped drainage systems. A detailed modeling report was delivered to the City including input/output data. Below, the modeling approach and results are summarized.
2.4.1 Modeling Approach
VES used HydroCAD for the analysis of Old Zoo’s and Africa’s piped stormwater systems, and the routing of the stormwater runoff through the pipes and into containment ponds. Two storms were evaluated for this purpose: 2.5-inches in two hours, and a 25-year, 24-hour design storm event (eight inches in 24 hours). These two events were chosen because they would bracket system performance and identify potential drainage issues.
2.4.2 Model Assumptions
Modeling assumptions used are discussed below:
• Because of limited information on the exhibit overflow structures, it was assumed that all exhibit pools would discharge immediately during each modeled storm event. No storage or attenuation from the exhibit pools was considered in the analysis, and all pool-drop valves were assumed to be closed. This approach to the modeling provided a more conservative assessment of the capacity of the piped systems.
• Item 1 of the Lake Sharon Operating Protocol (see Subsection 2.5.3) states that during normal operations, the normal pool of Lake Sharon is maintained at two to four feet below the weir crest. Therefore, the model assumed that the Lake Sharon pool elevation was at 10 ft (2.65 feet below the weir elevation) at the beginning of each storm event. This is a conservative assumption for the 8-in/24-hr storm event because Item 3 of the Protocol requires the lake level to be lowered to a minimum of four feet below crest if rain in excess of three inches in 24 hours is expected.
• Item 2 of the Lake Sharon Protocol states that it is expected that the Lake can accommodate up to 2.5 inches of rain in a 24-hour period without discharging and with no pumping through the treatment system (i.e., Lake is not drawn down during storm event). Therefore, the model assumed that Lake Sharon was not drawn down during the modeled storm events.
• Although the stormwater pond for Africa was designed as a dry pond, it now has a blanket of debris at the bottom of the pond impeding infiltration. However, the Africa system was modeled as though it was functioning as designed. The Zoo intends to clean debris from the pond and stormwater pipe to restore the system to its intended purpose.
2.4.3 Modeling Results & Findings
Both basins (Lake Sharon and Africa) were analyzed for the two storm events. In addition, the Lake Sharon basin model results were checked against a recent storm event of two inches of rain in two hours to verify model performance. The results indicated that the model was a reasonable representation of existing conditions. The Africa basin model did not have any storm events to

LPZ Water Resources Master Plan November 2015 Page 9
compare, but because similar input parameters were used in this model, it is expected that the model results should provide reasonable results. The results of the modeling did not reveal any system deficiencies with respect to conveyance capacity. The drainage systems for both basins contained the design storms that were modeled. The modeling results are provided in Table 4.
Table 4. Stormwater Modeling Results
The results show that both the Lake Sharon and Africa ponds can handle a 2.5-in/24-hr storm event without discharging over their respective weirs. Results show that during a 25-yr flood event, both systems will discharge to Hamilton Creek. However, during such an event, Hamilton Creek will be impacted by non-Zoo flows such that contaminants and sediments from either system will be further diluted by Hamilton Creek.
2.5 Existing Wastewater Systems
There are two main wastewater discharges at the Zoo: wastewater that is discharged untreated to the City’s wastewater treatment system and an onsite industrial wastewater treatment system that discharges treated wastewater to Hamilton Creek. These two systems are described below.
2.5.1 Zoo Wastewater Discharged to City’s Sanitary Sewer
Zoo discharges to the City’s sanitary sewer include the following:
• All domestic wastewater.
• Penguin, stingray, and pygmy hippo pool drops and filter backwash. Because these pools are supplied by City water, the Zoo is charged for wastewater based on its metered water usage.
• The elephant pool is dropped to sanitary sewer. Because the elephant pool is supplied with well water, the Zoo pays a flat rate to the City for the discharge. The rate is based on the volume of the pool and an estimated number of pool drops per month.
• Manatee life support system backwash: Because the Zoo uses well water to backwash the filters of the manatee life support system, its discharge of backwash water to the City’s sanitary sewer system is un-metered and an otherwise unaccounted-for discharge to the City’s system. The Zoo indicated that the connection has been unmetered since the Manatee Hospital was constructed in 1991 and that the City is aware of the connection. The Zoo is currently looking at upgrading its manatee life support system to reduce backwash volumes. Further, options presented in this master plan may provide additional storage in Lake Sharon and treatment capacity such that manatee backwash can be sent to Lake Sharon and treated by the Zoo’s wastewater treatment system. It is also possible that backwash can be discharged directly to the Lake Sharon treatment system.
• Backwash from the Zoo’s industrial wastewater treatment system which is discharged through a metered sanitary sewer connection located at the Lake Sharon treatment system.
• Lake Sharon drawdown: Prior to and during major rain events, the Zoo by-passes Lake Sharon filtration and disinfection systems and discharges Lake Sharon water directly to City’s sanitary
Existing and Modeled Conditions Lake Sharon AfricaNormal Pool Elevation 10.0 ft Dry Pond (20.5 ft)Control Weir Elevation 12.65 ft 23.0 ftPond Elevation after a 2.5-in/2-hr Storm Event 12.1 ft 19.4 ftPond Elevation after an 8-in/24-hr Storm Event (25-yr Flood) 13.5 ft 23.5 ft

LPZ Water Resources Master Plan November 2015 Page 10
sewer through a metered connection. Conditions under which this occurs are specified in the Subsection 2.5.3.
• The average monthly volume of wastewater registered by the Lake Sharon wastewater meter (from discharging treatment backwash and from bypassing treatment during emergency operations) is 378 Kgal/mo.
2.5.2 City of Tampa Sanitary Sewer Capacity Analysis
As part of the master planning process, the City conducted a wastewater capacity analysis and identified that the 12-inch pipe that runs east-west through the south part of Zoo can accept up to an additional 100 gpm of wastewater flows from the Zoo. There is also an interceptor pipe that runs parallel to the Hillsborough River; that pipe also has 100 gpm of additional capacity. The City stated that the 100-gpm capacity should not limit project options or the design of such options.
2.5.3 Zoo’s Onsite Industrial Wastewater Treatment System
The Zoo operates an onsite industrial wastewater treatment system under FDEP Permit #FL0186651 (7/27/2012 – 7/26/2017). Under normal operating conditions, stormwater and pool-drop flows from Old Zoo that drain to Lake Sharon are pumped to a filtration and ultraviolet (UV) disinfection system. Treated water is then discharged to Hamilton Creek via Outfall D-001 which is co-located with an emergency overflow weir in Lake Sharon. Filters are backwashed with water from Lake Sharon and the backwash water is discharged to the City’s sanitary system through a metered connection. Per the Zoo’s Operating Protocol, levels in Lake Sharon are closely monitored and pools are dropped and cleaned only when there is sufficient free board in Lake Sharon.
GPI reviewed the wastewater facility’s compliance file through FDEP’s website and discovered that Lake Sharon had discharged untreated water over the emergency weir during five 2013 storm events. In response to these discharges, the Zoo raised the height of the weir by two feet in February 2014 (a project that was funded by Tampa Bay Water). In March 2014, the Zoo developed and began implementing an operating protocol to alleviate the potential for future overflows. Based on structural and operational improvements, the FDEP deemed the facility in compliance in May 2014. The operational protocol developed by VES and implemented by the Zoo was in response to the FDEP’s request for additional clarification on the circumstances under which a discharge from Lake Sharon to the City sanitary sewer would occur. Full details (verbatim) of the Lake Sharon Operating Protocol are provided below.
1) Under normal operating conditions, the lake level will be maintained at a level between 2 to 4 feet below the new crest elevation of the control structure by means of pumping through the treatment system and discharging the treated effluent into Hamilton Creek via the lake outlet structure.
2) With the raised crest elevation, it is expected that the lake can accommodate up to 2.5 inches of rain in a 24 hour period without discharging and with no pumping through the treatment system.
3) In the event of an approaching tropical storm or hurricane in which rain in excess of 3 inches in 24 hours is expected, inflows from the exhibits into the lake will be minimized and the lake level will be lowered to the maximum extent possible (lower than 4 feet below crest) by way of pumping and treating through the treatment system. This should allow the lake to accept runoff from the drainage area without overtopping the crest elevation of the control structure. In the event that the lake water level reaches within 1
LPZ Water Resources Master Plan November 2015 Page 11
foot of the crest of the control structure, pumping into the City of Tampa sanitary sewer system will begin, and will continue until the lake level drops by 1 foot.
4) If a rain event exceeding 4 inches in 24 hours is occurring and the lake level reaches to within 1 foot of the crest of the control structure, discharge will begin into the City of Tampa sanitary sewer system. This discharge will continue until the rain event passes and/or the lake level reaches 2 feet below the crest of the control structure.
5) If a rain event exceeding 6 inches in 24 hours is expected to occur, then discharge from the lake is likely even with the implementation of the above measures. However, with this magnitude of rainfall, there will be significant runoff into Hamilton Creek such that the discharge from the lake would have no significant impact to the creek’s water quality.
6) For extreme storm events (exceeding 9 inches in 24 hours – 25 year event), the flashboards in the control structure would be removed to allow maximum discharge from the lake. Upon passing of the event, the flashboards would be re-installed.
2.6 Historical Nitrogen and Fecal Loadings Discharged via D-001
In June 1998, the Environmental Protection Agency adopted a Total Maximum Daily Load (TMDL) for Tampa Bay, with the pollutant of concern being total nitrogen. The TMDL was split into four sections of Tampa Bay: Old Tampa Bay, Upper Tampa Bay, Middle Tampa Bay, and Lower Tampa Bay. For Old Tampa Bay, where the Zoo is located, the allocation was 486 tons/yr. Through a unique public/private partnership called the Tampa Bay Nitrogen Management Consortium, affected stakeholders developed a Reasonable Assurance Plan (RAP) in 2009 to address nitrogen loadings through nutrient-abatement projects that would result in nitrogen loadings that would comply with the TMDL. The RAP also demonstrated that increased population in the Tampa Bay watershed would not cause additional nitrogen loading.
The Zoo was listed as a separate entity in the 2009 RAP, but in the 2012 RAP update, the Zoo was merged in with other small sources in the Small Sources category. As part of the forthcoming 2017 RAP update, and potential reallocation of some Bay-wide loads, the Zoo will likely be re-listed as a separate entity and will be contributing funds as an active partner in the Tampa Bay Nitrogen Management Consortium.
As part of the 2009 Tampa Bay Reasonable Assurance Plan, Lowry Park Zoo was assigned a total nitrogen allocation which was included in the Zoo’s Industrial Wastewater Treatment Permit (Permit #FL0186651). In the permit, the Zoo is allowed to discharge up to 1.5 tons/yr as a total annual load, and up to 1.0 tons/yr as a five-year rolling average.
The Hillsborough River is also an impaired waterbody (WBID 1443E) and has a fecal coliform TMDL that was adopted by the FDEP in September of 2004. The Zoo property and Hamilton Creek are in the watershed of the impaired river. Fecal coliform is expressed as the number of colony forming units (CFU) per 100 mL. Fecal coliform exceedance levels are 400 CFU/100 mL as a monthly average, and 800 CFU/100 mL as a maximum day.
GPI reviewed the Zoo’s discharge data from September 2012 through October 2015 and nitrogen loading values reported on Zoo’s Discharge Monitoring Reports (DMRs). Because nitrogen loadings reported on the DMRs were unreasonably low, it was discovered that that the Zoo had been incorrectly calculating these values. GPI built a loading calculator for the Zoo to use moving forward. Table 5 is a snapshot of the loading calculator. As shown in Table 5, the correctly calculated loads indicate that since September 2012, the Zoo has maintained its nitrogen loadings well below its permit allocations.

LPZ Water Resources Master Plan November 2015 Page 12
Table 5. Nitrogen Loading Calculator and Resulting Values.
Calculations:
Enter from Meter Log
Calculating total volume for month
(A X B = MG/month)
Enter Lab Data
Calculating monthly load
(C X D X 8.3454 ÷ 2,000 lbs/ton) Conversion:
1 mg/L = 8.3454 lbs/MG
Calculating rolling annual total
based on monthly average loading
(Column E)
Calculating 5-yr average annual
loading
ReportMonthly
Avg.
Not required to report, but need it to calculate loading
Report Monthly
Calculate per NPDES Permit
paragraph I.A.10
Calculate per NPDES Permit
paragraphs I.A.9 & I.A.11
Calculate per NPDES Permit
paragraph I.A.11
Report Report Report Limit = 1.5 tons/yr Limit = 1 tons/yrColumn ID: A B C D E G H
Year MonthDays in Month
Monthly
Avg. Flow(MGD)
Monthly TotalVolume
(MG/mo)
Total Nitrogen Monthly Average (mg/L)
Nitrogen LoadingMonthly Total
(tons/mo)
Total NitrogenTotal Annual
Loading(tons/yr)
Total Nitrogen5-yr Average
Loading(tons/yr)
Nitrogen Annual Loading
as a % of Allocation
Nitrogen5-yr
Average Loading
as a % of Allocation
2012 Sep 30 0.049867 1.4960 1.6 0.0100 0.0100 0.0020 1% 0%2012 Oct 31 0.144280 4.4727 1.26 0.0235 0.0335 0.0067 2% 1%2012 Nov 30 0.117103 3.5131 0.09475 0.0014 0.0349 0.0070 2% 1%2012 Dec 31 0.089790 2.7835 1.056 0.0123 0.0472 0.0094 3% 1%2013 Jan 31 0.823830 25.5387 1.075 0.1146 0.1617 0.0323 11% 3%2013 Feb 28 0.058467 1.6371 0.86 0.0059 0.1676 0.0335 11% 3%2013 Mar 31 0.076550 2.3731 1.37 0.0136 0.1812 0.0362 12% 4%2013 Apr 30 0.074540 2.2362 1.778 0.0166 0.1977 0.0395 13% 4%2013 May 31 0.092836 2.8779 1.1 0.0132 0.2110 0.0422 14% 4%2013 Jun 30 0.019700 0.5910 1.45 0.0036 0.2145 0.0429 14% 4%2013 Jul 31 0.104600 3.2426 1.76 0.0238 0.2383 0.0477 16% 5%2013 Aug 31 0.759970 23.5591 1.825 0.1794 0.4178 0.0836 28% 8%2013 Sep 30 0.870870 26.1261 1.4 0.1526 0.5604 0.1141 37% 11%2013 Oct 31 0.101683 3.1522 1.245 0.0164 0.5532 0.1174 37% 12%2013 Nov 30 0.117477 3.5243 1.4 0.0206 0.5724 0.1215 38% 12%2013 Dec 31 0.121683 3.7722 1.36 0.0214 0.5816 0.1257 39% 13%2014 Jan 31 0.100493 3.1153 1.625 0.0211 0.4882 0.1300 33% 13%2014 Feb 28 0.088103 2.4669 1.425 0.0147 0.4969 0.1329 33% 13%2014 Mar 31 0.104630 3.2435 1.3 0.0176 0.5010 0.1364 33% 14%2014 Apr 30 0.092947 2.7884 1.4 0.0163 0.5007 0.1397 33% 14%2014 May 31 0.095000 2.9450 1.35 0.0166 0.5041 0.1430 34% 14%2014 Jun 30 0.094247 2.8274 1.24 0.0146 0.5151 0.1459 34% 15%2014 Jul 31 0.068123 2.1118 1.15 0.0101 0.5014 0.1480 33% 15%2014 Aug 31 0.057803 1.7919 1.35 0.0101 0.3321 0.1500 22% 15%2014 Sep 30 0.088940 2.6682 1.036 0.0115 0.1910 0.1523 13% 15%2014 Oct 31 0.116767 3.6198 1.4 0.0211 0.1958 0.1565 13% 16%2014 Nov 30 0.119427 3.5828 1.625 0.0243 0.1995 0.1614 13% 16%2014 Dec 31 0.112017 3.4725 1.88 0.0272 0.2053 0.1668 14% 17%2015 Jan 31 0.103903 3.2210 1.7 0.0228 0.2071 0.1714 14% 17%2015 Feb 28 0.099673 2.7908 1.92 0.0224 0.2148 0.1759 14% 18%2015 Mar 31 0.129327 4.0091 1.7 0.0284 0.2256 0.1815 15% 18%2015 Apr 30 0.064350 1.9305 1.4 0.0113 0.2206 0.1838 15% 18%2015 May 31 0.122177 3.7875 1.085 0.0171 0.2211 0.1872 15% 19%2015 Jun 30 0.099057 2.9717 1.1625 0.0144 0.2209 0.1901 15% 19%2015 Jul 31 0.124743 3.8670 1.282 0.0207 0.2315 0.1943 15% 19%2015 Aug 31 0.055050 1.7066 2.875 0.0205 0.2419 0.1983 16% 20%2015 Sep 30 0.118600 3.5580 1.68 0.0249 0.2553 0.2033 17% 20%2015 Oct 31 0.132750 4.1153 0.94 0.0161 0.2503 0.2066 17% 21%
Permit Instructions:
Permit Requirements:

LPZ Water Resources Master Plan November 2015 Page 13
GPI reviewed the fecal coliform reported on Zoo’s DMRs from September 2013 through August 2015. During this period, on average, the Zoo’s fecal loading through the outfall has been 30% and 43% of its monthly-average and maximum-daily allowances, respectively. Prior to September 2013, and up to 2010, the Zoo had been under FDEP Consent Orders stemming from repeat fecal exceedances into Hamilton Creek. As a result, the Zoo installed the UV treatment system to disinfect water prior to discharging to Hamilton Creek. Since that time, the Zoo has not exceeded the monthly-average limit, but it did exceed the maximum-day limit three times (September 2013, and November and December 2014). The conditions causing these maximum-day exceedances are discussed below.
• The September 2013 exceedance was a result heavy rains (3.5 inches in two days). Due to heavy rains, Lake Sharon discharged untreated water over the weir into D-001 outfall. The Zoo worked with the FDEP to gain expedient compliance and raised the weir height by two feet by February 2014. Since the weir was raised, there have been no indications of Lake Sharon overtopping the weir.
• The November 2014 exceedance was due to the flow sensor on the UV system malfunctioning. The Zoo immediately replaced the flow sensor, and during the FDEP’s December 2014 Compliance Inspection, the FDEP found the Zoo to be in compliance.
• The December 2014 exceedance was a result of low precipitation thereby resulting in an increased wastewater strength in Lake Sharon. Potential projects resulting from this master plan include reducing clean stormwater flows to Lake Sharon. As such, disinfection rates of the UV will need to take into account increased wastewater strength that will result from reductions in clean stormwater in Lake Sharon.
2.7 Existing Surface Water Improvement and Management Ponds
The area located at the southwest corner of the Zoo between Lake Sharon and Sligh Avenue contains Surface Water Improvement and Management (SWIM) ponds. The SWIM ponds, constructed in 2001 by SWFWMD, comprise a one-acre stormwater treatment facility consisting of eight control structures and five wetland ‘pools.’ Its purpose was to provide for the environmental restoration of Hamilton Creek. The Zoo initially planned to incorporate the treatment facility into a native Florida exhibit, then a South American exhibit, and later, a Botanical Garden. The project was to include the creation of a wildlife habitat through wetland creation, and provide environmental education exhibits demonstrating the importance of wetlands to water quality and wildlife. However, the Zoo did not further develop the project area into an exhibit and it was left unmaintained.
The original planting plan included the following species:
• Trees: sweet bay, bald cypress;
• Shrubs: beauty berry, button bush; and
• Forbs: swamp fern, yellow canna, swamp lily, prairie iris, soft rush, lotus, pickerelweed, arrowhead, cord gross, bulrush, and Florida coontie.
Currently, the ponds are overgrown and clogged with nuisance vegetation to the extent that GPI was not able to thoroughly assess the condition of the control structures. However, GPI did identify that the control structures are in disrepair, mechanical equipment is missing and the weirs and ponds no longer function as intended.
Based on GPI’s knowledge of the original SWIM-pond project, after construction was substantially completed in 2001, but before the project was accepted by SWFWMD, the area around the weirs had eroded. At the time, the design was called into question, but the Engineer of Record stated that the issue was caused by the Contractor improperly installing filter fabric. Though these issues were

LPZ Water Resources Master Plan November 2015 Page 14
supposedly corrected by the contractor, GPI’s recent observation of the project indicated areas where stormwater flows have continued to erode the embankments around the weirs rendering the treatment facility non-functional. The SWIM ponds also included a recirculation system which pulled water from the lowest pond and pumped it upstream to the highest pond. This pump system is no longer in place. These various stormwater treatment infrastructure components should be repaired or replaced and the project restored either to its original design or to a design that meets or exceeds the original treatment objectives of the project. Restoration of the pond system is detailed in Subsection 4.1.
2.8 Existing Manure Management
Based on information GPI received from the Zoo, Zoo staff pick up approximately 14 cubic yards of animal manure every day and store it in two 20-cubic yard containers on site. On average, 20 times per month, the containers are emptied and manure is transported to Sweetwater Farms and to another private farm in Odessa. The Zoo pays approximately $4,000 per month to have the manure removed from the site and hauled to these farms.
3.0 OVERVIEW, SCORING, AND RANKING OF POTENTIAL PROJECTS
Based on existing conditions, GPI developed several potential projects that would improve water quality and conservation. As part of the project-development process, GPI evaluated the potential to use existing properties (outside of the Zoo’s footprint) to provide stormwater treatment and/or improve water-quality.
• One of the properties is a defined area within the City-owned property that the Zoo leases from the City. The area is located at the southwest corner of the Zoo between Lake Sharon and Sligh Avenue and it contains Surface Water Improvement and Management (SWIM) ponds.
• The other properties include Zoo-owned residential lots to the west of the Zoo.
GPI identified the opportunity to restore the SWIM; however, none of the other stormwater-treatment/water-quality improvement or water-conservation options identified in this master plan were shown to benefit from the use of the Zoo-owned residential lots. As such, their use was not further considered. Restoration of the SWIM ponds, however, will be pursued by the City without the Zoo.
To evaluate potential projects to be implemented by the Zoo, GPI developed a simple benefit-cost matrix (Table 6) to identify projects with fatal flaws and rank projects based on their scores.

LPZ Water Resources Master Plan November 2015 Page 15
Table 6. Matrix of Project Options
Based on the final scores and fatal-flaw criteria, the projects were ranked as shown below. Projects considered to be unreasonably disruptive to animals were considered to be a fatally flawed. As such, the amount of animal disruption involved in completely separating dirty/clean stormwater in Old Zoo was found to be unacceptable from Zoo’s perspective. Disruption would be great because pool-drop inlets are submerged in pools located within animal habitats. Projects that scored higher than the do-nothing option should be considered for implementation. As such, GPI developed conceptual cost estimates for those projects (see Section 4).
Table 7. Rankings of Project Options
Rank Project Options Score 1 Opt. B Targeted Diversion of Clean SW to Rain Gardens 15
2 Opt. D Storage/Reuse of Targeted Clean SW 14 Opt. E Storage/Reuse of Treated Lake Sharon WW 14
3 Opt. G Do Nothing 9 4 Opt. C Targeted Diversion of Dirty SW to City SS 8 5 Opt. F Manure Managed as Compost or Waste-to-Energy 5
NC Opt. A Separate All Clean/Dirty SW Fatal Flaw Notes
NC = project was not considered further due to fatal flaw
Opt. A Opt. B Opt. C Opt. D Opt. E Opt. F Opt. G
Separation of all
Clean/Dirty SW with all
Dirty SW to City SS
Targeted Diversion of Clean
SW to Rain
Gardens
Targeted Diversion of Dirty SW to City SS
Storage/Reuse of Targeted
Clean SW
Storage/Reuse of Treated
Lake Sharon
WW
Manure Managed
as Compost
or Waste-to-
EnergyDo
Nothing
Capital Costs 1 3 2 2 1 1 3Additional Operating Costs 1 3 2 3 2 1 3Disruption to Animals 0 3 1 2 2 3 3
Reduction of Nutrients Discharged to Hillsb. River 2 2 2 2 3 0 0Reduction of Fecal Matter Discharged to Hillsb. River 1 1 1 1 1 0 0Conservation of Purchased Potable Water 0 0 0 1 3 0 0Conservation of Self-supplied Well-water 0 0 0 1 3 0 0Public Education of Water Conservation and SW BMPs 0 3 0 3 2 0 0
TOTAL SCORE: 5 15 8 14 14 5 9
NotesSS = City sanitary sewer; SW = stormwater; Clean SW = without fecal matter; Dirty SW = with fecal matter; WW = waste water from Lake SharonAll costs are from Zoo's perspectiveOptions A and C through E refer only to Old Zoo; Option B is Zoo-wideOptions with impractical (score = 0) for animal-disruption is considered to be a fatal flaw. No other scores zero are considered fatal flaws Cost and benefit scores are relative to competing options Reduction of fecal matter for Options A through E is low because water is currently disinfected (by UV) prior to discharging to Hamilton Creek
Costs (0 = Unacceptable; 1 = high; 2 = med; 3 = low to $0)
Benefits (0 = none; 1 = low; 2 = med; 3 = high)
Rain gardens and storage/reuse of clean stormwater received higher scores for education than storage/reuse of Lake Sharon WW. This is because storage/reuse of Lake Sharon WW is an industrial wastewater reuse project and is therefore not a projet that a typical Zoo visitor would implement.

LPZ Water Resources Master Plan November 2015 Page 16
4.0 RECOMMENDED PROJECTS
Recommended projects are presented in the following subsections. With the exception of the restoration of SWIM ponds, the Zoo would implement the recommended projects. Restoration of the SWIM ponds would be a City-only project. For each project, a description is provided along with permitting considerations, conceptual costs, and public-education opportunities. Permit considerations are not exhaustive in that they do not include permits typically secured by the General Contractor.
4.1 Restoration of SWIM Ponds by City
To improve Hamilton Creek water quality, it is recommended that the City restore the function of the SWIM ponds. As a first step, overgrowth should be cleared and nuisance and exotic species removed so that facilities can be thoroughly inspected and surveyed in support of restoration design efforts. The weir designs should be re-evaluated to determine if there is a problem with the design/construction. It is possible that the installation of the riprap and gabions actually promote the development of piping along the concrete-fabric-soil interface. At the very least, the area around and adjacent to the weirs needs to be reconstructed.
It is also possible that the site is receiving more flow from offsite contributing areas than was initially estimated in the SWIM stormwater model. GPI recommends the SWIM model be rerun and possibly revised to ensure the site is adequately designed or can be redesigned/reconstructed to meet actual, current flow characteristics and capacity.
To restore the system to the original condition and purpose, a new pump and power supply would have to be installed. However, it may be desirable to eliminate the mechanical components and revise the design as a gravity-only system. This would reduce overhead and maintenance costs. Further, it is questionable how much the recirculation system added to the overall effectiveness of the system. After the ponds and weirs are re-constructed and the embankments stabilized, a planting plan will be required. The ponds were intended to be treatment wetlands, likely because wetlands are one of the least expensive treatment systems to operate and maintain.
The restoration plan may include increasing treatment volume which will improve water quality treatment of Hamilton Creek. Additional detention/treatment capacity can be achieved by increasing the size of the ponds. When first designed, certain upland features were left (unexcavated) between ponds to save trees and create an island effect. It appears some of the trees have since died, so there may no longer be a reason for the island(s). By removing one or more of the islands, the wetlands and treatment capacity may perhaps be increased by as much as 50%.
4.1.1 Permitting Restoration of SWIM Ponds
The project was first permitted through FDEP by a Noticed General Environmental Resource Permit. Approval by the Environmental Protection Commission of Hillsborough County and the Army Corps of Engineers was also required. It is anticipated that the same process will be required again for restoration of the system. Whether post-construction monitoring and sampling, initially required for three years, will be required again, is unknown at this time. The proposed project will need to include a discovery task to determine current permit conditions to identify if the permit was released by the regulatory agencies or if the permits remain open and permit conditions have not been met.
4.1.2 Conceptual Cost Estimate for Restoring SWIM Ponds
GPI developed a conceptual cost estimate based on experience with similar projects. The cost estimate shown in Table 8 assumes that all soil and sediment removed from the project area will either be sterilized and reused on site or will be disposed of at the City facility adjacent to the Zoo. It also assumes

LPZ Water Resources Master Plan November 2015 Page 17
that only two weirs will need to be replaced, and that plantings will be limited to minimum requirements.
Table 8. Conceptual Cost Estimate for Restoring SWIM Ponds
4.1.3 Incorporating SWIM Ponds into Zoo Grounds for Environmental Education
Further enhancing the area around the ponds and incorporating it into the Zoo grounds as a Botanical Garden and Environmental Education Exhibit could provide a new attraction and a means of showcasing Florida-friendly plants and informing the public about the benefits of utilizing wetlands as biological water treatment systems. The use of constructed wetlands, with accompanying ponds, is becoming a routine best management practice (BMP) for controlling the quality of runoff.
4.2 Targeted Diversion of Clean Stormwater to Rain Gardens
The installation of rain gardens is recommended to improve water quality of storm runoff and to reduce pumping and treatment costs associated with flows that otherwise do not need to be treated for fecal matter. The term “targeted diversion” refers to targeting clean stormwater except where clean stormwater could easily be diverted to storage for reuse (such as the area near the entrance to the Zoo).
Figure 3– Recommended Projects shows clean stormwater infrastructure in Old Zoo (in orange). VES ground-truthed the areas near clean stormwater inlets and identified 20 potential locations for rain gardens. This effort of identifying opportunities to install rain gardens extended beyond Old Zoo and Figure 3 shows proposed rain gardens throughout the Zoo and also in the Zoo’s the parking lot. These candidate rain-garden locations generally include areas that collect stormwater runoff from higher lying areas and are located in high-access public locations. Individual sites include a variation of sizes from small sites (200 sf) to large sites (6,300 sf), with an even distribution of sizes in between.
MOBILIZATION 5,000$ PLANS & PERMITS BY CONTRACTOR 5,000$ PAYMENT AND PERFORMANCE BOND 5,000$ EROSION AND SEDIMENT CONTROL 5,000$ SURVEY / AS-BUILTS 2,500$ QUALITY CONTROL / TESTING / GEOTECHNICAL SERVICES 2,500$ DEWATERING - TEMP BYPASS CHANNELS 5,000$ CLEARING AND GRUBBING 5,000$ DEMOLITION & REMOVAL OF EXISTING WEIRS, GABIONS & RIP RAP 10,000$ SEDIMENT EXCAVATION 80,000$ STRUCTURAL SAND - REUSE EXCAVATED SANDS IN-SITU 10,000$ EXCAVATED SAND DISPOSAL ON ADJACENT CITY PROPERTY 10,000$ RELOCATION / CONSTRUCTION OF MODIFIED WEIRS 20,000$ SLOPE STABILIZATION 20,000$ FINAL GRADING 10,000$ PLANTING / SODDING 25,000$ STORM DRAIN MODIFICATIONS 5,000$
TOTAL BEFORE CONTINGENCY 225,000$ CONTINGENCY @ 30% 67,500$
TOTAL WITH CONTINGENCY 292,500$

LPZ Water Resources Master Plan November 2015 Page 18
The Zoo recently submitted an application for an EPA Gulf of Mexico Regional Partnership grant to implement a rain-garden project with the University of South Florida (USF). Information provided in the grant application states that the potential sites shown in Figure 3 would be ranked based upon the following factors: potential nitrogen sources within the contributing drainage area (30%), visibility (30%), accessibility (30%) and construction feasibility (10%). Then, the top four sites would be selected for implementation and would include two to three enhanced nitrogen removal (modified) rain gardens and one to two conventional rain gardens. USF would take control measurements of nitrogen during the first rainy season from existing stormwater ponds, then install the rain gardens and monitor nitrogen reductions for years two and three of the project. Potential rain garden sites identified in Figure 3 that are not selected by the potential USF project, may be implemented by the Zoo.
For traditional rain gardens, the International Stormwater BMP Database shows a total nitrogen (TN) removal efficiency 21% and Version 3 of the Center for Watershed Protection’s National Pollutant Removal Performance Database lists a median removal efficiency of 46%. The University of South Florida (USF) is currently monitoring both a conventional and a modified rain garden at a field site in Tampa. Results to date indicate 61% TN removal for the modified rain garden versus 34% TN removal for the conventional rain garden. Similar removal efficiencies are expected for conventional and modified rain gardens that may be implemented at the Zoo.
4.2.1 Permitting Rain Gardens
Even though these rain gardens will not change the storm runoff conditions within the site, these systems would need to be permitted through the Florida Department of Environmental Protection. Because stormwater runoff from the Zoo property is covered by an FDEP Environmental Resources Permit (ERP), any earth-disturbing actions within the Zoo need to be approved under the ERP. It is expected that permitting requirements would be minimal and could be accomplished through a simple permit-modification process.
4.2.2 Conceptual Cost Estimate of Rain Gardens
The cost for construction of rain gardens can vary widely depending on the extent of earthwork required and the type of plant materials used. Rain gardens can vary in cost from less than $3/sf to over $50/sf. Because the rain garden areas will require minimal excavation/earthwork, only planting material costs were used in the cost estimate. It is expected that Zoo staff and equipment could be used to perform the limited earthwork to create the rain gardens. In addition, it is anticipated that the labor used for planting materials would be provided by students and volunteers. Therefore, a cost of $5/sf was used to develop a conceptual cost estimate for construction of the rain gardens. The total rain-garden area (for all 20 sites) is 34,300 sf; therefore, the cost to construct all 20 rain gardens would be approximately $171K. Although this cost assumes that all of the areas identified would be converted to rain gardens, it is likely that several of the areas may be eliminated because of future planned uses in these areas, proximity to other garden areas, or conflict with existing utilities. Maintenance costs for the rain gardens are assumed to be a negligible.
4.2.3 Public Education Opportunities for Rain Gardens
Public education opportunities for the rain gardens is quite high because rain gardens are simple improvements that Zoo visitors can implement at home. To enhance the educational component of this project, rain-gardens sites will include signage describing their purpose, plant materials used, monitoring activities, and the expected environmental benefits. Monitoring data will be used to determine the effectiveness of the rain gardens on improvements to water quality, which is an industry need. It is expected that USF would present the results of the monitoring in research publications.
LPZ Water Resources Master Plan November 2015 Page 19
4.3 Storage and Reuse of Treated Lake Sharon Wastewater
This recommended project includes storing treated water from Lake Sharon in an underground vault under the Events Lot. Except for the existing UV system, all other pumping and treatment systems would be upgraded and pumping, treatment, disposal, and outfall facilities relocated.
A pump station with 100% redundancy is proposed near the southeast bank of Lake Sharon. Water would be pumped from the Lake to an upgraded filtration system and the existing UV system which would be located south of the Events Lot. Treated water would flow by gravity from the treatment system into the storage vault. If this configuration is accepted, it is recommended to relocate the Hamilton Creek outfall downstream, closer to the new treatment system and to abandon the existing treatment and pumping (from the Lake to the treatment system and from the treatment system to the existing outfall) systems, existing outfall, and all associated piping. It may be possible to relocate and reuse the existing sanitary sewer meter as well as the meter on the outfall. However, meters with data collection and communication capabilities to automate operations and improve overall system reliability are recommended and existing meters may not integrate well into the new system.
The primary discharge of treated wastewater would be the storage vault, but when the vault is full or is out of service for maintenance or repairs, treated wastewater would be discharged to Hamilton Creek. Similar to the existing configuration, a metered sanitary sewer connection would be required for discharging filter backwash water and also for emergency disposal of untreated water during events when treatment must be bypassed. There are two potential options for the proposed new sanitary sewer connection. One is an existing manhole on the northeast corner of the Events Lot, and the other would involve installing a new manhole in the City’s sanitary sewer gravity trunk that runs east-west across the Events Lot directly south of the proposed vault. It is important to note that the City’s wastewater capacity analysis (see Subsection 2.5.2) identified 100 gpm available additional capacity in this line.
This option includes reuse of the treated and stored water, but specific uses for the reuse water would need to be identified in a basis of design report (BODR) following the completion and acceptance of this master plan because identifying water quality needs for potential end uses was not part of the master plan scope.
Automation with communication to system operators is recommended to improve reliability and to provide operators with on-demand information critical to water management throughout the Zoo. The current pumping and treatment system is largely operated manually. Moving to a more automated system will require adjustments in operations protocol, but once implemented, demands on operators should be greatly reduced. This project option also includes auxiliary power because system reliability is most vulnerable during extreme storm events, when pumping, treatment, and the option to bypass treatment and discharge to sanitary sewer is most needed. Although the system would include automation, communication, and auxiliary power, the system would be designed with manual overrides throughout.
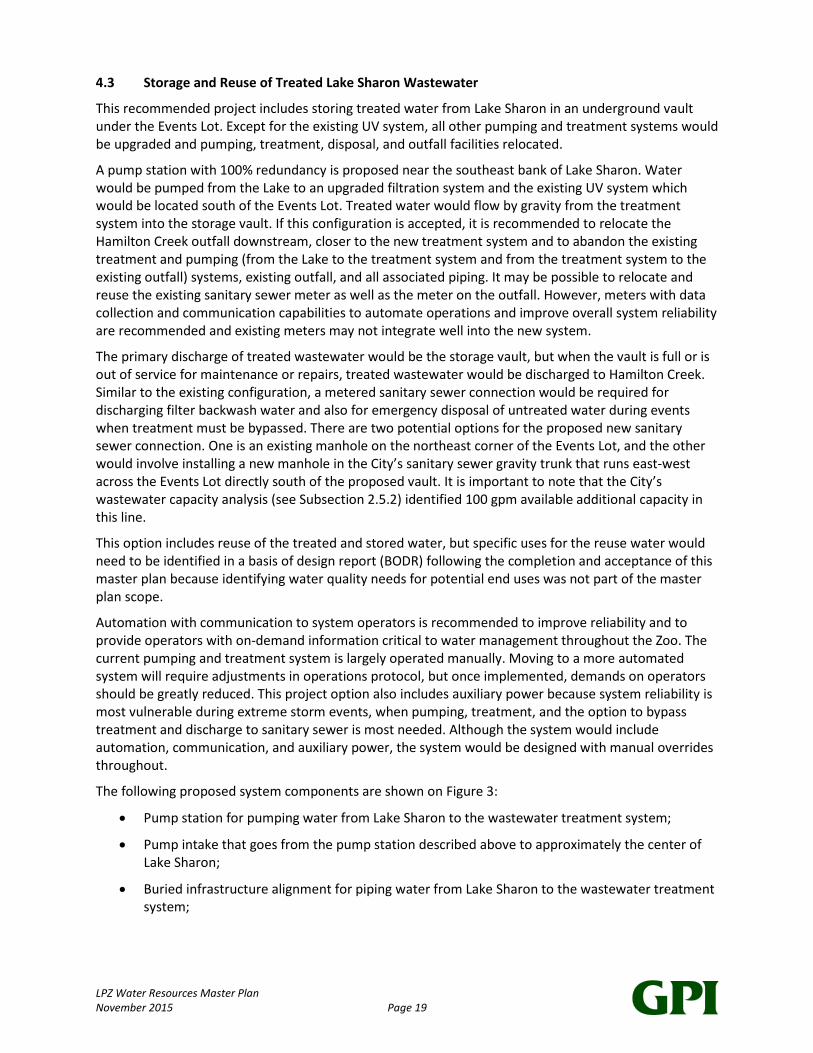
The following proposed system components are shown on Figure 3:
• Pump station for pumping water from Lake Sharon to the wastewater treatment system;
• Pump intake that goes from the pump station described above to approximately the center of Lake Sharon;
• Buried infrastructure alignment for piping water from Lake Sharon to the wastewater treatment system;

LPZ Water Resources Master Plan November 2015 Page 20
• Available area of reuse system – this area would contain the filtration and UV systems, pump station to pump water from the vault to end uses, auxiliary power, and automation and communication equipment.
Proposed components not shown on Figure 3 include the following:
• Alignment of the new outfall to Hamilton Creek, which would go from the treatment system to a location at Hamilton Creek that is near the treatment system and downstream from the existing outfall;
• Alignment of the gravity line from the treatment system to the vault;
• A new metered sanitary sewer connection;
• Alignment from the treatment system to the new metered sanitary sewer connection; and
• Alignments from the reuse-system pump station (that pumps from the vault) to end uses.
Parameters used to develop the conceptual design of this project option are summarized in Table 9 and additional details regarding storage vault construction and water treatment are discussed in Subsection 4.3.2.
Table 9. Conceptual Design Parameters for Treatment, Storage and Reuse of Treated Lake Sharon Wastewater
4.3.1 Permitting Storage and Reuse of Treated Lake Sharon Wastewater
Permitting considerations for this project include the Zoo’s industrial wastewater permit and permits associated with trees.
Industrial Wastewater Permit
The Zoo’s wastewater treatment system is permitted under Chapter 62-620 F.A.C. Adding reuse will require either a new permit or a permit revision. FDEP rules governing industrial wastewater contained in Chapters 62-4, 62-302, 62-520, 62--521, 62-522, 62-620, 62-621, 62-650, 62-660, 62-670, 62-671, 62-672, and 62-673, F.A.C., may also apply.
Parameters Basis of Conceptual DesignStorage Capacity (volume) 390,000 gallons Maximize available footprint in Events LotAvailable Supply of Reuse Water 300,000 GPD Average discharge via D-001 + Manatee backwash water
Total Potential Offset in Old Zoo 176,368 GPDReplace 100% of Manatee and Otter well water and 50% of City-supplied potable water in Old Zoo (from meter # 31945071)
Storage Capacity (time) 2 days Storage volume ÷ demand, where demand = potential offsetUV Disinfection Capacity 470 gpm Capacity of existing UV system
Filtration Capacity 500 gpmSelected to match capacity of existing UV-system capacity and to avoid the need to bypass filtration and UV and dump to sanitary sewer
Reuse Supply Finished Water Quality (WQ)
End Uses to be Supplied withReuse Water
Recommended project can meet NPDES WQ requirements and should be acceptable for washing down exhibit pools after draining them to Lake Sharon. Recommended project may meet WQ needs of moats (water barriers) with little to no additional treatment. Further analyses are needed to identify other specific end uses such as toilet/urinal flushing, filling exhibit pools and/or backwashing Manatee filters. It is possible to meet or exceed existing WQ of well water with additional treatment (after storage and before delivery).
To beDetermined
Conceptual Value

LPZ Water Resources Master Plan November 2015 Page 21
Tree Permits
Chapter 13 of the City of Tampa Code of Ordinances, known as the City of Tampa Landscaping, Tree Removal and Site Clearing Ordinance (the Ordinance), is intended to protect trees, wetlands, and natural resources by regulating the trimming or removing of trees, site clearing, landscaping, tree planting, and irrigation in the city. The provisions of the Ordinance apply to all buildings, development, improvements and land within the corporate limits of the City, unless expressly exempted by law. “Protected trees,” as defined by the Ordinance, are trees greater than five inches in diameter at breast height (DBH) and all mangrove and cypress trees, regardless of size. When a tree is determined not to be a grand tree, it shall be considered a protected tree if it otherwise meets the definition of a protected tree. Grand trees are defined in the Ordinance by a point system. Points are assigned based on circumference, and canopy height and spread. If total points for the tree meets the minimum points identified for the species of the tree, the tree is a grand tree.
The Ordinance requires a site-inspection, and a site-clearing permit be obtained for any parcel on which protected trees are located within thirty feet of proposed development as confirmed by the site inspection. Permits are also required for the removal of protected and grand trees; and for trimming branches four inches or greater in diameter measured twelve (12) inches from the base of the branch located on any protected or grand tree located in a public right-of-way in the City.
Several aspects of construction can be detrimental to trees, these include but are not limited to: excavation, fill, improper pruning, bark injuries caused by equipment, changes in hydrology, and soil compaction. Regarding trees observed near Lake Sharon, Cypress, Sweet Gum and Loblolly Pine trees are typically tolerant of impacts from construction; Live Oaks are moderately tolerant. In general, younger and healthier trees are also more tolerant to impacts compared to older or stressed trees. Tree morphology is also an issue for construction access. Pines and Cypress typically have an upright growth pattern allowing for easier access between trees, while Live Oaks typically have many large spreading branches closer to the ground. Thus, an assessment of the trees within and adjacent to any proposed development site is recommended early in the concept development process in order to avoid and minimize impacts to trees and streamline the permitting process during design and construction.
As part of developing the Lake Sharon storage and reuse project option, an ISA-certified Arborist performed a visual inspection of trees located along the areas south and east of Lake Sharon as identified on Figure 3. Based on the locations, types, and conditions of trees in the area, the Arborist was able to recommend areas where infrastructure can be constructed to support water pumping, treatment, and storage and avoid and minimize impacts to trees. The Arborist identified acceptable footprints for the pump station (proposed to pump water from Lake Sharon to the wastewater treatment system), the alignment of underground piping from the pump station to the treatment system, and a large area for the reuse system (treatment, auxiliary power, and pump station for pumping from the vault to end uses). These areas are also shown on Figure 3.
Trees observed by the Arborist as part of this project are identified on Figure 4 and descriptions of the trees are provided in Table 10. Based on their DBH, all trees in the observed area were determined to be protected trees, but no trees met the point-requirements to qualify as grand trees. Some minor trimming of trees may be required for construction. If construction methods require the removal of one or both of the two Sweet Gum trees, their permitted removal may not require mitigation due to their poor condition.

LPZ Water Resources Master Plan November 2015 Page 22
Table 10. Trees Observed near Lake Sharon (see Figure 4 for Tree Locations)
Tree No.on
Figure 4Species Name
Common Name
DBH(inches)
Circumf.(feet)
AvgerageCanopy Spread(feet)
Canopy Height(feet)
ClearanceHeight(feet) Comments
Observed Condition
1Quercus
virginianaLive Oak 18 4.7 25 32 20
Clearance height assumes trimming one branch.
Fair
2Quercus
virginianaLive Oak 26 6.8 42 30 9 Clearance varies Good
3Taxodium distichum
Bald Cypress
19 5.1 25 52 20Clearance assumes minor trimming
Good
4Quercus
virginianaLive Oak 26 6.8 65 35 8 Good
5Taxodium distichum
Bald Cypress
10 2.7 15 30 10 Excellent
6Taxodium distichum
Bald Cypress
16 4.2 25 45 20Clearance assumes minor trimming
Excellent
7Taxodium distichum
Bald Cypress
16 4.1 20 35 15Clearance assumes minor trimming
Excellent
8Taxodium distichum
Bald Cypress
15 4 20 40 20Clearance assumes minor trimming
Excellent
9 Pinus taedaLoblolly
Pine22 5.7 45 61 20 Good
10Taxodium distichum
Bald Cypress
17 4.5 30 60 20Clearance assumes minor trimming
Excellent
11Taxodium distichum
Bald Cypress
18 4.8 20 60 20Clearance assumes minor trimming
Excellent
12Taxodium distichum
Bald Cypress
15 4 15 60 20Clearance assumes minor trimming
Excellent
13Liquidambar
styracifluaSweet Gum
16 4.3 15 25 20Based on poor condition, remove if needed
Poor
14Liquidambar
styracifluaSweet Gum
16 4.1 20 25 20Based on poor condition, remove if needed
Poor
15Quercus
virginianaLive Oak 24 6.3 50 28 8 Excellent
16Quercus
virginianaLive Oak 16/19/15/13 4.1/4.9/3.8/3.3 60 40 20 Four trunks Fair
17Quercus
virginianaLive Oak 76 20 32 32 20
Double trunk; multiple large branches prev. pruned off
Fair
18Quercus
virginianaLive Oak 29 7.6 60 30 10 Good
19Quercus
virginianaLive Oak 35 9.1 60 30 15 Good
20Quercus
virginianaLive Oak 15/38 3.8/10 75 45 10 Double trunk Good
21 Pinus taedaLoblolly
Pine20 5 20 45 30 Good

LPZ Water Resources Master Plan November 2015 Page 23
4.3.2 Conceptual Cost Estimate for Storage and Reuse of Treated Lake Sharon Wastewater
A conceptual capital cost estimate for this recommended project option was developed based on previous experience and conceptual cost estimates from filtration and vault suppliers. The cost estimate is provided as Table 11 following the below description of the vault and treatment system.
Underground Storage Vault
The most cost-effective type of underground stormwater storage facility for the Zoo would be a vault consisting of an aluminized steel corrugated metal pipe (CMP) system. CMP depths of six feet can be installed for $5/cf. A 15,000-sf CMP system (100’ x 150’) with a depth of six feet can store 52,000 cf or 390,000 gallons of water at a capital cost of $260K.
The maintenance requirements of the vault itself are: the annual (minimum) inspection and removal of debris and accumulated sediments within the system; monthly inspections of the inlets and outlets to remove trapped materials ensuring proper performance of the system; and any required structural repairs to be addressed on an as-needed basis. O&M costs for the vault are estimated to be $20K/yr.
Wastewater Treatment System
The current wastewater treatment system in place includes sand filters and UV treatment. The UV system is sized for a maximum flow rate of 470 gpm at 90% UV Transmittance (UVT), which is high. Most systems are typically sized for a UVT of 50-75%. UVT is related to the quantity of organics, suspended solids and other material in the water which limit the UV light as it passes through the water, thereby affecting the effectiveness of the treatment system. Lower UVT percentages will lower the maximum flow rate through the system in order to guarantee proper disinfection. During basis-of-design efforts, it is recommended to test the water with a UVT meter to identify the exact percentage in order to ascertain the system’s maximum flow rate and treatment capacity. Similar to the current Lake Sharon wastewater treatment system, sediment filtration should take place before water passes through the UV units. Particulate matter, color, and turbidity affect the transmission of light to the microorganisms and must be removed for successful disinfection. For the purpose of this master plan, a filtration system capable of meeting the maximum flow rating of the UV was selected. The annual O&M costs for the UV system is estimated to be about $15K per year.
4.3.3 Public Education Opportunities for Storage and Reuse of Treated Lake Sharon Wastewater
Unlike rain gardens, reuse projects such as this one are not projects that homeowners could implement. However, the project may be promoted by the Zoo as a way to convey the value of water and that clean water is finite resource. Signage at taps and other points of use will be necessary for informing Zoo staff that the source water is reuse water. Public signage near exhibits with water features could inform visitors that the exhibit is filled with water that is captured, treated to high standards, and reused on site. Somewhere highly visible to guests, a display or other communication media could be used to teach visitors about the Zoo’s entire reuse project. It is recommended that all branding associated with the Zoo’s reuse program use the purple color indicative of reuse pipe (Pantone 522). Messaging should not include the word “reclaimed water,” because the Chapter 62-610, F.A.C. defines reclaimed water as “water that has received at least secondary treatment and basic disinfection and is reused after flowing out of a domestic wastewater treatment facility.” The Zoo’s wastewater facility is an industrial wastewater treatment facility, not a domestic facility.

LPZ Water Resources Master Plan November 2015 Page 24
Table 11. Conceptual Cost Estimate for Lake Sharon Treatment, Storage, and Reuse
4.4 Storage and Reuse of Diverted Clean Stormwater from Zoo Entrance Area
This option includes the capture/collection, and pre-treatment of clean stormwater from the Zoo’s entrance area (see clean stormwater capture area on Figure 3). This project option is considered an add-on to the Lake Sharon storage/reuse option and therefore costs associated with storage and reuse are included in that option along with general-requirement costs (see Table 11). Operation of this component of the reuse system needs to consider alternative discharge of the stormwater when the vault is full or is out of service for corrective maintenance or repairs, and that is a consideration that would need to be vetted in the permitting process.
4.4.1 Permitting Storage and Reuse of Clean Stormwater
Permitting this project option would be the same as the permitting efforts described in Subsection 4.3.1.
GENERAL REQUIREMNTSMOBILIZATION 5,000$ PLANS & PERMITS BY CONTRACTOR 5,000$ PAYMENT AND PERFORMANCE BOND 5,000$ EROSION AND SEDIMENT CONTROL 5,000$ SURVEY / AS-BUILTS 2,500$ QUALITY CONTROL / TESTING / GEOTECHNICAL SERVICES 2,500$
STORAGEVAULT (INSTALLED WITH INLETS/OUTLETS, LEVEL SENSORS) 260,000$ RELOCATE POWER POLE FROM EVENTS LOT 20,000$ DEWATERING 5,000$ PAVING & RESTORATION 60,000$
LAKE SHARON WASTEWATER TREATMENT SYSTEMFILTRATION (EQUIPMENT ONLY) 20,000$ DISINFECTION (UV EQUIPMENT ONLY - ASSUMES USING EXISTING) -$ INSTALL FOUNDATION, FILTRATION, UV, VALVES, CONTROLS 150,000$
PUMPING (INSTALLED ON PADS WITH POWER SUPPLY)FROM LAKE TO TREATMENT SYSTEM (2 PUMPS FOR REDUNCANCY) 20,000$ FROM STORAGE TO END USES (2 PUMPS FOR REDUNCANCY) 40,000$
POWER SUPPLY & GENERATORAC POWER PANEL (INSTALLED) 5,000$ GENERATOR (EQUIPMENT ONLY) 12,000$ INSTALL GENERATOR ON PAD WITH CONTAINMENT 5,000$ TRANSFER SWITCH/PANEL (INSTALLED) 2,000$
PIPING (INSTALLED & INCLUDES FITTINGS AND RESTORATION)FROM LAKE SHARON TO TREATMENT (1,000 LF @ $25/LF) 25,000$ FROM STORAGE TO END USES (3,000 LF @ $30/LF) 90,000$
CONTROLS, AUTOMATION & COMMUNICATIONHARDWARE & SOFTWARE ALLOWANCE 30,000$
TOTAL (BEFORE CONTINGENCY) 769,000$ CONTINGENCY @ 30% 230,700$
TOTAL WITH CONTINGENCY 999,700$

LPZ Water Resources Master Plan November 2015 Page 25
4.4.2 Conceptual Cost Estimate for Storage and Reuse of Clean Stormwater
The capital costs related to capturing and storing rainwater from the entrance area of the Zoo include modifications to structures, piping to vault, a separator, and site restoration. For this project option, clean stormwater would be conveyed to the vault via guttering and direct stormwater drainage pipes. It is assumed that some modification to the building guttering will be required to maximize rainwater collection potential. At least one hydrodynamic separation device (interceptor) will be required to remove debris and suspended solids from the stormwater runoff through gravitational settling and trapping. O&M costs are estimated to be $3K annually.
Future basis-of-design efforts may identify that it is more cost effective to capture, treat and store these flows through the existing drainage system. Meaning that if this project option were not implemented, the potential to capture and reuse these flows is not lost as they would continue to flow to Lake Sharon, be treated by the new Lake Sharon treatment system, and then stored in the vault. Further, it is unknown at this time if the Zoo would be allowed to discharge the primary treated (by the separator) stormwater to Hamilton Creek when the storage vault is full or if flows would need to first be attenuated in Lake Sharon. Emergency operations (such as when Lake Sharon is bypassing treatment and being disposed directly to the sanitary sewer) would also need to be considered. These details should be evaluated through pre-permitting discussions with FDEP during the basis-of-design phase and the results of those discussions should inform infrastructure design, system controls/automation, and standard operating procedures for the system.
Table 12. Conceptual Cost Estimate for Capture/Collection and Storage of Clean Stormwater from Zoo Entrance
GENERAL REQUIREMNTSINCLUDED IN STORAGE/REUSE OF LAKE SHARON WW PROJECT -$
STORAGEINCLUDED IN STORAGE/REUSE OF LAKE SHARON WW PROJECT -$
TREATMENTHYDRODYNAMIC SEPARATION DEVICE (INSTALLED) 20,000$
PUMPING (INSTALLED ON PADS WITH POWER SUPPLY)FROM CAPTURE AREA TO TREATMENT/STORAGE
ASSUMES GRAVITY -$ FROM STORAGE TO END USES
INCLUDED IN STORAGE/REUSE OF LAKE SHARON WW PROJECT -$ POWER SUPPLY & GENERATOR
INCLUDED IN STORAGE/REUSE OF LAKE SHARON WW PROJECT -$ PIPING (INSTALLED & INCLUDES FITTINGS AND RESTORATION)
FROM CAPTURE AREA TO TREATMENT/STORAGE (1,000 LF @ $30/LF) 25,000$ FROM STORAGE TO END USES
INCLUDED IN STORAGE/REUSE OF LAKE SHARON WW PROJECT -$ MODIFICATIONS TO STORMWATER STRUCTURES AND GUTTERS
GENERAL ALLOWANCE 55,000$ CONTROLS, AUTOMATION & COMMUNICATION
INCLUDED IN STORAGE/REUSE OF LAKE SHARON WW PROJECT -$ TOTAL (BEFORE CONTINGENCY) 100,000$
CONTINGENCY @ 30% 30,000$ TOTAL WITH CONTINGENCY 130,000$

LPZ Water Resources Master Plan November 2015 Page 26
4.4.3 Public Education Opportunities for Storage and Reuse of Clean Stormwater
Public education opportunities for this project are similar to and would be combined with opportunities discussed in Subsection 4.3.3. However, what is unique to this component of the recommended reuse program, is that homeowners and commercial property owners could implement a similar project, which would essentially be a project where rainwater is captured and stored in a cistern and then reused for irrigation, car washing, and other non-potable uses. Although the Zoo would be combining rainwater with treated industrial waste, messaging could focus on the value of capturing and reusing rain water which is a project that could be implemented by visitors on their properties.
5.0 NEXT STEPS AND OTHER RECOMMENDATIONS
Below is a list of next steps and other recommendations not discussed elsewhere in this master plan
• City should begin design efforts for restoration of the SWIM Ponds.
• Identify potable-water piping in Old Zoo and stormwater and wastewater discharges in the southwest area of Old Zoo where stormwater infrastructure is currently unknown;
• Zoo should move forward with the development of the BODR for storage/reuse of treated Lake Sharon wastewater and clean stormwater from Zoo-entrance area. Components of the BODR should include at a minimum:
o Sub-metering of exhibit-pool washdown water to better quantify appropriate storage volume, pumping requirements, and reuse piping
o Identifying instantaneous flow and pressure requirements at all proposed end uses to specify pumping requirements and pipe sizes
o Identifying acceptable water quality for each potential use of treated Lake Sharon wastewater. For well-water offsets, as long as the treated wastewater is of the same quality as well water, replacing well water with treated Lake Sharon water to fill exhibits should be acceptable
o Additional water-quality testing of well water and treated Lake Sharon water to identify baseline water quality, testing for parameters that relate to various uses (exhibit pools used by animals, exhibit pools used for animal containment (moats), and fouling of taps used for washdown water)
o Geotechnical investigation of Events Lot
o Detailed survey and subsurface utility evaluation of Events Lot and all proposed piping alignments
• Consider installing floating islands to improve water quality in Lake Sharon;
• Currently, the sand filters for the Lake Sharon wastewater treatment system are backwashed with untreated Lake Sharon water. Until the Zoo can upgrade Lake Sharon treatment system, it is recommended to re-plumb system to backwash with City potable or treated Lake Sharon water. Also, a pre-filter should be installed upstream from the sand filters to remove shells and other debris entering the intake pipe. If the intake sits on the bottom of Lake Sharon, it is recommended to raise the inlet to reduce entrainment of shells and debris from the bottom of the lake;
• All hoses used for washing down exhibit pools after pool drops should be fitted with high-pressure nozzles with a shut-off feature;

LPZ Water Resources Master Plan November 2015 Page 27
• Approximately half of the aerators on hand-sink faucets are 2.2 gpm (instead of 0.5 gpm). Replace 2.2-gpm aerators with 0.5-gpm aerators to reduce this end use by 30%. All toilets and urinals are currently 1.6 gallons per flush (gpf) and 1 gpf, respectively. New or renovated bathroom facilities should use 1.28-gpf or dual-flush toilets to reduce this end use to 30%. It is not recommended to replace flush valves and use existing 1.6-gpf porcelain bowls because bowl design should match flush-valve ratings to ensure hydraulic performance; and
• Replace pre-rinse spray nozzles in food service areas with 1.6-gpm nozzles. There are several models on the market that perform better at this lower flowrate because the spray pattern is similar to a knife instead of a showerhead. This fixture replacement will save both water and energy from heating water

FIGURES

WATER RESOURCES MASTER PLANLOWRY PARK ZOO
FIGURE 1. UTILITY MAP - EXISTING CONDITIONS
LEGEND
C:\C
AD
\13-
214\
13-2
14.d
wg, 1
0/8/
2015
8:4
4:46
AM
VICKSTROM ENGINEERING SERVICES, INC.
505 20th Avenue NESt. Petersburg, FL 33704Telephone No. (727) 894-0404CA No. 30184
PREPARED FOR:

PREPARED FOR:CITY OF TAMPA
ANDLOWRY PARK
ZOO
VICKSTROMENGINEERINGSERVICES, INC.

WATER RESOURCES MASTER PLANLOWRY PARK ZOO
FIGURE 3. PROPOSED PROJECTS
LEGEND
C:\C
AD
\13-
214\
13-2
14.d
wg, 1
0/8/
2015
3:2
9:12
PM PREPARED FOR:
VICKSTROM ENGINEERING SERVICES, INC.
505 20th Avenue NESt. Petersburg, FL 33704Telephone No. (727) 894-0404CA No. 30184
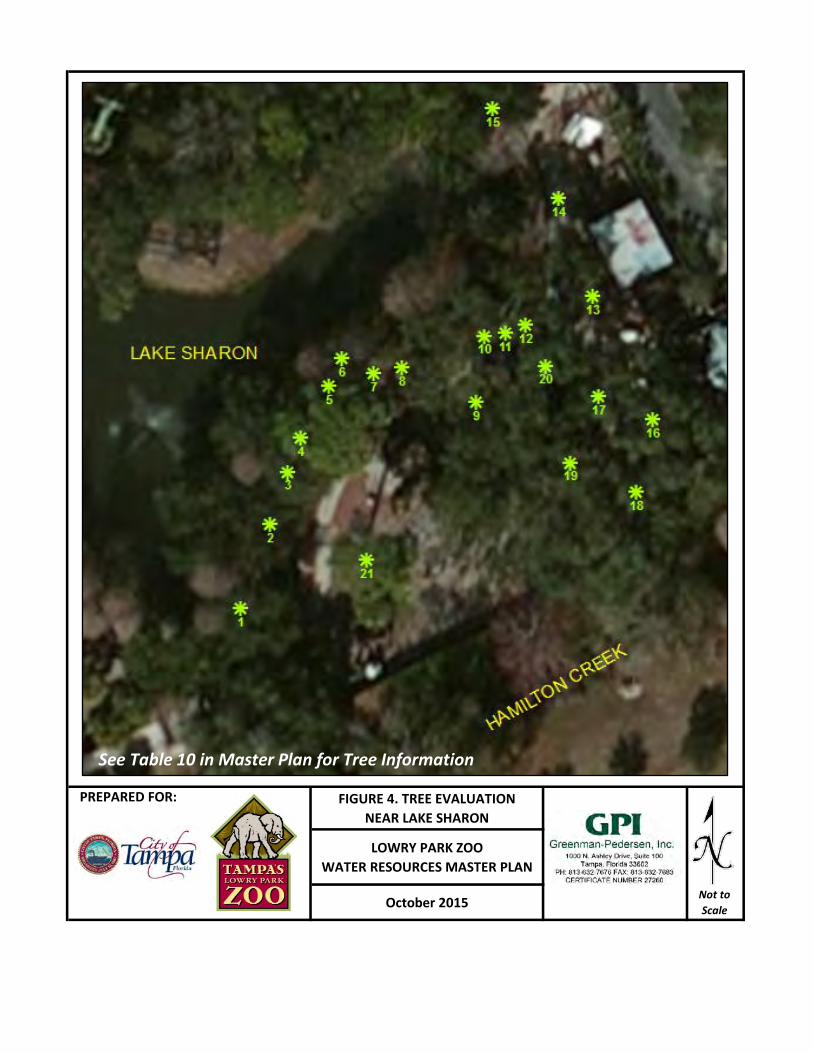
FIGURE 4. TREE EVALUATIONNEAR LAKE SHARON
LOWRY PARK ZOOWATER RESOURCES MASTER PLAN
October 2015 Not to Scale
PREPARED FOR:
See Table 10 in Master Plan for Tree Information

1000 N Ashley Drive, Suite 100, Tampa, Florida 33602(813) 632-7676