lower tully state school queensland state school reporting 2015 · pdf file ·...
TRANSCRIPT
Lower Tully State School Queensland State School Reporting 2015 School Annual Report
Postal address 6 Collins Road Lower Tully 4854
Phone (07) 4066 9351
Fax (07) 4066 9110
Email [email protected]
Webpages Additional reporting information pertaining to Queensland state schools is located on the My School website and the Queensland Government data website.
Contact person A/Principal Julie Musumeci
Principal’s foreword
Introduction
The 2015 school year proved to be another successful one. Significantly it was the year whereby we were lead by our Year six students for the first time and indeed it was the second year of the Great Results Guarantee, both of which proved to be most successful. Of equal significance was the collaboration with the Griffith University and the Age Appropriate Pedagogies for Prep research which witnessed the implementation of our project proving to be excitingly successful. This will no doubt continue next year as we certainly have investigated avenues for further expansion into all year levels.
The data presented in this report speaks largely for itself but as always there is a story behind the information. Our community is well versed in this interpretation of results based on our small population and relishes our emphasis on individual learning journeys through a wide range of educational activities and experiences.
Many of these experiences involve our participation in our Ulysses Cluster of schools as well as our own undertakings. School camps to Daradgee EEC and Daintree proved to be most successful and eagerly anticipated. Live performances both by our students and professional companies always provide a wealth of long term memories and immediate core benefit. Amongst these were Dinosaur Science, Best of Brass, TSHS Yr 10 Drama performance, Science Discovery Day, Wetlands Science day with MBSS students, the Gala Concert with Cluster instrumental music students, Anzac Day poppy project and Skills Day Out. One particularly engaging and totally enjoyable program was Dance Fever which culminated in a whole of school performance for our parents and community members which was very well received. Whilst not an exhausted list, it provides an insight into our commitment to offering programs and opportunities for learning and life.
School progress towards its goals in 2015
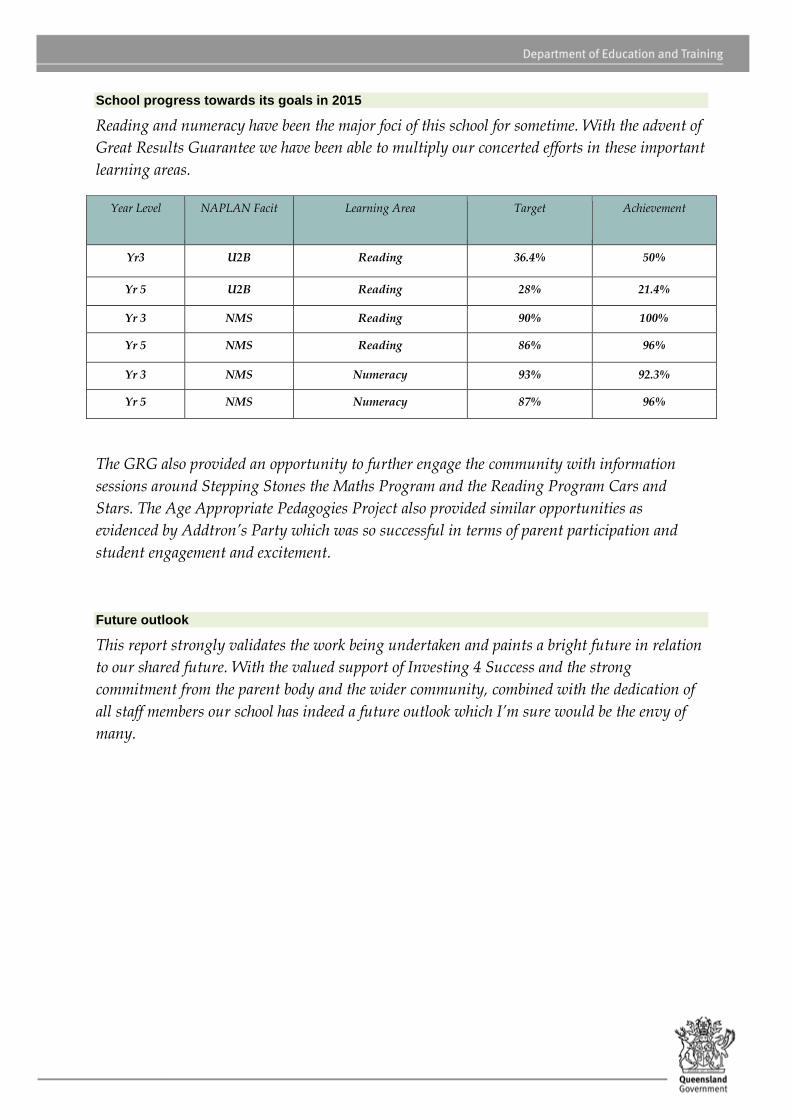
Reading and numeracy have been the major foci of this school for sometime. With the advent of
Great Results Guarantee we have been able to multiply our concerted efforts in these important
learning areas.
Year Level NAPLAN Facit Learning Area Target Achievement
Yr3 U2B Reading 36.4% 50%
Yr 5 U2B Reading 28% 21.4%
Yr 3 NMS Reading 90% 100%
Yr 5 NMS Reading 86% 96%
Yr 3 NMS Numeracy 93% 92.3%
Yr 5 NMS Numeracy 87% 96%
The GRG also provided an opportunity to further engage the community with information
sessions around Stepping Stones the Maths Program and the Reading Program Cars and
Stars. The Age Appropriate Pedagogies Project also provided similar opportunities as
evidenced by Addtron’s Party which was so successful in terms of parent participation and
student engagement and excitement.
Future outlook
This report strongly validates the work being undertaken and paints a bright future in relation
to our shared future. With the valued support of Investing 4 Success and the strong
commitment from the parent body and the wider community, combined with the dedication of
all staff members our school has indeed a future outlook which I’m sure would be the envy of
many.
Our school at a glance
School Profile
areas, a covered, lighted tennis court and an activities building. With the pride taken to ensure best presentation at all times, we possess a great facility to serve our community both presently and into a confident future. Our staff consisted of: 1 Teaching Principal 2 Classroom Teachers 2 Fractional Teachers 3 Permanent Part Time Teacher Aides 1 Part Time Aide A Permanent Part Time Administration Officer A Permanent Part Time Cleaner Additionally we were serviced by:
A Guidance Officer An SEP Teacher An Instrumental Music Teacher A Physical Education Teacher and A general Music Teacher
Our school is a coeducational one and offers classes from Prep to Yr 6. It’s located in the tropical heartland on the Cassowary Coast and set amongst cane fields, services the beach areas of Tully and Hull Heads. Established in 1932 the school is 13km from Tully and approximately 8km from the Heads areas. In 1997 the school officially opened Elouera Oval which has been developed into an excellent sporting arena. In 2000 an Early Education Centre was established which saw Preschool students attend for the first time in a new building relocated from Rocky Point SS. This presents with enormous potential as we enjoy excellent spaces and great flexibility in teaching and learning approaches. Totally air-conditioned our buildings are complemented by two playground
Our school at a glance
School Profile
Coeducational or single sex: Coeducational
Independent Public School: No
Year levels offered in 2015: Prep Year - Year 6
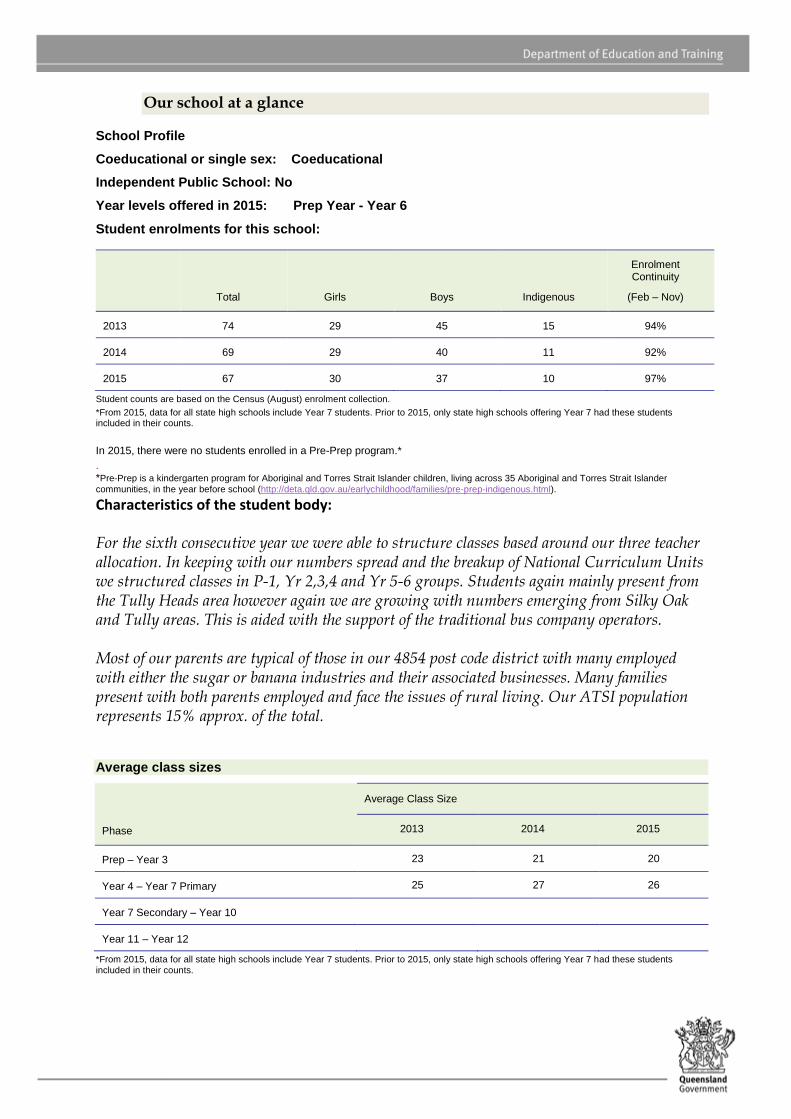
Student enrolments for this school:
Total Girls Boys Indigenous
Enrolment Continuity
(Feb – Nov)
2013 74 29 45 15 94%
2014 69 29 40 11 92%
2015 67 30 37 10 97%
Student counts are based on the Census (August) enrolment collection.
*From 2015, data for all state high schools include Year 7 students. Prior to 2015, only state high schools offering Year 7 had these students included in their counts.
In 2015, there were no students enrolled in a Pre-Prep program.*
. *Pre-Prep is a kindergarten program for Aboriginal and Torres Strait Islander children, living across 35 Aboriginal and Torres Strait Islander
communities, in the year before school (http://deta.qld.gov.au/earlychildhood/families/pre-prep-indigenous.html).
Characteristics of the student body: For the sixth consecutive year we were able to structure classes based around our three teacher allocation. In keeping with our numbers spread and the breakup of National Curriculum Units we structured classes in P-1, Yr 2,3,4 and Yr 5-6 groups. Students again mainly present from the Tully Heads area however again we are growing with numbers emerging from Silky Oak and Tully areas. This is aided with the support of the traditional bus company operators. Most of our parents are typical of those in our 4854 post code district with many employed with either the sugar or banana industries and their associated businesses. Many families present with both parents employed and face the issues of rural living. Our ATSI population represents 15% approx. of the total.
Average class sizes
Phase
Average Class Size
2013 2014 2015
Prep – Year 3 23 21 20
Year 4 – Year 7 Primary 25 27 26
Year 7 Secondary – Year 10
Year 11 – Year 12
*From 2015, data for all state high schools include Year 7 students. Prior to 2015, only state high schools offering Year 7 had these students included in their counts.
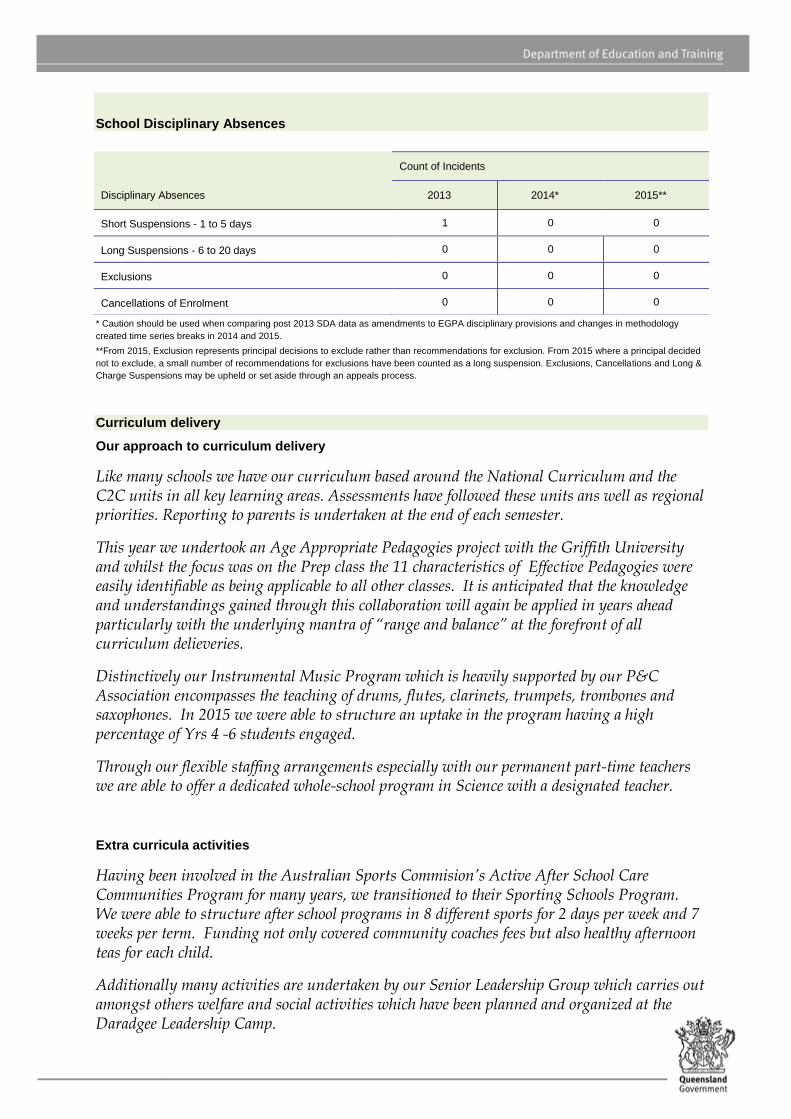
School Disciplinary Absences
* Caution should be used when comparing post 2013 SDA data as amendments to EGPA disciplinary provisions and changes in methodology
created time series breaks in 2014 and 2015.
**From 2015, Exclusion represents principal decisions to exclude rather than recommendations for exclusion. From 2015 where a principal decided
not to exclude, a small number of recommendations for exclusions have been counted as a long suspension. Exclusions, Cancellations and Long &
Charge Suspensions may be upheld or set aside through an appeals process.
Curriculum delivery
Our approach to curriculum delivery
Like many schools we have our curriculum based around the National Curriculum and the C2C units in all key learning areas. Assessments have followed these units ans well as regional priorities. Reporting to parents is undertaken at the end of each semester.
This year we undertook an Age Appropriate Pedagogies project with the Griffith University and whilst the focus was on the Prep class the 11 characteristics of Effective Pedagogies were easily identifiable as being applicable to all other classes. It is anticipated that the knowledge and understandings gained through this collaboration will again be applied in years ahead particularly with the underlying mantra of “range and balance” at the forefront of all curriculum delieveries.
Distinctively our Instrumental Music Program which is heavily supported by our P&C Association encompasses the teaching of drums, flutes, clarinets, trumpets, trombones and saxophones. In 2015 we were able to structure an uptake in the program having a high percentage of Yrs 4 -6 students engaged.
Through our flexible staffing arrangements especially with our permanent part-time teachers we are able to offer a dedicated whole-school program in Science with a designated teacher.
Extra curricula activities
Having been involved in the Australian Sports Commision’s Active After School Care Communities Program for many years, we transitioned to their Sporting Schools Program. We were able to structure after school programs in 8 different sports for 2 days per week and 7 weeks per term. Funding not only covered community coaches fees but also healthy afternoon teas for each child.
Additionally many activities are undertaken by our Senior Leadership Group which carries out amongst others welfare and social activities which have been planned and organized at the Daradgee Leadership Camp.
Disciplinary Absences
Count of Incidents
2013 2014* 2015**
Short Suspensions - 1 to 5 days 1 0 0
Long Suspensions - 6 to 20 days 0 0 0
Exclusions 0 0 0
Cancellations of Enrolment 0 0 0
How Information and Communication Technologies are used to improve learning
Computers and other digital devices are used in a variety of ways. Initially students employ
computers to re-enforce and practice various literacy and numeracy skills and understandings.
Programs are used to present aspects of student learning activities as well as formal lessons to
ensure appropriate use of technology including the use of the internet.
In 2015 we substantially undertook a refurbishment of all interactive whiteboards and now
have this technology in each classroom as well as the library. Additionally through the GRG
funds we were able to purchase a number of iPads which had particular utility with the
younger students.
Social Climate
Over many years a single most commonly offered compliment by visitors to our school is its
ambience. It’s our way of life, deliberately adopted to surround our teaching and learning as a
natural extension of the wonderful environs. This is further validated by the steady increase in
student enrolements over the last number of years where many parents indicated as part of
their reasoning for changing schools was this school’s treatment of behavior and discipline.
The satisfaction survey results are strong in core areas of fair treatment, safety at school,
behaviour, discipline and happiness to attend this school.
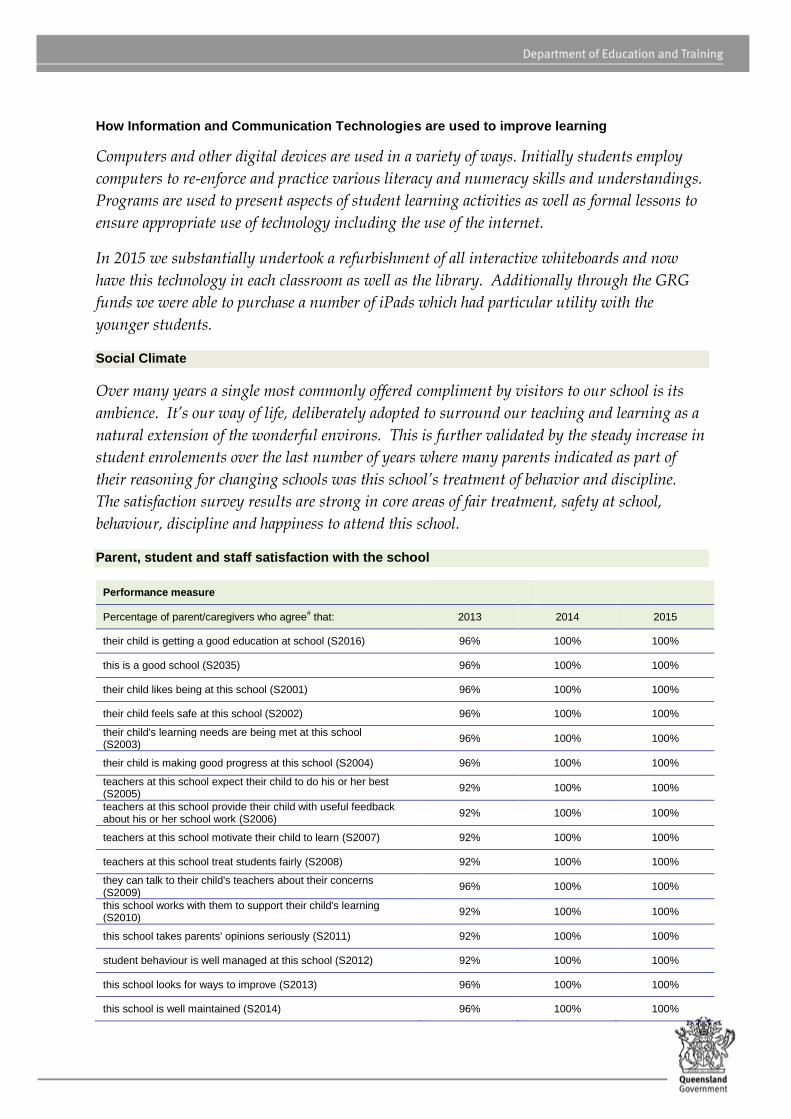
Parent, student and staff satisfaction with the school
Performance measure
Percentage of parent/caregivers who agree# that: 2013 2014 2015
their child is getting a good education at school (S2016) 96% 100% 100%
this is a good school (S2035) 96% 100% 100%
their child likes being at this school (S2001) 96% 100% 100%
their child feels safe at this school (S2002) 96% 100% 100%
their child's learning needs are being met at this school (S2003)
96% 100% 100%
their child is making good progress at this school (S2004) 96% 100% 100%
teachers at this school expect their child to do his or her best (S2005)
92% 100% 100%
teachers at this school provide their child with useful feedback about his or her school work (S2006)
92% 100% 100%
teachers at this school motivate their child to learn (S2007) 92% 100% 100%
teachers at this school treat students fairly (S2008) 92% 100% 100%
they can talk to their child's teachers about their concerns (S2009)
96% 100% 100%
this school works with them to support their child's learning (S2010)
92% 100% 100%
this school takes parents' opinions seriously (S2011) 92% 100% 100%
student behaviour is well managed at this school (S2012) 92% 100% 100%
this school looks for ways to improve (S2013) 96% 100% 100%
this school is well maintained (S2014) 96% 100% 100%
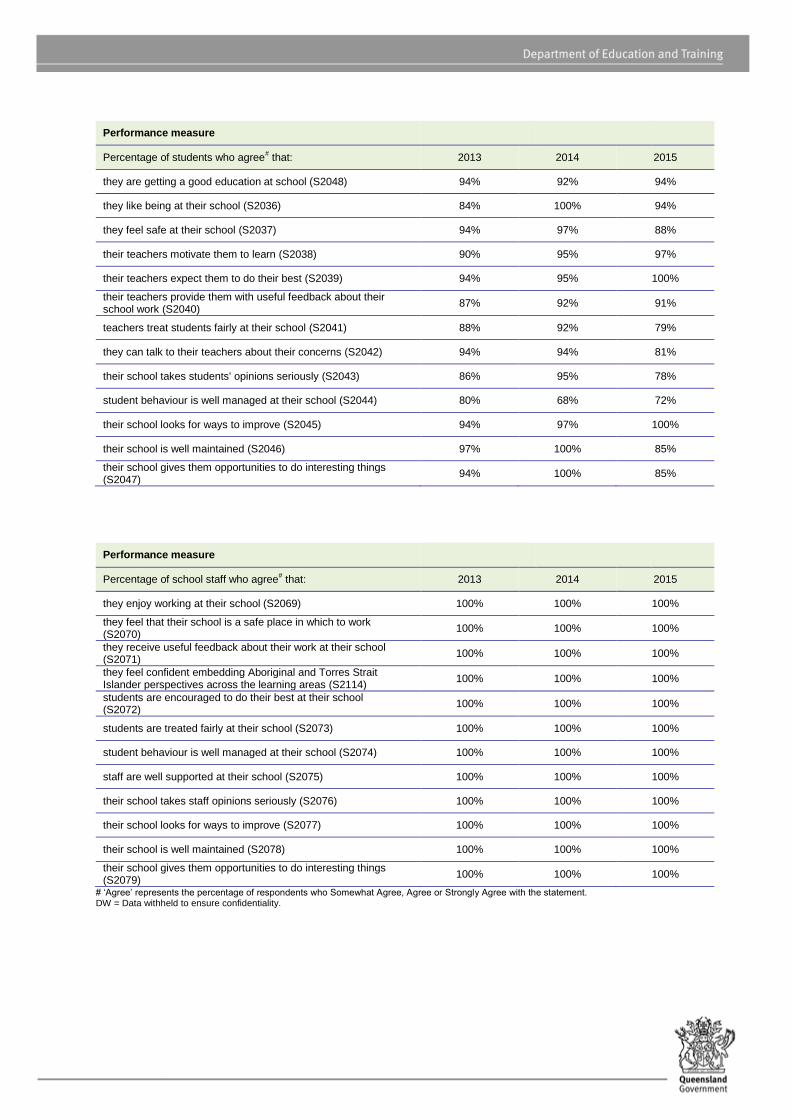
Performance measure
Percentage of students who agree# that: 2013 2014 2015
they are getting a good education at school (S2048) 94% 92% 94%
they like being at their school (S2036) 84% 100% 94%
they feel safe at their school (S2037) 94% 97% 88%
their teachers motivate them to learn (S2038) 90% 95% 97%
their teachers expect them to do their best (S2039) 94% 95% 100%
their teachers provide them with useful feedback about their school work (S2040)
87% 92% 91%
teachers treat students fairly at their school (S2041) 88% 92% 79%
they can talk to their teachers about their concerns (S2042) 94% 94% 81%
their school takes students' opinions seriously (S2043) 86% 95% 78%
student behaviour is well managed at their school (S2044) 80% 68% 72%
their school looks for ways to improve (S2045) 94% 97% 100%
their school is well maintained (S2046) 97% 100% 85%
their school gives them opportunities to do interesting things (S2047)
94% 100% 85%
Performance measure
Percentage of school staff who agree# that: 2013 2014 2015
they enjoy working at their school (S2069) 100% 100% 100%
they feel that their school is a safe place in which to work (S2070)
100% 100% 100%
they receive useful feedback about their work at their school (S2071)
100% 100% 100%
they feel confident embedding Aboriginal and Torres Strait Islander perspectives across the learning areas (S2114)
100% 100% 100%
students are encouraged to do their best at their school (S2072)
100% 100% 100%
students are treated fairly at their school (S2073) 100% 100% 100%
student behaviour is well managed at their school (S2074) 100% 100% 100%
staff are well supported at their school (S2075) 100% 100% 100%
their school takes staff opinions seriously (S2076) 100% 100% 100%
their school looks for ways to improve (S2077) 100% 100% 100%
their school is well maintained (S2078) 100% 100% 100%
their school gives them opportunities to do interesting things (S2079)
100% 100% 100%
# ‘Agree’ represents the percentage of respondents who Somewhat Agree, Agree or Strongly Agree with the statement. DW = Data withheld to ensure confidentiality.
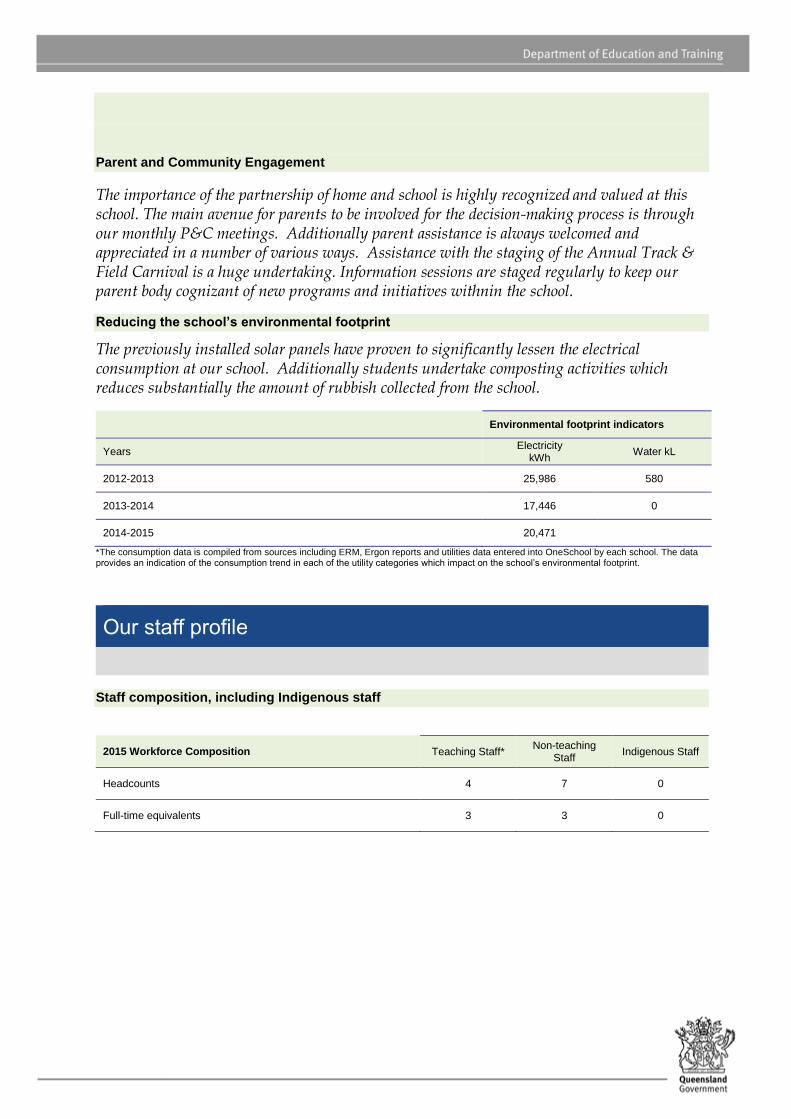
Parent and Community Engagement
The importance of the partnership of home and school is highly recognized and valued at this school. The main avenue for parents to be involved for the decision-making process is through our monthly P&C meetings. Additionally parent assistance is always welcomed and appreciated in a number of various ways. Assistance with the staging of the Annual Track & Field Carnival is a huge undertaking. Information sessions are staged regularly to keep our parent body cognizant of new programs and initiatives withnin the school.
Reducing the school’s environmental footprint
The previously installed solar panels have proven to significantly lessen the electrical consumption at our school. Additionally students undertake composting activities which reduces substantially the amount of rubbish collected from the school.
Environmental footprint indicators
Years Electricity
kWh Water kL
2012-2013 25,986 580
2013-2014 17,446 0
2014-2015 20,471
*The consumption data is compiled from sources including ERM, Ergon reports and utilities data entered into OneSchool by each school. The data provides an indication of the consumption trend in each of the utility categories which impact on the school’s environmental footprint.
Our staff profile
Staff composition, including Indigenous staff
2015 Workforce Composition Teaching Staff* Non-teaching
Staff Indigenous Staff
Headcounts 4 7 0
Full-time equivalents 3 3 0
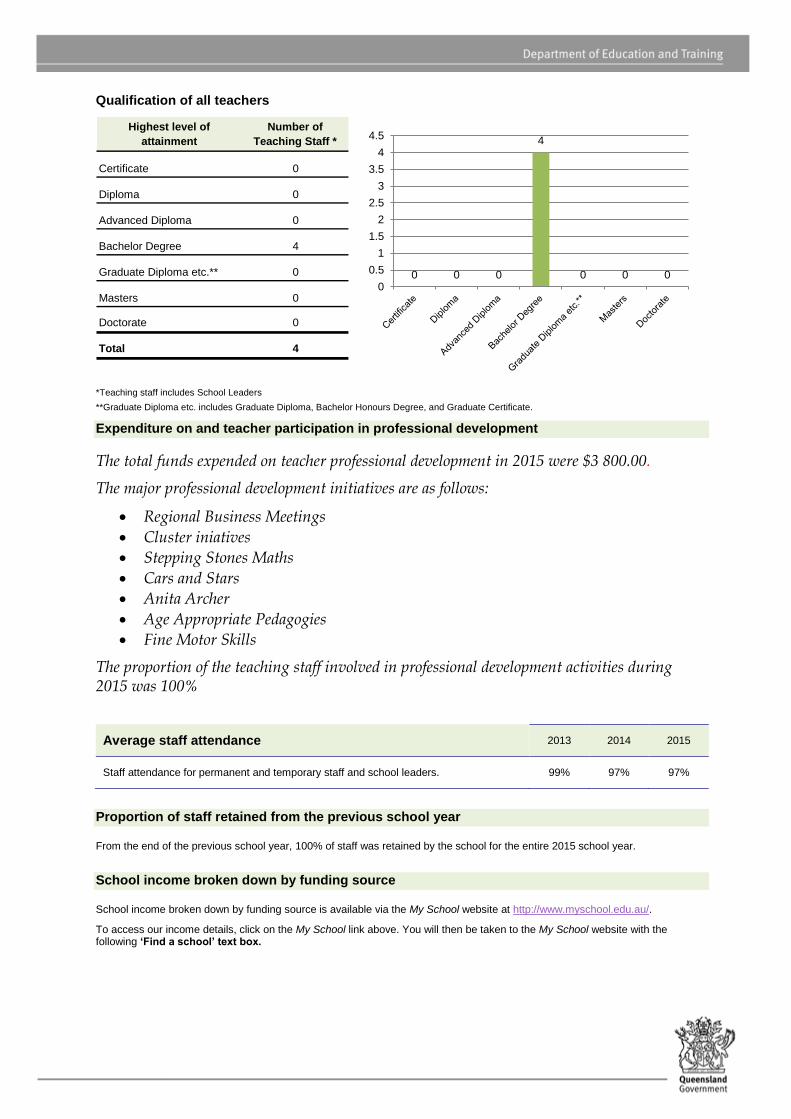
Qualification of all teachers
Highest level of
attainment
Number of
Teaching Staff *
Certificate 0
Diploma 0
Advanced Diploma 0
Bachelor Degree 4
Graduate Diploma etc.** 0
Masters 0
Doctorate 0
Total 4
0 0 0
4
0 0 00
0.5
1
1.5
2
2.5
3
3.5
4
4.5
*Teaching staff includes School Leaders
**Graduate Diploma etc. includes Graduate Diploma, Bachelor Honours Degree, and Graduate Certificate.
Expenditure on and teacher participation in professional development
The total funds expended on teacher professional development in 2015 were $3 800.00.
The major professional development initiatives are as follows:
Regional Business Meetings
Cluster iniatives
Stepping Stones Maths
Cars and Stars
Anita Archer
Age Appropriate Pedagogies
Fine Motor Skills
The proportion of the teaching staff involved in professional development activities during 2015 was 100%
Average staff attendance 2013 2014 2015
Staff attendance for permanent and temporary staff and school leaders. 99% 97% 97%
Proportion of staff retained from the previous school year
From the end of the previous school year, 100% of staff was retained by the school for the entire 2015 school year.
School income broken down by funding source
School income broken down by funding source is available via the My School website at http://www.myschool.edu.au/.
To access our income details, click on the My School link above. You will then be taken to the My School website with the following ‘Find a school’ text box.
Where it says ‘School name’, type in the name of the school you wish to view, select the school from the drop-down list and select <GO>. Read and follow the instructions on the next screen; you will be asked to confirm that you are not a robot then by clicking continue, you acknowledge that you have read, accepted and agree to the Terms of Use and Privacy Policy before being given access to the school’s profile webpage.
School financial information is available by selecting ‘School finances’ in the menu box in the top left corner of the school’s profile webpage. If you are unable to access the internet, please contact the school for a paper copy of income by funding source.
Performance of our students
Key student outcomes
Student attendance 2013 2014 2015
The overall attendance rate for the students at this school (shown as a percentage). 96% 90% 95%
The attendance rate for Indigenous students at this school (shown as a percentage). 93% 88% 95%
The student attendance rate is generated by dividing the total of full-days and part-days that students attended, and comparing this to the total of all possible days for students to attend, expressed as a percentage.
The overall attendance rate in 2015 for all Queensland Primary schools was 93%.
Student attendance rate for each year level (shown as a percentage)
Prep Year
1 Year
2 Year
3 Year
4 Year
5 Year
6 Year
7 Year
8 Year
9 Year 10
Year 11
Year 12
2013 95% 97% 97% 97% 97% 96% 97% 95%
2014 88% 88% 88% 90% 89% 89% 92% 94%
2015 91% 95% 96% 95% 98% 94% 94%
*From 2013, the methodology used for calculating attendance rates effectively counts attendance for every student for every day of attendance in Semester 1. The student attendance rate is generated by dividing the total of full-days and part-days that students attended, and comparing this to the total of all possible days for students to attend, expressed as a percentage.
DW = Data withheld to ensure confidentiality.
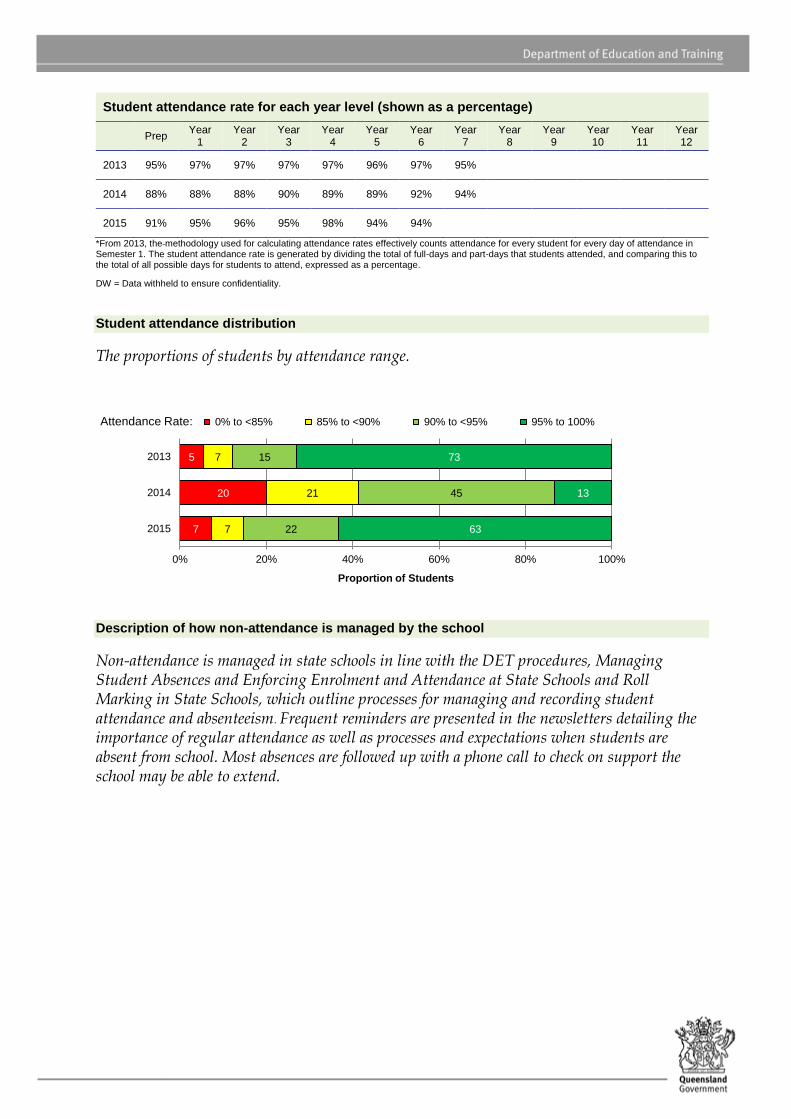
Student attendance distribution
The proportions of students by attendance range.
Description of how non-attendance is managed by the school
Non-attendance is managed in state schools in line with the DET procedures, Managing Student Absences and Enforcing Enrolment and Attendance at State Schools and Roll Marking in State Schools, which outline processes for managing and recording student attendance and absenteeism. Frequent reminders are presented in the newsletters detailing the importance of regular attendance as well as processes and expectations when students are absent from school. Most absences are followed up with a phone call to check on support the school may be able to extend.
7
20
5
7
21
7
22
45
15
63
13
73
0% 20% 40% 60% 80% 100%
2015
2014
2013
Proportion of Students
Attendance Rate: 0% to <85% 85% to <90% 90% to <95% 95% to 100%
National Assessment Program – Literacy and Numeracy (NAPLAN) results – our reading,
writing, spelling, grammar and punctuation, and numeracy results for the Years 3, 5, 7, and 9.
Our reading, writing, spelling, grammar and punctuation, and numeracy results for the Years
3, 5, 7 and 9 are available via the My School website at http://www.myschool.edu.au/.
To access our NAPLAN results, click on the My School link above. You will then be taken to
the My School website with the following ‘Find a school’ text box.
Where it says ‘School name’, type in the name of the school you wish to view, select the school from the drop-down list and select <GO>. Read and follow the instructions on the next screen; you will be asked to confirm that you are not a robot then by clicking continue, you acknowledge that you have read, accepted and agree to the Terms of Use and Privacy Policy before being given access to the school’s profile webpage.
School NAPLAN information is available by selecting ‘NAPLAN’ in the menu box in the top left corner of the school’s profile webpage. If you are unable to access the internet, please contact the school for a paper copy of our school’s NAPLAN results.
.