lower snake river compensation plan: … chs an… · fish research project oregon ... were...
TRANSCRIPT
LOWER SNAKE RIVER COMPENSATION PLAN: Oregon Spring Chinook Salmon Evaluation Studies
2003 Annual Progress Report
Oregon Department of Fish and Wildlife Fish Research and Development, NE Region
Fred R. Monzyk Gary R. Vonderohe
Timothy L. Hoffnagle Richard W. Carmichael
Debra L. Eddy Patrick J. Keniry
December 2006

This program receives federal financial assistance from the U.S. Fish and Wildlife Service and prohibits discrimination on the basis of race, color, national origin, age, sex, or disability. If you believe that you have been discriminated against as described above in any program, activity, or facility, or if you desire further information, please contact ADA coordinator, Oregon Department of Fish and Wildlife, 3406 Cherry Dr. NE, Salem, OR 97303, 503-947-6000, or write Office for Human Resources, U.S. Fish and Wildlife Service, Department of the Interior, Washington, D.C. 20240. This report is available at: http://lsnakecomplan.fws.gov/

ANNUAL PROGRESS REPORT
FISH RESEARCH PROJECT
OREGON
PROJECT TITLE: Lower Snake River Compensation Plan: Oregon Spring Chinook
Salmon Evaluation Studies
CONTRACT NUMBER: 14-11-03-J050
PROJECT PERIOD: January 1, 2003 through December 31, 2003 Prepared By: Fred R. Monzyk Gary R. Vonderohe Timothy L. Hoffnagle Richard W. Carmichael Debra L. Eddy Patrick J. Keniry
December 2006
Oregon Department of Fish and Wildlife 3406 Cherry Avenue NE
Salem, OR 97303
This project was financed by the U.S. Fish and Wildlife Service under the Lower Snake River Compensation Plan.

i
Preface
This progress report provides summary information for Lower Snake River Compensation Plan (LSRCP) spring Chinook salmon programs operated by Oregon Department of Fish and Wildlife (ODFW) in the Imnaha and Grande Ronde river basins during 2003. These ongoing monitoring and evaluation programs provide technical, logistical and biological information to managers charged with maintaining viable Chinook salmon populations and associated fisheries in northeast Oregon. The data in this report serve as the basis for assessing the success of meeting our management objectives and were derived from hatchery inventories and standard databases (e.g., PSMFC, coded-wire tag) or through standard sampling techniques. As such, specific protocols are usually not described. When possible, data obtained from different sources were cross-referenced and verified. In cases where expansions of data or unique methodologies were used, protocols are described in more detail. Additional descriptions of protocols can be found in the 2003 work statement (Carmichael et al. 2003). We used coded-wire tag (CWT) data collected from 2003 adult returns to evaluate smolt-to-adult survival rates in production and experimental rearing release groups. In 2003, salmon returned from the experimental size at release treatments for Imnaha River stock. Analysis of data for specific survival studies will be completed once all cohorts have returned and CWT data are complete for a given experiment. In addition, much of the data that we discuss in this report will be used in separate and specific evaluations of ongoing supplementation and research programs for Chinook salmon in the Imnaha and Grande Ronde river basins. We began fish culture evaluations in 1983 and have dramatically improved many practices. Progress for work completed in previous years is presented in annual progress reports (Carmichael and Wagner 1983; Carmichael and Messmer 1985; Carmichael et al. 1986a 1987, 1988, 1999 and 2004; Hoffnagle et al. 2005; Messmer et al. 1989, 1990, 1991, 1992 and 1993; Monzyk et al. 2006a, 2006b, 2006c, 2006d) and United States v. Oregon production report (Carmichael et al. 1986b).
Within each section of this report, data are organized into salmon culture monitoring for juveniles, adults, CWT recoveries, compensation goals, and estimates for total escapement. During the period covered in this report, Chinook salmon smolts from the 2001 cohort were released, Chinook salmon from the 1998-2000 cohorts returned to spawn, and adult Chinook salmon that returned to spawn were used to create the 2003 cohort.
Acknowledgments Mike Gribble, Bob Lund and many other hatchery personnel exhibited great dedication and provided essential assistance. Numerous personnel from the U.S. Fish and Wildlife Service, U.S. Forest Service, the Nez Perce Tribe, and the Confederated Tribes of the Umatilla Indian Reservation were enthusiastically supportive during spawning ground surveys and spawning at Lookingglass Fish Hatchery. In addition, personnel from the Nez Perce Tribe and the Confederated Tribes of the Umatilla Indian Reservation provided much of the weir data summarized in this report. This project was funded by the U.S. Fish and Wildlife Service under the Lower Snake River Compensation Plan, contract number 14-11-03-J050, a cooperative agreement with the Oregon Department of Fish and Wildlife.

ii
CONTENTS
Page Preface ............................................................................................................................. i Acknowledgements ......................................................................................................... i Contents ........................................................................................................................... ii List of Figures.................................................................................................................. ii List of Tables ................................................................................................................... ii Executive Summary......................................................................................................... iv Introduction ..................................................................................................................... 1 Program Objectives ............................................................................................. 1 Research Objectives ............................................................................................ 1 Results and Discussion .................................................................................................... 2 Juveniles .............................................................................................................. 2 Adults ................................................................................................................. 4 Coded-Wire Tag Recoveries ............................................................................... 5 Compensation Goals............................................................................................ 7 Natural Escapement Monitoring.......................................................................... 8 References ....................................................................................................................... 34 LIST OF FIGURES Number Page
1. Length frequency-at-age relationship for Imnaha River Chinook salmon adults used as hatchery broodstock in 2003 and from 1991-2002 ...................
9
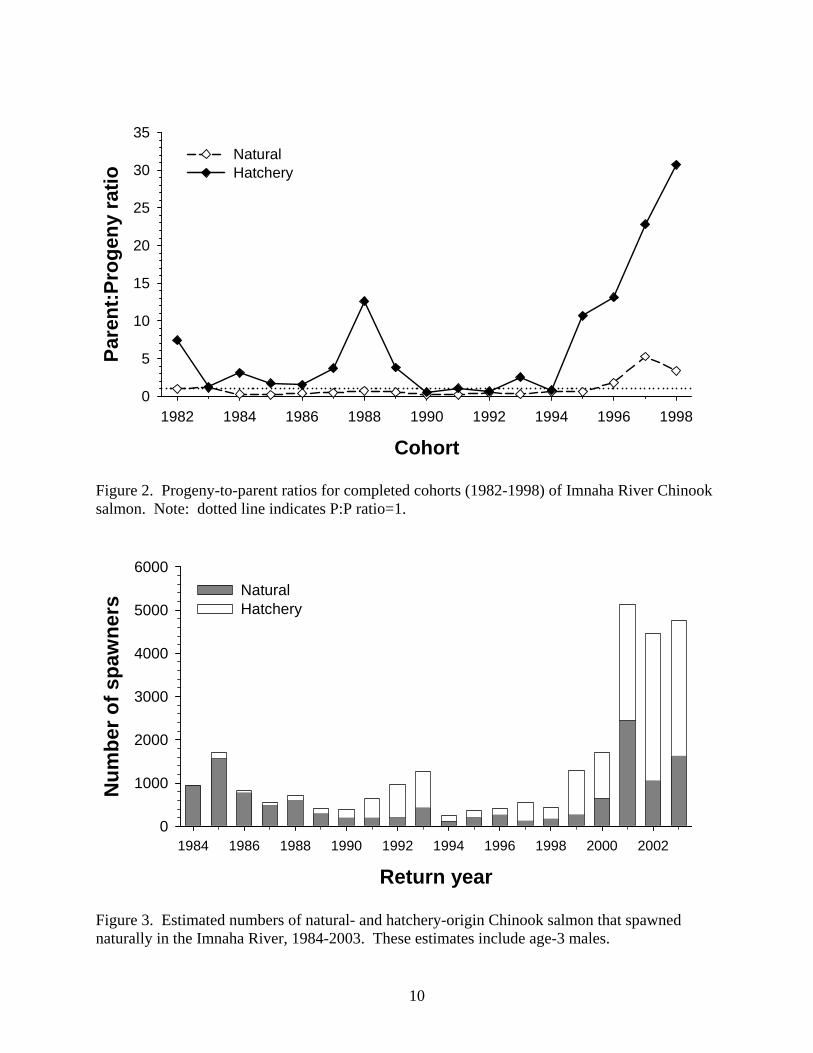
2. Progeny-to parent ratios for completed cohorts (1982-1998) of Imnaha River Chinook salmon ...................................................................................... 10
3. Estimated numbers of natural- and hatchery-origin Chinook salmon that spawned naturally in the Imnaha River, 1984-2003......................................... 10
LIST OF TABLES
Number Page 1. Rearing summaries for the 2001 cohort of juvenile spring Chinook salmon
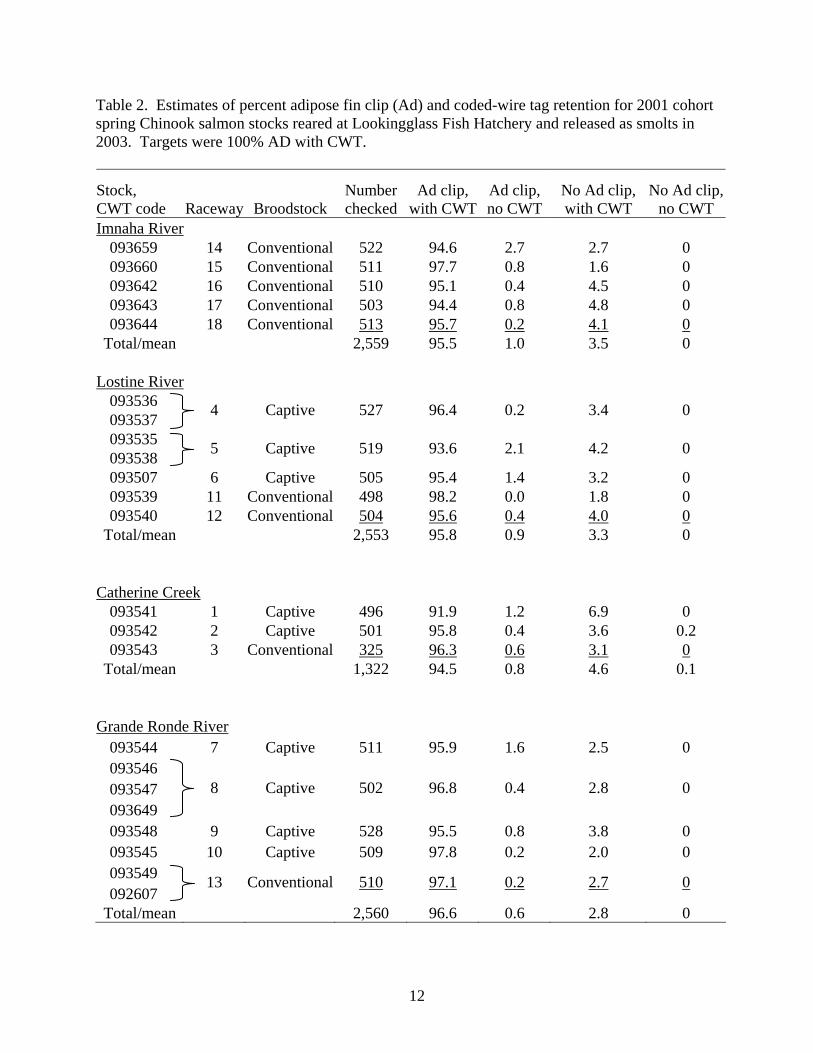
smolts released into the Imnaha and Grande Ronde river basins in 2003........ 11 2. Estimates of percent adipose fin clip (Ad) and coded-wire tag retention for
2001 cohort spring Chinook salmon stocks reared at Lookingglass Fish Hatchery and released as smolts in 2003.......................................................... 12
3. Mean size of 2001 cohort spring Chinook salmon smolts, total number released into the Imnaha River and Grande Ronde river basins, number PIT-tagged and percent detected at Snake and Columbia river dams, 2003 .... 13
4. Recoveries of adult spring Chinook salmon at northeast Oregon LSRCP facilities and Lower Granite Dam, 2003 .......................................................... 15
5. Number and disposition of adult spring Chinook salmon that returned to northeast Oregon LSRCP facilities in 2003 by origin, age, and sex ................ 16
iii
6. Timing of spawning and spawning summaries for spring Chinook salmon
at Lookingglass Fish Hatchery, 2003 ............................................................... 19 7. Expanded adult recoveries by coded-wire tag group of Imnaha River spring
Chinook salmon for the 2003 return year......................................................... 20 8. Catch and escapement distribution of Imnaha River hatchery adult spring
Chinook salmon by recovery location in 2003................................................. 22 9. Expanded adult recoveries by coded-wire tag group for the 2003 return
year of Rapid River and Catherine Creek spring Chinook salmon released into Lookingglass Creek................................................................................... 23
10. Catch and escapement distribution of Grande Ronde Basin hatchery adult spring Chinook salmon by stock and recovery location in 2003...................... 24
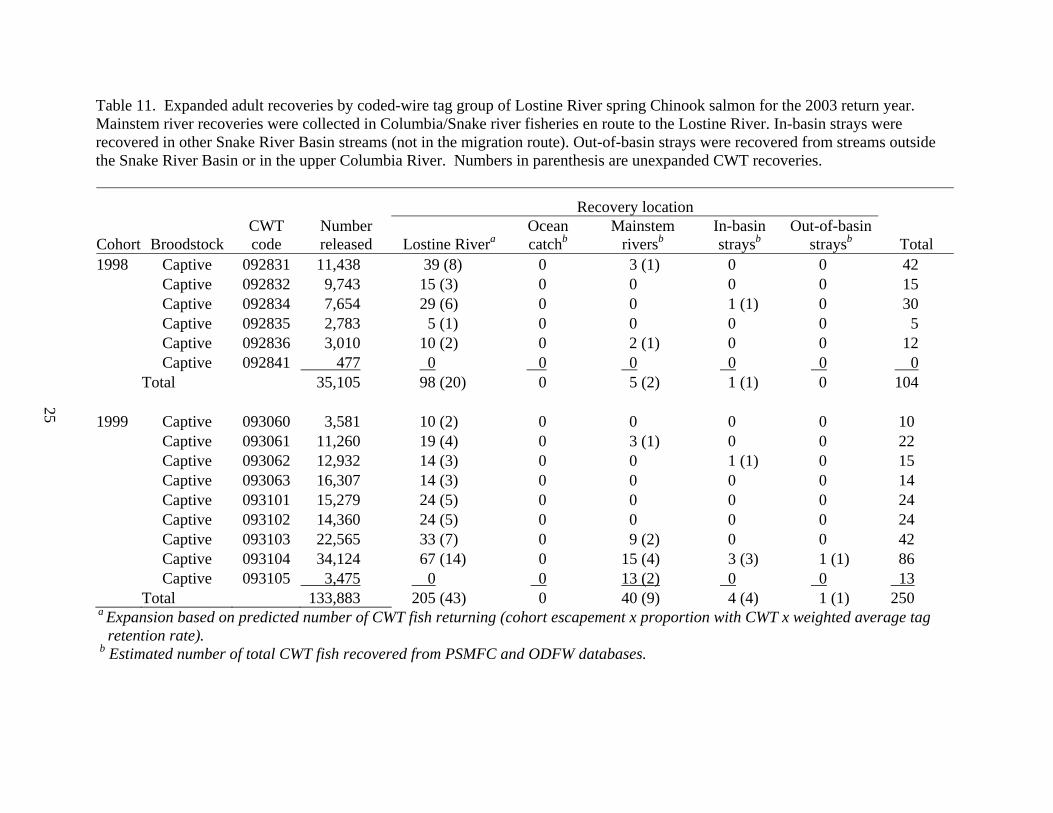
11. Expanded adult recoveries by coded-wire tag group of Lostine River spring Chinook salmon for the 2003 return year......................................................... 25
12. Expanded adult recoveries by coded-wire tag group of Catherine Creek spring Chinook salmon for the 2003 return year.............................................. 27
13. Expanded adult recoveries by coded-wire tag group of Grande Ronde River spring Chinook salmon for the 2003 return year .................................... 29
14. Summary of marked and unmarked spring Chinook salmon carcass recoveries and number of redds discovered by stream during spawning ground surveys, 2003........................................................................................ 30
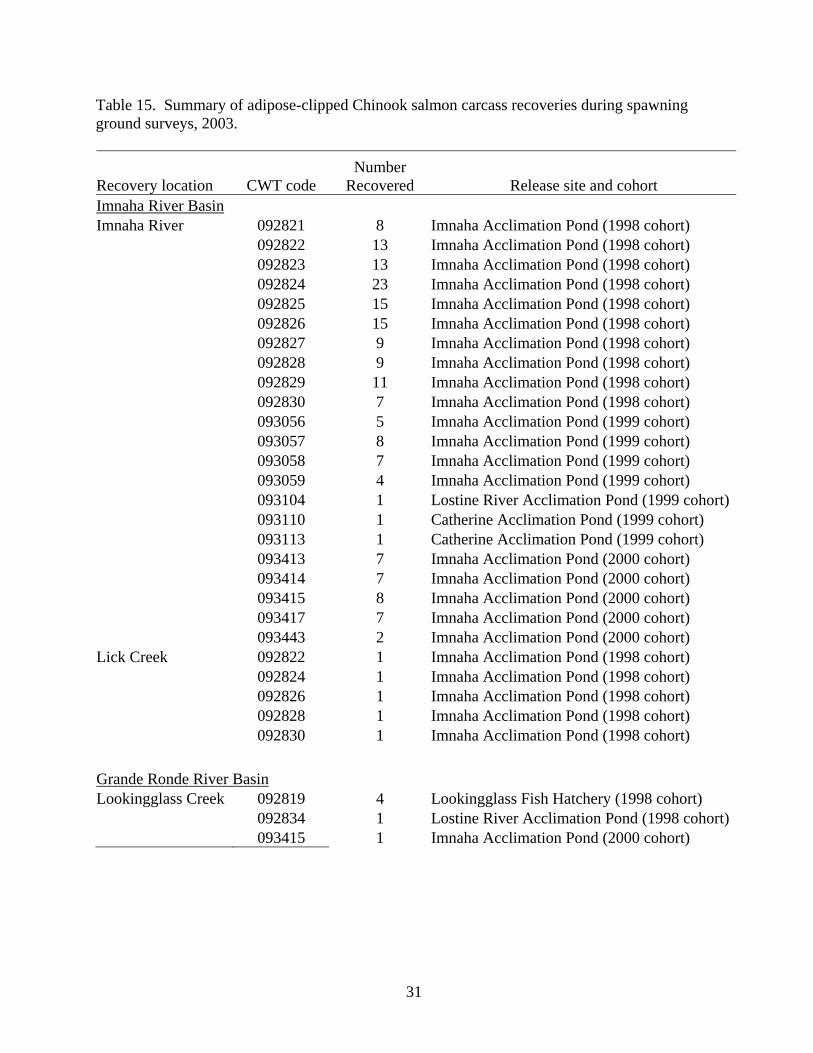
15. Summary of adipose-clipped Chinook salmon carcass recoveries during spawning ground surveys, 2003 ....................................................................... 31
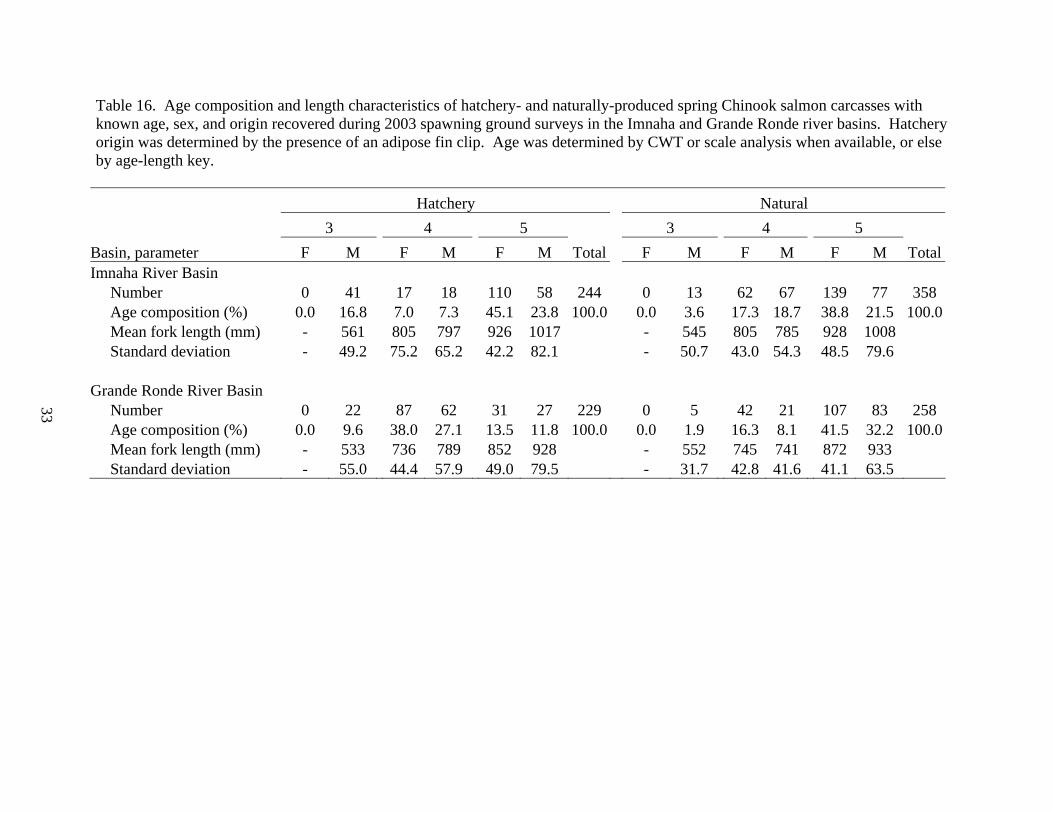
16. Age composition and length characteristics of hatchery- and naturally-produced spring Chinook salmon carcasses with known age, sex, and origin recovered during 2003 spawning ground surveys in the Imnaha and Grande Ronde river basins ............................................................................... 33

iv
EXECUTIVE SUMMARY
In 2003, we released 268,426 Chinook salmon smolts into the Imnaha River from the 2001 cohort produced from conventional broodstock. We estimated that 96.5% of these smolts were recognizably marked with adipose fin clips (ad clip). In addition, smolts produced from the Grande Ronde Basin Spring Chinook Salmon Captive Broodstock Program and Conventional Broodstock program were released into the Grande Ronde Basin. We released 141,867 Captive Broodstock smolts and 100,882 Conventional Broodstock smolts from the 2001 cohort into the Lostine River with an estimated 96.7% recognizably marked with ad clips. We released 105,292 Captive Broodstock smolts and 24,392 Conventional Broodstock smolts from the 2001 cohort into Catherine Creek with an estimated 95.3% recognizably marked with ad clips. We released 210,113 Captive Broodstock smolts and 26,923 Conventional Broodstock smolts into the upper Grande Ronde River and estimated 97.2% of these smolts had recognizable ad clip marks.
We trapped 899 hatchery- and 406 naturally-produced Chinook salmon at the Imnaha River weir. We trapped 45 hatchery-produced Chinook salmon at the Lookingglass Creek weir along with 32 naturally-produced Chinook salmon. We captured 225 hatchery- and 238 naturally-produced Chinook salmon on the Lostine River, 305 hatchery- and 254 naturally-produced Chinook salmon on Catherine Creek, and 41 hatchery- and 121 naturally-produced Chinook salmon on the upper Grande Ronde River. We estimated that 3,856 Imnaha River hatchery Chinook salmon returned to the Lower Snake River Compensation Plan compensation area in 2003, achieving 120% of the adult compensation goal in the Imnaha River Basin. In the Grande Ronde River Basin, we estimated 465 Lostine River, 334 Catherine Creek, and 77 Grande Ronde River hatchery adults returned to the basin. In addition, 31 Rapid River stock and six Catherine Creek stock hatchery spring Chinook salmon that were originally released into Lookingglass Creek returned to the compensation area. Combined, these returns achieved 15.1% of the compensation goal for the Grande Ronde Basin. In 2003, we observed 838 carcasses and found 754 redds during spawning ground surveys in the Imnaha River Basin. One carcass recovered in the Imnaha River was a hatchery stray from the Lostine River and two were hatchery strays from Catherine Creek. In the Grande Ronde Basin, we observed 548 carcasses and found 794 redds. There were four known hatchery strays recovered in 2003 within the Grande Ronde Basin. We recovered two marked hatchery strays that came from the Lostine River: one stray recovered in the Minam River and one in Lookingglass Creek. We recovered one hatchery stray that came from Catherine Creek in the Lostine River. In addition, one stray that came from the Imnaha River was recovered in Lookingglass Creek.
1
INTRODUCTION This report summarizes spring Chinook salmon monitoring data for the Lower Snake River Compensation Plan (LSRCP) facilities in 2003. The main objectives of this report are to document and evaluate salmon culture performance for spring Chinook salmon hatchery programs and achievement of management objectives in the Imnaha and Grande Ronde river basins. These data are used to design culture practices to optimize egg-to-smolt survival rate, smolt quality, and smolt-to-adult survival rate, as well as to provide information to adapt the programs to most effectively meet management objectives. This report provides information on rearing and release operations for the 2001 cohort of juvenile Chinook salmon smolts, the collection, spawning, and adult characteristics for the 2003 return of adult Chinook salmon, and the collection of eggs for the 2003 cohort.
LSRCP Chinook Salmon Program Objectives 1. Prevent extinction of Imnaha River, Lostine River, Catherine Creek, and upper Grande
Ronde River Chinook salmon populations and ensure a high probability of population persistence well into the future, once causes of basin-wide declines have been addressed.
2. Establish adequate broodstock to meet annual production goals. 3. Establish a consistent total return of Chinook salmon that meets the LSRCP mitigation
goal of 3,210 hatchery adults in the Imnaha Basin and 5,820 hatchery adults in the Grande Ronde Basin.
4. Re-establish historic tribal and recreational fisheries. 5. Minimize impacts of hatchery programs on resident stocks of game fish. 6. Operate the hatchery program so that the genetic and life history characteristics of
hatchery fish mimic those of wild fish, while achieving mitigation goals. 7. Maintain genetic and life-history characteristics of natural Chinook salmon populations in
the Imnaha River, Lostine River, Catherine Creek, and upper Grande Ronde River. 8. Maintain the genetic and life-history characteristics of the endemic wild populations of
Chinook salmon in the Minam and Wenaha rivers. 9. Provide a future basis to reverse the decline in abundance of endemic Chinook salmon
populations in the Imnaha and Grande Ronde river basins.
Research Monitoring and Evaluation Objectives 1. Document Chinook salmon rearing and release activities at all LSRCP facilities. 2. Determine optimum rearing and release strategies that will produce maximum survival to
adulthood for hatchery-produced Chinook salmon smolts. 3. Document Chinook salmon adult returns by stock to each LSRCP broodstock collection
facility. 4. Estimate annual hatchery returns to compensation areas and determine success in meeting
mitigation goals. 5. Estimate annual smolt survival to Lower Granite Dam for production and experimental
groups.

2
6. Conduct index, extensive, and supplemental Chinook salmon spawning ground surveys for all populations in northeast Oregon to assess spawn timing and spawning distribution, and estimate natural spawner escapement.
7. Determine the proportion of naturally spawning spring Chinook salmon that are of hatchery origin in all Imnaha and Grande Ronde Chinook salmon populations.
8. Determine annual escapement and spawner numbers to estimate and compare productivity (recruits per spawner) for natural- and hatchery-produced fish in the Imnaha and Grande Ronde basin Chinook salmon populations.
9. Compare life history characteristics (age structure, run timing, sex ratio, egg size, and fecundity) of hatchery and natural origin salmon.
10. Coordinate Chinook salmon broodstock marking programs for Lookingglass Fish Hatchery.
11. Participate in planning activities associated with anadromous salmon production and management in the Imnaha and Grande Ronde river basins and participate in ESA permitting, consultation, and recovery planning.
RESULTS AND DISCUSSION During 2003, spring Chinook salmon from the 2001 cohort produced from Conventional
Broodstock were released as smolts into the Imnaha River. In the Grande Ronde River Basin, smolts from the 2001 cohort produced from the Grande Ronde Basin Spring Chinook Salmon Captive Broodstock Program were released into the Lostine River, Catherine Creek, and the Grande Ronde River. Also released into the Lostine River, Catherine Creek, and the Grande Ronde River were smolts from the 2001 cohort produced from the Conventional Broodstock Program. Adult Chinook salmon from the 1998-2000 cohorts returned to spawn and were used as broodstock to create the 2003 cohort to be reared at Lookingglass Fish Hatchery (LFH). In 2003, the only experimental group from which salmon returned were size at release treatments from the Imnaha River stock. Analysis of data for specific survival studies will be completed once all cohorts have returned and coded-wire tag (CWT) data are complete for a given experiment and will be presented in separate and specific reports for these experiments. In addition, much of the data discussed in this report will be used in separate and specific evaluations of ongoing supplementation programs for Chinook salmon in the Imnaha and Grande Ronde river basins.
Juveniles
Eyed egg-to-smolt survival rate for the 2001 cohort of Imnaha River Chinook salmon released in 2003 was 58.0% (green egg-to-eyed egg survival rate, 61.0%; eyed egg-to-smolt survival rate, 95.0%). For the Lostine River, green egg-to-smolt survival rates were 67.9% for Captive Broodstock offspring and 72.2% for Conventional Broodstock offspring. Green egg-to-smolt survival rates for Catherine Creek salmon were 54.0% for Captive Broodstock offspring and 58.3% for Conventional Broodstock offspring. For the Grande Ronde River, green egg-to-smolt survival rates were 54.5% for Captive Broodstock offspring and 91.0% for Conventional Broodstock offspring (Table 1).

3
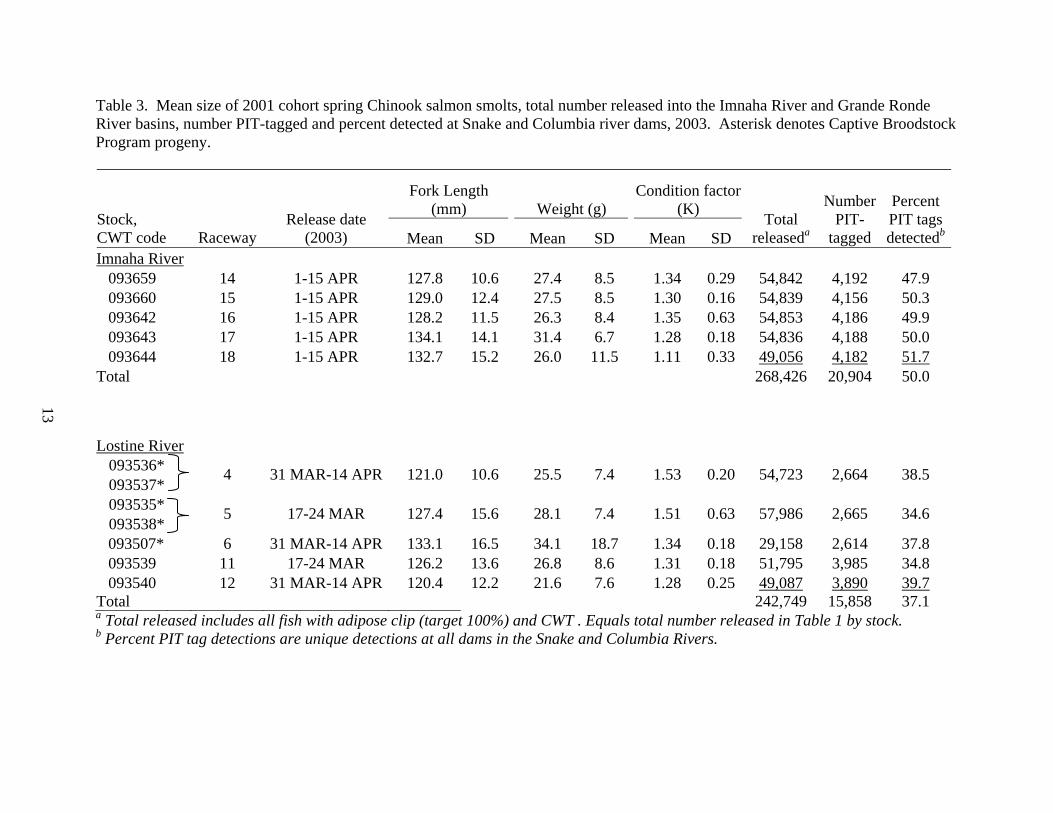
The release of 268,426 smolts from the 2001 Imnaha River cohort (Table 1) was below the long-term mitigation goal of 490,000 and the specific annual production goal of 360,000 for this cohort. This was the result of broodstock collection strategies that placed a large proportion of trapped hatchery and natural salmon above the weir to spawn naturally, along with and a relatively high number of pre-spawn mortalities at Lookingglass Fish Hatchery compared to previous years.
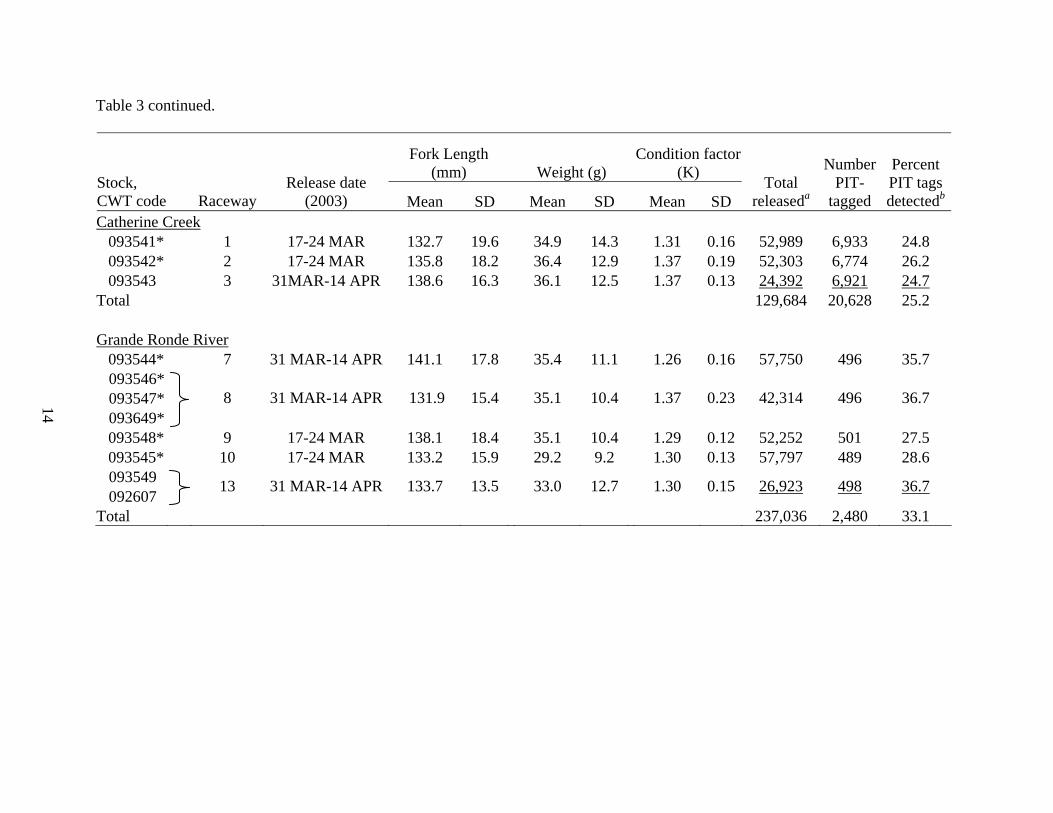
The recently modified long-term mitigation goal for the Grande Ronde River Basin was set at 250,000 smolts per year for the Lostine, Catherine Creek, and upper Grande Ronde populations. In the Lostine River, the release in 2003 of 141,867 smolts produced from Captive Broodstock and 100,882 smolts produced from Conventional Broodstock (242,749 total) was close to the mitigation goal (Table 1). In Catherine Creek, we released 105,292 smolts produced from Captive Broodstock and 24,392 smolts produced from Conventional Broodstock (129,684 total). In the Grande Ronde River, we released 210,113 smolts produced from Captive Broodstock and 26,923 smolts produced from Conventional Broodstock (237,036 total). In addition, we released 2001 cohort parr from the Captive Broodstock Program in 2002 into Bear Creek (4,660 Lostine River stock), Lookingglass Creek (17,880 Catherine Creek stock), and Sheep Creek (32,800 Grande Ronde River stock).
We attempted to mark 100% of the 2001 cohort smolts released in 2003 with ad clip+CWT. We had good ad clip+CWT mark rates for each stock (Table 2): Imnaha River (95.5%); Lostine River (95.8%); Catherine Creek (94.5%); and Grande Ronde River (96.6%). The 2001 cohort of Imnaha River Chinook salmon was reared in five raceways at Lookingglass Fish Hatchery. All Imnaha River Chinook salmon smolts were acclimated at the Imnaha Acclimation Facility starting as early as 10 March 2003. Smolts were volitionally released beginning on 1 April 2003 and the remaining smolts were forced out on 15 April 2003.
Lostine River Chinook salmon smolts produced from Captive Broodstock parents were reared in three raceways and smolts produced from Conventional Broodstock were reared in two raceways at LFH. Smolts from both production groups were transported to and released from the Lostine acclimation ponds in two stages: early and late acclimation periods (Table 3). Smolts from the early acclimation were transported to the acclimation ponds on 3 March 2003. Volitional release of smolts began on 17 March 2003 and remaining smolts were forced out on 24 March 2003. Smolts from the late acclimation period were transported to acclimation ponds on 25 March 2003, were volitionally released beginning on 31 March 2003, and the remaining smolts were forced out on 14 April 2003.
Catherine Creek Chinook salmon smolts produced from Captive Broodstock parents were reared in two raceways and smolts produced from Conventional Broodstock were reared in one raceway at LFH. Smolts produced from Captive Broodstock parents were transported to Catherine Creek acclimation ponds on 10 March 2003. These smolts were volitionally released beginning 17 March 2003 and remaining smolts were forced out on 24 March 2003. Smolts produced from Conventional Broodstock parents were transported to the acclimation ponds on 25 March 2003, volitionally released beginning 31 March 2003, and forced out on 14 April 2003.
Grande Ronde River Chinook salmon smolts produced from Captive Broodstock parents were reared in four raceways and smolts produced from Conventional Broodstock were reared in one raceway at LFH. Smolts produced from Captive Broodstock parents were transported to the Grande Ronde River acclimation ponds on 10 March 2003. Smolts were volitionally released beginning 17 March 2003 and remaining smolts were forced out on 24 March 2003. In the late acclimation period, smolts produced from Captive Broodstock and Conventional Broodstock
4
parents were transported to the acclimation ponds on 25 March 2003, volitionally released beginning 31 March 2003, and forced out on 14 April 2003.
Smolt migration success was monitored based on first-time PIT-tag detections at mainstem dams. Mean detection rates for smolts released in 2003 were: 50.0% for Imnaha River stock; 37.1% for Lostine River stock; 25.2% for Catherine Creek stock; and 33.1% for Grande Ronde River stock. Detection rates for the smolts produced from Captive Broodstock parents were similar to detection rates of Conventional Broodstock produced smolts (Table 3).
Adults
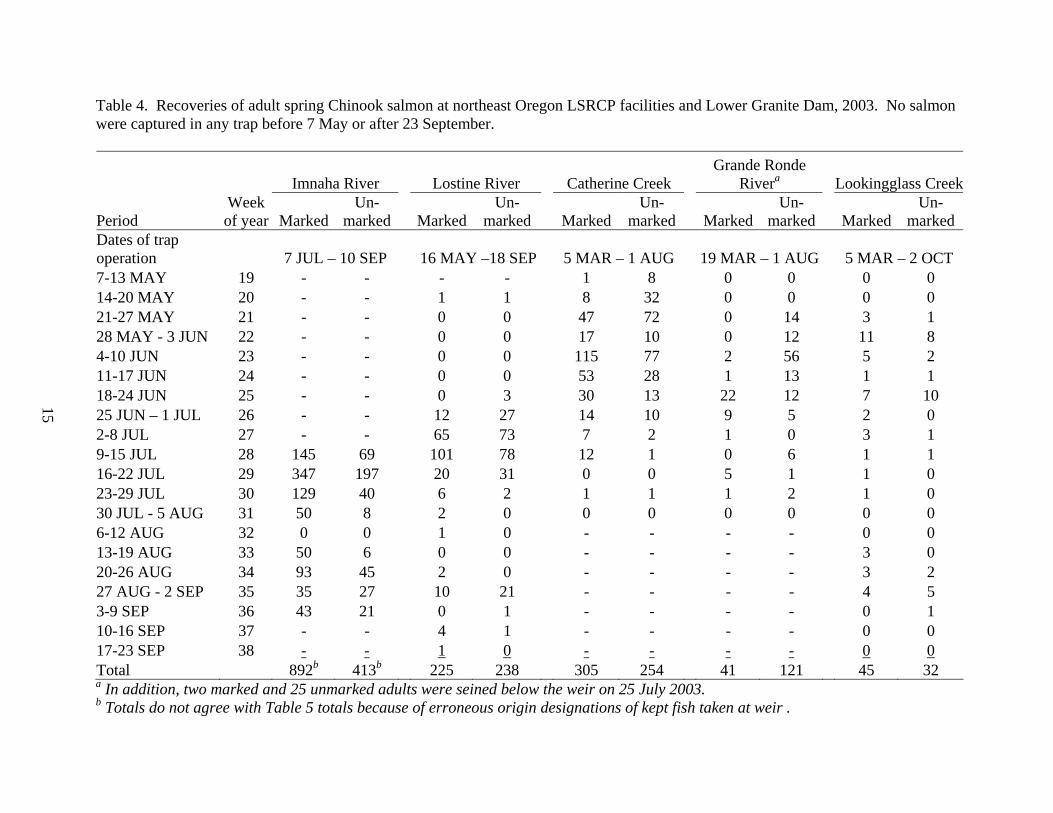
The Imnaha River weir was installed on 7 July 2003, well after the target date of 15 June, due to high river flows. The weir was operated until 10 September 2003 (Table 4). We trapped 899 hatchery- and 406 naturally-produced salmon and 28.6% (304 hatchery; 69 natural) were retained (Table 5). Most were retained for broodstock, but seven (three hatchery and four natural) were weir mortalities. The remaining salmon collected at the weir were either outplanted to Big Sheep and Lick creeks (371 hatchery, one natural) or released above the weir to spawn naturally (224 hatchery, 336 natural). Age structure of salmon captured at the weir was determined from CWT or scale analysis, when available, or from length-at-age relationships. The largest proportion of adults (43.7%) used as broodstock were age 4 (Figure 1). Age structure of hatchery-produced adults collected at the weir was: 41.9% age 3; 30.2% age 4; and 27.9% age 5. This differed from the age structure of naturally-produced adults collected at the weir: 6.7% age 3; 51.2% age 4; and 42.1% age 5 (Table 5). Pre-spawn mortality of combined hatchery and natural Imnaha River Chinook salmon that died at the weir or were held at LFH was 32.7%. Much of the mortality occurred late in the spawning season and was comprised mainly age 3 males (jacks). We spawned 71 hatchery and 26 natural females with 125 hatchery and 24 natural males (Table 5). We collected 497,969 eggs, which was below our goal of 576,500 green eggs, and they were incubated at Lookingglass Fish Hatchery (Table 6). Mortality to shocking was 12.0%. The Lostine River weir was installed on 16 May 2003 and operated until 18 September 2003. A total of 225 hatchery- and 238 naturally-produced adult Chinook salmon were captured, with 11.0% (six hatchery, 45 natural) retained (Table 5). Most were retained for broodstock, but two hatchery-origin salmon were weir mortalities. The remaining salmon trapped at the weir were either outplanted (39 hatchery Chinook salmon to Bear Creek) or released above the weir to spawn naturally (180 hatchery, 193 natural). Age 4 adults were the dominant age group returning to the Lostine River weir, comprising 45.8% of the hatchery-produced salmon and 56.7% of the naturally produced salmon collected (Table 5). Age 3 adults comprised 32.4% of hatchery-produced adults and only 4.6% of naturally-produced adults returning to the weir. Age 5 adults comprised 21.8% of hatchery-produced salmon and 38.6% of naturally-produced salmon collected. The age 4 and age 5 hatchery returns were Captive Broodstock progeny from the 1999 and 1998 cohorts, respectively. Age 3 hatchery returns were from both Captive Broodstock and Conventional Broodstock progeny. All adults used as broodstock to create the 2003 cohort were natural origin salmon. Age structure of adults used as conventional broodstock was as follows: 5.1% age 3; 56.4% age 4; and 38.5% age 5. Pre-spawning mortality of broodstock caught at the weir and held at Lookingglass Hatchery was 23.5%. We spawned 21 natural females with 18 natural males and collected 106,646 eggs, which was below the goal of 176,600 green eggs. Egg mortality to shocking was low (4.5%).
5
The Catherine Creek weir was operated from 5 March to 1 August 2003. Totals of 305 hatchery- and 254 naturally-produced adult Chinook salmon were captured (Table 5). Fifty-three (9.5% of total) naturally-produced adults were retained (51 for broodstock and two weir mortalities). In order to limit the number of hatchery jacks on the spawning grounds, 51 hatchery-origin jacks were kept and provided to the Confederated Tribe of the Umatilla Indian Reservation (CTUIR) for ceremonial/subsistence purposes. Two small age-4 hatchery adults were mistaken for jacks and also provided to CTUIR. The remaining salmon were released above the weir to spawn naturally (252 hatchery, 201 natural). Age structure of hatchery-produced adults collected at the weir was: 22.6% age 3; 59.7% age 4; and 17.7% age 5. This differed from the age structure of naturally-produced adults collected at the weir: 2.4% age 3; 26.4% age 4; and 71.3% age 5 (Table 5). All hatchery returns were progeny of the Captive Broodstock Program. Pre-spawning mortality of broodstock caught at the weir and held at Lookingglass Hatchery was 11.3%. We spawned 28 natural females with 19 natural males and collected 103,916 eggs, which was below the goal of 176,600 green eggs. Egg mortality to shocking was low (12.5%). The upper Grande Ronde River weir was operated from 19 March to 1 August 2003. A total of 41 hatchery- and 121 naturally-produced adult Chinook salmon were captured with 36.4% (59 natural) retained for broodstock (Table 5). In addition, there were two hatchery-origin salmon weir mortalities. In order to limit the number of hatchery jacks on the spawning grounds, 32 hatchery-origin jacks were kept and provided to the Confederated Tribe of the Umatilla Indian Reservation for ceremonial/subsistence purposes. The remaining salmon were released above the weir to spawn naturally (nine hatchery, 60 natural). All hatchery returns were from Captive Broodstock progeny releases. Age 3 adults comprised the majority of hatchery returns (86.0%) mainly because the size of the 2000 cohort release was two orders of magnitude larger than previous releases. Age structure of naturally produced adults returning to the weir was as follows: 1.7% age 3; 3.4% age 4; and 95.0% age 5. The weak age 4 adult return was the result of poor escapement to spawning grounds in 1999 that produced this cohort. In addition to adults collected at the weir, two hatchery-origin adults of unknown age were collected with seines below the weir and released upstream. Twenty-five naturally produced salmon were also collected below the weir. Thirteen (seven age-5 females and six age-5 males) were released above the weir to spawn naturally and 12 were kept for broodstock (six age-5 females, six age-5 males). Pre-spawning mortality of the fish held at Lookingglass Hatchery was 27.9%. We spawned 23 natural females with 20 natural males and collected 120,703 eggs, which was below the goal of 176,600 green eggs. Egg mortality to shocking was 12.7%. The Lookingglass Creek weir was operated from 5 March to 2 October 2003. A total of 45 hatchery- and 32 naturally-produced Chinook salmon were collected. As part of the management objective to phase out Rapid River stock in Lookingglass Creek and re-establish stock endemic to the Grande Ronde Basin, all adults collected at the weir were retained for tribal ceremonial/subsistence purposes. No adults were passed above the weir or kept for broodstock at Lookingglass Fish Hatchery.
Coded-Wire Tag Recoveries We used coded-wire tag recoveries from adult returns, strays, and fisheries collections from experimental and production groups of each stock of Chinook salmon to evaluate hatchery treatments and assess the success of achieving mitigation goals and management objectives.

6
Hatchery fish from all experimental and most production groups were marked with a coded-wire tag (CWT) to provide basic information on survival, harvest, escapement, straying, and specific information on experimental results. Coded-wire tag recovery information for each CWT code group was obtained from the Regional Mark Information System (RMIS) CWT recovery database maintained by the Pacific States Marine Fisheries Commission. We summarized from the RMIS database the observed and expanded number of CWTs recovered in ocean and mainstem river fisheries as well as strays collected in and out of the Snake River Basin. Expanded numbers in the RMIS database were the estimated number of CWT fish caught based on sampling efficiencies at each recovery location. The RMIS database does not expand for recoveries observed in the Imnaha and Grande Ronde River basins. We expanded observed recoveries from returning hatchery adults (from weir collections and spawning ground recoveries) from each cohort to the Imnaha, Lostine, and Grande Ronde rivers and Catherine Creek. Observed recoveries were expanded for unrecovered CWT adults by first estimating hatchery escapement to each stream for each cohort (see Monzyk et al. 2006a). For each stream, the total number of coded-wire tagged returns was estimated by multiplying the hatchery escapement estimate by the proportion of the cohort tagged at release and the weighted average tag retention rate for each cohort. The expanded number of recoveries for each CWT code group was estimated by multiplying the total number of CWT returns by the relative proportion of each CWT code within a cohort. Nearly all CWT recoveries for hatchery Chinook salmon released in the Imnaha Basin occurred in the Snake River Basin. In 2003, we recovered 517 hatchery-reared Imnaha River Chinook salmon with a CWT from the 1998-2000 cohorts. These recoveries were expanded to an estimated 3,781 CWT returns to the Imnaha River with the following age distribution: 1,034 from the 1998 cohort; 1,160 from the 1999 cohort; and 1,587 from the 2000 cohort (Table 7). In addition, an estimated three CWT Imnaha River salmon were recovered in ocean fisheries, 152 were recovered in the Columbia River, and five were recovered as strays outside the Snake River basin. Of the Columbia River recoveries, and estimated 25 were recovered in ceremonial fisheries and 82 were recovered in sport fisheries (Table 8). Of the out-of-basin strays, an estimated three were recovered in the Deschutes River, one was recovered at Sandy Fish Hatchery, Oregon, and one was recovered at Lyons Ferry Fish Hatchery, Washington. A within-basin stray was recovered in Lookingglass Creek.
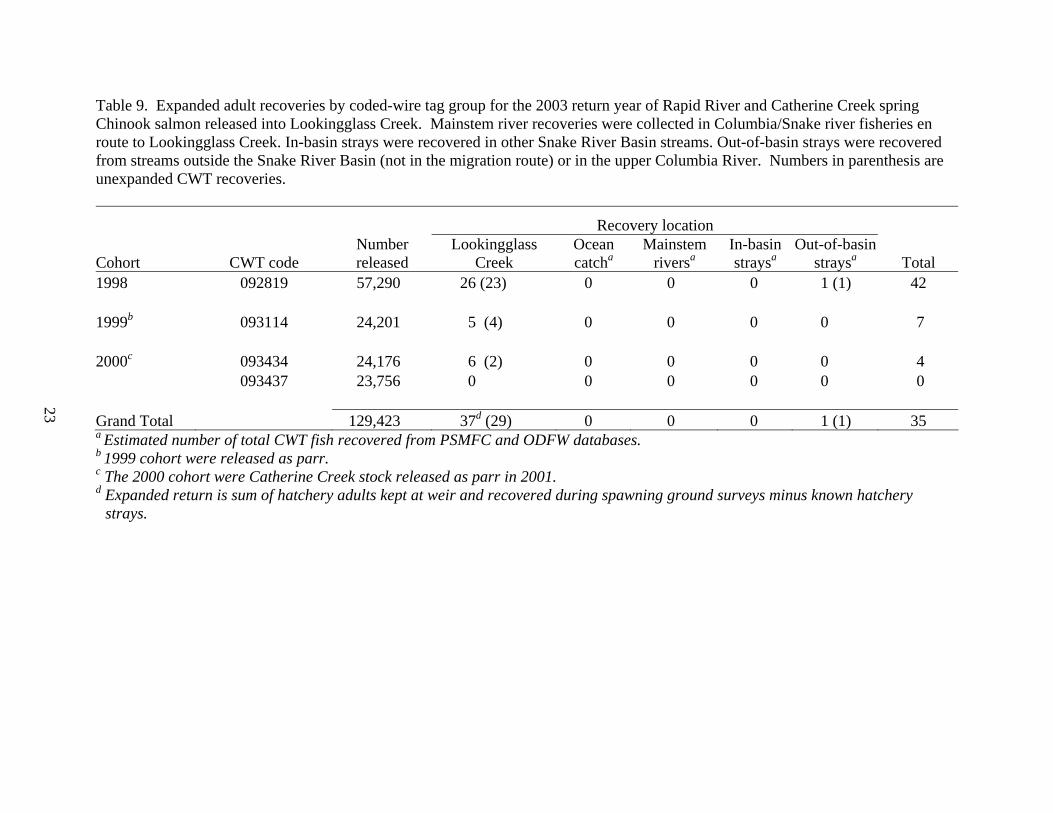
In 2003, we recovered 28 CWT marked Rapid River Chinook salmon from the 1998-1999 cohorts and two CWT marked Catherine Creek Chinook salmon from the 2000 cohort that had been released into Lookingglass Creek (Table 9). Of the Rapid River Chinook salmon, 27 CWT fish were recovered at the LFH weir or during spawning ground surveys on Lookingglass Creek and one was also recovered from the Deschutes River. The two Catherine Creek hatchery salmon were recovered at the weir. We estimated that a total of 31 Rapid River Chinook salmon and six Catherine Creek Chinook salmon returned to Lookingglass Creek (Table 9)
We recovered 98 hatchery-reared Lostine River Chinook salmon from the 1998-2000 cohorts with a CWT in 2003. These recoveries were expanded to an estimated 441 CWT returns to the Lostine River with the following age distribution: 98 from the 1998 cohort; 205 from the 1999 cohort; and 138 from the 2000 cohort (Table 11). An estimated 65 Lostine River Chinook salmon were recovered in the Columbia/Snake river migration corridor, mostly from sport fisheries (Table 10). One stray was recovered out of the Snake River basin, in the Deschutes River. Thirteen CWT salmon were recovered as in-basin strays, although three recovered in the
7
Wallowa River Basin may have been the result of outplanting from the Lostine River weir. Two in-basin strays were recovered in Lookingglass Creek.
We recovered 176 hatchery-reared Catherine Creek Chinook salmon with a CWT from the 1998-2000 cohorts. These recoveries were expanded to an estimated 310 CWT returns to Catherine Creek with the following age distribution: 56 from the 1998 cohort; 189 from the 1999 cohort; and 65 from the 2000 cohort (Table 12). An estimated 45 CWT marked Catherine Creek salmon were also recovered in the Columbia River, mostly from sport fisheries (Table 10). Two were recovered out of the Snake River Basin at the Little White Salmon National Fish Hatchery. In addition, 13 CWT Catherine Creek Chinook salmon were recovered as within-basin strays, most (10) from Lookingglass Creek.
We recovered 54 hatchery-reared Grande Ronde Chinook salmon with a CWT from the 1998-2000 cohorts in 2003. These recoveries were expanded to an estimated 66 CWT returns to the Grande Ronde River with the following age distribution: one from the 1998 cohort; six from the 1999 cohort; and 59 from the 2000 cohort (Table 13). An estimated 10 CWT marked Grande Ronde River salmon were also recovered in the Columbia/Snake river migration corridor, all from sport fisheries (Table 10). In addition, three CWT Grande Ronde Chinook salmon were recovered at the Lookingglass Creek weir.
Compensation Goals
To assess the success of achieving mitigation goals and management objectives, we determined the total number of hatchery-produced salmon for each stock that were recovered in fisheries, escaped to stream of release, or strayed within or outside the Snake River basin. The number of hatchery-produced salmon that were recovered in fisheries or strayed within or outside the Snake River basin was estimated based on CWT recoveries. The number of hatchery-produced salmon that escaped to the stream of release was determined using the method described in Monzyk et al. (2006a). To determine the return to the LSRCP Compensation Area, defined as the Snake River basin above Ice Harbor Dam, we summed all estimated escapement for the 2003 return year above Ice Harbor Dam. The compensation goal for the Imnaha Basin is 3,210 hatchery adults. We estimated that 3,856 Imnaha River hatchery adults returned to the compensation area, 120% of the goal for the Imnaha River stock (Table 8). Of these, an estimated 3,855 returned to the Imnaha River and one was recovered in Lookingglass Creek. In the Grande Ronde Basin, the compensation goal for all stocks combined was set at 5,820 hatchery adults. We estimated 451 Lostine River, 321 Catherine Creek, and 72 Grande Ronde River adults returned to the basin. In addition, 31 Rapid River and six Catherine Creek hatchery adults that were released from LFH returned to Lookingglass Creek. The combined return to the compensation area was 881 hatchery adults, or 15.1% of the compensation goal. The primary factors causing low hatchery returns in the basin were management strategies that reduced the number of Rapid River salmon released in the basin (1998 and 1999 cohorts) and newly initiated Conventional Broodstock Programs that are yet to reach production goals. The progeny-to-parent ratio for hatchery- and natural-origin Imnaha River salmon that spawned naturally in 1998 was 3.4, much higher than the mean value since 1982 and well above replacement (Figure 2). This is the third consecutive year that natural productivity has been above replacement, after a twelve year period of being below replacement. The progeny-to-parent ratio for the hatchery component was 30.8, better than naturally spawning salmon and

8
well above replacement. The progeny-to-parent ratios reported here include jacks. The number of natural salmon that returned to the basin to spawn (1,615) was up slightly from the 2002 return and was greater than the average return since 1990 (Figure 3).
Natural Escapement Monitoring
Stream surveys to enumerate Chinook salmon redds and to sample salmon carcasses were conducted as in previous years (see Monzyk et al. 2006a). We surveyed three streams in the Imnaha River Basin and nine in the Grande Ronde Basin. An exception to normal carcass sampling was on the Imnaha and Lostine rivers, where we encountered large numbers of carcasses that made complete sampling of every carcass prohibitive. For this reason, we completely sampled every other carcass observed for scale samples and snouts (CWT). All carcasses were observed for fin and opercle marks, sex, and degree of spawning. In 2003, we counted 754 redds and observed 838 carcasses in the Imnaha Basin (Table 14). Based on recovered CWTs from marked hatchery salmon on spawning grounds, all were Imnaha stock with the exception of one Lostine River and two Catherine Creek adults (Table 15). Marked salmon comprised 37.4% of the observed carcasses of known origin on the spawning grounds. Age composition of hatchery adults recovered on spawning grounds in the Imnaha River Basin was 16.8% age 3, 14.3% age 4, and 68.9% age 5. Age composition of natural adults was 3.6% age 3, 36.0% age 4, and 60.3% age 5 (Table 16). In the Grande Ronde Basin, we observed 794 redds and recovered 548 carcasses on the spawning grounds (Table 14). We recovered four marked hatchery strays in the Grande Ronde Basin (Table 15). In Lookingglass Creek, one stray from the 1998 Lostine River cohort and one stray from the 2000 Imnaha River cohort were recovered on spawning grounds. In the Lostine River, one stray from the 1999 Catherine Creek cohort was recovered. No strays were recovered in the Wenaha River, but a stray from the 1999 Lostine River cohort was recovered in the Minam River. Hatchery strays comprised 0.8% of the total carcasses recovered in the Grande Ronde River Basin. Age composition of hatchery adults recovered on spawning grounds in the Grande Ronde Basin was 9.6% age 3, 65.1% age 4, and 25.3% age 5 and age composition of natural adults was 1.9% age 3, 24.4% age 4, and 73.7% age 5 (Table 16).

9
1991-2002
Length interval (mm)400 500 600 700 800 900 1000
Freq
uenc
y (%
)
0
2
4
6
8
10
12
14Age 3 n = 876Age 4 n = 1,341Age 5 n = 481
2003
Length interval (mm)400 500 600 700 800 900 1000
Freq
uenc
y (%
)
0
2
4
6
8
10
12
14Age 3 n = 65Age 4 n = 108Age 5 n = 74
Figure 1. Length frequency-at-age relationship for Imnaha River Chinook salmon adults used as hatchery broodstock in 2003 (top) and from 1991-2002 (below).
10
Cohort1982 1984 1986 1988 1990 1992 1994 1996 1998
Pare
nt:P
roge
ny ra
tio
0
5
10
15
20
25
30
35NaturalHatchery
Figure 2. Progeny-to-parent ratios for completed cohorts (1982-1998) of Imnaha River Chinook salmon. Note: dotted line indicates P:P ratio=1.
Return year1984 1986 1988 1990 1992 1994 1996 1998 2000 2002
Num
ber o
f spa
wne
rs
0
1000
2000
3000
4000
5000
6000Natural Hatchery
Figure 3. Estimated numbers of natural- and hatchery-origin Chinook salmon that spawned naturally in the Imnaha River, 1984-2003. These estimates include age-3 males.

11
Table 1. Rearing summaries for the 2001 cohort of juvenile spring Chinook salmon released into the Imnaha and Grande Ronde river basins in 2003. Percent Survival
Cohort, stock Broodstock
Number of green
eggs taken
Eyed eggs a
Green -to- eyed
Eyed -to-
smolt
Total smolts
releasedb 2001 cohort Imnaha River Conventional 462,968 282,541 61.0 95.0 268,426 Lostine River Captive 266,739 242,360 90.9 74.7 141,867 Lostine River Conventional 139,768 97,493 69.8 100.0 100,882 Catherine Creek Captive 227,782 199,990 88.8 60.8 105,292 Catherine Creek Conventional 41,826 26,426 63.2 92.3 24,392 Grande Ronde River Captive 434,670 375,347 86.4 63.1 210,113 Grande Ronde River Conventional 29,580 25,339 85.7 100.0 26,923
a Underestimated number of eyed eggss for Lostine and Grande Ronde River Conventional Program so estimated survival biased.
b Includes all smolts released (adipose clipped and coded-wire tagged plus unrecognizable marks) but does not include captive broodstock produced parr released in 2002.
12
Table 2. Estimates of percent adipose fin clip (Ad) and coded-wire tag retention for 2001 cohort spring Chinook salmon stocks reared at Lookingglass Fish Hatchery and released as smolts in 2003. Targets were 100% AD with CWT.
Stock, CWT code Raceway Broodstock
Number checked
Ad clip, with CWT
Ad clip, no CWT
No Ad clip, with CWT
No Ad clip, no CWT
Imnaha River 093659 14 Conventional 522 94.6 2.7 2.7 0 093660 15 Conventional 511 97.7 0.8 1.6 0 093642 16 Conventional 510 95.1 0.4 4.5 0 093643 17 Conventional 503 94.4 0.8 4.8 0 093644 18 Conventional 513 95.7 0.2 4.1 0
Total/mean 2,559 95.5 1.0 3.5 0
Lostine River 093536 093537 4 Captive 527 96.4 0.2 3.4 0
093535 093538 5 Captive 519 93.6 2.1 4.2 0
093507 6 Captive 505 95.4 1.4 3.2 0 093539 11 Conventional 498 98.2 0.0 1.8 0 093540 12 Conventional 504 95.6 0.4 4.0 0
Total/mean 2,553 95.8 0.9 3.3 0
Catherine Creek
093541 1 Captive 496 91.9 1.2 6.9 0 093542 2 Captive 501 95.8 0.4 3.6 0.2 093543 3 Conventional 325 96.3 0.6 3.1 0
Total/mean 1,322 94.5 0.8 4.6 0.1
Grande Ronde River
093544 7 Captive 511 95.9 1.6 2.5 0 093546 093547 093649
8 Captive 502 96.8 0.4 2.8 0
093548 9 Captive 528 95.5 0.8 3.8 0 093545 10 Captive 509 97.8 0.2 2.0 0 093549 092607
13 Conventional 510 97.1 0.2 2.7 0
Total/mean 2,560 96.6 0.6 2.8 0
13
Table 3. Mean size of 2001 cohort spring Chinook salmon smolts, total number released into the Imnaha River and Grande Ronde River basins, number PIT-tagged and percent detected at Snake and Columbia river dams, 2003. Asterisk denotes Captive Broodstock Program progeny.
Fork Length (mm) Weight (g)
Condition factor (K) Stock,
CWT code Raceway Release date
(2003) Mean SD Mean SD Mean SD Total
releaseda
Number PIT-
tagged
Percent PIT tags detectedb
Imnaha River 093659 14 1-15 APR 127.8 10.6 27.4 8.5 1.34 0.29 54,842 4,192 47.9 093660 15 1-15 APR 129.0 12.4 27.5 8.5 1.30 0.16 54,839 4,156 50.3 093642 16 1-15 APR 128.2 11.5 26.3 8.4 1.35 0.63 54,853 4,186 49.9 093643 17 1-15 APR 134.1 14.1 31.4 6.7 1.28 0.18 54,836 4,188 50.0 093644 18 1-15 APR 132.7 15.2 26.0 11.5 1.11 0.33 49,056 4,182 51.7 Total 268,426 20,904 50.0
Lostine River 093536* 093537*
4 31 MAR-14 APR 121.0 10.6 25.5 7.4 1.53 0.20 54,723 2,664 38.5
093535* 093538*
5 17-24 MAR 127.4 15.6 28.1 7.4 1.51 0.63 57,986 2,665 34.6
093507* 6 31 MAR-14 APR 133.1 16.5 34.1 18.7 1.34 0.18 29,158 2,614 37.8 093539 11 17-24 MAR 126.2 13.6 26.8 8.6 1.31 0.18 51,795 3,985 34.8 093540 12 31 MAR-14 APR 120.4 12.2 21.6 7.6 1.28 0.25 49,087 3,890 39.7 Total 242,749 15,858 37.1 a Total released includes all fish with adipose clip (target 100%) and CWT . Equals total number released in Table 1 by stock. b Percent PIT tag detections are unique detections at all dams in the Snake and Columbia Rivers.
14
Table 3 continued.
Fork Length (mm) Weight (g)
Condition factor (K) Stock,
CWT code Raceway Release date
(2003) Mean SD Mean SD Mean SD Total
releaseda
Number PIT-
tagged
Percent PIT tags detectedb
Catherine Creek 093541* 1 17-24 MAR 132.7 19.6 34.9 14.3 1.31 0.16 52,989 6,933 24.8 093542* 2 17-24 MAR 135.8 18.2 36.4 12.9 1.37 0.19 52,303 6,774 26.2 093543 3 31MAR-14 APR 138.6 16.3 36.1 12.5 1.37 0.13 24,392 6,921 24.7 Total 129,684 20,628 25.2 Grande Ronde River 093544* 7 31 MAR-14 APR 141.1 17.8 35.4 11.1 1.26 0.16 57,750 496 35.7 093546* 093547* 093649*
8 31 MAR-14 APR 131.9 15.4 35.1 10.4 1.37 0.23 42,314 496 36.7
093548* 9 17-24 MAR 138.1 18.4 35.1 10.4 1.29 0.12 52,252 501 27.5 093545* 10 17-24 MAR 133.2 15.9 29.2 9.2 1.30 0.13 57,797 489 28.6 093549 092607 13 31 MAR-14 APR 133.7 13.5 33.0 12.7 1.30 0.15 26,923 498 36.7
Total 237,036 2,480 33.1
15
Table 4. Recoveries of adult spring Chinook salmon at northeast Oregon LSRCP facilities and Lower Granite Dam, 2003. No salmon were captured in any trap before 7 May or after 23 September.
Imnaha River Lostine River Catherine Creek Grande Ronde
Rivera Lookingglass Creek
Period Week of year Marked
Un-marked Marked
Un-marked Marked
Un-marked Marked
Un-marked Marked
Un-marked
Dates of trap operation 7 JUL – 10 SEP 16 MAY –18 SEP 5 MAR – 1 AUG 19 MAR – 1 AUG 5 MAR – 2 OCT 7-13 MAY 19 - - - - 1 8 0 0 0 0 14-20 MAY 20 - - 1 1 8 32 0 0 0 0 21-27 MAY 21 - - 0 0 47 72 0 14 3 1 28 MAY - 3 JUN 22 - - 0 0 17 10 0 12 11 8 4-10 JUN 23 - - 0 0 115 77 2 56 5 2 11-17 JUN 24 - - 0 0 53 28 1 13 1 1 18-24 JUN 25 - - 0 3 30 13 22 12 7 10 25 JUN – 1 JUL 26 - - 12 27 14 10 9 5 2 0 2-8 JUL 27 - - 65 73 7 2 1 0 3 1 9-15 JUL 28 145 69 101 78 12 1 0 6 1 1 16-22 JUL 29 347 197 20 31 0 0 5 1 1 0 23-29 JUL 30 129 40 6 2 1 1 1 2 1 0 30 JUL - 5 AUG 31 50 8 2 0 0 0 0 0 0 0 6-12 AUG 32 0 0 1 0 - - - - 0 0 13-19 AUG 33 50 6 0 0 - - - - 3 0 20-26 AUG 34 93 45 2 0 - - - - 3 2 27 AUG - 2 SEP 35 35 27 10 21 - - - - 4 5 3-9 SEP 36 43 21 0 1 - - - - 0 1 10-16 SEP 37 - - 4 1 - - - - 0 0 17-23 SEP 38 - - 1 0 - - - - 0 0 Total 892b 413b 225 238 305 254 41 121 45 32 a In addition, two marked and 25 unmarked adults were seined below the weir on 25 July 2003. b Totals do not agree with Table 5 totals because of erroneous origin designations of kept fish taken at weir .

16
Table 5. Number and disposition of adult spring Chinook salmon that returned to northeast Oregon LSRCP facilities in 2003 by origin, age, and sex. Hatchery Natural 3 4 5 3 4 5 Disposition F M F M F M Total F M F M F M Total
Grand total
Imnaha River Trapped 2 375 114 157 154 97 899 0 27 85 123 97 74 406 1,305 Passed 0 23 37 59 64 41 224 0 27 71 106 78 54 336 560 Outplanted 1 201 33 44 55 37 371 0 0 0 0 0 1 1 372 Kept 1 151 44 54 35 19 304 0 0 14 17 19 19 69 373 Actual spawned 1 65 37 48 33 12 196 0 0 12 11 14 13 50 246 Killed, not spawned 0 3 0 0 0 1 4 0 0 0 0 0 1 1 5 Pre-spawn mortality 0 83 7 6 2 6 104 0 0 2 6 5 5 18 122 Mean length (mm)a 680 577 803 782 925 987 - - 807 773 911 974 Standard deviation (mm) - 43.2 38.3 56.7 37.5 56.2 - - 36.5 59.5 33.0 62.0 Age composition (%) 0.2 41.7 12.7 17.5 17.1 10.8 100 0.0 6.7 20.9 30.3 23.9 18.2 100 41.7 Lostine River Trapped 0 73 50 53 22 27 225 0 11 76 59 46 46 238 463 Passed 0 30 49 53 22 26 180 0 9 61 51 36 36 193 373 Outplanted 0 39 0 0 0 0 39 0 0 0 0 0 0 0 39 Kept 0 4 1 0 0 1 6 0 2 15 8 10 10 45 51 Actual spawned 0 0 0 0 0 0 0 0 2 14 8 7 8 39 39 Killed, not spawned 0 0 0 0 0 0 0 0 0 0 0 0 0 0 0 Pre-spawn mortality 0 4 1 0 0 1 6 0 0 1 0 3 2 6 12 Mean length (mm)a - 553 - - - - - 565 804 791 892 990 Standard deviation (mm) - 43.4 - - - - - 33.9 28.8 38.0 27.8 59.1 Age composition (%) 0.0 32.4 22.2 23.6 9.8 12.0 100 0.0 4.6 31.9 24.8 19.3 19.3 100 32.4
a Mean length per age class determined from known age fish based on either CWT, scale data, or unique VIE mark.

17
Table 5 continued.
Hatchery Natural 3 4 5 3 4 5 Disposition F M F M F M Total F M F M F M Total
Grand total
Lookingglass Creek Trapped / Killed 0 13 6 4 12 10 45 0 9 9 6 7 1 32 77 Mean length (mm)a 0 502.0 730.0 677.8 885.3 902.6 0 514.3 719.6 744.0 875.0 900.0 Standard deviation (mm) 0 52.6 24.8 26.7 33.0 56.6 0 46.6 32.2 40.0 38.2 NA Age composition (%) 0.0 28.9 13.3 8.9 26.7 22.2 100 0.0 28.1 28.1 18.8 21.9 3.1 100 Catherine Creek Trapped 0 69 111 71 20 34 305 0 6 32 35 97 84 254 559 Passed 0 18 110 70 20 34 252 0 4 27 32 72 66 201 453 Kept 0 51 1 1 0 0 53 0 2 5 3 25 18 53 106 Spawned 0 0 0 0 0 0 0 0 1 4 3 24 15 47 47 Killed not spawned 0 51 1 1 0 0 53 0 0 0 0 0 0 0 53 Pre-spawn mortality 0 0 0 0 0 0 0 0 1 1 0 1 3 6 6 Mean length (mm)a - 481 770 - 843 - - 598 711 696 863 924 Standard Deviation (mm) - 41.6 - - - - - - 17.2 46.3 35.8 51.4 Age composition (%) 0.0 22.6 36.4 23.3 6.6 11.1 100 0.0 2.4 12.6 13.8 38.2 33.1 100

18
Table 5 continued.
Hatchery Natural 3 4 5 3 4 5 Disposition F M F M F M Total F M F M F M Total
Grand total
Grande Ronde Riverb Trapped 0 37 2 2 0 0 41 0 2 2 2 61 54 121 162 Passed 0 5 2 2 0 0 9 0 1 1 0 28 30 60 69 Kept 0 32 0 0 0 0 32 0 1 1 2 33 24 61 93 Spawned 0 0 0 0 0 0 0 0 0 0 1 23 19 43 43 Killed not spawned 0 32 0 0 0 0 32 0 0 0 0 0 1 1 33 Pre-spawn mortality 0 0 0 0 0 0 0 0 1 1 1 10 4 17 17 Mean length (mm)a - 500 - - - - - 605 660 795 856 883 Standard Deviation (mm) - 32.6 - - - - - - - - 28.8 64.1 Age composition (%) 0.0 86.0 7.0 7.0 0.0 0.0 100 0.0 1.7 1.7 1.7 50.4 44.6 100
b In addition, two hatchery adults of unknown age (1 F, 1 M) were captured below the weir and passed upstream and 25 natural adults were captured below the weir (13 passed-7 F, 6 M; 12 kept –6 F, 6 M, all age-5). Only one kept adult (male) survived to spawn.

19
Table 6. Timing of spawning and spawning summaries for spring Chinook salmon at Lookingglass Fish Hatchery, 2003. Mix=crosses of natural and hatchery parents.
Number of parents Stock,
spawn date Origin of parents F Ma
Number of eggs
collected Number of eyed eggs
Percent mortality to shocking
Imnaha River 12 AUG Hatchery 1 1 5,486 213 95.1 19 AUG Mixed 6 7 37,383 28,678 23.2 26 AUG Mixed 19 37 93,608 88,008 5.8 2 SEP Mixed 33 51 181,113 165,862 8.2 9 SEP Mixed 35 53 166,646 141,862 14.7 16 SEP Mixed 4 4 13,733 13,427 2.1 Total 98 153 497,969 438,050 12.0 Lostine River 20 AUG Natural 3 3 15,212 13,602 10.6 27 AUG Natural 4 4 19,515 18,643 4.4 3 SEP Natural 7 7 36,229 34,729 3.7 10 SEP Natural 6 6 29,270 28,466 2.5 16 SEP Natural 1 2 6,420 6,371 0.7 Total 21 22 106,646 101,811 4.5 Catherine Creek 14 AUG Natural 3 3 11,703 3,534 69.6 21 AUG Natural 12 12 44,995 41,749 6.9 28 AUG Natural 10 8 35,420 34,177 3.3 4 SEP Natural 3 3 11,798 11,431 1.9 Total 28 26 103,916 90,891 12.5 Grande Ronde River 14 AUG Natural 4 4 21,515 12,284 42.9 21 AUG Natural 6 6 36,140 32,730 9.3 28 AUG Natural 7 7 33,201 32,608 1.7 4 SEP Natural 4 3 21,160 19,312 8.2 11 SEP Natural 1 2 4,512 4,493 0.4 15 SEP Natural 1 1 4,175 3,947 5.4 Total 23 23 120,703 105,374 12.7 a The number of males in table are greater than the number kept because some males were
recycled.

20
Table 7. Expanded adult recoveries by coded-wire tag group of Imnaha River spring Chinook salmon for the 2003 return year. Mainstem river recoveries were collected in Columbia/Snake river fisheries en route to the Imnaha River. In-basin strays were recovered in other Snake River Basin streams (not in the migration route). Out-of-basin strays were recovered from streams outside the Snake River Basin or in the upper Columbia River. Numbers in parenthesis are unexpanded CWT recoveries.
Recovery location
Cohort
Experimental group (target size at
release) CWT codeNumber released
Imnaha Rivera Ocean catchb
Mainstem riversb
In-basin straysb
Out-of-basin straysb Total
1998 18 g 092821 18,633 91 (17) 0 9 (2) 0 1 (1) 101 18 g 092822 18,617 134 (25) 0 1 (1) 0 0 135 18 g 092823 18,618 112 (21) 0 8 (2) 0 0 120 18 g 092824 18,624 161 (30) 0 7 (2) 0 0 168 18 g 092825 18,600 107 (20) 0 7 (3) 0 0 114 18 g 092826 15,245 145 (27) 0 10 (3) 0 1 (1) 156 30 g 092827 17,590 64 (12) 0 3 (1) 0 0 67 30 g 092828 17,585 75 (14) 0 4 (1) 0 0 79 30 g 092829 17,581 75 (14) 0 7 (2) 0 0 82 30 g 092830 18,894 70 (13) 0 5 (2) 0 0 75 Total 179,987 1,034 (193) 0 61 (19) 0 2 (2) 1,097 1999 Production 093056 18,033 170 (17) 0 7 (2) 0 3 (3) 180 Production 093057 35,863 310 (31) 0 22 (6) 0 0 332 Production 093058 35,880 350 (35) 3 (1) 12 (2) 0 0 365 Production 093059 33,238 330 (33) 0 2 (1) 0 0 332 Total 123,014 1,160 (116) 3 (1) 43 (11) 0 3 (3) 1,209 a Expansion based on predicted number of CWT fish returning (cohort escapement x proportion with CWT x weighted average tag
retention rate). b Expanded number of total CWT fish recovered from PSMFC and ODFW databases.

21
Table 7 continued.
Recovery location
Cohort
Experimental group (target size at
release) CWT codeNumber released
Imnaha Rivera Ocean catchb
Mainstem riversb
In-basin straysb
Out-of-basin straysb Total
2000 Production 075851 27,730 171 (18) 0 0 0 0 171 Production 093413 61,615 304 (32) 0 1 (1) 0 0 305 Production 093414 61,578 390 (41) 0 20 (1) 0 0 410 Production 093415 61,511 247 (26) 0 7 (1) 1 (1) 0 255 Production 093417 61,497 285 (30) 0 20 (1) 0 0 305 Production 093443 29,806 190 (20) 0 0 0 0 190 Total 303,737 1,587 (167) 0 48 (4) 1 (1) 0 1,636 Grand Total 606,738 3,781 (476) 3 (1) 152 (34) 1 (1) 5 (5) 3,942

22
Table 8. Catch and escapement distribution of Imnaha River hatchery adult spring Chinook salmon by recovery location in 2003 (CWT recovery data summarized through April 2006 from the PSMFC and ODFW recovery databases).
Location, recovery type Observed recoveries Expanded adults Percent of total
Ocean catch 1 3 >0.1 Columbia River Ceremonial and subsistence 10 25 0.6 Treaty net 8 36 0.9 Non-treaty net 4 9 0.2 Sport 12 82 2.1 Test fishery 0 0 0.0 Snake River Sporta 0 0 0.0 Lower Granite Dama 0 0 0.0 Deschutes River Trap 3 3 >0.1 Sport 0 0 0.0 Ceremonial and subsistence 0 0 0.0 Other Strays Outside Snake River Basin 2 2 >0.1 Within Snake River Basina 1 1 >0.1 Escapement to rivera 1,095b 3,855c 96.0 Total catch/escapement 4,016 Return to compensation area 3,856 Percent of compensation goald 120 a Indicates areas defining the compensation area. b Number of unique hatchery spring Chinook salmon observations at weir and on spawning
ground surveys. Hatchery origin determined by presence of ad clip. c Expansion factor is estimated total escapement to Imnaha River of hatchery cohorts. d The compensation goal for Imnaha stock is 3,210 hatchery adults.
23
Table 9. Expanded adult recoveries by coded-wire tag group for the 2003 return year of Rapid River and Catherine Creek spring Chinook salmon released into Lookingglass Creek. Mainstem river recoveries were collected in Columbia/Snake river fisheries en route to Lookingglass Creek. In-basin strays were recovered in other Snake River Basin streams. Out-of-basin strays were recovered from streams outside the Snake River Basin (not in the migration route) or in the upper Columbia River. Numbers in parenthesis are unexpanded CWT recoveries.
Recovery location
Cohort CWT code Number released
Lookingglass Creek
Ocean catcha
Mainstem riversa
In-basin straysa
Out-of-basin straysa Total
1998 092819 57,290 26 (23) 0 0 0 1 (1) 42 1999b 093114 24,201 5 (4) 0 0 0 0 7 2000c 093434 24,176 6 (2) 0 0 0 0 4 093437 23,756 0 0 0 0 0 0 Grand Total 129,423 37d (29) 0 0 0 1 (1) 35 a Estimated number of total CWT fish recovered from PSMFC and ODFW databases. b 1999 cohort were released as parr. c The 2000 cohort were Catherine Creek stock released as parr in 2001. d Expanded return is sum of hatchery adults kept at weir and recovered during spawning ground surveys minus known hatchery
strays.

24
Table 10. Catch and escapement distribution of Grande Ronde Basin hatchery adult spring Chinook salmon by stock and recovery location in 2003 from CWT recovery data summarized through April 2006 from the PSMFC and ODFW databases. Lostine River Catherine Creek Grande Ronde River Lookingglass Creek
Location, recovery type Actual Expanded
adults Percent of total Actual
Expanded adults
Percent of total Actual
Expanded adults
Percent of total Actual
Expanded adults
Percent of total
Ocean catch 0 0 0.0 0 0 0.0 0 0 0.0 0 0 0.0 Columbia River 0.0 0.0 0.0 Ceremonial/subsistence 4 13 2.5 3 7 1.8 0 0 0.0 0 0 0.0 Treaty net 2 12 2.3 0 0 0.0 0 0 0.0 0 0 0.0 Non-treaty net 2 4 0.8 0 0 0.0 0 0 0.0 0 0 0.0 Sport 3 34 6.4 8 38 10.0 2 8 9.4 0 0 0.0 Test fishery 0 0 0.0 0 0 0.0 0 0 0.0 0 0 0.0 Snake River Sport a 1 2 0.4 0 0 0.0 1 2 2.4 0 0 0.0 Lower Granite Dama 0 0 0.0 0 0 0.0 0 0 0.0 0 0 0.0 Deschutes River Trap 0 0 0.0 0 0 0.0 0 0 0.0 1 1 1.9 Sport 1 1 0.2 0 0 0.0 0 0 0.0 0 0 0.0 Ceremonial/subsistence 0 0 0.0 0 0 0.0 0 0 0.0 0 0 0.0 Other Strays Outside Snake R. Basin 0 0 0.2 2 2 0.5 0 0 0.0 0 0 0.0 Within Snake R. Basina 13 13 2.3 13 13 3.4 3 3 3.5 0 0 0.0 Escapement to streama 301b 451c 85.1 310b 321c 84.3 43b 72c 84.7 37b 37d 98.1 Total estimated return 530 381 85 38 Compensation area return 465 334 77 37 a Indicates areas within LRSCP compensation area. b Number of hatchery spring Chinook salmon observed at weir and on spawning ground surveys. c Expansion factor is estimated total escapement to natal stream of hatchery adults. Does not include adjustments for CWT loss or
proportion intentionally not tagged. d Six of the 37 observed Chinook salmon were age-3 jacks from Catherine Creek stock originally released into Lookingglass Creek.
25
Table 11. Expanded adult recoveries by coded-wire tag group of Lostine River spring Chinook salmon for the 2003 return year. Mainstem river recoveries were collected in Columbia/Snake river fisheries en route to the Lostine River. In-basin strays were recovered in other Snake River Basin streams (not in the migration route). Out-of-basin strays were recovered from streams outside the Snake River Basin or in the upper Columbia River. Numbers in parenthesis are unexpanded CWT recoveries.
Recovery location
Cohort Broodstock CWT code
Number released Lostine Rivera
Ocean catchb
Mainstem riversb
In-basin straysb
Out-of-basin straysb Total
1998 Captive 092831 11,438 39 (8) 0 3 (1) 0 0 42 Captive 092832 9,743 15 (3) 0 0 0 0 15 Captive 092834 7,654 29 (6) 0 0 1 (1) 0 30 Captive 092835 2,783 5 (1) 0 0 0 0 5 Captive 092836 3,010 10 (2) 0 2 (1) 0 0 12 Captive 092841 477 0 0 0 0 0 0 Total 35,105 98 (20) 0 5 (2) 1 (1) 0 104 1999 Captive 093060 3,581 10 (2) 0 0 0 0 10 Captive 093061 11,260 19 (4) 0 3 (1) 0 0 22 Captive 093062 12,932 14 (3) 0 0 1 (1) 0 15 Captive 093063 16,307 14 (3) 0 0 0 0 14 Captive 093101 15,279 24 (5) 0 0 0 0 24 Captive 093102 14,360 24 (5) 0 0 0 0 24 Captive 093103 22,565 33 (7) 0 9 (2) 0 0 42 Captive 093104 34,124 67 (14) 0 15 (4) 3 (3) 1 (1) 86 Captive 093105 3,475 0 0 13 (2) 0 0 13 Total 133,883 205 (43) 0 40 (9) 4 (4) 1 (1) 250 a Expansion based on predicted number of CWT fish returning (cohort escapement x proportion with CWT x weighted average tag
retention rate). b Estimated number of total CWT fish recovered from PSMFC and ODFW databases.

26
Table 11 continued.
Recovery location
Cohort Broodstock CWT code
Number released Lostine Rivera
Ocean catchb
Mainstem riversb
In-basin straysb
Out-of-basin straysb Total
2000 Conventional 075852 31,464 108 (7) 0 0 0 0 108 Captive 093419 2,363 0 0 0 2 (2) 0 2 Captive 093421 7,800 0 0 0 1 (1) 0 1 Captive 093422 10,514 0 0 0 1 (1) 0 1 Captive 093423 13,178 15 (1) 0 20 (1) 0 0 35 Captive 093425 16,537 15 (1) 0 0 0 0 15 Captive 093426 20,265 0 0 0 4 (4) 0 4 Captive 093428 3,815 0 0 0 0 0 0 Total 105,936 138 (9) 0 20 (1) 8 (8) 0 164 Grand Total 274,924 441 (72) 0 65 (12) 13 (13) 1 (1) 520

27
Table 12. Expanded adult recoveries by coded-wire tag group of Catherine Creek spring Chinook salmon for the 2003 return year. Mainstem river recoveries were collected in Columbia/Snake river fisheries en route to Catherine Creek. In-basin strays were recovered in other Snake River Basin streams (not in the migration route). Out-of-basin strays were recovered from streams outside the Snake River Basin or in the upper Columbia River. Numbers in parenthesis are unexpanded recoveries.
Recovery location
Cohort Broodstock CWT code
Number released
Catherine Creeka
Ocean catchb
Mainstem riversb In-basin straysb
Out-of-basin straysb Total
1998 Captive 092820 23,698 31 (6) 0 5 (1) 0 0 36 Captive 092833 11,261 25 (5) 0 5 (1) 0 0 30 Captive 092837 1,061 0 0 0 0 0 0 Captive 092838 1,064 0 0 0 0 0 0 Captive 092839 563 0 0 0 0 0 0 Captive 092842 502 0 0 0 0 0 0 Total 38,149 56 (11) 0 10 (2) 0 0 66 1999 Captive 093106 6,068 2 (1) 0 0 0 0 2 Captive 093107 4,711 11 (5) 0 5 (1) 0 0 16 Captive 093108 6,916 0 0 0 0 0 0 Captive 093109 11,471 17 (8) 0 2 (1) 1 (1) 0 20 Captive 093110 13,062 22 (10) 0 8 (2) 2 (2) 0 32 Captive 093111 18,985 50 (23) 0 5 (1) 1 (1) 0 56 Captive 093112 25,498 41 (19) 0 5 (1) 1 (1) 0 47 Captive 093113 25,534 41 (19) 0 10 (3) 3 (3) 0 54 Captive 093226 7,936 5 (2) 0 0 0 0 5 Captive 093227 16,652 0 0 0 0 0 0 Total 136,833 189 (87) 0 35 (9) 8 (8) 0 232 a Expansion factor is based on estimated total return to Catherine Creek of hatchery cohort adjusted by tag retention rates for tag
groups. Includes weir and spawning ground recoveries. b Estimated number of total CWT fish recovered from PSMFC and ODFW databases.

28
Table 12 continued.
Recovery location
Cohort Broodstock CWT code
Number released
Catherine Creeka
Ocean catchb
Mainstem riversb In-basin straysb
Out-of-basin straysb Total
2000 Captive 093420 5,553 4 (3) 0 0 0 1 (1) 5 Captive 093429 3,260 1 (1) 0 0 0 0 1 Captive 093430 6,560 1 (1) 0 0 0 0 1 Captive 093431 9,404 6 (5) 0 0 0 0 6 Captive 093432 10,524 4 (3) 0 0 1 (1) 0 5 Captive 093433 14,490 4 (3) 0 0 0 0 4 Captive 093435 46,365 25 (20) 0 0 1 (1) 0 26 Captive 093436 43,986 14 (11) 0 0 1 (1) 1 (1) 16 Captive 093438 23,348 6 (5) 0 0 2 (2) 0 8 Total 163,490 65 (52) 0 0 5 (5) 2 (2) 72 Grand Total 338,472 310 (150) 0 45 (11) 13 (13) 2 (2) 370

29
Table 13. Expanded adult recoveries by coded-wire tag group of Grande Ronde River spring Chinook salmon for the 2003 return year. Mainstem river recoveries were collected in Columbia/Snake river fisheries en route to the upper Grande Ronde River. In-basin strays were recovered in other Snake River Basin streams (not in the migration route). Out-of-basin strays were recovered from streams outside the Snake River Basin or in the upper Columbia River. Numbers in parenthesis are unexpanded recoveries.
Recovery location
Cohort Broodstock CWT code
Number released
Grande Ronde Rivera
Ocean catchb
Mainstem riversb
In-basin straysb
Out-of-basin straysb Total
1998 Captive 092840 1,508 1 (1) 0 0 0 0 1 1999c Captive 093115 2,560 6 (0) 0 0 0 0 6 2000 Captive 070149 42,152 22 (13) 0 1 (1) 2 (2) 0 25 Captive 092611 2,029 2 (1) 0 0 0 0 2 Captive 093416 24,669 7 (4) 0 0 0 0 7 Captive 093424 13,214 0 0 0 0 0 0 Captive 093439 30,376 7 (4) 0 2 (1) 0 0 9 Captive 093440 31,824 9 (5) 0 7 (1) 1 (1) 0 17 Captive 093442 20,394 0 0 0 0 0 0 Captive 093441 4,544 7 (4) 0 0 0 0 7 Captive 093444 42,200 5 (3) 0 0 0 0 5 Total 211,402 59 (34) 0 10 (3) 3 (3) 0 72 Grand Total 215,470 66 (54) 0 10 (3) 3 (3) 0 79 a Expansion factor is based on estimated total return to the Grande Ronde River of hatchery cohort adjusted by tag retention rates for
tag groups. Includes weir and spawning ground recoveries. b Estimated number of total CWT fish recovered from PSMFC and ODFW databases. c No recoveries reported for CWT code 093115 but an estimated six adults from this cohort returned to the river.

30
Table 14. Summary of marked and unmarked spring Chinook salmon carcass recoveries and number of redds discovered by stream during spawning ground surveys, 2003.
Basin, stream Marked UnmarkedUnknown
Mark Percent marked
Number of redds
Imnaha River Basin Big Sheep Creek 0 3 1 0 16 Imnaha River 286 483 59 37.2 727 Lick Creek 5 1 0 83.3 11 Total 291 487 60 37.4 754 Grande Ronde River Basin Bear Creek 0 2 0 0 2 Hurricane Creek 2 6 0 25.0 23 Lostine River 92 71 12 56.4 194 Wallowa River 3 29 3 9.3 59 Grande Ronde River 2 20 5 9.1 29 Catherine Creek 124 61 9 67.0 167 Lookingglass Creek 7 2 2 77.8 10 Minam River 5 67 2 6.9 153 Wenaha River 0 19 2 0 157 Total 235 278 35 45.8 794
31
Table 15. Summary of adipose-clipped Chinook salmon carcass recoveries during spawning ground surveys, 2003.
Recovery location CWT code Number
Recovered Release site and cohort Imnaha River Basin Imnaha River 092821 8 Imnaha Acclimation Pond (1998 cohort) 092822 13 Imnaha Acclimation Pond (1998 cohort) 092823 13 Imnaha Acclimation Pond (1998 cohort) 092824 23 Imnaha Acclimation Pond (1998 cohort) 092825 15 Imnaha Acclimation Pond (1998 cohort) 092826 15 Imnaha Acclimation Pond (1998 cohort) 092827 9 Imnaha Acclimation Pond (1998 cohort) 092828 9 Imnaha Acclimation Pond (1998 cohort) 092829 11 Imnaha Acclimation Pond (1998 cohort) 092830 7 Imnaha Acclimation Pond (1998 cohort) 093056 5 Imnaha Acclimation Pond (1999 cohort) 093057 8 Imnaha Acclimation Pond (1999 cohort) 093058 7 Imnaha Acclimation Pond (1999 cohort) 093059 4 Imnaha Acclimation Pond (1999 cohort) 093104 1 Lostine River Acclimation Pond (1999 cohort) 093110 1 Catherine Acclimation Pond (1999 cohort) 093113 1 Catherine Acclimation Pond (1999 cohort) 093413 7 Imnaha Acclimation Pond (2000 cohort) 093414 7 Imnaha Acclimation Pond (2000 cohort) 093415 8 Imnaha Acclimation Pond (2000 cohort) 093417 7 Imnaha Acclimation Pond (2000 cohort) 093443 2 Imnaha Acclimation Pond (2000 cohort) Lick Creek 092822 1 Imnaha Acclimation Pond (1998 cohort) 092824 1 Imnaha Acclimation Pond (1998 cohort) 092826 1 Imnaha Acclimation Pond (1998 cohort) 092828 1 Imnaha Acclimation Pond (1998 cohort) 092830 1 Imnaha Acclimation Pond (1998 cohort) Grande Ronde River Basin Lookingglass Creek 092819 4 Lookingglass Fish Hatchery (1998 cohort) 092834 1 Lostine River Acclimation Pond (1998 cohort) 093415 1 Imnaha Acclimation Pond (2000 cohort)

32
Table 15 continued.
Recovery location CWT code Number
Recovered Release site and cohort Lostine River 075852 6 Lostine River Acclimation Pond (2000 cohort)
092831 8 Lostine River Acclimation Pond (1998 cohort) 092832 3 Lostine River Acclimation Pond (1998 cohort) 092834 6 Lostine River Acclimation Pond (1998 cohort) 092835 1 Lostine River Acclimation Pond (1998 cohort) 092836 2 Lostine River Acclimation Pond (1998 cohort) 093060 2 Lostine River Acclimation Pond (1999 cohort)
093061 4 Lostine River Acclimation Pond (1999 cohort) 093062 3 Lostine River Acclimation Pond (1999 cohort) 093063 3 Lostine River Acclimation Pond (1999 cohort) 093101 5 Lostine River Acclimation Pond (1999 cohort) 093102 5 Lostine River Acclimation Pond (1999 cohort) 093103 7 Lostine River Acclimation Pond (1999 cohort) 093104 14 Lostine River Acclimation Pond (1999 cohort) 093113 1 Catherine Acclimation Pond (1999 cohort) 093423 1 Lostine River Acclimation Pond (2000 cohort) 093425 1 Lostine River Acclimation Pond (2000 cohort)Catherine Creek 092820 5 Catherine Acclimation Pond (1998 cohort) 092833 5 Catherine Acclimation Pond (1998 cohort) 093106 1 Catherine Acclimation Pond (1999 cohort) 093107 5 Catherine Acclimation Pond (1999 cohort) 093109 8 Catherine Acclimation Pond (1999 cohort) 093110 10 Catherine Acclimation Pond (1999 cohort) 093111 23 Catherine Acclimation Pond (1999 cohort) 093112 18 Catherine Acclimation Pond (1999 cohort) 093113 17 Catherine Acclimation Pond (1999 cohort) 093226 2 Catherine Acclimation Pond (1999 cohort) 093431 1 Catherine Acclimation Pond (2000 cohort) 093435 2 Catherine Acclimation Pond (2000 cohort) 093436 2 Catherine Acclimation Pond (2000 cohort) Wallowa River 075852 1a Lostine River Acclimation Pond (2000 cohort) 093062 1a Lostine River Acclimation Pond (1999 cohort)Grande Ronde River 070149 1 Grande Ronde River (2000 cohort) 092840 1 Grande Ronde River (1998 cohort) Minam River 093104 1 Lostine River Acclimation Pond (1999 cohort)a Recoveries could be the result of outplants from Lostine River weir.
33
Table 16. Age composition and length characteristics of hatchery- and naturally-produced spring Chinook salmon carcasses with known age, sex, and origin recovered during 2003 spawning ground surveys in the Imnaha and Grande Ronde river basins. Hatchery origin was determined by the presence of an adipose fin clip. Age was determined by CWT or scale analysis when available, or else by age-length key.
Hatchery Natural 3 4 5 3 4 5 Basin, parameter F M F M F M Total F M F M F M TotalImnaha River Basin Number 0 41 17 18 110 58 244 0 13 62 67 139 77 358 Age composition (%) 0.0 16.8 7.0 7.3 45.1 23.8 100.0 0.0 3.6 17.3 18.7 38.8 21.5 100.0 Mean fork length (mm) - 561 805 797 926 1017 - 545 805 785 928 1008 Standard deviation - 49.2 75.2 65.2 42.2 82.1 - 50.7 43.0 54.3 48.5 79.6 Grande Ronde River Basin Number 0 22 87 62 31 27 229 0 5 42 21 107 83 258 Age composition (%) 0.0 9.6 38.0 27.1 13.5 11.8 100.0 0.0 1.9 16.3 8.1 41.5 32.2 100.0 Mean fork length (mm) - 533 736 789 852 928 - 552 745 741 872 933 Standard deviation - 55.0 44.4 57.9 49.0 79.5 - 31.7 42.8 41.6 41.1 63.5
34
References Carmichael, R.W. and E.J. Wagner. 1983. Evaluation of Lower Snake River Compensation
Plan facilities in Oregon. Oregon Department of Fish and Wildlife, Fish Research Project 14-16-0001-83269, Annual Progress Report, Portland.
Carmichael, R.W. and R.T. Messmer. 1985. Evaluation of Lower Snake River Compensation
Plan facilities in Oregon. Oregon Department of Fish and Wildlife, Fish Research Project FRI/LSR-86-35, Annual Progress Report, Portland.
Carmichael, R.W., B.A. Miller and R.T. Messmer. 1986a. Lower Snake River Compensation
Plan--Oregon evaluation studies. Oregon Department of Fish and Wildlife, Fish Research Project FRI/LSR-86-35, Annual Progress Report, Portland.
Carmichael, R.W., R. Boyce and J. Johnson. 1986b. Grande Ronde River spring Chinook
production report (U.S. v. Oregon). Oregon Department of Fish and Wildlife, Portland. Carmichael, R.W., R.T. Messmer and B.A. Miller. 1987. Lower Snake River Compensation
Plan--Oregon evaluation studies. Oregon Department of Fish and Wildlife, Fish Research Project FRI/LSR-88-16, Annual Progress Report, Portland.
Carmichael, R.W., R.T. Messmer and B.A. Miller. 1988. Lower Snake River Compensation
Plan--Oregon evaluation studies. Oregon Department of Fish and Wildlife, Fish Research Project AFFI/LSR-90-17, Annual Progress Report, Portland.
Carmichael, R.W., D.L. Eddy, M.W. Flesher, M. Keefe, P.J. Keniry, S.J. Parker and T.A.
Whitesel. 1999. Lower Snake River Compensation Plan: Oregon Evaluation Studies. Oregon Department of Fish and Wildlife, 1994 Annual Progress Report, Portland.
Carmichael, R.W., T.L. Hoffnagle and J.R. Ruzycki. 2003. Lower Snake River Compensation
Plan: Oregon Evaluation Studies. Work Statement submitted to the U. S. Fish and Wildlife Service, Lower Snake River Compensation Plan office, Boise, ID. Contract Number 14-11-03-J050. Oregon Department of Fish and Wildlife, La Grande.
Carmichael, R.W., D.L. Eddy, M.W. Flesher, T.L. Hoffnagle, P.J. Keniry and J.R. Ruzycki.
2004. Lower Snake River Compensation Plan: Oregon Evaluation Studies. Oregon Department of Fish and Wildlife, 1995 and 1996 Bi-Annual Progress Report, Salem.
Hoffnagle, T.L., R. W. Carmichael, D.L. Eddy, P.J. Keniry, F. M. Monzyk and G. Vonderohe.
2005. Lower Snake River Compensation Plan: Oregon Evaluation Studies. Oregon Department of Fish and Wildlife, 1997 and 1998 Bi-Annual Progress Report, Salem.
Messmer, R.T., R.W. Carmichael and M.W. Flesher. 1989. Evaluation of Lower Snake River
Compensation Plan facilities in Oregon. Oregon Department of Fish and Wildlife, Fish Research Project. Annual Progress Report, Portland.

35
Messmer, R.T., R.W. Carmichael and M.W. Flesher. 1990. Evaluation of Lower Snake River Compensation Plan facilities in Oregon. Oregon Department of Fish and Wildlife, Fish Research Project. Annual Progress Report, Portland.
Messmer, R.T., R.W. Carmichael, M.W. Flesher and T.A. Whitesel. 1991. Evaluation of Lower
Snake River Compensation Plan facilities in Oregon. Oregon Department of Fish and Wildlife, Fish Research Project. Annual Progress Report, Portland.
Messmer, R.T., R.W. Carmichael, M.W. Flesher and T.A. Whitesel. 1992. Evaluation of Lower
Snake River Compensation Plan facilities in Oregon. Oregon Department of Fish and Wildlife, Fish Research Project. Annual Progress Report, Portland.
Messmer, R.T., R.W. Carmichael, M.W. Flesher and T.A. Whitesel. 1993. Evaluation of Lower
Snake River Compensation Plan facilities in Oregon. Oregon Department of Fish and Wildlife, Fish Research Project. Annual Progress Report, Portland.
Monzyk, F. M., G. Vonderohe, T. L. Hoffnagle, R. W. Carmichael, D.L. Eddy and P.J. Keniry.
2006a. Lower Snake River Compensation Plan: Oregon Spring Chinook Salmon Evaluation Studies. 1999 Annual Progress Report, Oregon Department of Fish and Wildlife, Salem.
Monzyk, F. M., G. Vonderohe, T. L. Hoffnagle, R. W. Carmichael, D.L. Eddy and P.J. Keniry.
2006b. Lower Snake River Compensation Plan: Oregon Spring Chinook Salmon Evaluation Studies. 2000 Annual Progress Report, Oregon Department of Fish and Wildlife, Salem.
Monzyk, F. M., G. Vonderohe, T. L. Hoffnagle, R. W. Carmichael, D.L. Eddy and P.J. Keniry.
2006c. Lower Snake River Compensation Plan: Oregon Spring Chinook Salmon Evaluation Studies. 2001 Annual Progress Report, Oregon Department of Fish and Wildlife, Salem.
Monzyk, F. M., G. Vonderohe, T. L. Hoffnagle, R. W. Carmichael, D.L. Eddy and P.J. Keniry.
2006d. Lower Snake River Compensation Plan: Oregon Spring Chinook Salmon Evaluation Studies. 2002 Annual Progress Report, Oregon Department of Fish and Wildlife, Salem.