lower north fork spring river final report
TRANSCRIPT

Biological Assessment Study
Lower North Fork of the Spring RiverBarton and Jasper Counties
2004
Prepared for:
Missouri Department of Natural ResourcesDivision of Environmental Quality
Water Protection ProgramWater Pollution Control Branch
Prepared by:
Missouri Department of Natural ResourcesField Services Division
Environmental Services ProgramWater Quality Monitoring Section
Table of ContentsPage
1.0 Introduction....................................................................................................................11.1 Study Area/Justification.....................................................................................11.2 Purpose...............................................................................................................11.3 Objectives ..........................................................................................................21.4 Tasks ..................................................................................................................21.5 Null Hypotheses.................................................................................................2
2.0 Methods .........................................................................................................................22.1 Study Timing .....................................................................................................22.2 Station Descriptions ...........................................................................................2
2.2.1 Ecological Drainage Unit.......................................................................32.3 Habitat Assessment............................................................................................52.4 Biological Assessment .......................................................................................5
2.4.1 Macroinvertebrate Collection and Analysis...........................................52.4.2 Physicochemical Collection and Analysis .............................................72.4.3 Discharge ...............................................................................................7
2.5 Data Analysis .....................................................................................................72.6 Quality Control ..................................................................................................7
3.0 Results and Analysis ......................................................................................................73.1 Habitat Assessment............................................................................................83.2 Biological Assessment .....................................................................................10
3.2.1 Standard Metrics…. .............................................................................103.2.1.1 Taxa Richness (TR) ................................................................103.2.1.2 EPT Taxa (EPTT) ..................................................................103.2.1.3 Biotic Index ............................................................................103.2.1.4 Shannon Diversity Index (SDI) ..............................................10
3.2.2 Secondary Metrics ...............................................................................143.2.2.1 Percent EPT Relative Abundance...........................................143.2.2.2 Percent Dominant (5) Taxa.....................................................153.2.2.3 Percent Clingers ......................................................................16
3.2.3 Macroinvertebrate Percent and Community Composition ..................193.2.4 Physicochemical Water........................................................................19
3.2.4.1 Discharge ................................................................................193.2.4.2 Nutrients ................................................................................21
3.2.4.2.1 Ammonia-N ............................................................213.2.4.2.2 Nitrate + Nitrite-N...................................................213.2.4.2.3 TKN ........................................................................213.2.4.2.4 Total Phosphorous ..................................................21
3.2.4.3 Dissolved Oxygen ...................................................................214.0 Discussion....................................................................................................................24
4.1 Habitat Assessment..........................................................................................244.2 Possible Effects of Land Use on Sedimentation ..............................................244.3 Transitional Nature of North Fork of the Spring River ..................................244.4 Macroinvertebrate Community Composition and Evaluation of
Biological Metrics............................................................................................25

Page4.5 Water Quality and Water Quantity Impacts.....................................................27
5.0 Conclusions..................................................................................................................296.0 Recommendations........................................................................................................297.0 Literature Cited ...........................................................................................................30
TABLES
Table 1 Station Number, Legal Location, and Descriptive Information for theLower North Fork of the Spring River Bioassessment Study............................3
Table 2 Percent Land Cover............................................................................................5
Table 3 Habitat Assessment Scores for Control and Test StationsSeptember 20-22, 2004 ......................................................................................8
Table 4 Predominant Category Habitat Values Estimated from Stream HabitatAssessments for the North Fork of the Spring River (NFSR) Test Stationsand Control Stations on Little Drywood Creek (LDW) and Flat Rock Creek(FRC) .................................................................................................................9
Table 5 Standard and Secondary Biological Metric Values (Mean ± SD) Calculatedfor North Fork of the Spring River (NFSR) test stations and control stationson Little Drywood Creek (LDW) and Flat Rock Creek (FRC) .......................18
Table 6 Dominant Taxa and Functional Feeding Group Values (Mean ± SD) forNorth Fork of the Spring River (NFSR) test stations and control stations onLittle Drywood Creek (LDW) and Flat Rock Creek (FRC) ............................20
Table 7 Physicochemical Variables for the North Fork of the Spring River StudyCollected from August 30, 2004 to September 1, 2004 During LeafpackDeployment......................................................................................................22
Table 8 Physicochemical Field Measurements for the North Fork of the SpringRiver Study Collected During (a) Stream Habitat Assessments(September 20-22, 2004) and at (b) Leafpack Retrieval(October 4-6, 2004)..........................................................................................23

PageFIGURES
Figure 1 Map of the Lower North Fork of the Spring River and Sampling Stations.......4
Figure 2 Taxa Richness (Mean ± SD) for North Fork of the Spring River (NFSR)Test Stations and Control Stations on Little Drywood Creek (LDW) andFlat Rock Creek (FRC) ....................................................................................11
Figure 3 EPT Taxa (Mean ± SD) for North Fork of the Spring River (NFSR) TestStations and Control Stations on Little Drywood Creek (LDW) and FlatRock Creek (FRC). ..........................................................................................12
Figure 4 Biotic Index (Mean ± SD) for North Fork of the Spring River (NFSR) TestStations and Control Stations on Little Drywood Creek (LDW) and FlatRock Creek (FRC). ..........................................................................................13
Figure 5 Shannon Diversity Index (Mean ± SD) for North Fork of the Spring River(NFSR) Test Stations and Control Stations on Little Drywood Creek (LDW)and Flat Rock Creek (FRC) .............................................................................14
Figure 6 Percent EPT Relative Abundance (Mean ± SD) for North Fork of the SpringRiver (NFSR) Test Stations and Control Stations on Little Drywood Creek(LDW) and Flat Rock Creek (FRC).................................................................15
Figure 7 Percent Dominant (5) Taxa (Mean ± SD) for North Fork of the Spring River(NFSR) Test Stations and Control Stations on Little Drywood Creek (LDW)and Flat Rock Creek (FRC) .............................................................................16
Figure 8 Percent Clingers (Mean ± SD) for North Fork of the Spring River (NFSR)Test Stations and Control Stations on Little Drywood Creek (LDW) and FlatRock Creek (FRC). ..........................................................................................17
Figure 9 Level III Ecoregion Map Showing Sampling Stations for the Upper NorthFork of the Spring River Bioassessment Study Using Biological CriteriaProtocols and the Lower North Fork of the Spring River Study UsingLeafpacks .........................................................................................................28

ATTACHMENTS
Appendix A Missouri Department of Natural Resources Bioassessment Study PlanLower North Fork of the Spring River, Barton and Jasper CountiesAugust 26, 2004
Appendix B Statistical Analyses (One-Way ANOVA and Tukey Multiple Comparison Test forParametric Data and Kruskal-Wallis ANOVA on Ranks and Dunn’s MultipleComparison Test for Non-parametric Data) Comparing Biological MetricsBetween Sampling Stations
Appendix C Lower North Fork of the Spring River Bioassessment Study MacroinvertebrateBench Sheets
Biological Assessment StudyLower North Fork of the Spring River2004Page 1
1.0 IntroductionAt the request of the Missouri Department of Natural Resources (MDNR), Water ProtectionProgram (WPP), Water Pollution Branch (WPB), the Environmental Services Program (ESP),Water Quality Monitoring Section (WQMS) conducted a macroinvertebrate bioassessment ofthe North Fork of the Spring River in Barton and Jasper counties. A 24-mile segment of theNorth Fork of the Spring River that flows from Lamar to the approximate confluence of DryFork Creek located southeast of Jasper was assessed. This segment is the lower portion of a 51.5mile segment on the 2002 303(d) list for elevated levels of sediment.
1.1 Study Area/JustificationNorth Fork of the Spring River originates in western Dade County near the town of Golden Cityand is located within the Ozark/Elk/Spring Ecological Drainage Unit (EDU). North Fork of theSpring River is listed in the Missouri Water Quality Standards (MDNR 2000) as a class “C”stream for its first 51.5 miles and continuing as a class “P” stream for 14.5 miles to itsconfluence with the Spring River in Jasper County. Designated uses for North Fork of theSpring River are “warm water aquatic life protection, human health/fish consumption andlivestock and wildlife watering.” The first 51.5 miles of the North Fork of the Spring River havebeen placed on the 2002 303(d) list for elevated levels of sediment.
The North Fork of the Spring River is a tributary of the Spring River system in southwesternMissouri that flows through a geological transitional region that has features of both the Ozarkand Plains ecoregions. The stream system is characterized by long pools with short, rocky, andgravelly riffles and the geology in the watershed contains beds of shale, sandstone, and limestone(Pflieger, 1989). Since the study reach has some sections that are transitional in nature, somesections that are plains-like, and there are no transition or plains biological criteria referencestreams in the Ozark/Elk/Spring EDU, leafpacks, a type of artificial substrate was used to assessthe stream. To determine impairment of the North Fork of the Spring River, leafpacks weredeployed at 5 test stations on the North Fork of the Spring River and at two control stations inthe Osage River and the Arkansas River drainages. The two control stations are Flat RockCreek, a tributary of the Neosho River, located in Neosho County, Kansas and Little DrywoodCreek, a Plains/Osage EDU biological criteria reference stream located in Vernon County,Missouri. The Kansas Department of Health and Environment recommended Flat Rock Creek asa control stream based on water quality data even though it is on the Kansas 303(d) list forcopper. No macroinvertebrate sampling had been conducted on Flat Rock Creek, which coulddetermine if this stream is of reference quality.
In 2004, a study plan was submitted to the MDNR, WPB (Appendix A). The ESP, WQMS wasresponsible for the proposed bioassessment study on the North Fork of the Spring River thatincluded the following purpose, objectives, tasks, and null hypotheses.
1.2 PurposeThe purpose of the study is to determine if the North Fork of the Spring River macroinvertebratecommunity is impaired. If North Fork of the Spring River is impaired, a second objective is todetermine if sediment deposition or something else is causing impairment.

Biological Assessment StudyLower North Fork of the Spring River2004Page 2
1.3 Objectives1) Determine if the macroinvertebrate community and water quality in North Fork of the Spring
River is impaired compared to control streams in the Osage River and the Arkansas Riverdrainages.
2) Assess the habitat quality of the North Fork of the Spring River.
1.4 Tasks1) Conduct a bioassessment of the macroinvertebrate community at five test stations on the
North Fork of the Spring River and at two control stations in the Osage River and theArkansas River drainages during fall 2004.
2) Conduct a water quality assessment at the sampling stations to determine potential waterquality impacts.
3) Conduct a habitat assessment at the sampling stations to ensure comparability of aquatichabitats.
1.5 Null Hypotheses1) The macroinvertebrate community found in leafpacks will not differ significantly (P = 0.05)
between longitudinally separate reaches of the North Fork of the Spring River.
2) The macroinvertebrate community found in leafpacks in the North Fork of the Spring Riverwill not differ significantly (P = 0.05) from similar sized control reaches on Flat Rock Creekand Little Drywood Creek.
2.0 MethodsCarl Wakefield and Brian Nodine of the Missouri Department of Natural Resources, FieldServices Division, Environmental Services Program, Water Quality Monitoring Sectionconducted this study.
2.1 Study TimingLeafpacks were deployed and water quality samples were collected from August 30 toSeptember 1, 2004. Stream habitat assessments were conducted and water quality fieldmeasurements (pH, conductivity, D.O., and water temperature) were collected from September20 to September 22, 2004. Leafpacks were retrieved and water quality field measurements werecollected from October 4 to 6, 2004.
2.2 Station DescriptionsFigure 1 shows the location for the test stations on North Fork of the Spring River and Table 1provides legal descriptions and descriptive information for the test and control stations.

Biological Assessment StudyLower North Fork of the Spring River2004Page 3
Table 1Station Number, Legal Location, and Descriptive Information for the Lower North Fork of the
Spring River Bioassessment StudyStation Number Section, Township, Range Description County
North Fork SpringRiver #1
SE ¼ sec. 29, T. 30 N., R. 31 W. Test-Redbud Roadcrossing
Jasper
North Fork SpringRiver #2
SW ¼ sec. 11, T. 30 N., R. 31 W. Test-SW 100th roadcrossing
Barton
North Fork SpringRiver #3
SW ¼ sec. 26, T. 31 N., R. 31 W. Test-Highway 126road crossing
Barton
North Fork SpringRiver #4
SE ¼ sec. 1, T. 31 N., R. 31 W. Test-SE 30th roadcrossing
Barton
North Fork SpringRiver #5
SW ¼ sec. 25, T. 32 N., R. 31 W. Test-upstream ofLamar WWTF
Barton
Little Drywood Creek#1
SE ¼ sec. 30, T. 35 N., R. 31 W. Control-near unnamedcounty road crossing
Vernon
Flat Rock Creek #2 SE ¼ sec. 7, T. 29 S., R. 21 E. Control-110th roadcrossing
Neosho,Kansas
2.2.1 Ecological Drainage UnitAn EDU is a region in which biological communities and habitat conditions can be expected tobe similar. A map of the Ozark/Elk/Spring EDU is also included in Figure 1. All test stationsare within this EDU. Table 2 compares the land cover percentages from the Ozark/Elk/SpringEDU and 14-digit Hydrologic Units (HU), which contain the North Fork of the Spring River teststations and the control station on Little Drywood Creek, a biocriteria reference stream reach inthe Osage/Plains EDU. Land cover data were derived from Thematic Mapper satellite data from1991 to 1993 and interpreted by the Missouri Resource Assessment Partnership (MoRAP).Land cover data derived from USEPA BASINS Version 3.0 for the control station on Flat RockCreek in Neosho County, Kansas was not included in Table #2 because it combined crops andgrassland into one category (USGS 1994). Land cover data from USEPA Basins Version 3.0estimated that crops and grassland made up 95 percent of the watershed and forest made up 4percent. Grassland was the dominant land use of the North Fork of the Spring River watershed,Ozark/Elk/Spring EDU, and Little Drywood Creek (Table 2). Forest cover was much lower atthe North Fork of the Spring River test stations than the Ozark/Elk/Spring EDU and the controlstation on Little Drywood Creek, but higher than Flat Rock Creek.

Biological Assessment StudyLower North Fork of the Spring River2004Page 4
Figure 1: Map of the Lower North Fork of the Spring River and Sampling Stations

Biological Assessment StudyLower North Fork of the Spring River2004Page 5
Table 2Percent Land Cover
Land Cover 14-digit
Hydrological Unit(HU)
Urban Crops Grassland Forest Swamp
Ozark/Elk/SpringEDU
MultipleHydrological
Units0.7 5.5 67.2 25.4 0
North Fork SpringRiver #1 11070207080003 1.1 14.5 74.0 9.1 0
North Fork SpringRiver #2 11070207070004 0 24.6 64.8 9.8 0
North Fork SpringRiver #3 11070207070004 0 24.6 64.8 9.8 0
North Fork SpringRiver #4 11070207060004 1.9 21.4 63.2 10.9 0
North Fork SpringRiver #5 11070207060004 1.9 21.4 63.2 10.9 0
Little DrywoodCreek #1 10290104060002 0.2 16.2 62.4 20.0 0
2.3 Habitat AssessmentA standardized assessment procedure was followed as described for Glide/Pool Habitat in theStream Habitat Assessment Project Procedure (SHAPP) (2003a). The habitat assessment wasconducted on all stations from September 20 to 22, 2004.
2.4 Biological AssessmentBiological assessments consisted of macroinvertebrate collection and physicochemical sampling.
2.4.1 Macroinvertebrate Collection and AnalysisMacroinvertebrates were quantitatively sampled by deploying 9 replicate leafpacks at eachsample station. Leafpacks were placed in the stream at 3 separate locations (3 leafpacks perlocation) spread throughout the sample reach on inside bends of pools with stream flows lessthan 0.5 cubic feet per second (cfs). Leafpacks were retrieved after approximately five weeks ofdeployment.
Leafpacks were constructed of 30 X 21 cm pieces of polymesh netting containing a total of 10leaves of eastern cottonwood (Populus deltoides) and American sycamore (Platunusoccidentalis). Since American sycamore was more common in the riparian zone of the sample

Biological Assessment StudyLower North Fork of the Spring River2004Page 6
reaches of this study, approximately 70% of leaves placed in the leafpacks were of this species.Leaves were collected, air-dried, pre-weighed to 7 g (+/- 1 g), and stored in zip-lock bags untilthey were ready for use. Leafpacks were constructed by placing leaves on top of half of thepolymesh netting while the other half was folded over on top of the leaves. The polymeshnetting was tied together with nylon cord around the loose edges to enclose the leaves. Theleafpacks were stored in zip-lock bags until deployment.
A set of 3 leafpacks were deployed in the stream by inserting a piece of rebar in the streambottom near the bank edge and inserting another piece of rebar in the stream bottom downstreamand about 10 to 15 feet from the bank. A piece of 3/16-inch diameter nylon rope was thenattached around a tree near the bank, if available, then attached to the piece of rebar near thebank, and finally attached to the other piece of rebar located in the stream. The nylon rope wasadjusted on the rebar so that it was at or near the water surface and was as tight as possible. Thethree leafpacks were spaced evenly along the nylon rope and deployed about a foot below thewater surface by attaching a piece of #24 braided nylon twine to the leafpack and to the nylonrope at the water surface. A snap-on clip was attached to the bottom of the leafpack to weight itdown so that it would hang vertically and be less susceptible to current.
At retrieval the leafpacks were removed from the stream by holding a kick net under the leafpackwhile cutting them loose from their place of attachment. The leafpacks were then placed in aplastic wash pan, the nylon cord was cut away from the polymesh netting, and the leaves werepulled from the netting and placed in a sample jar. A scrub brush and deionized (DI) water wereused to clean debris from the polymesh netting and the material was rinsed into the sample jarwith the leaves. The entire sample was preserved with 10% formalin. All macroinvertebrateswere removed from leafpack samples at the Environmental Services Program biology lab with adissecting microscope at 10X magnification. Specimens were preserved in glass vials containing80% ethanol. All specimens were identified to taxonomic levels described in Standard OperatingProcedure MDNR-WQMS-209, Taxonomic Levels for Macroinvertebrate Identifications.
Four standard metrics: Taxa Richness (TR), Ephemeroptera, Plecoptera, Trichoptera Taxa(EPTT), Biotic Index (BI), and the Shannon Diversity Index (SDI) were calculated for eachreplicate leafpack. Additional metrics, such as Percent EPT Relative Abundance, PercentDominant (5) taxa, and Percent Clingers were also employed to discern differences in taxabetween test and control stations.
Macroinvertebrate data collected at each sampling station were analyzed in two ways. First, alongitudinal comparison between the five sample reaches of the North Fork of the Spring Riverwas made. Secondly, the data from the North Fork of the Spring River was compared to datacollected from the control stations. Macroinvertebrate biological metric data that met theassumptions of parametric tests were analyzed using the one way analysis of variance (ANOVA)and Tukey’s multiple comparison tests. Biological metric data that violated the assumptions ofparametric tests were analyzed using the Kruskal-Wallis ANOVA and Dunn’s multiplecomparison tests.

Biological Assessment StudyLower North Fork of the Spring River2004Page 7
2.4.2 Physicochemical Collection and AnalysisResults are shown from physicochemical collections and analyses during the study (Tables 6 and7). Physicochemical samples collected during the study were: pH, temperature, conductivity,dissolved oxygen, discharge, turbidity, hardness, ammonia-N, nitrate/nitrite-N, Total KjeldahlNitrogen (TKN), chloride, and total phosphorus. Temperature, pH, conductivity, dissolvedoxygen, and discharge measurements were conducted in the field.
All samples were collected per MDNR-FSS-001, Required/Recommended Containers, Volumes,Preservatives, Holding Times, and Special Sampling Considerations (MDNR 2003e). Sampleswere kept on ice until they were delivered to the ESP laboratory. The WQMS measuredturbidity in the WQMS biology laboratory and all other samples were delivered to the ESPChemical Analysis Section (CAS) for analyses.
Results of water quality analyses were compared to Water Quality Standards (MDNR 2000).The study reach of North Fork of the Spring River is classified as a class “C” stream withdesignated use of general warm-water fishery (GWWF). Waters designated as GWWF “allowthe maintenance of a wide variety of warm-water biota, including naturally reproducingrecreationally important fish species”. Standards for aquatic life protection for GWWF in theWater Quality Standards are based on the rate of exposure (chronic and acute) for variouspollutants.
2.4.3 DischargeStream flow was measured using a Marsh-McBirney Flow Meter at each station and dischargewas calculated as cubic feet per second (cfs). Methodology was in accordance with StandardOperating Procedure MDNR-WQMS 113, Flow Measurement in Open Channels (MDNR2003d).
2.5 Data AnalysisThe physicochemical data were examined by parameter to identify stations that had elevatedlevels that were outliers or above Missouri Water Quality Standards (MDNR 2000). Samplingstations that had elevated levels of certain variables were then discussed with possible influencesbeing identified.
2.6 Quality ControlQuality control was used as stated in the various MDNR Project Procedures and StandardOperating Procedures. A random number of processed macroinvertebrate collections wererechecked for missed specimens.
3.0 Results and AnalysisThree areas of interest were used to assess the Lower North Fork of the Spring River. Thesewere the stream habitat assessment, biological assessment, and physicochemical water analysis.

Biological Assessment StudyLower North Fork of the Spring River2004Page 8
3.1 Habitat AssessmentTable 3 provides habitat assessment scores for North Fork of the Spring River test stations andthe control stations on Little Drywood Creek and Flat Rock Creek. Data was collected fromSeptember 20 to 22, 2004 with Carl Wakefield and Brian Nodine performing the scoring.According to the SHAPP guidance, for a study site to support a similar biological community,the total score of the study site should be 75 to 100 percent similar to the total score of areference or control station. Based on this assumption and the stream habitat assessment scores,all of the test stations should have biological communities that are comparable to the controlstations.
Some habitat category scores in the SHAPP, such as epifaunal substrate, sediment deposition,stream bank stability, stream bank vegetation protection, and riparian zone at the test and controlstations scored in the poor or marginal scoring categories (Table 4). These results indicated thatbenthic sediment deposition could be a problem at some of the sampling stations. All of the testand control stations scored in the marginal or poor category for epifaunal substrate and channelsinuosity. Bank vegetation cover also scored in the marginal or poor category for at least onebank at all of the test and control stations. Sediment deposition scored in the marginal or poorcategory at Test Stations #3 through #5 and control station Little Drywood Creek #1, but not atTest Stations #1 and #2 and control station Flat Rock Creek #2. An average of at least 60percent of the stream bottom was covered with fine sediment at Test Stations #3 and #5 andcontrol station Little Drywood Creek #1. Bank stability scored in the marginal or poor categoryfor at least one bank at North Fork of the Spring River #2 and #3 test stations and Flat RockCreek #2 control station, but not at the other sampling stations. The riparian zone scored in themarginal or poor category for at least one bank at Test Stations #1, #3, #4, and at both controlstations.
Table 3Habitat Assessment Scores for Control and Test Stations
September 20-22, 2004Transitional Reference
Stream/StationHabitatScore
Test Streams/Stations HabitatScore
% ofReference
Little Drywood Creek #1 112 North Fork Spring River #1 118 103Flat Rock Creek #2 118 North Fork Spring River #2 128 111
North Fork Spring River #3 113 98North Fork Spring River #4 114 99North Fork Spring River #5 116 101

Biological Assessment StudyLower North Fork of the Spring River2004Page 9
Table 4Predominant Category Habitat Values Estimated from Stream Habitat Assessments for the North Fork of the Spring River (NFSR)
Test Stations and Control Stations on Little Drywood Creek (LDW) and Flat Rock Creek (FRC). Mean values are listed inparentheses for habitat parameters in which a mean value was calculated. Habitat parameter categories ranged from I to IV with
category I = optimal, category II = suboptimal, category III = marginal, and category IV = poor.NFSR #1 NFSR #2 NFSR #3 NFSR #4 NFSR #5 LDW #1 FRC #2
Stream Habitat ParametersEpifaunal Substrate/Available Cover III (16.5) III (13.0) III (16.6) IV (9.1) III (14.2) IV (5.6) IV (5.9)Pool Substrate Characterization I I I III I II IPool Variability III I I II III III ISediment Deposition I (19.0) II (22.5) III (60.8) III (65.8) III (69.5) III (68.3) II (33.6)Channel Flow Status II II II II II II IIChannel Alteration I I I I I I IChannel Sinuosity I III III IV IV III IVBank Stability – Left Bank II IV I I II I IBank Stability – Right Bank I I IV I I I IVVegetative Protection – Left Bank IV (23.5) IV (19.3) IV (29.5) III (54.0) IV (22.8) III (61.3) III (66.5)Vegetative Protection – Right Bank IV (33.5) IV (29.0) IV (17.0) IV (38.2) III (51.5) III (58.5) IV (41.5)Riparian Zone Width – Left Bank III I I I I IV IRiparian Zone Width – Right Bank III I IV III I I IV

Biological Assessment StudyLower North Fork of the Spring River2004Page 10
3.2 Biological AssessmentBiological metrics were calculated and analyzed to determine if the test stations on the NorthFork of the Spring River were impaired. Metric data that met the assumptions of parametric testswas analyzed using a one-way analysis of variance (ANOVA) and Tukey multiple comparisontests. Data that violated the assumptions of parametric tests was analyzed using the non-parametric Kruskal-Wallis ANOVA on Ranks and Dunn’s multiple comparison tests.
3.2.1 Standard MetricsStandard metrics are the four primary metrics (TR, EPTT, BI, and SDI) used to calculated theStream Condition Index (SCI) in the Semi-quantitative Macroinvertebrate Stream BioassessmentProject Procedure (MDNR 2003b).
3.2.1.1 Taxa Richness (TR)Mean TR ranged from 16.7 at North Fork of the Spring River #5 (NFSR #5) to 28.9 at NorthFork of the Spring River #1 (NFSR #1) (Table 5 and Figure 2). Taxa richness at North Fork ofthe Spring River #1 (NFSR #1) was significantly higher than Flat Rock Creek #2 (FRC #2) andTest Stations #2, #3, and #5 on the North Fork of the Spring River (One-Way ANOVA, P <0.001; Tukey Multiple Comparison Test, P < 0.05). Taxa richness at Little Drywood Creek #1(LDW #1) and North Fork of the Spring River #4 (NFSR #4) was also significantly higher thanat North Fork of the Spring River #5 (NFSR #5).
3.2.1.2 EPT Taxa (EPTT)Mean EPT taxa ranged from 3.8 at NFSR #5 to 8.0 at NFSR #1 (Table 5 and Figure 3). EPTtaxa were significantly higher at NFSR #1 than at the other sampling stations. Additionally, EPTtaxa at FRC #2 were significantly higher than at NFSR #5 (One-Way ANOVA, P < 0.001;Tukey Multiple Comparison Test, P < 0.05).
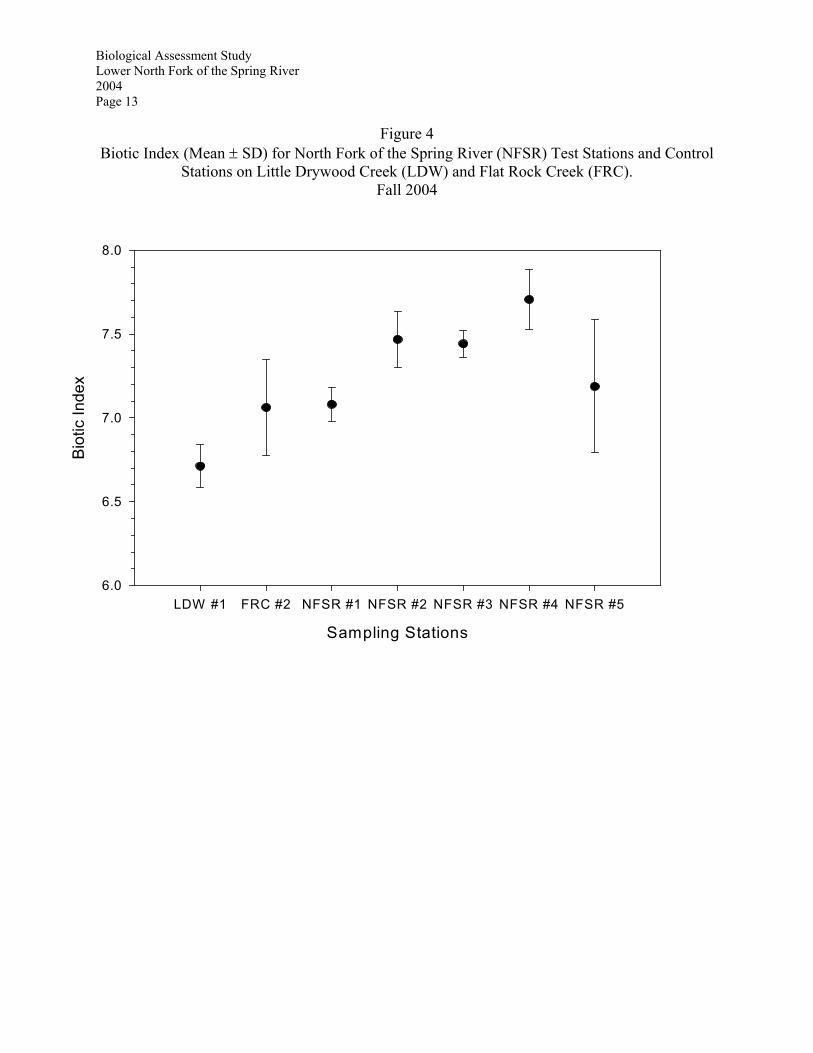
3.2.1.3 Biotic Index (BI)Mean BI ranged from 6.7 at LDW #1 to 7.7 at NFSR #4 (Table 5 and Figure 4).Biotic Index was significantly lower at LDW #1 than at NFSR Test Stations #2 through #4(Kruskal-Wallis One-Way ANOVA, P < 0.001; Dunn’s Multiple Comparison Test, P < 0.05).Biotic Index was also significantly lower at NFSR #1 and FRC #2 than at NFSR #4.
3.2.1.4 Shannon Diversity Index (SDI)Mean SDI ranged from 1.9 at NFSR #2 to 2.6 at NFSR #1 (Table 5 and Figure 5). ShannonDiversity Index was significantly higher at NFSR #1 than at NFSR Test Stations #2, #3, and #5(Kruskal-Wallis One-Way ANOVA, P < 0.001; Dunn’s Multiple Comparison Test, P < 0.05).Shannon Diversity Index was also significantly higher at FRC #2 than at NFSR Test Station #3.

Biological Assessment StudyLower North Fork of the Spring River2004Page 11
Figure 2Taxa Richness (Mean ± SD) for North Fork of the Spring River (NFSR) Test Stations and
Control Stations on Little Drywood Creek (LDW) and Flat Rock Creek (FRC).Fall 2004
Sam pling Stations
LDW #1 FRC #2 NFSR #1 NFSR #2 NFSR #3 NFSR #4 NFSR #5
Taxa
Ric
hnes
s
15
20
25
30
35

Biological Assessment StudyLower North Fork of the Spring River2004Page 12
Figure 3EPT Taxa (Mean ± SD) for North Fork of the Spring River (NFSR) Test Stations and Control
Stations on Little Drywood Creek (LDW) and Flat Rock Creek (FRC).Fall 2004
Sampling Stations
LDW #1 FRC #2 NFSR #1 NFSR #2 NFSR #3 NFSR #4 NFSR #5
EP
T Ta
xa
0
2
4
6
8
10
Biological Assessment StudyLower North Fork of the Spring River2004Page 13
Figure 4Biotic Index (Mean ± SD) for North Fork of the Spring River (NFSR) Test Stations and Control
Stations on Little Drywood Creek (LDW) and Flat Rock Creek (FRC).Fall 2004
Sampling Stations
LDW #1 FRC #2 NFSR #1 NFSR #2 NFSR #3 NFSR #4 NFSR #5
Bio
tic In
dex
6.0
6.5
7.0
7.5
8.0

Biological Assessment StudyLower North Fork of the Spring River2004Page 14
Figure 5Shannon Diversity Index (Mean ± SD) for North Fork of the Spring River (NFSR) Test Stations
and Control Stations on Little Drywood Creek (LDW) and Flat Rock Creek (FRC).Fall 2004
3.2.2. Secondary MetricsIn addition to standard metrics, secondary metrics were used to help determine impairment onNFSR test stations. The secondary metrics used in this study include percent EPT relativeabundance, percent dominant (5) taxa, and percent clingers. These metrics have either beenproposed as secondary metrics for the Semi-quantitative Macroinvertebrate StreamBioassessment Project Procedure (MDNR 2003b) or are currently being used by other agencies,such as the Kentucky Department of Environmental Protection’s MacroinvertebrateBioassessment Index (Kentucky Division of Water 2003).
3.2.2.1 Percent EPT Relative AbundanceMean percent EPT relative abundance ranged from 13.9 at NFSR #3 to 49.4 at LDW #1 (Table 5and Figure 6). Percent EPT taxa at LDW #1 were significantly higher than NFSR #3 through #5
Sampling Stations
LDW #1 FRC #2 NFSR #1 NFSR #2 NFSR #3 NFSR #4 NFSR #5
Sha
nnon
Div
ersi
ty In
dex
1.0
1.5
2.0
2.5
3.0

Biological Assessment StudyLower North Fork of the Spring River2004Page 15
and control station FRC #2 (One-Way ANOVA, P < 0.001; Tukey Multiple Comparison Test, P< 0.05). NFSR #1 and #2 were also significantly higher than NFSR #3 and NFSR #4. Thismetric was dominated by the mayfly taxa Stenacron at all sampling stations.
Figure 6Percent EPT Relative Abundance (Mean ± SD) for North Fork of the Spring River (NFSR) Test
Stations and Control Stations on Little Drywood Creek (LDW) and Flat Rock Creek (FRC).Fall 2004
3.2.2.2 Percent Dominant (5) TaxaThis metric measures the proportion of a macroinvertebrate sample that is made up of the fivemost abundant taxa and is expected to increase with increasing water quality impairment. Meanpercent dominant (5) taxa ranged from 65.2 at NFSR #1 to 83.0 at NFSR #2 (Table 5 and Figure7). NFSR #1 was significantly lower than all other sampling stations except FRC #2 (One-WayANOVA, P < 0.001; Tukey Multiple Comparison Test, P < 0.05). FRC #2 was also significantlylower than NFSR Test Stations #2 through #5.
Sampling Stations
LDW #1 FRC #2 NFSR #1 NFSR #2 NFSR #3 NFSR #4 NFSR #5
% E
PT
0
5
10
15
20
25
30
35
40
45
50
55
60
65

Biological Assessment StudyLower North Fork of the Spring River2004Page 16
Figure 7Percent Dominant (5) Taxa (Mean ± SD) for North Fork of the Spring River (NFSR) Test
Stations and Control Stations on Little Drywood Creek (LDW) and Flat Rock Creek (FRC).Fall 2004
3.2.2.3 Percent ClingersThis metric measures the proportion of macroinvertebrates that cling to hard, silt-free substratesand metric values should decrease with increasing amounts of fine sediment covering the streambottom. Mean percent clingers ranged from 14.5 at NFSR #3 to 43.3 at NFSR #2 (Table 5 andFigure 8). Percent clingers at LDW #1 and NFSR #2 were significantly higher than the FRC #2control station and NFSR Test Stations #3 and #4 (One-Way ANOVA, P < 0.001; TukeyMultiple Comparison Test, P < 0.05). Percent clingers at NFSR #1 were also significantlyhigher than at NFSR #3.
Sam pling Station
LDW #1 FRC #2 NFSR #1 NFSR #2 NFSR #3 NFSR #4 NFSR #5
% D
omin
ant (
5)
60
70
80
90

Biological Assessment StudyLower North Fork of the Spring River2004Page 17
Figure 8Percent Clingers (Mean ± SD) for North Fork of the Spring River (NFSR) Test Stations and
Control Stations on Little Drywood Creek (LDW) and Flat Rock Creek (FRC).Fall 2004
Sampling Stations
LDW #1 FRC #2 NFSR #1 NFSR #2 NFSR #3 NFSR #4 NFSR #5
% C
linge
rs
0
10
20
30
40
50
60
70

Biological Assessment StudyLower North Fork of the Spring River2004Page 18
Table 5Standard and Secondary Biological Metric Values (Mean ± SD) Calculated for North Fork of the Spring River (NFSR) Test Stations
and Control Stations on Little Drywood Creek (LDW) and Flat Rock Creek (FRC)NFSR #1 NFSR #2 NFSR #3 NFSR #4 NFSR #5 LDW #1 FRC #2
Standard MetricsTaxa Richness 28.9 ± 3.3 22.0 ± 6.2 22.1 ± 3.7 23.8 ± 3.1 16.7 ± 3.1 25.6 ± 5.3 22.3 ± 2.7EPT Taxa 8.0 ± 1.0 4.9 ± 1.4 4.7 ± 1.3 4.4 ± 1.0 3.8 ± 1.1 5.4 ± 1.6 5.7 ± 1.1Biotic Index 7.1 ± 0.1 7.5 ± 0.2 7.4 ± 0.1 7.7 ± 0.2 7.2 ± 0.4 6.7 ± 0.1 7.1 ± 0.3Shannon Diversity Index 2.6 ± 0.1 1.9 ± 0.4 2.0 ± 0.2 2.2 ± 0.2 2.1 ± 0.3 2.1 ± 0.2 2.4 ± 0.2
Secondary Metrics% EPT 38.6 ± 13.9 36.9 ± 19.3 13.9 ± 5.6 17.7 ± 7.7 28.2 ± 12.2 49.4 ± 5.9 26.4 ± 13.1% Dominant (5 taxa) 65.2 ± 4.8 83.0 ± 6.9 80.4 ± 4.5 80.6 ± 3.9 81.8 ± 5.7 76.9 ± 2.9 69.5 ± 7.7% Clingers 37.2 ± 15.0 43.3 ± 19.1 14.5 ± 6.2 21.6 ± 5.8 33.0 ± 12.0 43.1 ± 6.9 21.9 ± 11.0

Biological Assessment StudyLower North Fork of the Spring River2004Page 19
3.2.3 Macroinvertebrate Percent and Community CompositionPercent composition for the five dominant macroinvertebrate families and Functional FeedingGroups were determined for each sampling station and are presented in Table 6. Stenacron, themost abundant EPT taxa, was more abundant at LDW #1 and much higher than at FRC #2,NFSR #3, and NFSR #4. Hyalella azteca, a tolerant amphipod with a biotic index of 7.9, wasvery abundant at NFSR #4, but was low in numbers at the other sampling stations.Dicrotendipes was the most abundant chironomid taxa found at NFSR #2 through #5, but it wasmuch lower at NFSR #1 and the two control stations. Ablabesmyia, Glyptotendipes,Phaenopsectra, Stenochironomus, Tanytarsus, Thienemannimyia group, and Tribelos werechironomid taxa that were common at some of the sampling stations. Glyptotendipes was thesecond most abundant chironomid at NFSR #4 and was also abundant at NFSR #2 and FRC #2.Tribelos was the second most abundant chironomid taxa at NFSR #3 through #5 and at FRC #2.Tanytarsus (biotic index of 6.7) was more abundant at NFSR #1 and FRC #2 than the othersampling stations. Stenochironmus was the second most abundant taxa at LDW #1 and muchmore abundant than the other sampling stations.
The analysis of the relative abundance of Functional Feeding Groups showed that collector-filters were lower and scrapers were higher at LDW #1 than the other sampling stations (Table6). Mean collector-filter values ranged from 9.0 at LDW #1 to 60.2 at NFSR #3 and meanscraper values ranged from 9.7 at NFSR #3 to 46.4 at LDW #1. Dicrotendipes was the mostabundant collector-filter taxa and Stenacron was the most abundant scraper taxa. Shredders weremuch more abundant at LDW #1 than the other sampling stations except NFSR #4. Meanshredder values ranged from 5.3 at NFSR #3 and NFSR #5 to 20.4 at LDW #1. The tolerantGlyptotendipes made up most of the shredders at NFSR #4 while the less tolerantStenochironomus made up most of the shredders at LDW #1. Predators were more abundant atFRC #2, NFSR #1, and LDW #1 than the other sampling stations. Mean predator values rangedfrom 4.4 at NFSR #2 to 16.7 at FRC #2. Tanypod chironomids like Thienemannimyia Groupand Ablabesmyia made up a large portion of predators found at each sampling station.
3.2.4 Physicochemical WaterPhysicochemical results are arranged to demonstrate trends of certain variables that may identifyimpact sources to the North Fork of the Spring River. Results can be found in Tables 7 and 8 forresults of samples and field measurements collected during leafpack deployment, stream habitatassessment, and leafpack retrieval. Results for discharge, ammonia-N, nitrate + nitrite-N, TKN,total phosphorus, and dissolved oxygen are described in this section.
3.2.4.1 DischargeDischarge during leafpack deployment at the North Fork of the Spring River test stations rangedfrom 1.45 cfs at NFSR #5 to 6.10 cfs at NFSR #1 (Table 7). Discharge was 1.76 cfs at LDW #1control station and 0.02 cfs at FRC #2 control station. Based on field observations, dischargewas much lower during later stream visits when stream habitat assessments were conducted andduring leafpack retrieval, even though discharge was not measured.

Biological Assessment StudyLower North Fork of the Spring River2004Page 20
Table 6Dominant Taxa and Functional Feeding Group Values (Mean ± SD) for North Fork of the Spring River (NFSR) Test Stations andControl Stations on Little Drywood Creek (LDW) and Flat Rock Creek (FRC). Values in bold are the five most dominant taxa for
each sampling station.NFSR #1 NFSR #2 NFSR #3 NFSR #4 NFSR #5 LDW #1 FRC #2
Percent DominantMacroinvertebrate TaxaStenacron 21.1 ± 9.4 32.3 ± 19.5 8.1 ± 4.5 15.1 ± 7.1 22.3 ± 11.1 39.9 ± 6.6 8.8 ± 7.1Tanytarsus 15.0 ± 10.0 5.8 ± 1.2 7.9 ± 2.1 3.0 ± 2.0 3.7 ± 2.6 1.7 ± 1.3 19.9 ± 10.7Dicrotendipes 9.5 ± 3.6 27.8 ± 20.5 48.4 ± 6.7 21.0 ± 9.0 26.7 ± 15.6 6.3 ± 2.8 5.8 ± 2.5Thienemannimyia Group 6.0 ± 2.5 0.4 ± 0.3 2.0 ± 1.4 1.7 ± 1.2 2.4 ± 2.1 5.5 ± 2.7 6.4 ± 5.8Ablabesmyia 5.0 ± 1.3 1.6 ± 1.2 4.5 ± 1.0 1.5 ± 1.3 2.7 ± 1.1 3.0 ± 1.5 2.6 ± 2.3Glyptotendipes 0.6 ± 0.5 9.5 ± 3.1 2.7 ± 1.6 15.9 ± 4.8 2.6 ± 1.8 0.6 ± 0.9 9.9 ± 3.8Paratanytarsus 3.0 ± 3.4 6.6 ± 0.8 2.4 ± 1.4 2.6 ± 1.9 3.8 ± 1.8 1.2 ± 0.8 0.3 ± 0.5Tribelos 3.0 ± 3.3 0.5 ± 0.6 9.7 ± 3.4 7.1 ± 7.1 12.3 ± 9.8 1.4 ± 0.9 11.8 ± 9.9Hyalella azteca 2.9 ± 3.3 0.4 ± 0.7 0.1 ± 0.2 18.6 ± 12.6 0.3 ± 0.5 0.5 ± 0.7 0.1 ± 0.3Phaenopsectra 1.0 ± 1.2 1.7 ± 0.8 1.3 ± 0.6 0.4 ± 0.4 6.0 ±4.3 3.6 ± 1.9 1.8 ± 3.5Stenochironomus 1.2 ± 1.1 1.3 ± 1.8 0.8 ± 0.5 0.1 ± 0.2 0.5 ±1.3 18.9 ± 3.0 1.8 ± 1.7Leptophlebiidae 0.4 ± 0.4 0.4 ± 0.5 0.1 ± 0.2 0.2 ± 0.2 1.7 ± 1.9 4.4 ± 2.4 2.7 ± 4.0Cyrnellus fraternus 4.0 ± 3.3 2.3 ± 3.2 2.6 ± 2.2 0.8 ± 1.0 0.1 ± 0.3 0.2 ± 0.5 7.8 ± 8.2
Percent Functional FeedingGroupsCollector-Filters 30.9 ± 11.2 36.9 ± 21.9 60.2 ± 3.8 27.9 ± 8.2 34.2 ± 14.7 9.0 ± 4.1 36.0 ± 10.3Collector-Gathers 18.1 ± 4.5 10.5 ± 3.0 16.3 ± 3.2 34.0 ± 10.8 23.3 ± 10.0 13.2 ± 3.4 19.4 ± 7.8Scrapers 29.5 ± 12.2 36.4 ± 20.9 9.7 ± 4.4 16.1 ± 6.8 30.7 ± 13.9 46.4 ± 5.8 17.4 ± 10.9Shredders 6.9 ± 4.0 11.5 ± 3.2 5.3 ± 1.6 17.2 ± 5.3 5.3 ± 3.4 20.4 ± 4.0 12.1 ± 4.7Predators 14.2 ± 3.8 4.4 ± 2.3 8.4 ± 2.1 4.8 ± 2.5 6.3 ± 3.7 10.4 ± 3.7 16.7 ± 6.7

Biological Assessment StudyLower North Fork of the Spring River2004Page 21
3.2.4.2 NutrientsAmmonia-N, TKN, and total phosphorous were elevated at NFSR #4 Test Station. Nitrate +nitrite was also slightly elevated at NFSR #1 through #3.
3.2.4.2.1 Ammonia-NAmmonia-N was 4.22 mg/L (5.06 mg/L when converted to total ammonia) at NFSR #4 TestStation (Table 7). This value was higher than the chronic value (1.6 mg/L) for total ammonia inthe Water Quality Standards for the General Warm Water Fishery (GWWF) classification(MDNR 2000). Ammonia-N values at the other sample stations were well below Water QualityStandards.
3.2.4.2.2 Nitrate + Nitrite-NNitrate + nitrite-N ranged from 0.04 mg/L at Flat Rock Creek #2 to 0.80 mg/L at NFSR #1(Table 7). Nitrate + nitrite-N values at NFSR #1 through #3 were slightly elevated compared tothe other sampling stations and normal reference conditions for nitrate + nitrite-N, although thereare no water quality standards for nitrate + nitrite-N in the Missouri Water Quality Standards(MDNR 2000) for the protection of aquatic life designation.
3.2.4.2.3 TKNTKN was 5.90 mg/L at NFSR #4 and 1.54 mg/L at NFSR #3, which was much higher thanvalues at other sampling stations and normal reference conditions for TKN (Table 7). TKNranged from 0.62 mg/L to 0.97 mg/L at the other sampling stations.
3.2.4.2.4 Total PhosphorusTotal phosphorus had a slightly elevated value of 0.88 mg/L at NFSR #4 (Table 7). This valuewas higher than other sample stations and normal reference conditions for total phosphorus,although there are no water quality standards for total phosphorus in the Missouri Water QualityStandards (MDNR 2000). Total phosphorus ranged from 0.06 mg/L to 0.14 mg/L at the othersample stations.
3.2.4.3 Dissolved OxygenDissolved oxygen was consistently low at all of the test stations of North Fork of the SpringRiver #4 during leafpack deployment and when stream habitat assessments were conducted inmid September (Tables 7 and 8). Dissolved oxygen was slightly above or below 5.0 mg/L, theminimum value allowed in the Missouri Water Quality Standards (MDNR 2000) for theprotection of aquatic life designation, at the North Fork of the Spring River test stations duringthese time periods. Dissolved oxygen was above 5.0 mg/L during leafpack retrieval except atNFSR #2 and NFSR #3 (Table 7). Lower stream water temperature during this time period mayhave increased dissolved oxygen at most of the sampling stations.

Biological Assessment StudyLower North Fork of the Spring River2004Page 22
Table 7Physicochemical Variables for the North Fork of the Spring River Study Collected from August 30, 2004 to September 1, 2004
During Leafpack DeploymentUnits mg/L unless otherwise noted.
Variable-Station
N. Fk.SpringRiver #1,Test
N. Fk.SpringRiver #2,Test
N. Fk.SpringRiver #3,Test
N. Fk.SpringRiver #4,Test
N. Fk.SpringRiver #5,Test
LittleDrywoodCreek #1,Control
Flat RockCreek #2,Control
Sample Number 04-11067 04-11066 04-11065 04-11064 04-11063 04-11068 04-11070Sample Date 08/31/2004 08/31/2004 08/31/2005 08/30/2004 08/30/2004 09/01/2004 09/01/2004Sample Time 1115 1415 1605 1510 1310 1640 1315pH (Units) 7.62 7.66 7.50 7.34 7.70 7.62 8.00Temperature (C0) 22.5 24.0 24.0 24.0 23.5 23.5 27.5Conductivity (uS) 363 335 339 445 268 325 352Dissolved O2 4.95 4.91 3.74 3.38 5.11 5.69 8.04Discharge (cfs) 6.10 4.70 3.60 3.11 1.45 1.76 0.02Turbidity (NTUs) 10.7 22.3 11.7 14.2 15.3 30.6 9.20Ammonia-N 0.13 0.03 0.41 4.22 0.03 0.03 0.03Nitrate/Nitrite-N 0.80 0.62 0.75 0.14 0.14 0.07 0.04TKN 0.91 0.97 1.54 5.90 0.81 0.63 0.62Chloride 25.6 21.5 23.9 31.4 17.7 9.63 10.1Total Phosphorus 0.11 0.13 0.14 0.88 0.13 0.06 0.08

Biological Assessment StudyLower North Fork of the Spring River2004Page 23
Table 8Physicochemical Field Measurements for the North Fork of the Spring River Study Collected During (a) Stream Habitat Assessments
(September 20-22, 2004) and at (b) Leafpack Retrieval (October 4-6, 2004)Units mg/L unless otherwise noted.
Variable-Station
N. Fk.SpringRiver #1,Test
N. Fk.SpringRiver #2,Test
N. Fk.SpringRiver #3,Test
N. Fk.SpringRiver #4,Test
N. Fk.SpringRiver #5,Test
LittleDrywoodCreek #1,Control
Flat RockCreek #2,Control
(a) Field Measurements Collected During Stream Habitat AssessmentsSample Date 09/22/2004 09/22/2004 09/21/2004 09/20/2004 09/20/2204 09/20/2004 09/21/2004Sample Time 0955 1135 1635 1625 1430 1200 1320pH (Units) 7.51 7.44 7.75 7.80 7.60 7.36 8.30Conductivity (uS) 376 382 348 389 285 348 328Dissolved O2 5.25 5.05 3.41 5.07 4.65 2.54 8.40Temperature (C0) 19.0 21.0 21.8 22.4 24.0 19.0 21.5
(b) Field Measurements Collected During Leafpack RetrievalSample Date 10/05/2004 10/06/2004 10/04/2004 10/04/2004 10/04/2004 10/06/2004 10/05/2004Sample Time 1555 1005 1655 1430 1315 12.1235 1205pH (Units) 8.30 7.41 7.51 7.74 7.70 7.47 7.84Conductivity (uS) 414 474 362 515 290 383 354Dissolved O2 12.40 4.15 4.62 5.87 7.62 5.48 5.65Temperature (C0) 18.9 14.3 15.5 16.3 17.8 13.0 14.0
Biological Assessment StudyLower North Fork of the Spring River2004Page 24
4.0 DiscussionThe discussion describes possible effects of stream habitat, land use, ecoregion, andphysicochemical conditions on the biological metric scores and the macroinvertebratecommunity composition.
4.1 Habitat AssessmentTotal stream habitat assessment scores suggest that the test stations on NFSR should becomparable to the control stations on LDW and FRC in their ability to support a similar qualitymacroinvertebrate community (Table 3). However, some habitat categories of the SHAPP suchas epifaunal substrate/available cover, sediment deposition, channel sinuosity, and bankvegetation protection scored either in the marginal or poor category at some of the NFSR teststations and at the control stations (Table 4). The low scores for epifaunal substrate andsediment deposition scores, especially at NFSR stations #3 through #5 and LDW #1, indicatedthat greater than 60 percent of the stream bottom is covered by fine sediment and good epifaunalsubstrate was low in abundance. Sediment deposition was much lower at NFSR #1, NFSR #2,and FRC #2 even though epifaunal substrate was still very low at FRC #2. Personal observationsduring sampling also indicated fine sediment depth on the stream bottom was much higher atNFSR #3 and NFSR #4 than the other sampling stations. At Test Station #2, the NFSR begins toenter into the Ozark highlands ecoregion from the central irregular plains ecoregion (Chapman etal., 2002; Figure 9) with the NFSR changing from a glide/pool stream to a riffle/pool stream,possibly accounting for some of the differences in epifaunal substrate and sediment deposition.Both LDW and FRC are located in the central irregular plains ecoregion, but FRC has physicalcharacteristics (rock outcroppings and coarse substrate) more like NFSR #1 and #2 than the otherNFSR test stations and LDW #1 control station. The change in physical habitat at the lowerstations on the NFSR may have been one of the primary factors leading to higher metric valuesat NFSR #1, with some of the metrics like taxa richness, EPT taxa, and SDI having higher valuesthan at the control stations.
4.2 Possible Effects of Land Use on SedimentationRow crops make up a much larger percentage and forest cover make up a much smallerpercentage of the land use at the NFSR test stations than the entire Ozark/Elk/Spring EDU(Table 2). Row crops, except NFSR #1, also made up a higher percentage and forest cover madeup a lower percentage of land use compared to LDW #1, a control station located within thebiological criteria reference reach and located in the Osage/Plains EDU. The percentage ofgrasslands in the lower NFSR watershed was similar, except NFSR #1, to the entireOzark/Elk/Spring EDU and the LDW #1 sampling station. The higher percentage of row cropsand lower percentage of forest cover at NFSR sampling stations suggests increased runoff andaltered stream hydrology, resulting in increased sheet and bank erosion. Increased runoff alsohas the potential to carry more contaminants, such as fertilizer and pesticides from farm fields,leading to water quality problems and effects to the biotic community.
4.3 Transitional Nature of North Fork of the Spring RiverNorth Fork of the Spring River is a transitional stream that flows through both the OzarkHighlands and Central Irregular Plains ecoregions (Figure 9). The upper section near GoldenCity and the lower section starting near the Jasper County line has physical characteristics of

Biological Assessment StudyLower North Fork of the Spring River2004Page 25
both Ozark and plains streams with short riffles and very long pools with some woody debris.The section of stream starting near Lamar and ending near the Barton/Jasper County line hasphysical characteristics like plains streams in the Osage/Plains EDU with woody debris and finesediment being abundant at some stream reaches.
Most of the sampling stations for the Upper North Fork of the Spring River bioassessment study(MDNR 2004) were located in or near the Ozark Highlands ecoregion. These stations scoredpoorly with SCI scores ranging from 10 to 14 against biological criteria calculated from twotransitional reference streams (Horse and Cedar Creeks in the Ozark/Osage EDU). Theexception was Station #1 with an SCI score of 18 during the fall sampling season.Macroinvertebrate taxa with high biotic index values and tolerant of low dissolved oxygen levels(such as Oligochaeta, Chironomus, Chaoborus, and Physella) were more abundant in NFSR thanin Cedar Creek and Horse Creek, especially during the fall sampling season. EPT taxa duringboth sampling seasons were also generally higher at the two transitional reference streams thanthe test stations on NFSR.
Leafpack NFSR Stations #3 through #5 were located in the Central Irregular Plains ecoregionwhile Stations #1 and #2 were located in the Ozark Highlands ecoregion for the Lower NorthFork of the Spring River bioassessment study. Stations #3 through #5 had physicalcharacteristics of streams found in the plains. Station #2 was located near the border between theCentral Irregular Plains and Ozark Highlands ecoregions and had characteristics of bothecoregions with long stagnant pools containing woody debris in part of the stream reach andriffle/runs present near rock outcroppings in another segment of the stream reach. Station #1 wasmore Ozark-like with rock outcroppings, well-defined riffles, and coarse substrate found in boththe riffle/run areas and pools.
The section of the NFSR that flows through the Ozark Highlands ecoregion is located in theSpringfield Plateau sub-ecoregion. The Springfield Plateau is an area of moderate topographythat has soils that are rocky and contain Mississippian-age limestone. This area has numerouskarst features that often allow connections between groundwater and surface flow. Streamslocated in the Ozark Highlands ecoregion normally have higher base flows than streams locatedin the Central Irregular Plains ecoregion because of the connection with groundwater. Thesection of the NFSR that flows through the Central Irregular Plains ecoregion is located in theCherokee Plains sub-ecoregion. This area is relatively flat in topography and has poorly drainedsoils made up of clay. There is little or no groundwater connection because of the clay soils,which cause base flow to be much lower for streams in the Cherokee Plains sub-ecoregioncompared to streams in the Springfield Plateau sub-ecoregion.
4.4 Macroinvertebrate Community Composition and Evaluation of Biological MetricsMacroinvertebrate taxa with high biotic index values were common at all NFSR samplingstations, but the most tolerant taxa like Dicrotendipes, Glyptotendipes, and Hyalella azteca wereless abundant at NFSR #1 and the two control stations. Dicrotendipes, a chironomid tolerant oflow dissolved oxygen and sediment, was very abundant from NFSR Test Stations #2 through #5,with much lower abundance at NFSR Test Station #1, LDW #1, and FRC #2. Members of thegenus Dicrotendipes usually inhabit sediments or Aufwuchs in standing or minimally flowing

Biological Assessment StudyLower North Fork of the Spring River2004Page 26
water and have a biotic index value of 7.9 (Wiederholm, 1983). Studies have found that twocommon species, Dicrotendipes neomodestus and Dicrotendipes nervosus, were common inareas of high organic pollution and low dissolved oxygen levels (Simpson and Bode, 1980).Stenacron, a tolerant EPT taxa (biotic index of 7.1), was the most abundant EPT taxa at allsampling stations, but was much lower in abundance at NFSR #3, NFSR #4, and FRC#2.Tribelos, which has a biotic index of 6.6 and has been documented to occur in littoral sedimentsof lakes and occurs in a wide range of ecological conditions in streams (Simpson and Bode,1980; Wiederholm, 1983), was abundant at NFSR Test Stations #3 through #5 and FRC #2.Glyptotendipes was found in high abundance at NFSR #2 and NFSR #4. The genus has a bioticindex of 8.5, generally occurs in detritus rich sediments of slow flowing rivers, and becomesabundant in areas of organic pollution (Simpson and Bode, 1980; Wiederholm, 1983). Hyalellaazteca, a tolerant amphipod, was very abundant at NFSR #4 but very low in abundance at theother sampling stations. Tanytarsus, a filter feeding Tanytarsini chironomid with a biotic indexof 6.7, and Cyrnellus fraternus, a filtering polycentropid caddisfly with a biotic index of 7.4,were much more abundant at NFSR #1 and FRC #2. The tribe Tanytarsini is considered to bethe most sensitive group of chironomids to pollution and is currently being used as a biologicalmetric in the state of Ohio (DeShon, 1995). Stenochironmus was the second most abundant taxaat LDW #1 and much more abundant than the other sampling stations. Stenochironmus areconsidered obligate miners of living and dead vegetation, including woody debris (Wiederholm,1983).
There was no significant difference for 5 of the 7 biological metrics between the control stations,LDW #1 and FRC #2 (Figures 2 through 8 and Appendix B). Two metrics, percent EPT relativeabundance and percent clingers, showed a significant difference between the control stations.The significant difference for these two metrics was mainly driven by the much higherabundance of the mayfly taxa Stenacron at LDW #1. These results indicated that FRC #2 wascomparable to LDW #1 for most of the metrics. The results at NFSR Test Stations #4 and #5showed that 4 of 7 metrics were significantly different compared to the results at either LDW #1or FRC #2. Taxa richness (TR) and percent EPT relative abundance were significantly differentfrom LDW #1 and EPTT and percent dominant (5) taxa were significantly different from FRC#2 at NFSR #5. At NFSR #4, BI was significantly different compared to both control stations,percent EPT relative abundance and percent clingers were significantly different compared toLDW #1, and percent dominant (5) taxa was significantly different compared to FRC #2. Theresults at NFSR #3 showed that 5 of 7 metrics were significantly different compared to eitherLDW #1 or FRC #2. Biotic index (BI), percent EPT relative abundance, and percent clingerswere significantly different compared to LDW #1 and SDI and percent dominant (5) taxa weresignificantly different compared to FRC #2 at NFSR #3. At NFSR #2, 2 of 7 metrics weresignificantly different compared to either LDW #1 or FRC #2. Biotic index (BI) wassignificantly different from LDW #1 and percent dominant (5) taxa was significantly differentfrom FRC #2 at NFSR #2. The results at NFSR #1 showed that 3 of 7 metrics had significantlyhigher values compared to either LDW #1 or FRC #2. The results at the NFSR test stationsindicate impairment at Stations #3 through #5 since at least 4 of 7 metrics were significantlydifferent compared to either LDW #1 or FRC #2. Test Station #2 showed some impairment, butthe metric results indicate that the NFSR was beginning to show improvement compared to theupstream stations, with only 2 of 7 metrics significantly different from the control stations.

Biological Assessment StudyLower North Fork of the Spring River2004Page 27
There was no indication of impairment at NFSR #1 since it had significantly higher values for 3metrics and was not significantly different for the other 4 metrics compared to the controlstations.
The results of BI, percent EPT relative abundance, and percent clingers metric values indicatedthat fine sediment could be impacting the macroinvertebrate community. Percent clingersmeasure the proportion of taxa that require hard substrate and should decrease with increasingfine sediment on the stream bottom. EPT taxa usually makes up a large percentage of clingers ina macroinvertebrate sample and a higher percentage of EPT taxa could indicate lower amounts offine sediment. Biotic index values are based on tolerance of taxa to organic pollution and not forsediment, but many of the dominant taxa with high biotic index values, like Dicrotendipes andGlyptotendipes, are also tolerant to sediment according to previous studies (Simpson and Bode,1980; Wiederholm, 1983).
4.5 Water Quality and Water Quantity ImpactsNorth Fork of the Spring River #4, located about 3.5 miles downstream of the Lamar WWTF,had elevated levels of ammonia-N, nitrate + nitrite-N, TKN, and total phosphorus (Table 7). Theammonia-N value of 4.22 mg/L was a chronic violation of the water quality standards. Waterquality was probably impacting the macroinvertebrate community at this station since the bioticindex was the highest and the macroinvertebrate community had high abundance of tolerant taxalike Hyalella azteca, Dicrotendipes, and Glyptotendipes. Other metrics like EPT taxa, percentEPT taxa, percent dominant (5) taxa, and percent clingers also performed poorly at NFSR #4.
Low stream discharge and low dissolved oxygen may have impacted the macroinvertebratecommunity at the NFSR test stations (Tables 7 and 8). Stream discharge during leafpackdeployment ranged from 1.45 cfs at NFSR #5 to 6.10 cfs at NFSR #1. Visual estimates ofstream discharge during the time period that the stream habitat assessments and leafpackretrieval were conducted indicated that discharge had decreased since leafpack deployment. Inthe Missouri Department of Natural Resources Water Quality Standards, the North Fork of theSpring River is listed as a class “C” stream. The low flow conditions and high watertemperatures during this study were two probable causes of the low dissolved oxygen that werepresent at all test stations. Dissolved oxygen was slightly above or below 5.0 mg/L, the waterquality standard for dissolved oxygen, at all of the NFSR test stations during leafpackdeployment and during the time period that the stream habitat assessments were conducted.Dissolved oxygen was extremely low at Test Station #3 (3.74 mg/L) and Test Station #4 (3.38mg/L) during leafpack deployment. At the time leafpacks were retrieved and processed, duringthe first week in October, dissolved oxygen levels were higher than 5.0 mg/L, except at NFSR #2and #3. The higher dissolved oxygen levels during this time period were probably caused bylower water temperatures since stream discharge was estimated to be lower at leafpack retrievalthan at leafpack deployment. The low values for many of the biological metrics and the highabundance of tolerant taxa like Dicrotendipes were probably caused by a combination of lowdissolved oxygen, higher levels of fine sediment covering the stream bottom, nutrient enrichmentfrom the Lamar WWTF, and non-point sources caused by surface runoff.

Biological Assessment StudyLower North Fork of the Spring River2004Page 28
Figure 9.Level III Ecoregion Map Showing Sampling Stations for the Upper North Fork of the Spring River Bioassessment Study Using
Biological Criteria Protocols and the Lower North Fork of the Spring River Study Using Leafpacks.

Biological Assessment StudyLower North Fork of the Spring River2004Page 29
5.0 ConclusionsLower biological metric values for at least 4 metrics at Test Stations #3 through #5 and for two metrics atTest Station #2 indicate the macroinvertebrate community was impaired at these stations (Table 5). Noneof the biological metrics indicated impairment at Test Station #1. The first null hypothesis that all of thetest stations would have a similar macroinvertebrate community was rejected since Station #1 had betterbiological metric values than the other test stations. The second null hypothesis that NFSR test stationswould not differ from the two control stream stations was rejected. The results of this study, except atTest Station #1, and the results from the Upper North Fork of the Spring River Bioassessment Study in theFall 2003 sampling season, except at Test Station #1, indicated that the macroinvertebrate community wasimpaired for the 303(d) listed stream reach.
The overall habitat scores indicated that the macroinvertebrate community should be fully supportingcompared to control stations (Table 3). But there was evidence that fine sediment was a possible cause ofimpairment from Lamar to the Barton/Jasper County line based on some of the habitat parameters likeepifaunal substrate and sediment deposition from the stream habitat assessment protocol and fieldobservations made while sampling (Table 4). The physical characteristics of Test Stations #3 through #5were prairie-like while Test Stations #1 and #2 were transitional in nature with characteristics of bothprairie and Ozark streams.
The land use in the NFSR watershed generally had a higher percentage of land in row crops and a lowerpercentage in forest cover than the sampling station on Little Drywood Creek (Table 2). The highpercentage of agriculture production in the NFSR watershed could lead to surface runoff problems duringlarge precipitation events. Water quality data showed that ammonia-N, TKN, and total phosphorus wereelevated at Test Station #4 and most likely originating from the Lamar WWTF. All of the test stations hadlow dissolved oxygen levels that were near or below 5.0 mg/L during leafpack deployment and during thetime period in which stream habitat assessments were performed. A variety of impacts that include lowdissolved oxygen levels, nutrient enrichment at Station #4, and possible elevated levels of benthic finesediment were most likely causing the high abundance of tolerant taxa like Dicrotendipes, Glyptotendipes,and Hyalella azteca at test stations.
6.0 Recommendations1. Recommend that the Missouri Department of Conservation, Resource Assessment and Monitoring
(RAM) program staff conduct a fish community study on the North Fork of the Spring River watershed.Use the fish Index of Biotic Integrity (IBI) and/or other metrics to determine if the fish communityindicates impairment similar to the macroinvertebrate community.
2. Conduct a sediment deposition and/or suspended sediment study on North Fork of the Spring River,Little Drywood Creek, Horse Creek, and Cedar Creek watersheds to determine if sedimentation is aproblem in the North Fork of the Spring River watershed. This would involve collectingmacroinvertebrates from four habitats (CS, NF, RM, SG) in the North Fork of the Spring River andestimating benthic sediment deposition and/or suspended sediment in the water column.
3. Conduct a water quality study on the entire watershed to determine the impacts of surface runoff onNorth Fork of the Spring River and its tributaries. This could determine if nutrients or other waterquality parameters are elevated after major rainfall events.

Biological Assessment StudyLower North Fork of the Spring River2004Page 30
7.0 Literature CitedChapman, S.S., J.M. Omernik, G.E. Griffith, W.A. Schroeder, T.A. Nigh, and T.F. Wilton. 2002.
Ecoregions of Iowa and Missouri (color poster with map, descriptive text, summary tables, andphotographs). Reston, Virginia, U.S. Geological Survey (maps scale 1:1,800,000).
DeShon, J.E. 1995. Development and Application of the Invertebrate Community Index (ICI). Pages 217-243 in W.S. Davis and T.P. Simon (editors). Biological Assessment and Criteria: Tools for WaterResource Planning and Decision Making. Lewis Publishers, Boca Raton, Florida.
Kentucky Division of Water (KDOW). 2003. The Kentucky Macroinvertebrate Bioassessment Index.Kentucky Department for Environmental Protection, Division of Water, Frankfort, Kentucky.
Missouri Department of Natural Resources. 2000. Rules of the Department of Natural Resources. CleanWater Commission, Water Quality Standards, 10 CSR, 20-7. Division of Environmental Quality,Water Pollution Control Program, Jefferson City, Missouri. pp. 136.
Missouri Department of Natural Resources. 2001. Taxonomic Levels for Macroinvertebrate Identification.MDNR-WQMS-209. Missouri Department of Natural Resources, Environmental ServicesProgram, P.O. Box 176, Jefferson City, Missouri 65102. 32 pp.
Missouri Department of Natural Resources. 2003a. Stream Habitat Assessment Project Procedure.MDNR-FSS-032. Missouri Department of Natural Resources, Environmental Services Program,P.O. Box 176, Jefferson City, Missouri 65102. 40 pp.
Missouri Department of Natural Resources. 2003b. Semi-quantitative Macroinvertebrate StreamBioassessment Project Procedure. MDNR-FSS-030. Missouri Department of Natural Resources,Environmental Services Program, P.O. Box 176, Jefferson City, Missouri 65102. 24 pp.
Missouri Department of Natural Resources. 2003c. Flow Measurements in Open Channels StandardOperating Procedure. MDNR-WQMS-113. Missouri Department of Natural Resources,Environmental Services Program, P.O. Box 176, Jefferson City, Missouri 65102. 9 pp.
Missouri Department of Natural Resources. 2003d. Required/Recommended Containers, Volumes,Preservatives, Holding Times, and Special Sampling Considerations Standard Operating Procedure.MDNR-FSS-001. Missouri Department of Natural Resources, Environmental Services Program,P.O. Box 176, Jefferson City, Missouri 65102. 21 pp.
Missouri Department of Natural Resources. 2004. Biological Assessment Study: Upper North Fork SpringRiver, Barton and Dade Counties. Missouri Department of Natural Resources, EnvironmentalServices Program, P.O. Box 176, Jefferson City, Missouri 65102. 34 pp.
Pflieger, W.L. 1989. Aquatic Community Classification System for Missouri. Missouri Department ofConservation Aquatic Series No. 19. 76 pp.

Biological Assessment StudyLower North Fork of the Spring River2004Page 31
Simpson, K.W. and R.W. Bode. 1980. Common Larvae of Chironomidae (Diptera) from NewYork State Streams and Rivers with Particular Reference to the Fauna of Artificial Substrates. NewYork State Museum Bulletin. 439:1-105.
USGS. 1994. Land Use/Land Cover Data. http://edcwww.cr.usgs.gov/products/landcover/lulc.html
Wiederholm, T. (Editor). 1983. Chironomidae of the Holarctic Region. Keys and Diagnoses. Part I. Larvae.Entomol. Scand. Suppl. 19:1-457.
Biological Assessment StudyLower North Fork of the Spring River2004Page 32
Submitted by: _______________________________________
Carl WakefieldEnvironmental Specialist IIIEnvironmental Services ProgramWater Quality Monitoring Section
Date: _______________________________________
Approved by: _______________________________________
Connie GiesingInterim DirectorEnvironmental Services Program
CG:cwt
c: Cindy Davies, Interim Regional Director, SWROJohn Ford, QAPP Project Manager, WPCP

Appendix A
Missouri Department of Natural ResourcesBioassessment Study Plan
Lower North Fork of the Spring RiverDade and Barton Counties
August 26, 2004

Missouri Department of Natural ResourcesBioassessment Study Proposal
Lower North Fork Spring River, Barton and Jasper CountiesAugust 26, 2004
Objectives
This study will assess the aquatic macroinvertebrate community in the North Fork Spring River fromLamar, Missouri to the approximate confluence of Dry Fork Creek located southeast of Jasper, Missouri.The North Fork Spring River within the study area is classified by the State of Missouri Water QualityStandards as a class “C” stream and this section has been placed on the 2002 303d list for sediment. Thestream originates in Barton and Dade counties near Golden City and flows through a predominately ruralarea in the Ozark/Elk/Spring Ecological Drainage Unit (EDU). The North Fork Spring River watersheddrains a landscape that is transitional in nature between Ozark and Plains ecological regions and in the pasthas been classified as a distinctly different aquatic faunal area than other drainage’s in Ozark/Elk SpringEDU (Pflieger, 1989). The lower North Fork Spring River study segment is a low gradient prairie streamwith steep banks, long pools, and few riffles. Since the stream study segment is uniquely prairie-like andwithin an EDU that has predominantly riffle/pool stream types, it will not be compared to streams from theOzark/Elk/Spring biocriteria database. Instead, leafpacks will be used to quantitatively compare the NorthFork Spring River against 2 Plains control streams. Due to the unique location and transitional nature ofthe study reach of North Fork Spring River, comparisons will be made with control streams from the OsageRiver and the Arkansas River drainages. Two control stations will be placed on Flat Rock Creek, atributary of the Neosho River, located in Neosho County, Kansas and one control station will be locatedwithin the reference reach of Little Drywood Creek (Plains/Osage EDU) in Vernon County, Missouri. Theobjectives of this study are to determine: 1) whether the aquatic macroinvertebrate community is beingimpacted by excessive amounts of sediment and 2) whether the aquatic macroinvertebrate community ofNorth Fork Spring River is impaired in comparison to the control stations.
Null Hypotheses
1) The macroinvertebrate community found in leafpacks will not differ significantly (P = 0.05) betweenlongitudinally separate reaches of North Fork Spring River.
2) The macroinvertebrate community found in leafpacks in the North Fork Spring River will not differsignificantly (P = 0.05) from similar sized control reaches on Flat Rock Creek and Little DrywoodCreek.
Background
The North Fork Spring River is a tributary of the Spring River system in southwestern Missouri that flowsthrough a transitional area that has features of both the Ozark and plains ecoregions. It is characterized bylong pools with short, rocky and gravelly riffles and the geology of the watershed contains beds of shale,sandstone and limestone (Pflieger, 1989). The goals of the study are to determine if the biologicalcommunity of this stream is being impaired by excessive amounts of sediment since this section of streamhas been placed on 2002 303d list.

Study Design
General: Five North Fork Spring River stations will be surveyed. The general locations are as follows: 1)upstream of 19th street in Lamar (SW1/4, Sec. 25, T32N, R31W); 2) upstream of SE 30th road (SE1/4, Sec.1, T31N, R31W; 3) upstream of highway 126 (SW1/4, Sec. 26, T31N, R31W; 4) downstream of SW 100th
road (NW1/4, Sec. 14, T30N, R31W); and 5) downstream of Redbud road (NE1/4, Sec. 32, T30N, R31W).Three control stations on Flat Rock Creek in Neosho County, Kansas and Little Drywood Creek in VernonCounty, Missouri will also be surveyed. The general locations are as follows: 1) Flat Rock Creek locateddownstream of highway 47 (NW1/4, Sec. 19, T29S, R21E); 2) Flat Rock Creek located upstream ofhighway 110th road (SE1/4, Sec. 7, T29S, R21E); and 3) Little Drywood Creek upstream of a unnamedcounty road (SE1/4, Sec. 30, T35N, R31W). Data from the control stations will be used to assess the teststations on the North Fork Spring River. A longitudinal comparison of the North Fork Spring Riversampling sites will also be made to try to determine if there are differences in macroinvertebratecommunity between test stations.
Each station will consist of a length approximately 20 times the average stream width as outlined in theSemi-quantitative Macroinvertebrate Stream Bioassessment Project Procedure (SMSBPP). To assesscomparability between sampling stations, stream discharge, habitat assessment and water chemistry will bedetermined during the macroinvertebrate surveys. Sampling will be conducted in fall of 2004 (September 1through October 1) and the spring of 2004 (March 1 through April 1).
Biological Sampling Methods: Macroinvertebrates will be quantitatively sampled by deploying 9 replicateleafpacks at each sample station. Leafpacks will be placed in the stream at three separate locations (3leafpacks per location) spread throughout the sample station on inside bends of pools with stream flowsless than 0.5 cubic feet per second (cfs). Leafpacks will be deployed at each of the sample stations aroundSeptember 1, 2004 and March 1, 2005. The leafpacks will be collected from the stream stations about amonth after the respective deployment.
Leafpacks are constructed of 30 X 21 cm pieces of polymesh netting containing a total of 10 leaves ofeastern cottonwood (Populus deltoides) and American sycamore (Platunus occidentalis). Since Americansycamore is more common in the riparian zone of the sample reaches of this study, approximately 70% ofleaves placed in the leafpacks will be of this species. Leaves will be collected, air-dried, pre-weighed to 7g (+/- 1 g), and stored in zip-lock bags until ready for use. Leafpacks will be constructed by placing leaveson top of half of the polymesh netting while the other half is folded over on top of leaves. The polymeshnetting will be tied together with nylon cord around the loose edges to enclosed leaves. The leafpacks willthen be stored in zip-lock bags until deployment.
A set of 3 leafpacks will be deployed in the stream by inserting a piece of rebar in the stream bottom nearthe bank’s edge and inserting another piece of rebar in the stream bottom downstream and about 10 to 15feet from the bank. A piece of 3/16 inch diameter nylon rope will then be attached around a tree near thebank, if available, then attached to the piece of rebar near the bank, and finally attached to the other pieceof rebar located in the stream. The nylon rope will be adjusted on the rebar so that it is at or near thewater’s surface and is as tight as possible. The three leafpacks will be spaced evenly along the nylon ropeand deployed about a foot below the water’s surface by attaching a piece #24 braided nylon twine to theleafpack and to the nylon rope that is at the water’s surface. A snap-on clip will be clipped on the bottom

of the leafpack to weight the leafpack down so that it will not float to the surface of the water. Thisprocedure will be done at three locations spread throughout the sample reach of each sample station.
At retrieval the leafpacks will be removed from the stream by holding a kick net under the leafpack whilecutting them loose from their place of attachment. They will then be placed in a plastic wash pan, thenylon cord will be cut away from the polymesh netting, and the leaves will be pulled from the netting andplaced in a sample jar. A scrub brush and deionized (DI) water will be used to clean debris from thepolymesh netting and the material will be rinsed into the sample jar with the leaves. The entire sample willbe preserved with 10% formalin. Macroinvertebrates will be removed from leafpack samples at theEnvironmental Services Program biology lab with a dissecting microscope at 10X magnification.Specimens will be preserved in glass vials containing 80% ethanol. All specimens will be identified totaxonomic levels described in Standard Operating Procedure MDNR-WQMS-209 (Taxonomic Levels forMacroinvertebrate Identifications).
Habitat Sampling Methods: Stream discharge will be measured at each sampling station with a Marsh-McBirney flow meter according to MDNR-WQMS-113. Stream habitat assessments will also beconducted within each study area according to the guidelines of the Stream Habitat Assessment ProjectProcedure.
Water Quality Sampling Methods: Water samples from all sampling stations will be analyzed at the ESPlaboratory chloride, TKN, ammonia nitrogen, nitrite plus nitrate nitrogen, total phosphorus, and turbidity.Field analyses will include pH, conductivity, temperature and dissolved oxygen.
Laboratory Methods: All macroinvertebrate samples will be processed and identified according to theguidelines of MDNR-WQMS-209. Turbidity samples will be analyzed at the MDNR biological laboratory.
Data Analyses: Four standard metrics: Taxa Richness (TR); Ephemeroptera, Plecoptera, TrichopteraTaxa (EPTT), Biotic Index (BI), and the Shannon Diversity Index (SI) will be calculated for each replicateleafpack. Additional metrics, such as Percent EPT, Percent Chironomidae, EPT/Chironomidae ratio,Percent Scrapers, and Scraper/Collector-Filter ratio may be employed to discern differences in taxabetween test and control stations.
Macroinvertebrate data will be analyzed in two ways using one way analysis of variance (ANOVA) foreach biological metric. First, a longitudinal comparison between the five sample reaches of the North ForkSpring River will be made. Secondly, the data from the North Fork Spring River will be compared to datacollected from the control stations.
Data Reporting: Results of the study will be summarized and interpreted in report format.
Quality Control: As stated in the various MDNR Project Procedures and Standard Operating Procedures.
Literature Cited:
Missouri Department of Natural Resources. 2003a. Stream Habitat Assessment Project Procedure.MDNR-FSS-032. Missouri Department of Natural Resources, Environmental Services Program, P.O. Box176, Jefferson City, Missouri 65102. 40 pp.

Missouri Department of Natural Resources. 2003b. Semi-quantitative Macroinvertebrate StreamBioassessment Project Procedure. MDNR-FSS-030. Missouri Department of Natural Resources,Environmental Services Program, P.O. Box 176, Jefferson City, Missouri 65102. 24 pp.
Missouri Department of Natural Resources. 2003c. Quality Control Procedures for Data Processing.MDNR-WQMS-214. Missouri Department of Natural Resources, Environmental Services Program, P.O.Box 176, Jefferson City, Missouri 65102. 6 pp.
Missouri Department of Natural Resources. 2002. Biological Criteria for Wadeable/Perennial Streams ofMissouri. Missouri Department of Natural Resources, Environmental Services Program, P.O. Box 176,Jefferson City, Missouri 65102. 32 pp.
Missouri Department of Natural Resources. 2001. Taxonomic Levels for Macroinvertebrate Identification.MDNR-WQMS-209. Missouri Department of Natural Resources, Environmental Services Program, P.O.Box 176, Jefferson City, Missouri 65102. 32 pp.
Pflieger, W.L. Aquatic Community Classification System for Missouri. 1989. 76 pp.
Attachments:
Maps of all sampling stations in this study

Lower North Fork of the Spring River Bioassessment Test Stations
Highw
ay 71
Station #1
Station #2
Station #3
Station #4
Station #5
Lamar
Jasper
#WWTF
# WWTF

Flat Rock Creek Bioassessment Control Stations

Little Drywood Creek Control Station

Appendix B
Statistical Analyses (One-Way ANOVA and Tukey Multiple Comparison Test for ParametricData and Kruskal-Wallis ANOVA on Ranks and Dunn’s Multiple Comparison Test for Non-
parametric Data Comparing Biological Metrics Between Sampling Stations.

One Way Analysis of Variance Wednesday, August 17, 2005, 07:59:19
Data source: One Way Analysis of Variance comparing taxa richness (TR) between the NorthFork of the Spring River (NFSR) test stations and control stations on Little Drywood Creek(LDW) and Flat Rock Creek (FRC)
Normality Test: Passed (P > 0.200)
Equal Variance Test: Passed (P = 0.188)
Group Name N Missing Mean Std Dev SEMNFSR #5 9 0 16.667 3.122 1.041NFSR #4 9 0 23.778 3.073 1.024NFSR #3 9 0 22.111 3.655 1.218NFSR #2 7 0 22.000 6.164 2.330NFSR #1 9 0 28.889 3.257 1.086FRC #2 9 0 22.333 2.739 0.913LDW #1 9 0 25.556 5.270 1.757
Source of Variation DF SS MS F P Between Groups 6 755.035 125.839 7.943 <0.001Residual 54 855.556 15.844Total 60 1610.590
The differences in the mean values among the treatment groups are greater than would beexpected by chance; there is a statistically significant difference (P = <0.001).
Power of performed test with alpha = 0.050: 0.999
All Pairwise Multiple Comparison Procedures (Tukey Test):
Comparisons for factor: StationComparison Diff of Means p q P P<0.050NFSR #1 vs. NFSR #5 12.222 7 9.212 <0.001 YesNFSR #1 vs. NFSR #2 6.889 7 4.857 0.019 YesNFSR #1 vs. NFSR #3 6.778 7 5.108 0.011 YesNFSR #1 vs. FRC #2 6.556 7 4.941 0.016 YesNFSR #1 vs. NFSR #4 5.111 7 3.852 0.112 NoNFSR #1 vs. LDW #1 3.333 7 2.512 0.569 Do Not TestLDW #1 vs. NFSR #5 8.889 7 6.699 <0.001 YesLDW #1 vs. NFSR #2 3.556 7 2.507 0.572 NoLDW #1 vs. NFSR #3 3.444 7 2.596 0.531 Do Not TestLDW #1 vs. FRC #2 3.222 7 2.429 0.608 Do Not TestLDW #1 vs. NFSR #4 1.778 7 1.340 0.963 Do Not TestNFSR #4 vs. NFSR #5 7.111 7 5.360 0.007 Yes

NFSR #4 vs. NFSR #2 1.778 7 1.253 0.973 Do Not TestNFSR #4 vs. NFSR #3 1.667 7 1.256 0.973 Do Not TestNFSR #4 vs. FRC #2 1.444 7 1.089 0.987 Do Not TestFRC #2 vs. NFSR #5 5.667 7 4.271 0.056 NoFRC #2 vs. NFSR #2 0.333 7 0.235 1.000 Do Not TestFRC #2 vs. NFSR #3 0.222 7 0.167 1.000 Do Not TestNFSR #3 vs. NFSR #5 5.444 7 4.103 0.074 Do Not TestNFSR #3 vs. NFSR #2 0.111 7 0.0783 1.000 Do Not TestNFSR #2 vs. NFSR #5 5.333 7 3.760 0.129 Do Not Test
A result of "Do Not Test" occurs for a comparison when no significant difference is foundbetween two means that enclose that comparison. For example, if you had four means sorted inorder, and found no difference between means 4 vs. 2, then you would not test 4 vs. 3 and 3 vs.2, but still test 4 vs. 1 and 3 vs. 1 (4 vs. 3 and 3 vs. 2 are enclosed by 4 vs. 2: 4 3 2 1). Note thatnot testing the enclosed means is a procedural rule, and a result of Do Not Test should be treatedas if there is no significant difference between the means, even though one may appear to exist.

One Way Analysis of Variance Wednesday, August 17, 2005, 08:03:48
Data source: One Way Analysis of Variance comparing EPT Taxa (EPTT) between the NorthFork of the Spring River (NFSR) test stations and control stations on Little Drywood Creek(LDW) and Flat Rock Creek (FRC)
Normality Test: Passed (P = 0.124)
Equal Variance Test: Passed (P = 0.105)
Group Name N Missing Mean Std Dev SEMNFSR #5 9 0 3.778 1.093 0.364NFSR #4 9 0 4.444 1.014 0.338NFSR #3 9 0 4.667 1.323 0.441NFSR #2 7 0 4.857 1.345 0.508NFSR #1 9 0 8.000 1.000 0.333FRC #2 9 0 5.667 1.118 0.373LDW #1 9 0 5.444 1.590 0.530
Source of Variation DF SS MS F P Between Groups 6 99.405 16.568 11.065 <0.001Residual 54 80.857 1.497Total 60 180.262
The differences in the mean values among the treatment groups are greater than would beexpected by chance; there is a statistically significant difference (P = <0.001).
Power of performed test with alpha = 0.050: 1.000
All Pairwise Multiple Comparison Procedures (Tukey Test):
Comparisons for factor: StationComparison Diff of Means p q P P<0.050NFSR #1 vs. NFSR #5 4.222 7 10.351 <0.001 YesNFSR #1 vs. NFSR #4 3.556 7 8.717 <0.001 YesNFSR #1 vs. NFSR #3 3.333 7 8.172 <0.001 YesNFSR #1 vs. NFSR #2 3.143 7 7.208 <0.001 YesNFSR #1 vs. LDW #1 2.556 7 6.265 <0.001 YesNFSR #1 vs. FRC #2 2.333 7 5.721 0.003 YesFRC #2 vs. NFSR #5 1.889 7 4.631 0.029 YesFRC #2 vs. NFSR #4 1.222 7 2.996 0.357 NoFRC #2 vs. NFSR #3 1.000 7 2.452 0.597 Do Not TestFRC #2 vs. NFSR #2 0.810 7 1.856 0.843 Do Not TestFRC #2 vs. LDW #1 0.222 7 0.545 1.000 Do Not TestLDW #1 vs. NFSR #5 1.667 7 4.086 0.077 No

LDW #1 vs. NFSR #4 1.000 7 2.452 0.597 Do Not TestLDW #1 vs. NFSR #3 0.778 7 1.907 0.826 Do Not TestLDW #1 vs. NFSR #2 0.587 7 1.347 0.962 Do Not TestNFSR #2 vs. NFSR #5 1.079 7 2.475 0.586 Do Not TestNFSR #2 vs. NFSR #4 0.413 7 0.946 0.994 Do Not TestNFSR #2 vs. NFSR #3 0.190 7 0.437 1.000 Do Not TestNFSR #3 vs. NFSR #5 0.889 7 2.179 0.719 Do Not TestNFSR #3 vs. NFSR #4 0.222 7 0.545 1.000 Do Not TestNFSR #4 vs. NFSR #5 0.667 7 1.634 0.907 Do Not Test
A result of "Do Not Test" occurs for a comparison when no significant difference is foundbetween two means that enclose that comparison. For example, if you had four means sorted inorder, and found no difference between means 4 vs. 2, then you would not test 4 vs. 3 and 3 vs.2, but still test 4 vs. 1 and 3 vs. 1 (4 vs. 3 and 3 vs. 2 are enclosed by 4 vs. 2: 4 3 2 1). Note thatnot testing the enclosed means is a procedural rule, and a result of Do Not Test should be treatedas if there is no significant difference between the means, even though one may appear to exist.

Kruskal-Wallis One Way Analysis of Variance on RanksWednesday, August 17, 2005,08:08:15
Data source: Kruskal-Wallis One Way Analysis of Variance on Ranks comparing biotic index(BI) between the North Fork of the Spring River (NFSR) test stations and control stations onLittle Drywood Creek (LDW) and Flat Rock Creek (FRC)
Normality Test: Passed (P = 0.052)
Equal Variance Test: Failed (P = 0.010)
Group N Missing Median 25% 75% NFSR #59 0 7.140 6.845 7.450NFSR #49 0 7.680 7.575 7.850NFSR #39 0 7.400 7.380 7.508NFSR #27 0 7.460 7.353 7.475NFSR #19 0 7.080 7.035 7.150FRC #2 9 0 7.150 6.838 7.262LDW #1 9 0 6.700 6.637 6.785
H = 43.416 with 6 degrees of freedom. (P = <0.001)
The differences in the median values among the treatment groups are greater than would beexpected by chance; there is a statistically significant difference (P = <0.001)
To isolate the group or groups that differ from the others use a multiple comparison procedure.
All Pairwise Multiple Comparison Procedures (Dunn's Method)
Comparison Diff of Ranks Q P<0.01NFSR #4 vs LDW #1 46.556 5.563 YesNFSR #4 vs NFSR #1 32.500 3.883 YesNFSR #4 vs FRC #2 31.611 3.777 YesNFSR #4 vs NFSR #5 25.944 3.100 NoNFSR #4 vs NFSR #2 10.857 1.214 Do Not TestNFSR #4 vs NFSR #3 10.833 1.294 Do Not TestNFSR #3 vs LDW #1 35.722 4.268 YesNFSR #3 vs NFSR #1 21.667 2.589 NoNFSR #3 vs FRC #2 20.778 2.483 Do Not TestNFSR #3 vs NFSR #5 15.111 1.806 Do Not TestNFSR #3 vs NFSR #2 0.0238 0.00266 Do Not TestNFSR #2 vs LDW #1 35.698 3.990 YesNFSR #2 vs NFSR #1 21.643 2.419 Do Not TestNFSR #2 vs FRC #2 20.754 2.320 Do Not TestNFSR #2 vs NFSR #5 15.087 1.686 Do Not Test

NFSR #5 vs LDW #1 20.611 2.463 NoNFSR #5 vs NFSR #1 6.556 0.783 Do Not TestNFSR #5 vs FRC #2 5.667 0.677 Do Not TestFRC #2 vs LDW #1 14.944 1.786 Do Not TestFRC #2 vs NFSR #1 0.889 0.106 Do Not TestNFSR #1 vs LDW #1 14.056 1.680 Do Not Test
Note: The multiple comparisons on ranks do not include an adjustment for ties.

Kruskal-Wallis One Way Analysis of Variance on RanksWednesday, August 17, 2005,08:12:11
Data source: Kruskal-Wallis One Way Analysis of Variance on Ranks comparing ShannonDiversity Index (SDI) between the North Fork of the Spring River (NFSR) test stations andcontrol stations on Little Drywood Creek (LDW) and Flat Rock Creek (FRC)
Normality Test: Passed (P = 0.125)
Equal Variance Test: Failed (P = 0.009)
Group N Missing Median 25% 75% NFSR #59 0 2.070 1.877 2.328NFSR #49 0 2.170 2.010 2.317NFSR #39 0 1.940 1.828 2.090NFSR #27 0 1.910 1.688 2.172NFSR #19 0 2.580 2.538 2.683FRC #2 9 0 2.470 2.320 2.518LDW #1 9 0 2.140 2.095 2.195
H = 34.873 with 6 degrees of freedom. (P = <0.001)
The differences in the median values among the treatment groups are greater than would beexpected by chance; there is a statistically significant difference (P = <0.001)
To isolate the group or groups that differ from the others use a multiple comparison procedure.
All Pairwise Multiple Comparison Procedures (Dunn's Method):
Comparison Diff of Ranks Q P<0.01NFSR #1 vs NFSR #3 38.667 4.620 YesNFSR #1 vs NFSR #2 37.738 4.218 YesNFSR #1 vs NFSR #5 30.556 3.651 YesNFSR #1 vs LDW #1 27.778 3.319 NoNFSR #1 vs NFSR #4 25.056 2.994 Do Not TestNFSR #1 vs FRC #2 9.000 1.075 Do Not TestFRC #2 vs NFSR #3 29.667 3.545 YesFRC #2 vs NFSR #2 28.738 3.212 NoFRC #2 vs NFSR #5 21.556 2.576 Do Not TestFRC #2 vs LDW #1 18.778 2.244 Do Not TestFRC #2 vs NFSR #4 16.056 1.918 Do Not TestNFSR #4 vs NFSR #3 13.611 1.626 NoNFSR #4 vs NFSR #2 12.683 1.418 Do Not TestNFSR #4 vs NFSR #5 5.500 0.657 Do Not TestNFSR #4 vs LDW #1 2.722 0.325 Do Not Test

LDW #1 vs NFSR #3 10.889 1.301 Do Not TestLDW #1 vs NFSR #2 9.960 1.113 Do Not TestLDW #1 vs NFSR #5 2.778 0.332 Do Not TestNFSR #5 vs NFSR #3 8.111 0.969 Do Not TestNFSR #5 vs NFSR #2 7.183 0.803 Do Not TestNFSR #2 vs NFSR #3 0.929 0.104 Do Not Test
Note: The multiple comparisons on ranks do not include an adjustment for ties.

One Way Analysis of Variance Wednesday, August 17, 2005, 08:03:48
Data source: One Way Analysis of Variance comparing EPT Taxa (EPTT) between the NorthFork of the Spring River (NFSR) test stations and control stations on Little Drywood Creek(LDW) and Flat Rock Creek (FRC)
Normality Test: Passed (P = 0.124)
Equal Variance Test: Passed (P = 0.105)
Group Name N Missing Mean Std Dev SEMNFSR #5 9 0 3.778 1.093 0.364NFSR #4 9 0 4.444 1.014 0.338NFSR #3 9 0 4.667 1.323 0.441NFSR #2 7 0 4.857 1.345 0.508NFSR #1 9 0 8.000 1.000 0.333FRC #2 9 0 5.667 1.118 0.373LDW #1 9 0 5.444 1.590 0.530
Source of Variation DF SS MS F P Between Groups 6 99.405 16.568 11.065 <0.001Residual 54 80.857 1.497Total 60 180.262
The differences in the mean values among the treatment groups are greater than would beexpected by chance; there is a statistically significant difference (P = <0.001).
Power of performed test with alpha = 0.050: 1.000
All Pairwise Multiple Comparison Procedures (Tukey Test):
Comparisons for factor: StationComparison Diff of Means p q P P<0.050NFSR #1 vs. NFSR #5 4.222 7 10.351 <0.001 YesNFSR #1 vs. NFSR #4 3.556 7 8.717 <0.001 YesNFSR #1 vs. NFSR #3 3.333 7 8.172 <0.001 YesNFSR #1 vs. NFSR #2 3.143 7 7.208 <0.001 YesNFSR #1 vs. LDW #1 2.556 7 6.265 <0.001 YesNFSR #1 vs. FRC #2 2.333 7 5.721 0.003 YesFRC #2 vs. NFSR #5 1.889 7 4.631 0.029 YesFRC #2 vs. NFSR #4 1.222 7 2.996 0.357 NoFRC #2 vs. NFSR #3 1.000 7 2.452 0.597 Do Not TestFRC #2 vs. NFSR #2 0.810 7 1.856 0.843 Do Not TestFRC #2 vs. LDW #1 0.222 7 0.545 1.000 Do Not TestLDW #1 vs. NFSR #5 1.667 7 4.086 0.077 No
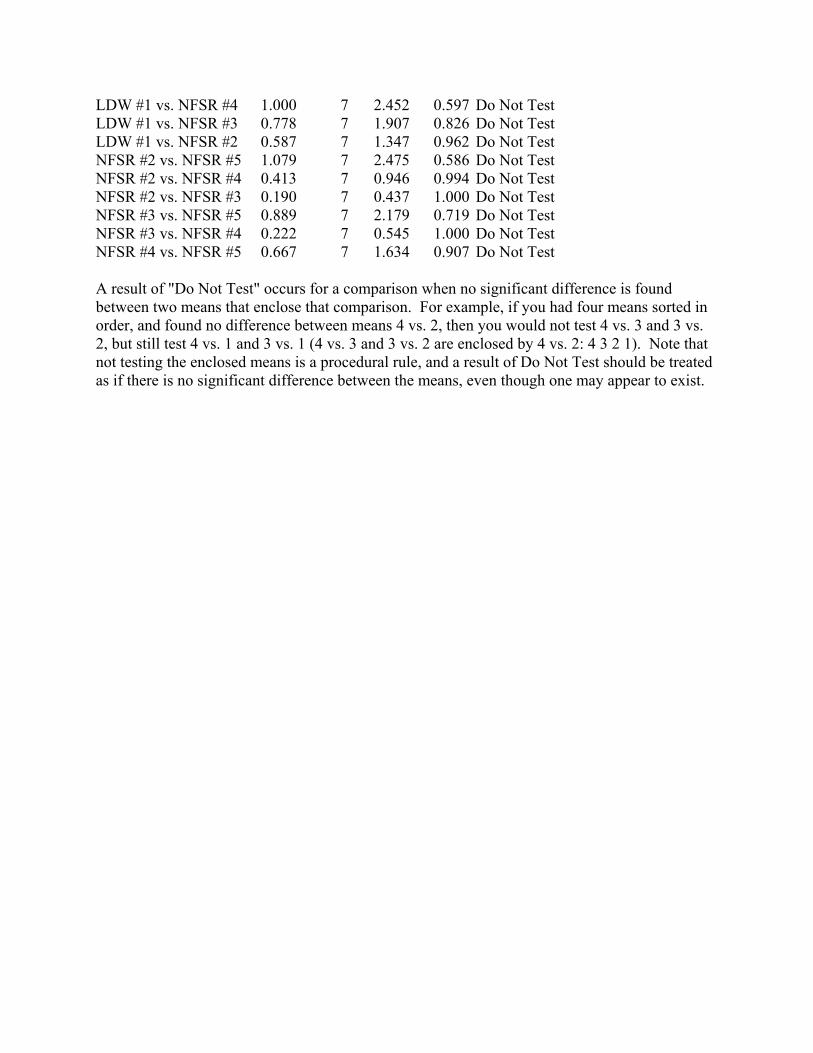
LDW #1 vs. NFSR #4 1.000 7 2.452 0.597 Do Not TestLDW #1 vs. NFSR #3 0.778 7 1.907 0.826 Do Not TestLDW #1 vs. NFSR #2 0.587 7 1.347 0.962 Do Not TestNFSR #2 vs. NFSR #5 1.079 7 2.475 0.586 Do Not TestNFSR #2 vs. NFSR #4 0.413 7 0.946 0.994 Do Not TestNFSR #2 vs. NFSR #3 0.190 7 0.437 1.000 Do Not TestNFSR #3 vs. NFSR #5 0.889 7 2.179 0.719 Do Not TestNFSR #3 vs. NFSR #4 0.222 7 0.545 1.000 Do Not TestNFSR #4 vs. NFSR #5 0.667 7 1.634 0.907 Do Not Test
A result of "Do Not Test" occurs for a comparison when no significant difference is foundbetween two means that enclose that comparison. For example, if you had four means sorted inorder, and found no difference between means 4 vs. 2, then you would not test 4 vs. 3 and 3 vs.2, but still test 4 vs. 1 and 3 vs. 1 (4 vs. 3 and 3 vs. 2 are enclosed by 4 vs. 2: 4 3 2 1). Note thatnot testing the enclosed means is a procedural rule, and a result of Do Not Test should be treatedas if there is no significant difference between the means, even though one may appear to exist.

One Way Analysis of Variance Wednesday, August 17, 2005, 08:17:07
Data source: One Way Analysis of Variance comparing percent dominant (5) taxa between theNorth Fork of the Spring River (NFSR) test stations and control stations on Little DrywoodCreek (LDW) and Flat Rock Creek (FRC)Normality Test: Passed (P > 0.200)
Equal Variance Test: Passed (P = 0.465)
Group Name N Missing Mean Std Dev SEMNFSR #5 9 0 81.803 5.730 1.910NFSR #4 9 0 80.596 3.886 1.295NFSR #3 9 0 80.381 4.546 1.515NFSR #2 7 0 82.964 6.865 2.595NFSR #1 9 0 65.151 4.818 1.606FRC #2 9 0 69.497 7.680 2.560LDW #1 9 0 76.927 2.899 0.966
Source of Variation DF SS MS F P Between Groups 6 2434.206 405.701 14.076 <0.001Residual 54 1556.433 28.823Total 60 3990.640
The differences in the mean values among the treatment groups are greater than would beexpected by chance; there is a statistically significant difference (P = <0.001).
Power of performed test with alpha = 0.050: 1.000
All Pairwise Multiple Comparison Procedures (Tukey Test):
Comparisons for factor: StationComparison Diff of Means p q P P<0.050NFSR #2 vs. NFSR #1 17.813 7 9.311 <0.001 YesNFSR #2 vs. FRC #2 13.468 7 7.040 <0.001 YesNFSR #2 vs. LDW #1 6.038 7 3.156 0.296 NoNFSR #2 vs. NFSR #3 2.583 7 1.350 0.961 Do Not TestNFSR #2 vs. NFSR #4 2.369 7 1.238 0.975 Do Not TestNFSR #2 vs. NFSR #5 1.161 7 0.607 1.000 Do Not TestNFSR #5 vs. NFSR #1 16.652 7 9.305 <0.001 YesNFSR #5 vs. FRC #2 12.307 7 6.877 <0.001 YesNFSR #5 vs. LDW #1 4.877 7 2.725 0.472 Do Not TestNFSR #5 vs. NFSR #3 1.422 7 0.795 0.998 Do Not TestNFSR #5 vs. NFSR #4 1.208 7 0.675 0.999 Do Not TestNFSR #4 vs. NFSR #1 15.444 7 8.630 <0.001 YesNFSR #4 vs. FRC #2 11.099 7 6.202 0.001 Yes

NFSR #4 vs. LDW #1 3.669 7 2.050 0.772 Do Not TestNFSR #4 vs. NFSR #3 0.214 7 0.120 1.000 Do Not TestNFSR #3 vs. NFSR #1 15.230 7 8.510 <0.001 YesNFSR #3 vs. FRC #2 10.884 7 6.082 0.001 YesNFSR #3 vs. LDW #1 3.454 7 1.930 0.818 Do Not TestLDW #1 vs. NFSR #1 11.776 7 6.580 <0.001 YesLDW #1 vs. FRC #2 7.430 7 4.152 0.068 NoFRC #2 vs. NFSR #1 4.346 7 2.428 0.608 No
A result of "Do Not Test" occurs for a comparison when no significant difference is foundbetween two means that enclose that comparison. For example, if you had four means sorted inorder, and found no difference between means 4 vs. 2, then you would not test 4 vs. 3 and 3 vs.2, but still test 4 vs. 1 and 3 vs. 1 (4 vs. 3 and 3 vs. 2 are enclosed by 4 vs. 2: 4 3 2 1). Note thatnot testing the enclosed means is a procedural rule, and a result of Do Not Test should be treatedas if there is no significant difference between the means, even though one may appear to exist.

One Way Analysis of Variance Wednesday, August 17, 2005, 08:20:10
Data source: One Way Analysis of Variance comparing percent clingers between the NorthFork of the Spring River (NFSR) test stations and control stations on Little Drywood Creek(LDW) and Flat Rock Creek (FRC)
Normality Test: Passed (P = 0.157)
Equal Variance Test: Passed (P = 0.029)
Group Name N Missing Mean Std Dev SEMNFSR #5 9 0 32.970 12.037 4.012NFSR #4 9 0 21.603 5.825 1.942NFSR #3 9 0 14.459 6.230 2.077NFSR #2 7 0 43.260 19.123 7.228NFSR #1 9 0 37.239 15.021 5.007FRC #2 9 0 21.862 11.034 3.678LDW #1 9 0 43.144 6.871 2.290
Source of Variation DF SS MS F P Between Groups 6 6737.703 1122.951 8.551 <0.001Residual 54 7091.800 131.330Total 60 13829.504
The differences in the mean values among the treatment groups are greater than would beexpected by chance; there is a statistically significant difference (P = <0.001).
Power of performed test with alpha = 0.050: 1.000
All Pairwise Multiple Comparison Procedures (Tukey Test):
Comparisons for factor: StationComparison Diff of Means p q P P<0.050NFSR #2 vs. NFSR #3 28.801 7 7.053 <0.001 YesNFSR #2 vs. NFSR #4 21.657 7 5.303 0.008 YesNFSR #2 vs. FRC #2 21.398 7 5.240 0.009 YesNFSR #2 vs. NFSR #5 10.290 7 2.520 0.566 NoNFSR #2 vs. NFSR #1 6.021 7 1.474 0.942 Do Not TestNFSR #2 vs. LDW #1 0.116 7 0.0283 1.000 Do Not TestLDW #1 vs. NFSR #3 28.686 7 7.509 <0.001 YesLDW #1 vs. NFSR #4 21.541 7 5.639 0.004 YesLDW #1 vs. FRC #2 21.282 7 5.571 0.004 YesLDW #1 vs. NFSR #5 10.174 7 2.663 0.500 Do Not TestLDW #1 vs. NFSR #1 5.906 7 1.546 0.928 Do Not TestNFSR #1 vs. NFSR #3 22.780 7 5.963 0.002 Yes

NFSR #1 vs. NFSR #4 15.636 7 4.093 0.076 NoNFSR #1 vs. FRC #2 15.377 7 4.025 0.085 Do Not TestNFSR #1 vs. NFSR #5 4.269 7 1.118 0.985 Do Not TestNFSR #5 vs. NFSR #3 18.511 7 4.846 0.019 YesNFSR #5 vs. NFSR #4 11.367 7 2.976 0.365 Do Not TestNFSR #5 vs. FRC #2 11.108 7 2.908 0.393 Do Not TestFRC #2 vs. NFSR #3 7.403 7 1.938 0.815 NoFRC #2 vs. NFSR #4 0.259 7 0.0678 1.000 Do Not TestNFSR #4 vs. NFSR #3 7.144 7 1.870 0.838 Do Not Test
A result of "Do Not Test" occurs for a comparison when no significant difference is foundbetween two means that enclose that comparison. For example, if you had four means sorted inorder, and found no difference between means 4 vs. 2, then you would not test 4 vs. 3 and 3 vs.2, but still test 4 vs. 1 and 3 vs. 1 (4 vs. 3 and 3 vs. 2 are enclosed by 4 vs. 2: 4 3 2 1). Note thatnot testing the enclosed means is a procedural rule, and a result of Do Not Test should be treatedas if there is no significant difference between the means, even though one may appear to exist.

Appendix C
Lower North Fork of the Spring River Bioassessment Study Macroinvertebrate Bench Sheets

LP = Leafpack
Aquid Invertebrate Database Bench Sheet ReportNorth Fk Spring R [0449226], Station #5a, Sample Date: 10/4/2004 12:00:00 PMORDER: TAXA LPDIPTERA Ablabesmyia 2 Dicrotendipes 86 Glyptotendipes 12 Kiefferulus 25 Paratanytarsus 4 Phaenopsectra 7 Rheotanytarsus 1 Tanytarsus 4 Tribelos 25EPHEMEROPTERA Caenis latipennis 7 Stenacron 12TRICHOPTERA Cheumatopsyche 1TUBIFICIDA Tubificidae 1
Aquid Invertebrate Database Bench Sheet ReportNorth Fk Spring R [0449227], Station #5b, Sample Date: 10/4/2004 12:00:00 PMORDER: TAXA LP"HYDRACARINA" Acarina 2COLEOPTERA Lutrochus 1DIPTERA Ablabesmyia 1 Anopheles 1 Dicrotendipes 32 Glyptotendipes 3 Kiefferulus 6 Paratanytarsus 4 Procladius 1 Rheotanytarsus 3 Tanytarsus 3 Tribelos 2EPHEMEROPTERA Caenis latipennis 4 Stenacron 2ISOPODA Lirceus 2LIMNOPHILA Ancylidae 3TRICHOPTERA Cheumatopsyche 1

LP = Leafpack
Aquid Invertebrate Database Bench Sheet ReportNorth Fk Spring R [0449228], Station #5c, Sample Date: 10/4/2004 12:00:00 PMORDER: TAXA LPDIPTERA Ablabesmyia 4 Dicrotendipes 21 Glyptotendipes 2 Kiefferulus 4 Parachironomus 1 Paratanytarsus 6 Phaenopsectra 15 Polypedilum fallax grp 2 Thienemannimyia grp. 1 Tribelos 35EPHEMEROPTERA Caenis latipennis 1 Leptophlebiidae 1 Stenacron 43 Stenonema femoratum 1
Aquid Invertebrate Database Bench Sheet ReportNorth Fk Spring R [0449229], Station #5d, Sample Date: 10/4/2004 12:00:00 PMORDER: TAXA LP"HYDRACARINA" Acarina 1AMPHIPODA Hyalella azteca 1DIPTERA Ablabesmyia 4 Chironomus 1 Dicrotendipes 23 Glyptotendipes 1 Kiefferulus 1 Parachironomus 1 Paratanytarsus 1 Phaenopsectra 7 Polypedilum fallax grp 2 Rheotanytarsus 10 Tanytarsus 6 Thienemannimyia grp. 5 Tribelos 43EPHEMEROPTERA Caenis latipennis 3 Leptophlebiidae 5 Stenacron 30 Stenonema femoratum 4MEGALOPTERA Sialis 1ODONATA Argia 2TRICHOPTERA Cyrnellus fraternus 1

LP = Leafpack
Aquid Invertebrate Database Bench Sheet ReportNorth Fk Spring R [0449230], Station #5e, Sample Date: 10/4/2004 12:00:00 PMORDER: TAXA LPDIPTERA Ablabesmyia 4 Cricotopus/Orthocladius 3 Dicrotendipes 8 Glyptotendipes 2 Kiefferulus 1 Paratanytarsus 6 Phaenopsectra 8 Rheotanytarsus 7 Tanytarsus 3 Thienemannimyia grp. 6 Tribelos 6EPHEMEROPTERA Caenis latipennis 1 Leptophlebiidae 5 Stenacron 34 Stenonema femoratum 4LIMNOPHILA Ancylidae 1ODONATA Argia 1TRICHOPTERA Psychomyia 1
Aquid Invertebrate Database Bench Sheet ReportNorth Fk Spring R [0449231], Station #5f, Sample Date: 10/4/2004 12:00:00 PMORDER: TAXA LPAMPHIPODA Hyalella azteca 1DIPTERA Ablabesmyia 2 Cricotopus/Orthocladius 1 Dicrotendipes 5 Glyptotendipes 1 Labrundinia 1 Paratanytarsus 4 Phaenopsectra 2 Polypedilum fallax grp 5 Rheotanytarsus 4 Stenochironomus 3 Tanytarsus 7 Thienemannimyia grp. 4 Tribelos 2EPHEMEROPTERA Leptophlebiidae 3 Stenacron 23 Stenonema femoratum 4ODONATA Argia 1 Enallagma 1

LP = Leafpack
Aquid Invertebrate Database Bench Sheet ReportNorth Fk Spring R [0449232], Station #5g, Sample Date: 10/4/2004 12:00:00 PMORDER: TAXA LPAMPHIPODA Hyalella azteca 1DIPTERA Ablabesmyia 2 Cricotopus bicinctus 1 Dicrotendipes 36 Glyptotendipes 3 Paratanytarsus 4 Phaenopsectra 3 Rheotanytarsus 1 Stempellinella 1 Tanytarsus 5 Thienemannimyia grp. 2EPHEMEROPTERA Caenis latipennis 2 Leptophlebiidae 1 Stenacron 28 Stenonema femoratum 3
Aquid Invertebrate Database Bench Sheet ReportNorth Fk Spring R [0449233], Station #5h, Sample Date: 10/4/2004 12:00:00 PMORDER: TAXA LPDIPTERA Ablabesmyia 6 Cricotopus/Orthocladius 1 Dicrotendipes 43 Glyptotendipes 2 Paratanytarsus 3 Phaenopsectra 17 Polypedilum fallax grp 1 Rheotanytarsus 5 Tanytarsus 3 Thienemannimyia grp. 3 Tribelos 11EPHEMEROPTERA Caenis latipennis 1 Stenacron 30

LP = Leafpack
Aquid Invertebrate Database Bench Sheet ReportNorth Fk Spring R [0449234], Station #5i, Sample Date: 10/4/2004 12:00:00 PMORDER: TAXA LPDIPTERA Ablabesmyia 5 Dicrotendipes 62 Glyptotendipes 5 Kiefferulus 1 Microtendipes 1 Paratanytarsus 7 Phaenopsectra 14 Polypedilum fallax grp 7 Rheotanytarsus 2 Stenochironomus 1 Tanytarsus 5 Thienemannimyia grp. 4 Tribelos 35EPHEMEROPTERA Caenis latipennis 1 Leptophlebiidae 2 Stenacron 44 Stenonema femoratum 2ODONATA Argia 1TRICHOPTERA Cyrnellus fraternus 1

LP = Leafpack
Aquid Invertebrate Database Bench Sheet ReportNorth Fk Spring R [0449235], Station #4a, Sample Date: 10/4/2004 1:55:00 PMORDER: TAXA LPAMPHIPODA Hyalella azteca 70COLEOPTERA Scirtes 1DIPTERA Ablabesmyia 8 Chironomus 1 Cricotopus bicinctus 5 Cricotopus/Orthocladius 2 Dicrotendipes 49 Glyptotendipes 47 Kiefferulus 2 Nanocladius 1 Paratanytarsus 2 Phaenopsectra 2 Polypedilum illinoense grp 1 Rheotanytarsus 23 Stenochironomus 1 Tanytarsus 22 Thienemannimyia grp. 10 Tribelos 23EPHEMEROPTERA Caenis latipennis 3 Callibaetis 3 Stenacron 38ODONATA Argia 3TRICHOPTERA Cyrnellus fraternus 1TUBIFICIDA Tubificidae 1

LP = Leafpack
Aquid Invertebrate Database Bench Sheet ReportNorth Fk Spring R [0449236], Station #4b, Sample Date: 10/4/2004 1:55:00 PMORDER: TAXA LPAMPHIPODA Hyalella azteca 100DIPTERA Ablabesmyia 6 Cricotopus bicinctus 2 Cricotopus/Orthocladius 8 Dicrotendipes 59 Glyptotendipes 55 Kiefferulus 2 Nanocladius 4 Parachironomus 1 Paratanytarsus 4 Polypedilum illinoense grp 1 Polypedilum scalaenum grp 1 Rheotanytarsus 19 Stenochironomus 2 Tanytarsus 15 Thienemannimyia grp. 10 Tribelos 7EPHEMEROPTERA Caenis latipennis 1 Callibaetis 1 Stenacron 19LIMNOPHILA Physella 2ODONATA Argia 2

LP = Leafpack
Aquid Invertebrate Database Bench Sheet ReportNorth Fk Spring R [0449237], Station #4c, Sample Date: 10/4/2004 1:55:00 PMORDER: TAXA LPAMPHIPODA Hyalella azteca 80COLEOPTERA Dineutus 1 Scirtes 1DIPTERA Ablabesmyia 3 Chironomus 2 Cricotopus bicinctus 1 Cricotopus/Orthocladius 2 Dicrotendipes 99 Glyptotendipes 103 Kiefferulus 6 Parachironomus 2 Paratanytarsus 16 Phaenopsectra 4 Polypedilum illinoense grp 2 Rheotanytarsus 13 Tanytarsus 9 Thienemannimyia grp. 5 Tribelos 2EPHEMEROPTERA Caenis latipennis 2 Callibaetis 3 Leptophlebiidae 1 Stenacron 28 Stenonema femoratum 3LIMNOPHILA Physella 2ODONATA Argia 1TRICHOPTERA Cyrnellus fraternus 3TRICLADIDA Planariidae 1

LP = Leafpack
Aquid Invertebrate Database Bench Sheet ReportNorth Fk Spring R [0449238], Station #4d, Sample Date: 10/4/2004 1:55:00 PMORDER: TAXA LPAMPHIPODA Hyalella azteca 39COLEOPTERA Dubiraphia 1DIPTERA Ablabesmyia 3 Cricotopus bicinctus 1 Cricotopus/Orthocladius 1 Dicrotendipes 146 Glyptotendipes 74 Kiefferulus 17 Parachironomus 1 Paratanytarsus 14 Procladius 1 Rheotanytarsus 8 Tanypus 1 Tanytarsus 3 Thienemannimyia grp. 1 Tribelos 9EPHEMEROPTERA Caenis latipennis 3 Callibaetis 3 Stenacron 94LIMNOPHILA Physella 1ODONATA Argia 1RHYNCHOBDELLIDA Glossiphoniidae 1TRICHOPTERA Cyrnellus fraternus 1TUBIFICIDA Tubificidae 1
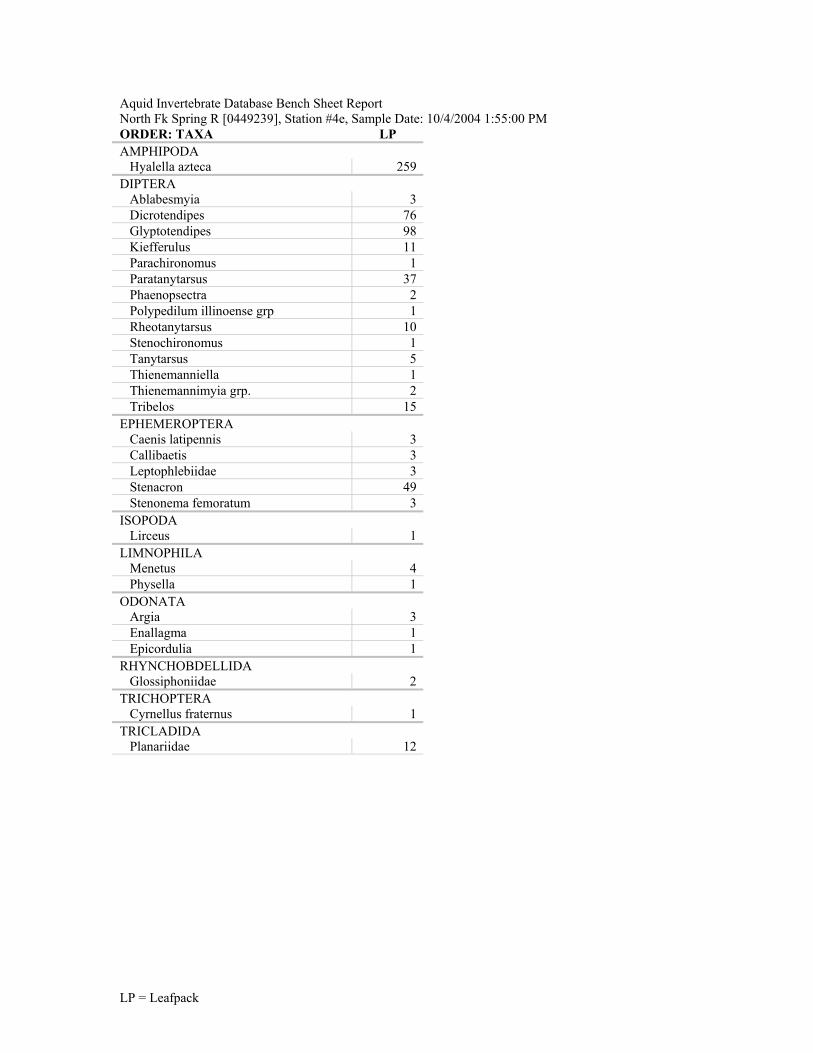
LP = Leafpack
Aquid Invertebrate Database Bench Sheet ReportNorth Fk Spring R [0449239], Station #4e, Sample Date: 10/4/2004 1:55:00 PMORDER: TAXA LPAMPHIPODA Hyalella azteca 259DIPTERA Ablabesmyia 3 Dicrotendipes 76 Glyptotendipes 98 Kiefferulus 11 Parachironomus 1 Paratanytarsus 37 Phaenopsectra 2 Polypedilum illinoense grp 1 Rheotanytarsus 10 Stenochironomus 1 Tanytarsus 5 Thienemanniella 1 Thienemannimyia grp. 2 Tribelos 15EPHEMEROPTERA Caenis latipennis 3 Callibaetis 3 Leptophlebiidae 3 Stenacron 49 Stenonema femoratum 3ISOPODA Lirceus 1LIMNOPHILA Menetus 4 Physella 1ODONATA Argia 3 Enallagma 1 Epicordulia 1RHYNCHOBDELLIDA Glossiphoniidae 2TRICHOPTERA Cyrnellus fraternus 1TRICLADIDA Planariidae 12

LP = Leafpack
Aquid Invertebrate Database Bench Sheet ReportNorth Fk Spring R [0449240], Station #4f, Sample Date: 10/4/2004 1:55:00 PMORDER: TAXA LPAMPHIPODA Hyalella azteca 14DIPTERA Ablabesmyia 4 Anopheles 1 Chironomus 1 Dicrotendipes 157 Glyptotendipes 79 Kiefferulus 37 Paratanytarsus 17 Rheotanytarsus 4 Tanytarsus 11 Thienemannimyia grp. 2 Tribelos 15EPHEMEROPTERA Caenis latipennis 10 Callibaetis 2 Leptophlebiidae 1 Stenacron 62 Stenonema femoratum 1HEMIPTERA Neoplea 1LIMNOPHILA Ancylidae 2 Menetus 1 Physella 2ODONATA Argia 1RHYNCHOBDELLIDA Glossiphoniidae 2

LP = Leafpack
Aquid Invertebrate Database Bench Sheet ReportNorth Fk Spring R [0449241], Station #4g, Sample Date: 10/4/2004 1:55:00 PMORDER: TAXA LPAMPHIPODA Hyalella azteca 11DIPTERA Ablabesmyia 10 Anopheles 1 Dicrotendipes 39 Glyptotendipes 23 Kiefferulus 5 Nanocladius 1 Parachironomus 1 Paratanytarsus 2 Phaenopsectra 1 Polypedilum illinoense grp 1 Procladius 1 Rheotanytarsus 5 Tanytarsus 10 Thienemannimyia grp. 4 Tribelos 47EPHEMEROPTERA Caenis latipennis 2 Callibaetis 2 Stenacron 48LIMNOPHILA Physella 1ODONATA Argia 1 Enallagma 2TRICHOPTERA Cyrnellus fraternus 4
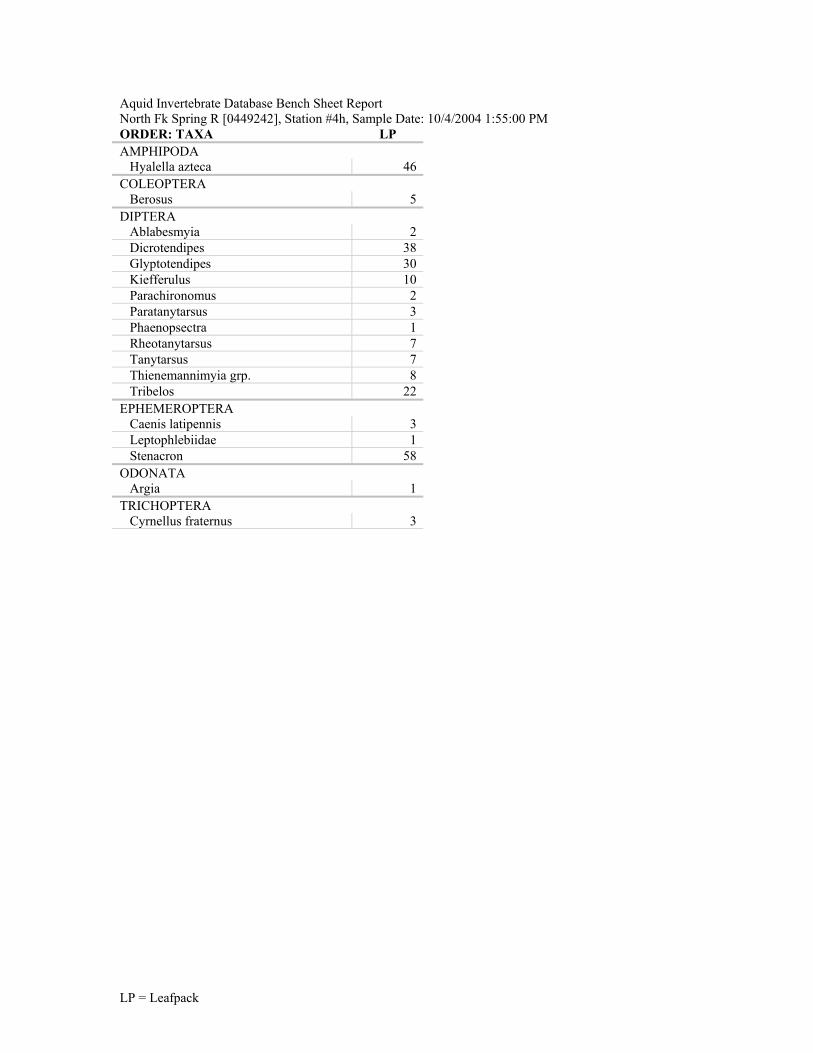
LP = Leafpack
Aquid Invertebrate Database Bench Sheet ReportNorth Fk Spring R [0449242], Station #4h, Sample Date: 10/4/2004 1:55:00 PMORDER: TAXA LPAMPHIPODA Hyalella azteca 46COLEOPTERA Berosus 5DIPTERA Ablabesmyia 2 Dicrotendipes 38 Glyptotendipes 30 Kiefferulus 10 Parachironomus 2 Paratanytarsus 3 Phaenopsectra 1 Rheotanytarsus 7 Tanytarsus 7 Thienemannimyia grp. 8 Tribelos 22EPHEMEROPTERA Caenis latipennis 3 Leptophlebiidae 1 Stenacron 58ODONATA Argia 1TRICHOPTERA Cyrnellus fraternus 3

LP = Leafpack
Aquid Invertebrate Database Bench Sheet ReportNorth Fk Spring R [0449243], Station #4i, Sample Date: 10/4/2004 1:55:00 PMORDER: TAXA LP"HYDRACARINA" Acarina 1AMPHIPODA Hyalella azteca 51DIPTERA Ablabesmyia 3 Chironomus 1 Culex 1 Dicrotendipes 44 Glyptotendipes 35 Kiefferulus 21 Parachironomus 2 Paratanytarsus 6 Phaenopsectra 3 Polypedilum illinoense grp 3 Procladius 2 Rheotanytarsus 2 Tanytarsus 5 Thienemannimyia grp. 6 Tribelos 50EPHEMEROPTERA Caenis latipennis 3 Callibaetis 2 Stenacron 68LIMNOPHILA Physella 1ODONATA Argia 2 Epicordulia 1TRICHOPTERA Cyrnellus fraternus 9

LP = Leafpack
Aquid Invertebrate Database Bench Sheet ReportNorth Fk Spring R [0449244], Station #3a, Sample Date: 10/4/2004 3:45:00 PMORDER: TAXA LP"HYDRACARINA" Acarina 1DIPTERA Ablabesmyia 25 Cricotopus bicinctus 1 Dicrotendipes 272 Glyptotendipes 7 Nanocladius 1 Paratanytarsus 1 Phaenopsectra 9 Polypedilum fallax grp 12 Polypedilum scalaenum grp 5 Procladius 3 Rheotanytarsus 4 Stenochironomus 3 Tanytarsus 24 Thienemannimyia grp. 8 Tribelos 59EPHEMEROPTERA Caenis latipennis 23 Stenacron 30LIMNOPHILA Physella 1ODONATA Argia 6TRICHOPTERA Cyrnellus fraternus 6

LP = Leafpack
Aquid Invertebrate Database Bench Sheet ReportNorth Fk Spring R [0449245], Station #3b, Sample Date: 10/4/2004 3:45:00 PMORDER: TAXA LP"HYDRACARINA" Acarina 1DIPTERA Ablabesmyia 14 Corynoneura 2 Cricotopus bicinctus 4 Cricotopus/Orthocladius 1 Dicrotendipes 163 Glyptotendipes 6 Labrundinia 1 Nanocladius 1 Paratanytarsus 6 Phaenopsectra 6 Polypedilum fallax grp 5 Polypedilum scalaenum grp 4 Rheotanytarsus 11 Stenochironomus 2 Tanytarsus 44 Thienemannimyia grp. 19 Tribelos 24EPHEMEROPTERA Caenis latipennis 17 Callibaetis 2 Stenacron 24LIMNOPHILA Ancylidae 1 Physella 3ODONATA Argia 7TRICHOPTERA Cyrnellus fraternus 7 Hydroptila 1

LP = Leafpack
Aquid Invertebrate Database Bench Sheet ReportNorth Fk Spring R [0449246], Station #3c, Sample Date: 10/4/2004 3:45:00 PMORDER: TAXA LP"HYDRACARINA" Acarina 1AMPHIPODA Hyalella azteca 1DIPTERA Ablabesmyia 19 Chironomus 2 Corynoneura 1 Cricotopus/Orthocladius 2 Dicrotendipes 302 Glyptotendipes 8 Kiefferulus 2 Labrundinia 1 Paratanytarsus 7 Phaenopsectra 2 Polypedilum fallax grp 1 Polypedilum illinoense grp 1 Polypedilum scalaenum grp 2 Rheotanytarsus 1 Stenochironomus 4 Tanytarsus 30 Thienemannimyia grp. 4 Tribelos 44EPHEMEROPTERA Caenis latipennis 13 Callibaetis 1 Stenacron 29 Stenonema femoratum 1ODONATA Argia 4TRICHOPTERA Cyrnellus fraternus 2

LP = Leafpack
Aquid Invertebrate Database Bench Sheet ReportNorth Fk Spring R [0449247], Station #3d, Sample Date: 10/4/2004 3:45:00 PMORDER: TAXA LPDIPTERA Ablabesmyia 14 Chironomus 1 Cricotopus bicinctus 1 Dicrotendipes 211 Glyptotendipes 20 Paratanytarsus 14 Phaenopsectra 3 Polypedilum scalaenum grp 2 Rheotanytarsus 5 Stenochironomus 3 Tanytarsus 35 Thienemannimyia grp. 8 Tribelos 49EPHEMEROPTERA Caenis latipennis 12 Callibaetis 1 Stenacron 26ODONATA Argia 5TRICHOPTERA Cyrnellus fraternus 7

LP = Leafpack
Aquid Invertebrate Database Bench Sheet ReportNorth Fk Spring R [0449248], Station #3e, Sample Date: 10/4/2004 3:45:00 PMORDER: TAXA LPAMPHIPODA Hyalella azteca 2COLEOPTERA Scirtes 2DIPTERA Ablabesmyia 26 Cricotopus/Orthocladius 1 Dicrotendipes 218 Glyptotendipes 10 Nanocladius 5 Paratanytarsus 18 Phaenopsectra 4 Polypedilum fallax grp 5 Polypedilum illinoense grp 2 Polypedilum scalaenum grp 4 Stenochironomus 8 Tanytarsus 41 Thienemannimyia grp. 16 Tribelos 39EPHEMEROPTERA Caenis latipennis 10 Callibaetis 1 Leptophlebiidae 2 Stenacron 28 Stenonema femoratum 1HEMIPTERA Neoplea 1LIMNOPHILA Menetus 2ODONATA Argia 9RHYNCHOBDELLIDA Glossiphoniidae 1TRICHOPTERA Cyrnellus fraternus 6
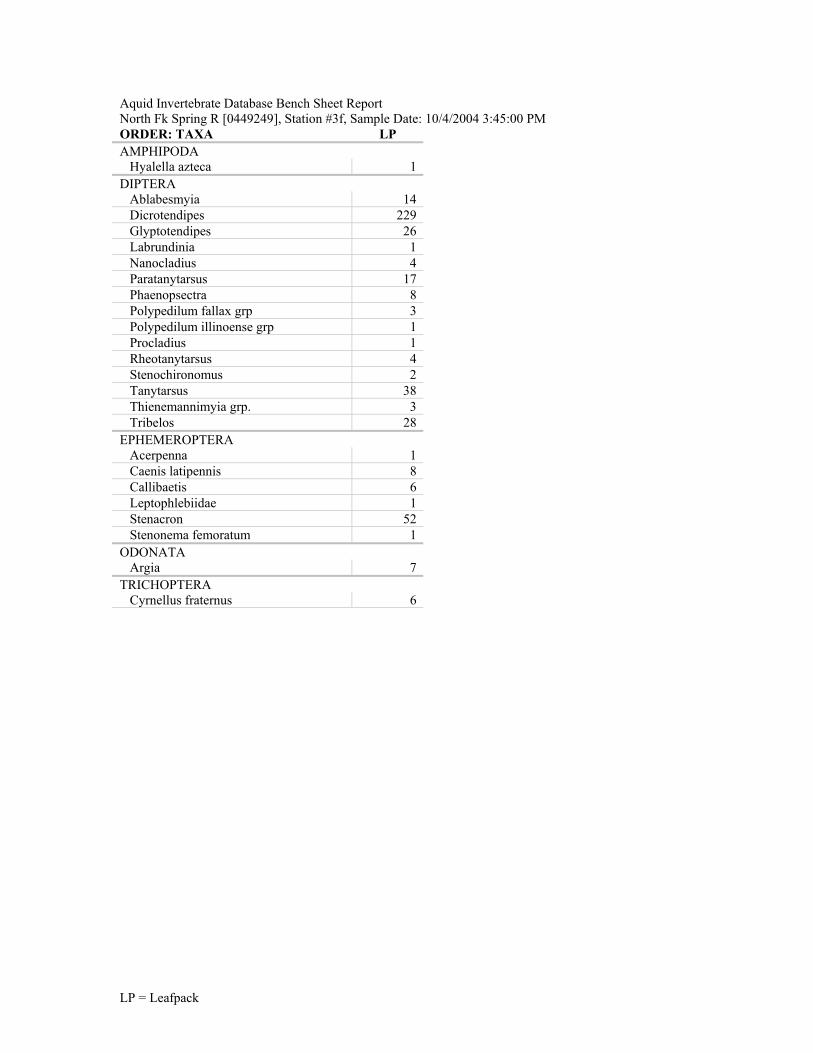
LP = Leafpack
Aquid Invertebrate Database Bench Sheet ReportNorth Fk Spring R [0449249], Station #3f, Sample Date: 10/4/2004 3:45:00 PMORDER: TAXA LPAMPHIPODA Hyalella azteca 1DIPTERA Ablabesmyia 14 Dicrotendipes 229 Glyptotendipes 26 Labrundinia 1 Nanocladius 4 Paratanytarsus 17 Phaenopsectra 8 Polypedilum fallax grp 3 Polypedilum illinoense grp 1 Procladius 1 Rheotanytarsus 4 Stenochironomus 2 Tanytarsus 38 Thienemannimyia grp. 3 Tribelos 28EPHEMEROPTERA Acerpenna 1 Caenis latipennis 8 Callibaetis 6 Leptophlebiidae 1 Stenacron 52 Stenonema femoratum 1ODONATA Argia 7TRICHOPTERA Cyrnellus fraternus 6

LP = Leafpack
Aquid Invertebrate Database Bench Sheet ReportNorth Fk Spring R [0449250], Station #3g, Sample Date: 10/4/2004 3:45:00 PMORDER: TAXA LPDIPTERA Ablabesmyia 23 Cricotopus/Orthocladius 2 Dicrotendipes 187 Glyptotendipes 7 Nanocladius 1 Paratanytarsus 8 Phaenopsectra 4 Polypedilum scalaenum grp 1 Procladius 3 Rheotanytarsus 4 Stenochironomus 1 Tanytarsus 29 Thienemanniella 1 Thienemannimyia grp. 4 Tribelos 55EPHEMEROPTERA Caenis latipennis 8 Callibaetis 1 Leptophlebiidae 1 Stenacron 56ODONATA Argia 7TRICHOPTERA Cyrnellus fraternus 17

LP = Leafpack
Aquid Invertebrate Database Bench Sheet ReportNorth Fk Spring R [0449251], Station #3h, Sample Date: 10/4/2004 3:45:00 PMORDER: TAXA LPDIPTERA Ablabesmyia 14 Cladotanytarsus 1 Cricotopus bicinctus 1 Dicrotendipes 100 Glyptotendipes 4 Paratanytarsus 4 Phaenopsectra 4 Rheotanytarsus 10 Stenochironomus 4 Tanytarsus 16 Thienemannimyia grp. 4 Tribelos 14EPHEMEROPTERA Caenis latipennis 9 Stenacron 38ODONATA Argia 4TRICHOPTERA Cyrnellus fraternus 14

LP = Leafpack
Aquid Invertebrate Database Bench Sheet ReportNorth Fk Spring R [0449252], Station #3i, Sample Date: 10/4/2004 3:45:00 PMORDER: TAXA LPDIPTERA Ablabesmyia 19 Chironomus 1 Cricotopus/Orthocladius 1 Dicrotendipes 165 Glyptotendipes 13 Kiefferulus 1 Paratanytarsus 16 Phaenopsectra 8 Polypedilum fallax grp 6 Polypedilum scalaenum grp 3 Rheotanytarsus 10 Stenochironomus 2 Tanytarsus 38 Thienemannimyia grp. 8 Tribelos 60EPHEMEROPTERA Caenis latipennis 9 Callibaetis 1 Stenacron 6LIMNOPHILA Ancylidae 1ODONATA Argia 9TRICHOPTERA Cyrnellus fraternus 15

LP = Leafpack
Aquid Invertebrate Database Bench Sheet ReportNorth Fk Spring R [0449255], Station #2c, Sample Date: 10/6/2004 8:45:00 AMORDER: TAXA LPDIPTERA Cricotopus bicinctus 2 Cricotopus/Orthocladius 1 Dicrotendipes 191 Glyptotendipes 37 Kiefferulus 2 Parachironomus 2 Paratanytarsus 14 Phaenopsectra 4 Rheotanytarsus 9 Stenochironomus 1 Tanytarsus 13EPHEMEROPTERA Caenis latipennis 2 Leptophlebiidae 1 Stenacron 6TRICHOPTERA Cyrnellus fraternus 2
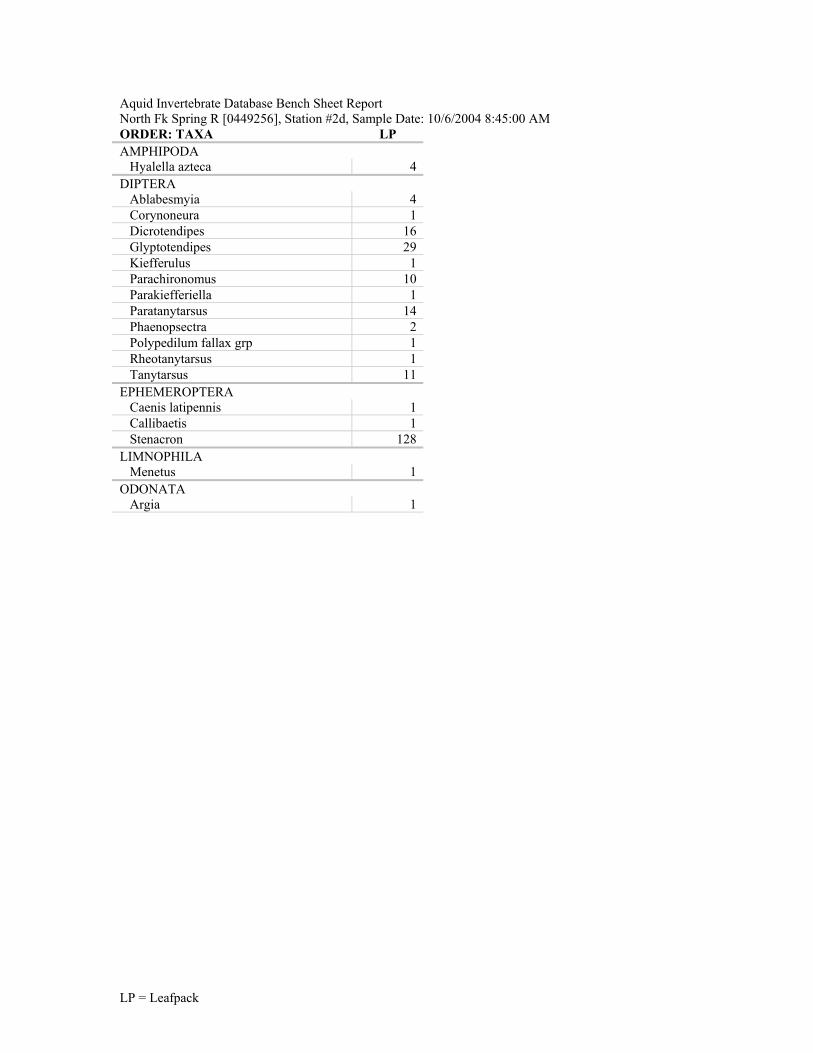
LP = Leafpack
Aquid Invertebrate Database Bench Sheet ReportNorth Fk Spring R [0449256], Station #2d, Sample Date: 10/6/2004 8:45:00 AMORDER: TAXA LPAMPHIPODA Hyalella azteca 4DIPTERA Ablabesmyia 4 Corynoneura 1 Dicrotendipes 16 Glyptotendipes 29 Kiefferulus 1 Parachironomus 10 Parakiefferiella 1 Paratanytarsus 14 Phaenopsectra 2 Polypedilum fallax grp 1 Rheotanytarsus 1 Tanytarsus 11EPHEMEROPTERA Caenis latipennis 1 Callibaetis 1 Stenacron 128LIMNOPHILA Menetus 1ODONATA Argia 1

LP = Leafpack
Aquid Invertebrate Database Bench Sheet ReportNorth Fk Spring R [0449257], Station #2e, Sample Date: 10/6/2004 8:45:00 AMORDER: TAXA LPAMPHIPODA Hyalella azteca 3DIPTERA Ablabesmyia 5 Dicrotendipes 57 Glyptotendipes 36 Parachironomus 7 Parakiefferiella 1 Paratanytarsus 22 Phaenopsectra 5 Polypedilum illinoense grp 1 Rheotanytarsus 1 Stenochironomus 1 Tanytarsus 24 Thienemannimyia grp. 1 Tribelos 4EPHEMEROPTERA Callibaetis 2 Stenacron 128 Stenonema femoratum 4LIMNOPHILA Ancylidae 3TRICHOPTERA Cyrnellus fraternus 3

LP = Leafpack
Aquid Invertebrate Database Bench Sheet ReportNorth Fk Spring R [0449258], Station #2f, Sample Date: 10/6/2004 8:45:00 AMORDER: TAXA LP"HYDRACARINA" Acarina 1COLEOPTERA Scirtes 1DIPTERA Ablabesmyia 6 Dicrotendipes 19 Glyptotendipes 24 Kiefferulus 2 Paratanytarsus 19 Phaenopsectra 4 Rheotanytarsus 1 Tanytarsus 14 Thienemannimyia grp. 2 Tribelos 1EPHEMEROPTERA Callibaetis 2 Leptophlebiidae 1 Stenacron 145 Stenonema femoratum 5HEMIPTERA Corixidae 1LIMNOPHILA Ancylidae 11 Menetus 6ODONATA Argia 1TRICHOPTERA Cyrnellus fraternus 3TRICLADIDA Planariidae 3

LP = Leafpack
Aquid Invertebrate Database Bench Sheet ReportNorth Fk Spring R [0449259], Station #2g, Sample Date: 10/6/2004 8:45:00 AMORDER: TAXA LP"HYDRACARINA" Acarina 2COLEOPTERA Dubiraphia 1 Scirtes 1DIPTERA Ablabesmyia 12 Cladotanytarsus 1 Corynoneura 1 Cricotopus bicinctus 1 Cricotopus/Orthocladius 3 Dicrotendipes 107 Glyptotendipes 27 Kiefferulus 1 Microtendipes 3 Parachironomus 2 Paratanytarsus 23 Phaenopsectra 3 Pseudochironomus 1 Rheotanytarsus 2 Stelechomyia 1 Stenochironomus 16 Tanytarsus 23 Thienemannimyia grp. 1 Tribelos 4EPHEMEROPTERA Caenis latipennis 1 Callibaetis 1 Leptophlebiidae 5 Stenacron 57 Stenonema femoratum 3HEMIPTERA Corixidae 3LIMNOPHILA Menetus 1ODONATA Argia 2 Enallagma 1TRICHOPTERA Cyrnellus fraternus 4 Hydroptila 2TRICLADIDA Planariidae 10

LP = Leafpack
Aquid Invertebrate Database Bench Sheet ReportNorth Fk Spring R [0449260], Station #2h, Sample Date: 10/6/2004 8:45:00 AMORDER: TAXA LP"HYDRACARINA" Acarina 1DIPTERA Ablabesmyia 2 Corynoneura 1 Dicrotendipes 67 Forcipomyiinae 1 Glyptotendipes 19 Labrundinia 1 Parachironomus 4 Paratanytarsus 17 Phaenopsectra 6 Polypedilum illinoense grp 2 Procladius 1 Rheotanytarsus 1 Stenochironomus 6 Tanytarsus 14 Thienemanniella 1 Thienemannimyia grp. 2EPHEMEROPTERA Caenis latipennis 1 Leptophlebiidae 1 Stenacron 62 Stenonema femoratum 6HEMIPTERA Rheumatobates 1ODONATA Argia 5TRICHOPTERA Cyrnellus fraternus 6TRICLADIDA Planariidae 9

LP = Leafpack
Aquid Invertebrate Database Bench Sheet ReportNorth Fk Spring R [0449261], Station #2i, Sample Date: 10/6/2004 8:45:00 AMORDER: TAXA LP"HYDRACARINA" Acarina 1DIPTERA Ablabesmyia 3 Cricotopus/Orthocladius 1 Dicrotendipes 99 Glyptotendipes 12 Parachironomus 1 Paratanytarsus 19 Phaenopsectra 9 Polypedilum fallax grp 1 Rheotanytarsus 2 Stenochironomus 2 Tanytarsus 16 Thienemannimyia grp. 1 Tribelos 1EPHEMEROPTERA Caenis latipennis 1 Leptophlebiidae 1 Stenacron 84 Stenonema femoratum 2ODONATA Argia 2TRICHOPTERA Cyrnellus fraternus 27 Hydroptila 2

LP = Leafpack
Aquid Invertebrate Database Bench Sheet ReportNorth Fk Spring R [0449262], Station #1a, Sample Date: 10/5/2004 3:15:00 PMORDER: TAXA LP"HYDRACARINA" Acarina 3ARHYNCHOBDELLIDA Erpobdellidae 1COLEOPTERA Berosus 1 Dubiraphia 1DIPTERA Ablabesmyia 11 Corynoneura 4 Cricotopus bicinctus 6 Cricotopus/Orthocladius 1 Dicrotendipes 36 Glyptotendipes 2 Labrundinia 2 Microtendipes 1 Nanocladius 19 Parachironomus 7 Paratanytarsus 8 Polypedilum fallax grp 1 Polypedilum illinoense grp 9 Polypedilum scalaenum grp 12 Rheotanytarsus 19 Stenochironomus 1 Tanytarsus 90 Thienemanniella 1 Thienemannimyia grp. 29 Tribelos 2EPHEMEROPTERA Caenis latipennis 11 Callibaetis 1 Stenacron 48 Stenonema femoratum 3TRICHOPTERA Cyrnellus fraternus 21 Hydroptila 11 Oecetis 4

LP = Leafpack
Aquid Invertebrate Database Bench Sheet ReportNorth Fk Spring R [0449263], Station #1b, Sample Date: 10/5/2004 3:15:00 PMORDER: TAXA LP"HYDRACARINA" Acarina 1AMPHIPODA Hyalella azteca 6DIPTERA Ablabesmyia 18 Corynoneura 1 Cricotopus/Orthocladius 1 Dicrotendipes 17 Glyptotendipes 3 Nanocladius 7 Parachironomus 5 Paratanytarsus 5 Phaenopsectra 1 Polypedilum fallax grp 1 Polypedilum illinoense grp 5 Polypedilum scalaenum grp 3 Rheotanytarsus 14 Stenochironomus 1 Tanytarsus 88 Thienemanniella 2 Thienemannimyia grp. 16 Tribelos 3EPHEMEROPTERA Caenis latipennis 3 Leptophlebiidae 2 Stenacron 44 Stenonema femoratum 5ODONATA Argia 2 Enallagma 1TRICHOPTERA Cernotina 1 Cyrnellus fraternus 12 Hydroptila 21 Nectopsyche 1 Oecetis 1

LP = Leafpack
Aquid Invertebrate Database Bench Sheet ReportNorth Fk Spring R [0449264], Station #1c, Sample Date: 10/5/2004 3:15:00 PMORDER: TAXA LPAMPHIPODA Hyalella azteca 17COLEOPTERA Dubiraphia 1DIPTERA Ablabesmyia 20 Anopheles 1 Corynoneura 4 Dicrotendipes 50 Glyptotendipes 5 Labrundinia 2 Nanocladius 26 Parachironomus 8 Parakiefferiella 1 Paratanytarsus 7 Phaenopsectra 2 Polypedilum convictum grp 2 Polypedilum illinoense grp 3 Polypedilum scalaenum grp 4 Rheotanytarsus 1 Stenochironomus 2 Tanytarsus 92 Thienemanniella 5 Thienemannimyia grp. 32 Tribelos 4EPHEMEROPTERA Caenis latipennis 12 Callibaetis 1 Leptophlebiidae 2 Stenacron 20 Stenonema femoratum 3ODONATA Argia 2 Enallagma 2TRICHOPTERA Cyrnellus fraternus 3 Hydroptila 2TRICLADIDA Planariidae 2

LP = Leafpack
Aquid Invertebrate Database Bench Sheet ReportNorth Fk Spring R [0449265], Station #1d, Sample Date: 10/5/2004 3:15:00 PMORDER: TAXA LP"HYDRACARINA" Acarina 5AMPHIPODA Hyalella azteca 2DIPTERA Ablabesmyia 8 Cladotanytarsus 1 Corynoneura 1 Cricotopus/Orthocladius 2 Dicrotendipes 18 Glyptotendipes 1 Microtendipes 2 Nanocladius 1 Paratanytarsus 32 Phaenopsectra 6 Procladius 2 Stenochironomus 5 Tanytarsus 8 Thienemanniella 1 Thienemannimyia grp. 13 Tribelos 5EPHEMEROPTERA Caenis latipennis 5 Callibaetis 1 Leptophlebiidae 2 Stenacron 68 Stenonema femoratum 3 Tricorythodes 1HEMIPTERA Corixidae 3ODONATA Argia 3 Enallagma 3RHYNCHOBDELLIDA Glossiphoniidae 1TRICHOPTERA Cernotina 1 Cyrnellus fraternus 32 Hydroptila 43

LP = Leafpack
Aquid Invertebrate Database Bench Sheet ReportNorth Fk Spring R [0449266], Station #1e, Sample Date: 10/5/2004 3:15:00 PMORDER: TAXA LP"HYDRACARINA" Acarina 1AMPHIPODA Hyalella azteca 12COLEOPTERA Dineutus 1DIPTERA Ablabesmyia 7 Dicrotendipes 11 Forcipomyiinae 1 Nanocladius 1 Parakiefferiella 1 Paratanytarsus 4 Polypedilum illinoense grp 1 Polypedilum scalaenum grp 1 Rheotanytarsus 5 Stenochironomus 2 Tanytarsus 14 Thienemannimyia grp. 10 Tribelos 1EPHEMEROPTERA Caenis latipennis 6 Callibaetis 4 Leptophlebiidae 1 Stenacron 33 Stenonema femoratum 12LIMNOPHILA Ancylidae 2 Menetus 1ODONATA Enallagma 1TRICHOPTERA Cyrnellus fraternus 8 Hydroptila 1 Nectopsyche 3 Oecetis 2
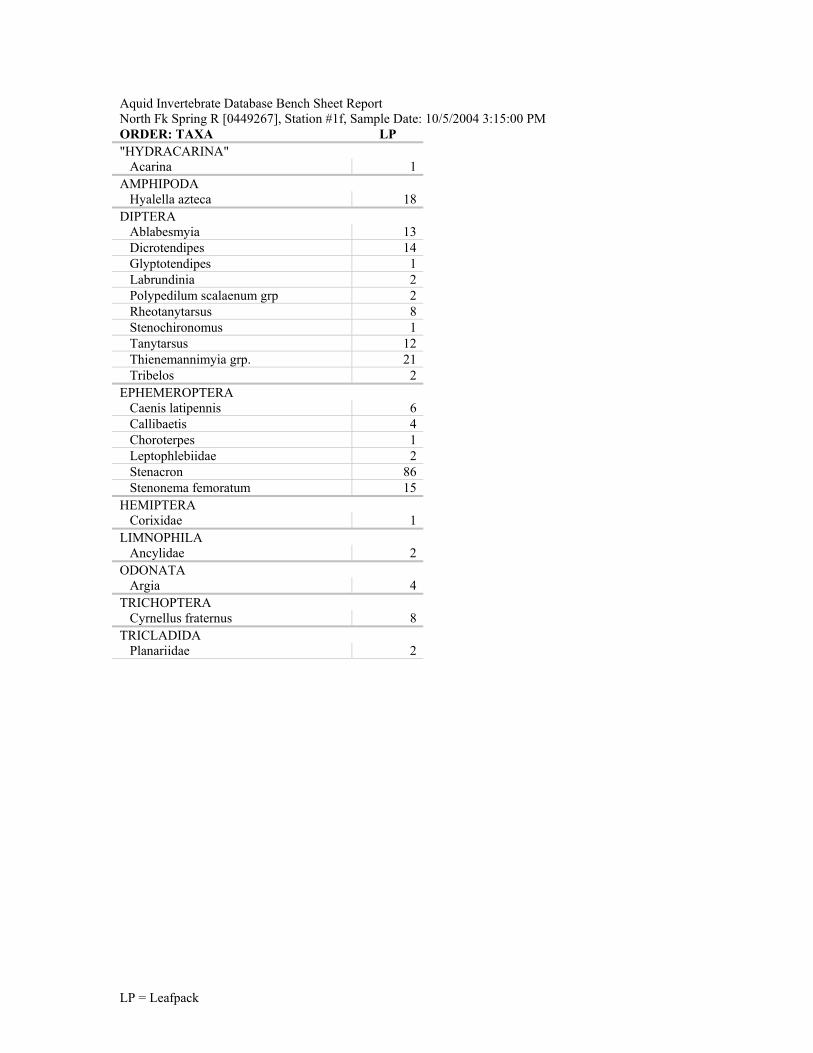
LP = Leafpack
Aquid Invertebrate Database Bench Sheet ReportNorth Fk Spring R [0449267], Station #1f, Sample Date: 10/5/2004 3:15:00 PMORDER: TAXA LP"HYDRACARINA" Acarina 1AMPHIPODA Hyalella azteca 18DIPTERA Ablabesmyia 13 Dicrotendipes 14 Glyptotendipes 1 Labrundinia 2 Polypedilum scalaenum grp 2 Rheotanytarsus 8 Stenochironomus 1 Tanytarsus 12 Thienemannimyia grp. 21 Tribelos 2EPHEMEROPTERA Caenis latipennis 6 Callibaetis 4 Choroterpes 1 Leptophlebiidae 2 Stenacron 86 Stenonema femoratum 15HEMIPTERA Corixidae 1LIMNOPHILA Ancylidae 2ODONATA Argia 4TRICHOPTERA Cyrnellus fraternus 8TRICLADIDA Planariidae 2

LP = Leafpack
Aquid Invertebrate Database Bench Sheet ReportNorth Fk Spring R [0449268], Station #1g, Sample Date: 10/5/2004 3:15:00 PMORDER: TAXA LP"HYDRACARINA" Acarina 1AMPHIPODA Hyalella azteca 2DIPTERA Ablabesmyia 20 Corynoneura 1 Dicrotendipes 55 Glyptotendipes 4 Labrundinia 2 Microtendipes 1 Nanocladius 7 Paratanytarsus 4 Phaenopsectra 2 Polypedilum 1 Polypedilum fallax grp 2 Polypedilum scalaenum grp 28 Rheotanytarsus 1 Stenochironomus 2 Tanytarsus 41 Thienemanniella 3 Thienemannimyia grp. 16 Tribelos 22EPHEMEROPTERA Caenis latipennis 35 Callibaetis 5 Stenacron 92 Stenonema femoratum 8ODONATA Argia 1TRICHOPTERA Cernotina 1 Cyrnellus fraternus 6 Hydroptila 4 Nectopsyche 1 Orthotrichia 7

LP = Leafpack
Aquid Invertebrate Database Bench Sheet ReportNorth Fk Spring R [0449269], Station #1h, Sample Date: 10/5/2004 3:15:00 PMORDER: TAXA LPAMPHIPODA Hyalella azteca 3DIPTERA Ablabesmyia 11 Corynoneura 1 Cricotopus/Orthocladius 1 Dicrotendipes 29 Glyptotendipes 2 Labrundinia 2 Nanocladius 4 Paratanytarsus 10 Phaenopsectra 4 Polypedilum 2 Polypedilum fallax grp 1 Polypedilum illinoense grp 2 Polypedilum scalaenum grp 11 Rheotanytarsus 1 Stenochironomus 5 Tanytarsus 36 Thienemanniella 3 Thienemannimyia grp. 9 Tribelos 11EPHEMEROPTERA Caenis latipennis 15 Stenacron 41 Stenonema femoratum 9ODONATA Argia 1 Enallagma 2 Nasiaeschna pentacantha 1TRICHOPTERA Cyrnellus fraternus 5 Hydroptila 3 Oecetis 1 Orthotrichia 1

LP = Leafpack
Aquid Invertebrate Database Bench Sheet ReportNorth Fk Spring R [0449270], Station #1i, Sample Date: 10/5/2004 3:15:00 PMORDER: TAXA LP"HYDRACARINA" Acarina 1DIPTERA Ablabesmyia 11 Dicrotendipes 13 Microtendipes 1 Nanocladius 1 Paratanytarsus 2 Phaenopsectra 6 Polypedilum 1 Polypedilum fallax grp 2 Polypedilum illinoense grp 2 Polypedilum scalaenum grp 12 Stenochironomus 6 Tanytarsus 14 Thienemannimyia grp. 4 Tribelos 17EPHEMEROPTERA Caenis latipennis 10 Callibaetis 2 Procloeon 1 Stenacron 47 Stenonema femoratum 9LIMNOPHILA Ancylidae 1TRICHOPTERA Cyrnellus fraternus 2 Hydroptila 1 Oecetis 1

LP = Leafpack
Aquid Invertebrate Database Bench Sheet ReportFlat Rock Ck [0449280], Station #2a, Sample Date: 10/5/2004 11:45:00 AMORDER: TAXA LP"HYDRACARINA" Acarina 1DIPTERA Ablabesmyia 4 Dicrotendipes 4 Glyptotendipes 11 Kiefferulus 1 Microtendipes 1 Parachironomus 2 Paratanytarsus 1 Stenochironomus 3 Tanytarsus 13 Thienemannimyia grp. 2 Tribelos 5EPHEMEROPTERA Callibaetis 1 Leptophlebiidae 1 Stenacron 9 Stenonema femoratum 7HEMIPTERA Corixidae 3LIMNOPHILA Ancylidae 2 Menetus 4TRICLADIDA Planariidae 1

LP = Leafpack
Aquid Invertebrate Database Bench Sheet ReportFlat Rock Ck [0449281], Station #2b, Sample Date: 10/5/2004 11:45:00 AMORDER: TAXA LP"HYDRACARINA" Acarina 2DIPTERA Ablabesmyia 2 Corynoneura 2 Dicrotendipes 8 Glyptotendipes 20 Kiefferulus 1 Nanocladius 1 Parachironomus 6 Phaenopsectra 19 Polypedilum illinoense grp 1 Stenochironomus 4 Tanytarsus 42 Thienemannimyia grp. 2 Tribelos 31EPHEMEROPTERA Caenis latipennis 3 Callibaetis 2 Heptageniidae 1 Stenacron 1 Stenonema femoratum 2HEMIPTERA Corixidae 2LIMNOPHILA Ancylidae 6 Menetus 6ODONATA Argia 2TRICHOPTERA Cyrnellus fraternus 6TUBIFICIDA Branchiura sowerbyi 1

LP = Leafpack
Aquid Invertebrate Database Bench Sheet ReportFlat Rock Ck [0449282], Station #2c, Sample Date: 10/5/2004 11:45:00 AMORDER: TAXA LPCOLEOPTERA Hydroporus 1DIPTERA Ablabesmyia 2 Corynoneura 1 Dicrotendipes 11 Glyptotendipes 21 Kiefferulus 1 Labrundinia 1 Microtendipes 1 Parachironomus 3 Parakiefferiella 1 Paratanytarsus 1 Phaenopsectra 1 Stenochironomus 2 Tanytarsus 53 Tribelos 15EPHEMEROPTERA Caenis latipennis 4 Callibaetis 1 Stenacron 4 Stenonema femoratum 3HEMIPTERA Corixidae 4ODONATA Argia 2 Enallagma 1TRICHOPTERA Cyrnellus fraternus 6VENEROIDEA Sphaeriidae 1

LP = Leafpack
Aquid Invertebrate Database Bench Sheet ReportFlat Rock Ck [0449283], Station #2d, Sample Date: 10/5/2004 11:45:00 AMORDER: TAXA LPDIPTERA Ablabesmyia 1 Anopheles 1 Dicrotendipes 3 Glyptotendipes 10 Labrundinia 1 Nanocladius 1 Parachironomus 1 Parakiefferiella 1 Polypedilum fallax grp 1 Tanytarsus 24 Thienemannimyia grp. 9 Tribelos 2EPHEMEROPTERA Caenis latipennis 1 Heptageniidae 2 Leptophlebiidae 13 Stenacron 26 Stenonema femoratum 13ODONATA Argia 2 Enallagma 4TRICHOPTERA Cyrnellus fraternus 5 Oecetis 1TRICLADIDA Planariidae 1

LP = Leafpack
Aquid Invertebrate Database Bench Sheet ReportFlat Rock Ck [0449284], Station #2e, Sample Date: 10/5/2004 11:45:00 AMORDER: TAXA LP"HYDRACARINA" Acarina 1AMPHIPODA Hyalella azteca 1DIPTERA Dicrotendipes 14 Glyptotendipes 4 Parachironomus 3 Phaenopsectra 2 Tanytarsus 59 Thienemannimyia grp. 26 Tribelos 1EPHEMEROPTERA Caenis latipennis 1 Leptophlebiidae 14 Stenacron 15 Stenonema femoratum 17LIMNOPHILA Ancylidae 1ODONATA Argia 6TRICHOPTERA Cyrnellus fraternus 3 Hydroptila 1

LP = Leafpack
Aquid Invertebrate Database Bench Sheet ReportFlat Rock Ck [0449285], Station #2f, Sample Date: 10/5/2004 11:45:00 AMORDER: TAXA LPAMPHIPODA Hyalella azteca 2DIPTERA Ablabesmyia 1 Dicrotendipes 19 Glyptotendipes 21 Kiefferulus 1 Labrundinia 1 Nanocladius 2 Nilothauma 5 Parachironomus 4 Paratanytarsus 3 Phaenopsectra 5 Stenochironomus 10 Tanytarsus 54 Thienemanniella 3 Thienemannimyia grp. 47 Tribelos 3EPHEMEROPTERA Caenis latipennis 1 Leptophlebiidae 8 Stenacron 51 Stenonema femoratum 17HEMIPTERA Corixidae 1ODONATA Argia 11 Enallagma 2TRICHOPTERA Cyrnellus fraternus 12 Oecetis 5TRICLADIDA Planariidae 4
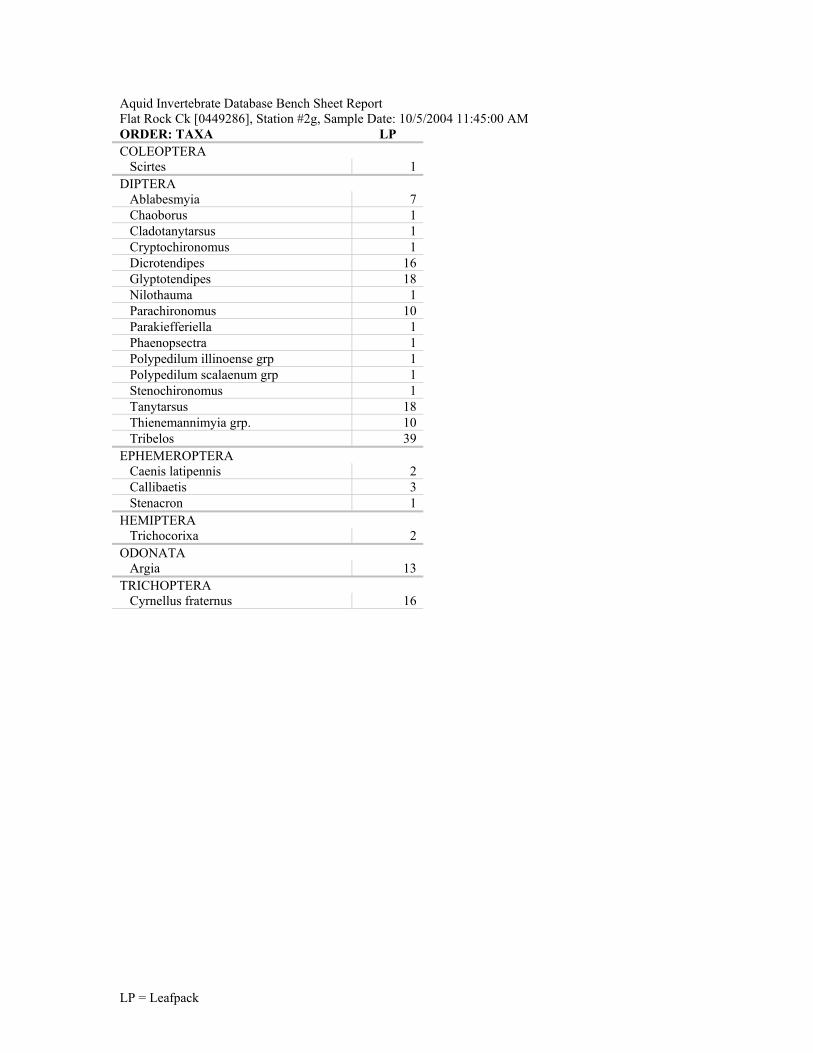
LP = Leafpack
Aquid Invertebrate Database Bench Sheet ReportFlat Rock Ck [0449286], Station #2g, Sample Date: 10/5/2004 11:45:00 AMORDER: TAXA LPCOLEOPTERA Scirtes 1DIPTERA Ablabesmyia 7 Chaoborus 1 Cladotanytarsus 1 Cryptochironomus 1 Dicrotendipes 16 Glyptotendipes 18 Nilothauma 1 Parachironomus 10 Parakiefferiella 1 Phaenopsectra 1 Polypedilum illinoense grp 1 Polypedilum scalaenum grp 1 Stenochironomus 1 Tanytarsus 18 Thienemannimyia grp. 10 Tribelos 39EPHEMEROPTERA Caenis latipennis 2 Callibaetis 3 Stenacron 1HEMIPTERA Trichocorixa 2ODONATA Argia 13TRICHOPTERA Cyrnellus fraternus 16

LP = Leafpack
Aquid Invertebrate Database Bench Sheet ReportFlat Rock Ck [0449287], Station #2h, Sample Date: 10/5/2004 11:45:00 AMORDER: TAXA LPDIPTERA Ablabesmyia 10 Dicrotendipes 9 Glyptotendipes 17 Kiefferulus 2 Microtendipes 1 Parachironomus 4 Parakiefferiella 1 Procladius 1 Stenochironomus 1 Tanytarsus 14 Thienemannimyia grp. 7 Tribelos 31EPHEMEROPTERA Caenis latipennis 1 Callibaetis 2 Leptophlebiidae 1 Stenacron 13 Stenonema femoratum 2HEMIPTERA Corixidae 3LIMNOPHILA Physella 1ODONATA Argia 9TRICHOPTERA Cyrnellus fraternus 36 Hydroptila 1TRICLADIDA Planariidae 1

LP = Leafpack
Aquid Invertebrate Database Bench Sheet ReportFlat Rock Ck [0449288], Station #2i, Sample Date: 10/5/2004 11:45:00 AMORDER: TAXA LPDECAPODA Palaemonetes kadiakensis 1DIPTERA Ablabesmyia 5 Cryptochironomus 1 Dicrotendipes 3 Glyptotendipes 12 Kiefferulus 3 Nilotanypus 1 Phaenopsectra 1 Stenochironomus 5 Tanytarsus 10 Thienemannimyia grp. 6 Tribelos 32EPHEMEROPTERA Caenis latipennis 1 Callibaetis 2 Leptophlebiidae 1 Stenacron 10 Stenonema femoratum 1LIMNOPHILA Menetus 1 Physella 1ODONATA Argia 1TRICHOPTERA Cyrnellus fraternus 27

LP = Leafpack
Aquid Invertebrate Database Bench Sheet ReportLittle Drywood Ck [0449289], Station #1a, Sample Date: 10/6/2004 11:30:00 AMORDER: TAXA LP"HYDRACARINA" Acarina 4AMPHIPODA Hyalella azteca 2DIPTERA Ablabesmyia 6 Axarus 1 Chaoborus 1 Chironomus 2 Cladotanytarsus 4 Dicrotendipes 14 Kiefferulus 2 Paratanytarsus 1 Phaenopsectra 6 Polypedilum fallax grp 2 Procladius 5 Rheotanytarsus 2 Stenochironomus 67 Tanytarsus 3 Thienemannimyia grp. 11 Tribelos 3EPHEMEROPTERA Caenis latipennis 12 Leptophlebiidae 5 Stenacron 123HEMIPTERA Corixidae 1LIMNOPHILA Ancylidae 8 Ferrissia 3 Menetus 2 Physella 4ODONATA Argia 3TRICHOPTERA Cyrnellus fraternus 4

LP = Leafpack
Aquid Invertebrate Database Bench Sheet ReportLittle Drywood Ck [0449290], Station #1b, Sample Date: 10/6/2004 11:30:00 AMORDER: TAXA LP"HYDRACARINA" Acarina 7AMPHIPODA Hyalella azteca 1DIPTERA Ablabesmyia 14 Cladotanytarsus 1 Corynoneura 2 Cryptochironomus 1 Dicrotendipes 16 Glyptotendipes 2 Paratanytarsus 1 Phaenopsectra 1 Procladius 7 Rheotanytarsus 1 Stenochironomus 63 Tanytarsus 7 Thienemannimyia grp. 21 Tribelos 4EPHEMEROPTERA Caenis latipennis 20 Hexagenia 1 Leptophlebiidae 3 Procloeon 1 Stenacron 138 Stenonema femoratum 4LIMNOPHILA Ancylidae 2 Ferrissia 1 Menetus 1 Physella 1ODONATA Argia 1TRICHOPTERA Hydroptila 1 Oecetis 5TUBIFICIDA Tubificidae 3

LP = Leafpack
Aquid Invertebrate Database Bench Sheet ReportLittle Drywood Ck [0449291], Station #1c, Sample Date: 10/6/2004 11:30:00 AMORDER: TAXA LP"HYDRACARINA" Acarina 2AMPHIPODA Hyalella azteca 3ARHYNCHOBDELLIDA Erpobdellidae 1DIPTERA Ablabesmyia 15 Corynoneura 1 Dicrotendipes 21 Glyptotendipes 1 Microtendipes 1 Parakiefferiella 1 Paratanytarsus 3 Phaenopsectra 18 Polypedilum fallax grp 2 Polypedilum scalaenum grp 1 Procladius 2 Rheotanytarsus 3 Stenochironomus 80 Tanytarsus 3 Thienemannimyia grp. 37 Tribelos 11EPHEMEROPTERA Caenis latipennis 7 Leptophlebiidae 13 Stenacron 190 Stenonema femoratum 2ISOPODA Lirceus 5LIMNOPHILA Ancylidae 7 Ferrissia 5 Menetus 1 Physella 3ODONATA Argia 3TRICHOPTERA Cyrnellus fraternus 1 Hydroptila 1TRICLADIDA Planariidae 1VENEROIDEA Sphaeriidae 1

LP = Leafpack
Aquid Invertebrate Database Bench Sheet ReportLittle Drywood Ck [0449292], Station #1d, Sample Date: 10/6/2004 11:30:00 AMORDER: TAXA LP"HYDRACARINA" Acarina 1AMPHIPODA Hyalella azteca 1COLEOPTERA Dubiraphia 1DIPTERA Ablabesmyia 11 Dicrotendipes 16 Labrundinia 1 Nanocladius 6 Nilothauma 1 Paratanytarsus 9 Phaenopsectra 5 Rheotanytarsus 3 Stenochironomus 60 Tanytarsus 6 Thienemanniella 1 Thienemannimyia grp. 15EPHEMEROPTERA Baetidae 1 Caenis latipennis 5 Leptophlebiidae 19 Stenacron 198 Stenonema femoratum 2LIMNOPHILA Ancylidae 2ODONATA Argia 1TRICHOPTERA Cyrnellus fraternus 2 Hydroptila 1

LP = Leafpack
Aquid Invertebrate Database Bench Sheet ReportLittle Drywood Ck [0449293], Station #1e, Sample Date: 10/6/2004 11:30:00 AMORDER: TAXA LP"HYDRACARINA" Acarina 1AMPHIPODA Hyalella azteca 7DIPTERA Ablabesmyia 4 Dicrotendipes 25 Glyptotendipes 1 Microtendipes 1 Nanocladius 2 Parachironomus 1 Parakiefferiella 1 Paratanytarsus 5 Phaenopsectra 13 Polypedilum fallax grp 1 Polypedilum scalaenum grp 1 Stenochironomus 58 Tanytarsus 3 Thienemanniella 1 Thienemannimyia grp. 8 Tribelos 1EPHEMEROPTERA Caenis latipennis 6 Leptophlebiidae 21 Procloeon 2 Stenacron 114 Stenonema femoratum 7ISOPODA Lirceus 2LIMNOPHILA Ancylidae 6 Ferrissia 1 Physella 2ODONATA Argia 4TRICHOPTERA Hydroptila 1TRICLADIDA Planariidae 8TUBIFICIDA Tubificidae 1

LP = Leafpack
Aquid Invertebrate Database Bench Sheet ReportLittle Drywood Ck [0449294], Station #1f, Sample Date: 10/6/2004 11:30:00 AMORDER: TAXA LPAMPHIPODA Hyalella azteca 1DIPTERA Ablabesmyia 12 Dicrotendipes 15 Microtendipes 1 Nanocladius 1 Parachironomus 1 Paratanytarsus 4 Phaenopsectra 13 Polypedilum fallax grp 1 Rheotanytarsus 1 Stenochironomus 52 Tanytarsus 8 Thienemannimyia grp. 11 Tribelos 6EPHEMEROPTERA Acerpenna 2 Caenis latipennis 5 Leptophlebiidae 18 Stenacron 103 Stenonema femoratum 4ISOPODA Lirceus 1LIMNOPHILA Ancylidae 1 Ferrissia 1ODONATA Argia 3TRICHOPTERA Hydroptila 1

LP = Leafpack
Aquid Invertebrate Database Bench Sheet ReportLittle Drywood Ck [0449295], Station #1g, Sample Date: 10/6/2004 11:30:00 AMORDER: TAXA LPCOLEOPTERA Hydroporus 1 Scirtes 1DIPTERA Ablabesmyia 1 Dicrotendipes 9 Glyptotendipes 4 Paratanytarsus 1 Phaenopsectra 8 Polypedilum fallax grp 3 Rheotanytarsus 2 Stenochironomus 30 Tanytarsus 2 Thienemannimyia grp. 8 Tribelos 3EPHEMEROPTERA Caenis latipennis 13 Leptophlebiidae 11 Stenacron 47LIMNOPHILA Ancylidae 1TRICHOPTERA Cernotina 1

LP = Leafpack
Aquid Invertebrate Database Bench Sheet ReportLittle Drywood Ck [0449296], Station #1h, Sample Date: 10/6/2004 11:30:00 AMORDER: TAXA LP"HYDRACARINA" Acarina 2COLEOPTERA Paracymus 1DIPTERA Ablabesmyia 4 Corynoneura 1 Dicrotendipes 7 Glyptotendipes 2 Paratanytarsus 3 Phaenopsectra 6 Polypedilum fallax grp 2 Procladius 1 Stenochironomus 30 Thienemannimyia grp. 5 Tribelos 1EPHEMEROPTERA Leptophlebiidae 6 Stenacron 53 Stenonema femoratum 2ISOPODA Lirceus 3LIMNOPHILA Ancylidae 1ODONATA Argia 1

LP = Leafpack
Aquid Invertebrate Database Bench Sheet ReportLittle Drywood Ck [0449297], Station #1i, Sample Date: 10/6/2004 11:30:00 AMORDER: TAXA LPAMPHIPODA Hyalella azteca 1DIPTERA Ablabesmyia 15 Dicrotendipes 39 Glyptotendipes 1 Labrundinia 1 Microtendipes 1 Nanocladius 2 Parachironomus 1 Parakiefferiella 2 Paratanytarsus 2 Phaenopsectra 16 Polypedilum scalaenum grp 2 Rheotanytarsus 5 Stenochironomus 39 Tanytarsus 13 Thienemannimyia grp. 33 Tribelos 7EPHEMEROPTERA Caenis latipennis 10 Leptophlebiidae 10 Stenacron 94 Stenonema femoratum 2TRICHOPTERA Hydroptila 1TRICLADIDA Planariidae 1