lower duwamish waterway remedial investigation report, maps sec 5-8 ri/final_ldw_ri… · ·...
TRANSCRIPT

Slip 4
Kellogg I.
Slip 1
Slip 3
Slip 2
Upper Turning Basin
Slip 6
Harbor I.
M1
M2
M3
M4
2.2
0.1
5.3
5.2
5.1
4.94 .
8
4 .7
4.6
4.5
4.4
4.3
4.2
4.1
3.9
3.8
3.7
3.6
3.5
3.4
3.3
3.2
3.1
2.9
2.8
2.7
2.6
2.5
2.4
2.3
5.4
2.1
1.9
1.8
1.7
1.6
1.5
1.4
1.3
1.2
1.1
0.9
0.8
0.7
0.6
0.5
0.4
0.3
0.2
5.5
0.0
5.0
4.0
3.0
2.0
1.0
Pre
pare
d by
CE
H, 0
7/15
/201
0; M
AP
#23
79; W
:\Pro
ject
s\00
-08-
06_D
uwam
ish_
RI\d
ata\
gis\
Pha
se2
RI\E
RA
Sum
mar
y
±Map 5-1. Modeling areas in the LDW used inthe fish exposure assessment and the foodweb model
Modeling area
M1
M2
M3
M4
Navigation channel
River mile
LLCWindWardenvironmental
0 0.25 0.5Miles
0 0.25 0.5Kilometers
Slip 1
Slip 2
Kellogg I.
Harbor I.
Slip 3
Exposure
Area 1
Exposure
Area 2
2.2
2.4
2.3
2.1
1.9
1.8
1.7
1.6
1.5
1.4
1.3
1.2
1.1
0.9
0.8
0.7
0.6
0.5
0.4
0.3
0.2
0.1
0.0
2.0
1.0
Slip 4
Slip 6
UpperTurningBasin
Exposure
Area 3
5.1
4.9
4.8
4.7
4.6
4.5
4.4
4.3
4.2
4.1
3.9
3.8
3.7
3.6
3.5
3.4
3.3
3.2
3.1
2.9
2.8
2.7
2.6
2.5
2.4
3.0
5.0
4.0
Pre
pare
d by
CE
H, 0
7/15
/201
0; M
ap 2
283;
W:\P
roje
cts\
00-0
8-06
_Duw
amis
h_R
I\dat
a\gi
s\P
hase
2 R
I\ER
A S
umm
ary
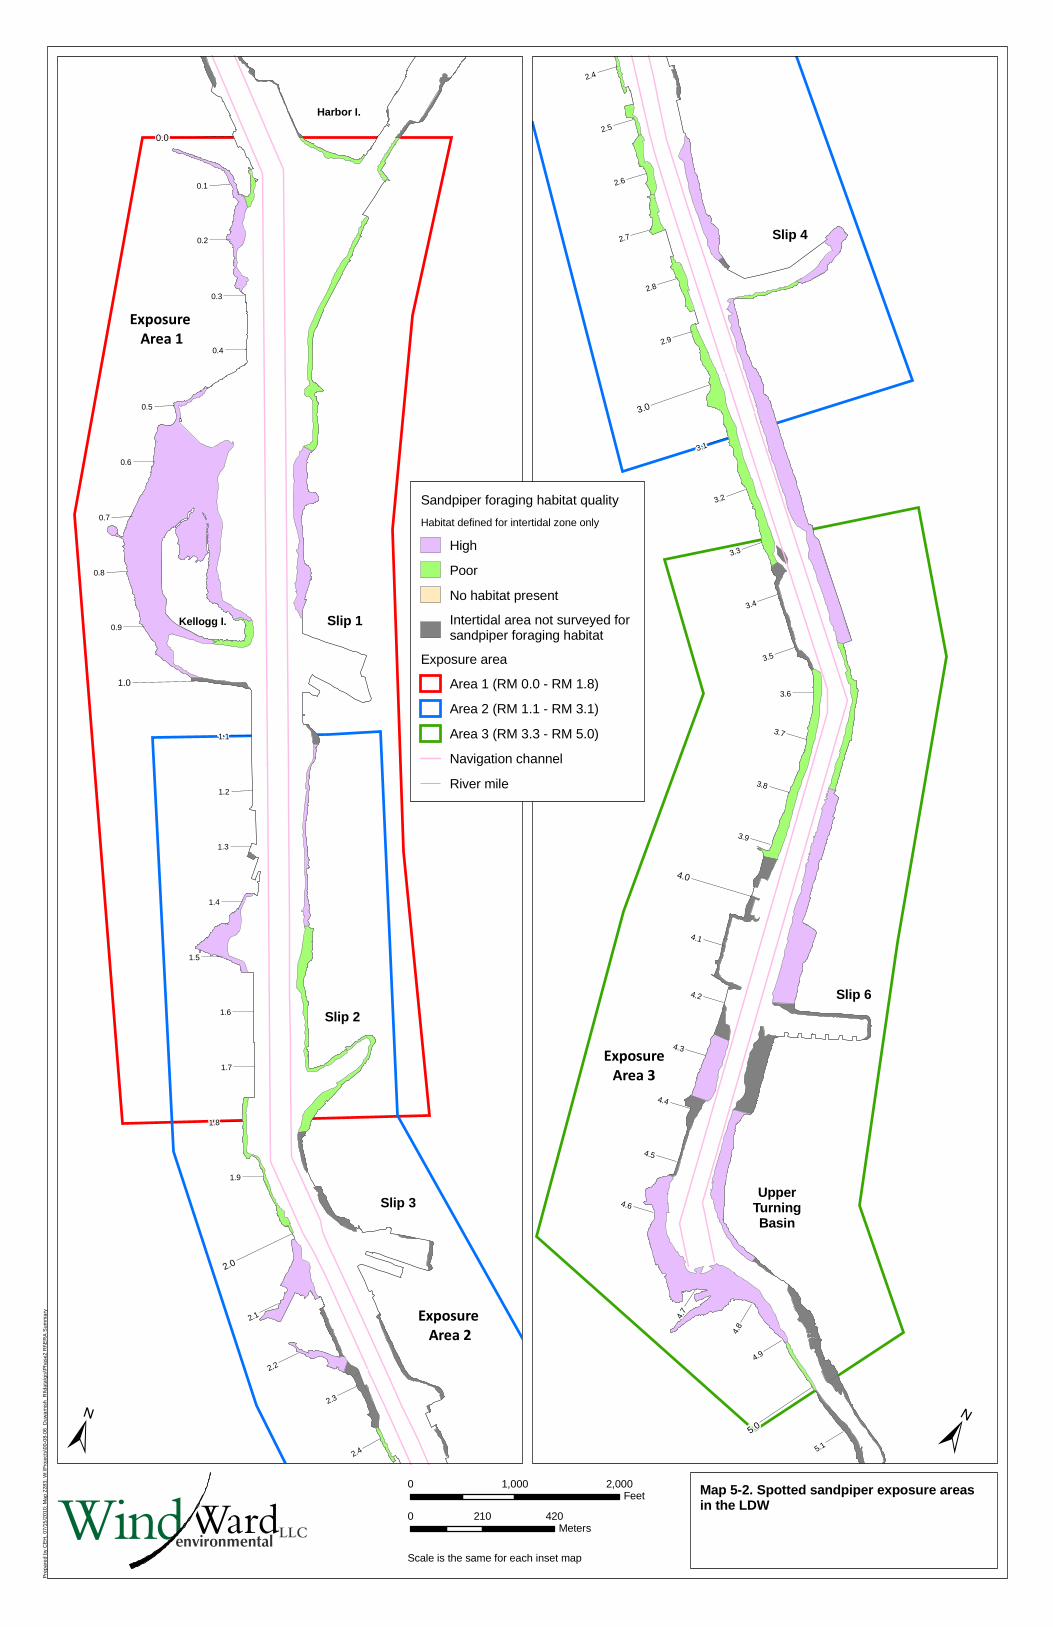
±Map 5-2. Spotted sandpiper exposure areas in the LDW
Sandpiper foraging habitat quality
Habitat defined for intertidal zone only
High
Poor
No habitat present
Intertidal area not surveyed for sandpiper foraging habitat
Exposure area
Area 1 (RM 0.0 - RM 1.8)
Area 2 (RM 1.1 - RM 3.1)
Area 3 (RM 3.3 - RM 5.0)
Navigation channel
River mile
±
Scale is the same for each inset map
0 1,000 2,000Feet
0 210 420Meters
LLCWindWardenvironmental

!
!
!
!
!
!
!
!
!
!
!!
!
!
!
!
!
!
!
!
!
!
!
!!
!
!
!
!
!
!
!
!
!
!!
!
!
!
!
!
!
!
!
!
!
!!
!
!
!
!!
!
!
!
!
!
!
!
!
!
!
!
!
!
!
!
!
!
!
!
!
!
!
!
!
!
!
!
!
Kellogg I.
Slip 1
Slip 2
DiagonalAve S
restorationarea
Employee access only;area fenced to keep
out public
Steep bank (riprap) with no public access
from upland side
BP Gypsumowns property;
access controlledby guards anddogs; no public
access
Unfencedindustrial propertywith steep riprap-
covered bank
T-105
Harbor I.
1.0
Herring's HousePark
1
32
Total
risk =
2x10⁻⁵
Total
risk =
5x10⁻⁵
Total
risk =
3x10⁻⁵
LAFARGE CORP
LIPSETT CO LLC
PORT OFSEATTLE
PORT OF SEATTLE
ANDERSON, DOROTHY
PORT OF SEATTLE
GLACIER NORTHWEST INC
DUWAMISH SHIPYARD INC
ALASKA MARINE LINES INC
SEATTLE PARKS DEPT
GENERAL RECYCLINGOF WASHINGTON LLC
BPB GYPSUM INC
KING COUNTY
FEDERALGOVERNMENT
PORT OFSEATTLE
SAINT-GOBAINCONTAINERS
KING COUNTY
KING COUNTY
KING COUNTY
KING COUNTY
LIPSETT CO LLC
PORT OF SEATTLE
PORT OF SEATTLE
GENERAL RECYCLINGOF WASHINGTON LLC
PORT OFSEATTLE
PORT OFSEATTLE
PORT OFSEATTLE
CHEMITHON CORP
PORT OF SEATTLE
GLACIER NORTHWEST INC
LONE STARINVESTORS LLP
1.7
1.6
1.5
1.4
1.3
1.2
1.1
0.1
0.2
0.3
0.4
0.6
0.5
0.0
!
!
!
!
!
!
!
!
!
!
!
!
!!
!
!
!
!
!
!
!
!
!
!
!
!
!
!
!
!
!
!
!
!
!
!
!
!
!
!
!
!
!
!
!
!
!
!
!
!!
!
!
!
!
!
!
!!!
!!!
!!!!!!!!
!!!!!!
!
!
!
!!
!
!
!
!
!
!
!
!
!
!
!
!
!
!
!
!
!
!
!
!
!
!
!
!
!
!
!
!
!
!
!
!
!
!
!
! !
! !
!!
!!
! !
!!
!
!! !
!
!
!!
!
!
!
!
!
!
!
!
!
!
!!
!
!!
!
!!!
!
!
!!
!
!!!
!!
!
!
!
!
!
!!
!
!
!
!
!
!
!
!
!
!
!
!
!
!
!
!
!
!
!
!
!
!!
!
!
!
!
!
!
!
!
!
!
!
!
!
!
!
!
!
!
!
!
!
!
!
!
!
!
!
!
!
!!
!
!
!!
!
!
!!
!
!!
!
!
!
!
!
Slip 3
Slip 4
Unfenced; employees have access to shoreline; signs designating shallow water, no diving, and no lifeguard on duty indicate potentialfor human use; littered
steep bank
Public access trail along bank; muddy shoreline; difficult
to access
a
Employee access only;building immediately adjacent to shoreline
Difficult access;steep riprap bank
1st Ave S Brid
ge
South Park Bridge
Member access
only
Easy public accessat either end of area;shallow bank, mud
flats; employeeaccess only in the
middle, but public couldtheoretically accessfrom either end at
low tide
2.0
3.0
Steep riprap banks, docks
and piers
4
6
Residentialaccess
Residentialaccess
DuwamishWaterway
Park
5
Slip 2
Total
risk =
3x10⁻⁵
Total
risk =
9x10⁻⁶
Total
risk =
8x10⁻⁶
SOUTH PARKMARINA LTDPARTNERS
SILVER BAYLOGGING INC
BOEING
BOEING
SHALMAR GROUP
FOX AVENUE LLC
ESI MGT
GUIMONT GEMO/WILLIAM P
HOPKINS,FREDERICK J
FAM TRS
BOEING
R & A PROPERTIES
PORT OF SEATTLE
LONE STARINVESTORS LLP
GILMUR,JAMES
SEATTLE DOT
PORT OFSEATTLE STATE OF
WASHINGTON
SEATTLE DOT
DUWAMISH TRIBE USA IN TRUSTSEATTLE DOT
MUCKLESHOOTTRIBE
RANIER PETROLEUM CORPORATION
SCS HOLDINGS INC
CLPF-SEATTLEDISTRIBUTION
CENTER LP
SEATAC MARINEPROPERTIES LLC
DOUGLASMANAGEMENT
COMPANY
TROTSKY,HERMAN &
JACQUALINE
HALVORSEN,MARYCATHERINE
BOYERTOWING
INC
BOYERTOWING
INC
CROWLEY MARINE SERVICES INC
LUKAS,BILLIE MACKSENE
KING COUNTY
ELM GROVE LLC
SOUTH PARKMARINA LTDPARTNERS
BOEING
JORGENSEN FORGE CORP
PORT OFSEATTLE
BOEING
3.7
3.6
3.5
2.5
2.4
2.3
1.8
1.9
3.4
3.3
3.2
3.1
2.9
2.8
2.7
2.6
±±
Pre
pare
d by
CE
H, 0
7/15
/201
0; M
ap 2
602;
W:\P
roje
cts\
00-0
8-06
_Duw
amis
h_R
I\dat
a\gi
s\P
hase
2 R
I\HH
RA
Sum
mar
y
!
!
!
!
!!!
!
!
!
!
!
!
!
!!
!
!
!
!
!
!
!
!
!
!
!
!
!
!
!
!
!
!
!
!
!
!
!
!
!
!
!
!
!
!
!
!
!
!
!
!
!
!
!
!
!
!
!
!
!
!
!
!
!
!
!
!
!
!
!
!
!
!
!
!
!
!
! !
!
!
!
! !
!
!
!
!
!
!
!
!
!
!
!!
!!!
!!!
!!!
!
!
!!!
!
!
!
!
!
!
!!
!
!!
!
!
!
!
!!!!
!!!
!
!!!!!!
!
!!
!
!
!
!
!
!
!
!
!
!
!
!
!
!
!
!
!
!
!
!
!
!
!
!
!
!
!
!
!
!
!
!
!
!
!
!
!
!
!
!
!
!
!
!
!
!
!
!
!
!
!
!
!
!
!
!
!!
!
UpperTurningBasin
Slip 6
Boeingemployee
access only
Fenced;no public access; steep riprap bank
Fenced
Difficult publicaccess
Memberaccess only
No public access,but area is unfenced
Nopublicaccess
Path alongshore above
riprap-covered steep bank
S. Turning Basin 3 Public Park
Easy accessvia trail
at Hamm Creek
Restoration Area
Muckleshoot Tribe
fenced property
Oxbow Brid
ge
102nd St Brid
ge
7
8
Total
risk =
5x10⁻⁶
Total
risk =
7x10⁻⁶
PORT OF SEATTLE
SEATTLECITY LIGHT
SEATTLECITY LIGHT
SEATTLECITY LIGHT
MELLON DESIMONE
MUCKLE-SHOOTINDIANTRIBE
BOEING
DELTA MARINE
MELLON TRUSTOF WA-DESIMONE
BOEING
MELLON TRUST REAL ESTATE
BOEING
BOEING
SEATTLE CITY LIGHT
MERRILL CREEK HOLDINGS LLC
CONTAINER PROPERTIES LLC
JORGENSENFORGE CORP
BOEING
BOEING
SEA KINGINDUSTRIALPARK LLC
BOEING
MUSEUMOF FLIGHT
FOUNDATION
BOEING
4.9
4.8
4.4
3.9
4.0
4.7
3.7
4.5
4.3
4.2
4.1
3.8
6
Map 6-1. LDW intertidal areas included in the beach play direct sediment contact exposure scenarios and excess cancer risk estimates
Beach playexposure area
1
2
3
4
5
6
7
8
Intertidal conditions (> -2 ft MLLW)
Marsh
Mud
Riprap
Subtidal (< -2 ft MLLW)
Road
Bridge
Building
Dock/pier
Marina
Taxparcel
a
Navigation channel
River mile
Scale is the same for each inset map
0 0.1 0.2Miles
0 0.1 0.2KilometersLLCWindWard
environmental
Risk = excess cancer risk estimatecPAH = carcinogenic PAHsCOPC = chemical of potential concernD/F TEQ = dioxin and furan toxic equivalent (data available only at beaches 4, 5 and 7)
Excess cancer risk charts for individual beaches compare risks bychemical as a fraction of total risk from all COPCs. Chemicals other thanPCBs, arsenic, cPAHs, and dioxins and furans are not shown on chartsbecause they contribute 1% or less to the total risk. The size of each chartis proportional to the total risk, as defined by the scale in the legend.a Tax parcel information was provided in 2008 by Seattle Public Utilitiesand King County. Some tax parcel polygons were edited to conform tothe LDW shoreline presentation. A comprehensive survey of property-owner records was not conducted.b cPAH concentrations are based on benzo(a)pyrene equivalents. TEQswere calculated with mammalian PEFs for seven individual PAHcompounds (California EPA 1994), using one-half the RL for undetectedcompounds. Because of the potential for increased susceptibility ofchildren to carcinogens with mutagenic activity, as described in EPAguidance (EPA 2005), the risk estimate for beach play RME for cPAHsis based on dose adjustments across the 0-to-6-year age range ofchildren. See Section B.5.1 for more information.
±
!
Intertidal baseline surfacesediment sampling location
Excess cancer risk forindividual beaches
ArseniccPAHb
Total PCBs
D/F TEQ
Total risk = 5 x 10⁻⁵
0.9
0.7
0.8
Park are
2.1
2.2
4.

!
!
!
!
!
!
!
!
!
!
!!
!
!
!
!
!
!
!
!
!
!
!
!!
!
!
!
!
!
!
!
!
!
!!
!
!
!
!
!
!
!
!
!
!
!!
!
!
!
!!
!
!
!
!
!
!
!
!
!
!
!
!
!
!
!
!
!
!
!
!
!
!
!
!
!
!
!
!
Kellogg I.
Slip 1
Slip 2
T-105
Harbor I.
1.0
Herring's HousePark
LAFARGE CORP
LIPSETT CO LLC
PORT OFSEATTLE
PORT OF SEATTLE
ANDERSON, DOROTHY
PORT OF SEATTLE
GLACIER NORTHWEST INC
DUWAMISH SHIPYARD INC
ALASKA MARINE LINES INC
SEATTLE PARKS DEPT
GENERAL RECYCLINGOF WASHINGTON LLC
BPB GYPSUM INC
KING COUNTY
FEDERALGOVERNMENT
PORT OFSEATTLE
SAINT-GOBAINCONTAINERS
KING COUNTY
KING COUNTY
KING COUNTY
KING COUNTY
LIPSETT CO LLC
PORT OF SEATTLE
PORT OF SEATTLE
GENERAL RECYCLINGOF WASHINGTON LLC
PORT OFSEATTLE
PORT OFSEATTLE
PORT OFSEATTLE
CHEMITHON CORP
PORT OF SEATTLE
GLACIER NORTHWEST INC
LONE STARINVESTORS LLP
1.7
1.6
1.5
1.4
1.3
1.2
1.1
0.1
0.2
0.3
0.4
0.6
0.5
0.0
!
!
!
!
!
!
!
!
!
!
!
!
!!
!
!
!
!
!
!
!
!
!
!
!
!
!
!
!
!
!
!
!
!
!
!
!
!
!
!
!
!
!
!
!
!
!
!
!
!
!
!
!
!
!
!
!
!!!
!!!
!!!!!!!!
!!
!!!!
!
!
!
!
!
!
!
!
!
!
!
!
!
!
!
!
!
!
!
!
!
!
!
!
!
!
!
!
!
!
!
!
!
!
!
!
!
!
!
!
! !
! !
!!
!!
! !
!
!
!
!! !
!
!
!!
!
!
!
!
!
!
!
!
!
!
!!
!
!!
!
!!
!
!
!
!!
!
!!!
!!
!
!
!
!
!
!
!
!
!
!
!
!
!
!
!
!
!
!
!
!
!
!
!
!
!
!
!
!
!!
!
!
!
!
!
!
!
!
!
!
!
!
!
!
!
!
!
!
!
!
!
!
!
!
!
!
!
!
!
!!
!
!
!
!
!
!
!!
!
!!
!
!
!
!
!
Slip 3
Slip 4
a
1st Ave S Brid
ge
South Park Bridge
2.0
3.0
Slip 2
SOUTH PARKMARINA LTDPARTNERS
SILVER BAYLOGGING INC
BOEING
BOEING
SHALMAR GROUP
FOX AVENUE LLC
ESI MGT
GUIMONT GEMO/WILLIAM P
HOPKINS,FREDERICK J
FAM TRS
BOEING
R & A PROPERTIES
PORT OF SEATTLE
LONE STARINVESTORS LLP
GILMUR,JAMES
SEATTLE DOT
PORT OFSEATTLE STATE OF
WASHINGTON
SEATTLE DOT
DUWAMISH TRIBE USA IN TRUSTSEATTLE DOT
MUCKLESHOOTTRIBE
RANIER PETROLEUM CORPORATION
SCS HOLDINGS INC
CLPF-SEATTLEDISTRIBUTION
CENTER LP
SEATAC MARINEPROPERTIES LLC
DOUGLASMANAGEMENT
COMPANY
TROTSKY,HERMAN &
JACQUALINE
HALVORSEN,MARYCATHERINE
BOYERTOWING
INC
BOYERTOWING
INC
CROWLEY MARINE SERVICES INC
LUKAS,BILLIE MACKSENE
KING COUNTY
ELM GROVE LLC
SOUTH PARKMARINA LTDPARTNERS
BOEING
JORGENSEN FORGE CORP
PORT OFSEATTLE
BOEING
GILMUR,JAMES
3.7
3.6
3.5
3.4
3.3
3.2
2.9
2.8
2.7
2.6
2.5
2.4
2.3
1.8
1.9
3.1
±±
Pre
pare
d by
CE
H, 0
7/15
/201
0; M
ap 2
245;
W:\P
roje
cts\
00-0
8-06
_Duw
amis
h_R
I\dat
a\gi
s\P
hase
2 R
I\HH
RA
Sum
mar
y
!
!
!
!
!!!
!
!
!
!
!
!
!
!!
!
!
!
!
!
!
!
!
!
!
!
!
!
!
!
!
!
!
!
!
!
!
!
!
!
!
!
!
!
!
!
!
!
!
!
!
!
!
!
!
!
!
!
!
!
!
!
!
!
!
!
!
!
!
!
!
!
!
!
!
!
!
! !
!
!
!
! !
!
!
!
!
!
!
!
!
!
!
!!
!!!
!!
!!
!!
!
!
!!!
!
!
!
!
!
!
!!
!
!!
!
!
!
!
!!!!
!!!
!
!!!!!!
!
!!
!
!
!
!
!
!
!
!
!
!
!
!
!
!
!
!
!
!
!
!
!
!
!
!
!
!
!
!
!
!
!
!
!
!
!
!
!
!
!
!
!
!
!
!
!
!
!
!
!
!
!
!
!
!
!
!
!!
!
UpperTurningBasin
Slip 6
Oxbow Brid
ge
102nd St Brid
ge
PORT OF SEATTLE
SEATTLECITY LIGHT
SEATTLECITY LIGHT
SEATTLECITY LIGHT
MELLON DESIMONE
MUCKLE-SHOOTINDIANTRIBE
BOEING
DELTA MARINE
MELLON TRUSTOF WA-DESIMONE
BOEING
MELLON TRUST REAL ESTATE
BOEING
BOEING
SEATTLE CITY LIGHT
MERRILL CREEK HOLDINGS LLC
CONTAINER PROPERTIES LLC
JORGENSENFORGE CORP
BOEING
BOEING
SEA KINGINDUSTRIALPARK LLC
BOEING
MUSEUMOF FLIGHT
FOUNDATION
BOEING
4.9
4.8
3.7
4.5
4.4
4.3
4.1
3.9
3.8
4.0
4.7
4.2
6
Map 6-2. LDW intertidal areas included in the clam harvesting direct sediment contact exposure scenarios
!
Intertidal baseline surfacesediment sampling location
Clamming access
Shoreline
Boat only
Intertidal conditions (> -2 ft MLLW)
Marsh
Mud
Riprap
Subtidal (< -2 ft MLLW)
Bridge
Building
Dock/Pier
Marina
Tax parcela
Road
Navigation channel
River mile
Scale is the same for each inset map
0 0.1 0.2Miles
0 0.1 0.2KilometersLLCWindWard
environmental
aTax parcel information was provided in 2008 by Seattle Public Utilitiesand King County. Some tax parcel polygons were edited to conform tothe LDW shoreline presentation. A comprehensive survey of property-owner records was not conducted.
±
0.9
0.7
0.8
Park are
2.1
2.2
4.

!(!(!(
!(
!(
!(!(
!(
!(
!(
!(
!(
!(
!(
!(!(
!(
!(
!(!(!(
!(
!(!(
!(
!(
!(
!(
!(
!(!(!(
!(
!(
!(
!(
!(
!(!(
!(
!(
!(
!(
!(
!(
!(!(
!(
!(!(
!(
!(!(!(
!(
!(
!(
!(
!(
!(
!(
!(
!( !(
!(
!(
!(
!(
!(
!(
!(!(!(!(!(!(!(!(!(!(!(
!(!(!(!(!(!(!(!(!(!(!(
PortTownsend
WhidbeyIsland
CamanoIsland
PortAngeles
Seattle
BainbridgeIsland
Bremerton
VashonIsland
Tacoma
Vancouver Island, BC
West Beach
CaseInlet
DabobBay
SamishBay
SaratogaPassage
Carr Inlet
DiscoveryBay
SequimBay
Rich Passage
Freshwater Bay Dungeness Bay
WollocherBay
King Co.
Skagit Co.
Whatcom Co.
Pierce Co.
Clallam Co.
Jefferson Co.
Snohomish Co.
Grays HarborCo.
Mason Co.
Kitsap Co.
Island Co.
San Juan Co.
±
Pre
pare
d by
CE
H, 0
7/15
/201
0, M
ap 3
240;
W:\P
roje
cts\
00-0
8-06
_Duw
amis
h_R
I\dat
a\gi
s\P
hase
2 R
I\Bac
kgro
und
0 5 10Miles
0 5 10KilometersLLCWindWard
environmental
Map 7-1. Locations of surface sediment PCB and dioxin and furan data available for natural background from reference areas prior to 2008
Straight ofJuan de Fuca
!(
PCB and dioxin and furansediment sample location
!( PCB sediment sample location
Background sampling area
Waterbody or river
Note: Puget Sound 2008 survey locations are shown on Map 7-4.

!(!(!(
!(!(!(!(!(!(!(!(!(!(!(!(!(!(!(!(!(!(!(!(
!(!(!(!(
!(!(!(
!(!(
!(
!(
!(
!(!(
!(
!(
!(!(!(
!(
!(!(
!(
!(
!(
!(
!(
!(
!(
!(!(!(!(
!(
!(
!(!(
!(
!(!(!(!(!(!(!(
!(!(
!(!(
!(
!(!(!(
!(
!(
!(
!(!(
!(
!(
!(
!(
!(!(
!(
!(
!(
!(!(!(!(!(!(
!(
!(
!(
!(
!(
!(
!(
!(
!(
!(
!(
!( !(
!(
!(
!(
!(
!(!(
!(
!(!(
!(!(
!(
!(
!(
!(
PortTownsend
WhidbeyIsland
CamanoIsland
PortAngeles
Seattle
BainbridgeIsland
Bremerton
VashonIsland
Tacoma
Vancouver Island, BC
West Beach
CaseInlet
DabobBay
SamishBay
SaratogaPassage
Carr Inlet
DiscoveryBay
SequimBay
Rich Passage
Freshwater Bay Dungeness Bay
WollocherBay
Mason Co.
Jefferson Co.
King Co.
Clallam Co.
Skagit Co.
Kitsap Co.
Snohomish Co.
Island Co.
Pierce Co.
Whatcom Co.
San Juan Co.
Grays Harbor Co.
Thurston Co.
±
Pre
pare
d by
CE
H, 0
7/15
/201
0; M
ap 3
242;
W:\P
roje
cts\
00-0
8-06
_Duw
amis
h_R
I\dat
a\gi
s\P
hase
2 R
I\Bac
kgro
und
0 5 10Miles
0 5 10Kilometers
LLCWindWardenvironmental
Map 7-2. Locations of surface sediment arsenic data available for natural background fromreference areas prior to 2008
Straight ofJuan de Fuca
!( Arsenic sediment sample location
Background sampling area
Waterbody or river
Note: Puget Sound 2008 survey locations are shown on Map 7-4.

!(!(!(
!(!(!(
!(
!(
!(!(!(
!(!(!(!(
!(!(!(!(
!(
!(!(!(!(
!(
!(
!(
!(!(
!(
!(!(
!(
!(
!(!(!(
!(
!(
!(
!(
!(
!(
!(
!(
!(
!(
!(
!( !(
!(!(!(!(
!(
!(
!(!(
!(
!(!(!(!(!(!(!(
!(!(
!(!(
!(
!(!(!(
!(
!(!(
!(
!(
!(
!(
!(
!(!(
!(
!(
!(
!(!(!(!(!(!(!(!(
!(
!(
!(
!(
!(
!(
!(
!(
!(
!(
!(
!( !(
!(
!(
!(
!(
!(!(
!(
!(
!(
!(!(
PortTownsend
WhidbeyIsland
CamanoIsland
PortAngeles
Seattle
BainbridgeIsland
Bremerton
VashonIsland
Tacoma
Vancouver Island, BC
West Beach
CaseInlet
DabobBay
SamishBay
SaratogaPassage
Carr Inlet
DiscoveryBay
SequimBay
Rich Passage
Freshwater Bay Dungeness Bay
WollocherBay
Mason Co.
Jefferson Co.
King Co.
Clallam Co.
Skagit Co.
Kitsap Co.
Snohomish Co.
Island Co.
Pierce Co.
Whatcom Co.
San Juan Co.
Grays Harbor Co.
Thurston Co.
±
Pre
pare
d by
CE
H, 0
7/15
/201
0; M
ap 3
241;
W:\P
roje
cts\
00-0
8-06
_Duw
amis
h_R
I\dat
a\gi
s\P
hase
2 R
I\Bac
kgro
und
0 5 10Miles
0 5 10Kilometers
LLCWindWardenvironmental
Map 7-3. Locations of surface sediment cPAH dataavailable for natural background from referenceareas prior to 2008
Straight ofJuan de Fuca
!( cPAH sediment sample location
Background sampling area
Waterbody or river
Note: Puget Sound 2008 survey locations are shown on Map 7-4.

#
####
#
#
#
#
#
#
#
#
#
#
PortTownsend
WhidbeyIsland
CamanoIsland
PortAngeles
Seattle
BainbridgeIsland
Bremerton
VashonIsland
Tacoma
Vancouver Island, BC
King Co.
Skagit Co.
Whatcom Co.
Pierce Co.
Clallam Co.
Jefferson Co.
Snohomish Co.
Grays Harbor Co.
Mason Co.
Thurston Co.
Kitsap Co.
Island Co.
San Juan Co.
SS_2
SS_1
SS_0
HC_6
HC_3
HC_2
HC_1
HC_0
AI_1
SJI_3
SJI_1
SJI_0
SJF_3
SJF_2
CPS_5
CPS_4
CPS_3
CPS_1CPS_0
SS_9_C
SS_8_C
SPSB_3
SPSB_2
SPSB_1
SPSB_0
SCPS_5
SCPS_3
SCPS_2
SCPS_1
PSPS_9
PSPS_8
PSPS_3
PSPS_2
PSPS_1
NCPS_4
NCPS_3
NCPS_2
NCPS_1
NCPS_0
AI_5_C
SJI_8_C
SJF_9_C
R_SAM_5
R_SAM_4
R_SAM_3R_SAM_1
R_SAM_0
R_HOL_7
R_HOL_4
R_HOL_3
R_HOL_1
R_HOL_0
R_DAB_5
R_DAB_2
R_DAB_1
R_DAB_0
R_CAR_5
R_CAR_4
R_CAR_1
R_CAR_0
AI_13_C
AI_11_C
SPSB_8_C
SJF_10_C
SCPS_10_C
R_DAB_7_C
R_CAR_6_C
AI_20_C_GS
SJI_20_C_GS
SJF_12_C_GS
±
Pre
pare
d by
CE
H, 0
7/15
/201
0; M
ap 3
786;
W:\P
roje
cts\
00-0
8-06
_Duw
amis
h_R
I\dat
a\gi
s\P
hase
2 R
I\Bac
kgro
und
0 5 10Miles
0 5 10KilometersLLCWindWard
environmental
Map 7-4. Locations of surface sediment dataavailable for arsenic, PCBs, cPAHs, and dioxinsand furans from the Puget Sound 2008 surveyfor natural background consideration
Puget Sound 2008 survey location
AI
CPS
HC
NCPS
PSPS
R_CAR
R_DAB
R_HOL
# R_SAM
# SCPS
# SJF
SJI
SPSB
SS
Waterbody
Straight ofJuan de Fuca

Map 7-5. Surface sediment sampling locations for arsenic, PCBs, cPAHs, or dioxins and furans - RM 5.0 to RM 7.0
Legend
Navigation channel
cPAH sample location
PCB sample location
Arsenic sample location
#*
River Mile marker
Dioxin and furan sample location")
!(
0 100 20050Meters
0 500 1,000250Feet
Notes:1. An additional sample collected from Springbrook Creek (which enters the Duwamish River at RM 10.2) was included in the dioxin and furan dataset for samples from RM 5.0 - 7.0, but is not shown on this map.
7.1
6.7
7.2
6.8
6.9
6.66.56.
46.3
6.2
6.1
5.9
5.8
7.3
5.6
5.5
5.4
5.3
5.2
5.1
4.9
4.8
5.7
6.0
5.0
7.0
4.7

Map 7-6. Locations of subsurface sediment samples collected as part of the 1990 to 2003 USACE dredged material characterization events±
Legend
Composite core location
Single core location
Navigation channel
River mile
0 500 1,000250Meters
Notes:1. Sampling data provided by USACE (2007).2. Dredge footprints from USACE dredge summary and analysis reports.3. Single sample locations represent stations where a single core was collected
(generally from 0 to 4 ft below the mudline), composited over the length of the core,and analyzed. Composite sample locations represent stations where single coresfrom each of those stations (again, generally from 0 to 4 ft below the mudline) were firstcomposited over the length of the core and then composited with the samples from the coresat other stations prior to analysis.
4. Stations downstream of RM 4.0 not shown.
1997 USACE dredging eventand 1996 core locations
1997 dredging footprint
4.0
5.0
3.0
4.3
3.2
3.4
3.3
4.6
4.5
4.4
3.9
4.1
4.2
4.7 4.8
3.6
4.9
3.1
3.5
5.2
5.1
3.7
3.8
5.3
Core C1
1990 USACE dredging eventand 1990 core locations
4.0
3.0
4.3
3.4
3.3
4.5
4.4
4.6
4.2
4.1
3.9
4.8
4.7
3.6
4.9
3.5
3.7
3.83.2
1990 cores C7,C8
1990 dredging footprint
1992/1994 USACE dredging eventand 1991 core locations
4.0
3.0
4.3
3.2
3.4
3.3
4.6
4.5
4.4
3.9
4.1
4.2
4.7 4.8
3.6
4.9
3.1
3.5
5.2
5.1
3.7
3.8
5.3
Core C1
Core C2
1992 dredging footprint
1994 dredging footprint
1996 USACE dredging eventand 1995 core locations
4.0
3.0
4.3
3.23.3
3.4
4.5
4.4
4.6
4.2
4.1
3.9
4.8
4.7
3.6
4.9
3.5
5.25.1
3.8
3.7
1996 dredging footprint
4.0
3.0
4.3
3.23.3
3.4
4.5
4.4
4.6
4.2
4.1
3.9
4.8
4.7
3.6
4.9
3.5
5.25.1
3.8
3.7
1999/2002 USACE dredging eventand 1998 core locations
Cores C2,C3
Core C1
1999 dredging footprint
2002 dredging footprint
4.0
5.0
3.0
4.3
3.2
3.4
3.3
4.6
4.5
4.4
3.9
4.1
4.2
4.7 4.8
3.6
4.9
3.1
3.5
5.2
5.1
3.7
3.8
5.3
2004/2007 USACE dredging eventand 2003 core locations
2007 dredging footprint
2004 dredging footprint
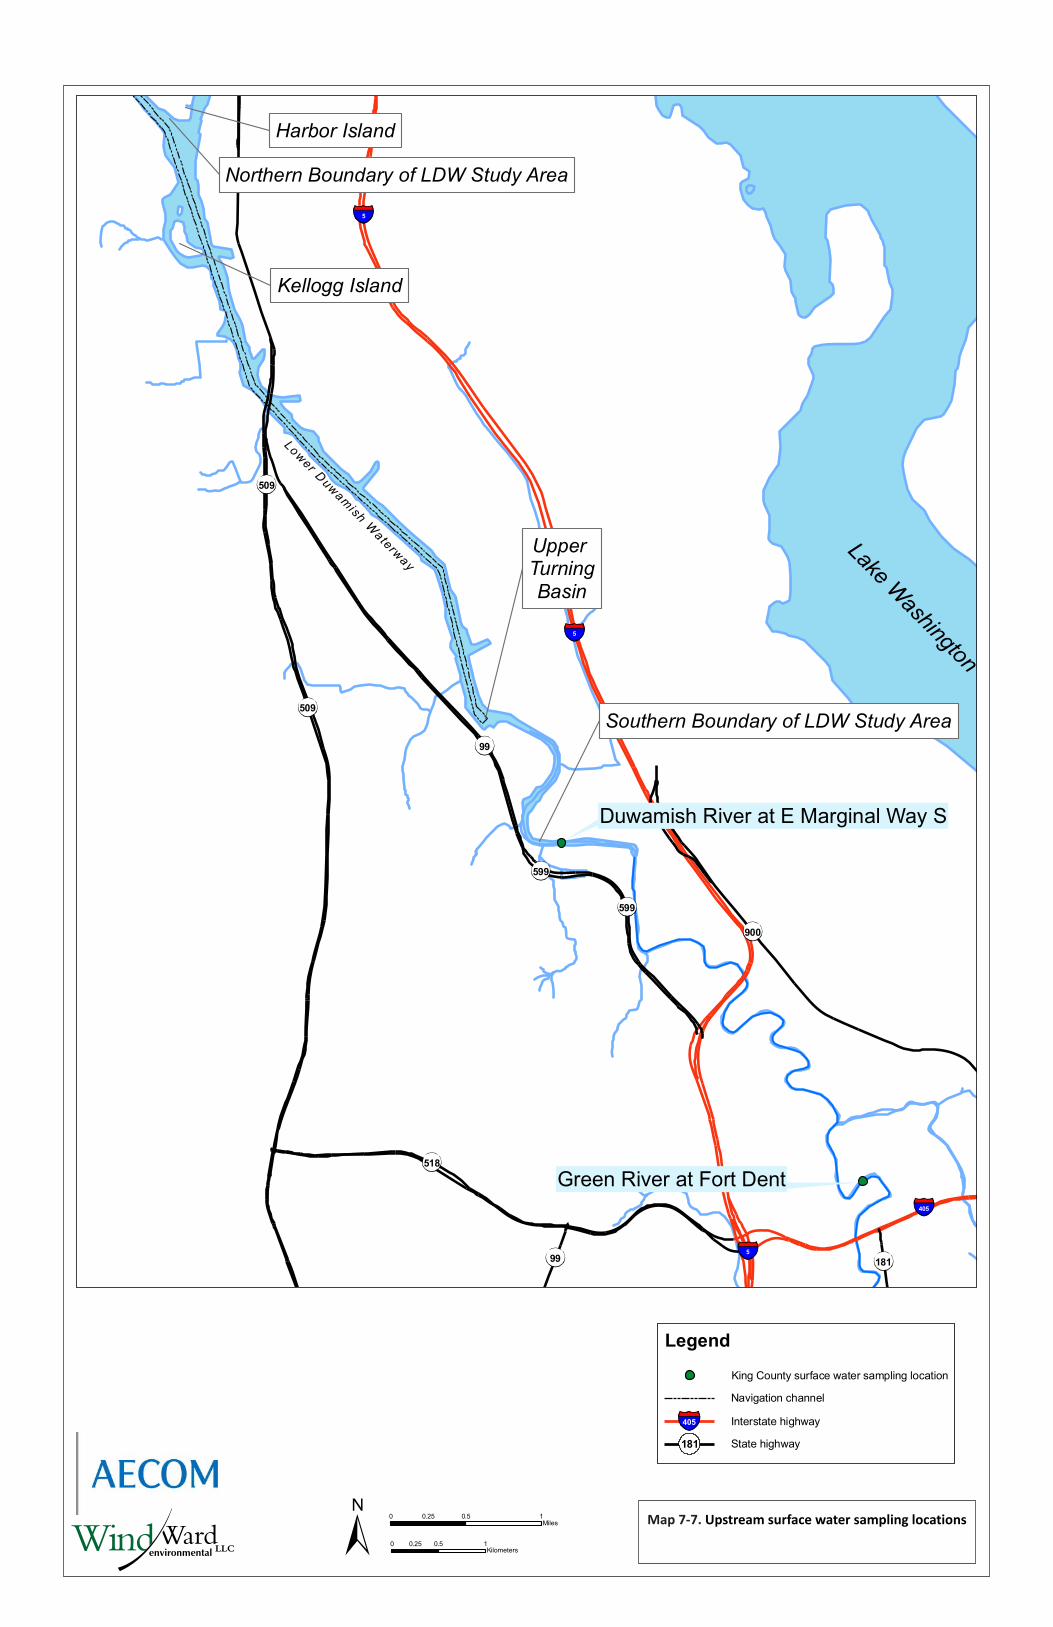
Map 7-7. Upstream surface water sampling locations
Duwamish River at E Marginal Way S
Green River at Fort Dent
5
405
5
5
99
509
900
599
518
181
509
599
99
Lake Washington
Harbor Island
Kellogg Island
UpperTurningBasin
Southern Boundary of LDW Study Area
Northern Boundary of LDW Study Area
Lower DuwamishW
aterway
0 0.5 10.25Miles
0 0.5 10.25Kilometers
Legend
Navigation channel
King County surface water sampling location
Interstate highway
State highway
405
181

�)�)
�)�)
�)
�)
�)�)
�)
�)
�)
�)�)�)
LakeWashington
PugetSound
Lake Union
ElliottBay
LowerDuwamish Waterway
Seattle
MercerIsland
Sammamish R.
Cedar R.
1a 187 J 1b 63.1 J
2a 13.7 J2b 18.9 J
9a 5.46 J9b 26.1 J
8 53.4 J
3 13.2 J
7 2.59 J
6 2.23 J
5a 14.1 J5b 14.5 J
4 14.7 J
1
9
2
5
Pre
pare
d by
CE
H, 0
7/15
/201
0; M
AP
#23
07; W
:\Pro
ject
s\00
-08-
06_D
uwam
ish_
RI\d
ata\
gis\
Pha
se2
RI\B
ackg
roun
d
Map 7-8. Dioxin and furan TEQs in surface sediment samples from the greater Seattle area
LLCWindWardenvironmental
Dioxin and furan TEQs were calculated from individual dioxin and furan concentrations withmammalian TEFs, using ½ the reporting limit for undetected dioxin and furan congeners. TheTEQ at location 3 is the average of the original sample value and the field duplicate sample value.
Centroid location numberDioxin and furan TEQ (ng/kg dw)J: estimated
13.2 J3
±0 1.5 3
Miles
0 2.5 5Kilometers
�)
�)
�)
�)
#*
!(
#*
!(
#*#*
#*#*
#*
#*
#*
#*
#*
!(
!(
#*
!(
#*
#*
#*
!(#*
#*
!(
#*
#*
!(
#*
!(
#*
!(
#*
#*
#*
!(
#*
#*
#*
[�
!.
!.
!.
!.
Bremerton
Seattle
Camano Island
WhidbeyIsland
PortTownsend
PortAngeles
Tacoma
KitsapCounty
KingCounty
PierceCounty
SkagitCounty
VashonIsland
JeffersonCounty
ClallamCounty
SnohomishCounty
IslandCounty
MasonCounty
Whatcom County
British Columbia
Vancouver Island
Olympia
Pre
pare
d by
CE
H, 0
7/15
/201
0; M
AP
303
4; W
:\Pro
ject
s\00
-08-
06_D
uwam
ish_
RI\d
ata\
gis\
Pha
se2
RI\N
atur
al b
ackg
roun
d
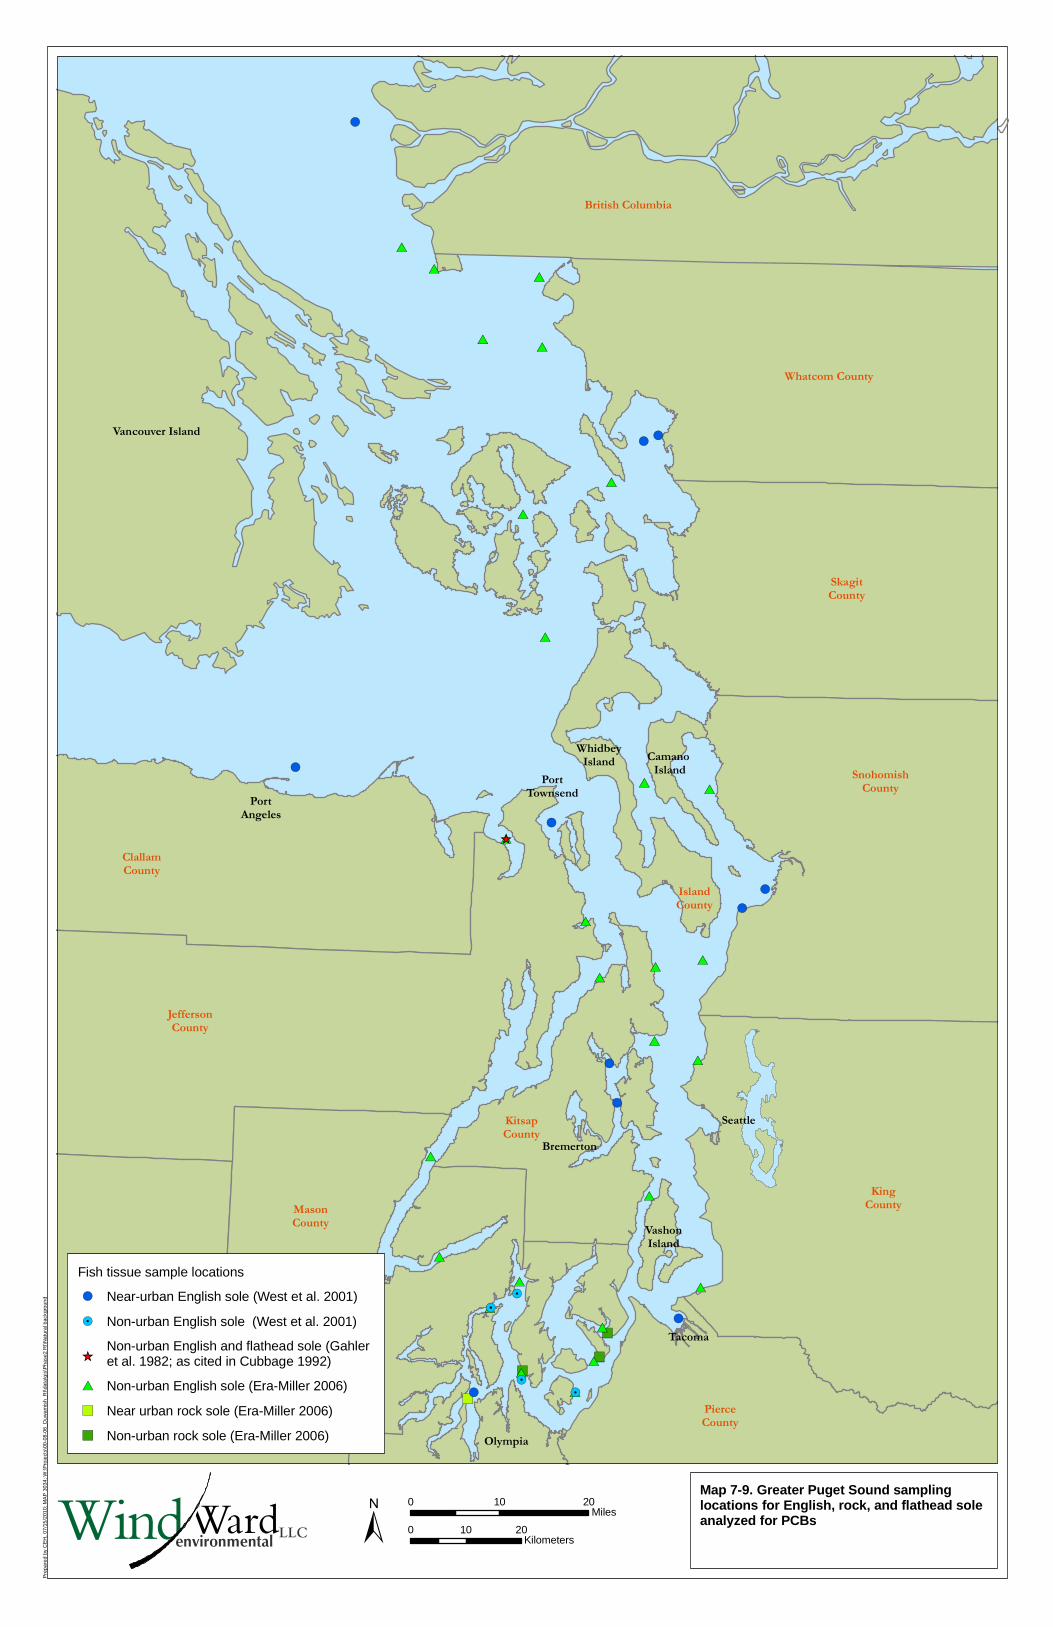
±Map 7-9. Greater Puget Sound samplinglocations for English, rock, and flathead soleanalyzed for PCBs
Fish tissue sample locations
!( Near-urban English sole (West et al. 2001)
!. Non-urban English sole (West et al. 2001)
[�Non-urban English and flathead sole (Gahler et al. 1982; as cited in Cubbage 1992)
#* Non-urban English sole (Era-Miller 2006)
�) Near urban rock sole (Era-Miller 2006)
�) Non-urban rock sole (Era-Miller 2006)
LLCWindWardenvironmental
0 10 20Miles
0 10 20Kilometers
�/
�/�/
�/
�/
�/
�)
�)
�)
�)
!.
!(
!(
!(
#*
#*
Bremerton
Seattle
Camano Island
WhidbeyIsland
PortTownsend
PortAngeles
Tacoma
KitsapCounty
KingCounty
PierceCounty
SkagitCounty
VashonIsland
JeffersonCounty
ClallamCounty
SnohomishCounty
IslandCounty
MasonCounty
Whatcom County
Pre
pare
d by
CE
H, 0
7/15
/201
0; M
AP
303
6; W
:\Pro
ject
s\00
-08-
06_D
uwam
ish_
RI\d
ata\
gis\
Pha
se2
RI\B
ackg
roun
d
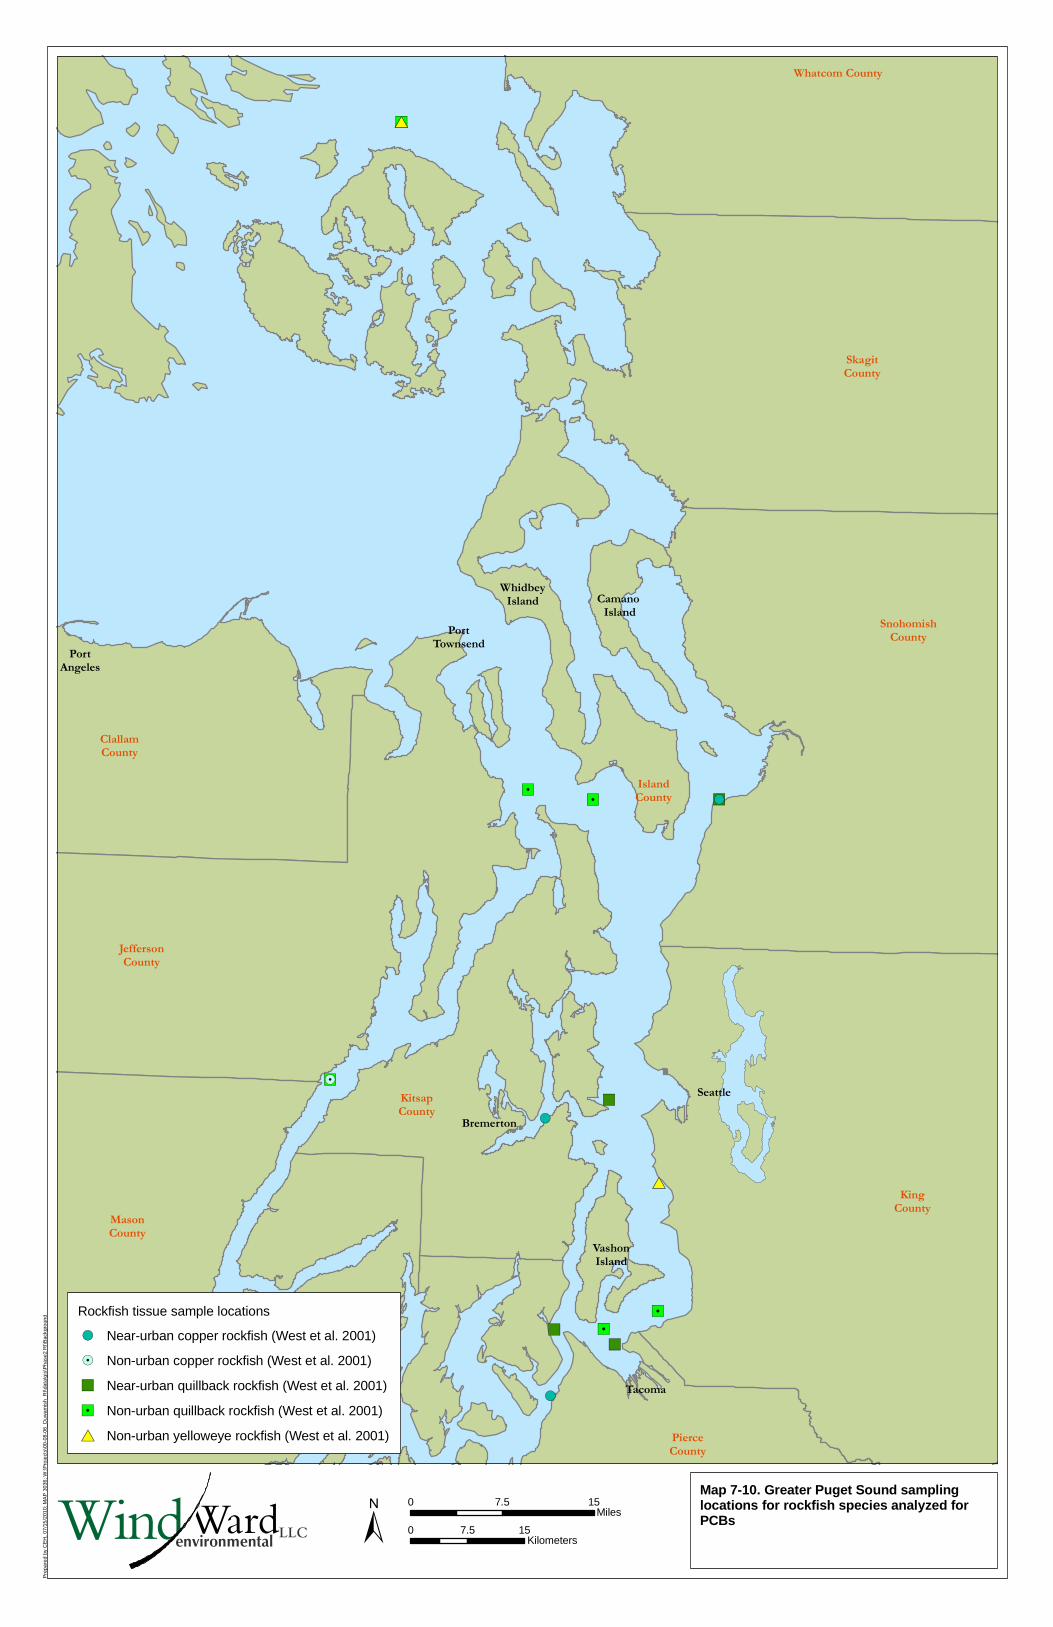
±Map 7-10. Greater Puget Sound samplinglocations for rockfish species analyzed forPCBs
Rockfish tissue sample locations
!( Near-urban copper rockfish (West et al. 2001)
!. Non-urban copper rockfish (West et al. 2001)
�) Near-urban quillback rockfish (West et al. 2001)
�/ Non-urban quillback rockfish (West et al. 2001)
#* Non-urban yelloweye rockfish (West et al. 2001)
LLCWindWardenvironmental
0 7.5 15Miles
0 7.5 15Kilometers

#*
#*
#*
#*
#*#*
#*#*
#*
#*
!( !(
�/
�/
�/
�/�/
�/�/
�/
Bremerton
Seattle
Camano Island
WhidbeyIsland
PortTownsendPort
Angeles
KitsapCounty
VashonIsland
JeffersonCounty
IslandCounty
MasonCounty
Vancouver Island
Pre
pare
d by
CE
H, 0
7/15
/201
0; M
AP
303
5; W
:\Pro
ject
s\00
-08-
06_D
uwam
ish_
RI\d
ata\
gis\
Pha
se2
RI\N
atur
al b
ackg
roun
d
±
Crab and clam tissue sampling locations
�/ Butter clam (Ecology 2000)
�/ Dungeness crab (Ecology 2000)
�/ Littleneck clam (Ecology 2000)
!(Dungeness crab, geoduck, and horse clam (Malcom Pirnie 2007)
#*Butter clam (King County 1995; 2000; 2001; 2005; 2006)
LLCWindWardenvironmental
0 5 10Miles
0 5 10Kilometers
Map 7-11. Greater Puget Sound samplinglocations for crab and clam species analyzedfor PCBs
!(
!(
!(
!(
!(
�)
�)
�)
�)
�)
�)
BainbridgeIsland
Puget Sound
Vashon Island
Olympic PenninsulaOlympic
NationalPark
!(
WhidbeyIsland
!(
!( Port Townsend
Asarco Smelter
Bremerton
!(Olympia
tu101
tu16
!( Port Angeles
��5
��405
��405
��5
��5
��5
tu101
tu2
SP
BI
VI
DU
EP
BL
Seattle
Tacoma
Everett
BellevueBellevue
Federal WayFederal Way
Pre
pare
d by
CE
H, 0
7/15
/201
0; M
AP
#22
82; W
:\Pro
ject
s\00
-08-
06_D
uwam
ish_
RI\d
ata\
gis\
Pha
se2
RI\B
ackg
roun
d
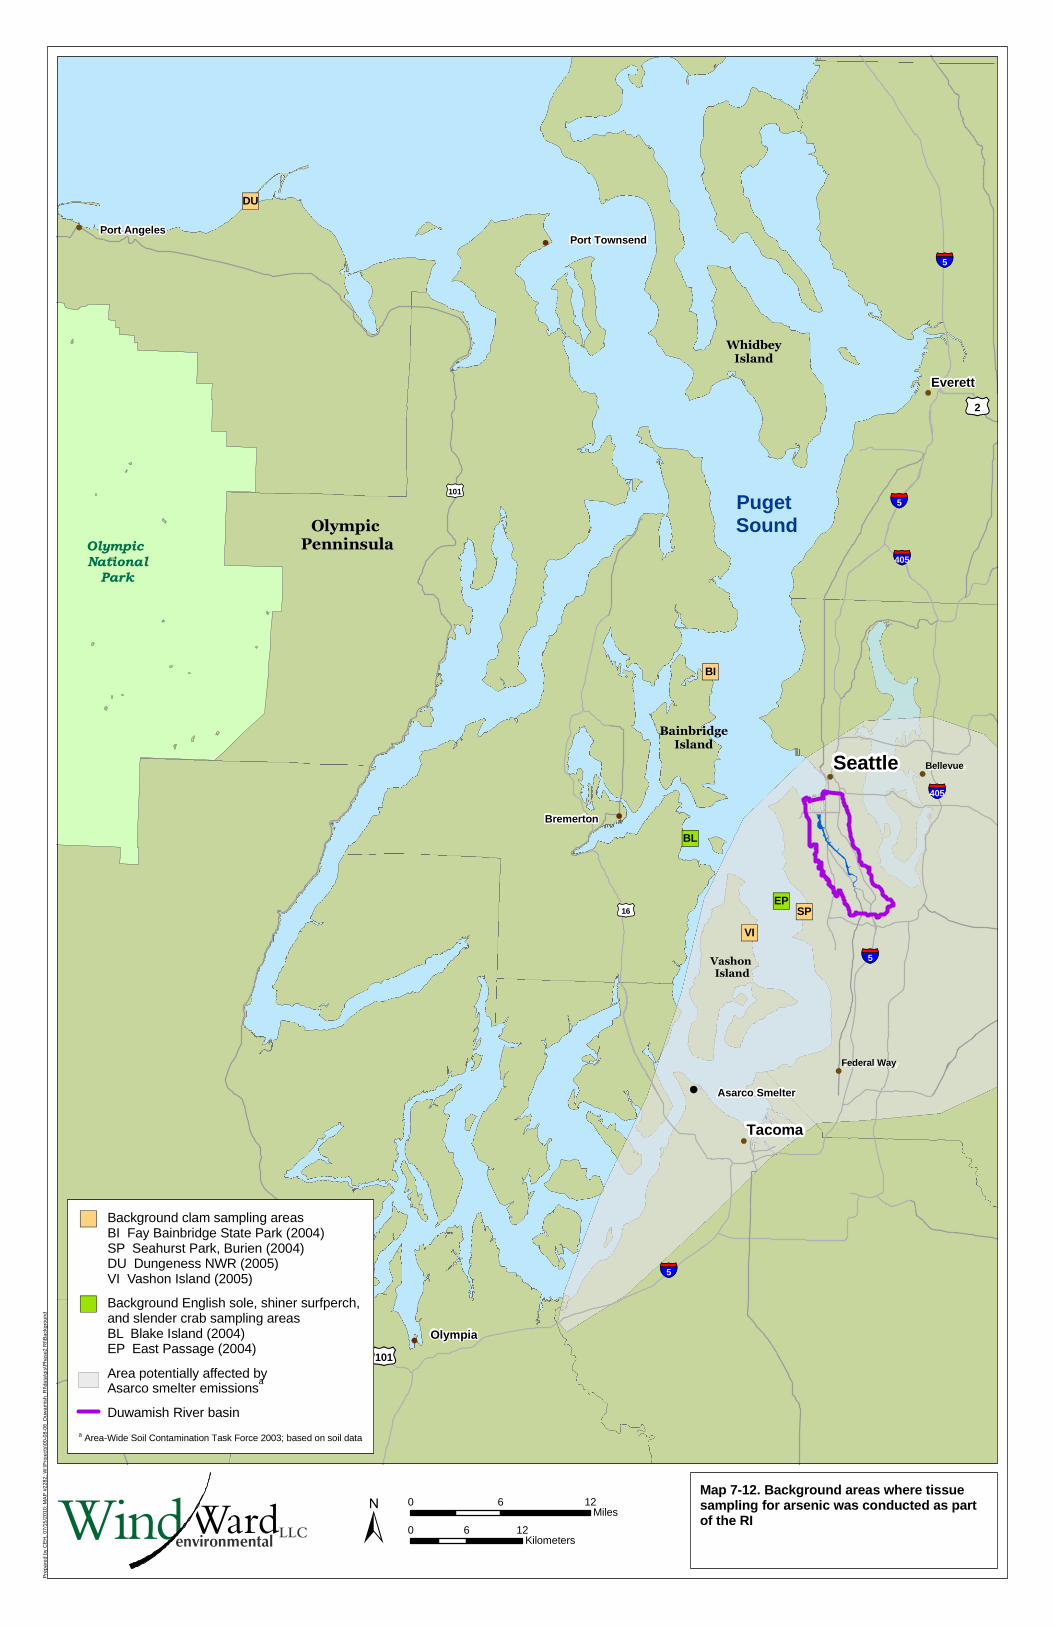
±Map 7-12. Background areas where tissuesampling for arsenic was conducted as partof the RI
LLCWindWardenvironmental
0 6 12Miles
0 6 12Kilometers
�) Background clam sampling areasBI Fay Bainbridge State Park (2004)SP Seahurst Park, Burien (2004)DU Dungeness NWR (2005)VI Vashon Island (2005)
�) Background English sole, shiner surfperch,and slender crab sampling areas BL Blake Island (2004)EP East Passage (2004)
Area potentially affected byAsarco smelter emissions
a
Duwamish River basin
a Area-Wide Soil Contamination Task Force 2003; based on soil data
Slip 1
Slip 2
Kellogg I.
Harbor I.
1.9
1.8
1.7
1.6
1.5
1.4
1.3
1.2
1.1
0.9
0.8
0.7
0.6
0.5
0.4
0.3
0.2
0.1
0.0
1.0
C5
C4
C1
C3-2
C2-2
C2-1
C5_North
C4_North
C1_North
C3-2_North
C3-1_North
C2-1_North
C3-1
C2-2_North Slip 4
Slip 3
PublicAccess
C11
C12�)
C7_NorthC8_North
2.2
3.9
3.7
3.6
3.5
3.4
3.3
3.2
3.1
2.9
2.8
2.7
2.6
2.5
2.4
2.3
3.8
2.1
1.9
2.0
3.0
C9C8
C6
C5
C7-2
C7-1
C10-2
C10-1
C6_North
C5_North
C12_North
C11_North
C10-2_North
Slip 6
Upper TurningBasin
5.7
5.6
5.5
5.4
5.3
5.2
5.1
4.9
4.8
4.7
4.6
4.5
4.4
4.3
4.2
4.1
3.9
4.0
5.0
Pre
pare
d by
CE
H, 0
7/15
/201
0; M
AP
#25
73; W
:\Pro
ject
s\00
-08-
06_D
uwam
ish_
RI\d
ata\
GIS
\Pha
se2
RI\C
OC
_RB
TC
Exp
lora
tion
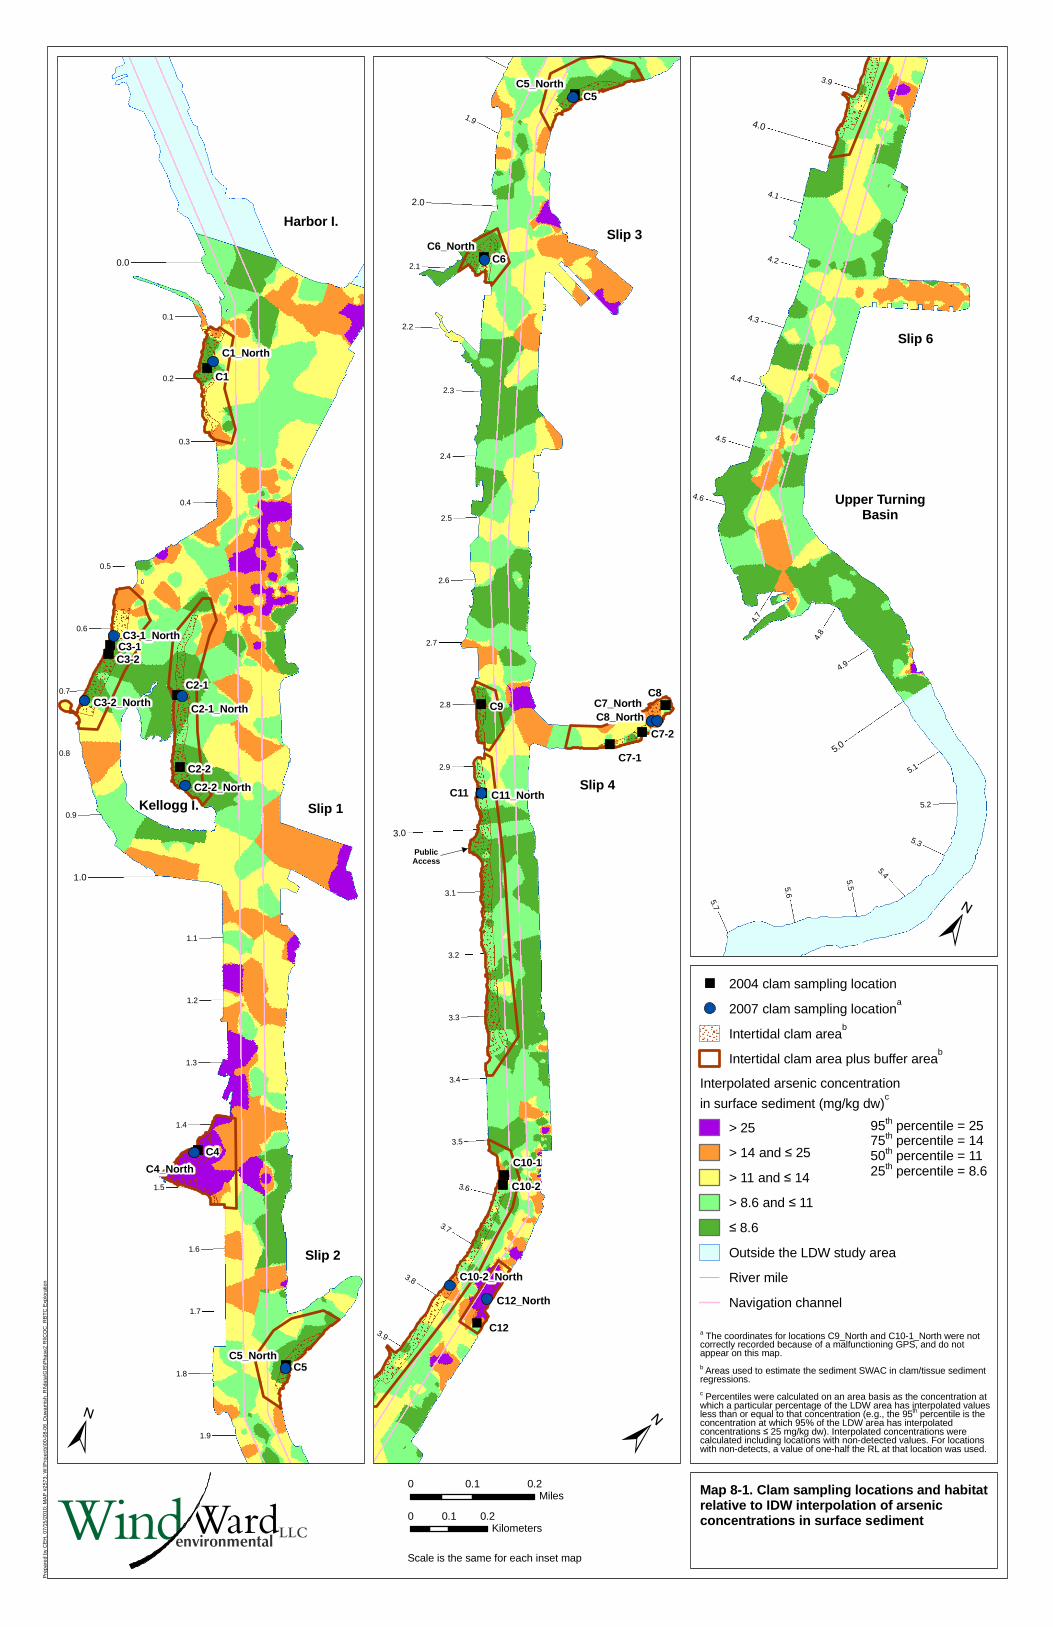
±Map 8-1. Clam sampling locations and habitatrelative to IDW interpolation of arsenicconcentrations in surface sediment
2004 clam sampling location
2007 clam sampling locationa
Intertidal clam areab
Intertidal clam area plus buffer areab
Interpolated arsenic concentration
in surface sediment (mg/kg dw)c
> 25
> 14 and ≤ 25
> 11 and ≤ 14
> 8.6 and ≤ 11
≤ 8.6
Outside the LDW study area
River mile
Navigation channel
±
±
Scale is the same for each inset map
0 0.1 0.2Miles
0 0.1 0.2Kilometers
LLCWindWardenvironmental
95th percentile = 2575th percentile = 1450th percentile = 1125th percentile = 8.6
a The coordinates for locations C9_North and C10-1_North were notcorrectly recorded because of a malfunctioning GPS, and do notappear on this map.b Areas used to estimate the sediment SWAC in clam/tissue sedimentregressions.c Percentiles were calculated on an area basis as the concentration atwhich a particular percentage of the LDW area has interpolated valuesless than or equal to that concentration (e.g., the 95th percentile is theconcentration at which 95% of the LDW area has interpolatedconcentrations ≤ 25 mg/kg dw). Interpolated concentrations werecalculated including locations with non-detected values. For locationswith non-detects, a value of one-half the RL at that location was used.

Slip 1
Slip 2
Kellogg I.
Harbor I.
1.9
1.8
1.7
1.6
1.5
1.4
1.3
1.2
1.1
0.9
0.8
0.7
0.6
0.5
0.4
0.3
0.2
0.1
0.0
1.0
C5
C4
C1
C3-2
C2-2
C3-1
C2-1Slip 4
Slip 3
2.2
3.9
3.7
3.6
3.5
3.4
3.3
3.2
3.1
2.9
2.8
2.7
2.6
2.5
2.4
2.3
3.8
2.1
1.9
2.0
3.0
C9C8
C6
C5
C7-2C7-1
C10-2C10-1
Slip 6
Upper TurningBasin
5.7
5.6
5.5
5.4
5.3
5.2
5.1
4.9
4.8
4.7
4.6
4.5
4.4
4.3
4.2
4.1
3.9
4.0
5.0
Pre
pare
d by
CE
H, 0
7/15
/201
0; M
AP
#33
79; W
:\Pro
ject
s\00
-08-
06_D
uwam
ish_
RI\d
ata\
GIS
\Pha
se2
RI\C
OC
_RB
TC
Exp
lora
tion
±Map 8-2. Clam sampling locations and habitatrelative to IDW interpolation of cPAHconcentrations in surface sediment
2004 clam sampling locationa
Intertidal clam areab
Intertidal clam area plus buffer areab
Interpolated cPAH concentration
in surface sediment (µg/kg dw)c
> 1,100
> 460 and ≤ 1,100
> 260 and ≤ 460
> 130 and ≤ 260
≤ 130
Outside the LDW study area
River mile
Navigation channel
±
±
Scale is the same for each inset map
0 0.1 0.2Miles
0 0.1 0.2Kilometers
LLCWindWardenvironmental
95th percentile = 1,10075th percentile = 46050th percentile = 26025th percentile = 130
a Clams were collected in 2007 but were not analyzed for cPAHs.b Areas used to estimate the sediment SWAC in clam tissue/sedimentregressions.c Percentiles were calculated on an area basis as the concentration atwhich a particular percentage of the LDW area has interpolated valuesless than or equal to that concentration (e.g., the 95th percentile is theconcentration at which 95% of the LDW area has interpolatedconcentrations ≤ 1,100 µg/kg dw). Interpolated concentrations werecalculated including locations with non-detected values. cPAHconcentrations are based on benzo(a)pyrene equivalents. TEQs werecalculated with mammalian PEFs for seven individual PAH compounds(California EPA 1994), using one-half the RL for undetected compounds.