low-voltage dc power transmission line model …fyvie001/files/senior design paper, fred fyvie...
TRANSCRIPT

Low-Voltage DC Power Transmission Line Model Utilizing 3-Phase Wind Power Generation
Fredric W. Fyvie Trevor D. Jackson
May 10th, 2013
Department of Electrical Engineering University of Minnesota Duluth
Duluth, MN 55812

1
Table of Contents
Page Abstract 3
I. Introduction 4 II. Overview 4
a. AC vs. DC 4 b. Thyristor Theory in Rectification Control 5 c. Inversion 7
III. Specifications and Methods 8 a. Turbine 9 b. AC-DC Rectifier 10 c. DC-AC Inverter 11
IV. Considerations 14 a. Economic Concerns 14 b. Environmental 15 c. Sustainability 16 d. Manufacturability 16 e. Health and Safety 17 f. Political 17
V. Results and Discussion 17 VI. Conclusions 22
VII. References 25
List of Tables
Page Table 1: Turbine Generation Values 18 Table 2: Rectified Voltages 18 Table 3: Arduino Input Signal Voltages 19 Table 4: Duty Ratios 19 Table 5: Point Generation Data 19 Table 6: Duty Cycle Equation 19 Table 7: Transmission Circuitry Values 20
List of Equations
Page Equation 1: Corner Frequency 13 Equation 2: Phase to Rectified Voltage 18

2
List of Figures Page Figure 1: Thyristor Schematic 6 Figure 2: Firing Angle 7 Figure 3: AC-DC Pseudo-Sinusoidal Inverter 7 Figure 4: Wire Coil Placement 9 Figure 5: 3-Phase AC to DC Rectification and Control 10 Figure 6: 3-Phase Bridge Rectifier Output Waveform 11 Figure 7: Inverter Circuit 12 Figure 8: Phasing of PWMs 12 Figure 9: Pseudo-Sinusoidal Signal 13 Figure 10: Smoothed Output Waveform with Harmonics 13 Figure 11: AC vs. DC ROW Comparison 14 Figure 12: Break-Even Distance (Point) 15 Figure 13: Magnetic Field in a DC Line 15 Figure 14: Low Wind Speed Rectification and Transmission 20 Figure 15: Medium Wind Speed Rectification, PWM, and Transmission 21 Figure 16: High Wind Speed Rectification, PWM, and Transmission 21 Figure 17: Inversion Output 22

3
Abstract
Power is essential to our every-day lives, and challenges arise in how to distribute such power to consumers. Three-phase AC transmission lines have primarily taken over our grid in the United States as the standard form of power transmission from power generators to substations and household/commercial loads. However, for long distance transmission, AC transmission suffers from multiple sources of power loss and non-idealities, and thus is not as ideal for long transmission runs. However, DC transmission doesn't suffer from these same issues, and is often times more ideal for longer distances. Such a system is already present locally, running from a 75MW wind farm in North Dakota to Arrowhead Substation in Hermantown, Minnesota [1]. This project takes a DC transmission line and scales it down to a low-voltage model. Incorporating a 3-phase AC wind turbine, 3-phase AC to DC conversion utilizing thyristor modeling, as well as DC to 3-phase AC oscillation, this physical model demonstrates the principles of what must occur in order to make such a transmission line possible while educating about the benefits and pitfalls of using such technology.

4
I. Introduction
Power will always be a commodity that we greatly value due to its high necessity in our every-day lives, and how to produce it is, without a doubt, a hot-topic in today's culture. However, how to transmit this power to residential and commercial buildings is another issue not many think about. There exist two ways of transmitting this power, one being through the use of alternating current (AC), and the other being through direct current (DC). While both have their benefits and pitfalls, each is beneficial for certain scenarios. This report outlines the research, development, and testing of a low-voltage DC transmission line model to educate about the mechanics and engineering that must occur in order to make the less-common DC transmission line properly function. While AC is the predominate system, it suffers from issues that the DC system doesn't, more notably in long distance transmission. The benefits and faults of both these systems will be analyzed in this report, along with outlining the work done to build a working low-voltage direct current (LVDC) transmission line, complete with a 3-phase AC wind generation source, 3-phase AC to DC conversion, and DC-3-phase AC inversion or oscillation.
II. Overview
AC vs. DC Power transmission has long been a prevalent issue in the United States, and the world in general. While so many devices today depend on electricity, the transmission of this power from a generation source to a standard pluggable AC wall terminal has become a necessity. Alternating current (AC) has long taken over as the primary way of distributing this power across the electrical grid, due in large part to the use of transformers. These devices allow the line voltages to be stepped up or down depending on the required load voltage. The cost of DC stations to convert AC to DC and invert DC to AC are very costly, and often times rid the need for considering if a DC transmission line should even be an option. While the cost of the substations for an AC line is relatively cheap when compared to that of a DC station, the power losses experienced due to a long AC transmission distance are vastly greater. It is important to mention the difference in the number of conductors required for each transmission scheme. Typically, 3-phase AC lines use a total number of six conductors for the duration of the run: one conductor is used for each phase (three) typically being transmitted as a double AC circuit to cancel interference [2]. Sometimes, even a seventh conductor is added for a neutral return [3]. DC lines, however, only use two: one for the positive DC transmission and one for ground [2]. These added conductors in the AC system contribute more power losses. With one third the number of conductors, HVDC starts to become more economically feasible both in power loss and conductor cost. The right of way (ROW) is also an important factor to consider when building AC transmission lines. The ROW is the safe distance around the power lines that must be kept clear of any natural growth. With DC lines, this ROW is much narrower [2].

5
DC lines have much lower EMI (Electromagnetic Interference) due to the absence of an alternating current flow, and thus have much less of an environmental impact. DC lines also do not have inherent series reactance and shunt reactance that introduce regulation issues, stability problems, and power loss [4]. The skin effect, or the fact that nearly all the AC current is carried in the outermost "skin" of the conductor, accounts for a high power loss in AC transmission systems. Also, the distance from line to ground or line to line conductors in an AC system is much greater than that of the distance required between the positive to ground conductors in a DC system. This means more space is required to install AC transmission towers versus DC transmission towers, which leads to a larger ROW. The effect of standing waves in AC systems also leads to attenuation distortion of the system, due to impedance mismatch, which is far from ideal. Therefore, the transmission distance needs to be matched to the AC frequency to ensure no standing waves can be present. While the current AC infrastructure dominates DC in short transmission distances due to the high cost of conversion technology in HVDC systems, there comes a transmission distance where the two technologies become economically equal to each other. This is typically coined the "break-even distance" [2]. At this distance, the AC cost of running more conductors and loss of power due to AC non-idealities begins to catch up to the initial high cost of building conversion technology for a DC system. For distances equal or great to this break-even distance, DC transmission makes more sense, both economically and environmentally. With these thoughts in mind, it seems as though DC, despite its high cost in rectification and inversion stations, has the upper hand in long transmission distances. With the advent of the thyristor, the power conversion efficiency of DC stations has become even more prominent, thus reducing some of the high cost of energy conversion in the DC stations. With thyristors, the efficiency of a converter station can be expected to be in the 99% range [5]. This efficiency is vastly higher than in previous history and thus DC transmission begins to make more sense despite its initial downfall of high cost conversion technology. While this project is not meant to disprove the benefits of AC transmission, it does have aim to give credit to DC transmission and the environmental and economic reasons it exists. But if the benefits of DC can primarily be seen in the transmission phase, how then is the conversion from AC to DC done effectively, and namely at the 99% efficiency as noted before? This is through the use of thyristors.
Thyristor Technology in Rectification Control In order to keep a constant voltage over the DC line, thyristors are used to cut off the generated waveform using an external control signal. Thyristors act very much like diodes in the fact that they only allow current to flow in one direction (anode to cathode). However, unlike normal diodes, an external gate is used to turn on the thyristor to allow current to flow [6]. In this regard, thyristors behave much like a MOSFET or BJT. However, thyristors continue to conduct through the device even after the gate voltage is removed. This is due to a gated structure of alternating P-type and N-type semiconductor material. In a sense, a thyristor can be modeled by using two BJT's, with the collector of one BJT controlling the base of the other. The schematic, P-N-P-N structure, and BJT transistor model can all be seen in Figure 1 [6].

6
Figure 1: Thyristor Schematic [6]
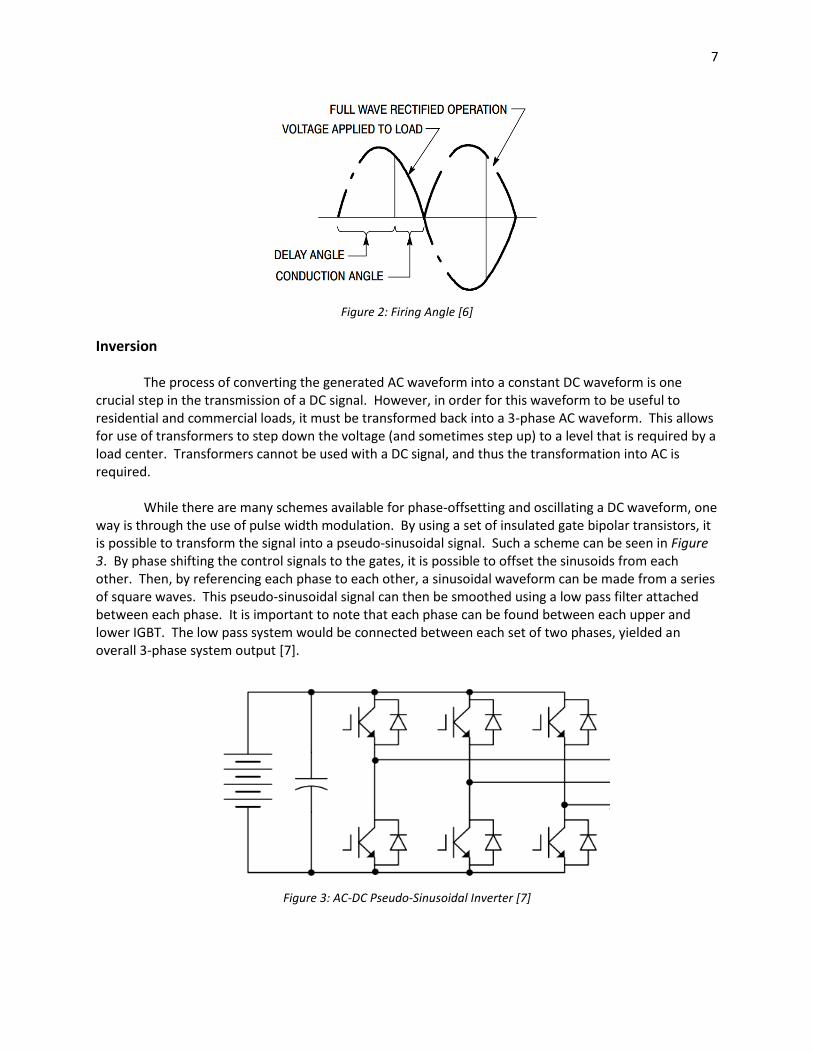
Thyristors are relatively easy to turn on. By simply applying a gate voltage above the threshold level at the gate of the thyristor, the current is able to flow from the anode to the cathode with little leakage current from the gate. However, turning the thyristor off is not as simple. Due to the gating characteristic of the thyristor, one the gate voltage is applied, the current that flows through the device continues to bias the gate so the device continues to conduct. Therefore, it can be stated that the device only turns off when the input waveform to the anode returns to zero [6]. This type of behavior is ideal for AC to DC conversion as the rectified AC waveform naturally returns to zero after every rectified cycle. Therefore, the thyristor will naturally turn off after the waveform returns to zero. This natural turn-off ability is a convenience as it eliminates a signal required to turn off the device. Only one signal is required to be supplied to the thyristor: a firing signal. A firing signal is simply a control voltage applied to the gate of the thyristor in order to turn the device on and allow it to conduct. The crucial part of this signal comes in its timing, or a "firing angle". Due to the need of constant voltage over the DC transmission line, the thyristor plays a crucial role in making sure this happens. If too much power is being generated, the thyristor is responsible for cutting the waveform to ensure that the line voltage doesn't spike. By watching the frequency of the incoming waveform (and therefore voltage), a control scheme can be made to send a firing signal to turn on the thyristor after a certain portion of the rectified waveform has passed. This allows only a section of the waveform to pass, so that the input voltage can continuously be monitored to ensure constant output voltage. Of course smoothing of the chopped waveform is then needed to transform it into a clean DC signal. Figure 2 depicts the delay angle or phase angle and the times of conduction and turn-off in the device. It must be noted that turning off the thyristor is not always simple. If the input waveform doesn't settle to zero for a long enough period, the thyristor may never turn off and the device would be allowed to conduct for another rectified period [7].
7
Figure 2: Firing Angle [6]
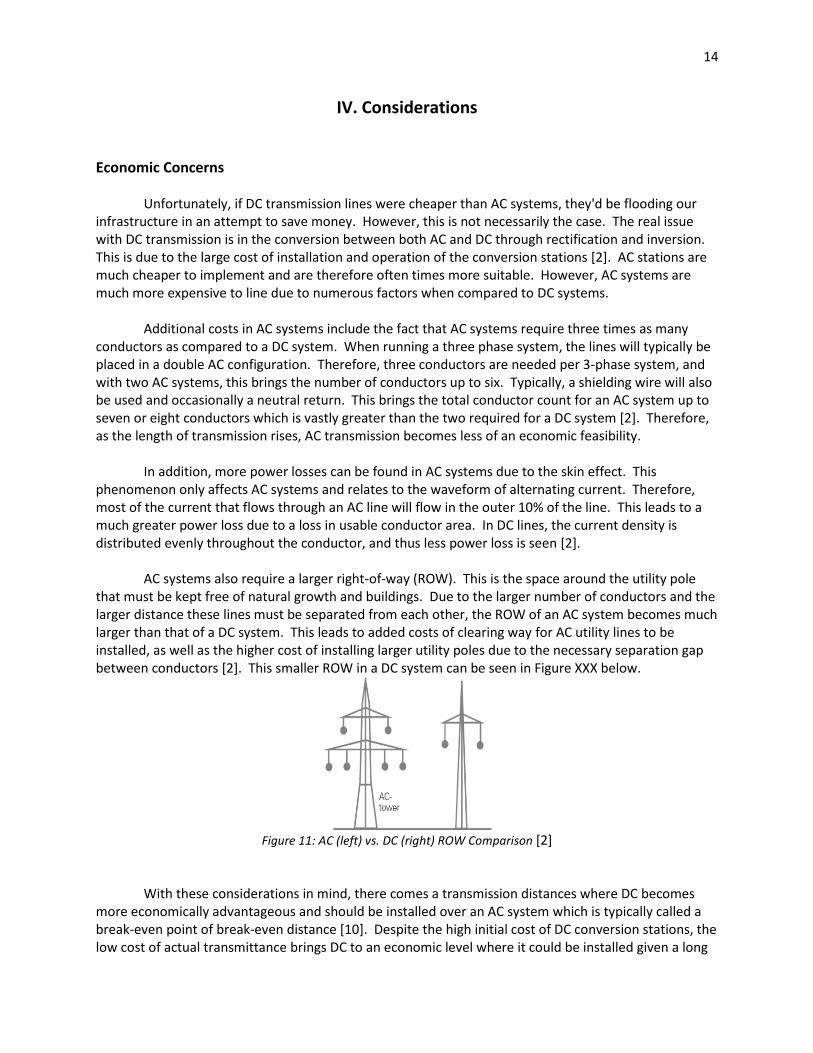
Inversion The process of converting the generated AC waveform into a constant DC waveform is one crucial step in the transmission of a DC signal. However, in order for this waveform to be useful to residential and commercial loads, it must be transformed back into a 3-phase AC waveform. This allows for use of transformers to step down the voltage (and sometimes step up) to a level that is required by a load center. Transformers cannot be used with a DC signal, and thus the transformation into AC is required. While there are many schemes available for phase-offsetting and oscillating a DC waveform, one way is through the use of pulse width modulation. By using a set of insulated gate bipolar transistors, it is possible to transform the signal into a pseudo-sinusoidal signal. Such a scheme can be seen in Figure 3. By phase shifting the control signals to the gates, it is possible to offset the sinusoids from each other. Then, by referencing each phase to each other, a sinusoidal waveform can be made from a series of square waves. This pseudo-sinusoidal signal can then be smoothed using a low pass filter attached between each phase. It is important to note that each phase can be found between each upper and lower IGBT. The low pass system would be connected between each set of two phases, yielded an overall 3-phase system output [7].
Figure 3: AC-DC Pseudo-Sinusoidal Inverter [7]

8
While inverter systems in the field may be different than this technique, this form of system offers a cheap and simple solution to the problem. For larger systems, more insulation is required to ensure equipment is not damaged and that safety is ensured.
III. Specifications and Methods
In order to implement a small signal, low-voltage model, three sections were required. The first was the creation of a 3-phase turbine to generate the power that would be converted to DC, transmitted, and inverted back to 3-phase AC. The second involved the 3-phase AC to DC rectification. This section includes the controlling of the firing angle in order to properly keep a steady voltage over the line. The third and final stage included designing a DC to 3-phase AC inverter. For each section of the project, certain materials were required in order to properly build the small-signal model. For each section, the materials can be seen below. Note that these were the final material required for the project. Not listed below are intermediate materials that were not used in the final design (mostly due to non-idealities). Turbine:
1. PicoTurbine Kit 2. Lomanco BIB-12 MILL Whirlybird Turbine Ventilator 3. Epoxy Glue 4. Tape 5. Wire (22AWG or up)
AC-DC Rectifier
1. Breadboard 2. Wire (22AWG or up) 3. 39uH Inductor 4. 100uF Capacitors 5. N-Channel Power MOSFET 6. Power Diodes 7. 1MΩ Load Resistor 8. Push Button (for discharging capacitors) 9. Toggle Switch (for ground switching) 10. Arduino Uno and Cable 11. 5V Power Supply
DC-AC Inverter
1. Breadboard 2. Wire (22AWG or up) 3. 39uH Inductors 4. 10uF Capacitors

9
5. Power Diodes 6. Perfboard/Plastic Board (for mounting capacitor banks) 7. 100Ω Load Resistors 8. Arduino Uno and Cable 9. Variable Power Supply
Additional Materials
1. Cat-5 Cables (for communications) 2. Cat-5 Receptacles 3. Oscilloscopes 4. Arduino Development Software
Using the materials and software listed above, it was possible to construct a working small-signal DC transmission line model. The small-signal model was made to represent the larger real-world DC transmission systems in place in our infrastructure. The first step was creating a turbine to properly generate 3-phase power.
Turbine In order to create a turbine to properly generate three phase power, it was important to understand Faraday's Law. Through this law, it is proven that a moving magnetic field over a wire coil induces a magnetic field in the wire coil. By exploiting this concept, a stronger current can be draw by using multiple coils and multiple magnets. To generate a single phase of power, four wire coils could be connected in series to one another and places on the base of the Lomanco WhirlyBird. Each wire coil could be placed 90° apart from each other. Then, 16 bar magnets could be secured to the rotating section of the WhirlyBird, with every-other magnet facing in an alternate direction and therefore creating an alternating north-south pole structure. After connecting the rotor to the stator and spinning the rotor (simulating wind), the magnets would continually rotate over the wire coils allowing magnetic flux to flow between them. This, in turn, generates an electric current through the coils and can be used to power external devices. By adding four more wire coils (each in series with each other) 120° apart from the first phase, a second phase could be created. Finally, by adding four more wire coils 120° apart from the second phase, a third phase could be created. The overall layout of the wire coils can be seen in Figure 4 (where P1,1 denotes phase 1, coil 1, etc).
Figure 4: Wire Coil Placement

10
The leads of each phase could be extracted from the turbine and used to connect to the AC-DC rectifier unit.
AC-DC Rectifier In order to properly rectify and control the 3-phase power generated by the Whirlybird, a couple concepts needed to be put together. The first involved created a 3-phase bridge rectifier. This type of rectifier takes in three phase voltages, and outputs a nearly constant DC voltage. Then, this waveform was smoothed using a smoothing capacitor. The second was a Buck converter utilizing an N-channel MOSFET. This part of the circuit would chop the waveform using a PWM generated by an Arduino if the turbine was generating too much power. Otherwise it would pass the signal straight through with a duty ratio of 1. If the turbine wasn't generating enough power (DC line voltage would be too low), then the rectified signal would not be allowed to pass with a duty ratio of 0. If the waveform was anywhere above the wanted transmittance voltage, the Arduino would change the duty ratio accordingly to only pass a percentage of the rectified waveform. As noted, the rectified and smoothed waveform also needed to be sent to an Arduino in order for it to calculate the Duty ratio needed to be applied to the buck converter. Finally, the chopped waveform was smoothed using one final smoothing capacitor that would hold the voltage at a constant DC level. Figure 5 shows the circuitry used to simulate the conversion from 3-phase AC to DC through the use of rectification control. The diode section constitutes the 3-phase bridge rectifier. The first capacitor is a smoothing capacitor to give the input of the Arduino a clean DC signal. This signal also goes into the drain of the MOSFET. Finally, the MOSFET, lone diode, and second capacitor constitute the buck converter. Using the duty ratio supplied by the Arduino, the input to the MOSFET with either be passed through or attenuated depending on the magnitude of the voltage after rectification.
Figure 5: 3-Phase AC to DC Rectification and Control

11
Figure 6 demonstrate the expected output waveform of the 3-phase bridge rectifier before any smoothing is done. After smoothing, the slight ripple in the bottom waveform will be removed and will be used as an input to the Arduino to send the level of power generation currently being attained.
Figure 6: 3-Phase Bridge Rectifier Output Waveform [9]
An important note needs to be addressed regarding the use of the buck converter. A buck converter works on the concept that it will either pass through the voltage it is given, or attenuate it. Therefore, this is an ideal circuit to simulate the behavior of a thyristor. Thyristors were originally chosen to be used, but unfortunately would not turn off properly. With thyristors connect, the 3-phase bridge rectifier was not used, and instead, each phase was rectified separately. With the thyristors not properly turning off and some small gate current trickling through to the output, thyristors were abandoned and a buck converter was used to simulate the effect the thyristors would have on the conversion.
DC-AC Inverter
After transmission, the DC waveform needs to be inverted back into a 3-phase AC signal so that it can be used within the local infrastructure. This voltage will usually be stepped down using transformers. The DC waveform needs to be oscillated as well as phase shifted in order to yield three sinusoidal signals, each 120° apart from each other. Our approach to this problem involved using six MOSFETs (three N-channel and three P-Channel). Initially, insulated-gate bipolar transistors (IGBTs) were going to be used. However, it was discovered that, due to non-idealities, the gates of these transistors were not truly "insulated". Therefore, the six MOSFETs were used instead. The design of the inverter can be seen in Figure 7.

12
Figure 7: Inverter Circuit
All MOSFETs received a duty ratio of 33% (to prevent shorting) at 60Hz. The MOSFETs, however, were all pulse width modulated at different phases. The top three MOSFETs (P-channel) were all set 120° apart from each other. The three bottom MOSFETs (N-channel) were each set 180° apart from its corresponding-phase P-channel MOSFET. This phasing sequence can be seen in Figure 8.
Figure 8: Phasing of PWMs
Each phase constitutes one vertical column of MOSFETs. However, in order to get the proper phasing, one phase must be referenced to that of another phase. Therefore, by taking the mid-point of one phase in reference to the midpoint of another phase, a phase voltage could be measured. This waveform was not expected to be sinusoidal, but instead pseudo-sinusoidal. Each would appear to be a sinusoid in the form of a stepping waveform as shown in Figure9. Therefore, the lower section of the circuit containing the inductor and capacitor constitutes a LC low-pass filter. In North America, the standard AC frequency used is 60Hz. Therefore, the DC signal needed to be oscillated back into a 60Hz waveform so that it could be utilized in the modern infrastructure.

13
Figure 9: Pseudo-Sinusoidal Signal
In order to properly oscillate into 60Hz, two things needed to occur. First, the PWM signals needed to be created properly at 60Hz. To do so, a timer was created so that every 60°, one MOSFET would turn on and another one would turn off. This 60° translates to 2.77ms for a 60Hz waveform as the period for a 60Hz oscillation is 1/60Hz or 16.66ms. For 60° (or 1/6 of this period), it would calculated out to be 2.77ms per 60° switch. The second important trait in properly oscillating at 60Hz is to properly filter the pseudo-sinusoidal waveform. Simply measuring the phase to phase voltages without filtering yields a sinusoid in the form of continuous stepping. In order to filter it properly, a low-pass LC circuit was created to filter out harmonics higher than those required. For this system, anything above 60Hz are unnecessary harmonics. This corner frequency (60Hz) could be used to set the inductance values capacitance values to those necessary to filter out any frequency greater that 60Hz. Due to component limitations, an inductance of 39mH was used and with a capacitance of 60uF. Using Equation 1, this comes to a corner frequency of 104Hz. Therefore, it should be expected that slight harmonics above 60Hz are seen in the output waveform as shown in Figure 10.
Equation 1: Corner Frequency
Figure 10: Smoothed Output Waveform with Harmonics
14
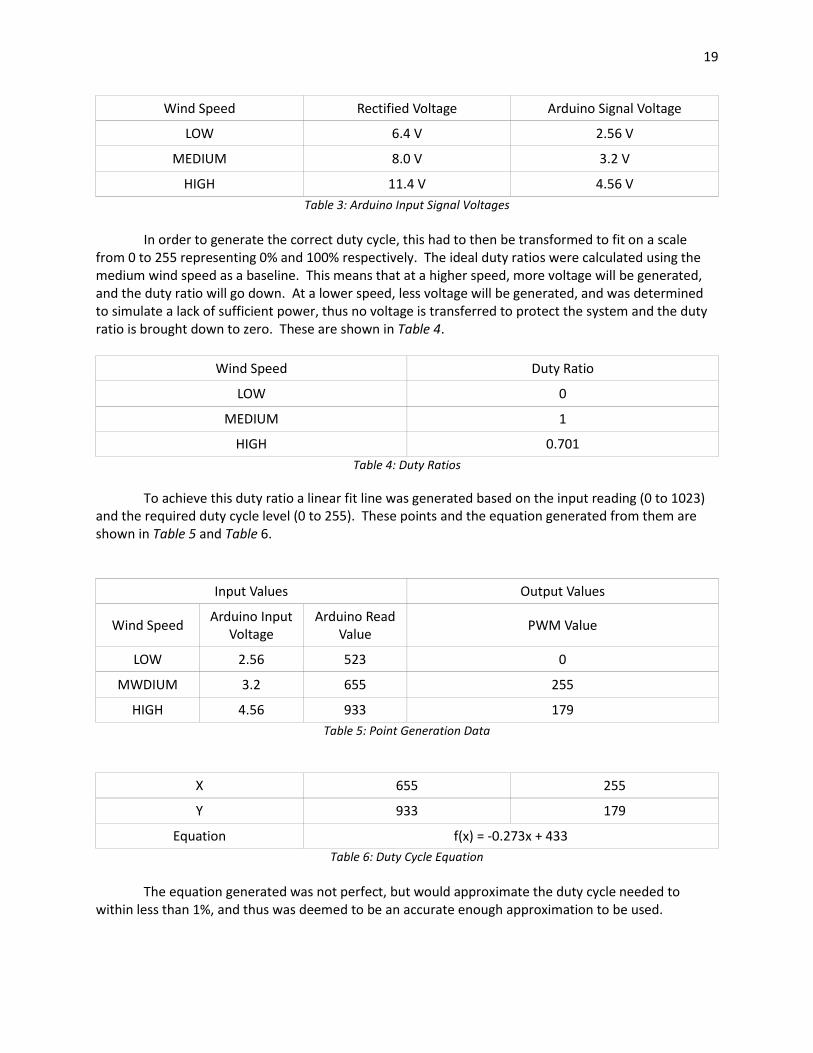
IV. Considerations Economic Concerns Unfortunately, if DC transmission lines were cheaper than AC systems, they'd be flooding our infrastructure in an attempt to save money. However, this is not necessarily the case. The real issue with DC transmission is in the conversion between both AC and DC through rectification and inversion. This is due to the large cost of installation and operation of the conversion stations [2]. AC stations are much cheaper to implement and are therefore often times more suitable. However, AC systems are much more expensive to line due to numerous factors when compared to DC systems. Additional costs in AC systems include the fact that AC systems require three times as many conductors as compared to a DC system. When running a three phase system, the lines will typically be placed in a double AC configuration. Therefore, three conductors are needed per 3-phase system, and with two AC systems, this brings the number of conductors up to six. Typically, a shielding wire will also be used and occasionally a neutral return. This brings the total conductor count for an AC system up to seven or eight conductors which is vastly greater than the two required for a DC system [2]. Therefore, as the length of transmission rises, AC transmission becomes less of an economic feasibility. In addition, more power losses can be found in AC systems due to the skin effect. This phenomenon only affects AC systems and relates to the waveform of alternating current. Therefore, most of the current that flows through an AC line will flow in the outer 10% of the line. This leads to a much greater power loss due to a loss in usable conductor area. In DC lines, the current density is distributed evenly throughout the conductor, and thus less power loss is seen [2]. AC systems also require a larger right-of-way (ROW). This is the space around the utility pole that must be kept free of natural growth and buildings. Due to the larger number of conductors and the larger distance these lines must be separated from each other, the ROW of an AC system becomes much larger than that of a DC system. This leads to added costs of clearing way for AC utility lines to be installed, as well as the higher cost of installing larger utility poles due to the necessary separation gap between conductors [2]. This smaller ROW in a DC system can be seen in Figure XXX below.
Figure 11: AC (left) vs. DC (right) ROW Comparison [2]
With these considerations in mind, there comes a transmission distances where DC becomes more economically advantageous and should be installed over an AC system which is typically called a break-even point of break-even distance [10]. Despite the high initial cost of DC conversion stations, the low cost of actual transmittance brings DC to an economic level where it could be installed given a long

15
enough transmission distance. This break-even distance is typically for distances greater than 500 miles or 800 kilometers [10]. The general trend for the installation of a DC line versus an AC line can be seen in Figure XXX.
Figure 12: Break-Even Distance (Point) [10]
Environmental Concerns As previously mentioned, DC lines have a much smaller ROW. This leads to less destruction of natural growth that could change an ecosystem. It is also important to look at the electromagnetic interference (EMI) that AC lines emit. This EMI can be very dangerous to life living around these lines, and must always be considered a factor when deciding where to build AC transmission lines. The magnetic field of AC lines is much higher than that of DC lines, and thus must become a factor in determining which type of line should be installed [11]. Figure XXX gives a graphical representation of the lower level of magnetic field generated in a DC transmission line.
Figure 13: Magnetic Field in a DC Line [11]

16
It is also important to note the smaller amount of aluminum needed for building the DC utility poles as compared to AC utility poles as well as the larger amount of conductor metal required for a double AC transmission system as compared to DC. Both of these factors become important when analyzing the small amount of natural resources we have here on Earth. DC transmission lines are also typically used with renewable energy sources. This is true due to the fact that the sources of renewable energy are often times very distant from the locations that require large amounts of power. Therefore, DC transmission will always be associated with renewable energy.
Sustainability Concerns Unfortunately, DC transmission lines are subject to more maintenance to ensure it is working properly [2]. Therefore, DC systems must continuously be monitored to ensure safety and reliability in order to continuously operate. DC lines, however, can be used in under-water locations without the worry of harming the sea life already living there. Due to the lower amount of EMI and the lack of having to charge to line capacitance up every cycle, DC transmission makes this under-water transmission much more feasible [10]. Again, it is important to note that DC lines will always be associated with renewable energy, as this type of energy is often harvested at locations that are very distant from heavy load centers. This means, with a large distance, a DC would most likely be built to transfer this energy, since AC transmission is much more expensive for longer transmissions.
Manufacturability Concerns As noted before, DC transmission requires a much lower number of conductors. Also, the utility pole size is greatly reduced in a DC system, thus less manufactured metal is needed. This means a lighter weight for transportation is required as well as a smaller utility line to install in a similar location. Therefore, it is much cheaper and quicker to manufacture materials for DC transmission than it is for AC transmission. Due to the smaller ROW, the reduced height and width of the utility poles, as well as the lighter weight, DC transmission utility poles are much easier to install and can often times be set up much more quickly. Less work is needed to clear the area of natural growth, or any obstruction blocking the path of the line. All of this leads to a much easier manufacturability, as well as ease of installation. However, added manufacturing comes in the construction of conversion stations. These locations are often very large and require a lot of specific mechanics that need to be custom built. The time to install these conversion stations can sometimes trump the added ease of installing the utility poles and lines.

17
Health and Safety Concerns It is needless to say that DC transmission requires much more care and attention in terms of conversion. This means that utility workers must remain close to the conversion stations at all times in order to ensure all systems are working properly. Due to the switching in the thyristors and during oscillation, large electromagnetic noise can be found in the converter stations [11]. This is not healthy when exposed for prolonged periods of time. This leads to a more hazardous work environment. However, once outside the conversion stations, the EMI emitted along the DC lines is much smaller when compared to AC lines. This was previously discussed in the environmental concerns sections. The lower EMI outside the conversion stations means a smaller environmental footprint for the DC line. As long as the conversion stations are properly shielded and workers are not exposed for prolonged periods of time, DC transmission is a healthier and safer technology to use.
Political Concerns While political concerns are not very prevalent in DC transmission, the main political issue centers around the sharing of power between countries. Due to the ease of using DC transmission in under-water applications, it makes the transfer of power between countries much more plausible. The primary reason such power transfer is ideal in DC as compared to AC is due to countries having different operating frequencies of power transmission. In America, we operate with a frequency of 60Hz. However, not all countries operate at this 60Hz standard. With DC transmission, this incompatibility of frequencies does not have to be a concern. Power can be generated at whatever frequency is necessary in one country, then converted to DC and transmitted to another country, and finally converted back to AC at whatever frequency is necessary. This allows countries to share power without having to change their frequency standards. This allows countries to form alliances with other countries for power, so they may equally share each other's resources when needed. DC transmission opens up a political boundary that allows countries to communicate and work together to find ways around energy crises around the world. This can help stabilize power in areas of poor integrity and allow countries to come together for a joint energy effort.
V. Results and Discussion
The first step of the circuit was to create baseline information for generation from the turbine, seen in Table 1. These readings were taken from the turbine directly, and with no additional circuitry attached. The measured voltages are a single phase and are reported as the peak-to-peak voltage.

18
Wind Speed Phase Voltage(p-p) Frequency
LOW 3.1 V 20 Hz
MEDIUM 3.9 V 27.5 Hz
HIGH 5.0 V 36 Hz
Table 1: Turbine Generation Values
The voltage generated was also not always consistent for a given wind speed. This was attributed to the relative positioning of the turbine to the fan that was creating the wind. This created slight fluctuations in our input which proved to be helpful and harmful. The fluctuations were helpful in that it further simulated real-world conditions. However it was harmful in that this caused difficulties in generating a stable baseline of operation. The values in Table 1 are the most consistently obtained data. Immediately after generation, the signals were brought into a 3-phase rectifier. This merged the three phases together into a single signal with an amplitude according to Equation 2. As is seen, the voltages from each of the three phases are not simply added together, but instead are multiplied and the square root is taken.
Vo = √3 * Vphase Equation 2: Phase to Rectified Voltage
The change brought by the rectification can be seen in Table 2.
Wind Speed Rectified Voltage
LOW 6.4 V
MEDIUM 8.0 V
HIGH 11.4 V
Table 2: Rectified Voltages
With the addition of a smoothing capacitor directly after the rectification, the rectified voltages were very stable, and easily read. This allowed the Arduino to take a very clean reading of that rectified voltage. As was stated in the “AC-DC Rectifier” section, the Arduino was used first to generate a PWM signal that would drive a buck converter circuit. This PWM signal would determine the amount of the input voltage that was passed through to the buck converter, and thus transmitted. With a low duty ratio, the buck converter would pass a lower voltage, and with a high duty ratio, the buck converter would pass almost the entire input voltage. By measuring this input voltage, the Arduino was able to generate the proper duty ratio needed to keep the output voltage constant. Since the Arduino had a built in Analog-to-Digital converter, the input signal would be turned into a integer value between 0 and 1023 corresponding to 0 and 5 volts respectively. This also meant that the input voltage read from the rectification had to be lowered down to a maximum of 5 volts. This was achieved by using a voltage divider to lower the input signal by dividing by a factor of 2.5. This yielded the input to the Arduino as is shown in Table 3.
19
Wind Speed Rectified Voltage Arduino Signal Voltage
LOW 6.4 V 2.56 V
MEDIUM 8.0 V 3.2 V
HIGH 11.4 V 4.56 V
Table 3: Arduino Input Signal Voltages
In order to generate the correct duty cycle, this had to then be transformed to fit on a scale from 0 to 255 representing 0% and 100% respectively. The ideal duty ratios were calculated using the medium wind speed as a baseline. This means that at a higher speed, more voltage will be generated, and the duty ratio will go down. At a lower speed, less voltage will be generated, and was determined to simulate a lack of sufficient power, thus no voltage is transferred to protect the system and the duty ratio is brought down to zero. These are shown in Table 4.
Wind Speed Duty Ratio
LOW 0
MEDIUM 1
HIGH 0.701
Table 4: Duty Ratios
To achieve this duty ratio a linear fit line was generated based on the input reading (0 to 1023) and the required duty cycle level (0 to 255). These points and the equation generated from them are shown in Table 5 and Table 6.
Input Values Output Values
Wind Speed Arduino Input
Voltage Arduino Read
Value PWM Value
LOW 2.56 523 0
MWDIUM 3.2 655 255
HIGH 4.56 933 179
Table 5: Point Generation Data
X 655 255
Y 933 179
Equation f(x) = -0.273x + 433
Table 6: Duty Cycle Equation
The equation generated was not perfect, but would approximate the duty cycle needed to within less than 1%, and thus was deemed to be an accurate enough approximation to be used.
20
Given the mostly stable rectified voltage as the input, the Arduino was able to generate a PWM signal to drive the Buck converter. Within the Buck converter though were voltage losses over components, thus lowering the available transmission voltage. These had been evaluated to be approximately 3 volts between the rectification and Buck converter output. These losses are shown as part of Table 7, which details a reading of the entire transmission circuitry.
Wind Speed Rectified Voltage Possible
Transmittable Voltage
Ideal Transmission Voltage
Experimental Transmission
Voltage
LOW 6.0 0 0 0
MEDIUM 8.4 5.3 5.3 4.9
HIGH 10.7 7.6 5.3 5.5
Table 7: Transmission Circuitry Values
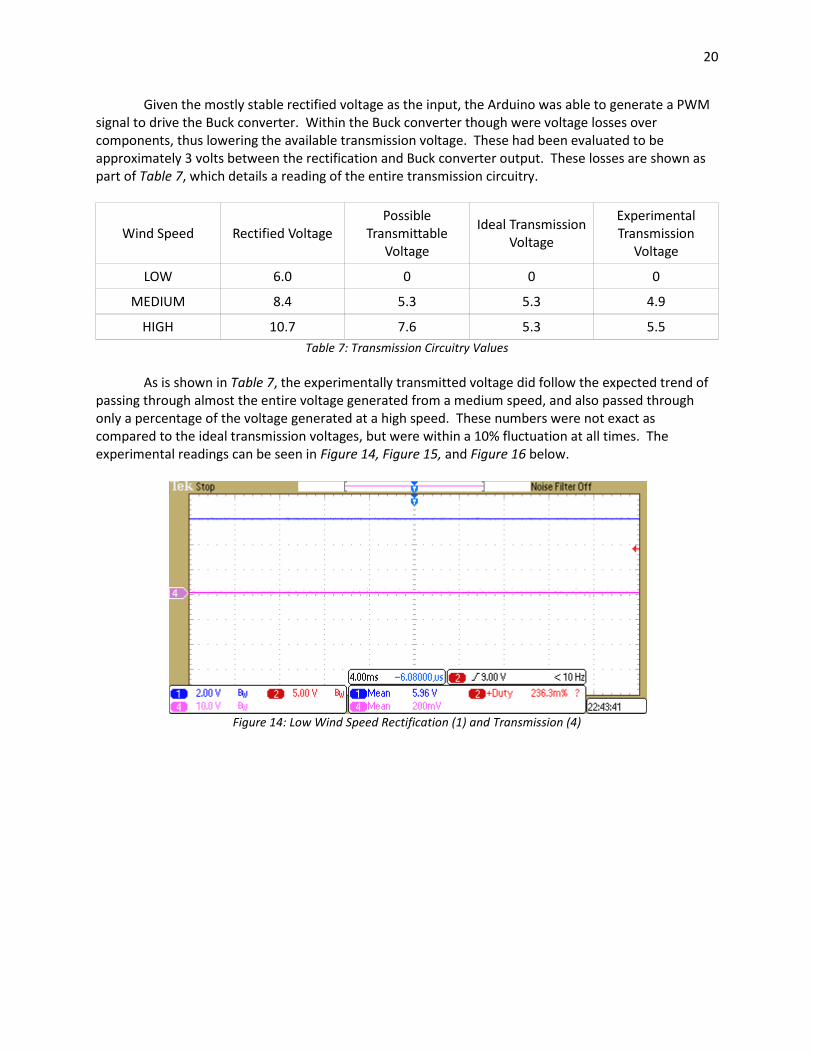
As is shown in Table 7, the experimentally transmitted voltage did follow the expected trend of passing through almost the entire voltage generated from a medium speed, and also passed through only a percentage of the voltage generated at a high speed. These numbers were not exact as compared to the ideal transmission voltages, but were within a 10% fluctuation at all times. The experimental readings can be seen in Figure 14, Figure 15, and Figure 16 below.
Figure 14: Low Wind Speed Rectification (1) and Transmission (4)
21
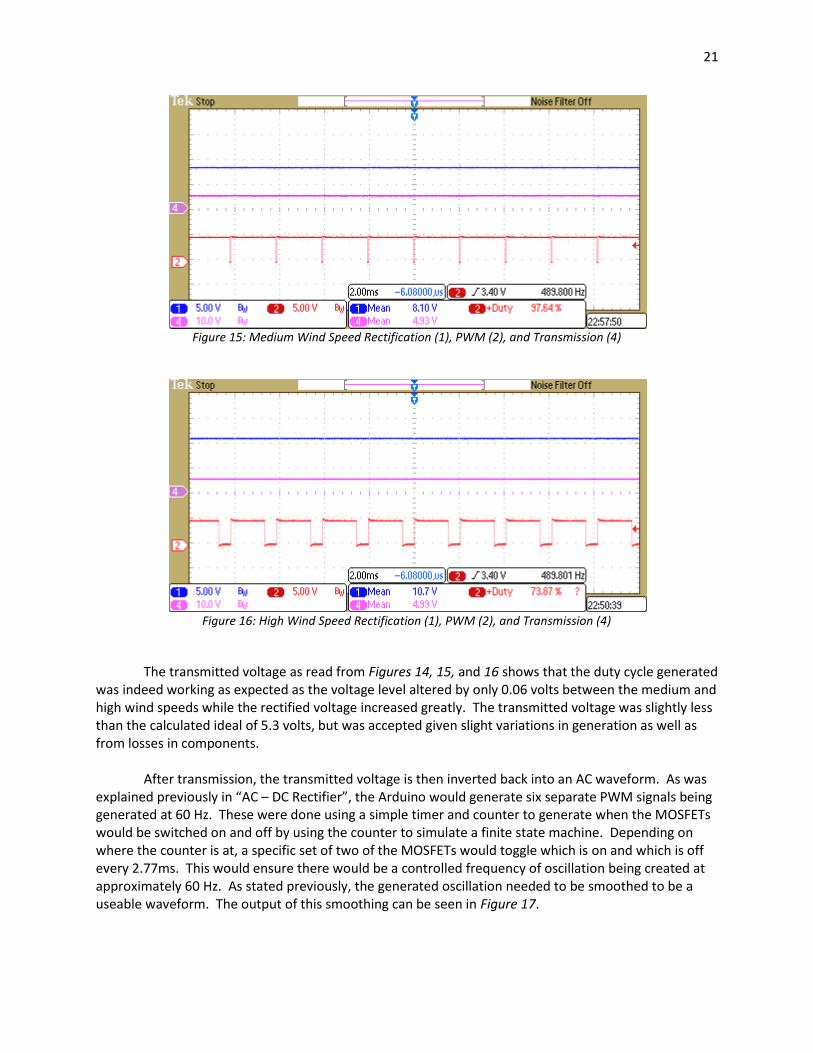
Figure 15: Medium Wind Speed Rectification (1), PWM (2), and Transmission (4)
Figure 16: High Wind Speed Rectification (1), PWM (2), and Transmission (4)
The transmitted voltage as read from Figures 14, 15, and 16 shows that the duty cycle generated was indeed working as expected as the voltage level altered by only 0.06 volts between the medium and high wind speeds while the rectified voltage increased greatly. The transmitted voltage was slightly less than the calculated ideal of 5.3 volts, but was accepted given slight variations in generation as well as from losses in components. After transmission, the transmitted voltage is then inverted back into an AC waveform. As was explained previously in “AC – DC Rectifier”, the Arduino would generate six separate PWM signals being generated at 60 Hz. These were done using a simple timer and counter to generate when the MOSFETs would be switched on and off by using the counter to simulate a finite state machine. Depending on where the counter is at, a specific set of two of the MOSFETs would toggle which is on and which is off every 2.77ms. This would ensure there would be a controlled frequency of oscillation being created at approximately 60 Hz. As stated previously, the generated oscillation needed to be smoothed to be a useable waveform. The output of this smoothing can be seen in Figure 17.

22
Figure 17: Inversion Output
As is shown in Figure 14, the resulting waveforms are oscillating at 58.94 Hz, which is just under the desired 60 Hz. Likewise, the phase shifting yields an almost perfect 120º separation between each generated waveform. It can also be seen that the waveforms are not perfectly sinusoidal. This is attributed to the LC low pass filter's corner frequency. Due to component availability, the corner frequency was experimentally set at 104 Hz. This means that there are some higher harmonics that are still present after filtration. These higher harmonics distorted the waveform to have a distinct triangular aspect still present. This distortion is still minimal, and would not affect the function of a load connected to it.
VI. Conclusions
Power is essential to our everyday lives. Understanding how that power is generated and transferred throughout the world can help us understand how to improve it. Though this was a low level model of a DC power transmission system, the concepts used are still relevant regardless of the size of the system. The system designed in this project was created in a way that every part would mimic that of a high power system. Under testing, this was shown to be true for each section of our design. The turbine was generating three pure sinusoidal waveforms at 120° phase separation from each other. The three-phase rectification yielded a single almost DC waveform at the expected voltage given a wind speed. The Arduino generated an easily controlled and stable PWM signal that controlled the level of attenuation of the Buck converter accordingly, thus providing a stable transmission voltage. The inversion circuitry would then take the transmitted voltage level, and would generate three sinusoidal waveforms at the expected frequency and with the expected phase shifting as well. Limitations in the individual components, however, altered the functionality of model as a whole. As was just stated, it can be shown that every component worked properly, but would not work properly together. The greatest limitation that could be found was within the turbine. The way the turbine was constructed created a large internal impedance, which in turn would limit the amount of

23
current that could be generated from it. The voltage levels that were generated were easily usable, however the high internal impedance would overpower the external impedance of the rest of the circuitry, and thus the current provided to it would not be enough to overcome the non-idealities of that external circuitry. The non-idealities of the external circuitry also led to many losses not accounted for through theory or simulation. Most notably in this were the inductors that were used. In order to properly ensure the Buck converter worked as it should, as well as create a corner frequency in the LC low pass of the inverting circuit, the inductors that were used needed to be a large value. Due to limitations of availability, the inductors also had a large DC resistance. The large DC resistance of the inductors, as well as losses to properly bias the diodes in order for them to conduct added to unexpected losses, and created an even larger strain on the turbine. For this reason, we were not able to transmit the generated voltage across to the inverter circuitry. The large number of inductors created too much of a loss in order to operate. The turbine could not generate enough power to overcome this, and thus the model was unusable as one complete system. Instead a separate voltage source was used to supply the inversion circuit with an input, matching what the turbine would be transmitting but able to provide a larger current to overcome any biasing and losses encountered. Finally, since the turbine was generating an AC waveform, there was not a well defined ground potential within the system. This made it difficult to accurately measure various voltage levels throughout any of the circuitry. This was most notably prevalent for the input signal to the Arduino. The formula used to calculate the proper duty ratio relied on the input voltage level to be within 0 to 5 volts of the Arduino's own ground potential. This meant that the Arduino had to be bound in some way to the same ground potential as the generated voltage was. To do this, a DC power supply was used to take the Buck converter ground, and generate a voltage higher than that to power the Arduino. In this way, the Arduino was then grounded to the same voltage as the rectified voltage, and a more proper reading could be made. Creating a common ground potential was a problem throughout the circuitry though, and was even created by trying to use the same ground reference across two different oscilloscopes. When both oscilloscopes were measuring with the ground wire attached, the readings from each one would be altered, thus creating great difficulty to ensure proper function across even short distances. Given the chance to create this project over again, there are a few key points that would be changed. Firstly, the turbine used proved to be the greatest source of non-ideal function. The internal impedance of it was too large, and as such it was not able to provide the power needed to properly operate the circuitry as expected. A more efficient turbine would be needed to effectively create a working model. Second, the components that were found to have high losses would also be replaced to improve efficiency. The inductors were easily the source of greatest loss, and could be replaced with ones that did not have as high of an internal DC resistance. Replacing the inductors alone would greatly reduce the losses seen. Likewise, the diodes used were of average quality due to high availability. Replacing the diodes with higher efficiency ones would reduce the voltage level requirements of the system, and thus reduce the overall losses seen. Third, the capacitor banks used for the inversion could also be improved. Due to the function of the capacitors, electrolytic capacitors could not be used. This required a large number of capacitors to achieve a capacitance level large enough to create the correct corner frequency of the LC low passing. More specialized capacitors would be able to give us the value that would create a proper corner frequency. Lastly, better electrical isolation throughout the circuit would aid in creating precise measurements. The Arduino in particular relies on a precise voltage

24
measurement, and by having irregular ground potentials throughout the circuitry, those readings could be thrown off. Power is all around us, and the systems that generate, control, transmit, and distribute that power will continuously be changing as the world's power use continues to grow power all the time. Understanding the systems used to create this infrastructure now can help to continue the improvement needed to provide to that power use. The small signal model designed in this project has provided a deeper understanding of all the challenges needed to overcome as well as provided insight as how to improve upon the design.

25
VII. References
[1] Rutledge, Amy. "Minnesota Power reaches milestone in renewable energy efforts with purchase of interstate transmission line." Minnesota Power. Company Newsletter (January, 2010). [2] Okba, M.H.; Saied, M.H.; Mostafa, M. Z.; Abdel- Moneim T. M. "High voltage direct current transmission - A review, part I," Energytech, 2012 IEEE, pp. 1,7, 29-31 Apr 2012. [3] UTPQD. "High-Voltage DC: An electric transmission alternative." Webberenergyblog. [On-line]. [Apr. 21, 2013]. [4] Baljit Singh and Sharma Gagandeep. (2012). "Power upgrading of Transmission Line by converting EHVAC into EHVDC." International Journal for Science and Emerging Technologies with Latest Trends. [On-line]. 4(1): pp. 20-24. [Apr 21, 2013]. [5] Andersen, B.R. "HVDC transmission-opportunities and challenges." AC and DC Power Transmission, 2006. ACDC 2006. The 8th IEE International Conference, pp.24,29, 28-31 March 2006. [6] "Thyristor Theory and Design Considerations." ON Semiconductor. Handbook (2005). [7] Ham, N.J. "Thyristors and Triacs - Ten Golden Rules for Success in Your Application." NXP Semiconductors. Application Note. [8] Miaosen Shen and Fang Zheng Peng, "Converter systems for hybrid electric vehicles," Electrical Machines and Systems, 2007. ICEMS. International Conference, pp. 2004-2010, 8-11 Oct. 2007. [9] Krishnavedala. "3 phase rectification." Wikipedia. Image (June 2011). [10] Hamerly, Ryan. (2010, Oct.) "Direct Current Transmission Lines." Stanford University. [On-line]. [Apr. 20, 2012]. [11] Bailey, William H.; Weil, Deborah E.; Stewart, James R. "HVDC Power Transmission Environmental Issues Review." Oak Ridge National Laboratory. May 1997.