low voltage ac/dc power supply - dto. de fisica | · pdf file ·...
TRANSCRIPT

© 1996 PASCO scientific $5.00
012-06263A
10/96
LOW VOLTAGE AC/DCPOWER SUPPLY
Instruction Manualfor the PASCO scientificModel SF-9584A
better
teach science
ways to
Phone (916) 786-3800 • FAX (916) 786-8905 • email: [email protected]
10101 Foothills Blvd. • P.O. Box 619011 • Roseville, CA 95678-9011 USA
LOW VOLTAGE AC/DC POWER SUPPLY ¨
6 A
10 A
12 V 24 V
0 – 24 V
DC
AC
24
6
V A
2-24 V6 A MAX
RESET
ONVOLTAGE ADJUST
SF-9584A
–
OFF
8
1012 14
16
18
20
2224
CURRENT ADJUST
+
MAX DC CURRRENT

The lightning flash with arrowhead, withinan equilateral triangle, is intended to alertthe user of the presence of uninsulated“dangerous voltage” within the product’senclosure that may be of sufficient magni-tude to constitute a risk of electric shockto persons.
The exclamation point within an equilat-eral triangle is intended to alert the userof the presence of important operatingand maintenance (servicing) instruc-tions in the literature accompanying theappliance.
CAUTIONRISK OF ELECTRIC SHOCK
DO NOT OPEN
CAUTION
TO PREVENT THE RISK OF ELECTRIC SHOCK, DO NOTREMOVE COVER ON UNIT. NO USER SERVICEABLEPARTS INSIDE. REFER SERVICING TO QUALIFIEDSERVICE PERSONNEL.
i
012-06263A Low Voltage AC/DC Power Supply
Table of Contents
Section Page
Copyright, Warranty, and Equipment Return...................................................... ii
Introduction....................................................................................................... 1
Operation....................................................................................................... 1 - 2
Equipment Specifications................................................................................... 3
Schematics and Parts Lists............................................................................. 5 - 12
Technical Support...................................................................................Back Cover

ii
Low Voltage AC/DC Power Supply 012-06263A
Equipment Return
Should the product have to be returned to PASCOscientific, for whatever reason, notify PASCO scientificby letter or phone BEFORE returning the product. Uponnotification, the return authorization and shipping instruc-tions will be promptly issued.
ä NOTE: NO EQUIPMENT WILL BEACCEPTED FOR RETURN WITHOUT ANAUTHORIZATION.
When returning equipment for repair, the units mustbe packed properly. Carriers will not accept responsi-bility for damage caused by improper packing. To becertain the unit will not be damaged in shipment,observe the following rules:
➀ The carton must be strong enough for the itemshipped.
➁ Make certain there is at least two inches of packingmaterial between any point on the apparatus and theinside walls of the carton.
➂ Make certain that the packing material can notshift in the box, or become compressed, thus lettingthe instrument come in contact with the edge of thebox.
Address: PASCO scientific
10101 Foothills Blvd.
P.O. Box 619011Roseville, CA 95678-9011
Phone: (916) 786-3800
FAX: (916) 786-8905
email: [email protected]
Copyright Notice
The PASCO scientific 012-06263A manual is copy-righted and all rights reserved. However, permissionis granted to non-profit educational institutions forreproduction of any part of the Low Voltage AC/DCPower Supply manual providing the reproductions areused only for their laboratories and are not sold forprofit. Reproduction under any other circumstances,without the written consent of PASCO scientific, isprohibited.
Limited Warranty
PASCO scientific warrants the product to be free fromdefects in materials and workmanship for a period of oneyear from the date of shipment to the customer. PASCOwill repair or replace, at its option, any part of the productwhich is deemed to be defective in material or workman-ship. The warranty does not cover damage to theproduct caused by abuse or improper use. Determina-tion of whether a product failure is the result of amanufacturing defect or improper use by the customershall be made solely by PASCO scientific. Responsi-bility for the return of equipment for warranty repairbelongs to the customer. Equipment must be properlypacked to prevent damage and shipped postage orfreight prepaid. (Damage caused by improper packingof the equipment for return shipment will not becovered by the warranty.) Shipping costs for returningthe equipment, after repair, will be paid by PASCOscientific.
Copyright, Warranty and Equipment Return
Please—Feel free to duplicate this manualsubject to the copyright restrictions below.
CreditsAuthor: Hans FrederiksenEditor: Sunny Bishop
012-06263A Low Voltage AC/DC Power Supply
1
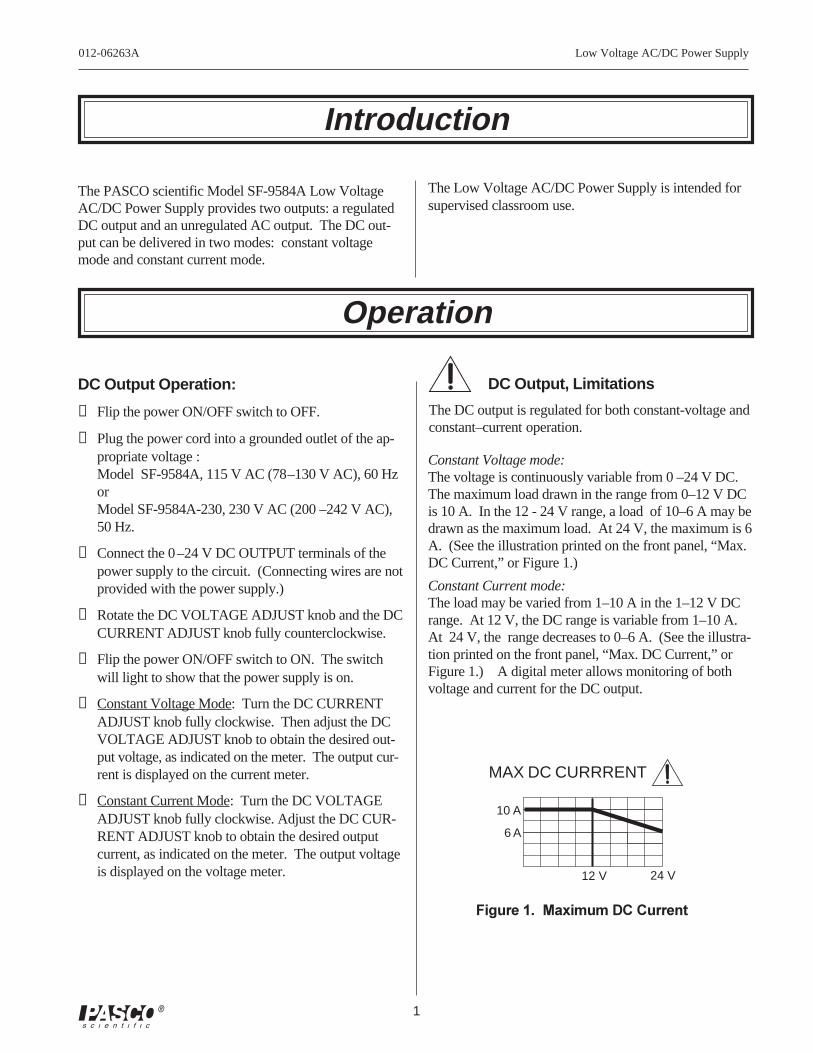
The PASCO scientific Model SF-9584A Low VoltageAC/DC Power Supply provides two outputs: a regulatedDC output and an unregulated AC output. The DC out-put can be delivered in two modes: constant voltagemode and constant current mode.
Introduction
Operation
DC Output Operation:
➀ Flip the power ON/OFF switch to OFF.
➁ Plug the power cord into a grounded outlet of the ap-propriate voltage :Model SF-9584A, 115 V AC (78–130 V AC), 60 HzorModel SF-9584A-230, 230 V AC (200 –242 V AC),50 Hz.
➂ Connect the 0–24 V DC OUTPUT terminals of thepower supply to the circuit. (Connecting wires are notprovided with the power supply.)
➃ Rotate the DC VOLTAGE ADJUST knob and the DCCURRENT ADJUST knob fully counterclockwise.
➄ Flip the power ON/OFF switch to ON. The switchwill light to show that the power supply is on.
➅ Constant Voltage Mode: Turn the DC CURRENTADJUST knob fully clockwise. Then adjust the DCVOLTAGE ADJUST knob to obtain the desired out-put voltage, as indicated on the meter. The output cur-rent is displayed on the current meter.
➆ Constant Current Mode: Turn the DC VOLTAGEADJUST knob fully clockwise. Adjust the DC CUR-RENT ADJUST knob to obtain the desired outputcurrent, as indicated on the meter. The output voltageis displayed on the voltage meter.
Figure 1. Maximum DC Current
6 A
10 A
12 V 24 V
MAX DC CURRRENT
The Low Voltage AC/DC Power Supply is intended forsupervised classroom use.
DC Output, Limitations
The DC output is regulated for both constant-voltage andconstant–current operation.
Constant Voltage mode:The voltage is continuously variable from 0 –24 V DC.The maximum load drawn in the range from 0–12 V DCis 10 A. In the 12 - 24 V range, a load of 10–6 A may bedrawn as the maximum load. At 24 V, the maximum is 6A. (See the illustration printed on the front panel, “Max.DC Current,” or Figure 1.)
Constant Current mode:The load may be varied from 1–10 A in the 1–12 V DCrange. At 12 V, the DC range is variable from 1–10 A.At 24 V, the range decreases to 0–6 A. (See the illustra-tion printed on the front panel, “Max. DC Current,” orFigure 1.) A digital meter allows monitoring of bothvoltage and current for the DC output.

2
Low Voltage AC/DC Power Supply 012-06263A
ä NOTE: If at any time the power supply fails tocome on, or if it shuts down during operation due toexcessive current, check the following: If theON/OFF switch does not light when unit is pluggedinto the appropriate power source and the switch isturned ON, check the fuse on the back of the unit.If it is blown, replace it only with a similarly ratedfuse (Model SF-9584A— 8A Slo-Blo fuse, ModelSF-9584A-230— 4A Slo-Blo fuse).
AC Output Operation:
➀ Flip the power ON/OFF switch to OFF.
➁ Plug the power cord into a grounded outlet of the ap-propriate voltage :Model SF-9584A, 115 V AC (78 - 130 V AC), 60 HzorModel SF-9584A-230, 230 V AC (200 - 242 V AC),50 Hz.
➂ Connect the 2–24 V AC OUTPUT terminals of thepower supply to the circuit. (Connecting wires are notprovided with the power supply.)
➃ Rotate the AC VOLTAGE ADJUST knob to the2–V position.
➄ Flip the power ON/OFF switch to ON. The switchwill light to show that the power supply is on.
➅ Set the AC VOLTAGE ADJUST knob to the desiredsetting.
AC Output Limitations
The AC output is unregulated and is adjustable in 2-Vincrements from 2 to 24 V AC, with a maximum out-put current of 6 amperes. This output is protected bya 6-amp circuit breaker. If the maximum current out-put is exceeded, the circuit breaker button below thepower switch will pop out. (See Figure 2.)
The circuit breaker can be reset by simply pushing thebutton back in. It may be necessary to reduce the ACoutput voltage or the load connected to the AC output inorder to resume operation.
Figure 2. Location of Circuit Breaker Button
AC
24
6
2-24 V6 A MAX
RESET
ON
OFF
8
1012 14
16
18
20
2224
power switch
circuit breakerbutton

012-06263A Low Voltage AC/DC Power Supply
3
Specifications:Outputs:
DC: regulated for both constant–voltage and con-stant–current operation. Both current and voltage con-tinuously variable over the range 0–24 V DC and 0–10amperes maximum. Independent floating ground refer-ence.
AC: 2 to 24 V (rms) AC, unregulated, selectable in2–V increments, current up to 6 amperes. Output pro-tected from overload by a 6-amp thermally-activated cir-cuit breaker. Independent floating ground reference.
ä NOTE: Both DC and AC outputs are availablesimultaneously on separate floating output terminals.Either one of the DC output terminals can be con-nected to either one of the AC output terminals toform a composite signal without damage to the unit.
Equipment Specifications
Line Regulation:
Less than 1% change in DC output voltage or cur-rent for full range change in line voltage. AC out-put not regulated.
Load Regulations:
Better than 1% no-load to full-load on the DC out-put voltage or current. AC output not regulated.
Ripple and Noise:Less than 25 mV pp on DC output.
Metering:DC voltage and DC currentAccuracy is +1% ± 2 L.S.D.
Line Voltage Requirement:78–130 V AC, 60 Hz (model SF-9584A)200–242 V AC, 50 Hz (model SF-9584A - 230)
Power Requirement:DC and AC: Maximum 350 WDC only: Maximum 175 WAC only: Maximum 175 W
Fuse:8 A Slo-Blo—(model SF-9584A)
4 A Slo-Blo—(model SF-9584A-230)
Size:
118 x 298 x 229 mm (H x W x D including controls)

4
Low Voltage AC/DC Power Supply 012-06263A
Notes:

012-06263A Low Voltage AC/DC Power Supply
5
Schematics and Parts Lists
ä Caution: If repairs are needed, they should be performed only by experienced personnel.
Figure 2. Schematic Overview
6
Low Voltage AC/DC Power Supply 012-06263A
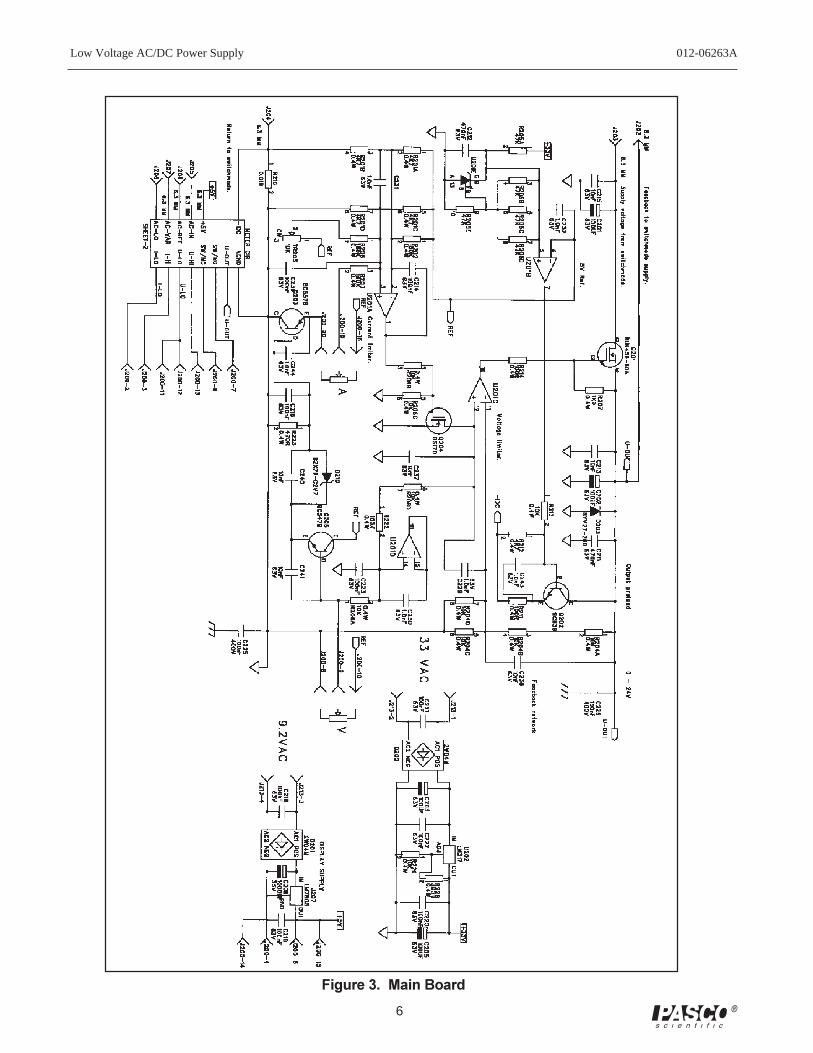
Figure 3. Main Board

012-06263A Low Voltage AC/DC Power Supply
7
Parts List – Main Board
1 R201 RESISTOR 4K7 250V 0.4W 1 6010742 R204R206 RESISTOR 10K 250V 0.4W 2 6010823 R220-221 RESISTOR 10K 250V 0.4W 2 6010834 R205 RESISTOR 47K 250V 0.4W 1 6010995 R216 R219 RESISTOR 100K 250V 0.4W 2 6011066 R211 R214 R217 RESISTOR 100R 250V 0.4W 3 60307017 R227 RESISTOR 150R 250V 0.4W 1 60308018 R228 RESISTOR 390R 250V 0.4W 1 60310519 R218 R223 RESISTOR 470R 250V 0.4W 2 603110110 R226 RESISTOR 680R 250V 0.4W 1 603120111 R207 R230 RESISTOR IK0 250V 0.4W 2 603130112 R212 RESISTOR 4K7 250V 0.4W 1 603170113 R213 R229 RESISTOR 10K 250V 0.4W 2 603190114 R222 RESISTOR 100K 250V 0.4W 1 603250115 R202-203 R208 RESISTOR 180K 250V 0.4W 3 603265116 R224 RESISTOR IM0 250V 0.4W 1 603310117 R210 R215 RESISTOR 0.01R 20mV 2W 2 60430118 TR201-202 TRIMPOT HORIZ 220R 250V 0.lW 2 60593519 TR203-205 TRIMPOT HORIZ 10K 250V 0.lW 3 60596020 C229-234 C243-244 CERAMIC CAP 1.0nF 63V 8 61189021 C213 C215 C235 CERAMIC CAP 10nF 63V 7 612010
C237-238 C240-24122 C224-227 STACK FOIL CAP 100nF 400V 4 61317023 C214 C216-223 STACK FOIL CAP 100nF 63V 11 613450
C228 C23924 C211-212 STACK FOIL CAP 470nF 63V 2 61353025 C207-210 C236 ELECTROLYT CAP 4.7UF 25V 5 61564326 C201-205 ELECTROLYT CAP 100UF 63V 5 61578527 C206 ELECTROLYT CAP 1000UF 35V 1 61600328 D203 DIODE BYV27-200 200V 2A 1 62326729 D205-209 DIODE lN4148 75V 0.2A 5 62330030 D201-202 DIODE 2W04M 400V 2A 2 62366531 D210 ZENER-DIODE BZX79-C2V7 2.7V 0.5W 1 62406032 Q205 NPN TRANSISTOR BC547B 50V 0.lA 1 62471033 Q203 PNP TRANSISTOR BC557B 50V 0.2A 1 62472034 Q202 NPN TRANSISTOR BC639 100V 1.5A 1 62475035 Q201 Nch MOSFET BUK456-60A 60V 52A 1 62569036 Q204 Nch MOSFET BS170 60V 0.5A 1 62612037 U204 DualOpAmp LTll12 30V 10mA 1 63021138 U201 IC LM614 36V 0.3mA 1 63121439 U202 VOLTAGE REGULATOR LM317 40V lA 1 63213040 U205 VOLTAGE REGULATOR LM78L05 35V 0.1A 1 63243041 U207 VOLTAGE REGULATOR LM7805 35V 1.5A 1 63253342 U206 RAIL SPLITTER TLE2426CLP 40V 0.08A 1 63494143 RE201-202 RELAY 5V M4-5H 125V/30W 1A 2 63742844 J202-208 CONNECTOR 6.3 MM 7 64124545 J200 3M-929 20 PIN 20 PIN 1 64132146 J213 STOCKO MKS4 4 PIN 1 641357
Item Reference Part Name Value Qty Stock No.
8
Low Voltage AC/DC Power Supply 012-06263A
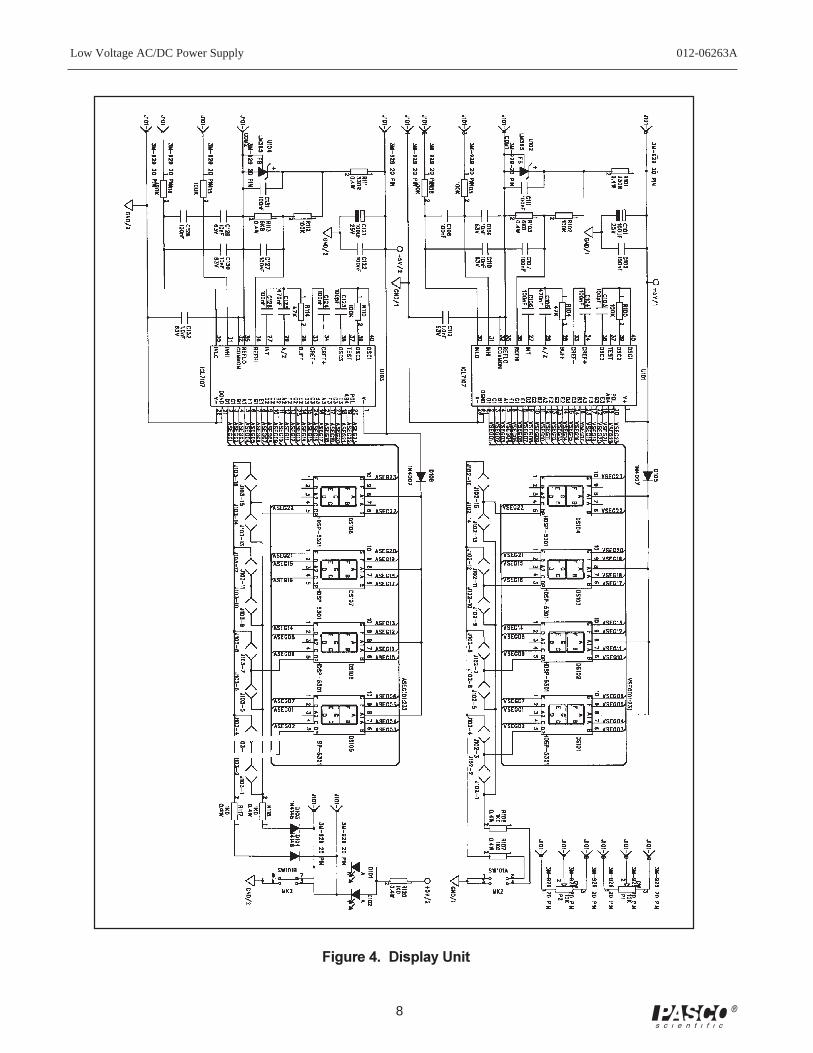
Figure 4. Display Unit
012-06263A Low Voltage AC/DC Power Supply
9
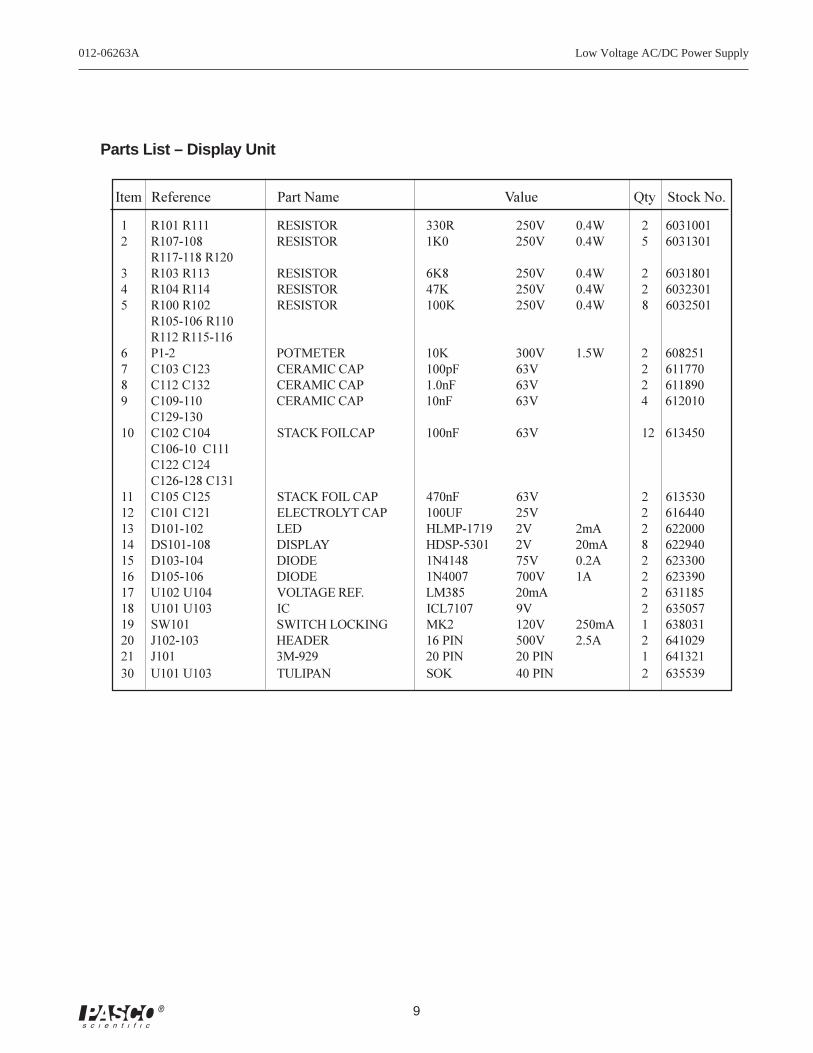
Item Reference Part Name Value Qty Stock No.
1 R101 R111 RESISTOR 330R 250V 0.4W 2 60310012 R107-108 RESISTOR 1K0 250V 0.4W 5 6031301
R117-118 R1203 R103 R113 RESISTOR 6K8 250V 0.4W 2 60318014 R104 R114 RESISTOR 47K 250V 0.4W 2 60323015 R100 R102 RESISTOR 100K 250V 0.4W 8 6032501
R105-106 R110R112 R115-116
6 P1-2 POTMETER 10K 300V 1.5W 2 6082517 C103 C123 CERAMIC CAP 100pF 63V 2 6117708 C112 C132 CERAMIC CAP 1.0nF 63V 2 6118909 C109-110 CERAMIC CAP 10nF 63V 4 612010
C129-13010 C102 C104 STACK FOILCAP 100nF 63V 12 613450
C106-10 C111C122 C124C126-128 C131
11 C105 C125 STACK FOIL CAP 470nF 63V 2 61353012 C101 C121 ELECTROLYT CAP 100UF 25V 2 61644013 D101-102 LED HLMP-1719 2V 2mA 2 62200014 DS101-108 DISPLAY HDSP-5301 2V 20mA 8 62294015 D103-104 DIODE 1N4148 75V 0.2A 2 62330016 D105-106 DIODE 1N4007 700V 1A 2 62339017 U102 U104 VOLTAGE REF. LM385 20mA 2 63118518 U101 U103 IC ICL7107 9V 2 63505719 SW101 SWITCH LOCKING MK2 120V 250mA 1 63803120 J102-103 HEADER 16 PIN 500V 2.5A 2 64102921 J101 3M-929 20 PIN 20 PIN 1 64132130 U101 U103 TULIPAN SOK 40 PIN 2 635539
Parts List – Display Unit

10
Low Voltage AC/DC Power Supply 012-06263A
Figure 5. Switch-Mode Regulator

012-06263A Low Voltage AC/DC Power Supply
11
Item Reference Part Name Value Qty Stock No.
1 R3 RESISTOR 2K2 250V 0.4W 1 6010662 Rl-2 RESISTOR 10K 250V 0.4W 2 6010833 R14 RESISTOR 0R 250V 0.4W 1 60209014 R10 R12 RESISTOR 10R 250V 0.4W 2 60301015 R9 RESISTOR 100R 250V 0.4W 1 60307016 R8 RESISTOR 470R 250V 0.4W 1 60311017 R5 RESISTOR 3K3 250V 0.4W 1 60316018 R7 RESISTOR 4K7 250V 0.4W 1 60317019 R4 R13 RESISTOR 47K 250V 0.4W 2 603230110 R6 RESISTOR IK0 500V 1.6W 1 60381011 Rll RESISTOR 0.01R 20mV 2W 1 60430112 CI2 C14 C19 CERAMIC CAP 1.0nF 63V 3 61189013 Cll CERAMIC CAP 4.7nF 63V 1 61197014 C7-8 C13 CERAMIC CAP 10nF 63V 3 61201015 C17-18 STACK FOIL CAP 100nF 400V 2 61317016 C2-4 C15 STACK FOIL CAP 470nF 63V 4 61353017 C9-10 ELECTROLYT CAP 2.2UF 63V 2 61562218 C5-6 C16 ELECTROLYT CAP 100UF 63V 3 61578519 Cl ELECTROLYT CAP 6800UF 63V 1 61610220 Dl DIODE BYV27-200 200V 2A 1 62326721 D2 ULTRA FAST DIODE BYV79-100 100V 14A 1 62326822 D4-7 DIODE lN4007 700V lA 4 62339023 D10 DIODE BRIDGE PBU802 100V 8A 1 62368524 D9 ZENER-DIODE BZV85-C15 15V 1.0W 1 62451525 D8 ZENER-DIODE BZV85-C33 33V 1.0W 1 62453326 Q2-3 NPN TRANSISTOR BC639 100V 1.5A 2 62475027 Ql Pch MOSFET SMP40P06 60V 40A 1 62611028 Ul IC LM3524 40V 1 632350
Parts List – Switch-Mode Regulator
12
Low Voltage AC/DC Power Supply 012-06263A
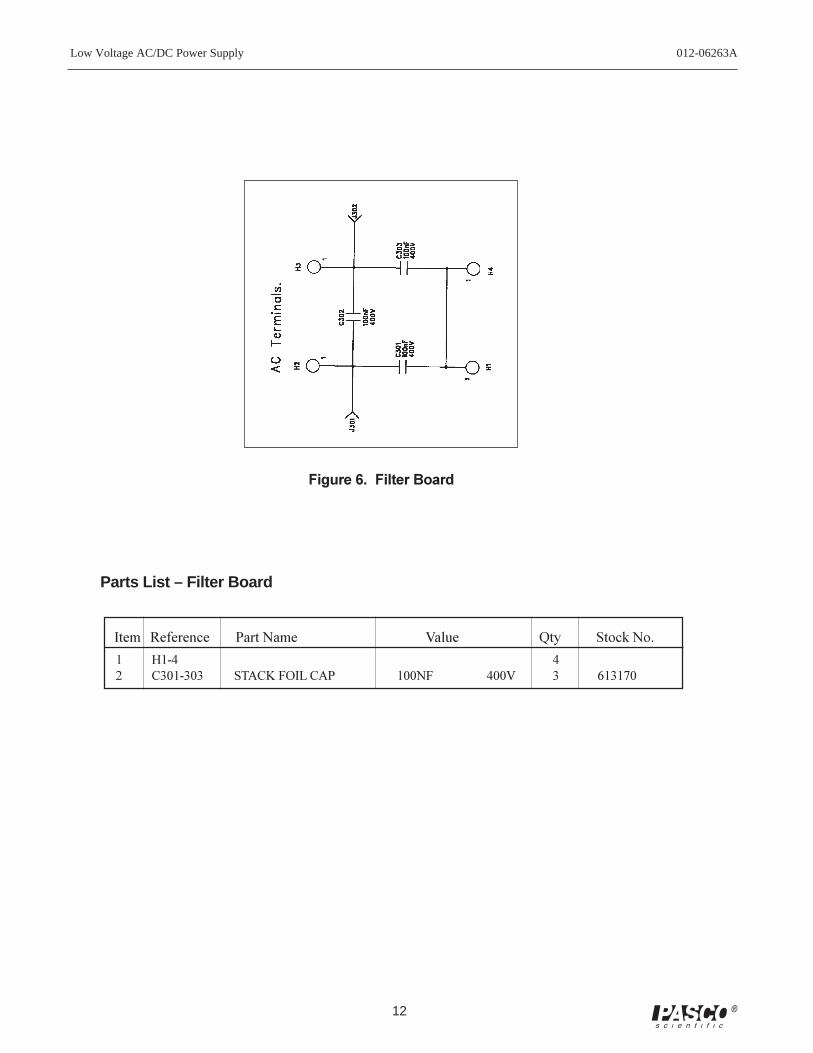
Figure 6. Filter Board
Parts List – Filter Board
Item Reference Part Name Value Qty Stock No.
1 H1-4 42 C301-303 STACK FOIL CAP 100NF 400V 3 613170

012-06263A Low Voltage AC/DC Power Supply
13
Technical Support
Feedback
If you have any comments about the product or manual,please let us know. If you have any suggestions on alter-nate experiments or find a problem in the manual, pleasetell us. PASCO appreciates any customer feedback.Your input helps us evaluate and improve our product.
To Reach PASCO
For technical support, call us at 1-800-772-8700 (toll-freewithin the U.S.) or (916) 786-3800.
fax: (916) 786-3292
e-mail: [email protected]
web: www.pasco.com
Contacting Technical Support
Before you call the PASCO Technical Support staff, itwould be helpful to prepare the following information:
If your problem is computer/software related, note:
Title and revision date of software;
Type of computer (make, model, speed);
Type of external cables/peripherals.
If your problem is with the PASCO apparatus, note:
Title and model number (usually listed on the label);
Approximate age of apparatus;
A detailed description of the problem/sequence ofevents. (In case you can’t call PASCO right away,you won’t lose valuable data.);
If possible, have the apparatus within reach whencalling to facilitate description of individual parts.
If your problem relates to the instruction manual, note:
Part number and revision (listed by month and yearon the front cover);
Have the manual at hand to discuss your questions.


Instruction Sheetfor the PASCOModel CI-6552A
POWER AMPLIFIER II
012-05783A2/95$1.00
Phone (916) 786-3800 • FAX (916) 786-8905 • email: [email protected]
10101 Foothills Blvd. • P.O. Box 619011 • Roseville, CA 95678-9011 USA
better
teach physics
ways to
POWER AMPLIFIER IICI-6552A
CAUTION!
CI-6552A
POWER AMPLIFIER II
ONCAUTION!
SIGNAL OUTPUT
0 to ±10 V
1 A MAX
WHEN LIGHT IS ON
WAVEFORM IS DISTORTED.
DECREASE AMPLITUDE!
© 1995 PASCO scientific
This instruction edited by Robert Morrison
Introduction
The PASCO CI-6552A Power Amplifier II is an acces-sory to the PASCO Signal Interfaces, Series 6500 andMac65. It amplifies the output of the computer, allowingit to be used as a controlled DC power source or an ACfunction generator.
With the Power Amplifier II plugged into one of the ana-log channels of the Signal Interface, the appropriate soft-ware (Power Amplifier for DOS, Power Amplifier forAPPLE II, or Science Workshop) can be used to generatethe following types of waves (up to ±10V peak at 1A, upto 5,000 Hz):
• sine,
• square,
• triangle, and
• sawtooth.
This means the computer can now be used as an AC sig-nal generator to power external circuits while it monitorsits own output current as well as other inputs. The ScienceWorkshop software can also generate a DC output.
Filter Select Switch
The CI-6552A Power Amplifier II has a filter selectswitch which is preset for use with the CI-6560 SignalInterface II (Mac65). The bandwidth at that switch posi-tion is about 100KHz, limited by the power amplifier’sfeedback compensation section and the load. When usingthe Power Amplifier II with the CI-6510 Signal Interface(Series 6500), the bandwidth needs to be limited to1.5KHz. To change the switch position push the filter se-lect switch in the back panel slot to the left, as shown inthe illustration below.
Switch positionfor CI-6510
Signal Interface
Switch positionfor CI-6560
Signal Interface II

2
Power Amplifier II 012-05783A
Using Power Amplifier II
To install the Power Amplifier II, plug in its power cordand plug the DIN plug into Channel A, B, or C of the ap-propriate PASCO Signal Interface box (CI-6510 orCI-6560).
NOTE: Using Power Amplifier II with Series6500, the Power Amplifier program is calibrated forchannel C. The Power Amplifier II can also beplugged into Channel A or B but these channels arenot automatically calibrated to read the current as isChannel C.
To use the output of the Power Amplifier II, connect theload to the banana jacks on the front of the Power Ampli-fier II. There is a power switch on the back left hand cor-ner of the Power Amplifier II.
WARNING! Do not turn on the power switchuntil a program (either Power Amplifier, DataMonitor or Science Workshop) has been run and thedesired output voltage has been selected.
When the computer is in DOS, the Power Amplifierwill output 10 Volts if the power switch is on andthis could overload a circuit that might be con-nected to it. The software controls this voltage:The Data Monitor Program sets the default voltageto zero and the Power Amplifier Program sets thedefault AC peak voltage to 5 Volts.
When the Power Amplifier II is operating, a green powerindicator light on the front panel of the Power AmplifierII will be lit. There is also a red current overload lightwhich comes on whenever the maximum current of 1 A isexceeded. If this warning light is on, the waveform is dis-torted and you should reduce the output voltage.
Limited Warranty
PASCO scientific warrants this product to be free fromdefects in materials and workmanship for a period of oneyear from the date of shipment to the customer. PASCOwill repair or replace, at its option, any part of the productwhich is deemed to be defective in material or workman-ship. This warranty does not cover damage to the productcaused by abuse or improper use. Determination ofwhether a product failure is the result of a manufacturingdefect or improper use by the customer shall be madesolely by PASCO scientific. Responsibility for the returnof equipment for warranty repair belongs to the customer.
Equipment must be properly packed to prevent damageand shipped postage or freight prepaid. (Damage causedby improper packing of the equipment for return ship-ment will not be covered by the warranty.) Shipping costsfor returning the equipment, after repair, will be paid byPASCO scientific.
Equipment Return
Should this product have to be returned to PASCO scien-tific, for whatever reason, notify PASCO scientific by let-ter or telephone BEFORE returning the product. Uponnotification, the return authorization and shipping instruc-tions will be promptly issued.
NOTE: NO EQUIPMENT WILL BE AC-CEPTED FOR RETURN WITHOUT AN AU-THORIZATION.
CAUTIONRISK OF ELECTRIC SHOCK
DO NOT OPEN
CAUTION:TO PREVENT THE RISK OF ELECTRIC SHOCK, DONOT REMOVE COVER ON UNIT. NO USER SERVICE-ABLE PARTS INSIDE. REFER SERVICING TO QUALI-FIED SERVICE PERSONNEL.
The lightning flash with arrowhead, withinan equilateral triangle, is intended to alertthe user of the presence of uninsulated“dangerous voltage” within the product’senclosure that may be of sufficient magni-tude to constitute a risk of electric shock topersons.
The exclamation point within an equi-lateral triangle is intended to alert theuser of the presence of important oper-ating and maintenance (servicing) in-structions in the literature accompany-ing the appliance.

Instruction Manual andExperiment Guide forthe PASCO scientificModel ES-9054B
012-03175E3/93
© 1987 PASCO scientific $7.50
ELECTROMETER
scientific
OUTPUT GND INPUT
Model ES-9054B ELECTROMETER
PUSHTO
ZERO
POWEROFF ON
FUNCTION
3
10
30
100
B1 B2
ZERO ADJUST
DC
VOLTS
ZEROLOCK

012-03175E Electrometer
i
Table of Contents
Section Page
Copyright and Warranty.................................................................................. ii
Equipment Return ........................................................................................... ii
Introduction ..................................................................................................... 1
Operation ......................................................................................................... 1
Setup .......................................................................................................... 2
Measuring Charge ..................................................................................... 3
Measuring Voltage .................................................................................... 4
Measuring Current .................................................................................... 4
Using a Projection Meter .......................................................................... 5
Maintenace ...................................................................................................... 5
Battery Installation.................................................................................... 6
MOS-FET Replacement ............................................................................ 6
Schematic........................................................................................................ 7
Parts List .......................................................................................................... 8
Technical Support ............................................................... Inside Back Cover
Electrometer 012-03175E
Copyright Notice
The PASCO scientific 012-0xxxy Model Name manualis copyrighted and all rights reserved. However,permission is granted to non-profit educational institu-tions for reproduction of any part of the manualproviding the reproductions are used only for theirlaboratories and are not sold for profit. Reproductionunder any other circumstances, without the writtenconsent of PASCO scientific, is prohibited.
Limited Warranty
PASCO scientific warrants the product to be free fromdefects in materials and workmanship for a period ofone year from the date of shipment to the customer.PASCO will repair or replace at its option any part ofthe product which is deemed to be defective in materialor workmanship. The warranty does not cover damageto the product caused by abuse or improper use.Determination of whether a product failure is the resultof a manufacturing defect or improper use by thecustomer shall be made solely by PASCO scientific.Responsibility for the return of equipment for warrantyrepair belongs to the customer. Equipment must beproperly packed to prevent damage and shippedpostage or freight prepaid. (Damage caused by im-proper packing of the equipment for return shipmentwill not be covered by the warranty.) Shipping costsfor returning the equipment after repair will be paid byPASCO scientific.
Copyright, Warranty, and Equipment Return
Please—Feel free to duplicate this manualsubject to the copyright restrictions below.
ii
Equipment Return
Should the product have to be returned to PASCOscientific for any reason, notify PASCO scientific byletter, phone, or fax BEFORE returning the product.Upon notification, the return authorization and ship-ping instructions will be promptly issued.
ä NOTE: NO EQUIPMENT WILL BEACCEPTED FOR RETURN WITHOUT ANAUTHORIZATION FROM PASCO.
When returning equipment for repair, the units must bepacked properly. Carriers will not accept responsibilityfor damage caused by improper packing. To be certainthe unit will not be damaged in shipment, observe thefollowing rules:
➀ The packing carton must be strong enough for theitem shipped.
➁ Make certain there are at least two inches of pack-ing material between any point on the apparatus andthe inside walls of the carton.
➂ Make certain that the packing material cannot shiftin the box or become compressed, allowing theinstrument come in contact with the packing carton.
Address: PASCO scientific
10101 Foothills Blvd.
Roseville, CA 95747-7100
Phone: (916) 786-3800
FAX: (916) 786-3292email: [email protected]
web: www.pasco.com

012-03175E
1
The Model ES-9054B Electrometer is an infiniteimpedance (1014 ý) voltmeter that can be used fordirect measurements of voltage, and indirect measure-ments of current and charge. Because of its highimpedance, it is especially suited for measuring chargein electrostatic experiments. It has a sensitivity nearly1,000 times that of a standard, gold-leaf electroscope,it has a center-zero meter that directly indicates chargepolarity, and it measures charges as low as 10-11
coulombs.
With these features, you’ll find that your electrostaticsdemonstrations and labs are easier to perform and, withquantitative data, are more informative as well.
The electrometer is battery powered by two 9 voltbatteries, and comes complete with the batteries and ashielded test lead. Instructions for inserting thebatteries are at the end of this manual.
Introduction
The controls on the front panel of the electrometer areexplained in Figure 1. Whether you’re using theelectrometer to measure voltage, current, or charge, thefollowing procedure should be followed each time youturn on the electrometer. More information on makingaccurate measurements is given in the sections thatfollow.
Operation
äIMPORTANT:① Never use the Electrometer for measuringpotentials in excess of 100 volts.
② Never connect the electrometer to an electro-static generator such as a Van de Graff generatoror a Wimshurst machine.
③ Never touch the input leads until you havegrounded yourself to an earth ground. A personwalking across a rug on a cool, dry day can easilypick up a potential of several thousand volts.

012-03175E
2
charge or voltage. Set the FUNCTION switch to thedesired voltage range. The range setting refers to thevoltage input required to produce a full-scale meterdeflection (e.g., a setting of 30 means that a full scalemeter deflection indicates a voltage of 30 volts).
scientific
OUTPUT GND INPUT
Model ES-9054B ELECTROMETER
PUSHTO
ZERO
POWEROFF ON
FUNCTION
3
10
30
100
B1 B2
ZERO ADJUST
DC
VOLTS
ZEROLOCK
Mechanical zero adjust screw(adjust with power off) Select voltage range
(3, 10, 30, or 100volts full scale) or
test batteries(B1 and B2)
0-3.6 volts for drivinga projection meter
Setup① Before turning on the electrometer, check that the
meter reads zero. If not, turn the Mechanical ZeroAdjust screw, located just below the meter face, un-til it does.
② Slide the POWER switch to the ON position.
③ Check the batteries:
a. Turn the FUNCTION switch to B1. The meterpointer should read to the left of the B1 line atthe bottom of the meter face. If the pointer fallswithin the area labeled B1, see the battery re-placement section at the end of this manual.
b. Turn the FUNCTION switch to B2. The meterpointer should read to the right of the B2 line atthe bottom of the meter face. If the pointer fallswithin the area labeled B2, see the battery re-placement section at the end of this manual.
④ Zero the meter:
a. Turn the FUNCTION switch to 3.
b. Turn the Zero Switch to the ZERO LOCK set-ting.
c. Adjust the ZERO ADJUST knob so the meterreads zero volts.
⑤ Turn the Zero Switch to the PUSH TO ZERO set-ting.
⑥ Connect the test lead to the INPUT connector of theelectrometer.
⑦ Connect the GND post of the electrometer to anearth ground.
You’re now ready to use the electrometer to measure
ä Important Points for General Operation:① Between measurements, always press the ZeroSwitch to discharge all current from the electrom-eter. (The Zero Switch must be in the PUSH TOZERO setting.) Shorting the test leads together isinsufficient. There may still be stray chargeswithin the electrometer circuitry.② When adjusting the zero point of the electrom-eter, always turn the Zero Switch to the ZEROLOCK position.③ For good results, it is essential that the elec-trometer be connected to an earth ground (a waterpipe or the ground wire from a 120 VAC socket).Only an earth ground provides a sufficient drainfor excess charges that may build up during anexperiment. It is also helpful if the experimenter isgrounded. Just touch one hand to a good earthground while, or just before, making measurements.
Figure 1 Front Panel Controls
Zero Switch: In PUSH TO ZEROsetting, pushing knob willdischarge the electrometer
Zero meter (zeroswitch should be inZERO LOCK position)
Connect test lead hereConnect to earth ground

012-03175E
3
Measuring Charge
Charge measurement with the electrometer is indirect,but simple. It is based on the relationship Q = CV,whereQ and V are the charge and voltage across a capacitorand C is the capacitance. The electrometer can bethought of as an infinite impedance voltmeter inparallel with a capacitor, as shown in Figure 2. Thecapacitor represents the internal capacitance of the
electrometer, plus the capacitance of the leads.
When a charge is placed across the Electrometer leads,a voltage V will read on the meter. If the value C isknown, the value of the charge can be calculated asQ = CV. However, when you touch the Electrometerleads to another object to test a charge, the capacitancemay change. If the object adds significant capacitance,the situation becomes as shown in Figure 3. The newcapacitance (C + C
ext) must be determined to accurately
calculate the charge from the measured voltage.
Measuring Charge by InductionUnder most conditions, the best way to measure chargeis by induction, using a proof plane and a Faraday icepail such as those included with PASCO’s Demonstra-tion Electrostatics System. The proof plane is simply asmall conductive disk on an insulating handle. Youcan make your own ice pail by mounting a conductivecylinder on an insulating support, and placing a largerconductive cylinder around it as a shield. Connect thetest lead of the electrometer probe to the inside cylin-der, and connect the ground lead to the outside cylinder(see Figure 4).
Volt-meter V
–Q
QC
Internal Capacitance ofElectrometer
(30-35 pf without TestProbe; approximately
150 pf with Test Probe)
Q = CV
V
Q
–Q
Q'
–Q'
CextCVolt-meter
Capacitance of objectconnected to the
Electrometer
Figure 3 Change in Capacitance Due toCharged Object
Q + Q' = (C + Cext) V
Figure 4 Using a Faraday Ice Pail
To sample the charge distribution on a charged object,simply touch it with the proof plane, then place theproof plane inside the inner cylinder of the ice pail,without touching the cylinder. A charge is induced onthe inside cylinder that is equal but opposite to that onthe proof plane. You can now read the voltage on theelectrometer. By always using the proof plane and theice pail, the capacitance will be the same for all yourmeasurements and the charge on the proof plane willalways be proportional to the voltage reading of theelectrometer. However, in experiments for which youwant to know the absolute charge on the proof plane,you need to know the total capacitance of the electrom-eter, plus the test probe, plus the ice pail with the proofplane inside it. Fortunately, this is easily measured, asdescribed below. Once you know the capacitance,you can calculate the absolute charge for any measure-ment as Q = CV.
Figure 2 Ideal Schematic of the Electrometer
Test leadElectrometer
Ground lead
Faraday ice pail
Proof Plane

012-03175E
4
To measure the total capacitance:
① Turn on the Electrometer and zero the meter. Clipthe test lead of the probe to the inside cylinder ofyour ice pail and the ground lead to the outside cyl-inder (see Figure 4).
② Use a DC power supply or a statically charged ob-ject to charge your proof plane.
③ Place the proof plane inside the inner cylinder of theice pail and adjust the FUNCTION switch to get ameter reading near full scale. (For convenience, youmay want to touch the proof plane to the inside ofthe ice pail and then remove the proof plane. Theeffect on the voltage reading should be negligible.)Record the voltage as V
e. Do not discharge the
Electrometer.
④ Take a capacitor of known capacitance, Ck. Ground
the leads of the capacitor to be sure it is fully dis-charged, then connect the capacitor between the in-ner and outer cylinder of the ice pail. With theproof plane still inside the ice pail, record the meterreading as V
k.
⑤ The capacitance of the Electrometer, Ce, can now be
calculated as:C
e = C
kV
k/(V
e -V
k).
ä EXPLANATION: This measurement isshown schematically in Figure 3. First theElectometer is charged with an unknown chargeQ, that must satisfy the equation Q = C
eV
e, where
Ce is the total capacitance of the system and V
e is
the Electrometer reading. Then the secondcapacitor is connected in parallel with the capaci-tance of the Electrometer. The total capacitanceis now C
e + C
k. The charge Q has not changed,
but now satisfies the equation Q =(C
e + C
k)V
k, where V
k is the new Electrometer
reading. Combining the two equations gives, C
eV
e = (C
e + C
k)V
k, or C
e = C
kV
k/(V
e -V
k).
If you want to use the Electrometer with a different setof test leads, or a different ice pail, or even a differentproof plane, the capacitance may be different, and youwill need to repeat the above procedure to measure thenew capacitance.
ä NOTE: The capacitance of the Electrometeris 30-35 pf. With the test probe, the total capaci-tance is approximately 150 pf. For best results,measure the total capacitance.
Measuring Charge by Contact
Charges can also be measured by contact. You’ll find, forexample, that if you touch the charged proof plane to the
inside cylinder of the ice pail, the Electrometer reading willgenerally remain relatively unchanged. This is because thetotal capacitance is only negligibly affected by the proofplane. This may not always be the case, however.
In general, contact measurements can be carried out inmuch the same way as inductive measurements usingthe ice pail. Touch the object with the test probe,record the voltage V, and use Q = CV to calculate thecharge. However, if you suspect the object for whichyou are measuring the charge appreciably affects thetotal capacitance of the system, you will need toremeasure the capacitance as described above.
Measuring Voltage
Voltage can be measured as with any voltmeter.Connect the leads to the circuit, set the range (3, 10,30, or 100 volts full scale), and read the voltage on themeter.
Measuring Current
The Electrometer can be used for indirect currentmeasurements in many situations, though it is nosubstitute for a good ammeter. Connect the Electrom-eter leads across a known resistance in the circuit andmeasure the voltage. Use Ohm’s law (Voltage =Current x Resistance) to determine the current. Theeffect of the Electrometer on the circuit will be negli-gible in most circuits due to its exceedingly high inputimpedance. However, the voltage drop across theresistor must be within the voltage range of the Elec-trometer.
If it is not convenient to hook the Electrometer across aknown resistance in the circuit, a precision resistor canbe connected between the input leads of the Electrom-eter. The circuit can then be broken, as for connectionto a standard ammeter, and connected in series with theprecision resistor. Again, measure the voltage acrossthis resistor and calculate the current. (The problemwith this technique is that the resistance must be highenough so the voltage drop is easily measured, but lowenough so it doesn't significantly affect the currentthrough the circuit.)
Using a Projection Meter
The OUTPUT connectors on the ES-9054B Electrom-eter provide an output signal for driving a projectionmeter, oscilloscope, or other monitoring device. Theoutput is proportional to meter deflection (within 10%)with a ±3.6 VDC output corresponding to a full scale deflec-tion. (The OUTPUT voltage depends only on meterdeflection. It is independent of the range setting of theFUNCTION switch.)

012-03175E
5
ä CAUTION: Whenever you open yourElectrometer, do not touch any of the compo-nents on the printed circuit board other than thebattery holders or the trim potentiometers. Theprinted circuit contains the high impedanceMOS-FET input which can be damaged just bytouching the wrong lead.
Battery InstallationTo install or replace the batteries, remove the fourscrews that fasten the front panel to the case, thengently lift the front panel out of the case. Install thebatteries as shown in Figure 5. When removing andinstalling the batteries, be careful not to bend thebattery clips or pull the battery wires out of the circuitboard. Place the new batteries in the clips with thepositive terminal closest to the printed circuitboard.Before replacing the front panel, test that thebatteries are good and the connections are secure byflipping the FUNCTION switch first to B1 and then toB2. The meter pointer should be deflected out beyondthe areas labeled B1 and B2, respectively, at thebottom of the meter face. Replace the front panel.
PASCO’s Model ES-9065 Projection Meter can beused with an overhead projector to display the Elec-trometer readings for the whole class. The ProjectionMeter connects directly to the OUTPUT jacks, red tored and black to black.
To calibrate the Projection Meter:
① Set the FUNCTION switch to 3, and the ZeroSwitch to ZERO LOCK.
② Turn the ZERO ADJUST knob until the meter onthe Electrometer reads as close to full scale aspossible (either postive or negative).
③ Adjust the CALIBRATE knob on the ProjectionMeter so that the Projection Meter reads the sameas the Electrometer.
④ Turn the ZERO ADJUST knob until the Electrom-eter and the Projection Meter read zero.
Checking Out Your Electrometer
① Follow the setup instructions on pages 2-3 of thismanual to check the batteries and zero the Elec-trometer. If the batteries are low, see “Battery In-stallation.” If the meter cannot be zeroed, see“MOS-FET Replacement.”
② Calibration Test: Set the FUNCTION switch to30 and connect the input to an accurate 30 VDCsource. If the meter does not read 30 volts ±5%,see “Calibration.”
③ Input Impedance Test: Set the FUNCTIONswitch to 30 and connect the input to a 30 VDCsource. Disconnect the input cable at the frontpanel input connector. Record the meter readingand the time. If the input impedance is sufficient, itwill take 15 minutes or longer for the meter readingto decrease to 30% of its initial value. If the inputimpedance is low, see “Repairs.”
④ Zero Drift Test: With the meter zeroed, short theleads of the input cable together. Turn the ZeroSwitch to PUSH TO ZERO and depress the knob,then release it. The meter should read zero voltsand should drift by no more than 75 mV/minute.At any time, depressing the Zero Switch shouldbring the meter immediately back to zero. If thezero drift is excessive, see “Repairs.”
ä IMPORTANT: A zero drift test is bestperformed after the Electometer has been leftunused with the Zero Switch in the ZERO LOCKposition for at least four hours. During use withhigh voltages, or during battery replacement orother maintenance, charges may be produced onthe insulators of the input circuit. The bleedingoff of these charges may appear as excessive zerodrift.
Battery 1 (B1) Battery 2 (B2)
CalibrationPotentiometer
Zero CalibrationPotentiometerMOS-FET
Figure 5 Inside the Electrometer
Maintenance
012-03175E
6
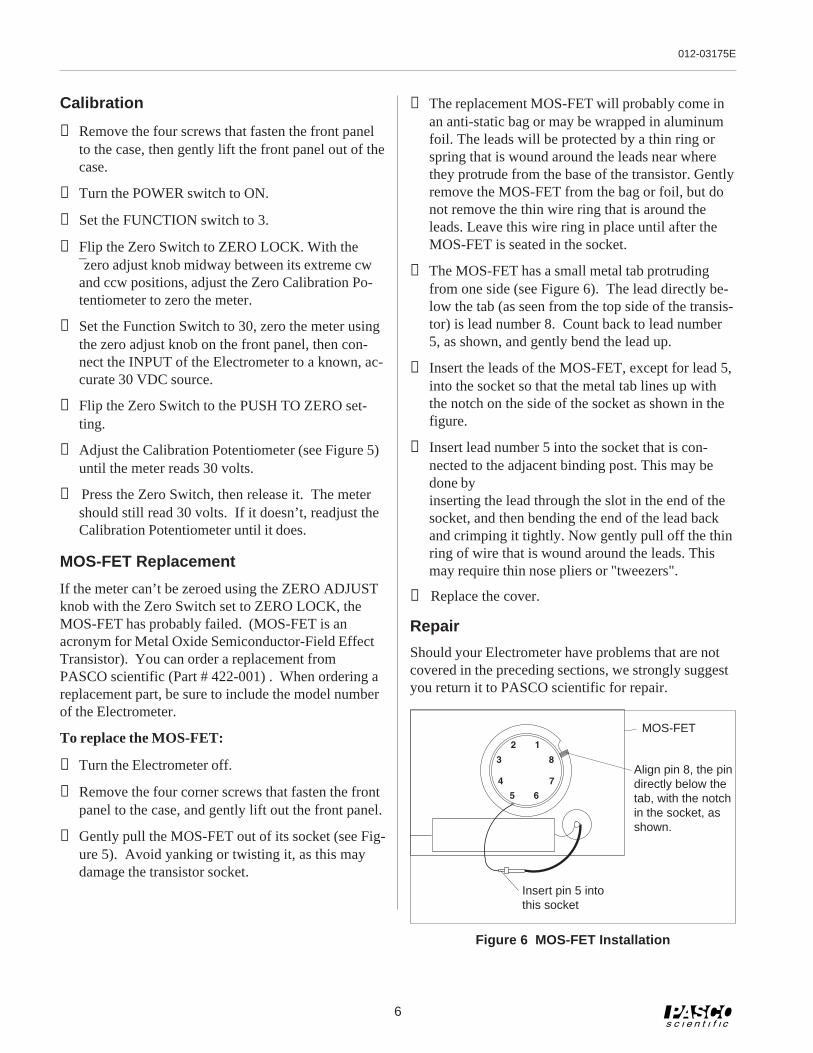
④ The replacement MOS-FET will probably come inan anti-static bag or may be wrapped in aluminumfoil. The leads will be protected by a thin ring orspring that is wound around the leads near wherethey protrude from the base of the transistor. Gentlyremove the MOS-FET from the bag or foil, but donot remove the thin wire ring that is around theleads. Leave this wire ring in place until after theMOS-FET is seated in the socket.
⑤ The MOS-FET has a small metal tab protrudingfrom one side (see Figure 6). The lead directly be-low the tab (as seen from the top side of the transis-tor) is lead number 8. Count back to lead number5, as shown, and gently bend the lead up.
⑥ Insert the leads of the MOS-FET, except for lead 5,into the socket so that the metal tab lines up withthe notch on the side of the socket as shown in thefigure.
⑦ Insert lead number 5 into the socket that is con-nected to the adjacent binding post. This may bedone byinserting the lead through the slot in the end of thesocket, and then bending the end of the lead backand crimping it tightly. Now gently pull off the thinring of wire that is wound around the leads. Thismay require thin nose pliers or "tweezers".
⑧ Replace the cover.
Repair
Should your Electrometer have problems that are notcovered in the preceding sections, we strongly suggestyou return it to PASCO scientific for repair.
Calibration
① Remove the four screws that fasten the front panelto the case, then gently lift the front panel out of thecase.
② Turn the POWER switch to ON.
③ Set the FUNCTION switch to 3.
④ Flip the Zero Switch to ZERO LOCK. With the¯zero adjust knob midway between its extreme cwand ccw positions, adjust the Zero Calibration Po-tentiometer to zero the meter.
⑤ Set the Function Switch to 30, zero the meter usingthe zero adjust knob on the front panel, then con-nect the INPUT of the Electrometer to a known, ac-curate 30 VDC source.
⑥ Flip the Zero Switch to the PUSH TO ZERO set-ting.
⑦ Adjust the Calibration Potentiometer (see Figure 5)until the meter reads 30 volts.
⑧ Press the Zero Switch, then release it. The metershould still read 30 volts. If it doesn’t, readjust theCalibration Potentiometer until it does.
MOS-FET Replacement
If the meter can’t be zeroed using the ZERO ADJUSTknob with the Zero Switch set to ZERO LOCK, theMOS-FET has probably failed. (MOS-FET is anacronym for Metal Oxide Semiconductor-Field EffectTransistor). You can order a replacement fromPASCO scientific (Part # 422-001) . When ordering areplacement part, be sure to include the model numberof the Electrometer.
To replace the MOS-FET:
① Turn the Electrometer off.
② Remove the four corner screws that fasten the frontpanel to the case, and gently lift out the front panel.
③ Gently pull the MOS-FET out of its socket (see Fig-ure 5). Avoid yanking or twisting it, as this maydamage the transistor socket.
1
3
2
4
5 6
7
8
MOS-FET
Align pin 8, the pindirectly below thetab, with the notchin the socket, asshown.
Insert pin 5 intothis socket
Figure 6 MOS-FET Installation

012-03175E
7
SCHEMATICModel ES-9054B Electrometer
(Drawing #956-02859)
012-03175E
8
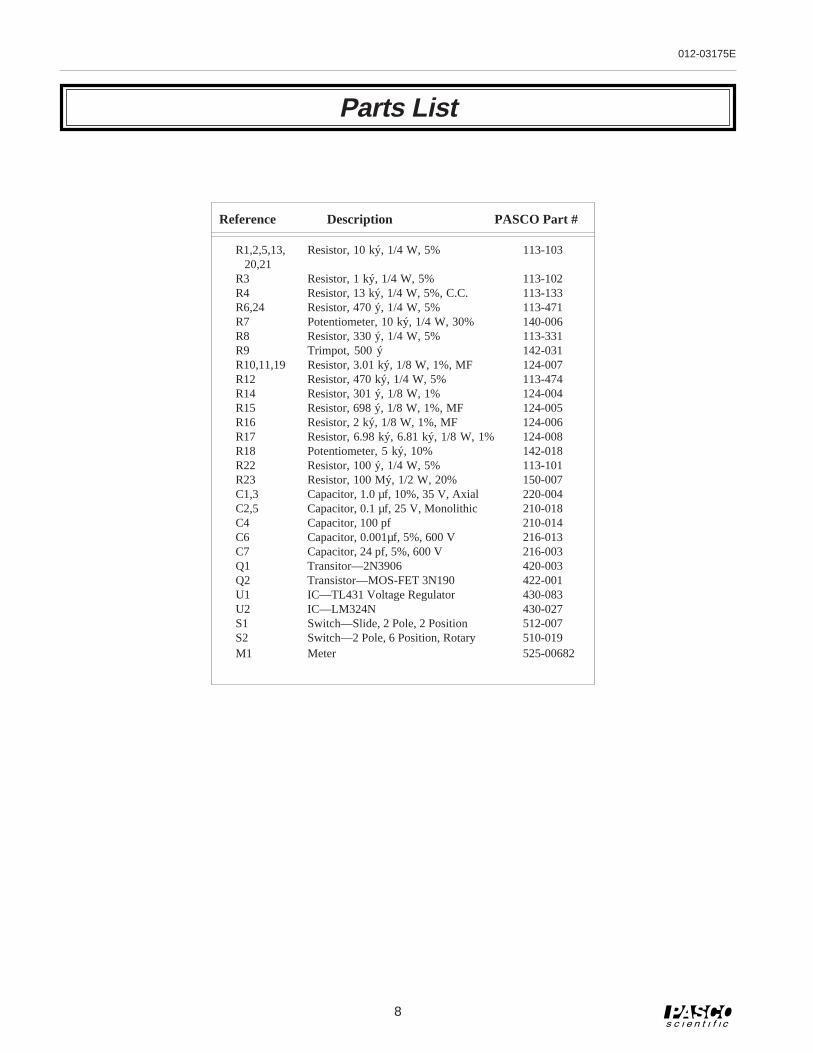
Reference Description PASCO Part #
R1,2,5,13, Resistor, 10 ký, 1/4 W, 5% 113-103 20,21R3 Resistor, 1 ký, 1/4 W, 5% 113-102R4 Resistor, 13 ký, 1/4 W, 5%, C.C. 113-133R6,24 Resistor, 470 ý, 1/4 W, 5% 113-471R7 Potentiometer, 10 ký, 1/4 W, 30% 140-006R8 Resistor, 330 ý, 1/4 W, 5% 113-331R9 Trimpot, 500 ý 142-031R10,11,19 Resistor, 3.01 ký, 1/8 W, 1%, MF 124-007R12 Resistor, 470 ký, 1/4 W, 5% 113-474R14 Resistor, 301 ý, 1/8 W, 1% 124-004R15 Resistor, 698 ý, 1/8 W, 1%, MF 124-005R16 Resistor, 2 ký, 1/8 W, 1%, MF 124-006R17 Resistor, 6.98 ký, 6.81 ký, 1/8 W, 1% 124-008R18 Potentiometer, 5 ký, 10% 142-018R22 Resistor, 100 ý, 1/4 W, 5% 113-101R23 Resistor, 100 Mý, 1/2 W, 20% 150-007C1,3 Capacitor, 1.0 µf, 10%, 35 V, Axial 220-004C2,5 Capacitor, 0.1 µf, 25 V, Monolithic 210-018C4 Capacitor, 100 pf 210-014C6 Capacitor, 0.001µf, 5%, 600 V 216-013C7 Capacitor, 24 pf, 5%, 600 V 216-003Q1 Transitor—2N3906 420-003Q2 Transistor—MOS-FET 3N190 422-001U1 IC—TL431 Voltage Regulator 430-083U2 IC—LM324N 430-027S1 Switch—Slide, 2 Pole, 2 Position 512-007S2 Switch—2 Pole, 6 Position, Rotary 510-019M1 Meter 525-00682
Parts List

012-03175E Electrometer
Technical Support
Feedback
If you have any comments about the product or manual,please let us know. If you have any suggestions onalternate experiments or find a problem in the manual,please tell us. PASCO appreciates any customerfeedback. Your input helps us evaluate and improve ourproduct.
To Reach PASCO
For technical support, call us at 1-800-772-8700(toll-free within the U.S.) or (916) 786-3800.
fax: (916) 786-3292
e-mail: [email protected]
web: www.pasco.com
Contacting Technical Support
Before you call the PASCO Technical Support staff, itwould be helpful to prepare the following information:
If your problem is with the PASCO apparatus, note:
Title and model number (usually listed on thelabel);
Approximate age of apparatus;
A detailed description of the problem/sequence ofevents (in case you can’t call PASCO right away,you won’t lose valuable data);
If possible, have the apparatus within reach whencalling to facilitate description of individual parts.
If your problem relates to the instruction manual,note:
Part number and revision (listed by month andyear on the front cover);
Have the manual at hand to discuss yourquestions.

Instruction Sheetfor the PASCOModel ES-9049A
POWER SUPPLY
012-01568C12/94$1.00
Introduction
The PASCO Model ES-9049A Power Supply is a tworange supply providing all the necessary potentials forPASCO electrostatics equipment.
Operating Instructions
Turn the unit ON by turning the VARIABLE controlknob clockwise.
Select the 30 VDC or 1000 VDC range using the OUT-PUT switch. The center position of the switch(STANDBY) will produce a zero output at the terminals,regardless of the voltage control settings.
When using the 30 VDC range use the red and blackbinding posts. The black binding post is connected to thethird prong (ground) on the power cord.
© 1989 PASCO scientificThis instruction sheet written/edited by: Dave Griffith
When using the 1000 VDC range use the black and greenbinding posts. When the green binding post is used thereis a 100 MΩ resistor in series with the output. This elimi-nates the hazard of shock if the green terminal is acciden-tally touched. However, if one attempts to measure theoutput of this terminal with a meter having less than sev-eral hundred MΩ of input impedance the meter on theES-9049A and the measuring meter will not read thesame. This is due to the voltage drop across the 100 MΩresistor produced by the current needed to drive themeter.
Voltage output is varied by the voltage control knob.
Specifications:
➀ Ranges:
a) 1000 VDC, less than 2% ripple peak-to-peak, un-regulated (maximum short circuit current less than0.01 mA)
b) 30 VDC at 20 mA, 0.3% ripple peak-to-peak, lineand load regulation to within 1%.
➁ Meter: Two scale, +/- 3% of full-scale accuracy.
➂ Power:
a) 110-130 VDC, 60 Hz
b) 220/240 VDC, 50 Hz
➃ Fuse:
a) 0.2 A, Slo-Blo. (110-130 VDC)
b) 0.1 A, Slo-Blo. (220/240 VDC)
➄ Dimensions: 17.5 x 13.5 x 6 cm

2
Power Supply 012-01568C
Maintenance
There is no routine maintenance required for the ES-9049A Power Supply. However, power line surges canblow the protective fuse without damaging the instru-ment. Therefore, should the instrument fail to operate andthe fuse is blown, replace it with a new fuse of the appro-priate value. If the instrument subsequently works prop-erly, no further action is necessary. If the fuse blowsagain (it may take 15 seconds), refer to the ‘Repairs’ sec-tion in this manual.
Repairs
Should the ES-9049A Power Supply require repair, it isstrongly recommended that the unit be returned toPASCO scientific. Because PASCO is thoroughly famil-iar with the instrument and maintains a complete stock ofreplacement parts, repairs can be made quickly and at lowcost.
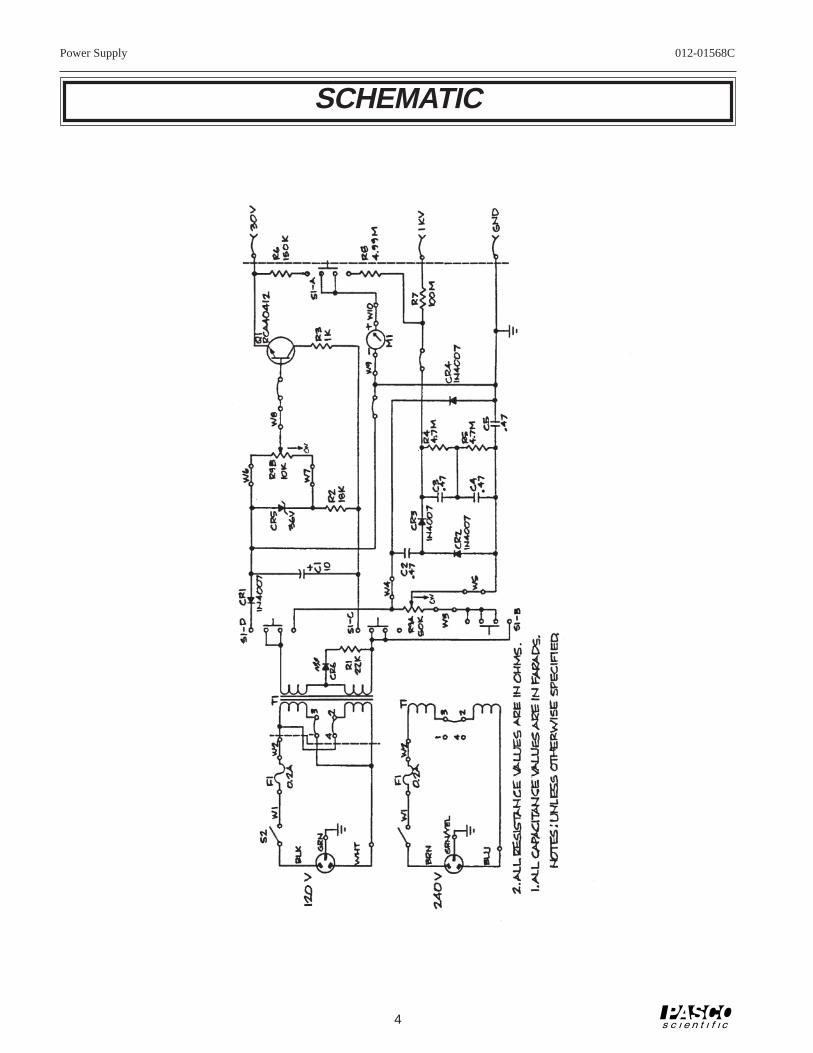
If field repair is desired, a schematic and parts list are in-cluded in the following section. A brief list of malfunc-tions and their probable causes are also given.
Troubleshooting Tips
➀ No output on any range:
Fuse blown
➁ Low output on 1000 VDC range:
Defective capacitor C2, C3, C4, or C5.
➂ No output on 30 VDC range but other range is all right:
Defective zener diode CR5 or power transistor Q1.
➃ Proper output, but no meter readings:
Defective meter M1.
Limited Warranty
PASCO scientific warrants this product to be free fromdefects in materials and workmanship for a period of oneyear from the date of shipment to the customer. PASCOwill repair or replace, at its option, any part of the productwhich is deemed to be defective in material or workman-ship. This warranty does not cover damage to the productcaused by abuse or improper use. Determination ofwhether a product failure is the result of a manufacturingdefect or improper use by the customer shall be madesolely by PASCO scientific. Responsibility for the returnof equipment for warranty repair belongs to the customer.Equipment must be properly packed to prevent damageand shipped postage or freight prepaid. (Damage causedby improper packing of the equipment for return ship-ment will not be covered by the warranty.) Shippingcosts for returning the equipment, after repair, will bepaid by PASCO scientific.
Equipment Return
Should this product have to be returned to PASCO scien-tific, for whatever reason, notify PASCO scientific byletter or phone BEFORE returning the product. Uponnotification, the return authorization and shipping instruc-tions will be promptly issued.
NOTE: NO EQUIPMENT WILL BEACCEPTED FOR RETURN WITHOUT ANAUTHORIZATION.
When returning equipment for repair, the units must bepacked properly. Carriers will not accept responsibilityfor damage caused by improper packing.
CAUTIONRISK OF ELECTRIC SHOCK
DO NOT OPEN
CAUTION:TO PREVENT THE RISK OF ELECTRIC SHOCK, DONOT REMOVE COVER ON UNIT. NO USER SERVICE-ABLE PARTS INSIDE. REFER SERVICING TO QUALI-FIED SERVICE PERSONNEL.
The lightning flash with arrowhead, withinan equilateral triangle, is intended to alertthe user of the presence of uninsulated“dangerous voltage” within the product’senclosure that may be of sufficient magni-tude to constitute a risk of electric shock topersons.
The exclamation point within an equi-lateral triangle is intended to alert theuser of the presence of important oper-ating and maintenance (servicing) in-structions in the literature accompany-ing the appliance.

3
Power Supply 012-01568C
PARTS LIST
Specification Pasco part no. Reference
Resistors:22K, 1/4W, 5% 113-223 R118K, 2W, 5% 110-183 R21K, 2W, 5% 110-102 R34.7M, 1/4W, 5% 113-475 R4, R5150K, 1/2W, 1% 122-064 R6100M, 1/2W, 5% 150-006 R74.99M, 1/2W, 1% 150-015 R8POT, Two Section 140-032 R9A/B*, S2*Capacitors:10mF, 450V, Electrolytic 222-003 C1.47mF, 400V, Mylar 214-007 C2-C5Transformer:Power, 115/230-2X115V 322-009 T1Diodes/Semiconductors:1N4007, 1000PIV, 1A Silicon Rect 410-002 CR1-CR41N4753A, 36V, 1W, 5% Zener 412-004 CR5LED Red 527-001 CR6Power Transistor RCA40412 NPN 420-005 Q1Switch:Slide, 4Pole, 3Position 512-016 S1Fuse/Meter:.2A SLO-BLO (110-130VDC) 530-001 F1.1A SLO-BLO (220/240VDC) 530-006 F1Meter 525-00804 M1Mechanical:Bakelite Case, Black 650-01462Front Panel 648-00803Control Knob 620-002Binding Post, Red 517-013Binding Post, Black 517-014Binding Post, Green 517-015Fuse Holder 520-003Power Cord, Domestic 516-001Power Cord, European 516-003Dissipater 624-001
NOTE: R9A/B and S2 are concentrically mounted on the Variable Control shaft and comprise a single unit.
4
Power Supply 012-01568C
SCHEMATIC

012-04367E4/94
© 1990 PASCO scientific $10.00
Phone (916) 786-3800 • FAX (916) 786-8905 • TWX 910-383-2040
10101 Foothills Blvd. • P.O. Box 619011 • Roseville, CA 95678-9011 USA
better
teach physics
ways to
BASIC ELECTRICITY
Instruction Manual andExperiment Guide forthe PASCO scientificModel EM-8622
IncludesTeacher's Notes
andTypical
ExperimentResults
AB
C
C
D E
CW
MODEL
EM-8622
+-
+-

i
012-04367E Basic Electricity
Table of Contents
Section ...........................................................................................................Page
Copyright, Warranty, and Equipment Return................................................. ii
Introduction .....................................................................................................1
Equipment ........................................................................................................1
Getting Started, The Experiments ...................................................................2
Comments on Meters .......................................................................................3
Notes on the Circuits Experiment Board .........................................................4
Experiments
Experiment 1: Circuits Experiment Board .......................................5
Experiment 2: Lights in Circuits ......................................................7
Experiment 3: Ohm's Law ................................................................9
Experiment 4: Resistances in Circuits ............................................11
Experiment 5: Voltages in Circuits ................................................15
Experiment 6: Currents in Circuits .................................................19
Experiment 7: Kirchhoff's Rules ....................................................21
Experiment 8: Capacitors in Circuits..............................................23
Experiment 9: Diodes .....................................................................25
Experiment 10: Transistors ...............................................................27
Appendix: Tips and Troubleshooting ...........................................................29
Replacement Parts List ..................................................................................31
Teacher's Guide .............................................................................................33
Technical Support ................................................................................ Back Cover

ii
Basic Electricity 012-04367E
Equipment Return
Should this product have to be returned to PASCOscientific, for whatever reason, notify PASCO scientificby letter or phone BEFORE returning the product. Uponnotification, the return authorization and shipping instruc-tions will be promptly issued.
NOTE: NO EQUIPMENT WILL BE AC-CEPTED FOR RETURN WITHOUT AN AU-THORIZATION.
When returning equipment for repair, the units must bepacked properly. Carriers will not accept responsibilityfor damage caused by improper packing. To be certainthe unit will not be damaged in shipment, observe thefollowing rules:
➀ The carton must be strong enough for the itemshipped.
➁ Make certain there is at least two inches of packingmaterial between any point on the apparatus and theinside walls of the carton.
➂ Make certain that the packing material can not shift inthe box, or become compressed, thus letting the instru-ment come in contact with the edge of the box.
Address: PASCO scientific
10101 Foothills Blvd.
P.O. Box 619011
Roseville, CA 95678-9011
Phone: (916) 786-3800
FAX: (916) 786-8905
Copyright Notice
The PASCO scientific Model EM-8622 Basic Electricitymanual is copyrighted and all rights reserved. However,permission is granted to non-profit educational institu-tions for reproduction of any part of this manual provid-ing the reproductions are used only for their laboratoriesand are not sold for profit. Reproduction under any othercircumstances, without the written consent of PASCOscientific, is prohibited.
Limited Warranty
PASCO scientific warrants this product to be free fromdefects in materials and workmanship for a period of oneyear from the date of shipment to the customer. PASCOwill repair or replace, at its option, any part of the productwhich is deemed to be defective in material or workman-ship. This warranty does not cover damage to the productcaused by abuse or improper use. Determination ofwhether a product failure is the result of a manufacturingdefect or improper use by the customer shall be madesolely by PASCO scientific. Responsibility for the returnof equipment for warranty repair belongs to the customer.Equipment must be properly packed to prevent damageand shipped postage or freight prepaid. (Damage causedby improper packing of the equipment for return ship-ment will not be covered by the warranty.) Shippingcosts for returning the equipment, after repair, will bepaid by PASCO scientific.
Copyright, Warranty and Equipment Return
Please—Feel free to duplicate this manualsubject to the copyright restrictions below.
Credits
This manual authored by: Clarence Bakken
This manual edited by: Dave Griffith
Teacher’s guide written by: Eric Ayars
1
012-04367E Basic Electricity
The PASCO Circuits Experiment Board is designed toimplement a large variety of basic electrical circuits forexperimentation. The Circuits Experiment Board can beused for experiments beginning with a simple complete
Introduction
circuit and continuing on to a study of Kirchhoff’s Lawsand characteristics of diodes and transistors. A labeledpictorial diagram of the Experiment Board appears inFigure 1.2 of Experiment 1.
Equipment
Instruction Manual andExperiment Guide forthe PASCO scientificModel EM-8622
012-04367A3 / 9 1
Copyright © November 1990 $10.00
BASIC ELECTRICITY
Phone (916) 786-3800 • FAX (916) 786-8905 • TWX 910-383-2040
10101 Foothills Blvd. • P.O. Box 619011 • Roseville, CA 95678-9011 USA
better
teach physics
ways to
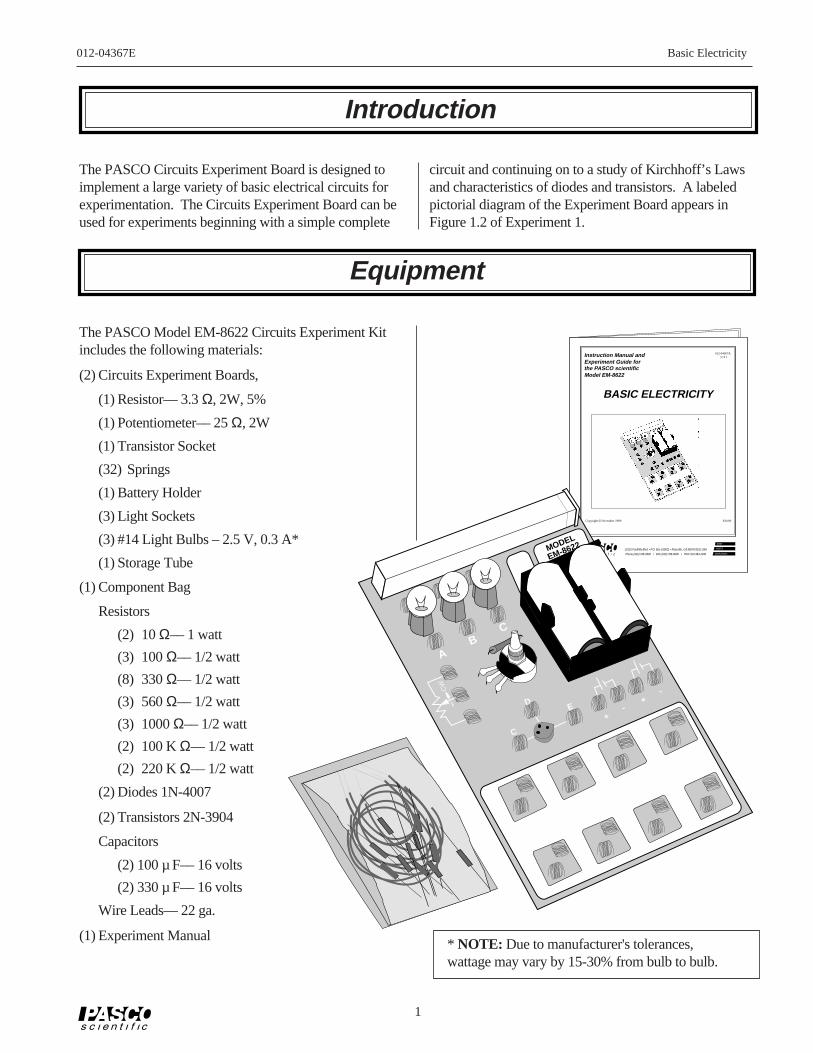
The PASCO Model EM-8622 Circuits Experiment Kitincludes the following materials:
(2) Circuits Experiment Boards,
(1) Resistor–– 3.3 Ω, 2W, 5%
(1) Potentiometer–– 25 Ω, 2W
(1) Transistor Socket
(32) Springs
(1) Battery Holder
(3) Light Sockets
(3) #14 Light Bulbs – 2.5 V, 0.3 A*
(1) Storage Tube
(1) Component Bag
Resistors
(2) 10 Ω–– 1 watt
(3) 100 Ω–– 1/2 watt
(8) 330 Ω–– 1/2 watt
(3) 560 Ω–– 1/2 watt
(3) 1000 Ω–– 1/2 watt
(2) 100 K Ω–– 1/2 watt
(2) 220 K Ω–– 1/2 watt
(2) Diodes 1N-4007
(2) Transistors 2N-3904
Capacitors
(2) 100 µ F–– 16 volts
(2) 330 µ F–– 16 volts
Wire Leads–– 22 ga.
(1) Experiment Manual
AB
C
C
D E
CW
MODEL
EM-8622
+-
+-
* NOTE: Due to manufacturer's tolerances,wattage may vary by 15-30% from bulb to bulb.

2
Basic Electricity 012-04367E
➀ Open the zip-lock bag containing the resistors andother components. Distribute the following resistorsand wires to each of the boards, storing them in theplastic holder at the top of the board:
(3) 5" Wire Leads (12.7 cm)
(4) 10" Wire Leads (25.4 cm)
(1) 100 Ω Resistor (brown, black, brown, gold)
(3) 330 Ω Resistors (orange, orange, brown, gold)
(1) 560 Ω Resistor (green, blue, brown, gold)
(1) 1000 Ω Resistor (brown, black, red, gold)
Store the remainder of the components in the zip-lock bag until needed in future experiments.
➁ Students will need to use the same resistors, same bat-teries, etc. from one experiment to another, particu-larly during experiments 4 to 6. Labeling of theboards and your meters will enable students to moreeasily have continuity in their work. A pad has beenincluded on the board for purposes of labeling indi-vidual boards. Use of a removable label or using apermanent marker are two alternatives.
The experiments written up in this manual are develop-mental, starting from an introduction to the CircuitsExperiment Board and complete circuits, through seriesand parallel circuits, ultimately resulting in diode andtransistor characteristics. These experiments can be usedin combination with existing labs that the teacher em-ploys, or may be used as a complete lab unit.
Experiment 1 Circuits Experiment Board
Experiment 2 Lights in Circuits
Experiment 3 Ohm’s Law
Experiment 4 Resistances in Circuits
Experiment 5 Voltages in Circuits
Experiment 6 Currents in Circuits
Experiment 7 Kirchhoff’s Rules
Experiment 8 Capacitors in Circuits
Experiment 9 Diode Characteristics
Experiment 10 Transistor Characteristics
Getting Started
The Experiments
Additional Equipment needed:
Experiments 3-10 Digital Multimeter, VOM orVTVM (See discussion on page 3)
Experiments 8-10 The Meter needs at least 106 Ωinput impedance
Experiment 8 A timing device is needed,0.1 second resolution.
Experiment 9 A.C. Power Supply and anOscilloscope (optional)

3
012-04367E Basic Electricity
VOM:The Volt-Ohm-Meter or VOM is a multiple scale, multiplefunction meter (such as the PASCO SB-9623 AnalogMultimeter), typically measuring voltage and resistance,and often current, too. These usually have a meter move-ment, and may select different functions and scales bymeans of a rotating switch on the front of the unit.
Advantages: VOM’s may exist in your laboratory andthus be readily accessible. A single meter may be used tomake a variety of measurements rather than needingseveral meters.
Disadvantages: VOM’s may be difficult for beginningstudents to learn to read, having multiple scales corre-sponding to different settings. VOM’s are powered bybatteries for their resistance function, and thus must bechecked to insure the batteries are working well. Typi-cally, VOM’s may have input resistances of 30,000 Ω onthe lowest voltage range, the range that is most often usedin these experiments. For resistances in excess of1,000 Ω, this low meter resistance affects circuit opera-tion during the taking of readings, and thus is not usablefor the capacitor, diode and transistor labs.
DMM:The Digital Multimeter or DMM is a multiple scale,multiple function meter (such as the PASCO SB-9624Basic Digital Multimeter or the SE-9589 General PurposeDMM), typically measuring voltage and resistance, andoften current, too. These have a digital readout, oftenwith an LCD (Liquid Crystal Display). Different func-tions and scales are selected with either a rotating switchor with a series of push-button switches.
Advantages: DMM’s are easily read, and with theirtypically high input impedances (>106 Ω) give good resultsfor circuits having high resistance. Students learn to readDMM’s quickly and make fewer errors reading values.Reasonable quality DMM’s can be purchased for $60 orless. PASCO strongly recommends the use of DMM’s.
Disadvantages:DMM’s also require the use of a battery,although the lifetime of an alkaline battery in a DMM isquite long. The battery is used on all scales and func-tions. Most DMM’s give the maximum reading on theselector (i.e., under voltage, “2” means 2-volt maximum,actually 1.99 volt maximum). This may be confusing tosome students.
VTVM:
The Vacuum Tube Voltmeter or VTVM is a multiplescale, multiple function meter, typically measuringvoltage and resistance. They do not usually measurecurrent. The meter is an analog one, with a variety ofscales, selected with a rotating switch on the front of themeter.
Advantages: VTVM’s have high input resistances, onthe order of 106 Ω or greater. By measuring the voltageacross a known resistance, current can be measured witha VTVM.
Disadvantages:VTVM’s have multiple scales. Studentsneed practice to avoid the mistake of reading the incorrectone. An internal battery provides the current for measur-ing resistance, and needs to be replaced from time to time.Grounding problems can occur when using more than oneVTVM to make multiple measurements in the samecircuit.
Panelmeters:
Individual meters, frequently obtained from scientificsupply houses, are available in the form of voltmeters,ammeters, and galvanometers (such as PASCO’sSE-9748 Voltmeter 5 V, 15 V , SE-9746 Ammeter 1 A, 5 A and SE-9749 Galvanometer ± 35 mV). In somemodels, multiple scales are also available.
Advantages: Meters can be used which have the specificrange required in a specific experiment. This helps toovercome student errors in reading.
Disadvantages:Using individual meters leads to errorsin choosing the correct one. With limited ranges, studentsmay find themselves needing to use another range and nothave a meter of that range available. Many of theindividual meters have low input impedances(voltmeters) and large internal resistances (ammeters).Ohmmeters are almost nonexistent in individual form.
Light Bulbs
The #14 bulbs are nominally rated at 2.5 V and 0.3 A.However, due to relatively large variations allowed bythe manufacturer, the wattage of the bulbs may vary by15 to 30%. Therefore, supposedly “identical” bulbs maynot shine with equal brightness in simple circuits.
Comments on Meters

4
Basic Electricity 012-04367E
The springs are securely soldered to the board and serveas a convenient method for connecting wires, resistorsand other components. Some of the springs are con-nected electrically to devices like the potentiometer andthe D-cells. In the large Experimental Area, the springsare connected in pairs, oriented perpendicular to eachother. This facilitates the connection of various types ofcircuits.
If a spring is too loose, press the coils together firmly totighten it up. The coils of the spring should not be tootight, as this will lead to bending and/or breaking of thecomponent leads when they are inserted or removed. If aspring gets pushed over, light pressure will get it straight-ened back up.
The components, primarily resistors, and small wires canbe stored in the plastic container at the top of the board.Encourage students to keep careful track of the compo-nents and return them to the container each day followingthe lab period.
Notes on the Circuits Experiment Board
When connecting a circuit to a D-cell, note the polarity(+ or -) which is printed on the board. In some cases thepolarity is not important, but in some it will be impera-tive. Polarity is very important for most meters.
Connections are made on the Circuits Experiment Boardby pushing a stripped wire or a lead to a component into aspring. For maximum effect, the stripped part of the wireshould extend so that it passes completely across thespring, making contact with the spring at four points.This produces the most secure electrical and mechanicalconnection.
(side view)
(top view)Wire
Spring
Figure 1 Diagram of wires and springs
5
012-04367E Basic Electricity
EQUIPMENT NEEDED:
-Circuits Experiment -Board-D-cell Battery -Wire Leads-Graph -Paper
Purpose
The purpose of this lab is to become familiar with the Circuits Experiment Board, to learn how toconstruct a complete electrical circuit, and to learn how to represent electrical circuits with circuitdiagrams.
Background
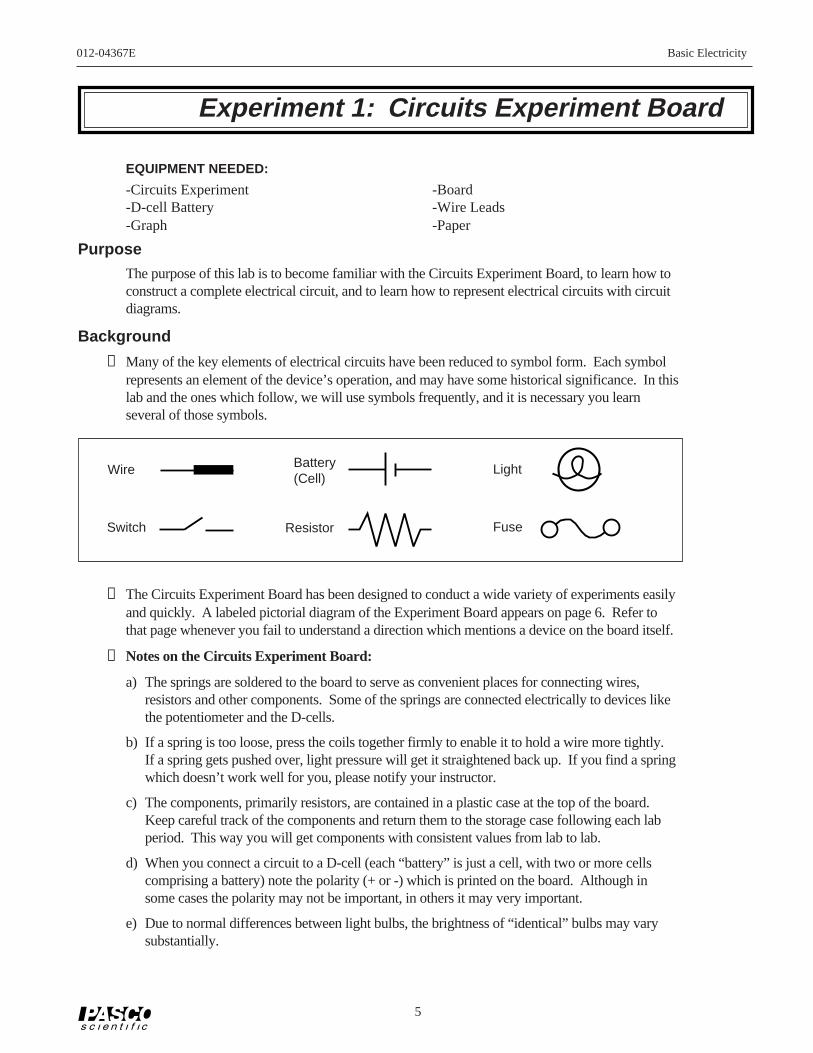
➀ Many of the key elements of electrical circuits have been reduced to symbol form. Each symbolrepresents an element of the device’s operation, and may have some historical significance. In thislab and the ones which follow, we will use symbols frequently, and it is necessary you learnseveral of those symbols.
➁ The Circuits Experiment Board has been designed to conduct a wide variety of experiments easilyand quickly. A labeled pictorial diagram of the Experiment Board appears on page 6. Refer tothat page whenever you fail to understand a direction which mentions a device on the board itself.
➂ Notes on the Circuits Experiment Board:
a) The springs are soldered to the board to serve as convenient places for connecting wires,resistors and other components. Some of the springs are connected electrically to devices likethe potentiometer and the D-cells.
b) If a spring is too loose, press the coils together firmly to enable it to hold a wire more tightly.If a spring gets pushed over, light pressure will get it straightened back up. If you find a springwhich doesn’t work well for you, please notify your instructor.
c) The components, primarily resistors, are contained in a plastic case at the top of the board.Keep careful track of the components and return them to the storage case following each labperiod. This way you will get components with consistent values from lab to lab.
d) When you connect a circuit to a D-cell (each “battery” is just a cell, with two or more cellscomprising a battery) note the polarity (+ or -) which is printed on the board. Although insome cases the polarity may not be important, in others it may very important.
e) Due to normal differences between light bulbs, the brightness of “identical” bulbs may varysubstantially.
Experiment 1: Circuits Experiment Board
Resistor Fuse
Light
Switch
Wire Battery(Cell)

6
Basic Electricity 012-04367E
Procedure
➀ Use two pieces of wire to make connections between the springs on one of the light bulbs tothe springs on the D-cell in such a way that the light will glow. Discuss with your lab partnerbefore you begin actually wiring your circuit which connections you intend to make, and whyyou think you will be successful in activating the light. If you are not successful, try in order:changing the wiring, using another light, using another cell, asking the instructor for assis-tance.
a) Sketch the connections that the wires make when you are successful, using the symbolsfrom the first page of this lab.
b) Re-sketch the total circuit that you have constructed, making the wires run horizontallyand vertically on the page. This is more standard in terms of drawing electrical circuits.
➁ Reverse the two wires at the light. Does this have any effect on the operation? Reverse thetwo wires at the cell. Does this have any effect on the operation?
➂ In the following steps, use a vacant springconnection such as one of the three around thetransistor socket as shown on the right as a“switch.” Connect one lead from the battery tothis spring and then take a third wire from thespring to the light. You can now switch thepower “on” and “off” by connecting or notconnecting the third wire.
➃ Use additional wires as needed to connect a second light into the circuit in such a way that it isalso lighted. (Use a “switch” to turn the power on and off once the complete wiring has beenachieved.) Discuss your plans with your lab partner before you begin. Once you haveachieved success, sketch the connections that you made in the form of a circuit diagram.Annotate your circuit diagram by making appropriate notes to the side indicating whathappened with that particular circuit. If you experience lack of success, keep trying.
NOTE: Is your original light the same brightness, or was it brighter or dimmer that it wasduring step 1? Can you explain any differences in the brightness, or the fact that it is thesame? If not, don’t be too surprised, as this will be the subject of future study.
➄ If you can devise anotherway of connecting two lightsinto the same circuit, try itout. Sketch the circuitdiagram when finished andnote the relative brightness.Compare your brightnesswith what you achieved witha single light by itself.
➅ Disconnect the wires.Return the components andwires to the plastic case onthe Circuits ExperimentBoard. Return the equip-ment to the location indi-cated by your instructor.
Circ
uits
Exp
erim
ent B
oard
Mod
el 5
55-0
4182
-12
amp
slow
blo
w fu
se
AB
C
1.5
volts
D c
ell
1.5
volts
D c
ell
Mod
el E
M-8
622
CIR
CU
IT E
XP
ER
IME
NT
B
OA
RD
KIT
NO
.
Battery Holder
Potentiometer
Springs
Figure 1.2
Light Bulbs Resistor (3.3 Ω)
Storage
Box
Can be
removed“Switch”
Figure 1.1
Transistor
Socket

7
012-04367E Basic Electricity
Purpose
The purpose of this lab is to determine how light bulbs behave in different circuit arrangements.Different ways of connecting two batteries will also be investigated.
Procedure
PART A
NOTE: Due to variations from bulb to bulb, the brightness of one bulb may be substantiallydifferent from the brightness of another bulb in “identical” situations.
➀ Use two pieces of wire to connect a single light bulb to one of the D-cells in such a way that thelight will glow. Include a “switch” to turn the light on and off, preventing it from being oncontinuously. (You should have completed this step in Experiment 1. If that is the case, reviewwhat you did then. If not, continue with this step.)
➁ Use additional wires as needed to connect a second light into the circuit in such a way that it isalso lighted. Discuss your plans with your lab partner before you begin. Once you haveachieved success, sketch the connections that you made in the form of a circuit diagram usingstandard symbols. Annotate your circuit diagram by making appropriate notes to the sideindicating what happened with that particular circuit.
NOTE: Is your original light the same brightness, or was it brighter or dimmer than it wasduring step 1? Can you explain any differences in the brightness, or why it is the same?
➂ If one of the light bulbs is unscrewed, does the other bulb go out or does it stay on? Why orwhy not?
➃ Design a circuit that will allow you to light all three lights, with each one being equally bright.Draw the circuit diagram once you have been successful. If you could characterize the circuitas being a series or parallel circuit, which would it be? What happens if you unscrew one ofthe bulbs? Explain.
➄ Design another circuit which will also light all three bulbs, but with the bulbs all being equallybright, even though they may be brighter or dimmer than in step 4. Try it. When you aresuccessful, draw the circuit diagram. What happens if you unscrew one of the bulbs?Explain.
➅ Devise a circuit which will light two bulbs at the same intensity, but the third at a differentintensity. Try it. When successful, draw the circuit diagram. What happens if you unscrewone of the bulbs? Explain.
NOTE: Are there any generalizations that you can state about different connections to a setof lights?
EQUIPMENT NEEDED:
-Circuits Experiment Board -Two D-cell Batteries-Wire Leads -Graph Paper.
Experiment 2: Lights in Circuits

8
Basic Electricity 012-04367E
PART B
➆ Connect a single D-cell to a single light as in step 1, using a spring clip “switch” to allowyou to easily turn the current on and off. Note the brightness of the light.
⑧ Now connect the second D-cell into the circuit as shown in Figure 2.1a. What is the effecton the brightness of the light?
⑨ Connect the second D-cell as in Figure 2.1b. What is the effect on the brightness?
➉ Finally, connect the second D-cell as in figure 2.1c. What is the effect on the brightness?
NOTE: Determine the nature of the connections between the D-cells you made in steps8-10. Which of these was most useful in making the light brighter? Which was leastuseful? Can you determine a reason why each behaved as it did?
PART C
11 Connect the circuit shown in Figure 2.2. Whatis the effect of rotating the knob on the devicethat is identified as a “Potentiometer?”
Discussion
➀ Answer the questions which appear during theexperiment procedure. Pay particular attentionto the “NOTED:” questions.
➁ What are the apparent rules for the operation oflights in series? In parallel?
➂ What are the apparent rules for the operation ofbatteries in series? In parallel?
➃ What is one function of a potentiometer in acircuit?
Figure 2.2 (Not to scale)
Potentiometer
Battery
Light
Figure 2.1cFigure 2.1a Figure 2.1b

9
012-04367E Basic Electricity
EQUIPMENT NEEDED:
-Circuits Experiment Board -D-cell Battery-Multimeter -Wire Leads-Graph Paper.
Purpose
The purpose of this lab will be to investigate the three variables involved in a mathematicalrelationship known as Ohm’s Law.
Procedure
➀ Choose one of the resistors that you have been given. Using the chart on the back, decode theresistance value and record that value in the first column of Table 3.1.
➁ MEASURING CURRENT: Construct the circuit shown in Figure 3.1a by pressing the leadsof the resistor into two of the springs in the Experimental Section on the Circuits ExperimentBoard.
➂ Set the Multimeter to the 200 mA range, noting any special connections needed for measuringcurrent. Connect the circuit and read the current that is flowing through the resistor. Record thisvalue in the second column of Table 3.1.
➃ Remove the resistor and choose another. Record its resistance value in Table 3.1 then measureand record the current as in steps 2 and 3. Continue this process until you have completed all ofthe resistors you have been given. As you have more than one resistor with the same value, keepthem in order as you will use them again in the next steps.
➄ MEASURING VOLTAGE: Disconnect the Multimeter and connect a wire from the positivelead (spring) of the battery directly to the first resistor you used as shown in Figure 3.1b. Changethe Multimeter to the 2 VDC scale and connect the leads as shown also in Figure 3.1b. Measurethe voltage across the resistor and record it in Table 3.1.
➅ Remove the resistor and choose the next one you used. Record its voltage in Table 3.1 as in step5. Continue this process until you have completed all of the resistors.
Experiment 3: Ohm’s Law
Figure 3.1bFigure 3.1a
Red (+)
Black (-)
Red (+)
Black (-)

10
Basic Electricity 012-04367E
Resistance, Ω Current, amp Voltage, volt Voltage/Resistance
Table 3.1
1st Digit2nd Digit
No. of ZerosTolerance
0123456789
BlackBrownRedOrangeYellowGreenBlueVioletGrayWhite
NoneSilverGoldRed
±20%±10%±5%±2%
Fourth Band
Figure 3.2
Data Processing
➀ Construct a graph of Current (vertical axis) vs Resistance.
➁ For each of your sets of data, calculate the ratio of Voltage/Resistance. Compare the valuesyou calculate with the measured values of the current.
Discussion
➀ From your graph, what is the mathematical relationship between Current and Resistance?
➁ Ohm’s Law states that current is given by the ratio of voltage/resistance. Does your dataconcur with this?
➂ What were possible sources of experimental error in this lab? Would you expect each tomake your results larger or to make them smaller?
Reference

11
012-04367E Basic Electricity
Purpose
The purpose of this lab is to begin experimenting with the variables that contribute to the opera-tion of an electrical circuit. This is the first of a three connected labs.
Procedure
➀ Choose the three resistors having the same value. Enter those sets of colors in Table 4.1 below.We will refer to one as #1, another as #2 and the third as #3.
➁ Determine the coded value of your resistors. Enter the value in the column labeled “CodedResistance” in Table 4.1. Enter the Tolerance value as indicated by the color of the fourth bandunder “Tolerance.”
➂ Use the Multimeter to measure the resistance of each of your three resistors. Enter these valuesin Table 4.1.
➃ Determine the percentage experimental error of each resistance value and enter it in the appropri-ate column.
Experimental Error = [(|Measured - Coded|) / Coded ] x 100%.
➄ Now connect the three resistors into the SERIES CIRCUIT, figure 4.1, using the spring clips onthe Circuits Experiment Board to hold the leads of the resistors together without bending them.Measure the resistances of the combinations as indicated on the diagram by connecting the leadsof the Multimeter between the points at the ends of the arrows.
EQUIPMENT NEEDED:
-Circuits Experiment Boar- Multimeter-Resistors.
Experiment 4: Resistances in Circuits
#1
#2
#3
Colors1st 2nd 3rd 4th Resistance
MeasuredResistance
CodedError
%Tolerance
Table 4.1

12
Basic Electricity 012-04367E
Series
➅ Construct a PARALLEL CIRCUIT, first using combinations of two of the resistors, and thenusing all three. Measure and record your values for these circuits.
Parallel
NOTE: Include also R13
➆ Connect the COMBINATIONCIRCUIT below and measurethe various combinations ofresistance. Do these followthe rules as you discoveredthem before?
R1
R2 3
R123
R3
R1 =
R23 =
R123=
R2
Figure 4.3
R1 R
2 R3
R23=
R12=
R123=
Figure 4.1
R23=
R12=
R123=
R12
Figure 4.2
R12
R123
R23
R2
R3
R1
R1
Combination
⑧ Choose three resistors having different values. Repeat steps 1 through 7 as above, recordingyour data in the spaces on the next page. Note we have called these resistors A, B and C.
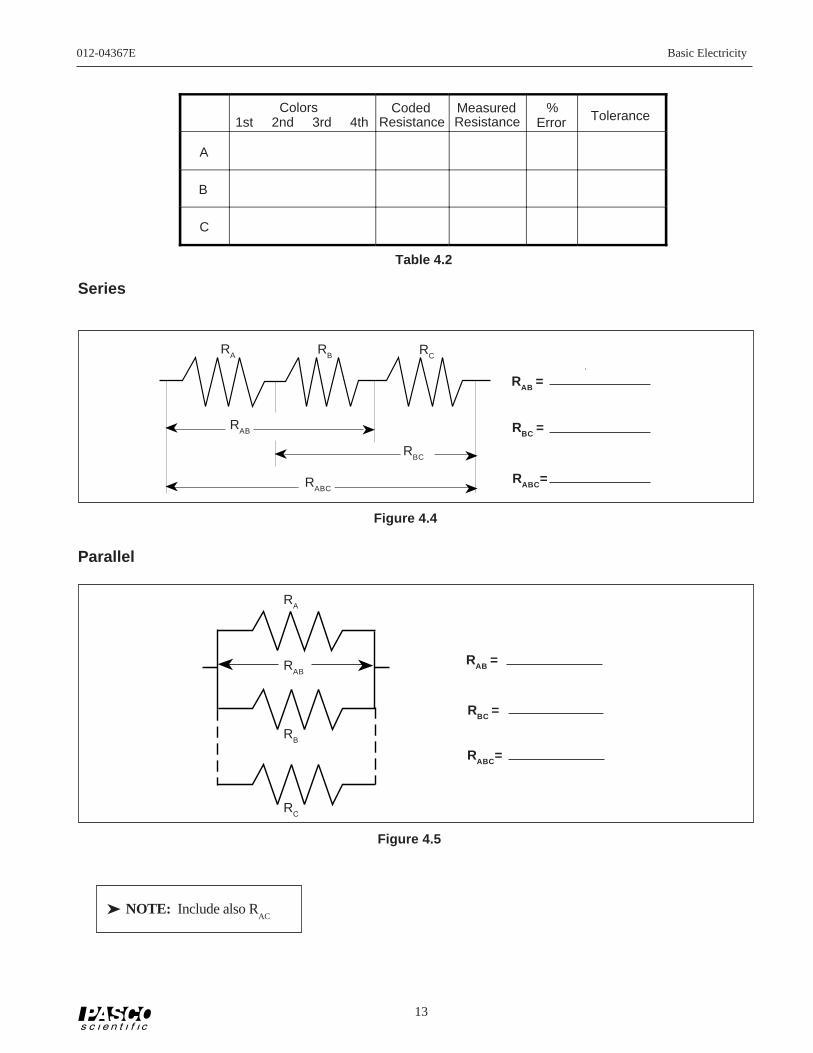
13
012-04367E Basic Electricity
Colors1st 2nd 3rd 4th Resistance
MeasuredResistance
CodedError
%Tolerance
B
A
C
RA R
B
RAB
RC
RABC
RBC
RABC=
RBC =
RAB =
Series
Parallel
NOTE: Include also RAC
RC
RA
RAB
RB
RAB =
RBC =
RABC=
Figure 4.5
Figure 4.4
Table 4.2

14
Basic Electricity 012-04367E
Combination
Discussion
➀ How does the % error compare to the coded tolerance for your resistors?
➁ What is the apparent rule for combining equal resistances in series circuits? In parallelcircuits? Cite evidence from your data to support your conclusions.
➂ What is the apparent rule for combining unequal resistances in series circuits? In parallelcircuits? Cite evidence from your data to support your conclusions.
➃ What is the apparent rule for the total resistance when resistors are added up in series? Inparallel? Cite evidence from your data to support your conclusions.
Extension
Using the same resistance values as you used before plus any wires needed to help build thecircuit, design and test the resistance values for another combination of three resistors. Asinstructed, build circuits with four and five resistors, testing the basic concepts you discov-ered in this lab.
Reference
RB
RA
RA
RABC
RC
RABC=
RBC =
RA =
RBC
Figure 4.6
1st Digit2nd Digit
No. of ZerosTolerance
0123456789
BlackBrownRedOrangeYellowGreenBlueVioletGrayWhite
NoneSilverGoldRed
±20%±10%±5%±2%
Fourth Band
Figure 4.7
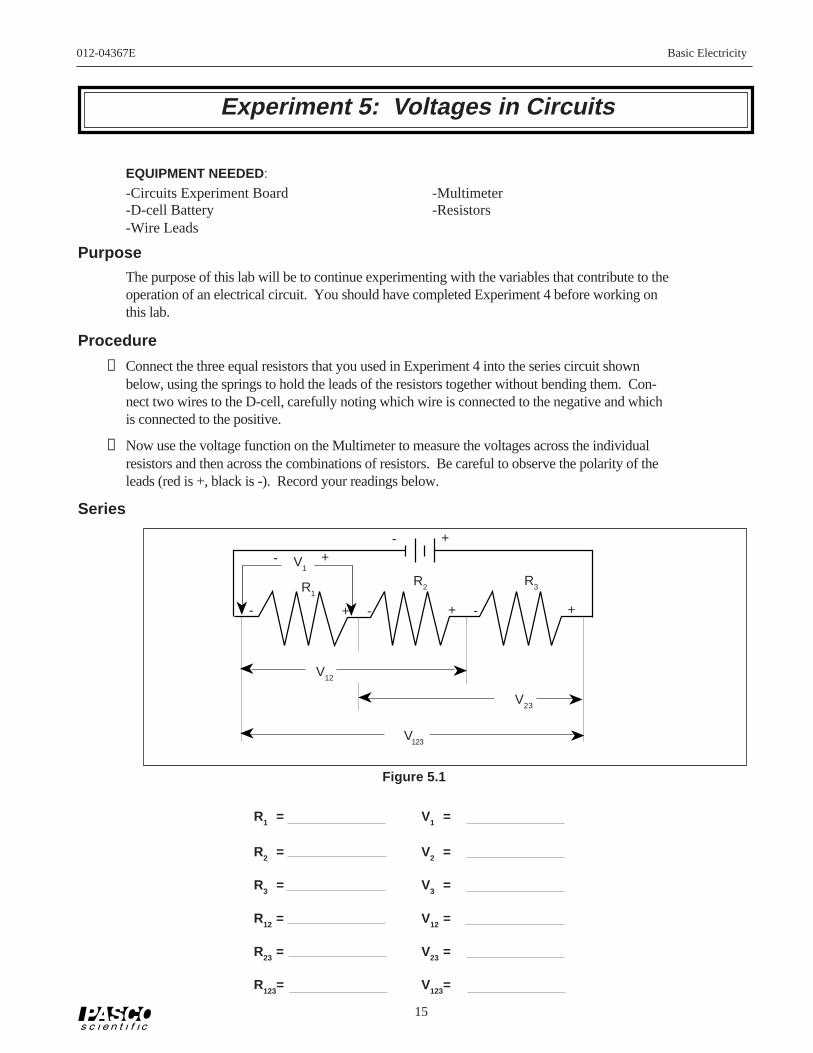
15
012-04367E Basic Electricity
EQUIPMENT NEEDED:
-Circuits Experiment Board -Multimeter-D-cell Battery -Resistors-Wire Leads
Purpose
The purpose of this lab will be to continue experimenting with the variables that contribute to theoperation of an electrical circuit. You should have completed Experiment 4 before working onthis lab.
Procedure
➀ Connect the three equal resistors that you used in Experiment 4 into the series circuit shownbelow, using the springs to hold the leads of the resistors together without bending them. Con-nect two wires to the D-cell, carefully noting which wire is connected to the negative and whichis connected to the positive.
➁ Now use the voltage function on the Multimeter to measure the voltages across the individualresistors and then across the combinations of resistors. Be careful to observe the polarity of theleads (red is +, black is -). Record your readings below.
Series
R1
R1 = V1 =
R2 = V2 =
R3 = V3 =
R12 = V12 =
R23 = V23 =
R123= V123=
Figure 5.1
- -
V1
R2
R3
V23
V12
V123
+ +-+
- +
+-
Experiment 5: Voltages in Circuits

16
Basic Electricity 012-04367E
➂ Now connect the parallel circuit below, using all three resistors. Measure the voltage acrosseach of the resistors and the combination, taking care with the polarity as before.
NOTE: Keep all three resistors connected throughout the time you are making yourmeasurements. Write down your values as indicated below.
Parallel
➃ Now connect the circuit below and measure the voltages. You can use the resistance read-ings you took in Experiment 4 for this step.
Combination
➄ Use the three unequal resistors that you used in Experiment 4 to construct the circuits shownbelow. Make the same voltage measurements that you were asked to make before in steps 1to 4. Use the same resistors for A, B and C that you used in Experiment 4.
V1
R1
R2
R3
- +
R123=
R1 =
R2 =
R3 =
V1 =
V2 =
V123=
V3 =
Figure 5.2
Figure 5.3
- +
R2
R1
R3
V1 V
23
V123
R123 =
R1 = V1 =
V23 =
V123 =
R23 =

17
012-04367E Basic Electricity
- + +
-
RA R
BR
C
VAB
VABC
-
+- VA
-
VBC
+
+
Figure 5.4
Series
RABC=
VA =
VB =
VABC=
VC =RC =
RB =
RA =
VA
RC
RA
RB
- +
Parallel
Figure 5.5
RA = VA =
RB = VB =
RC = VC =
RAB = VAB =
RBC = VBC =
RABC= VABC=

18
Basic Electricity 012-04367E
Combination
Discussion
On the basis of the data you recorded on the table with Figure 5.1, what is the pattern for howvoltage gets distributed in a series circuit with equal resistances? According to the data yourecorded with Figure 5.4, what is the pattern for how voltage gets distributed in a seriescircuit with unequal resistances? Is there any relationship between the size of the resistanceand the size of the resulting voltage?
Utilizing the data from Figure 5.2, what is the pattern for how voltage distributes itself in aparallel circuit for equal resistances? Based on the data from Figure 5.5, what is the patternfor how voltage distributes itself in a parallel circuit for unequal resistances? Is there anyrelationship between the size of the resistance and the size of the resulting voltage?
Do the voltages in your combination circuits (see Figures 5.3 and 5.6) follow the same rulesas they did in your circuits which were purely series or parallel? If not, state the rules you seein operation.
RABC=
RBC = VBC =
- +
RB
RA
RC
VA V
BC
VABC
RA =
VABC =
VA =
Figure 5.6

19
012-04367E Basic Electricity
Experiment 6: Currents in Circuits
EQUIPMENT NEEDED:
-Circuits Experiment Board -Digital Multimeter-Resistors -D-cell Battery-Wire Leads.
Purpose
The purpose of this lab will be to continue experimenting with the variables that contribute to theoperation of electrical circuits.
Procedure
➀ Connect the same three resistors that you used in Experiments 3 and 4 into the series circuit shownbelow, using the springs to hold the leads of the resistors together without bending them. Connecttwo wires to the D-cell, and carefully note which lead is negative and which is positive.
Series
➁ Now change the leads in your DMM so thatthey can be used to measure current. Youshould be using the scale which goes to amaximum of 200 mA. Be careful to observethe polarity of the leads (red is +, black is -). Inorder to measure current, the circuit must beinterrupted, and the current allowed to flowthrough the meter. Disconnect the lead wirefrom the positive terminal of the battery andconnect it to the red (+) lead of the meter.Connect the black (-) lead to R
1, where the wire
originally was connected. Record your readingin the table as I
o. See Figure 6.2.
➂ Now move the DMM to the positions indicatedin Figure 6.3, each time interrupting the circuit,and carefully measuring the current in eachone. Complete the table on the top of the backpage.
NOTE: You will be carrying values from Experiments 3 and 4 into the table on the back.
Figure 6.1
+ -
- + - -
R1 R
2 R3
++
Figure 6.2
- +
-
R1
+
- +
R3R
2
I0
+-
+ -
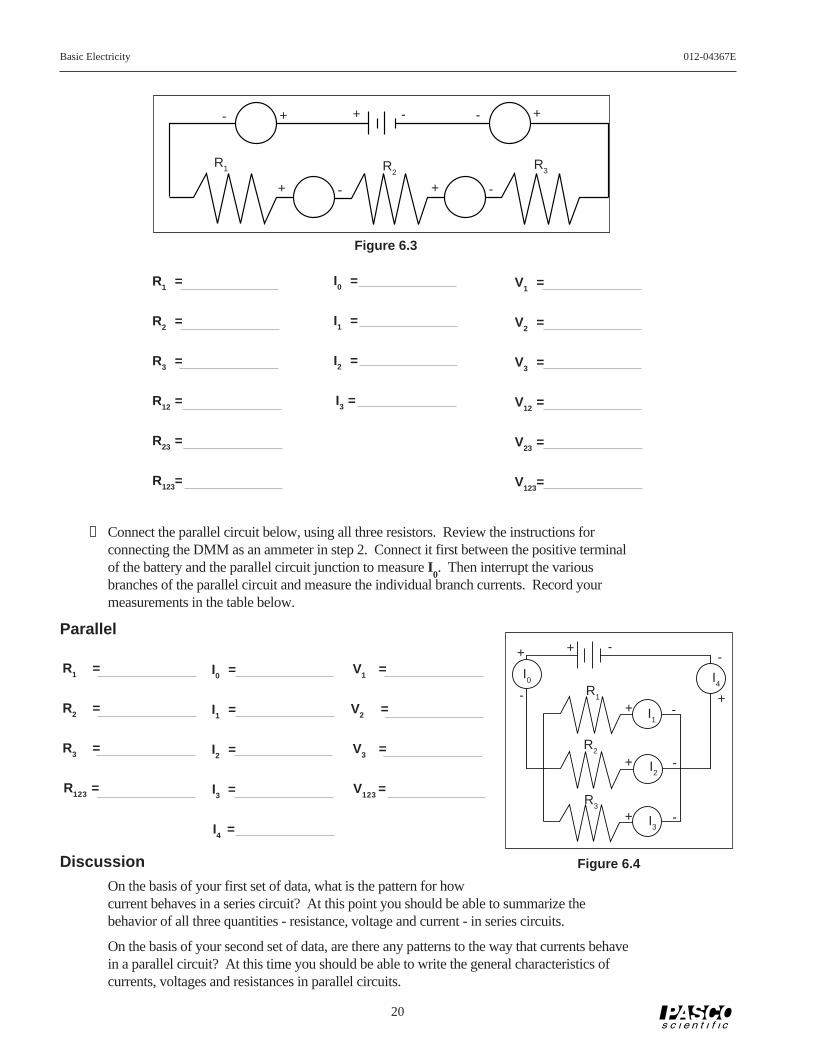
Basic Electricity 012-04367E
20
➃ Connect the parallel circuit below, using all three resistors. Review the instructions forconnecting the DMM as an ammeter in step 2. Connect it first between the positive terminalof the battery and the parallel circuit junction to measure I
0. Then interrupt the various
branches of the parallel circuit and measure the individual branch currents. Record yourmeasurements in the table below.
Parallel
Discussion
On the basis of your first set of data, what is the pattern for howcurrent behaves in a series circuit? At this point you should be able to summarize thebehavior of all three quantities - resistance, voltage and current - in series circuits.
On the basis of your second set of data, are there any patterns to the way that currents behavein a parallel circuit? At this time you should be able to write the general characteristics ofcurrents, voltages and resistances in parallel circuits.
Figure 6.3
I3
I0
I2
I1
R2
- + + - - +
R3
R1
-+ + -
R1 =
R2 =
R3 =
R123 =
I0 =
I1 =
I2 =
I3 =
I4 =
V1 =
V2 =
V3 =
V123 =
R2
R1
+ --
I4
I0
+
+ I1
-
+ -I2
-+ I3
R3
- +
Figure 6.4
R1 =
R2 =
R3 =
R12 =
R23 =
R123=
I0 =
I1 =
I2 =
I3 =
V1 =
V2 =
V3 =
V12 =
V23 =
V123=
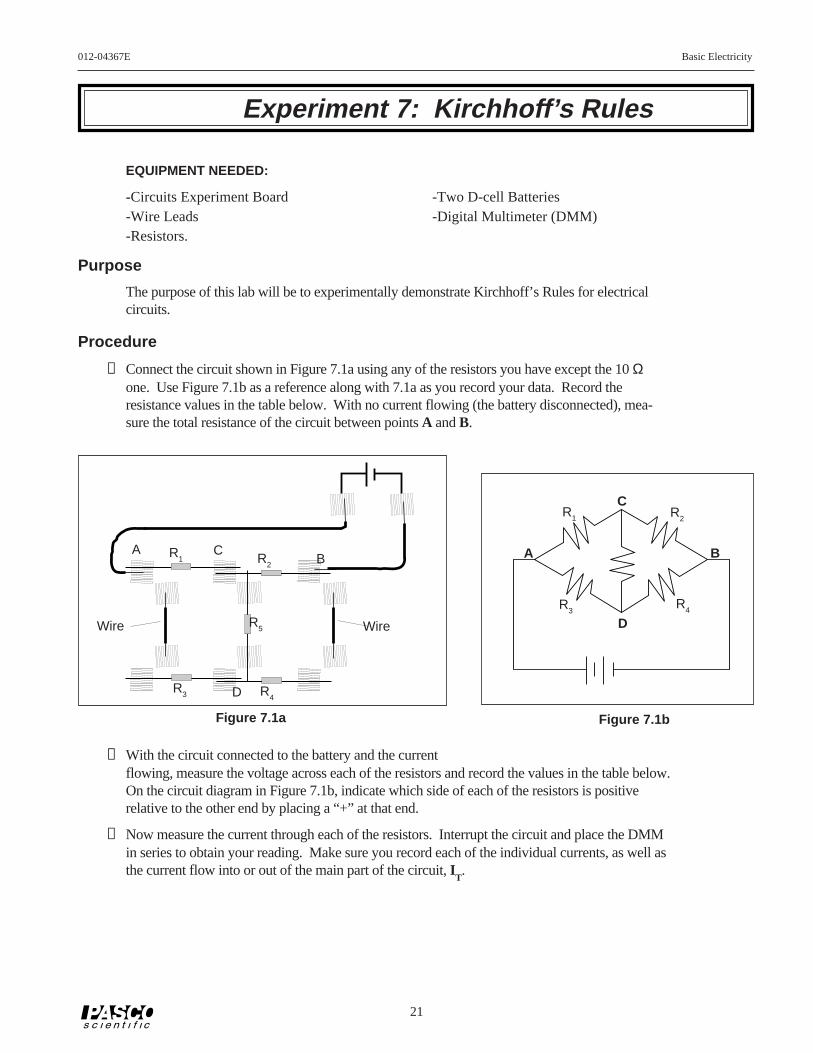
21
012-04367E Basic Electricity
EQUIPMENT NEEDED:
-Circuits Experiment Board -Two D-cell Batteries-Wire Leads -Digital Multimeter (DMM)-Resistors.
Purpose
The purpose of this lab will be to experimentally demonstrate Kirchhoff’s Rules for electricalcircuits.
Procedure
➀ Connect the circuit shown in Figure 7.1a using any of the resistors you have except the 10 Ωone. Use Figure 7.1b as a reference along with 7.1a as you record your data. Record theresistance values in the table below. With no current flowing (the battery disconnected), mea-sure the total resistance of the circuit between points A and B.
➁ With the circuit connected to the battery and the currentflowing, measure the voltage across each of the resistors and record the values in the table below.On the circuit diagram in Figure 7.1b, indicate which side of each of the resistors is positiverelative to the other end by placing a “+” at that end.
➂ Now measure the current through each of the resistors. Interrupt the circuit and place the DMMin series to obtain your reading. Make sure you record each of the individual currents, as well asthe current flow into or out of the main part of the circuit, I
T.
Experiment 7: Kirchhoff’s Rules
C
D
A BR
5
R1 R2
R3
R4
Figure 7.1b
A R1
CR
2 B
R5
R3 R
4D
WireWire
Figure 7.1a
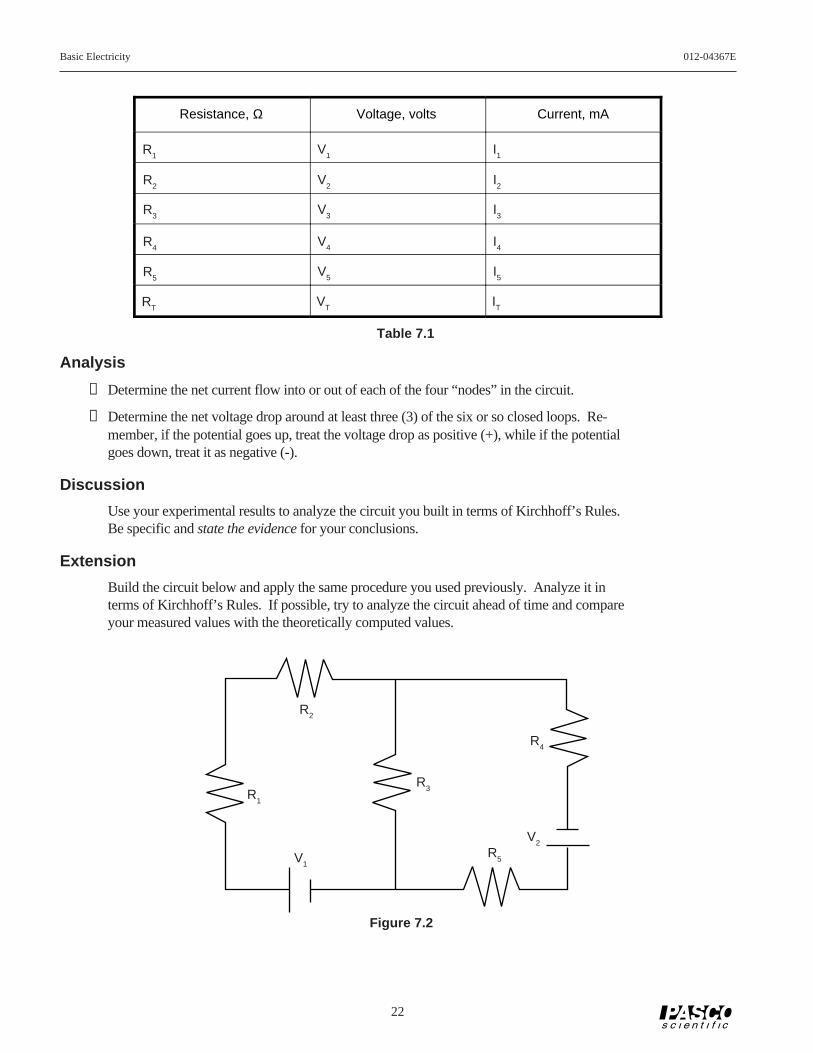
Basic Electricity 012-04367E
22
Analysis
➀ Determine the net current flow into or out of each of the four “nodes” in the circuit.
➁ Determine the net voltage drop around at least three (3) of the six or so closed loops. Re-member, if the potential goes up, treat the voltage drop as positive (+), while if the potentialgoes down, treat it as negative (-).
Discussion
Use your experimental results to analyze the circuit you built in terms of Kirchhoff’s Rules.Be specific and state the evidence for your conclusions.
Extension
Build the circuit below and apply the same procedure you used previously. Analyze it interms of Kirchhoff’s Rules. If possible, try to analyze the circuit ahead of time and compareyour measured values with the theoretically computed values.
Resistance, Ω Voltage, volts Current, mA
R1
R2
R3
R4
R5
RT
V1
V2
V3
V4
V5
VT
I1
I2
I3
I4
I5
IT
Table 7.1
R2
R4
R1
R3
R5V1
V2
Figure 7.2

23
012-04367E Basic Electricity
Purpose
The purpose of this lab will be to determine how capacitors behave in R-C circuits. The manner inwhich capacitors combine will also be studied.
Procedure
➀ Connect the circuit shown in Figure 8.1, using a 100-K Ω resistor and a 100-µF capacitor. Use oneof the spring clips from the transistor socket as a “switch” as shown. Connect the VTVM so theblack “ground” lead is on the side of the capacitor that connects to the negative terminal of thebattery and set it so that it reads to a maximum of 1.5 V DC.
➁ Start with no voltage on the capacitor andthe wire from the “switch” to the circuitdisconnected. If there is a remainingvoltage on the capacitor, use a piece ofwire to “short” the two leads together,draining any remaining charge. (Touchthe ends of the wire to points B and C asshown in Figure 1 to discharge thecapacitor.)
➂ Now close the “switch” by touching thewire to the spring clip. Observe thevoltage readings on the VTVM, thevoltage across the capacitor. How wouldyou describe the manner in which thevoltage changes?
➃ If you now open the “switch” by removing the wire from the spring clip, the capacitor shouldremain at its present voltage with a very slow drop over time. This indicates that the charge youplaced on the capacitor has no way to move back to neutralize the excess charges on the twoplates.
➄ Connect a wire between points A and C in the circuit, allowing the charge to drain back throughthe resistor. Observe the voltage readings on the VTVM as the charge flows back. How wouldyou describe the manner in which the voltage falls? (It would be reasonable to sketch a graphshowing the manner in which the voltage rose over time as well as the manner in which it fell over time.)
➅ Repeat steps 3-5 until you have a good feeling for the process of charging and discharging of acapacitor through a resistance.
➆ Now repeat steps 3-5, this time recording the time taken to move from 0.0 volts to 0.95 volts whilecharging, t
C, and the time taken to move from 1.5 volts to 0.55 volts while discharging, t
D. Record
your times along with the resistance and capacitance values in Table 8.1 at the top of the back page.
Experiment 8: Capacitors in Circuits
EQUIPMENT NEEDED:
– Vacuum Tube Voltmeter (VTVM) or Elec-trometer (ES-9054B) or Digital Multimeter(DMM) that has an input impedance of 10 MΩor greater.
– Circuits Experiment Board– Capacitors, Resistors– Wire Leads– D-cell Battery– Stopwatch or timer with 0.1 sec resolution.
V
Resistor
C
B
ACapacitor
“Switch”
+ -
Figure 8.1

Basic Electricity 012-04367E
24
⑧ Replace the 100-µF capacitor with a 330-µF capacitor. Repeat step 7, recording the charging anddischarging times in Table 8.1. If a third value is available, include it in the data table, too.
⑨ Return to the original 100-µF capacitor, but put a 220-K Ω resistor in the circuit. Repeat step 7,recording your data in Table 8.1. If a third resistor is provided, use it in the circuit, recording thedata.
NOTE:
➀ What is the effect on charging and discharging times if the capacitance is increased? Whatmathematical relationship exists between your times and the capacitance?
➁ What is the effect on charging and discharging times if the resistance of the circuit is increased?What mathematical relationship exists between your times and the resistance?
➉ Return to the original 100-K Ω resistor, but use the 100-µF capacitor in series with the 330-µFcapacitor. Repeat step 7, recording your results in Table 8.2.
11 Now repeat step 7, but with the 100-µF and the 330-µF capacitors in parallel.
R = __________ C1 = __________C
2 = __________
NOTE: What is the effect on the total capacitance if capacitors are combined in series? What ifthey are combined in parallel? (Refer to Table 8.2).
Trial Resistance Capacitance
1
2
3
4
5
6
7
8
tC t
D
Table 8.1
Table 8.2
Type of Circuit
Series
Parallel
tC t
D
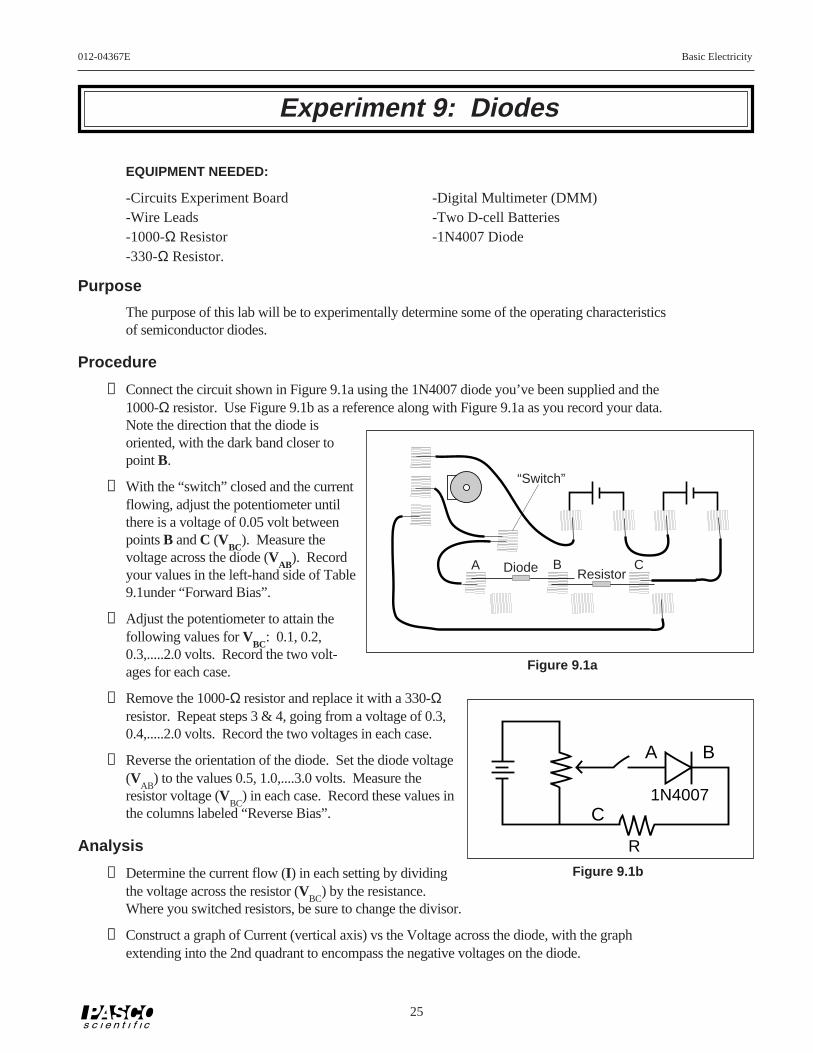
25
012-04367E Basic Electricity
“Switch”
Diode ResistorA B C
Figure 9.1b
Figure 9.1a
Experiment 9: Diodes
EQUIPMENT NEEDED:
-Circuits Experiment Board -Digital Multimeter (DMM)-Wire Leads -Two D-cell Batteries-1000-Ω Resistor -1N4007 Diode-330-Ω Resistor.
Purpose
The purpose of this lab will be to experimentally determine some of the operating characteristicsof semiconductor diodes.
Procedure
➀ Connect the circuit shown in Figure 9.1a using the 1N4007 diode you’ve been supplied and the1000-Ω resistor. Use Figure 9.1b as a reference along with Figure 9.1a as you record your data.Note the direction that the diode isoriented, with the dark band closer topoint B.
➁ With the “switch” closed and the currentflowing, adjust the potentiometer untilthere is a voltage of 0.05 volt betweenpoints B and C (V
BC). Measure the
voltage across the diode (VAB
). Recordyour values in the left-hand side of Table9.1under “Forward Bias”.
➂ Adjust the potentiometer to attain thefollowing values for V
BC: 0.1, 0.2,
0.3,.....2.0 volts. Record the two volt-ages for each case.
➃ Remove the 1000-Ω resistor and replace it with a 330-Ωresistor. Repeat steps 3 & 4, going from a voltage of 0.3,0.4,.....2.0 volts. Record the two voltages in each case.
➄ Reverse the orientation of the diode. Set the diode voltage(V
AB) to the values 0.5, 1.0,....3.0 volts. Measure the
resistor voltage (VBC
) in each case. Record these values inthe columns labeled “Reverse Bias”.
Analysis
➀ Determine the current flow (I) in each setting by dividingthe voltage across the resistor (V
BC) by the resistance.
Where you switched resistors, be sure to change the divisor.
➁ Construct a graph of Current (vertical axis) vs the Voltage across the diode, with the graphextending into the 2nd quadrant to encompass the negative voltages on the diode.
A B
C1N4007
R

Basic Electricity 012-04367E
26
Discussion
Discuss the shape of your graph and what it means for the operation of a semiconductordiode. Did the diode operate the same in steps 3 and 4 as it did in step 5? In steps 3 and 4the diode was “Forward Biased”, while it was “Reverse Biased” in step 5. Based on yourdata, what do you think these terms mean? What use might we have for diodes?
Sample Data Table
Diode Type ____________
Forward Bias Reverse Bias
Extensions
➀ If your instructor has a zener diode, carry out the same investigations that you did above.What differences are there in basic diodes and zener diodes?
➁ Use an LED (light emitting diode) to carry out the same investigations. What differencesare there between basic diodes and LED’s?
R, Ω VAB
, volts VBC
, volts I, mA R, Ω VAB
, volts VBC
, volts I, mA
Table 9.1
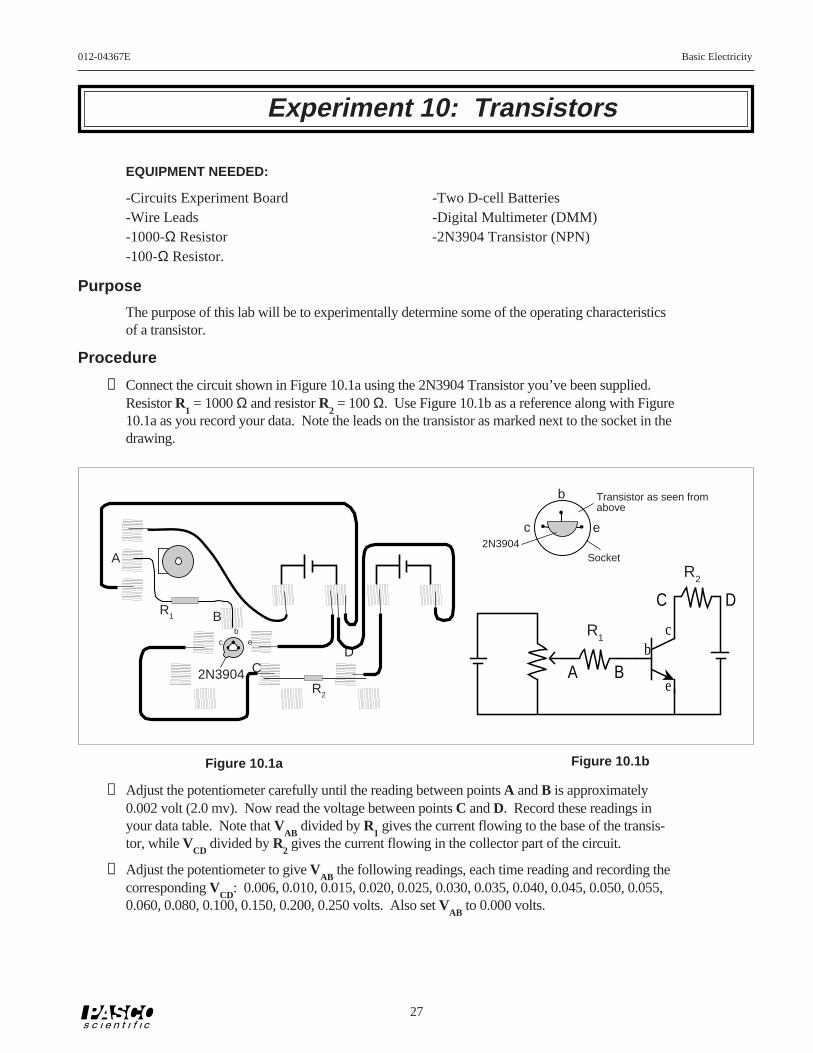
27
012-04367E Basic Electricity
EQUIPMENT NEEDED:
-Circuits Experiment Board -Two D-cell Batteries-Wire Leads -Digital Multimeter (DMM)-1000-Ω Resistor -2N3904 Transistor (NPN)-100-Ω Resistor.
Purpose
The purpose of this lab will be to experimentally determine some of the operating characteristicsof a transistor.
Procedure
➀ Connect the circuit shown in Figure 10.1a using the 2N3904 Transistor you’ve been supplied.Resistor R
1 = 1000 Ω and resistor R
2 = 100 Ω. Use Figure 10.1b as a reference along with Figure
10.1a as you record your data. Note the leads on the transistor as marked next to the socket in thedrawing.
➁ Adjust the potentiometer carefully until the reading between points A and B is approximately0.002 volt (2.0 mv). Now read the voltage between points C and D. Record these readings inyour data table. Note that V
AB divided by R
1 gives the current flowing to the base of the transis-
tor, while VCD
divided by R2 gives the current flowing in the collector part of the circuit.
➂ Adjust the potentiometer to give VAB
the following readings, each time reading and recording thecorresponding V
CD: 0.006, 0.010, 0.015, 0.020, 0.025, 0.030, 0.035, 0.040, 0.045, 0.050, 0.055,
0.060, 0.080, 0.100, 0.150, 0.200, 0.250 volts. Also set VAB
to 0.000 volts.
Experiment 10: Transistors
Figure 10.1a Figure 10.1b
A B
C D
bc
e
e
b
c
Transistor as seen fromabove
Socket2N3904
A
R1 B
C2N3904
D
R2
c eb
R2
R1

Basic Electricity 012-04367E
28
Analysis
➀ For each of your sets of readings, calculate:
IB = V
AB / R
1 and I
C = V
CD / R
2
Record all of your current readings in mA.
➁ Plot a graph of IC (vertical axis) vs I
B. If you find an area or areas where you need more
points to fill out any curves or sudden changes, simply return to step 2 and make the appro-priate measurements.
➂ What is the general shape of the graph? Is there a straight-line region? Does it go throughthe origin? Why or why not? Relate the behavior of the transistor at the beginning of thegraph to the behavior of the diode in Experiment 9.
➃ What does the leveling off of the graph indicate? Electronics people refer to the transistor asbeing “saturated”. How would you describe saturation based on your experiment?
➄ Find the slope of the straight-line region of the graph. This ratio - IC / I
B is referred to as
the current amplification of the transistor. It describes how many times greater changes inthe collector current are than the changes in the base current. Report the current amplifica-tion of your transistor.
Discussion
Discuss the graph and the calculations you did in the Analysis section.
Sample Data Table
Transistor Type ____________
Extensions
➀ What effect would changing the resistance in the collector circuit (R2) make? Try changing
the value to 330 Ω or 560 Ω. Does the graph have the same shape? Is the current amplifica-tion the same as before? How does the amplification depend on R
2?
➁ Obtain a different transistor and repeat the measurements you made in steps 2 & 3. If it is aPNP transistor, you will need to reverse the wires coming from the D-cells as the emitterneeds to be positive, not negative, and the collector will be negative.
Table 10.1
R1, Ω V
AB, volts I
B, mA R
2, Ω V
CD, volts I
C, mA
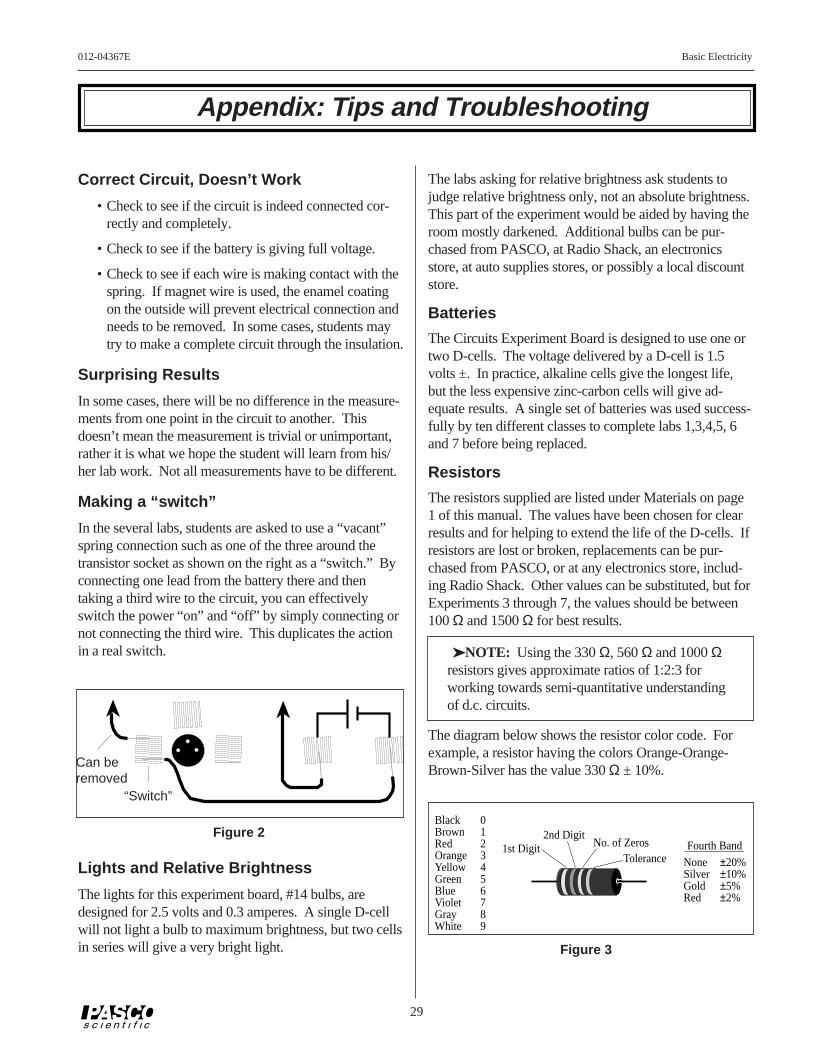
29
012-04367E Basic Electricity
The labs asking for relative brightness ask students tojudge relative brightness only, not an absolute brightness.This part of the experiment would be aided by having theroom mostly darkened. Additional bulbs can be pur-chased from PASCO, at Radio Shack, an electronicsstore, at auto supplies stores, or possibly a local discountstore.
Batteries
The Circuits Experiment Board is designed to use one ortwo D-cells. The voltage delivered by a D-cell is 1.5volts ±. In practice, alkaline cells give the longest life,but the less expensive zinc-carbon cells will give ad-equate results. A single set of batteries was used success-fully by ten different classes to complete labs 1,3,4,5, 6and 7 before being replaced.
Resistors
The resistors supplied are listed under Materials on page1 of this manual. The values have been chosen for clearresults and for helping to extend the life of the D-cells. Ifresistors are lost or broken, replacements can be pur-chased from PASCO, or at any electronics store, includ-ing Radio Shack. Other values can be substituted, but forExperiments 3 through 7, the values should be between100 Ω and 1500 Ω for best results.
NOTE: Using the 330 Ω, 560 Ω and 1000 Ωresistors gives approximate ratios of 1:2:3 forworking towards semi-quantitative understandingof d.c. circuits.
The diagram below shows the resistor color code. Forexample, a resistor having the colors Orange-Orange-Brown-Silver has the value 330 Ω ± 10%.
Appendix: Tips and Troubleshooting
Correct Circuit, Doesn’t Work
• Check to see if the circuit is indeed connected cor-rectly and completely.
• Check to see if the battery is giving full voltage.
• Check to see if each wire is making contact with thespring. If magnet wire is used, the enamel coatingon the outside will prevent electrical connection andneeds to be removed. In some cases, students maytry to make a complete circuit through the insulation.
Surprising Results
In some cases, there will be no difference in the measure-ments from one point in the circuit to another. Thisdoesn’t mean the measurement is trivial or unimportant,rather it is what we hope the student will learn from his/her lab work. Not all measurements have to be different.
Making a “switch”
In the several labs, students are asked to use a “vacant”spring connection such as one of the three around thetransistor socket as shown on the right as a “switch.” Byconnecting one lead from the battery there and thentaking a third wire to the circuit, you can effectivelyswitch the power “on” and “off” by simply connecting ornot connecting the third wire. This duplicates the actionin a real switch.
Lights and Relative Brightness
The lights for this experiment board, #14 bulbs, aredesigned for 2.5 volts and 0.3 amperes. A single D-cellwill not light a bulb to maximum brightness, but two cellsin series will give a very bright light.
“Switch”
Figure 2
Can beremoved
1st Digit2nd Digit
No. of ZerosTolerance
0123456789
BlackBrownRedOrangeYellowGreenBlueVioletGrayWhite
NoneSilverGoldRed
±20%±10%±5%±2%
Fourth Band
Figure 3
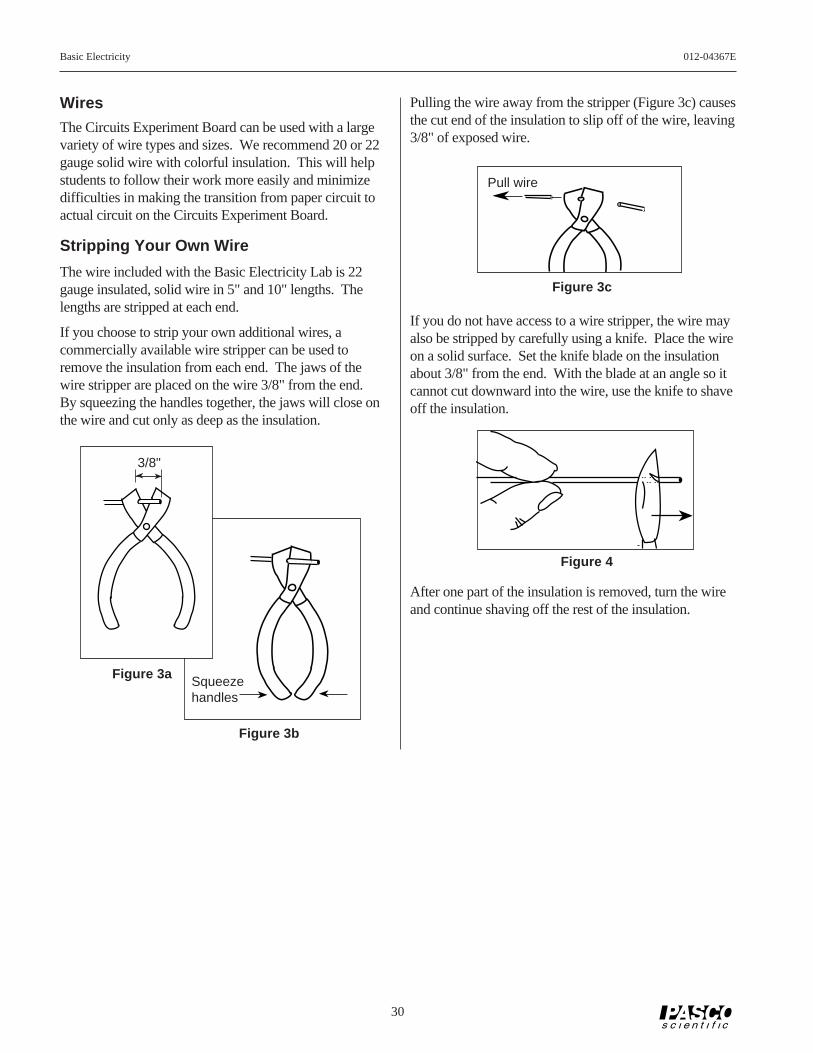
Basic Electricity 012-04367E
30
Wires
The Circuits Experiment Board can be used with a largevariety of wire types and sizes. We recommend 20 or 22gauge solid wire with colorful insulation. This will helpstudents to follow their work more easily and minimizedifficulties in making the transition from paper circuit toactual circuit on the Circuits Experiment Board.
Stripping Your Own Wire
The wire included with the Basic Electricity Lab is 22gauge insulated, solid wire in 5" and 10" lengths. Thelengths are stripped at each end.
If you choose to strip your own additional wires, acommercially available wire stripper can be used toremove the insulation from each end. The jaws of thewire stripper are placed on the wire 3/8" from the end.By squeezing the handles together, the jaws will close onthe wire and cut only as deep as the insulation.
Figure 3a Squeezehandles
3/8"
Figure 3b
Pulling the wire away from the stripper (Figure 3c) causesthe cut end of the insulation to slip off of the wire, leaving3/8" of exposed wire.
If you do not have access to a wire stripper, the wire mayalso be stripped by carefully using a knife. Place the wireon a solid surface. Set the knife blade on the insulationabout 3/8" from the end. With the blade at an angle so itcannot cut downward into the wire, use the knife to shaveoff the insulation.
After one part of the insulation is removed, turn the wireand continue shaving off the rest of the insulation.
Figure 3c
Figure 4
Pull wire
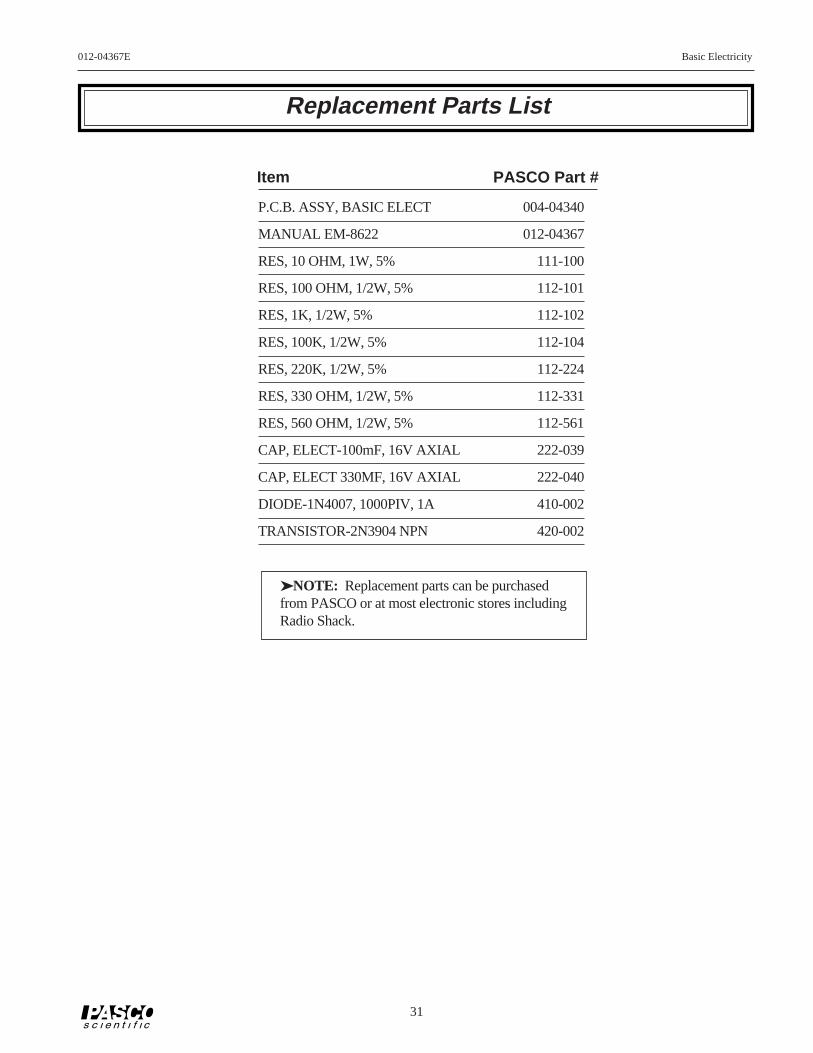
31
012-04367E Basic Electricity
PASCO Part #Item
Replacement Parts List
P.C.B. ASSY, BASIC ELECT 004-04340
MANUAL EM-8622 012-04367
RES, 10 OHM, 1W, 5% 111-100
RES, 100 OHM, 1/2W, 5% 112-101
RES, 1K, 1/2W, 5% 112-102
RES, 100K, 1/2W, 5% 112-104
RES, 220K, 1/2W, 5% 112-224
RES, 330 OHM, 1/2W, 5% 112-331
RES, 560 OHM, 1/2W, 5% 112-561
CAP, ELECT-100mF, 16V AXIAL 222-039
CAP, ELECT 330MF, 16V AXIAL 222-040
DIODE-1N4007, 1000PIV, 1A 410-002
TRANSISTOR-2N3904 NPN 420-002
NOTE: Replacement parts can be purchasedfrom PASCO or at most electronic stores includingRadio Shack.

Basic Electricity 012-04367E
32
Notes
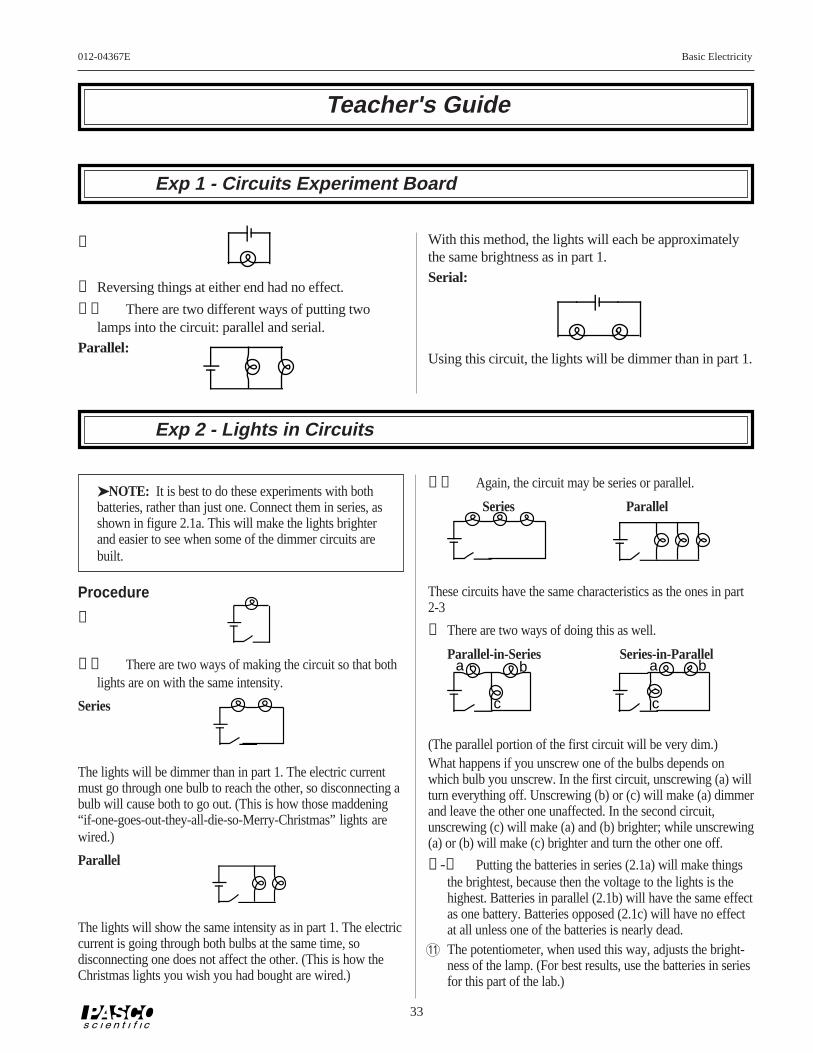
33
012-04367E Basic Electricity
Teacher's Guide
Exp 1 - Circuits Experiment Board
➀
➁ Reversing things at either end had no effect.
➃➄ There are two different ways of putting twolamps into the circuit: parallel and serial.
Parallel:
With this method, the lights will each be approximatelythe same brightness as in part 1.
Serial:
Using this circuit, the lights will be dimmer than in part 1.
NOTE: It is best to do these experiments with bothbatteries, rather than just one. Connect them in series, asshown in figure 2.1a. This will make the lights brighterand easier to see when some of the dimmer circuits arebuilt.
Procedure
➀
➁➂ There are two ways of making the circuit so that bothlights are on with the same intensity.
Series
The lights will be dimmer than in part 1. The electric currentmust go through one bulb to reach the other, so disconnecting abulb will cause both to go out. (This is how those maddening“if-one-goes-out-they-all-die-so-Merry-Christmas” lights arewired.)
Parallel
The lights will show the same intensity as in part 1. The electriccurrent is going through both bulbs at the same time, sodisconnecting one does not affect the other. (This is how theChristmas lights you wish you had bought are wired.)
➃➄ Again, the circuit may be series or parallel.
Series Parallel
These circuits have the same characteristics as the ones in part2-3
➅ There are two ways of doing this as well.
Parallel-in-Series Series-in-Parallela b
c
a b
c
(The parallel portion of the first circuit will be very dim.)What happens if you unscrew one of the bulbs depends onwhich bulb you unscrew. In the first circuit, unscrewing (a) willturn everything off. Unscrewing (b) or (c) will make (a) dimmerand leave the other one unaffected. In the second circuit,unscrewing (c) will make (a) and (b) brighter; while unscrewing(a) or (b) will make (c) brighter and turn the other one off.
➆-➉ Putting the batteries in series (2.1a) will make thingsthe brightest, because then the voltage to the lights is thehighest. Batteries in parallel (2.1b) will have the same effectas one battery. Batteries opposed (2.1c) will have no effectat all unless one of the batteries is nearly dead.
11 The potentiometer, when used this way, adjusts the bright-ness of the lamp. (For best results, use the batteries in seriesfor this part of the lab.)
Exp 2 - Lights in Circuits

Basic Electricity 012-04367E
34
Exp 3- Ohm's Law
Procedure
➁-➅)Warn the students to be particularly careful whensetting up the multimeter to measure current. Attach-ing an ammeter the wrong way can damage the meter.
Data ProcessingResistance Current Voltage V/R % difference
100 0.02 1.579 0.02 -1.87%
560 0.00 1.582 0.00 -2.73%
330 0.00 1.582 0.00 -3.32%
1000 0.00 1.583 0.00 -9.17%
10 0.14 1.549 0.15 -13.31%
Discussio n
➀ Current is inversely proportional to R
➁ Yes. A curve fit of the graph above gives Current =1.36 x Resistance-0.98, which is quite close to the theo-retical equation.
J
JJ J
J
0
0.02
0.04
0.06
0.08
0.1
0.12
0.14
0.16
0 200 400 600 800 1000
Cur
rent
Resistance
➂) The greatest source of error is caused by the meter it-self. Because the ammeter has some internal resis-tance, the measured current is less than the currentwhen the meter is not there.
Exp 4- Resistances in Circuits
➄ Series
R12
= 198.3ΩR
23 = 199.1Ω
R123
= 298Ω➅ Parallel
R12
= 49.7ΩR
23 = 49.9Ω
R123
= 33.3ΩR
13 = 49.8Ω
➆ Combination
R1 = 98.9Ω
R23
= 49.9ΩR
123 = 148.7Ω
Procedure
➀-➃
Colors coded measured % error tolerance
#1 brown-black-brown-gold 100 98.9 -1.10% ±0.05%
#2 brown-black-brown-gold 100 99.6 -0.40% ±0.05%
#3 brown-black-brown-gold 100 99.7 -0.30% ±0.05%
⑧ Series
RAB
= 428ΩR
BC = 891Ω
RABC
= 989ΩParallelR
AB = 76.1Ω
RBC
= 207ΩR
ABC = 67.0Ω
RAC
= 84.1ΩCombinationR
A = 98.9Ω
RBC
= 207ΩR
ABC = 306Ω

35
012-04367E Basic Electricity
Procedure
Equal Resistors:Series
measurement Resistance Voltage
1 100 0.5232 100 0.5283 100 0.527
12 200 1.05123 200 1.055
123 300 1.578Parallel
measurement Resistance Voltage
1 33.33 1.5652 33.33 1.5653 33.33 1.565
123 33.33 1.565Combination
measurement Resistance Voltage
1 100 1.04923 50 0.529
123 150 1.578
Different Resistors:Series
measurement Resistance Voltage
A 100 0.157B 330 0.526C 560 0.897
AB 430 0.685BC 890 1.423
ABC 990 1.581
Parallelmeasurement Resistance Voltage
A 67.49 1.574B 67.49 1.574C 67.49 1.574
ABC 67.49 1.574Combinationmeasurement Resistance Voltage
A 100.00 0.509BC 207.64 1.07
ABC 307.64 1.579
Discussion
In any series circuit, the voltage is distributed accordingto the size of the resistors. (Notice that the graph above,of the data from the second series circuit, shows thisdirect relationship.)
In any parallel circuit, the voltage is the same across allelements.
In the combination circuit, the voltage acts as if theparallel resistors were actually one resistor, which is thenin series with the first. The rules are the same.
Discussion
➀ The actual value matches the coded value much moreclosely than required by the tolerances.
Colors coded measured % error tolerance
A brown-black-brown-gold 100 98.9 -1.10% ±0.05%
B orange-orange-brown-gold 330 330 0.00% ±0.05%
C green-blue-brown-gold 560 561 0.18% ±0.05%
➁-➃ In series, the resistances are added.R = R
1 + R
2 + R
3 + ...In parallel, the reciprocals of the
resistances are added. 1/R = 1/R1 + 1/R
2 + 1/R
3 +...
This is evidenced in all the data sets above.
Exp 5- Voltages in Circuits
J
J
J
J
J
J
0
0.2
0.4
0.6
0.8
1
1.2
1.4
1.6
0 200 400 600 800 1000
Vol
tage
Resistance

Basic Electricity 012-04367E
36
Exp 6- Currents in Circuits
NOTE: The resistors used were:
R1 = 100Ω
R2 = 330Ω
R3 = 560Ω
These are the same resistors as were used in theprevious lab, and some of the data here originates inlab 5.
Procedure
Series:
The current was the same—1.5 mA—no matter where itwas measured in the circuit.
Parallel:
Measurement Resistance Current Voltage
1 100 0.0156 1.574
2 330 0.0047 1.574
3 560 0.0028 1.574
123 67.5 0.0229 1.574
Discussion
In any resistance circuit—series, parallel, or both—thevoltage, current, and resistance are related by Ohm’sLaw:
V = IR
This pattern, and conclusion, should be apparent instudent data.
NOTE: The product of the resistances andcurrents obtained experimentally will generally belower than the measured voltage. This is due to thenon-zero resistance of the ammeter. When themeter is in the circuit, its own resistance lessens thecurrent through that circuit. With most meters, thiserror should be less than 5% or so.
Exp 7- Kirchoff's Rules
Procedure
First circuit:
1 2
3 4
5
+
+
+
+
+
Second circuit:
+
+
+
+
+
1
2 4
3
5b1
b2
R (Ω) V (V) I (mA)
1 100 0.27 2.6
2 560 1.50 2.6
3 330 0.19 0.5
4 330 1.07 3.2
5 100 0.32 3.2
b1 1.573 2.6
b2 1.588 3.2
R (Ω) V (V) I (mA)
1 100 0.40 3.9
2 560 1.17 2.0
3 330 1.05 3.1
4 100 0.52 5.1
5 330 0.65 1.9
T 216 1.57 7.1

37
012-04367E Basic Electricity
AnalysisFirst circuit:
➀ node (1,3): 0.1 mA
node (1,2,5): 0.0 mA
node (3,4,5): -0.1 mA
node (2,4): 0.0 mA
➁ loop (1,5,3): 0.001 V
loop (1,2,4,3): 0.001 V
loop (5,2,4): 0.000 V
loop (batt,1,2): 0.001 V
loop (batt,3,4): 0.000 V
loop (batt,1,5,4): 0.001 V
loop (batt,3,5,2): 0.000 V
Second circuit:
➀ node (2,3,4): -0.1 mA
node (b1,3,5): 0.1 mA
➁ loop (b1,1,2,3) 0.001 V
loop (b2,5,3,4) 0.001 V
loop (b1,1,2,4,b2,5) 0.002 V
Discussion
Within the experimental uncertainty of the measuringdevice used (a DMM) Kirchoff’s Rules are verified. Thenet current flowing into or out of any junction is approxi-mately zero, and the sum of the voltages around any loopis approximately zero.
Exp 8- Capacitors in Circuits
Procedure
➃ The rate at which the capacitor loses its charge de-pends on the impedance of the meter used to measurethe voltage, as well as on the size of the capacitor. Forthis reason, most analog meters are not sufficient forthis lab.
➄
Vol
tage
Time
Vol
tage
Time
Charging
Discharging
➆ -11
1 1
1
1
ZZ
Z
Z
0
20
40
60
80
100
120
140
0 50 100 150 200 250 300 350 400 450
Tim
e (s
)
Capacitance (µF)
1 100,000 Ohm
Z 220,000 Ohm
NOTES:➀➁ Charging: t = - R C ln(1-V/V
o)
Discharging: t = - R C ln(V/Vo)
In either case, the time is linearly dependent onboth resistance and capacitance.➂ Parallel: C
p = C
1 + C
2Series: 1/C
s = 1/C
1 + 1/C
2

Basic Electricity 012-04367E
38
Exp 9- Diodes
Analysis
JJJJJJJJJJJJJJJ
JJJJ
J
J
J
J
J
J
J
J
J
J
J
J
J
JJJJJJ JJJJJJ OOOOOO OOOO
O
O
O
O
O
O
O
O
O
O
O
O O O OO0
0.001
0.002
0.003
0.004
0.005
0.006
0.007
-3 -2 -1 0 1 2 3
Cur
rent
Diode Voltage
J 4007
O LED
The diode acts as a one-way valve for electricity. Currentcan flow in one direction, but not in the other.
Extensions
➀ A zener diode would be similar to the 4007, exceptthat there would be a breakdown point on the reversebiasing, beyond which the current would flow. Thismakes them useful for power regulation.
➁) The LED opens up at a higher voltage than the 4007(and it lights up).
Exp 10- Transistors
Analysis➁
XX
X
X
X
X
X
X
X
X
XX
X X X X X X XX XX X X X X X X X X X
0
2
4
6
8
10
12
14
16
0 0.05 0.1 0.15 0.2
Col
lect
or C
urre
nt (m
A)
Base Current (mA)
2N3904 Transistor100 Ohm load
➂ The linear region does not include the origin, due tothe non-zero voltage that the junctions within the tran-sistor require to turn on. (Similar to the effect in lab 9)
➃ Beyond the “saturation point”, the transistor is actinglike a short circuit. It offers no resistance to the cur-rent; so beyond that point, there is no amplification.The current is limited only by the battery and resistor.
➄ The current amplification of the transistor tested was249. This value will vary from transistor to transistor;it’s usually between 150 and 250 for the 2N3904 tran-sistors supplied with the lab.
Discussion
➀ This graph shows the results of applying different val-ues for R2. The amplification remains the same ineach linear region, but the size of that linear regionchanges.
ÑÑ
ÑÑ
Ñ
ÑÑ
Ñ
ÑÑÑ
Ñ
Ñ
Ñ
Ñ
Ñ
Ñ
ÑÑ
ÑÑ
ÑÑ
ÑÑÑ
ÑÑ
ÑÑ
ÑÑ
ÑÑ
ÑÑ
ÑÑ
Ñ
ÇÇ
ÇÇ
ÇÇ
Ç
Ç
Ç
ÇÇ
ÇÇ
ÇÇ
ÇÇ
ÇÇ
ÇÇÇ
ÇÇ
ÇÇ Ç Ç
ÖÖÖÖ
Ö
ÖÖ
Ö
ÖÖ
ÖÖÖÖÖÖÖÖÖÖ ÖÖ ÖÖÖÖ ÖÖ Ö Ö Ö Ö Ö Ö Ö
áááááá áá á á á á á á á á á á á á á á á á
0
10
20
30
40
50
0 0.05 0.1 0.15 0.2 0.25 0.3 0.35 0.4
Col
lect
or C
urre
nt (
mA
)
Base Current (mA)
Ñ 10 Ohm load
Ç 47 Ohm load
Ö 100 Ohm load
á 560 Ohm load
2N3904 Transistorvarious loads
➁ The gain and/or saturation characteristics of the tran-sistor will vary, although the basic shape of the graphwill remain the same.

39
012-04367E Basic Electricity
Technical Support
Contacting Technical Support
Before you call the PASCO Technical Support staff itwould be helpful to prepare the following information:
• If your problem is computer/software related, note:
Title and Revision Date of software.
Type of Computer (Make, Model, Speed).
Type of external Cables/Peripherals.
• If your problem is with the PASCO apparatus, note:
Title and Model number (usually listed on the label).
Approximate age of apparatus.
A detailed description of the problem/sequence ofevents. (In case you can't call PASCO right away, youwon't lose valuable data.)
If possible, have the apparatus within reach when call-ing. This makes descriptions of individual parts mucheasier.
• If your problem relates to the instruction manual, note:
Part number and Revision (listed by month and year onthe front cover).
Have the manual at hand to discuss your questions.
Feed-Back
If you have any comments about this product or thismanual please let us know. If you have any suggestionson alternate experiments or find a problem in the manualplease tell us. PASCO appreciates any customer feed-back. Your input helps us evaluate and improve ourproduct.
To Reach PASCO
For Technical Support call us at 1-800-772-8700 (toll-free within the U.S.) or (916) 786-3800.
email: [email protected]
Tech support fax: (916) 786-3292
Web: http://www.pasco.com

Instruction Sheetfor the PASCOModel ES-9053A
012-04221C11/94$1.00
RESISTOR -CAPACITOR NETWORK
Introduction
The PASCO Model ES-9053A Resistor-Capacitor Net-work is designed for the study of RC time constants andfor investigating capacitors connected in series and paral-lel. The RC time constants range from 25 to 200 seconds,so charging and decay curves can easily be investigatedusing an electrometer, such as the PASCO ModelES-9054B Student Electrometer, and a stopwatch.
Two resistors and three capacitors are wired into aswitching network, which allows selecting three resis-tance values (50 ΜΩ, 100 MΩ, and 200 MΩ) in serieswith two selectable capacitance values (0.47 µF and .94µF). A third capacitor (0.22 µF) can be selected in seriesor parallel with the other two capacitances.
The switches and external connections allow the follow-ing combinations:
• Six combinations of resistors and capacitors in series.
• Two combinations of capacitors in series.
• Two combinations of capacitors in parallel.
Three slide switches determine the component selectionand circuit configuration (charging, discharging, or open cir-cuit). The positions of these slide switches on the front paneldiagram indicate the exact component values being used.
1.0 x 10 ohms8
.47 x 10 farads-6
(B)
(A)
Figure 1: Switch Positions & Equivalent Circuit
Figure 1 (A) shows the slide switches in arbitrary posi-tions, while Figure 1 (B) reflects the correspondingequivalent circuit diagram.
The three position slide switch on the left (S3) has avery useful OPEN position. It is often convenient tostop the charging or discharging process when makinga measurement, and the OPEN position permits thecircuit to be disconnected.
OPEN
COMPONENTS: ±5%MAX. 50 VOLTS
1.0
X 1
0 Ω8
2.0
X 1
0 Ω8
.50
X 1
0 Ω8
.22
X 1
0 F-6
.47
X 1
0 F
-6
.94
X 1
0 F-6
EXTINPUT
GND
IN
GND
OUT
ES-9053ARESISTOR - CAPACITOR
NETWORK
OPEN
COMPONENTS: ±5%MAX. 50 VOLTS
1.0
X 1
0 Ω8
2.0
X 1
0 Ω8
.50
X 1
0 Ω8
.22
X 1
0 F
-6
.47
X 1
0 F
-6
.94
X 1
0 F-6
IN
OUT
GNDGND
EXTINPUT
© 1990 PASCO scientific

2
R-C Network 012-04221C
Five binding posts allow a power supply, such as thePASCO Model ES-9049A Power Supply, and/or the elec-trometer to be connected at every possible componentconnection in the circuit.
IMPORTANT: Never place more than 50 VoltsDC across any component in the R-C network.When using the ES-9040A Power Supply, use the30 VDC range only.
The experiment using the R-C network will give onlysuggested schematics, such as in Figure 1 (B)—and notspecific switch settings.
Experiment:
Capacitors - Charging and Discharging
It takes a definite amount of time to charge or discharge acapacitor through a resistance. In this experiment we dis-cover the relationships between capacitance, resistance,and the time required to charge the capacitor.
Equipment Needed:
RC Network, DC Power Supply, and Electrometer.
The experimental circuits can be easily duplicated bytracing through the schematic on the front of the networkand setting the switches accordingly. The battery in theexperimental schematics is replaced with the DC PowerSupply. Use the electrometer to measure voltages. DONOT GROUND THE ELECTROMETER. (We wantrelative voltages.)
Procedure:
A. Charging Capacitors:
➀ Set up the circuit in Figure 2. At time t = 0, the switchis closed and capacitor voltage is recorded at regulartime intervals. (A simple way to collect data is to openthe switch at regular intervals and record the steadystate reading. Why is this possible?)
R
C
Figure 2
Plot time versus capacitor voltage for several values ofR and C. What is the shape of the curve?
Let us define T as the time required for the capacitorto charge from 10% to 90% of its final value. What isthe relation between R,C, and T? (Hint: Convert R toohms, C to farads, and T to seconds.)
➁ Repeat the same experiment as in (1), but measure thevoltage across R as a function of time. (This timeopening the switch stops the current flow, hencesteady-state readings cannot be made.)
According to Ohm’s law, potential is proportional toresistance multiplied by current. Hence, the potentialacross the resistor is proportional to the charging cur-rent. What relation is there between the charging cur-rent and the charge on the capacitor? (Hint: Part (1)gives the relation between charge and time, whereaspart (2) gives the relation between time and chargingcurrent.)
B. Discharging Capacitors:
➀ Set up the circuit in Figure 3. Charge the capacitor toan initial potential of 30 VDC. At time t = 0, close theswitch and use the electrometer to measure the voltageacross the capacitor. (Use the switch for steady statereadings as in part A (1).
Repeat the experiment with several other values of R andC. Plot time versus capacitor voltage. Does the time con-stant (T) remain the same for discharging capacitors as itdoes for charging capacitors?
➁ Using the same circuit as in B (1), charge the capacitorto 30 VDC, and close the switch and measure the volt-age across the resistor. Determine the relation be-tween discharging current and capacitor potential.
Figure 3
R
C

3
012-04221C R-C Network
Equipment Return
Should this product have to be returned to PASCO scien-tific, for whatever reason, notify PASCO scientific byletter or phone BEFORE returning the product. Uponnotification, the return authorization and shipping instruc-tions will be promptly issued.
NOTE: NO EQUIPMENT WILL BEACCEPTED FOR RETURN WITHOUTAN AUTHORIZATION.
When returning equipment for repair, the units must bepacked properly. Carriers will not accept responsibilityfor damage caused by improper packing. To be certainthe unit will not be damaged in shipment, observe the fol-lowing rules:
➀ The carton must be strong enough for the itemshipped.
➁ Make certain there is at least two inches of packingmaterial between any point on the apparatus and theinside walls of the carton.
➂ Make certain that the packing material can not shift inthe box, or become compressed, thus letting the instru-ment come in contact with the edge of the box.
Limited Warranty
PASCO scientific warrants this product to be free fromdefects in materials and workmanship for a period of oneyear from the date of shipment to the customer. PASCOwill repair or replace, at its option, any part of the productwhich is deemed to be defective in material or workman-ship. This warranty does not cover damage to the productcaused by abuse or improper use. Determination ofwhether a product failure is the result of a manufacturingdefect or improper use by the customer shall be madesolely by PASCO scientific. Responsibility for the returnof equipment for warranty repair belongs to the customer.Equipment must be properly packed to prevent damageand shipped postage or freight prepaid. (Damage causedby improper packing of the equipment for return ship-ment will not be covered by the warranty.) Shippingcosts for returning the equipment, after repair, will bepaid by PASCO scientific.
Specifications
Resistance: Three selectable series values:50 MΩ, 100 MΩ, and 200 MΩ;±5% Tolerance
Capacitance: Two selectable series values :0.47 µF and .94 µF;One series/parallel value:0.22 µF;±5% Tolerance
Connections: Five external connections via bananajacks / binding posts allow electricalconnections to each circuit node.
Component Selection: Via three slide switches
Repairs
Because of the extreme simplicity of the ES-9053A R-CNetwork and the fact that each component can be testedfrom the front panel, this section will only give a list ofreplaceable parts. Although PASCO scientific will repairthe ES-9053A it is highly suggested that repairs be madein the field. Any person with a basic understanding ofelectronics is capable of making the necessary repairs.
Replacement Parts
PART REF. DESCRIPTION/RATING
C1 Capacitor, Mylar, .22 mF, 100 V, ±5%C2, C3 Capacitor, Mylar, .47 mF, 100 V, ±5%R1, R2 Resistor, 100 MΩ, 3/4 W, ±2%S1, S2, S3 Switch, Slide, 2 Pole, 4 Position
C2
S3
C3
C1
S2
S1
R1
R2
PCB Parts Layout
NOTE: Complete operational instructions ofother PASCO Electrostatic Accessories and direc-tions for demonstrations possible with the completePASCO Electrostatic System are available in theES-9051 Accessory and Demonstrations Manual.For a listing of available Electrostatic equipmentplease refer to your current PASCO catalog.

4
R-C Network 012-04221C
R1100 MΩ
R2100 MΩ
C1.22 µF± 5%100 V
200M 50M .22 µF
S1
100M
OUT
S2
C2.47 µF, ± 5%
100 V
.94µF
C3.47 µF, ± 5%100 V
.47 µF
EXT
EXTINPUT
S3
OPEN
GND
GND GND
IN
GND
ES-9053ASCHEMATIC

012-03800A11/89Instruction Manual
and Experiment Guidefor the PASCO scientificModel SF-8616 and 8617
COILS SET
Copyright © November 1989 $15.00

scientific 1
012-03800A
How to Use This ManualThe best way to learn to use the PASCO Basic Coils Set orthe PASCO Complete Coils Set (referred to collectively asPASCO Coils Set) is to spend some time experimenting withit. We’ve organized this manual to get you started asquickly as possible. We strongly recommend that you readthe Introduction and Experiments sections first. These are
followed by 4 experiments for your students to get startedon. The experiments are ready to send to the copy room.
The Appendix contains technical data on the constructionand operation of the coils.
The PASCO scientific SF-8616 Basic Coils Set and SF-8617Complete Coils Set provide necessary parts to experimen-tally investigate relationships involved with electromagnet-ism and electromagnetic induction. Coupled with a galva-nometer, an accurate A.C. voltmeter, an A.C. ammeter, anoscilloscope and an A.C. power supply, little else is neededto carry out studies in this important area.
Additional equipment which is recommended includes smallbut strong magnets such as the ones found in the PASCOSE-8604 Bar Magnet Set, low constant springs, ring stands,a magnetic compass and iron filings.
One can study basic electromagnetism. The direction of thewindings is shown on the top of each coil, allowing therelationship between current direction and the direction ofthe resulting magnetic field to be studied. See Figure 1.
Introduction
Figure 1
Using a coil from eitherkit, it is easy to demon-strate that a moving coilof wire near a magnet, ora moving magnet near acoil of wire will induce avoltage, and therefore acurrent. Simply move amagnet into the coil asshown in Figure 2, and agalvanometer will show acurrent flow.
between the magnet and coil is needed. The effect ofmoving slow versus moving fast can be demonstrated.
Finally, changing the number of coils of wire and repeatingthe process will complete an initial investigation. Theseinvestigations are generally semi-quantitative, focusing onrelative sizes and directions. Another way to change themagnetic field is to provide an alternating magnetic fieldthrough the use of a second coil and an alternating current.See Figure 3.
Galvanometer
OUTIN
Figure 3
The Coils Set provides multiple coils and cores to experi-ment with this principle. These investigations lead to thebasic relationships involved in transformers, and lead tomore advanced studies of self- and mutual-induction.
With the addition oftwo magnets and smallsprings, a classicinteraction of inducedcurrent and electro-magnetic effects, plussimple harmonicmotion, can be studied.See Figure 4.
Figure 4
Suggested Experimental Approach
Demonstrate the basic principle of using the core and twocoils to make a transformer. Show coils, core(s), supplies,loads, meters, etc. Have students develop areas of investiga-tion and then proceed to carry them out. "Research teams"could investigate different factors and then combine theirresults for a comprehensive look at transformers.
Figure 2
Moving the magnet back out will yield a current in theopposite direction. Reversing the magnet will reverse therelative currents, also. Leaving the magnet at rest inside thecoil will produce no current. Thus, a change in relationship
d.c. power
amperes
•
compass

scientific2
012-03800A
Figure 5a
Figure 5b
a
b
c
d
e
f
g
b
h
PASCOManual
Your SF-8616 Basic Coils Set comes with the items shown in Figure 5a:
a. (1) SF-8609 200-turn Coil
b. (2) SF-8610 400-turn Coils
c. (1) SF-8611 800-turn Coil
d. (1) SF-8614 U-shaped Core
e. (1) Manual
Your SF-8617 Complete Coils Set comes with all of the items in the SF-8616 Basic Coils Set along with the followingadditional items, as shown in Figure 5b:
f. (1) SF-8612 1600-turn Coil
g. (1) SF-8613 3200-turn Coil
h. (2) SF-8615 E-shaped Core
Equipment Supplied
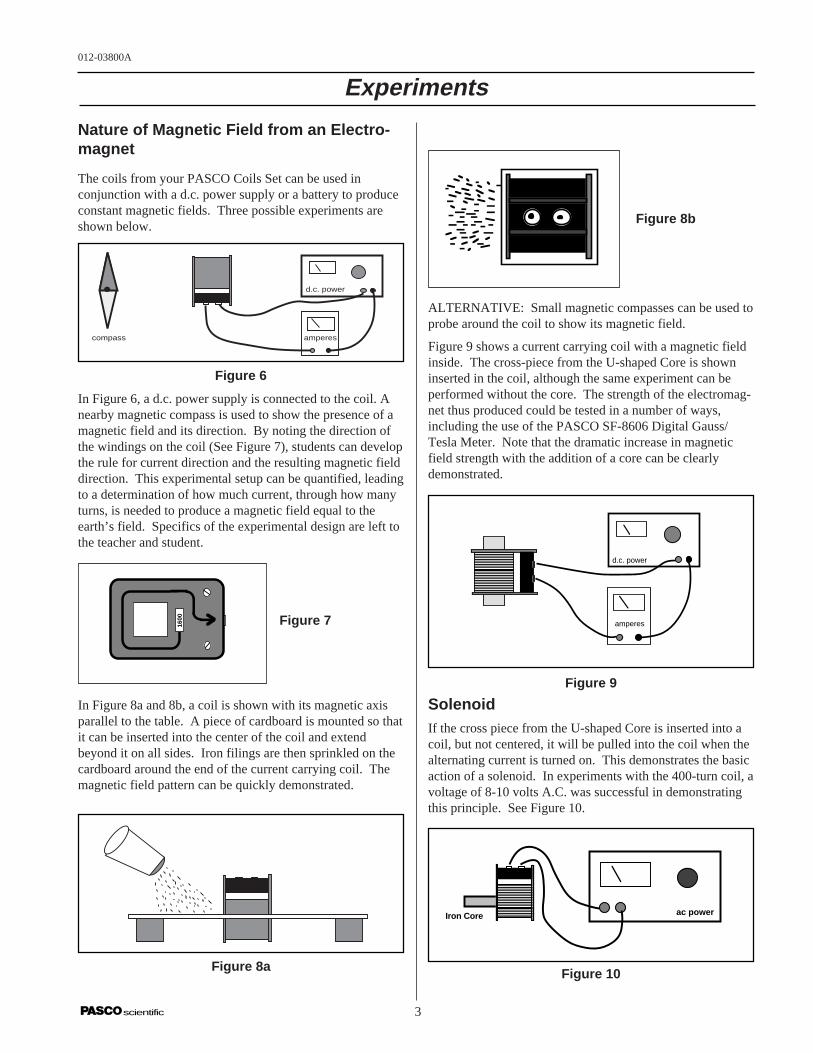
scientific 3
012-03800A
Experiments
Nature of Magnetic Field from an Electro-magnet
The coils from your PASCO Coils Set can be used inconjunction with a d.c. power supply or a battery to produceconstant magnetic fields. Three possible experiments areshown below.
Figure 6
In Figure 6, a d.c. power supply is connected to the coil. Anearby magnetic compass is used to show the presence of amagnetic field and its direction. By noting the direction ofthe windings on the coil (See Figure 7), students can developthe rule for current direction and the resulting magnetic fielddirection. This experimental setup can be quantified, leadingto a determination of how much current, through how manyturns, is needed to produce a magnetic field equal to theearth’s field. Specifics of the experimental design are left tothe teacher and student.
1600 Figure 7
In Figure 8a and 8b, a coil is shown with its magnetic axisparallel to the table. A piece of cardboard is mounted so thatit can be inserted into the center of the coil and extendbeyond it on all sides. Iron filings are then sprinkled on thecardboard around the end of the current carrying coil. Themagnetic field pattern can be quickly demonstrated.
Figure 8a
d.c. power
amperes
Figure 9
Figure 8b
ALTERNATIVE: Small magnetic compasses can be used toprobe around the coil to show its magnetic field.
Figure 9 shows a current carrying coil with a magnetic fieldinside. The cross-piece from the U-shaped Core is showninserted in the coil, although the same experiment can beperformed without the core. The strength of the electromag-net thus produced could be tested in a number of ways,including the use of the PASCO SF-8606 Digital Gauss/Tesla Meter. Note that the dramatic increase in magneticfield strength with the addition of a core can be clearlydemonstrated.
SolenoidIf the cross piece from the U-shaped Core is inserted into acoil, but not centered, it will be pulled into the coil when thealternating current is turned on. This demonstrates the basicaction of a solenoid. In experiments with the 400-turn coil, avoltage of 8-10 volts A.C. was successful in demonstratingthis principle. See Figure 10.
ac powerIron Core
Figure 10
d.c. power
amperes
•
compass

scientific4
012-03800A
Electromagnetic Induction
Use a small, relatively strong bar magnet to demonstrateelectromagnetic induction. It is only necessary to move themagnet up and down in the center of the coil. If the coil isattached to a galvanometer, the relative size of the inducedcurrent and the direction can be noted. See Figure 11.
Galvanometer
A second way of showing the effect is to connect the coil toan oscilloscope. See Figure 12
NOTE: A galvanometer shows the currentproduced, which should be proportional to the sizeof the induced voltage. Due to mechanical damp-ing, galvanometers do not rise to the maximumvalue, but give useful semi-quantitative measure-ments of the maximum currents. An oscilloscopeshows the size of the induced voltage directly, andgives a more instantaneous value.
The set-up below gives a method of “automatically” show-ing the induced voltage. A light spring which gives a nicesimple harmonic motion with the attached magnet is needed.Note that the method of attaching the magnet is via amachine nut which is hooked to the spring and held by themagnetic field of the magnet. See Figure 13.
TRANSFORMERS
Leading directly to the study of transformers, the setup inFigure 14 allows students to see how induction can proceedby passing magnetic field between the two coils. Using airas the medium between the two coils, PASCO’s experiments
showed a drop-off to an output voltage of less than 20%from the input voltage when the two 400-turn coils wereused in this manner.
ac power
ac volts
Figure 11
Figure 12
Figure 13
Figure 14
To improve the mutual induction, an iron core can beintroduced. See Figure 15. Using the cross piece from theU-shaped core, the induced voltage increased to almost 50%of the primary voltage under the same conditions as above.
Iron Core
Primary Secondary
Figure 15
ac power
ac amperes
Without Cross Bar
ac power
ac amperes
With Cross Bar
Numerous modifications of the cores which are provided canbe investigated. In each case, the ratio of secondary voltageto primary voltage is noted. The variables in this situationthus become: Primary Number of Turns, Secondary Numberof Turns, Existence of a Core, Shape of the Core, PrimaryVoltage, Primary Current, Secondary Voltage and SecondaryCurrent. Students can be led on directed studies, or giventhe materials to develop their own experiments. Somepossibilities are shown in Figure 16 below.
Primary Secondary 1 Secondary 2
Figure 16

scientific 5
012-03800A
Experiment 1: Transformer Basics I
Introduction
When an alternating current passes through a coil of wire, it produces an alternating magneticfield. This is precisely the condition needed for the electromagnetic induction to take place in asecond coil of wire. In this lab you will investigate several of the factors influencing the operationof a transformer.
Equipment Needed - Supplied
1. The four coils from the PASCO SF-8616 Basic Coils Set2. The U-shaped Core from the PASCO SF-8616 Basic Coils Set3. Optional: the additional coils from the PASCO SF-8617 Complete Coils Set
Equipment Needed - Not Supplied
1. Low voltage ac power supply 0-6 VAC, 0-1 amp such as PASCO Model SF-95822. AC voltmeter 0-6 VAC3. Banana connecting leads for electrical connections
Procedure
1. Set up the coils and core as shown in Figure1. In the diagram, the coil to the left will bereferred to as the primary coil, and the oneto the right will be the secondary coil. Notethat we are putting in an alternating currentto the primary at one voltage level, andreading the output at the secondary.
Iron Core
Primary Secondary Primary Secondary Primary Secondary
ac power
ac volts
Primary Secondary
Figure 1
2. With the 400-turn coil as the primary and the 400-turn coil as the secondary, adjust the inputvoltage to 6 volts a.c. Measure the output voltage and record your results in Table 1.1.
3. Repeat step 2 after inserting the straight cross piece from the top of the U-shaped core.Record your results. (See Figure 2.)
4. Repeat step 2 after placing the coils on the sides of the open U-shaped core. Record yourresults.
5. Finally, repeat step 2 after placing the cross piece over the U-shaped core. Record yourresults.
6. Using the core configuration which gives the best output voltage compared to input voltage,try all combinations of primary and secondary coils. Use a constant input voltage of 6.0 voltsa.c. Record your data in Table 1.2.
Figure 2

scientific6
012-03800A
Analysis
1. Which core configuration gives the maximum transfer of electromagnetic effect to thesecondary coil? Develop a theory to explain the differences between configurations.
2. From your data in table 1.2, for a primary having a constant number of turns, graph theresulting output voltage versus the number of turns in the secondary. What type of mathe-matical relationship exists between numbers of turns of wire and the resulting output voltage?Is the data ideal? Why or why not?
3. Consider further improvements to your transformer. What additional changes might youmake to increase the transfer from one coil to the other?
Data and Calculations
Table 1.1
Number of Turns
Primary Coil Secondary Coil Input V Output V Core
Table 1.2Core Configuration: ______________________________
Number of Turns
Primary Coil Secondary Coil Input V Output V Core
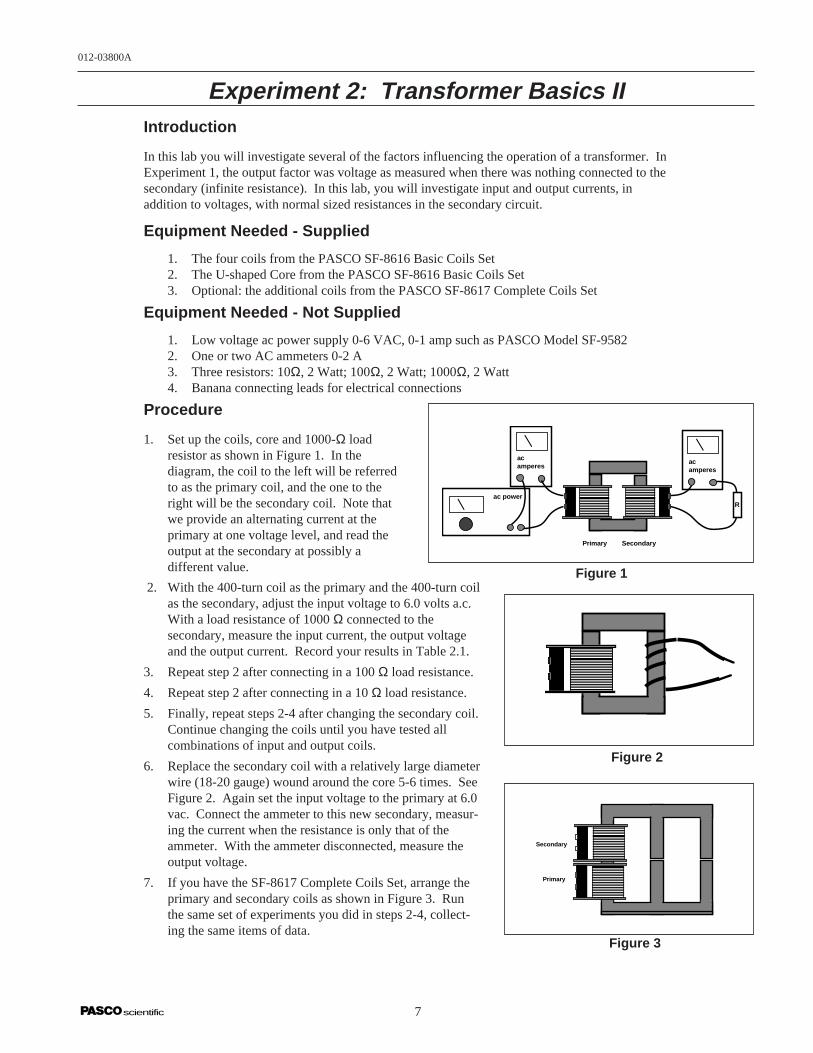
scientific 7
012-03800A
Experiment 2: Transformer Basics IIIntroduction
In this lab you will investigate several of the factors influencing the operation of a transformer. InExperiment 1, the output factor was voltage as measured when there was nothing connected to thesecondary (infinite resistance). In this lab, you will investigate input and output currents, inaddition to voltages, with normal sized resistances in the secondary circuit.
Equipment Needed - Supplied
1. The four coils from the PASCO SF-8616 Basic Coils Set2. The U-shaped Core from the PASCO SF-8616 Basic Coils Set3. Optional: the additional coils from the PASCO SF-8617 Complete Coils Set
Equipment Needed - Not Supplied
1. Low voltage ac power supply 0-6 VAC, 0-1 amp such as PASCO Model SF-95822. One or two AC ammeters 0-2 A3. Three resistors: 10Ω, 2 Watt; 100Ω, 2 Watt; 1000Ω, 2 Watt4. Banana connecting leads for electrical connections
Procedure
1. Set up the coils, core and 1000-Ω loadresistor as shown in Figure 1. In thediagram, the coil to the left will be referredto as the primary coil, and the one to theright will be the secondary coil. Note thatwe provide an alternating current at theprimary at one voltage level, and read theoutput at the secondary at possibly adifferent value.
ac power
ac amperes
ac amperes
R
Primary Secondary
Figure 1 2. With the 400-turn coil as the primary and the 400-turn coil
as the secondary, adjust the input voltage to 6.0 volts a.c.With a load resistance of 1000 Ω connected to thesecondary, measure the input current, the output voltageand the output current. Record your results in Table 2.1.
3. Repeat step 2 after connecting in a 100 Ω load resistance.
4. Repeat step 2 after connecting in a 10 Ω load resistance.
5. Finally, repeat steps 2-4 after changing the secondary coil.Continue changing the coils until you have tested allcombinations of input and output coils.
6. Replace the secondary coil with a relatively large diameterwire (18-20 gauge) wound around the core 5-6 times. SeeFigure 2. Again set the input voltage to the primary at 6.0vac. Connect the ammeter to this new secondary, measur-ing the current when the resistance is only that of theammeter. With the ammeter disconnected, measure theoutput voltage.
7. If you have the SF-8617 Complete Coils Set, arrange theprimary and secondary coils as shown in Figure 3. Runthe same set of experiments you did in steps 2-4, collect-ing the same items of data.
Figure 2
Primary
Secondary
Figure 3

scientific8
012-03800A
Note: Other configurations can be investigated once you have the E-shaped core. Atyour instructor’s direction, investigate other methods of arranging the primary andsecondary coils.
8. If there are more than one PASCO Coils Sets in the laboratory, set up a series of transformerssuch as the one diagrammed below in Figure 4. Measure input and output voltages, input andoutput currents at various places in the chain. Keep careful track of your measurements anddraft your observations based on these measurements.
Primary Secondary Primary Secondary
Input Output
Figure 4
Analysis
1. Calculate the quantities asked for in Table 2.2. Note the suggestion at the bottom of the page.If you were able to carry out the modification in step 7, a separate data table should beconstructed.
2. What relationship exists between the output current and the input current for different coilsgiven a constant load resistance? How does varying the load resistance change the outputcurrent/input current relationship for a given combination of coils? Is the effect the same forall combinations? Elaborate and make an educated hypothesis on why your experimentbehaved the way it did.
3. The ideal voltage gain is equal to the number of turns in the secondary divided by the numberof turns in the primary. How did the actual voltage gain (Vout / Vin) compare to the ideal?
4. Ideally, transformers convert alternating current from one voltage to another with very littlepower loss (almost 100% efficient). Looking at your power gain (Pout / Pin), how did yourtransformers do compared to ideal transformers?
5. What combination of voltage and current is gained by having few coils of wire in the secon-dary? (step 6)
6. Analyze the behavior of the coils in the E-shaped core, and compare this to the U-shapedcore. Is there a distinct advantage of one over the other? Why? Can an advantage gained befurther enhanced by other changes? What might they be? (step 7)
7. If you began and ended with the same number of turns in your coils (step 8), how did theinput and output voltages compare? How did the input and output power for the total combi-nation compare? Were principles you experimented with previously in evidence during thispart of the lab?

scientific 9
012-03800A
NOTE: It is recommended that the data collected above in Table 2.1 be gathered into aspread sheet program. Calculations of the input and output power, the voltage gain andpower gain for Table 2.2 can quickly and easily be made using the spread sheet. Addi-tionally, the data can be rearranged quickly to make it easy to analyze.
Data and Calculations
Table 2.1
Number of Turns
Trial # Primary Secondary Load R Input V Input I Output V Output I
Trial # Input P Output P Voltage Gain Power Gain
Table 2.2

scientific10
012-03800A
Notes:
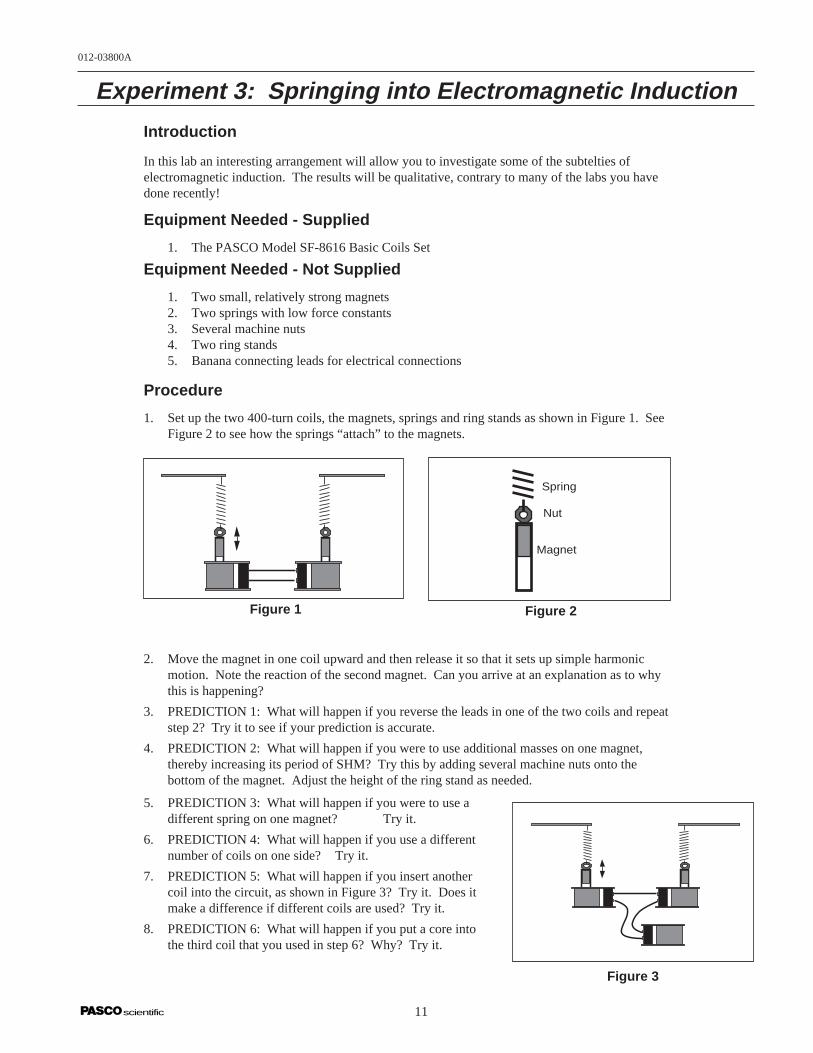
scientific 11
012-03800A
Experiment 3: Springing into Electromagnetic Induction
Introduction
In this lab an interesting arrangement will allow you to investigate some of the subtelties ofelectromagnetic induction. The results will be qualitative, contrary to many of the labs you havedone recently!
Equipment Needed - Supplied
1. The PASCO Model SF-8616 Basic Coils Set
Equipment Needed - Not Supplied
1. Two small, relatively strong magnets2. Two springs with low force constants3. Several machine nuts4. Two ring stands5. Banana connecting leads for electrical connections
Procedure
1. Set up the two 400-turn coils, the magnets, springs and ring stands as shown in Figure 1. SeeFigure 2 to see how the springs “attach” to the magnets.
Figure 1 Figure 2
2. Move the magnet in one coil upward and then release it so that it sets up simple harmonicmotion. Note the reaction of the second magnet. Can you arrive at an explanation as to whythis is happening?
3. PREDICTION 1: What will happen if you reverse the leads in one of the two coils and repeatstep 2? Try it to see if your prediction is accurate.
4. PREDICTION 2: What will happen if you were to use additional masses on one magnet,thereby increasing its period of SHM? Try this by adding several machine nuts onto thebottom of the magnet. Adjust the height of the ring stand as needed.
5. PREDICTION 3: What will happen if you were to use adifferent spring on one magnet? Try it.
6. PREDICTION 4: What will happen if you use a differentnumber of coils on one side? Try it.
7. PREDICTION 5: What will happen if you insert anothercoil into the circuit, as shown in Figure 3? Try it. Does itmake a difference if different coils are used? Try it.
8. PREDICTION 6: What will happen if you put a core intothe third coil that you used in step 6? Why? Try it.
Figure 3
Nut
Magnet
Spring

scientific12
012-03800A
Analysis
1. Why did the magnets behave as they did? How does your observation relate to electromag-netic induction?
2. What was the effect of changing the polarity of the leads connecting the two coils? Why?
3. Why did the behavior change as a result of changing the mass of the magnet and/or the springwhich was used?
4. Try to develop an explanation to cover the observations you made in steps 6-8. You maywish to begin considering energy!

scientific 13
012-03800A
Experiment 4: Intermediate Transformers
Introduction
In this lab you will continue investigating transformers. You will investigate additional coreconfigurations and work into d.c. power supplies, one of the key applications of transformertechnology.
Equipment Needed - Supplied
1. The PASCO SF-8617 Complete Coils Set
Equipment Needed - Not Supplied
1. Low voltage ac power supply 0-6 VAC, 0-1 amp such as PASCO Model SF-95822. AC voltmeter 0-6 VAC3. AC ammeter 0-2 A4. Oscilloscope5. Two diodes 1 amp, 50 PIV (min) rectifiers such as 2N40076. Resistor 1000Ω, 2 Watt7. Capacitor 470µF8. Banana connecting leads for electrical connections
Procedure A
1. Set up the coils and core as shown in Figure 1. In the diagram, thecoil to the left will be referred to as the primary coil, and the centerone will be the secondary coil.
2. With the 200-turn coil as the primary and the 800-turn coil as thesecondary, adjust the input voltage to 6.0 volts a.c. With a resistanceof 1000 Ω connected to the secondary, measure the input current, theoutput voltage and the output current. Record your results in Table4.1.
3. Now replace the 800-turn coil with the two 400-turn coils, stacked onthe same arm of the E-shaped core. With the two coils connected asshown in Figure 2, with a load resistance of 1000 ohms, measure theinput and output currents and voltages. Record your results in Table4.1.
4. Reverse the leads to one of the coils and re-measure the currents andvoltages. Record your results. How did the results compare with step3? What did you change and why did you get the results you did?
5. Now move the two 400-turn coils to the third arm of the core. Howdo the values for current and voltage compare to those seen in theprevious position of the coils? How would these values compare witha single 800-turn coil? Set up the single 800-turn coil and test yourhypothesis.
6. Measure the individual voltages and currents of the 400-turn coils ofthe secondary when they are connected to the 1000-Ω resistance inthe configuration which gave you the biggest output voltage andcurrent. How do the two values compare with one another? Do theyadd or subtract to any specific values? Do the values you obtain inthe experiment support your understanding of basic series circuits?Change the leads on one coil and re-measure the individual voltagesand the total voltage. Why do you get your end result?
Figure 2
Figure 1
Primary Secondary
Primary Secondary

scientific14
012-03800A
9. The waveform seen across the load resistance (A to C) is called a half-wave rectified signal.Half of the full sine wave passes through the diode, with the other half being blocked. Thisproduces a directional current (d.c.) but one that is constantly changing in magnitude. To beuseful, the voltage level must be made constant. The addition of an electronic “damper”should accomplish this.
PrimaryA
BC
Diode
LoadResistor
Procedure B
7. Set up the 200-turn coil as primary, and the 800-turn coil as the secondary. Put a diode intothe circuit as shown in Figure 4, and leave the 1000-Ω resistor in as a load.
Figure 3
10. Add the 470 µF capacitor as shown inFigure 4. What is the new waveform acrossthe load resistor? Is it still varying as muchas it did previously? What is the d.c. levelof the resulting voltage?
11. Now change the 1000-Ω resistor to a 10-Ωresistor in the same circuit. How does thisaffect the waveform? How does it affectthe d.c. voltage?
PrimaryA
BC
LoadResistor
•
•
Capacitor
Diode
Figure 4
Procedure C
12. Now connect the two 400-turn coils so thatthey have maximum voltage and currentoutput. With the 1000-Ω resistor as a load,connect the leads of the oscilloscopebetween points A and B as shown in Figure5. What is the shape of the wave form?What is the waveform between points Aand C? How does the size of the waveformbetween A and B compare to that betweenA and C?
13. In this step, set the triggering of youroscilloscope again to “LINE”. Connect theground lead (often a clip lead) from your oscilloscope to point B in Figure 5. With the probeat point A, note the waveform. With the probe at point C, again note the waveform and alsoany differences between that and the one found at point A. How would you describe thisdifference?
14. Now we will make the difference in waveforms useful to us. Connect two diodes into yourapparatus as shown in Figure 6. How does the waveform across the load resistance look?How does it differ from the waveforms you have seen in previous steps? Is this still alternat-ing current, or is it directional (direct) current?
Primary Secondary
A
CC
B
LoadResistor
Figure 5
8. In this step, set the triggering of youroscilloscope to “LINE”. This stabilizes thesweep so that it is sychronized with the a.c.line voltage. Now connect the ground lead(often a clip lead) from your oscilloscope topoint A in Figure 3, and the probe to pointB. Note the waveform. With the probe atpoint C, again note the waveform and alsoany differences between that and the onefound at point A. How would you describethis difference?

scientific 15
012-03800A
Primary
•
•A
B
C
LoadResistor
Diode
Diode
Figure 6
Capacitor
Primary
•
•A
B
C
LoadResistor
Diode
Diode
Figure 7 Analysis
1. Answer the questions which have been posed along the way during the procedure.
2. Why do you get such different results if you place the secondary coil(s) on the second or thirdleg of the E-shaped core? Think about the magnetic circulation that must take place withinthe core.
3. Compare the results of lowering the load resistance on a half-wave rectified circuit withlowering the load resistance on a full-wave rectified circuit. If you were to try to stabilize theoutput of a power supply, which would be better, a half-wave or full-wave rectified signal?
4. This experiment has introduced the concept of transformers and power supplies. Furtherreading and experimentation can easily begin from here and lead to profitable new under-standing.
15. The end result in step 14 is the produc-tion of a full-wave rectified signal, onewhich is directional in nature, althoughit varyies in amplitude over time. Wewill now add in a 470-µF capacitor asshown in Figure 7.
16. What is the new waveform across theload resistor? Do you have d.c., yet?What is the d.c. voltage you’ve pro-duced?
17. Now replace the 1000-Ω load resistancewith a 10-Ω resistor. What is the effecton the d.c. voltage compared to the1000-Ω resistance? What is the effecton the waveform?
Data and Calculations
Table 4.1
Number of Turns
Primary Secondary Input V Input I Load R Output V Output I
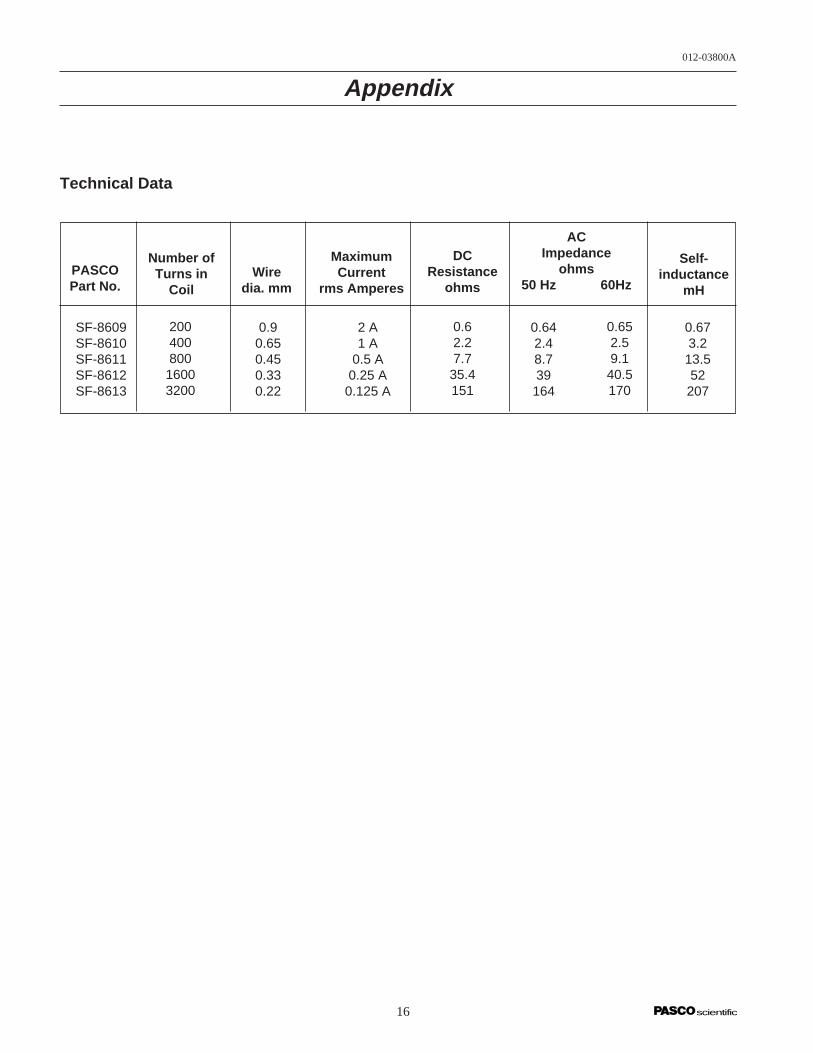
scientific16
012-03800A
Appendix
ACImpedance
ohms50 Hz 60Hz
0.90.650.450.330.22
0.642.48.739164
2 A1 A
0.5 A0.25 A0.125 A
SF-8609SF-8610SF-8611SF-8612SF-8613
PASCOPart No.
Number ofTurns in
CoilWire
dia. mm
MaximumCurrent
rms Amperes
DCResistance
ohms
Self-inductance
mH
0.673.213.552207
0.652.59.140.5170
0.62.27.735.4151
20040080016003200
Technical Data

012-04695D Thermal Radiation System
Technical Support
Contacting Technical Support
Before you call the PASCO Technical Support staff itwould be helpful to prepare the following information:
• If your problem is computer/software related, note:
Title and Revision Date of software.
Type of Computer (Make, Model, Speed).
Type of external Cables/Peripherals.
• If your problem is with the PASCO apparatus, note:
Title and Model number (usually listed on the label).
Approximate age of apparatus.
A detailed description of the problem/sequence ofevents. (In case you can't call PASCO right away,you won't lose valuable data.)
If possible, have the apparatus within reach whencalling. This makes descriptions of individual partsmuch easier.
• If your problem relates to the instruction manual,note:
Part number and Revision (listed by month and yearon the front cover).
Have the manual at hand to discuss your questions.
Feed-Back
If you have any comments about this product or thismanual please let us know. If you have any sugges-tions on alternate experiments or find a problem in themanual please tell us. PASCO appreciates any cus-tomer feed-back. Your input helps us evaluate andimprove our product.
To Reach PASCO
For Technical Support call us at 1-800-772-8700 (toll-free within the U.S.) or (916) 786-3800.

Instruction Sheetfor the PASCOModel SF-8619
MAGNETIC DIP NEEDLE
012-04399C3/95$1.00
Introduction
This compass needle is used to measure the dip angle ofthe Earth's magnetic field. However, it may also be usedin its horizontal position as a conventional compass.
Setup Procedure
➀ Assemble the two parts of the dip needle by insertingthe banana plug connector into the hole in the blackrod on the stand, as shown in equipment setup diagram.
➁ Put the dip needle in a location which is far away fromany ferromagnetic materials and other magnetic fields.If you place the dip needle on a table, be sure there areno ferromagnetic supports under the table top.
➂ Rotate the dip needle at its banana plug connectionuntil the plastic scale is in the horizontal plane.
Phone (916) 786-3800 • FAX (916) 786-8905 • email: [email protected]
10101 Foothills Blvd. • P.O. Box 619011 • Roseville, CA 95678-9011 USA
better
teach physics
ways to
➃ While in the horizontal position, rotate the entire appa-ratus to align the compass needle with the axis of ba-nana plug pivot.
➄ Without changing the orientation of the base, rotatethe dip needle at its banana plug connection until theplastic scale is in the vertical plane.
Theory
The dip needle is a magnetized steel needle which rotatesaround its center of mass. When no other magnetic fieldsare present, the dip needle will align itself along the direc-tion of the Earth’s magnetic field. The dip angle, or incli-nation, is the angle between the horizontal plane and thetotal Earth magnetic field. By convention, the dip angleis positive when pointing downwards.
The dip needle apparatus measures the angle, θ betweenthe vertical plane and the total Earth magnetic field. Inorder to obtain the dip angle, subtract θ from 90˚.
The United States Geological Survey maintains a publicdomain program for IBM compatible computers whichmodels geomagnetic parameters including dip angle. Theuser inputs their latitude, longitude and elevation and theprogram calculates the dip angle. Copies of the programare free of charge and are available over the Internet viathe following methods:
ftp host: ftp.ngdc.noaa.gov login anonymous
gopher host: gopher.ngdc.noaa.gov no login necessary
www host: http://www.ngdc.noaa.gov no login necessary
The appropriate file is pcgeomag.zip which contains thesource code, executable and documentation files alongwith the current magnetic field model.
Equipment Setup
© 1990 PASCO scientificThis instruction sheet written/edited by: Ann Hanks

2
Magnetic Dip Needle 012-04399C
N
S
NorthMagnetic
Pole
NorthGeographic
Pole SouthMagnetic
Pole
SouthGeographic
Pole
Dip Angle for Northern California
θ
Copyright Notice
The PASCO scientific Model SF-8619 Magnetic DipNeedle manual is copyrighted and all rights reserved.However, permission is granted to non-profit educationalinstitutions for reproduction of any part of this manualproviding the reproductions are used only for their labora-tories and are not sold for profit. Reproduction under anyother circumstances, without the written consent ofPASCO scientific, is prohibited.
Limited Warranty
PASCO scientific warrants this product to be free fromdefects in materials and workmanship for a period of oneyear from the date of shipment to the customer. PASCOwill repair or replace, at its option, any part of the productwhich is deemed to be defective in material or workman-ship. This warranty does not cover damage to the productcaused by abuse or improper use. Determination ofwhether a product failure is the result of a manufacturingdefect or improper use by the customer shall be madesolely by PASCO scientific. Responsibility for the returnof equipment for warranty repair belongs to the customer.Equipment must be properly packed to prevent damageand shipped postage or freight prepaid. (Damage causedby improper packing of the equipment for return ship-ment will not be covered by the warranty.) Shippingcosts for returning the equipment, after repair, will bepaid by PASCO scientific.
θ = Angle read from Dip NeedleI = Dip Angle = 90° - θ
Ι

Instruction Sheetfor the PASCOModel ES-9042A
FARADAY ICE PAIL
012-04393B11/95$1.00
Introduction
The Ice Pail designed by Faraday is an excellent productfor sampling a charge distribution. It operates on the prin-ciple that a charge placed inside a conducting surface willinduce an equal charge on the outside of that surface. Forexample, if a charged ball were hung inside a coffee can,the charge on the outside of the can would equal thecharge of the ball. The charge can be measured with anelectrometer such as the PASCO Model ES-9054B Stu-dent Electrometer.
The PASCO ModelES-9042A Faraday Ice Pailis a wire mesh cylinder mea-suring 10 cm in diameter by15 cm deep with a wiremesh bottom. It is mountedon three insulating rodsalong the outer edge of awire mesh shield.
The wire mesh shield notonly ensures complete vis-ibility of the experiment butalso helps eliminate theproblem of stray charges and AC fields.
To prevent stray charges from producing erroneous re-sults it is extremely important that the person performingthe experiment be continually grounded while performingthe experiment. The Ice-Pail needs to be temporarilygrounded prior to starting the experiment.
A charged object such as the PASCO Model ES-9057ACharge Producers and Proof Plane is placed in thegrounded ice pail (without touching it), and the electrom-eter indicates the potential between the ice pail andground. The greater the charge the greater the potential.Thus we can easily measure relative charges by varyingthe charges in the ice pail and observing the potential in-dicated by the electrometer.
Complete instructions for the operation of PASCO Elec-trostatic equipment can be found in the ES-9051 Acces-sory and Demonstration Manual (included with the Dem-onstration System) and the ES-9055 Laboratory Manual(included with the Electrostatic Laboratory System)
Demonstration: Faraday Ice Pail and ChargeProduction
Since the Faraday Ice Pail is used so frequently in electro-static demonstrations, one should examine the relation-ship between the charge induced on the ice pail by an in-serted object and the actual charge on that object. Usingthe ice pail, one can then investigate the nature of charging anobject by contact as opposed to charging by induction.
Equipment needed: Faraday Ice Pail, charge producing ob-jects (such as ES-9057A Charge Producers), electrometer
Setup
➀ Connect the electrometer input lead (red alligator clip)to the ice pail to create a system for measuringcharge. The electrometer ground lead (black alligatorclip) attaches to the shield. (Setup is shown in Figure1.) Adjust the sensitivity of the electrometer so thatmost readings appear in the upper 2/3 of the scale.
ElectrometerRed Clip
Charge Producer
+++ ++
++
++ +++
-------
- - - - -
-
------
++
+
+
+++
++
+
+
+
+ +
+
+
+
+
- -- -+ +
Figure 1
© 1993 PASCO scientific
Faraday Ice Pail
Black Clip

2
Faraday Ice Pail 012-04393B
®
➁ Ground the ice pail (i.e., connect the inner pail to theshield) by touching the inner pail and the outer shieldat the same time with the finger of one hand. (See Fig-ure 2) While conducting the experiment it may beconvenient to continually rest one hand on the upperedge of the shield. This also grounds the experimenter,providing the electrometer is connected to bothground and shield and it allows the ice pail to be easilygrounded whenever necessary.
NOTE: When removing your finger from theinner pail after grounding it, make certain that youare still touching the outer shield. DO NOT removeyour hand from the shield before releasing the innerpail, as this sequence will not effectively ground theinner pail.
➂ Make sure the electrometer reads “zero”, indicatingthat there is no charge on the ice pail.
Procedure A
➀ Rub two charge producers together to create a chargeon them.
➁ Insert one of the wands into the ice pail but do not letit touch the pail. Note the electrometer reading.
➂ Remove the object from the pail and again note theelectrometer reading.
➃ Insert the wand again, allow it to touch the ice pail andthen remove it. Note the electrometer reading.
➄ Momentarily ground the ice pail and then touch theobject to the pail again. Note the electrometer reading.Does any charge remain on the object?
What is the conclusion about the induced charge on the icepail, as compared to the charge on the charge producer?
NOTE:
➀ The charged object must be inserted at least into thelower half of the ice pail. Try inserting it, for example,approximately one centimeter below the top of the pailand attempt to explain your results.
➁ There may be a small charge retained on the exposedplastic between the aluminum disk and the aluminumrod on the charge producers. This residual charge doesnot transfer readily when the disk is touched to thepail. Therefore, (before starting the experiment)breathe on the exposed plastic of the charge producerso that the moisture in your breath will tend to removeany residual charge.
Procedure B
➀ Starting with initially uncharged charge producers,rub the blue and white materials together. Using theFaraday Ice Pail, measure the magnitude and polarityof their charges. By using the results from ProcedureA it is not necessary to touch the charge producer tothe pail. What relationship exists between thesecharges produced by contact?
➁ Ground the charge producers and rub them togetherinside the ice pail. What is the reading on the elec-trometer. Remove one charge producer and note theelectrometer reading. Replace this charge producer butremove the other and note the electrometer reading.
➂ Ground the charge producers again. Rub the whitematerial against the aluminum proof plane. Measurethe magnitude and polarity of the charges. Now rubthe blue material against the aluminum surface andrecord your measurements.
➃ Construct a list of materials such that if a materiallower on the list is rubbed against a material higher onthe list, the charge on the higher listed material is al-ways positive. Such a list is called an electrostatic series.
To Reach PASCO
For Technical Support call us at 1-800-772-8700 (toll-free within the U.S.) or (916) 786-3800.
email: [email protected]
Tech support fax: (916) 786-3292
OpenClosed
Figure 2
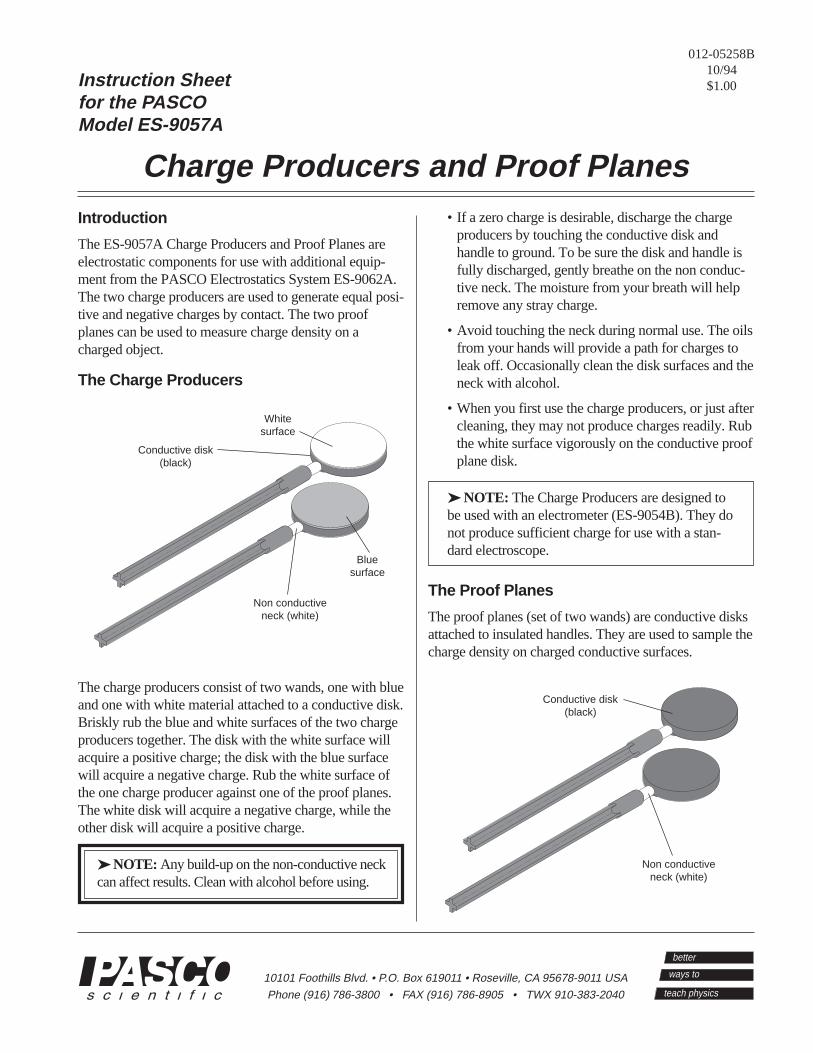
Instruction Sheetfor the PASCOModel ES-9057A
Charge Producers and Proof Planes
012-05258B10/94$1.00
Phone (916) 786-3800 • FAX (916) 786-8905 • TWX 910-383-2040
10101 Foothills Blvd. • P.O. Box 619011 • Roseville, CA 95678-9011 USA
better
teach physics
ways to
Introduction
The ES-9057A Charge Producers and Proof Planes areelectrostatic components for use with additional equip-ment from the PASCO Electrostatics System ES-9062A.The two charge producers are used to generate equal posi-tive and negative charges by contact. The two proofplanes can be used to measure charge density on acharged object.
The Charge Producers
The charge producers consist of two wands, one with blueand one with white material attached to a conductive disk.Briskly rub the blue and white surfaces of the two chargeproducers together. The disk with the white surface willacquire a positive charge; the disk with the blue surfacewill acquire a negative charge. Rub the white surface ofthe one charge producer against one of the proof planes.The white disk will acquire a negative charge, while theother disk will acquire a positive charge.
NOTE: Any build-up on the non-conductive neckcan affect results. Clean with alcohol before using.
• If a zero charge is desirable, discharge the chargeproducers by touching the conductive disk andhandle to ground. To be sure the disk and handle isfully discharged, gently breathe on the non conduc-tive neck. The moisture from your breath will helpremove any stray charge.
• Avoid touching the neck during normal use. The oilsfrom your hands will provide a path for charges toleak off. Occasionally clean the disk surfaces and theneck with alcohol.
• When you first use the charge producers, or just aftercleaning, they may not produce charges readily. Rubthe white surface vigorously on the conductive proofplane disk.
NOTE: The Charge Producers are designed tobe used with an electrometer (ES-9054B). They donot produce sufficient charge for use with a stan-dard electroscope.
The Proof Planes
The proof planes (set of two wands) are conductive disksattached to insulated handles. They are used to sample thecharge density on charged conductive surfaces.
Conductive disk(black)
Non conductiveneck (white)
Bluesurface
Whitesurface
Conductive disk(black)
Non conductiveneck (white)

012-05258B
2
NOTE: You can then use an electrometer anda Faraday ice pail (ES-9042A) to measure thecharge density on the proof plane, as shown inthe following illustration.
Electrometer
Faraday ice pail and shield
Ground lead
Insert charged proofplane into Faraday
ice pail
Signal lead
By touching the proof plane to a surface, it willacquire the same charge distribution as the surface. Bymeasuring the charge on the proof plane, the chargedensity on the surface can be determined. The greaterthe charge on the proof plane, the greater the chargedensity on the surface where the proof plane madecontact.
When the proof plane is touched to a conductor, theproof plane becomes part of the conductive surface. Ifthe effect on the shape of the surface is significant, thesampling of the charge density will not be accurate.Therefore, always touch the proof plane to the conduc-tor in such a way as to minimize the distortion of theconductive surface. The following illustration showsthe recommended method for using the proof plane tosample the charge on a conductive sphere.
NOTE: To accurately sample charge density,the conductor should be considerably larger thanthe disk of the proof plane and have a relativelylarge radius of curvature at the point from whichthe sample is taken. However, the proof planescan be used to test for charge polarity on conduc-tors of any shape.
Other
The conductive disk material is carbon filled blackpolycarbonate (about 103 Ω). The non-conductive neckis white polycarbonate (about 1014 Ω).
Limited Warranty
PASCO scientific warrants this product to be free fromdefects in materials and workmanship for a period ofone year from the date of shipment to the customer.PASCO will repair or replace, at its option, any part ofthe product which is deemed to be defective in mate-rial or workmanship. This warranty does not coverdamage to the product caused by abuse or improperuse. Determination of whether a product failure is theresult of a manufacturing defect or improper use by thecustomer shall be made solely by PASCO scientific.Responsibility for the return of equipment for warrantyrepair belongs to the customer. Equipment must beproperly packed to prevent damage and shippedpostage or freight prepaid. (Damage caused by im-proper packing of the equipment for return shipmentwill not be covered by the warranty.) Shipping costsfor returning the equipment, after repair, will be paidby PASCO scientific.
++
+
+
+
+
+
+
+
+
++
+
+
+
+
+
+
+
+
+
YES!
chargedconductive
sphere
Surface of the proof plane diskIS tangent to the surface
of the conductor.
NO!
Surface of the proof plane diskIS NOT tangent to the surface
of the conductor.

Instruction Sheetfor the PASCOModel TD-8550A
THERMOELECTRIC CONVERTER
012-04929A5/92
Introduction
The PASCO scientific Thermoelectric Converterconsists of a thermoelectric heat pump sandwichedbetween two aluminum metal legs. Electric currentfrom the thermoelectric heat pump can drive a smallmotor that has a fan attached to its shaft. The Con-verter can demonstrate the Seebeck effect (discoveredin 1821). In this effect, a temperature differenceacross the thermoelectric heat pump gives rise to acurrent that drives the small motor (∆T → E). Forexample, when one leg is in hot water and the other isin cold water, the small motor turns the fan. TheConverter can also demonstrate the Peltier effect(discovered in 1834). When a current is passedthrough the thermoelectric heat pump, a temperaturedifference results (E → ∆T). One of the legs becomeswarm while the other leg becomes cooler. Finally, theConverter acts as a “thermal capacitor”. After acurrent is passed through the Converter to create thetemperature difference (E → ∆T), flip the switch (∆T→ E), and the temperature difference causes a currentthat drives the small motor.
Figure 1 shows the top portion of the ThermoelectricConverter. Put the switch in the “up” position (toward
∆ T E
E ∆ T+ –
TD-8550AThermoelectric
Converter
scientific
A) Place one leg in icewater, one in hot water. Fan rotates due to ∆ T. With both legs in same temp water, fan won't rotate.
B) Connect 5 V, 3 A DC supply to terminals. One leg warms, one cools.
5V 3A2min MAX
A)
B)
DO NOT EXCEED 2 MIN OR 8 V!
Figure 1 Switch Position
∆T → E) in order to demonstrate the Seebeck effect(temperature difference causes electric current).Connect a source of electric current to the red andblack banana jacks and put the switch in the “down”position (towardE → ∆T) to demonstrate the Peltier effect (currentthrough the thermoelectric heat pump causes a tem-perature difference).
NOTE: The recommended voltage and currentis 5 Volts and 3 Amps (DC). Do not exceed 8Volts. Do not run the 5 Volt, 3 Amp currentthrough the device for more than 2 minutes.
Equipment Needed:
• Cups for hot and cold water
• DC Power supply capable of 5 Volts and 3 Amps
• Patch cords
Recommended Equipment:
• TD-8556 Steam Generator
• SF-9584 AC/DC Low Voltage Power Supply orSF-9582 12 Volt AC/DC Power Supply
• SE-9750 and SE-9751 Banana Plug Patch Cords
Optional Equipment:
• Digital thermometer (such as PASCO Model SB-9631 or Model SE-9086)
Theory
A transformation whose only final result is to trans-form into work heat extracted from a source which isat the same temperature throughout is impossible.
Lord Kelvin

012-04929A
2 scientific
Figure 2
➀ The change in entropy of the hot water, ∆Sh = Q
h/
Th, is negative, because of the heat transfer from
the water into the Converter.
➁ The change in entropy of the cold water,∆S
c = Q
c/T
c, is positive, because of the heat trans-
fer from the Converter into the water.
➂ According to the second law, the total change inentropy, ∆S
T = ∆S
c + ∆S
h, must be positive. There-
fore, the process will only take place if Qc/T
c > Q
h/
Th.
In order for the fan to be turned, some of the heattransferred from the hot water must be convertedinto work and will therefore not be available to betransferred back into the cold water. Therefore,whenever the fan turns, Q
h > Q
c.
➄ The equations in steps 3 and 4 can only both be trueif T
h > T
c. Once the water is mixed, however, T
h =
Tc. Therefore, if the fan were to turn, it would vio-
late the Second Law of Thermodynamics.
This was Kelvin’s statement of the Second Law ofThermodynamics. The second law has been stated inmany, seemingly unrelated ways; but in the end, allhave been shown to be different ways of expressingthe same basic principle. In its most general form, theSecond Law tells us that no physical process willoccur if it decreases the disorder—or entropy—of theuniverse. Conservation of energy, as expressed in theFirst Law of Thermodynamics, holds for every physi-cal process. But many processes which would con-serve energy do not occur. The Second Law describesthis phenomenon.
OPERATION
Seebeck Effect:
The PASCO Model TD-8550A Thermoelectric Con-verter is designed to demonstrate this relationshipbetween the First and Second Laws of Thermodynam-ics. The procedure used directly illustrates Kelvin’sstatement of the Second Law. The Converter is usedas illustrated in Figure 2. Put the switch in the “up”position. One leg of the unit is placed in a cup of coldwater and one in a cup of hot water. (Boiling water andice water give good results.) Some of the thermalenergy from the hot water is converted into work bythe Converter, and the fan turns. Then the hot andcold water are mixed together in a larger container.Both legs of the unit are placed into the container.Now the fan does not turn.
The total internal energy of the water is not changedby mixing the hot and cold together, so there must stillbe sufficient energy in the water to turn the fan. Butthis would violate the Second Law of Thermodynam-ics, as stated by Kelvin.
NOTE: As a further demonstration, placeone leg in the mixed water (or in ice water) andone in a container of dry ice to demonstrate thatthere is energy available in the mixed water (andeven in ice water).
This violation of the Second Law can also be ex-plained in terms of entropy, using the expression ∆S =Q/T, where ∆S is the change in entropy, Q is the heattransferred, and T is the temperature at which the heatis transferred. Considering only the heat transfertaking place in the cups of water, the following holds:
PASCOscientific
TD-8550AThermoelectric
Converter+ –
A) ∆T–E
B) E–∆T
H2O
Th = Tc
FAN DOES NOT ROTATE
H2O(HOT & COLD MIXED)
PASCOscientific
TD-8550AThermoelectric
Converter+ –
A) ∆T–E
B) E–∆T
H2O (HOT)
H2O(COLD)
SEEBECK EFFECT(∆T E)
FAN ROTATES
➃

012-04929A
3 scientific
Description of Seebeck effect
The Thermoelectric Converter uses a series of thermo-electric cells to convert thermal energy into electricalenergy that will drive the fan. Each cell is a semicon-ductor device. A simplified diagram of one cell isshown below.
During the Seebeck effect, the heat entering the cellraises the energy level of some of the electrons in thecell. At the higher energy level, the electrons are nolonger bound in the crystal structure of the semicon-ductor and are free to move. When they do so, theyleave a vacant place, or hole, in the crystal. Lowerenergy electrons, though they can’t move freely withinthe material, can jump from hole to hole. In this way,the holes can also migrate through the semiconductormaterial.
HOT
COLD
Thermoelectric Cell
FANMOTOR
Thermoelectric Converter Cell (Seebeck effect)
PASCOscientific
TD-8550AThermoelectric
Converter+ –
A) ∆T–E
B) E–∆T
TO
POWER SUPPLY
(5 VDC, 3 A)
2 min, 8 VDC MAXIMUM
COLD
PELTIER EFFECT(E ∆T)
HOT
SWITCH IS IN
"DOWN" POSITION
Peltier Effect:
During the Peltier effect, a current through the thermo-electric heat pump of the Converter causes a tempera-ture difference. Connect a DC power supply capable of5 Volts and 3 Amps to the red and black terminals onthe Converter. Put the switch on the Converter to theE → ∆T (down) position . (For this demonstration,you do not need to immerse the legs of the Converterin water.) Turn on the power supply. In a few mo-ments you should be able to feel the temperaturedifference of both aluminum legs of the Converter.
NOTE: DO NOT LEAVE THE POWERSUPPLY ON FOR MORE THAN TWO MIN-UTES. DO NOT EXCEED 8 VOLTS.
As an optional exercise, begin with the Converter atroom temperature. Measure the temperature of bothlegs. Then, while the current is applied to the Con-verter, use a digital thermometer to monitor the increasein temperature of the “hot” leg and the decrease intemperature of the “cold” leg.
Thermal Capacitor:
After demonstrating the Peltier effect, disconnect thepower supply from the Converter. Put the switch to the∆T → E (up) position. The temperature differencecaused when the current was applied to the thermoelec-tric heat pump will now cause the Converter to generatea current to drive the motor.
PASCOscientific
TD-8550AThermoelectric
Converter+ –
A) ∆T–E
B) E–∆T
"THERMAL CAPACITOR"(MODIFIED SEEBECK EFFECT)
FAN ROTATES

012-04929A
4 scientific
The electrons migrate, as shown, through the N-typesemiconductor material and the holes migrate throughthe P-type material. (N and P type materials are merelysilicon that is “doped” with special impurities thatenhance electron and hole migration.) The electronsflow through the external circuit and drive the fanmotor. At the other end of the circuit they reenter thecell and encounter the holes of the P-type semiconduc-tor. This occurs near the cold end of the cell. Theelectrons can therefore drop back into holes, giving upany excess energy they still retain as heat.
As long as the temperature differential is maintainedbetween the two sides of the cell, the electrons andholes continue to migrate, and the fan continues to turn.However, if there is no temperature differential, theelectrons can not recombine with the holes becausethere is no place to give up their excess energy. In thisway, the thermoelectric cell is constrained by theSecond Law of Thermodynamics.
Description of Peltier effect
During the Peltier effect, the electric potential differ-ence causes electrons and holes to migrate from one endof the N and P type semiconductor material to the other.The movement of the electrons in the N type semicon-ductor results in a transfer of internal energy from thatend of the semiconductor, and it cools. The same resultoccurs for the P type semiconductor during holemigration. The heat transfer from the “cold” leg to the“hot” leg is proportional to the carrier current passingthrough the circuit and the number of thermoelectriccells (couples) making up the thermoelectric pump.
Construction of the Thermoelectric Heat Pump:
The PASCO Thermoelectric Converter has 71 thermo-electric cooling “couples”. These are made from twoelements of semiconductor, primarily Bismuth Tellu-ride (a quarternary alloy of bismuth, tellurium, seleniumand antimony) heavily doped to create either an excess(N-type) or deficiency (P-type) of electrons. The
COOLING
WARMING
(N-type)
(P-type)
DCSUPPLY
Thermoelectric Converter Cell (Peltier effect)
couples, connected in series electrically and in parallelthermally, are integrated into the thermoelectric heatpump. The heat pump is packaged between metallizedceramic plates.
Specifications:
When using the Thermoelectric Converter as a Peltierdevice, the power required to produce a given tempera-ture difference depends on the temperature of the hotside. The hot side must never exceed 135 degrees C,the melting point of the solder which bonds the BismuthTelluride ingots to the plates. Starting at 25 degrees C,the hot leg temperature increases much more than thecold leg temperature decreases (about 40 degrees versusabout 8 degrees in 2 minutes). This is because thepower dissipated by the hot side is the sum of thesupplied power and the heat transferred from the coldside. (If the hot side is held to 25 degrees C, enoughpower can be applied to create a maximum temperaturedifference of about 67 degrees C.)
The resistance of the small motor is about 1 ohm.
Compatible PASCO Equipment
PASCO offers a complete line of laboratory anddemonstration equipment for thermodynamics. Experi-ment quantitatively with the mechanical and electricalequivalents of heat, thermal conductivity, heat capacity,phase changes in water, and black body radiation.
Check our catalog for these and other products that canbring PASCO quality into your classroom and labora-tory.
Limited Warranty
PASCO scientific warrants this product to be free fromdefects in materials and workmanship for a period ofone year from the date of shipment to the customer.PASCO will repair or replace, at its option, any part ofthe product which is deemed to be defective in materialor workmanship. This warranty does not cover damageto the product caused by abuse or improper use. Deter-mination of whether a product failure is the result of amanufacturing defect or improper use by the customershall be made solely by PASCO scientific. Responsi-bility for the return of equipment for warranty repairbelongs to the customer. Equipment must be properlypacked to prevent damage and shipped postage orfreight prepaid. (Damage caused by improper packingof the equipment for return shipment will not becovered by the warranty.) Shipping costs for returningthe equipment, after repair, will be paid by PASCOscientific.