low-temperature coatings for instruments on the
TRANSCRIPT

Low-temperature coatings for instruments on the BepiColombo mission
to Mercury
Anna-Lena Larsson, Jan-Erik Wahlund
IRF Technical Report 049July 2004
ISSN 0284-1738
INSTITUTET FÖR RYMDFYSIKSwedish Institute of Space Physics
Kiruna, Sweden


Low-temperature coatingsfor instruments on the
BepiColombo mission to Mercury
IRF Technical Report 049July 2004
Anna-Lena Larsson, Jan-Erik Wahlund
ISSN 0284-1738
Printed in SwedenSwedish Institute of Space Physics
Kiruna, Sweden, 2004


1
Contents
1 Introduction .........................................................................................................................................2
2 Background..........................................................................................................................................4 2.1 Heat transfer in a Mercury environment ....................................................................................4 2.2 Optical properties of materials ...................................................................................................4
2.2.1 Absorptance and emittance ....................................................................................................4 2.2.2 Thin film interference ............................................................................................................5
2.3 Environmental conditions...........................................................................................................6 2.4 Surface coatings requirements....................................................................................................6 2.5 Materials selection......................................................................................................................6
2.5.1 Thin film TiN and TiAlN.......................................................................................................6 2.5.2 MAX-phase materials ............................................................................................................6 2.5.3 Indium tin oxide (ITO) ..........................................................................................................7 2.5.4 PEDT polymer .......................................................................................................................7
3 Sample manufacturing and characterization........................................................................................8 3.1 Sample manufacturing................................................................................................................8
3.1.1 Physical vapour deposition (PVD).........................................................................................8 3.1.2 High temperature nitridation..................................................................................................8
3.2 Sample characterization .............................................................................................................8 3.2.1 X-ray diffraction ....................................................................................................................8 3.2.2 Optical characterization with spectrophotometry ..................................................................8
4 Results ...............................................................................................................................................10 4.1 Introduction ..............................................................................................................................10 4.2 TiAlN .......................................................................................................................................10
4.2.1 Measured reflectance of sputtered TiAlN (old) ...................................................................11 4.2.2 Measured reflectance of sputtered TiAlN (new) .................................................................11 4.2.3 Measured reflectance of nitrided TiAl.................................................................................12
4.3 MAX-phase materials...............................................................................................................13 4.3.1 Simulations of thin film MAX-phase Ti4AlN3 and Ti3Si2 ...................................................14 4.3.2 Measured reflectance of thin film MAX-phase Ti3AlC2, Ti3AlN2 and Ti2AlC ...................15
4.4 Simulated reflectance of sputtered indium tin oxide (ITO)......................................................16 4.5 Measured reflectance of a PEDT polymer ...............................................................................21
5 Summary and conclusions .................................................................................................................22


2
1 Introduction
The instruments on the BepiColombo mission to Mercury (ESA, 2004) will be submitted to a harsh envi-ronment, receiving radiated power from the Sun and the planet about 10 orders of magnitude larger than that of an Earth bound orbit. The equipment that is not covered by the housing platform needs to be coated to protect it from overheating. The choice of coating material is not obvious, and this report pre-sent measurements and simulations of some candidate materials.
The Swedish Institute of Space Physics (IRF) has previously sent Langmuir Probes with e.g. the Cas-sini/Huygens mission (called RPWS LP), and the Rosetta mission (called LAP). The TiN coatings used on these probes provide a worst-case balance temperature of 150 °C, calculated for the prevailing condi-tions. On BepiColombo, the Langmuir Probe will be a part of the MEFISTO sensor configuration (Blomberg et al., 2004) which also includes co-axial cables with heat sensitive insulation material.
Insulating material Low-temperature coating
Ag wire Conductor
Fig. 1-1. Schematic cross-section of a co-axial boom cable with a low-temperature coating.
Temperature calculations of thin film TiN coatings has previously been reported (Karmhag and Ribbing, 1999), as well as thin film TiAlN (Brogren et al., 2000). TiN coatings manufactured by high temperature nitridation have also been investigated (Veszelei, 1997). The lowest balance temperature was found for the TiAlN coating, and calculations in a Mercury environment results in a balance temperature of 270 °C.
The aim of this study is to take advantage of the advanced instrumentation and highly qualified compe-tence within the Ångström Laboratory and associated resources, in the search for a suitable coating for very hot space environments. For all the real and simulated materials, the purpose was to use the optical response and calculate the steady state balance temperature in a Mercury environment.
The balance temperature of a surface can be calculated from parameters obtained from optical charac-terization. Thin films of sputtered TiAlN were manufactured and optically analyzed. Thin films of sput-tered TiAl were submitted to nitridation, and optical characterization of the films was performed. Previ-ously obtained data (Hultåker, 2002) from optical characterization of thin films of indium tin oxide (ITO) were used to simulate the optical response at different film thicknesses. Previously obtained data (Pettersson, 2003) from optical characterization of bulk MAX-phase materials (this type of material is described in section 2.5.2) were used to simulate the optical response at different thicknesses. Thin films of MAX-phase materials were submitted to optical characterization. And the optical response of a PEDT polymer was obtained.
The candidate material for the probes was found to be a 0.65 µm sputtered Ti0.16Al0.43N0.41 yielding a temperature of 270 °C (alfa/epsilon = 1.3). Simulations of sputtered ITO of 0.6 µm, onto Ag, yielded a temperature of 200 °C (alfa/epsilon = 0.71) which makes it an interesting material for the boom cables.
3
Participants in this project were: Anna-Lena Larsson (Swedish Institute of Space Physics and Department of Engineering Sciences, Upp-sala University), optical characterization, simulations and writing Jan-Erik Wahlund (Swedish Institute of Space Physics), project driver Urban Wiklund (Department of Engineering Sciences, Uppsala University), manufacturing of sputtered TiAl and TiAlN samples Erik Johansson (Ti-Surf AB), manufacturing of nitrided TiAl samples Annette Hultåker (Department of Engineering Sciences, Uppsala University), manufacturing and charac-terization of ITO samples Lars Bylander (Alfvén Laboratory, The Royal Institute of Technology), project driver Heléne Pettersson (Department of Engineering Sciences, Uppsala University), optical characterization of bulk MAX phase materials Ola Wilhelmsson (Department of Materials Chemistry, Uppsala University), manufacturing of thin film Max phase materials C-G Ribbing and Richard Karmhag (Department of Engineering Sciences, Uppsala University), discus-sion Hans Högberg and Torbjörn Joelsson (IFM, Linköping University), manufacturing of thin film Max phase materials
4
2 Background
This chapter gives the physical background for the materials parameters searched for, the measurement techniques used, the requirements given by the parts to be coated and a short description of the candidate materials. Note that all formulas are written in SI units
2.1 Heat transfer in a Mercury environment Heat can generally be transferred by conduction (within a solid of a non-moving liquid), convection (be-tween a solid and liquid or gas) and radiation (between objects not in contact). Between the instrument and the surrounding space environment, heat is exchanged by radiation. Heat is led by conduction in the instrument structure, and exchanged by radiation between the internal surfaces. Convection will be ne-glected, as well as the internally dissipated heat. The radiation exchange with the environment gives rise to the largest contribution for the temperature changes of the MEFISTO sensor. The instrument will re-ceive heat, qrec, from the Sun and Mercury, and loose heat by thermal emittance, qem, according to
,4TAqqASq
em
Mercrec
σεα
=+=
Eq. 1
where α is the solar absorptance (a material constant), A is the projected area, S is the solar constant (a function of wavelength) and qMerc is the emitted radiation from the planet, ε is the emittance (a material constant), σ is the Stefan-Boltzmann constant, and T is the temperature of the emitting surface. The re-ceived radiation, including the albedo, in the vicinity of Mercury can described by qrec = A·S0·1.1(JAXA, 2004). The material constants are described in section 2.2.1.
The equations can be submitted to a finite-element method to calculate the transient temperature varia-tion, but this report focuses on the steady-state case for the worst-case scenario.
2.2 Optical properties of materials 2.2.1 Absorptance and emittance The solar absorptance α, and the thermal emittance ε, in Eq. 1, are functions of wavelength and can be obtained from a material by measuring its reflectance, R. The spectral absorption is A=1-R-T, where A, R and T are functions of the wavelength, λ. The values of α and ε can be calculated by weighting the meas-ured spectral absorption with the incoming solar radiation S (function of wavelength, λ) and the thermal blackbody spectrum, B (function of wavelength, λ, and temperature, T), and integrating over the particular wavelength interval (for a certain temperature). The weight function S used in this work is the solar inten-sity distribution in space (2000 ASTM Standard extraterrestrial spectrum reference E-490-00 at air mass 0) (NREL, 2000). The α and ε are thus obtained from
5
,)1()1(
50
2,
50
2,
2
3.0
2
3.0
∫
∫
∫
∫ −−
=
−−
= m
mT
m
mT
m
m
m
m
Bd
BTRde
Sd
STRd
µ
µλ
µ
µλλλ
µ
µλ
µ
µλλλ
λ
λ
λ
λ
α
Eq. 2
where λ is the wavelength, Rλ is the reflectance, Tλ is the transmittance, Sλ is the solar spectra and BT,λ is the black body radiation.
In this study, the emittance refers to the directional one, since it was obtained from Eq. 2 using the re-flectance data for 25 degrees angle of incidence, for the infrared wavelength range. It is an approximation to the hemispherical emittance.
The optical constants can be obtained by different measurement techniques and inversion methods that fit models to the spectra. The reflectance (R) and transmittance (T) can be measured with spectropho-tometry (see section 3.2.2), and submitted to Kramers-Kronig analysis. This method uses the coupling between the real and imaginary parts of the dielectric function. The optical response for all wavelengths is needed, so the method involves extrapolated values. This method was used to obtain the optical constants of the ITO (Hultåker, 2002) and the bulk MAX-phase materials (Pettersson, 2003).
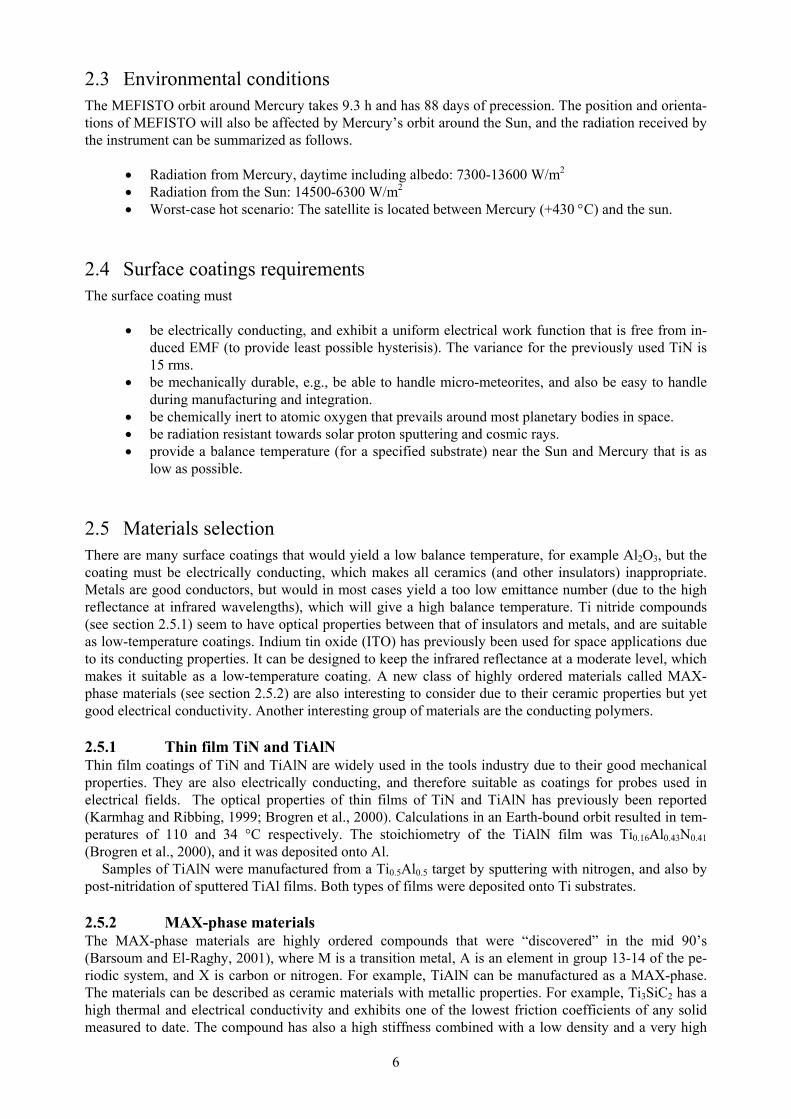
2.2.2 Thin film interference The absorption in a layer of thickness d decreases with e-αd, so the criterion for a film to be thin is that the optical density, αd, should be of the order of 1, or lower. Further, α~k/λ, hence kd/λ≤ 1.
N1=n1+ik1
t1 r2
t1 t2
r1
ϕ1
ϕ0
t1
n0
n2
interface 1
interface 2
ϕ2
Fig. 2-1 Multiple reflections in a thin film layer of refractive index N1, the angle of incidence is ϕ0, the substrate refractive index is n2 and the refractive index of the ambient medium is n0
The thin film reflectance can be calculated with the Fresnel formalism (Born and Wolf, 1980) by
∗
−
−
⋅=
++
=+−
=
=
rrR
errerrrr
nnnn
r
dN
i
i
δ
δ
ϕλπδ
221
2211
2,11,0
2,11,02,1
01
1
cos2
Eq. 3
where δ is the phase, λ is the wavelength, N1 is the complex refractive index of the film, d is the film thickness, ϕ0 is the angle of incidence and r1,2 are the reflectance coefficients, and R is the measurable intensity. The formulas in Eq. 3 are due for a single film on a semi-infinite substrate. The indices 1 and 2 correspond to the different interfaces shown in Fig. 2-1.
6
2.3 Environmental conditions The MEFISTO orbit around Mercury takes 9.3 h and has 88 days of precession. The position and orienta-tions of MEFISTO will also be affected by Mercury’s orbit around the Sun, and the radiation received by the instrument can be summarized as follows.
• Radiation from Mercury, daytime including albedo: 7300-13600 W/m2 • Radiation from the Sun: 14500-6300 W/m2 • Worst-case hot scenario: The satellite is located between Mercury (+430 °C) and the sun.
2.4 Surface coatings requirements The surface coating must
• be electrically conducting, and exhibit a uniform electrical work function that is free from in-
duced EMF (to provide least possible hysterisis). The variance for the previously used TiN is 15 rms.
• be mechanically durable, e.g., be able to handle micro-meteorites, and also be easy to handle during manufacturing and integration.
• be chemically inert to atomic oxygen that prevails around most planetary bodies in space. • be radiation resistant towards solar proton sputtering and cosmic rays. • provide a balance temperature (for a specified substrate) near the Sun and Mercury that is as
low as possible.
2.5 Materials selection There are many surface coatings that would yield a low balance temperature, for example Al2O3, but the coating must be electrically conducting, which makes all ceramics (and other insulators) inappropriate. Metals are good conductors, but would in most cases yield a too low emittance number (due to the high reflectance at infrared wavelengths), which will give a high balance temperature. Ti nitride compounds (see section 2.5.1) seem to have optical properties between that of insulators and metals, and are suitable as low-temperature coatings. Indium tin oxide (ITO) has previously been used for space applications due to its conducting properties. It can be designed to keep the infrared reflectance at a moderate level, which makes it suitable as a low-temperature coating. A new class of highly ordered materials called MAX-phase materials (see section 2.5.2) are also interesting to consider due to their ceramic properties but yet good electrical conductivity. Another interesting group of materials are the conducting polymers. 2.5.1 Thin film TiN and TiAlN Thin film coatings of TiN and TiAlN are widely used in the tools industry due to their good mechanical properties. They are also electrically conducting, and therefore suitable as coatings for probes used in electrical fields. The optical properties of thin films of TiN and TiAlN has previously been reported (Karmhag and Ribbing, 1999; Brogren et al., 2000). Calculations in an Earth-bound orbit resulted in tem-peratures of 110 and 34 °C respectively. The stoichiometry of the TiAlN film was Ti0.16Al0.43N0.41 (Brogren et al., 2000), and it was deposited onto Al.
Samples of TiAlN were manufactured from a Ti0.5Al0.5 target by sputtering with nitrogen, and also by post-nitridation of sputtered TiAl films. Both types of films were deposited onto Ti substrates.
2.5.2 MAX-phase materials The MAX-phase materials are highly ordered compounds that were “discovered” in the mid 90’s (Barsoum and El-Raghy, 2001), where M is a transition metal, A is an element in group 13-14 of the pe-riodic system, and X is carbon or nitrogen. For example, TiAlN can be manufactured as a MAX-phase. The materials can be described as ceramic materials with metallic properties. For example, Ti3SiC2 has a high thermal and electrical conductivity and exhibits one of the lowest friction coefficients of any solid measured to date. The compound has also a high stiffness combined with a low density and a very high

7
tolerance towards damage. Furthermore, it seems to maintain these properties at high temperatures, and is also highly resistant to oxidation and thermal shock.
The optical properties of thin films of MAX-phase materials have not been previously reported.
2.5.3 Indium tin oxide (ITO) Indium tin oxide (ITO) (Granqvist and Hultåker, 2002) is widely known as a conductor transparent for visible light. It is frequently used in applications such as low-emissive windows and flat panel displays. Thin film ITO has been deposited onto instruments for space flight, to reduce charging, since ITO is a good conductor. It is also very hard, and has sometimes been used for mechanical protection. It is possi-ble to manufacture ITO with a variety of optical properties, depending on the doping concentration.
2.5.4 PEDT polymer Baytron M is a monomer used in the manufacture of polymeric organic conductors. The conductive polymer formed by polymerization of Baytron M is poly(3,4-ethylenedioxythiophene), or PEDT. PEDT/Tosylate made from Baytron M can be used for the manufacture of intrinsically conductive yet highly transparent coatings (HCStarck, 2004). The manufacture of antistatic and/or conductive polymer coatings must be specifically adapted to the substrate to be coated.

8
3 Sample manufacturing and characterization
This chapter describes the techniques used for sample manufacturing and analysis.
3.1 Sample manufacturing 3.1.1 Physical vapour deposition (PVD) Thin films can be manufactured by physical vapour deposition (PVD) such as sputtering and evaporation. Free atoms from a solid target are released for example by ion bombardment (sputtering) or heating (evaporation). The atoms can react and mix with other substances before or at the deposition on the sub-strate. Sputtering often involves higher energies of the sputtered compounds, and therefore a better adhe-sion in comparison to evaporation.
3.1.2 High temperature nitridation In this process, the material is submitted to a nitrogenous atmosphere at an elevated temperature (ca 800 °C). The surface will react with the nitrogen and form a nitride. Since the nitridation proceeds by diffusion, there will be a gradient interface between the nitride and the material it is grown from.
3.2 Sample characterization 3.2.1 X-ray diffraction X-ray diffraction (XRD) can be used to identify a material and give information about the structure of the material, e.g. phase, lattice stress, texture orientation and grain size (Cullity, 1956). It is based on the con-structive interference between x-rays reflected at different atomic planes. By varying the angle between the incident and diffracted beam and recording the diffracted radiation, a chart with material and phase specific peaks as achieved. The films used in this work were submitted to gracing incidence X-ray dif-fraction, using a Siemens D5000-unit with CuKα raditaion of 1.54 Å.
3.2.2 Optical characterization with spectrophotometry The reflectance measurements in the near-ultraviolet/visible/near-infrared range were done with a Perkin-Elmer Lambda 900 spectrophotometer. This is a single beam instrument operating in the range 300 to 2500 nm. The light is collected in an integrating sphere covered with Spektralon which is also used as a reflectance reference.
The infrared optical measurements were recorded with a Perkin-Elmer 983 spectrophotometer. This is a double beam instrument with a rotating mirror operating in the range 2 to 50 µm. Sputtered gold mirrors were used as references, and the angle of incidence was 25°. The incident infrared radiation was to a good approximation equal to that of the unpolarized one. It was verified in several cases that the measured re-flectance corresponded to the average of the values obtained for s- and p-polarized radiation. To improve the signal to noise ratio, an air dryer was used.
The area of the thin film MAX-phase samples was smaller than the incoming beam, so delimiting masks were used when measuring. The data correction was done according to
,,,
,,
maskmeasuredreferencemeasured
maskmeasuredmasksamplemeasuredsample SS
SSS
−
−= +
Eq. 4

9
where Ssample is the corrected signal from the sample, Smeasured,sample+mask is the signal from the sample with mask, Smeasured,mask is the signal from the mask only, Smeasured,reference is the signal from the reference measurement.

10
4 Results
This chapter gives a graphical presentation of the measured and simulated values.
4.1 Introduction The reflectance is the key parameter when the balance temperature is to be determined. If the measured reflectance is inserted in Eq. 2 and Eq. 1, the balance temperature is obtained for the specific sample, at an arbitrary initial temperature. The calculated temperature is set to the new initial temperature, and the procedure is iterated until “equilibrium” is reached (i.e. the difference between the initial and resulting temperature is less than 0.5 degrees).
If the optical constants (see section 2.2.1) are known, the reflectance for different film thicknesses can be simulated, and an optimal thickness (yielding the lowest temperature) can be found. The temperature iteration for each thickness also remains. The optical constants for the substrate are needed as well.
In most of the graphs, the Gaussian shaped black body spectrum and the solar radiation spectrum are included (see section 2.2.1 about these weight functions). The blackbody radiation is due for the coating at the calculated “equilibrium” temperature. The calculated alfa, epsilon and temperature in °C (called TC) are also included. The x-axis shows the logarithmic wavelength in µm. All spectra are normalized to one.
4.2 TiAlN The measured reflectance of the previously manufactured TiAlN film was used to calculate the balance temperature in a Mercury environment. It was found to be 270 °C (see Fig. 4-1), and the alfa/epsilon value was 1.3. The balance temperature for the new samples (see Fig. 4-2 to Fig. 4-8) varied between 300 and 400 °C, and the corresponding alfa/epsilon value varied between 1.6 and 3.0. The difference in reflec-tance for different film thicknesses was small. The sputtered films had lower balance temperatures than the nitrided ones. The sputtered TiAlN films in Fig. 4-1 (old type) and Fig. 4-3 (new type) were 0.65 and 0.60 µm thick, and both reflectance spectra exhibit a dip around the long wavelength edge of the black-body spectrum, which increases the emittance. No such feature was found in the nitrided films. The ab-sorption of the sputtered TiAlN was quite high (≈ 0.75) while that of the nitrided films was considerably lower (≈ 0.42). The emittance of the nitrided films was unfortunately very low, yielding a high alfa/epsilon values.

11
4.2.1 Measured reflectance of sputtered TiAlN (old)
Fig. 4-1 Measured reflectance of previously sputtered TiAlN, 0.65 µm thick. The balance tem-perature was 270 °C.
4.2.2 Measured reflectance of sputtered TiAlN (new)
Fig. 4-2. Measured reflectance of sputtered TiAlN, 0.2 µm thick. The balance temperature was 330 °C and alfa/epsilon = 1.9.
Fig. 4-3. Measured reflectance of sputtered TiAlN, 0.6 µm thick. The balance temperature was 300 °C and alfa/epsilon = 1.6.

12
Fig. 4-4. Measured reflectance of sputtered TiAlN, 1.0 µm thick. The balance temperature was 310 °C and alfa/epsilon = 1.7.
Fig. 4-5. Measured reflectance of sputtered TiAlN, 2.1 µm thick. The balance temperature was 310 °C and alfa/epsilon = 1.7.
4.2.3 Measured reflectance of nitrided TiAl
Fig. 4-6 Measured reflectance of nitrided TiAl, 0.2 µm thick. The balance temperature was 370 °C and alfa/epsilon = 2.6.
13
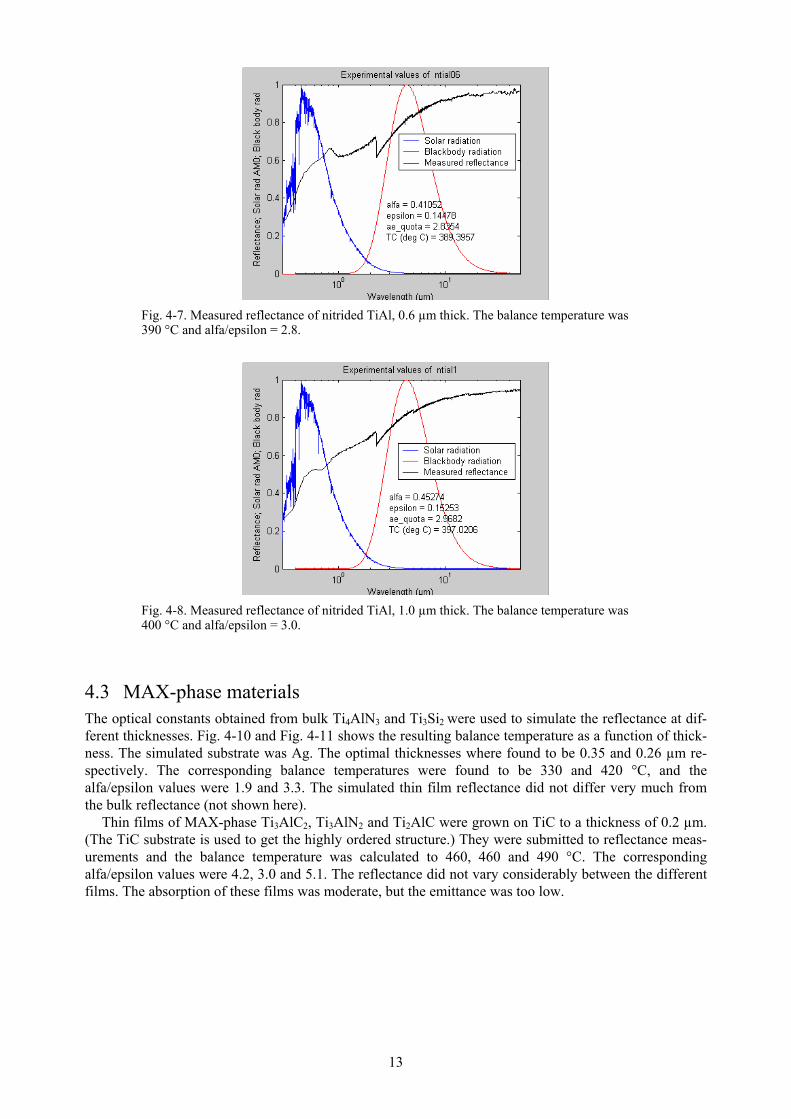
Fig. 4-7. Measured reflectance of nitrided TiAl, 0.6 µm thick. The balance temperature was 390 °C and alfa/epsilon = 2.8.
Fig. 4-8. Measured reflectance of nitrided TiAl, 1.0 µm thick. The balance temperature was 400 °C and alfa/epsilon = 3.0.
4.3 MAX-phase materials The optical constants obtained from bulk Ti4AlN3 and Ti3Si2 were used to simulate the reflectance at dif-ferent thicknesses. Fig. 4-10 and Fig. 4-11 shows the resulting balance temperature as a function of thick-ness. The simulated substrate was Ag. The optimal thicknesses where found to be 0.35 and 0.26 µm re-spectively. The corresponding balance temperatures were found to be 330 and 420 °C, and the alfa/epsilon values were 1.9 and 3.3. The simulated thin film reflectance did not differ very much from the bulk reflectance (not shown here).
Thin films of MAX-phase Ti3AlC2, Ti3AlN2 and Ti2AlC were grown on TiC to a thickness of 0.2 µm. (The TiC substrate is used to get the highly ordered structure.) They were submitted to reflectance meas-urements and the balance temperature was calculated to 460, 460 and 490 °C. The corresponding alfa/epsilon values were 4.2, 3.0 and 5.1. The reflectance did not vary considerably between the different films. The absorption of these films was moderate, but the emittance was too low.

144.3.1
4.3.1 Simulations of thin film MAX-phase Ti4AlN3 and Ti3Si2
Fig. 4-9. Iteration of calculation of balance temperature for different thickness of Ti4AlN3 (on Ag). The lowest temperature was 330 °C for 0.35 µm.
Fig. 4-10. Simulated reflectance of Ti4AlN3 (on Ag) at a thickness of 0.35 µm, yielding a bal-ance temperature of 330 °C and alfa/epsilon = 1.9.
Fig. 4-11. Iteration of calculation of balance temperature for different thickness of Ti3SiC2 (on Ag). The lowest temperature was 420 °C for 0.26 µm.
15
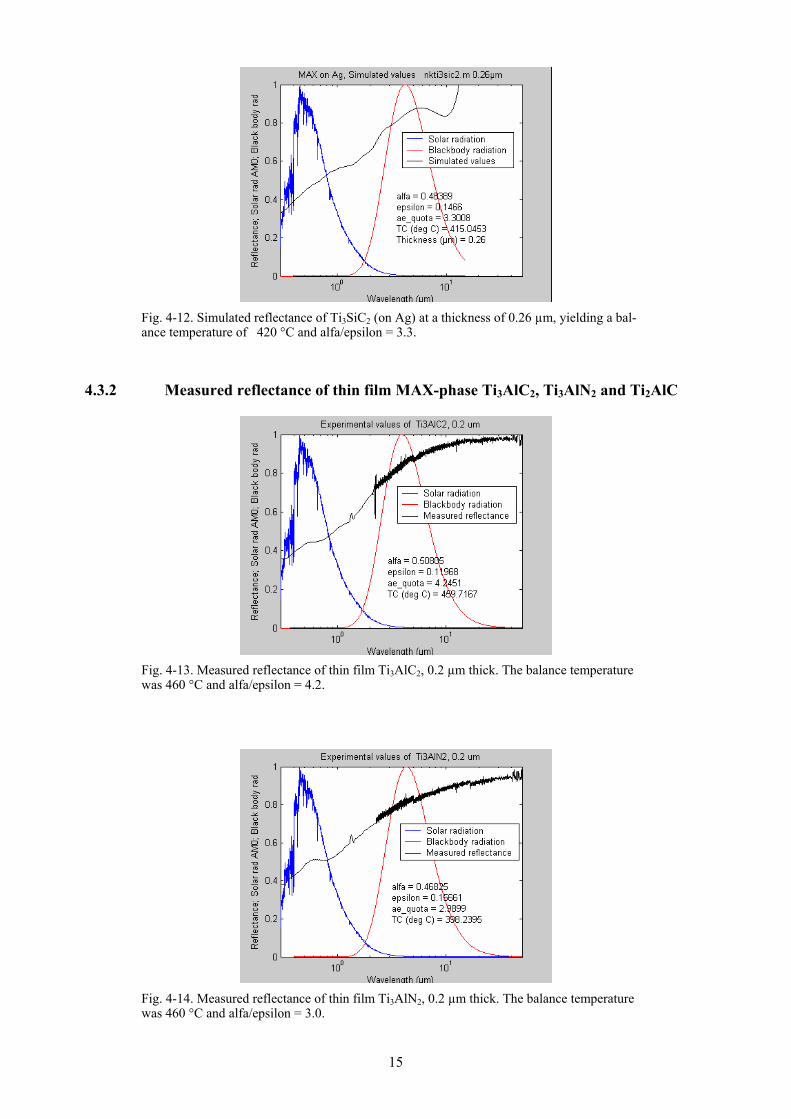
Fig. 4-12. Simulated reflectance of Ti3SiC2 (on Ag) at a thickness of 0.26 µm, yielding a bal-ance temperature of 420 °C and alfa/epsilon = 3.3.
4.3.2 Measured reflectance of thin film MAX-phase Ti3AlC2, Ti3AlN2 and Ti2AlC
Fig. 4-13. Measured reflectance of thin film Ti3AlC2, 0.2 µm thick. The balance temperature was 460 °C and alfa/epsilon = 4.2.
Fig. 4-14. Measured reflectance of thin film Ti3AlN2, 0.2 µm thick. The balance temperature was 460 °C and alfa/epsilon = 3.0.

16
Fig. 4-15. Measured reflectance of thin film Ti2AlC, 0.2 µm thick. The balance temperature was 490 °C and alfa/epsilon = 5.1.
4.4 Simulated reflectance of sputtered indium tin oxide (ITO) Thin films of ITO were previously manufactured and optically analyzed in the thesis of Annette Hultåker (Hultåker, 2002). Page 67 of the thesis is reprinted in Fig. 4-15. It shows the spectral reflectance and transmittance of ITO samples with a moderately low infrared reflectance and a high transmittance at shorter wavelengths, which should yield a low alfa/epsilon value (see section 2.2.1). All films were de-posited onto Corning glass 7059, and the thickness was around 120 nm. The optical constants were ob-tained from Kramers-Kronig analysis (Hultåker, 2004). Simulations of the reflectance of the ITO onto Corning 7059 glass are compared to the measured values (in Fig. 4-16, Fig. 4-19, Fig. 4-22 and Fig. 4-25) to verify the validity of the optical constants. The thicknesses were found to be around 120 µm, in agree-ment with the real films. The simulated reflectance is erroneous at long wavelengths, but this is of less importance since the black body radiation is approximately zero in this region.
A selection of interesting ITO films was simulated with an Ag substrate, for different film thickness. The lowest balance temperature, 200 °C, was found for the film corresponding to batch D n.a. (“not an-nealed”) in Fig. 4-15, for a thickness of 0.6 µm.
The simulated reflectance for ITO on glass in Fig. 4-20 and Fig. 4-23 is lower than the measured one, where the blackbody spectrum is large, and the emittance is probably slightly overestimated. This is not the case for the film in Fig. 4-17, which yielded the lowest balance temperature.
The results are due for a flat sample, while the real geometry will be a twinned plait.

17
Fig. 4-16 Page 67 from the thesis of Annette Hultåker (Hultåker, 2002), showing the measured reflectance and transmittance for different ITO samples for different annealing times.
Fig. 4-17. Simulated and measured reflectance of ITO (type 5650) onto Corning 7059 glass.

18
Fig. 4-18. Iteration of balance temperature calculations for different thickness of ITO (type 5650) on an Ag substrate. The lowest temperature was 200 °C for 0.6 µm.
Fig. 4-19. Simulated reflectance of 0.6 µm ITO (type 5650) on an Ag substrate. The balance temperature was 200 °C and alfa/epsilon = 0.71.
Fig. 4-20. Simulated and measured reflectance of ITO (type 4350) onto Corning 7059 glass.

19
Fig. 4-21. Iteration of balance temperature calculations for different thickness of ITO (type 4350) on an Ag substrate. The lowest temperature was 220 °C for 0.8 µm.
Fig. 4-22. Simulated reflectance of 0.8 µm ITO (type 4350) on an Ag substrate. The balance temperature was 220 °C and alfa/epsilon = 0.9.
Fig. 4-23. Simulated and measured reflectance of ITO (type 43300) onto Corning 7059 glass.

20
Fig. 4-24. Iteration of balance temperature calculations for different thickness of ITO (type 43300) on an Ag substrate. The lowest temperature was 240 °C for 0.8 µm
Fig. 4-25. . Simulated reflectance of 0.8 µm ITO (type 43300) on an Ag substrate. The balance temperature was 240 °C and alfa/epsilon = 1.0.
21
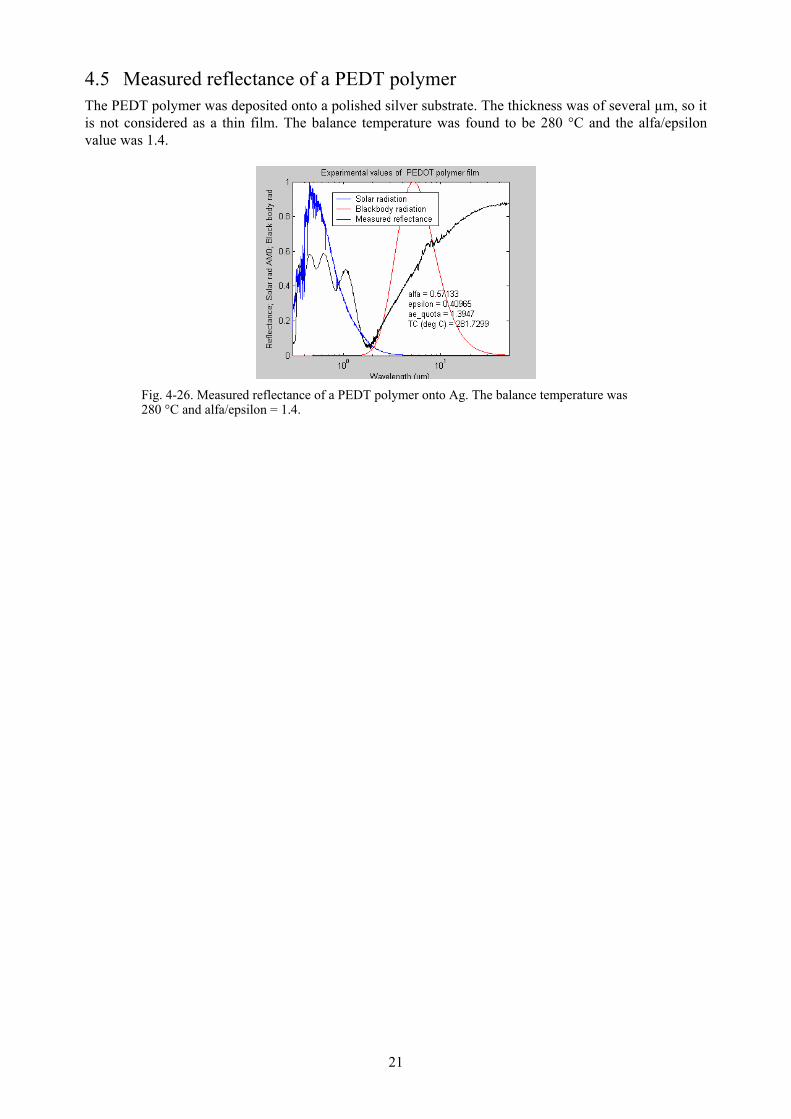
4.5 Measured reflectance of a PEDT polymer The PEDT polymer was deposited onto a polished silver substrate. The thickness was of several µm, so it is not considered as a thin film. The balance temperature was found to be 280 °C and the alfa/epsilon value was 1.4.
Fig. 4-26. Measured reflectance of a PEDT polymer onto Ag. The balance temperature was 280 °C and alfa/epsilon = 1.4.
22
5 Summary and conclusions
The balance temperature, with the environmental conditions of Mercury, has been calculated from • the measured reflectance of previously manufactured thin films of TiAlN, • the measured reflectance measured from sputtered thin films of TiAlN and nitrided TiAl, • the measured reflectance of thin films of MAX-phase compounds, • the simulated reflectance obtained from optical constants of bulk MAX-phase compounds, • the simulated reflectance obtained from optical constants of thin film ITO and • the measured reflectance of a PEDT polymer.
The lowest balance temperature from measured reflectance was found for the previously manufactured TiAlN, T = 270 °C and alfa/epsilon = 1.3. The lowest temperature for simulated values was obtained from the ITO, T = 200 °C and alfa/epsilon = 0.71.
There was no decrease in temperature with the new types of TiAlN. These samples were manufactured from a target with a fixed composition (50% Ti and 50% Al), while the previously reported film had the stoichiometry Ti0.16Al0.43N0.41. The MAX phase materials yielded temperatures between 330 and 490 °C, which make them inappropriate for this type of application. The PEDT polymer showed a quite low bal-ance temperature of 280 °C, but the most interesting results came from the simulations of the ITO films. The lowest balance temperature of the ITO films investigated was 200 °C. The ITO film can be designed to yield different optical properties, and it is probably possible to further optimize it for a low balance temperature, since this was not the aim of the previous work.
Conclusions: The results indicate that a 0.65 µm sputtered Ti0.16Al0.43N0.41 is a candidate material for the probes, yielding a balance temperature of less than 300 °C.
Simulations showed that 0.6 µm film of ITO of batch “D n.a.” (Hultåker, 2002), onto Ag, yielded 200 °C for a flat sample configuration. The ITO is considered to be a candidate material for the co-axial ca-bles.

23
References
Barsoum, M. W. and T. El-Raghy (2001). "The MAX phases: Unique new carbide and nitride materials." American Scientist 89: 334-343. Blomberg, L. G., H. Matsumoto, J.-L. Bougeret, H. Kojima, S. Yagitani, M. André, L. Bylander, J. A. Cumnock, A. I. Eriksson, P.-A. Lindqvist, G. T. Marklund, M. Morooka, J. E. Wahlund, L. Åhlén, J. A. Holtet, E. Kallio, Y. Kasaba, K. Lappalainen, B. Lybekk, M. Moncuquet, K. Mursula, A. Mälkki, H. J. Opgenoorth and J. A. Trotignon, MEFISTO - An electric field instrument for BepiColombo/MMO, Adv. Space Res., (to be submitted). Born, M. and E. Wolf (1980). Principles of optics. London, Pergamon Press. Brogren, M., G. L. Harding, R. Karmhag, C. G. Ribbing, G. A. Niklasson and L. Stenmark (2000). "Tita-nium-aluminum-nitride coatings for satellite temperature control." Thin Solid Films 370(1): 268-277. Cullity, B. D. (1956). Elements of x-ray diffraction. Massachusetts, Addison-Wesley. ESA, http://www.esa.int/export/esaSC/120391_index_0_m.html, 2004 Granqvist, C. G. and A. Hultåker (2002). "Transparent and conducting ITO films: New developments and applications." Thin Solid Films 411(1): 1-5. HCStarck, http://www.hcstarck-echemicals.com/, 2004 Hultåker, A. Transparent conductive tin doped indium oxide. Ph.D. thesis, (Dep. of Materials Science, Uppsala University: 138, 2002). Hultåker, A., Personal communication, 2004 JAXA, Personal communication, 2004 Karmhag, R. and C. G. Ribbing (1999). "TiN-alloy coatings for temperature control of space vessels." Applied Optics 38(4): 674-678. NREL, http://rredc.nrel.gov/solar/spectra/am0/ASTM2000.html, 2000 Pettersson, H. Optical characterization of two MAX-compounds. Master's thesis, Dep. of Materials Sci-ence, 2003). Veszelei, M. Preparation and characterization of sputtered metal oxides and nitrides for optical applica-tions. Ph.D. Thesis, (Dep. of Materials Science, Uppsala University, 1997).