low temperature catalytic oxidation of h2s over · pdf filefuel(vehicles(( heat( electricity...
TRANSCRIPT

Low temperature catalytic oxidation of H2S
over V2O5/CeO2 Catalysts
DIIN- Department of Industrial Engineering University of Salerno
Vincenzo Palma*, Daniela Barba , Paolo Ciambelli
December 11-13, 2013
European Fuel Cell Technology & Applications

Biogas INTRODUCTION
Renewable Energy Source Agricultural
Waste Biomass
Sewage Sludge
Industrial Waste Utilization
Fuel Vehicles Heat Electricity Fuel Cell

Molten Carbonate Fuel Cells (MCFC)
CO2 + ½ O2 + 2e-‐ →CO32-‐ Catode
H2 + CO3
2-‐ →H2O + CO2 + 2e-‐ Anode
q Can lead to the poisoning of the anode and electrolite q Can deactivate of sites for the oxidation
INTRODUCTION
Poisoning problem of the cells by H2S
(sulphur content allowed <1 ppm)

Clean-‐up Biogas : Purification Processes
Dry Processes
Chemical Absorption in aqueous solutions
Physical Solvent Membrane Separation
Biological Desulfurization
INTRODUCTION

Clean-‐up Biogas : Oxidation Processes
Ø Catalytic Oxidation: Claus Process
Ø Selective Catalytic Oxidation at Low Temperature:
T=950-‐1250°C
T=170-‐350°C
T=150-‐250°C
𝟐𝐇↓𝟐 𝐒 + 𝐒𝐎𝟐= 𝟑⁄𝐧 𝐒𝐧+ 𝟐𝐇↓𝟐 𝐎
𝐇↓𝟐 𝐒 + 𝟑⁄𝟐 𝐎𝟐= 𝐒𝐎↓𝟐 + 𝐇↓𝟐 𝐎
𝟏⁄𝐧 𝐒↓𝐧 + 𝐎𝟐= 𝐒𝐎↓𝟐 Temperature and catalyst influence the reaction
mechanism and the process selectivity
Innovative process for H2S abatement
INTRODUCTION

Catalysts Formulation (2.55%-‐20% v2o5)
Temperature (150-‐250°C)
Contact Time (4-‐80 ms)
Aim of the work Ø Previous works.. Among the others V/Ce seems to be most promising
Ø IN THIS WORK IMPROVE THE PROCESS SELECTIVITY TO SULFUR
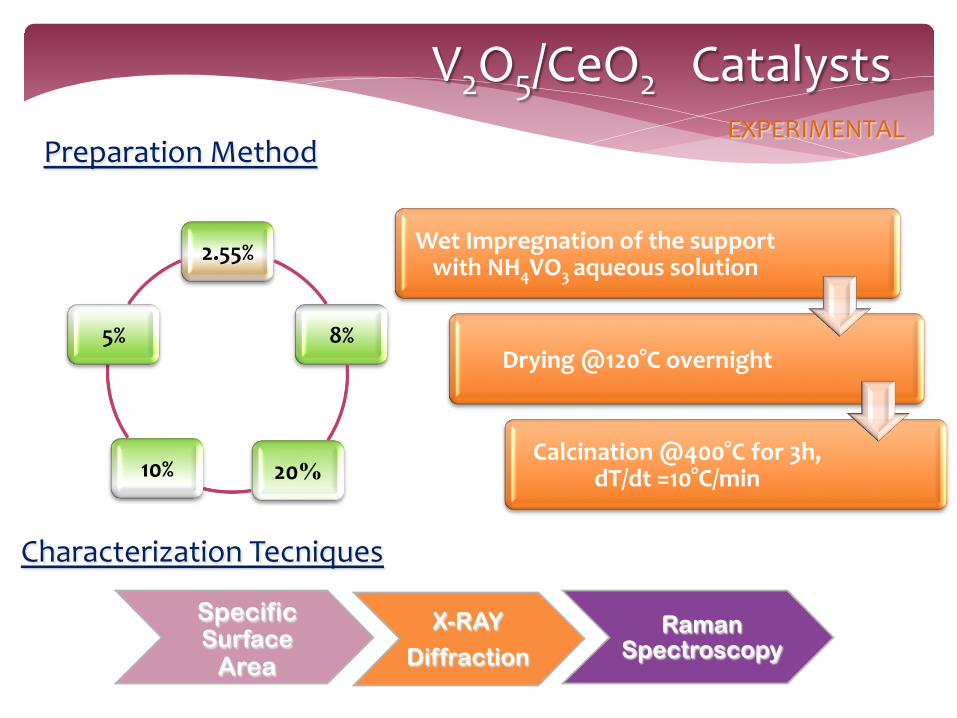
V2O5/CeO2 Catalysts
2.55%
8%
20% 10%
5%
Wet Impregnation of the support with NH4VO3 aqueous solution
Drying @120°C overnight
Calcination @400°C for 3h, dT/dt =10°C/min
EXPERIMENTAL Preparation Method
Characterization Tecniques
X-RAY
Diffraction
Raman Spectroscopy
Specific Surface
Area
Catalysts Characterization
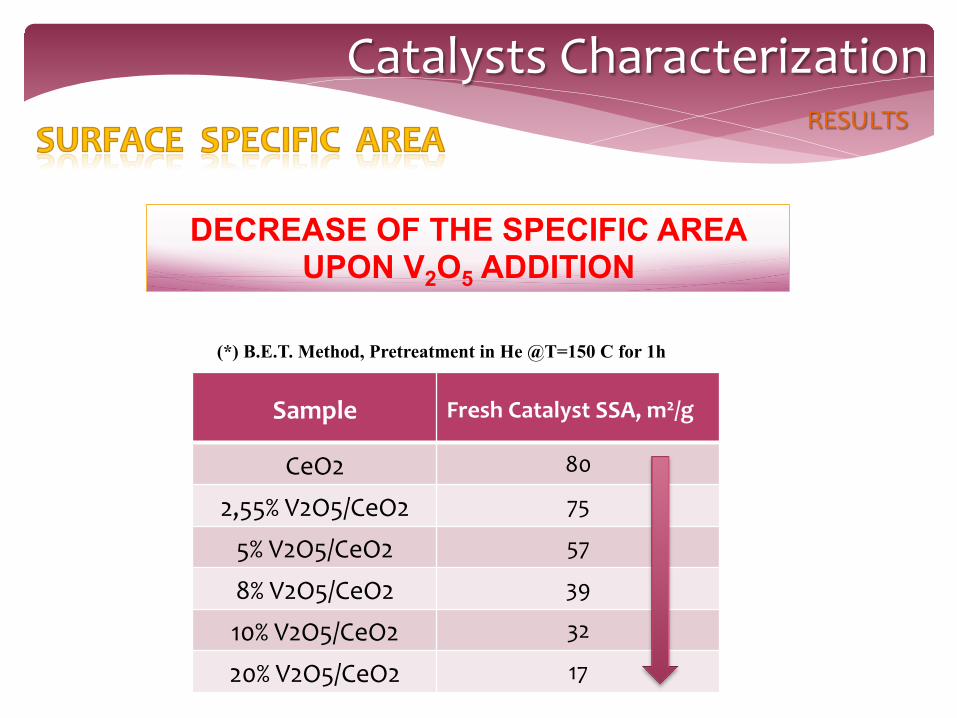
(*) B.E.T. Method, Pretreatment in He @T=150 C for 1h
DECREASE OF THE SPECIFIC AREA UPON V2O5 ADDITION
Sample Fresh Catalyst SSA, m2/g
CeO2 80
2,55% V2O5/CeO2 75
5% V2O5/CeO2 57
8% V2O5/CeO2 39
10% V2O5/CeO2 32
20% V2O5/CeO2 17

Catalysts Characterization
CeO2
EXPERIMENTAL
CeO2
V=O
V2O5
Polyvanadate

Laboratory Apparatus Plant
Feed Section
Analysis Section
Reaction Section
Analysis Section Mass Spectrometer
FT-‐IR
O2
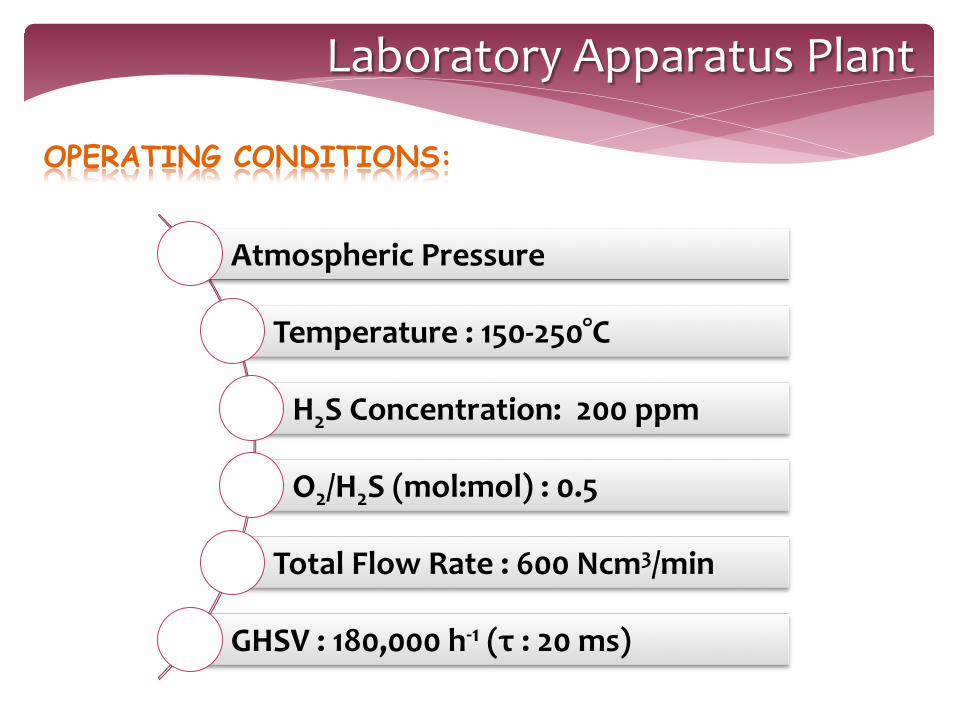
Atmospheric Pressure
Temperature : 150-‐250°C
H2S Concentration: 200 ppm
O2/H2S (mol:mol) : 0.5
Total Flow Rate : 600 Ncm3/min
GHSV : 180,000 h-‐1 (τ : 20 ms)
Laboratory Apparatus Plant
OPERATING CONDITIONS:

Catalytic Activity Tests
H2S
O2
SO2
T=150°C, 60 min
H2O
sig
nal,
-
H2O

Catalytic Activity Tests RESULTS
High Activity at any temperature
H2S conversion >90% @T≥200°C
Catalytic Activity Tests
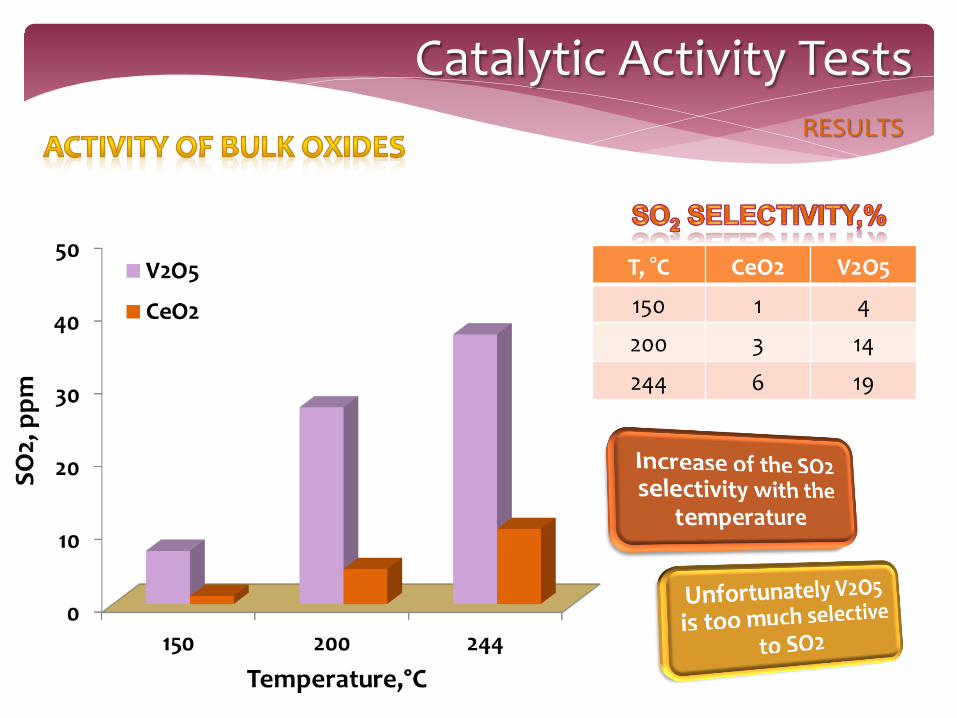
T, °C CeO2 V2O5
150 1 4
200 3 14
244 6 19

Catalytic Activity Tests
H2S conversion (~100%)
for the 20%V2o5/Ceo2
Minimization of So2 selectivity (~1%) for the 20%V2o5/Ceo2

Catalytic Activity Tests
Decrease of H2S conversion
With the temperature
Increase of SO2 selectivity
With the temperature

SSA Fresh Catalyst = 17 m2/g
Catalytic Activity Tests
Increase of the surface area
Oxidation of sulphur deposited on the catalyst
surface H2S --> S --> SO2
T=150°C
Contact Time, ms 4 10 20 40 80
xH2S, % 50 88 94 96 98
SO2, ppm 0 2 4 13 14
Y SO2,% 0 0,5 1 2,7 3
T=150°C
Increase of SO2 concentration

Conclusion X-‐Ray Diffraction & Raman Spectroscopy
Ø Good dispersion of V2O5 for all the catalysts Ø Low content of crystalline vanadium on the 20%V2O5/CeO2
Influence of the vanadium loading
Ø Improvement of the catalytic activity to the increase of V2O5 Ø Highest H2S conversion (~100%) and lowest SO2 selectivity (1%) @150°C for the 20%V2O5/CeO2 catalyst
Influence of the Contact Time
Ø Effect on the specific area and the SO2 selectivity
FUTURE WORKS
Effect of Temperature (<150°C) with the Contact Time
Influence of the vanadium loading (>20%)
Identification of sulphur species
Low temperature catalytic oxidation of H2S over V2O5/CeO2 Catalysts
Vincenzo Palma*, Daniela Barba , Paolo Ciambelli
DIIN- Department of Industrial Engineering University of Salerno
Piero Lunghi Conference, December 11-13, 2013


0
20
40
60
80
100
0 2 4 6 8 10 12
Gas Velocity, cm/s
H2S
Con
vers
ion,
%
External Diffusion
External and Internal Mass Transfer resistance
T=250°C, H2S=200 ppm, O2/H2S=0.5
Internal Mass Transfer resistance was observed for size particles > 180 μm
Flow Rate: 200, 300, 400, 800 Ncm3/min
0102030405060708090100
H2S
co
nve
rsio
n,
%
38-180 180-355 355-710
Size Particles, micrometer
Size Particles, µm : • 38-180 • 180-355 • 355-710
Flow Rate, Ncm3/min VGAS, cm/s XH2S, %
200 2.6 56
300 4 64
400 5.3 67
800 10.6 67
External Mass Transfer resistance was observed for linear gas velocity < 5 cm/s
t = 2ms
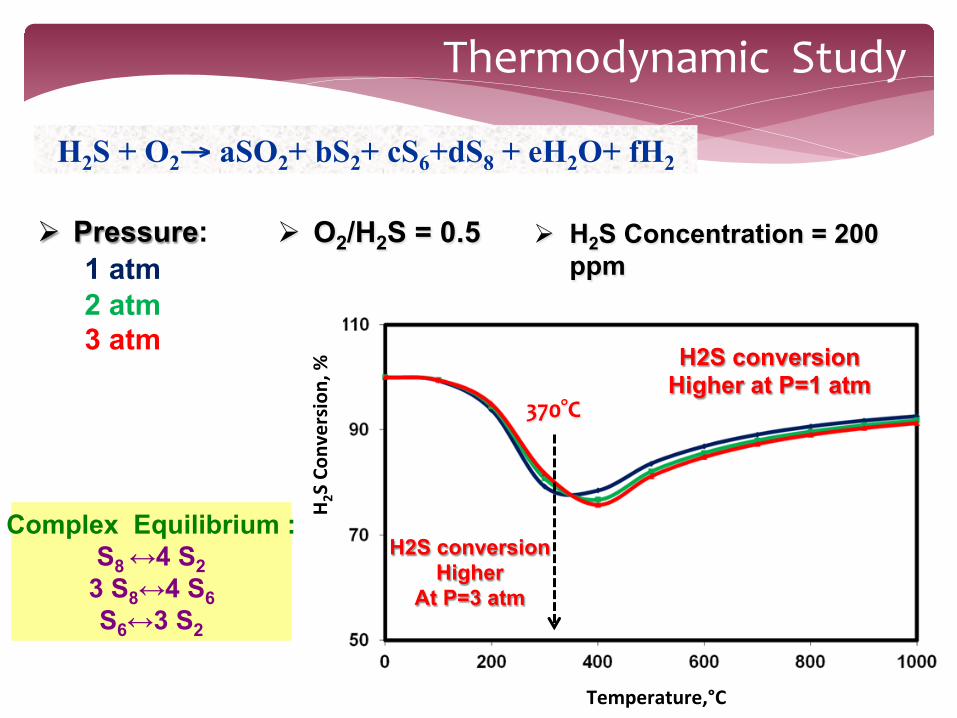
Ø Pressure: 1 atm 2 atm 3 atm
Ø H2S Concentration = 200 ppm
Complex Equilibrium : S8 ↔4 S2
3 S8↔4 S6 S6↔3 S2
H2S + O2→ aSO2+ bS2+ cS6+dS8 + eH2O+ fH2
Temperature,°C
H 2S Co
nversion
, % H2S conversion
Higher at P=1 atm
H2S conversion Higher
At P=3 atm
370°C
Ø O2/H2S = 0.5
Thermodynamic Study
Thermodynamic Study
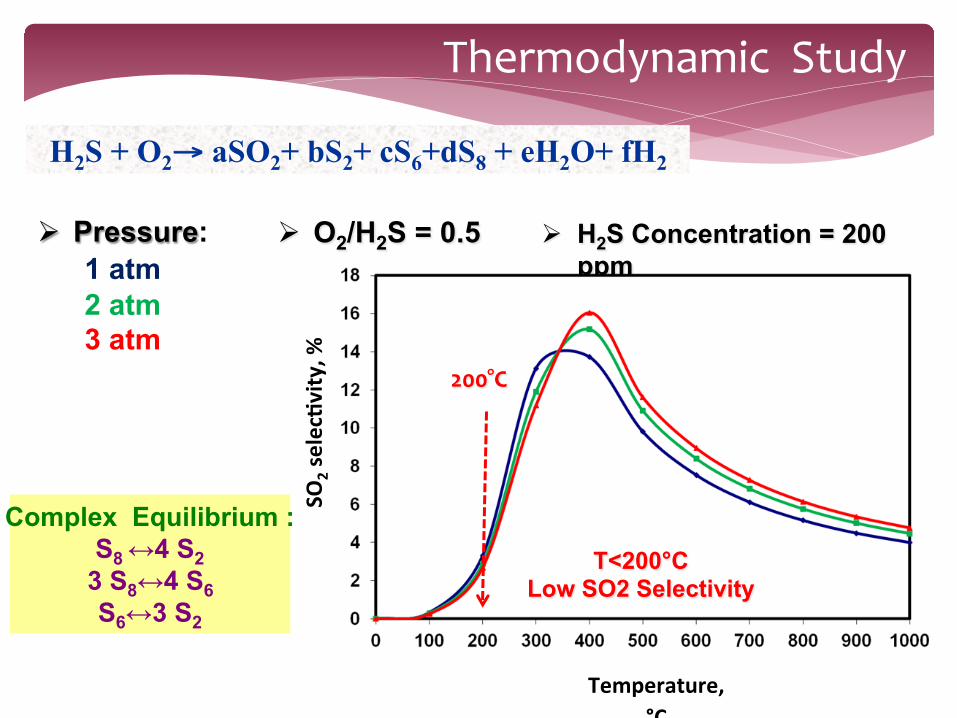
Ø Pressure: 1 atm 2 atm 3 atm
Ø O2/H2S = 0.5 Ø H2S Concentration = 200 ppm
H2S + O2→ aSO2+ bS2+ cS6+dS8 + eH2O+ fH2
Temperature,°C
SO2 selecKv
ity, %
T<200°C Low SO2 Selectivity
200°C
Complex Equilibrium : S8 ↔4 S2
3 S8↔4 S6 S6↔3 S2

Thermodynamic Study
Ø Pressure: 1 atm 2 atm 3 atm
Ø O2/H2S = 0.5 Ø H2S Concentration = 200 ppm
H2S + O2→ aSO2+ bS2+ cS6+dS8 + eH2O+ fH2
Temperature,°C
S 2 se
lecKvity, %
0
20
40
60
80
100
120
0 200 400 600 800 1000
Temperatura, °C
Sele
ttivi
tà S
2, %
Increase of S2 Selectivity
T> 200°C
Increase of S8 Selectivity
0
20
40
60
80
100
120
0 200 400 600 800 1000
Temperatura, °C
Sele
ttivi
tà S
8, %
Temperature,°C
S 8 se
lecKvity, %
T< 200°C

Adsorption Test of H2S T = 160°C, H2S = 800 ppm
0
100
200
300
400
500
600
700
800
0 10 20 30 40 50 60 70Time, min
H2S
Con
cent
rati
on, p
pm
0
1E-11
2E-11
3E-11
4E-11
5E-11
6E-11
7E-11
H2O
sig
nal m
/z=
18, t
orr
H2S
H2O
H2S adsorbs and reduces the catalyst producing H2O
OHSH ofg 211)(2 +↔+ θθ
Reaction between H2S adsorbed and O2 of the phase active
After the O2 activation via adsorption, the reoxidation of the previously reduced
vanadium to the oxidized vanadium occurs No SO2 , SO3 , H2O formation detected
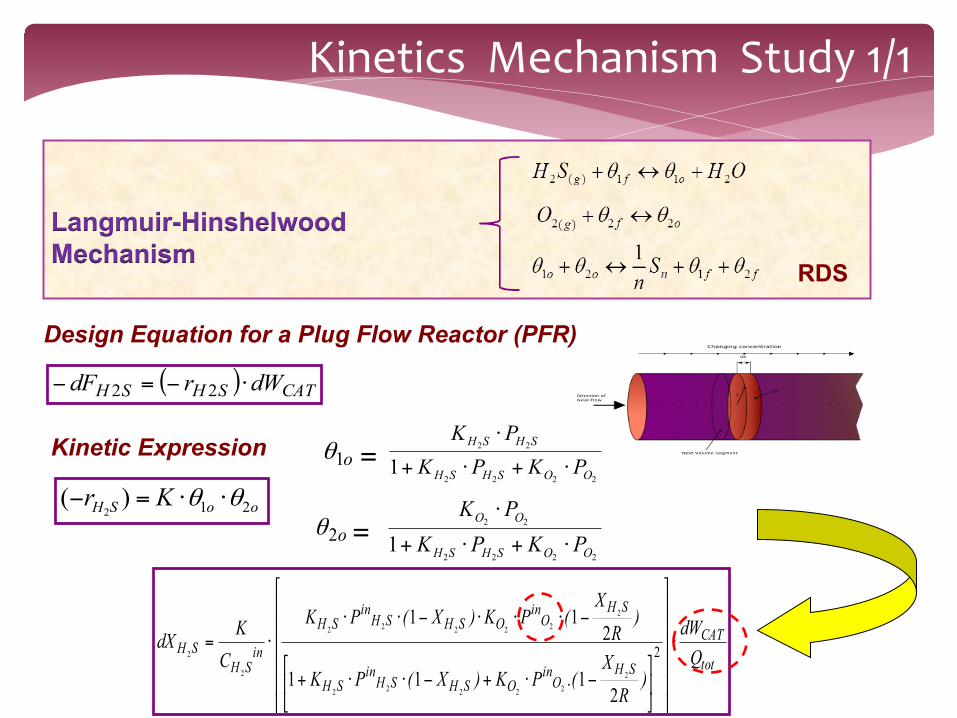
Kinetics Mechanism Study 1/1
Goodness of fit experimental data to the power law model
T = 200°C, 600 ppm H2S
Langmuir-Hinshelwood Mechanism
Design Equation for a Plug Flow Reactor (PFR)
( ) CATSHSH dWrdF ⋅−=− 22
Kinetic Expression
ooSH Kr 21)(2
θθ ⋅⋅=−
tot
CAT
SHO
inOSHSH
inSH
SHO
inOSHSH
inSH
inSH
SH QdW
)R
X.(PK)X(PK
)R
X(PK)X(PK
CKdX ⋅
⎥⎥⎥⎥⎥
⎦
⎤
⎢⎢⎢⎢⎢
⎣
⎡
⎥⎦
⎤⎢⎣
⎡−⋅+−⋅⋅+
−⋅⋅⋅−⋅⋅⋅= 2
2111
211
222222
222222
2
2
=
2222
22
1 OOSHSH
SHSH
PKPKPK
⋅+⋅+
⋅o1θ
o2θ
2222
22
1 OOSHSH
OO
PKPKPK
⋅+⋅+
⋅=
RDS
Goodness of fit experimental data to the power law model
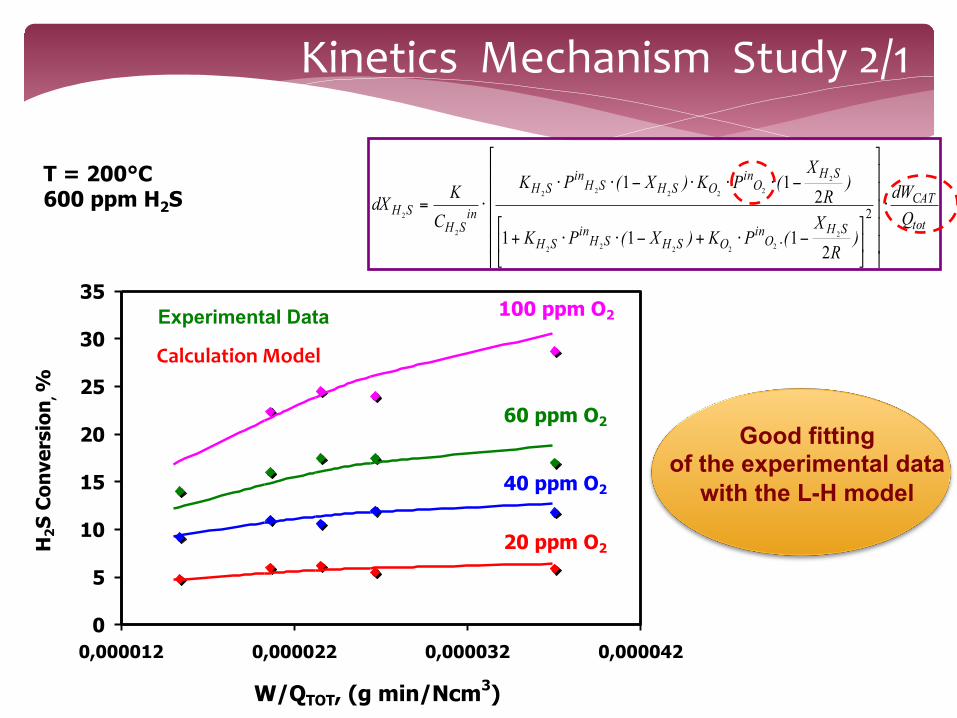
Kinetics Mechanism Study 2/1
T = 200°C 600 ppm H2S
0
5
10
15
20
25
30
35
0,000012 0,000022 0,000032 0,000042
W/QTOT, (g min/Ncm3)
H2S
Con
vers
ion
, %
20 ppm O2
40 ppm O2
60 ppm O2
100 ppm O2 Experimental Data
Calculation Model
tot
CAT
SHO
inOSHSH
inSH
SHO
inOSHSH
inSH
inSH
SH QdW
)R
X.(PK)X(PK
)R
X(PK)X(PK
CKdX ⋅
⎥⎥⎥⎥⎥
⎦
⎤
⎢⎢⎢⎢⎢
⎣
⎡
⎥⎦
⎤⎢⎣
⎡−⋅+−⋅⋅+
−⋅⋅⋅−⋅⋅⋅= 2
2111
211
222222
222222
2
2
Good fitting of the experimental data
with the L-H model
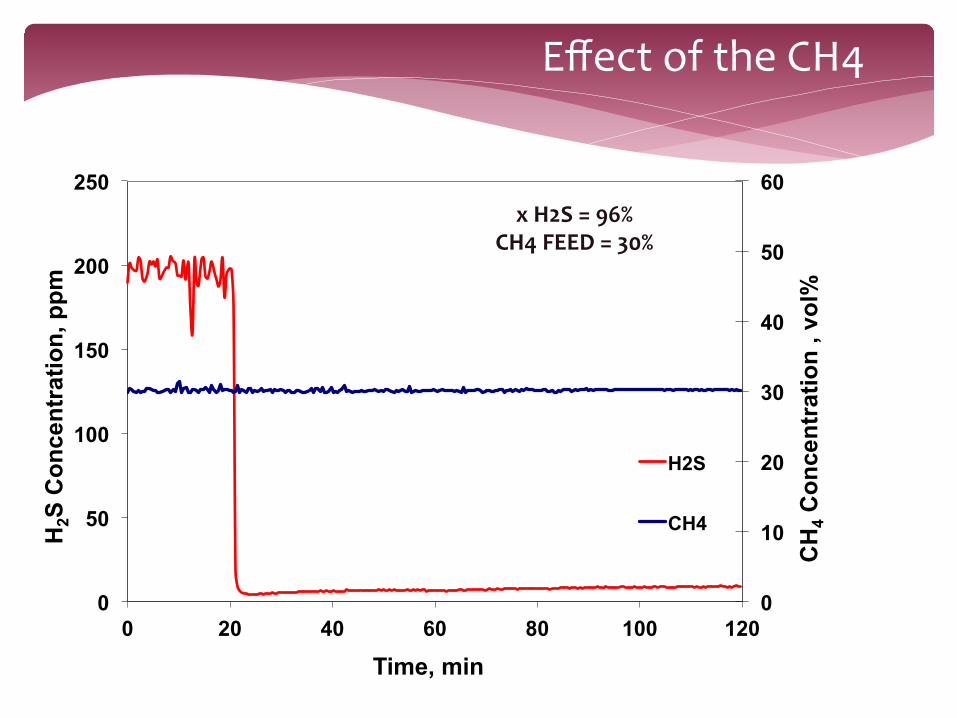
Effect of the CH4
0
10
20
30
40
50
60
0
50
100
150
200
250
0 20 40 60 80 100 120
CH
4 Con
cent
ratio
n , v
ol%
H2S
Con
cent
ratio
n, p
pm
Time, min
H2S
CH4
x H2S = 96% CH4 FEED = 30%