low flow augmentation study river...
TRANSCRIPT

National Rivers Authority (Anglian Region)
Low Flow Augmentation Study River Wensum
Phase I, Stage I Draft Planning Report
May 1990
C f O f S * ,
I I I I MacDonald

N R A f e 2 6 . II ( 4 / 0 . 1 3 - t )
National Rivers Authority (Anglian Region)
Low Flow Augmentation Study River Wensum
#
Phase I, Stage I• Draft Planning Report
May 1990
ENVIRONMENT AGENCY n ' n M o t t
J J J J MacDonald059654

CONTENTS
Page Nr
CHAPTER 1 INTRODUCTION
1.1 Objectives 1-11.2 M ethodology 1-2
* CHAPTER 2 HYDROLOGY
2.1 Introduction 2-12.2 Catchment Description 2-1
# 2.3 Data Availability and Quality 2-22.4 Data Analysis 2-4
2.4.1 Trend Analysis 2-42.4.2 Recession Curve Analysis 2-42.4.3 Estimation o f Augmentation for 1990 2-42.4.4 Discussion o f Results 2-5
CHAPTER 3 HYDROGEOLOGY
3.1 Geology 3-13.2 Groundwater 3-23.3 Piezometry 3-23.4 Existing Boreholes and Aquifer Properties 3-53.5 W ater Quality 3-7
CHAPTER 4 AUGMENTATION SITES
4.1 Selection Criteria 4-14.2 Potential Sites 4-24.3 Environmental Assessment 4-3
4.3.1 Criteria for Assessment 4-34.3.2 Assessment o f Sites 4-4
4.3.3 Costessey Pits 4-6
# '
#
CONTENTS (cont)
CHAPTER 4 (cont) 4.4 Engineering Feasibility4.4.1 General4.4.2 Detailed Requirements of Possible
Sites4.5 Selected Sites
CHAPTER 5 PRELIMINARY DESIGNS AND CONSTRUCTION COSTS
5.1 Introduction5.2 Wells5.3 Pumps and Electricity Supply5.4 Pipelines
5.4.1 Pipeline Sizing5.4.2 Material Options
5.5 Discharge to River5.6 Summary of Construction Costs5.7 Consultancy Inputs
CHAPTER 6 PROGRAMME
6.1 Phase 1 Requirements6.1.1 Introduction6.1.2 Design and Tendering
6.2 Phase 2 Requirements6.2.1 Hydrological Data Collection6.2.2 Observation Piezometers
• CHAPTER 7 CONCLUSIONS AND RECOMMENDATIONS
7.1 Hydrology
7.2 Augmentation Schemes
7.3 Scheme Costs
7.4 Programme
7.5 Observation Wells
REFERENCES
APPENDIX 1 TREND ANALYSIS RESULTS
(ii)
Page Nr
4-64-8
4-10
5-15-15-15-25-25-2
5-45-45-4
6-16-16-2
6-36-36-4
7-17-1
7-2
7-2
7-3
R -l

#
LIST OF TABLES
Table Title Page Nr Nr
2.1 Major Licensed Abstractions 2-22.2 Available Surface W ater Data 2-22.3 Augmentation Requirements 2-5
3.1 Details of Test Bores Within Wensum Catchment 3-33.2 Observation Piezometer Network 3-43.3 Groundwater Licences 3-53.4 Groundwater Abstractions PWS Boreholes 3-63.5 Nitrate Levels in Chalk Boreholes 3-7
4.1 Augmentation Summary 4-11
5.1 Augmentation Works for River Wensum 5-65.2 Augmentation Works for River Wensum 5-75.3 Augmentation Works for River Wensum 5-8
(iii)

#
LIST OF FIGURES
FigureNr
Title Following Page Nr
2.12.22.32.4
2.5
Location Plan: River WensumAnnual Summer Runoff, River Wensum, CostesseyDerivation of Recession CurvePredicted Recession for 1990, Assuming No Current Abstraction Predicted Recession for 1990, Assuming Current Abstraction of 0.4 m’/s
2-12-32-32-4
2-4
3.13.2
3.33.4
Wensum Catchment Geology Wensum Catchment HydrogeologyLongitudinal Section of River Wensum from Costessey M ill River Wensum, Total Oxidised Nitrogen Levels 1989/90
3-13-2
3-53-6
4.14.2
Possible Augmentation Sites Preferred Augmentation Sites
4-24-2
5.1
6.1
Typical Augmentation Well 5-1
River Wensum Phase 1 Implementation Program me-Activities Chart 6-1
(iv)
#

CHAPTER 1
INTRODUCTION
1.1 O bjectives
Mott MacDonald has been appointed by the National Rivers Authority (Anglian Region) to undertake a study of the Rivers Nar and Wensum. Both river catchments are located in north Norfolk. The rivers are fed by groundwater from the Chalk aquifer and are important sources of abstraction for public water supplies. The catchments are also attractive natural habitats with considerable recreation value. River flow augmentation from groundwater may therefore be necessary to maintain both water
supplies and river levels.
The objectives of the study are twofold:
a short term (Phase 1) assessment of available hydrological and hydrogeological data, leading to augmentation well site selection, engineering design and implementation to meet augmentation requirements in the event of continuation of a drought through the summer of 1990;
groundwater/surface water interlinked catchment modelling to determine suitable long term augmentation requirements (Phase 2).
Environmental assessment forms an important part o f the study in considering the impact of augmentation schemes on habitats, particularly woodland and wetland.
Project planning reports have been prepared following the initial stage of assessment in Phase 1.
Separate reports have been prepared for the two catchments. This report for the River Wensum catchment presents the following:
an assessment of hydrological and hydrogeological data;
prediction of river flows assuming continuation of a drought through the summer o f 1990, with estimation of augmentation quantities to meet minimum target flows;
recommendations for augmentation sites and pipeline routes to the river with costings;
a programme for the Phase 1 augmentation works;
discussion of data requirements for the longer term Phase 2 study.

1.2 Methodology
Hydrological and hydrogeological assessments carried out have used pre-existing data provided almost totally by the National Rivers Authority (NRA). The NRA has provided river gauging and abstraction, groundwater level, water quality, test pumping and well abstraction data. Some additional hydrogeological information was available on a hydrogeological map of northern East Anglia. For the environmental assessment information was obtained from the NRA, the Nature Conservancy Council, the Norfolk Naturalists’ Trust and the Norfolk Archaeological Unit.
For augmentation site location, topographical mapping at 1 : 25 000 scale was found most useful, as this shows a large number of water-related features and details o f land boundaries, as well as contouring at 5 m intervals. Site visits were made by hydrogeological, engineering and environm ental staff in selecting recommended augmentation sites from an initial larger number o f options determined in a desk study.
In costing augmentation schemes, typical rates were used from other recent engineering schemes involving similar materials or components. For some items budget rates were obtained through inquiries to contractors or suppliers.
1-2
CHAPTER 2
HYDROLOGY
2.1 In troduction
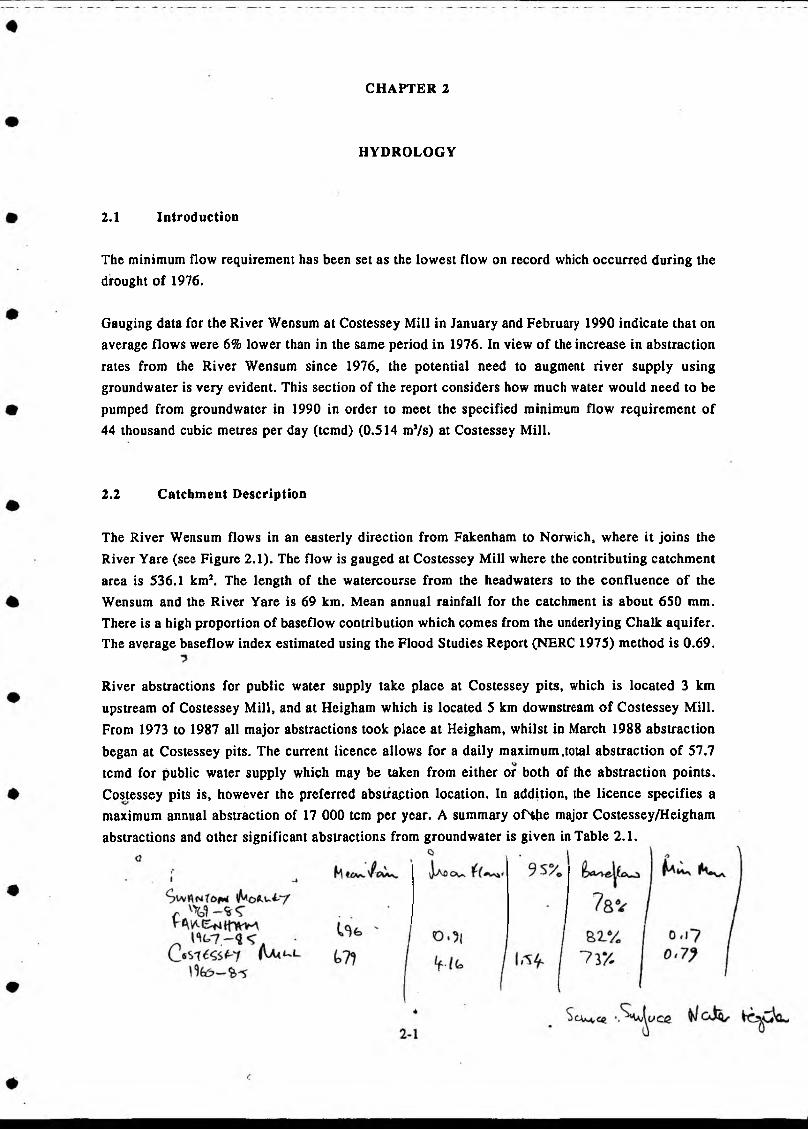
The minimum flow requirement has been set as the lowest flow on record which occurred during the drought o f 1976.
Gauging data for the River Wensum at Costessey Mill in January and February 1990 indicate that onaverage flows were 6% lower than in the same period in 1976. In view o f the increase in abstraction rates from the River Wensum since 1976, the potential need to augment river supply using
pumped from groundwater in 1990 in order to meet the specified minimum flow requirem ent of 44 thousand cubic metres per day (tcmd) (0.514 mVs) at Costessey Mill.
The River Wensum flows in an easterly direction from Fakenham to Norwich, where it jo ins the River Yare (see Figure 2.1). The flow is gauged at Costessey Mill where the contributing catchm ent area is 536.1 km3. The length of the watercourse from the headwaters to the confluence o f the Wensum and the River Yare is 69 km. Mean annual rainfall for the catchment is about 650 mm. There is a high proportion o f baseflow contribution which comes from the underlying Chalk aquifer. The average baseflow index estimated using the Flood Studies Report (NERC 1975) method is 0.69.
River abstractions for public water supply take place at Costessey pits, which is located 3 km upstream of Costessey Mill, and at Heigham which is located 5 km downstream o f Costessey Mill. From 1973 to 1987 all major abstractions took place at Heigham, whilst in March 1988 abstraction
began at Costessey pits. The current licence allows for a daily maximum .total abstraction of 57.7tcmd for public water supply which may be taken from either or both of the abstraction points. Costessey pits is, however the preferred abstraction location. In addition, the licence specifies a maximum annual abstraction of 17 000 tcm per year. A summary ofHhe major Costessey/Heigham abstractions and other significant abstractions from groundwater is given in Table 2.1.
groundwater is very evident. This section of the report considers how much water would need to be
2.2 C atchm ent D escription

River Wensum:Figure 2.1
Location Map
l - J 1____
1 1
-10-s t y
Ay1 sham
Reepham,
Heigham Ri PWS k Trei Works
#111GaugincSta tii
PWS River Intake Costessey
Pits: PWS Storage
!
-TF 0 TG;
Lyng*
SwantonJ <̂ Morl ey j
Fakenham
Beet 1 e y ^ ^ *^ * \ EftSt^ ■ \Derehfcm
Ir*'I-*-lc
Vrf1
10
C a s t le Acre
S e a l e km 1 0 5 km
Lagend
Major Road Minor Road RiverGauging StationR iver Wensum Catchment

TABLE 2.1
M ajor Licensed A bstractions
Source Daily flow Annual maxin(tcmd) (tcma)
1. PWS at Costessey/Heigham River Wensum 57.735 17 0002. Cawston PWS groundwater 1.855 5463. East Dereham PWS groundwater 4.100 1 3644. Beetley PWS groundwater 2.600 675S. Rhone-Poulenc Ltd groundwater 5.685 1 7626. Irrigation/industrial use
within S km of the river groundwater 25.000 5 200
2.3 D ata A vailability and Q uality
Flow gauging data are available at three locations within the River Wensum catchment: Costessey Mill, Swanton Morley and Fakenham. The availability of surface water data at the time of this investigation is summarised in Table 2.2. The non-availability o f abstraction data in 1989 and 1990 restricted the subsequent analysis that was carried out. An inspection of the hydrograph of mean daily flows against time revealed no apparent problems with the quality of the data at any o f the three
gauging stations.
TABLE 2.2
Available Surface W ater D ata
Type of data
Gauging station Data availableFrom To
Mean daily flow
Monthly abstractions
Monthly rainfall
Costessey Mill Swan ton Morley Fakenham Heigham
Costessey Various stations
February 1960 October 1969 May 1966 January 1973
March 1988 January 1970
March 1990 December 1989 March 1990 December 1988
December 1988 January 1990
2-2.
#

2.4 Data Analysis
2.4.1 T rend Analysis
Trend analysis was carried out on the river flow data in order to determine:
whether there is any evidence that low flows are becoming more frequent with time;
whether abstractions (other than the major abstractions at Heigham and Costessey) might be significantly influencing the river flow.
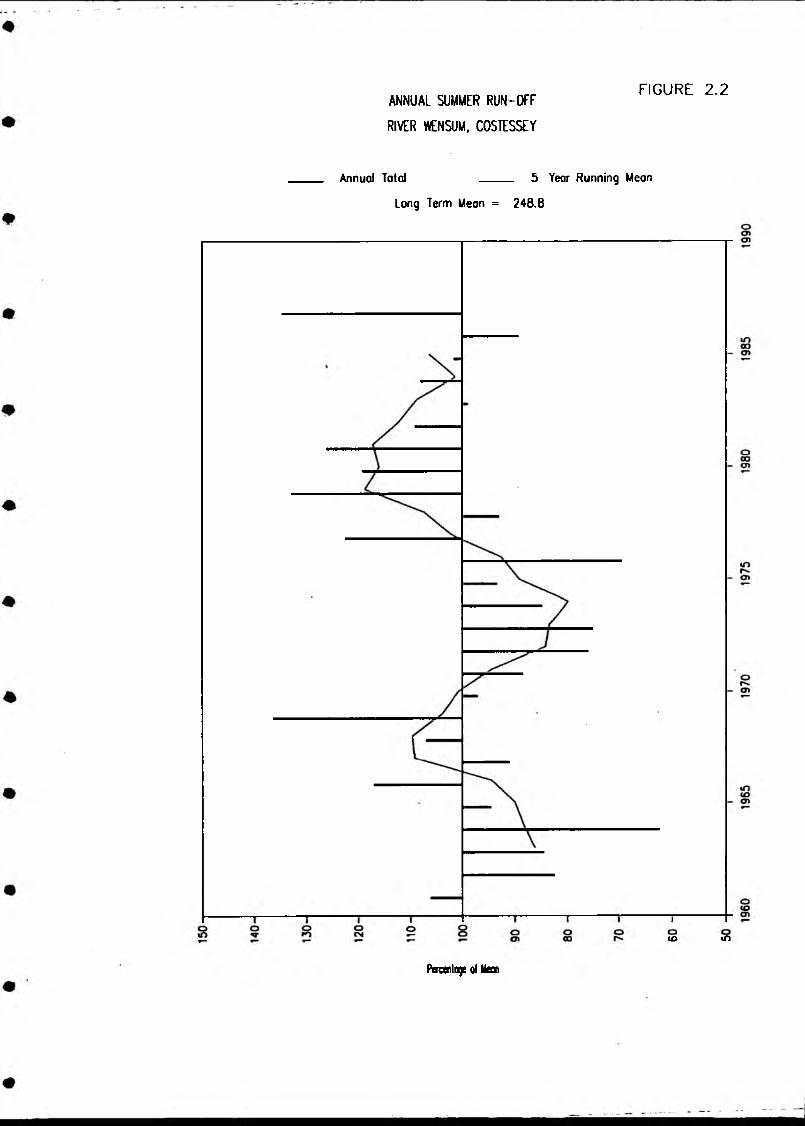
Several statistical tests were carried out on the annual river flow data for Costessey Mill. The results of these tests and also a plot of the variation in annual mean flow (Figure 2.2) indicated that there was no statistical evidence to support the hypothesis that there are any trends in the data caused by climatic changes or changes in abstractions (see Appendix 1).
2.4.2 Recession Curve Analysis
Forecasts of the flows in the river in 1990 were made, based on an analysis of 1976 recession curve. Low flows throughout the winter months o f 1989/1990 indicate that a similar pattern to the flows in 1975/1976 has occurred. Consequently a recession curve was fitted to the 1976 data from February to August using computer software for carrying out recession analysis. Data were selected from the hydrograph of mean daily flows and a recession curve was fitted, based on Horton’s equation:
Q(t) = a exp (- ktfc)
Where Q(t) is the naturalised flow at time t days and a, b and k are constants which were fitted using
exponential regression. The data selected and the fitted curve are shown in Figure 2.3. A translation of the curve along the x-axis showed that it provided a good fit to the selected data. Constants in
Horton’s equation were
a = 3.27 k = 0.0035
b = 1.18
2.4.3 Estim ation of A ugm entation for 1990
In estimating the augmentation pumping requirements two potential target minimum flows at
Costessey Mill were, considered:
ANNUAL SUMMER RUN-OFF
RIVER WENSUM, COSTESSEY
FIGURE 2.2
Annual Total _____ 5 Year Running Mean
Long Term Meon = 246.8
c o i n
Percentage of Uean

Dis
char
ge
(<- 12.0
RIVER WENSUM - RECESSION ANALYSIS
Based on Costessey data (197G)
10.0-
8.0-
8 .0-
4.0-
1 1 1 Jan Feb Mar Apr
1Hay
I 1Jun Jul
1976
1 ""Aug
1 'Sep Oct
■'r ■”Nov
r ...........Dec
________ Recorded Hydrograph
_______0(1) =* 3.27 » expl -0.0035 * t tt 1.18 )
Derivation of Recession
Curve

(i) the lowest flow at Costessey Mill on record (the specified minimum flow) and the mean abstraction rate at Costessey pits (as given in the licence):
ifb;7 r 9/ ^r.Cvv<A.= 0.514 + 0.540 = l!054 m3/s
(ii) the lowest flow at Costessey Mill on record and the maximum abstraction rate at Costessey pits (as given in the licence):
= 0.514 + 0.668 = 1.182 m3/s
Abstraction data for Costessey pits for 1989 and 1990 are not currently available. Therefore, in order to consider the two extreme cases that could occur if 1976 flow patterns were repeated, these two target flows were combined with two different assumptions concerning abstraction for the period of January to March 1990, as follows:
(a) assuming no abstraction took place in 1990 from January to March;
(b) assuming that abstraction from January to March 1990 was at a rate of 0.4 m’/s.
Combining the target flows with the assumptions, two extreme cases were considered:'iW ia va , I
Case A :a target flow of 1.182 m*/s and assuming no abstraction has yet taken place in 1990;
Case B : a target flow of 1.054 ms/s and assuming an abstraction at Costessey o f 0.4 m’/s. J 4-, 'S C
For each of these two cases the 1976 recession curve was superimposed on the 1990 data and the appropriate target flows were drawn on each plot (see Figures 2.4 and 2.5). For Cases A and B the volume of augmentation water required was estimated by calculating the area between the recession curve and the target flow. These volumes were converted to average pumping rates for the relevant time periods, giving the values shown in Table 2.3.
(V / f k . i U i i Irvowe. wolr W *
k, cl !o~ nl- ‘ CM*
}awt

Disc
harg
e (i
RIVER WENSUM - RECESSION ANALYSIS
O v O . I S
>cnV)c ~u3 . 33 Q-
CO o '__ r—¥Z CD O Q.
Recorded Hydrograph
_______Bit) • 3.27 * exp( -0.0035 * I M 1.18 I
O 3JC CD
r ^ °+ h (D £
n \J)C/)
£3
O C D
=3 O
TJ(Q‘c~T<DfOA

Disc
harg
e (i
RIVER WENSUM - RECESSION ANALYSIS
Based on Costessey data (1976)
i i i i i i i i r
12.0 -
10.0-
0.0-
G .0-
4.0-
2.0-
0.0
V
1990 Hydrograph
j1976 Recession Curve
C • - Oi (o\A?)*<
i
Target Flow {1.054 Cumecs)
1 1 1 Jan Feb Mar Apr
1May
T " IJun Jul
1990
' i1 6 AugI
Sep Octf ' ' “
Nov Dec
Recorded Hydrograph
_______ Q(t) - 3.27 * exp( -0.0035 * t ** 1.18 I
/
Predicted Recession
for 1990
Assum
ing C
urrent Abstraction of 0.4
Cum
ecs
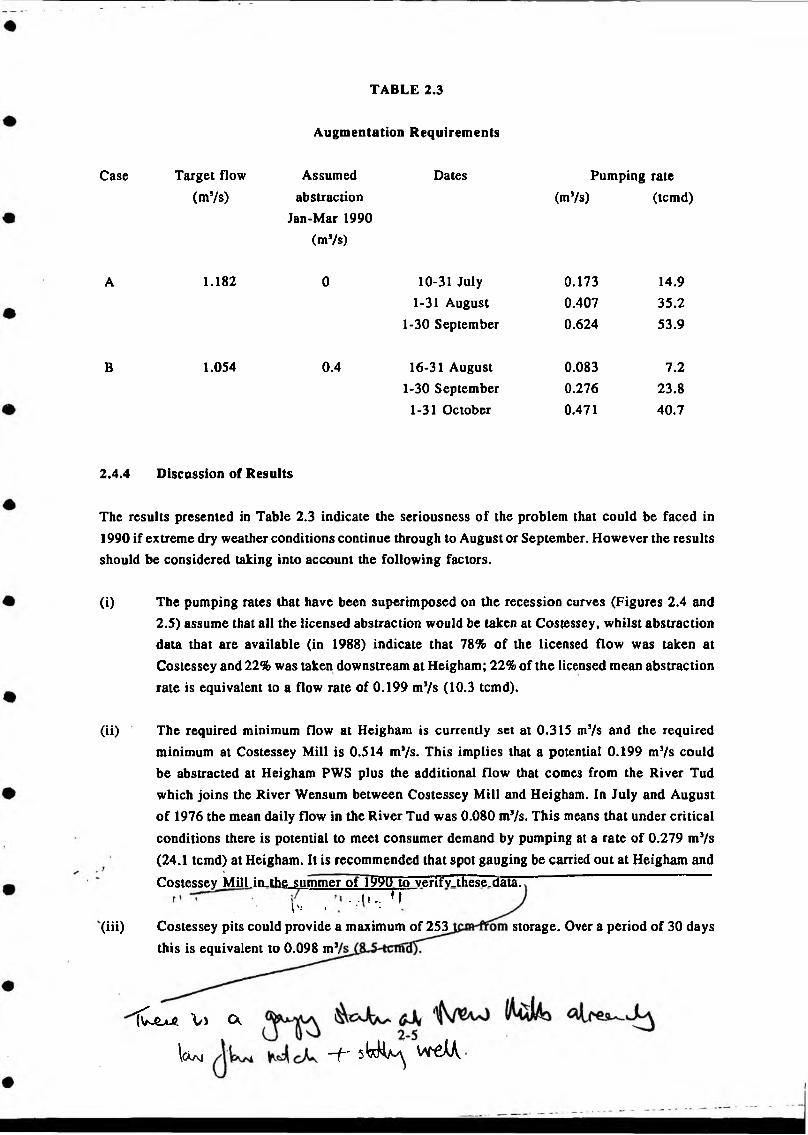
TABLE 2.3
A ugm entation R equirem ents
Case Target flow Assumed Dates Pumping rate(m5/s) abstraction
Jan-M ar 1990 (ms/s)
(mVs) (tcmd)
A 1.182 0 10-31 July 1-31 August
1-30 September
0.1730.4070.624
14.9 35.253.9
B 1.054 0.4 16-31 August 1-30 September
1-31 October
0.0830.2760.471
7.223.840.7
2.4.4 Discussion of R esults
The results presented in Table 2.3 indicate the seriousness o f the problem that could be faced in 1990 if extreme dry weather conditions continue through to August or September. However the results should be considered taking into account the following factors.
(i) The pumping rates that have been superimposed on the recession curves (Figures 2.4 and 2.5) assume that all the licensed abstraction would be taken at Costessey, whilst abstraction data that are available (in 1988) indicate that 78% of the licensed flow was taken at Costessey and 22% was taken downstream at Heigham; 22% of the licensed mean abstraction rate is equivalent to a flow rate of 0.199 mVs (10.3 tcmd).
(ii)
(iii)
The required minimum flow at Heigham is currently set at 0.315 m3/s and the required minimum at Costessey Mill is 0.514 ms/s. This implies that a potential 0.199 ms/s could be abstracted at Heigham PWS plus the additional flow that comes from the River Tud which joins the River Wensum between Costessey Mill and Heigham. In July and August o f 1976 the mean daily flow in the River Tud was 0.080 m5/s. This means that under critical
conditions there is potential to meet consumer demand by pumping at a rate o f 0.279 m’/s (24.1 tcmd) at Heigham. It is recommended that spot gauging be carried out at Heigham and
Costessev M ill.in_the summer ot i{j9U_to _verklv-.tiiese.data.. .I t,. f f\'t » *
Costessey pits could provide a maximum of 253 storage. Over a period of 30 daysthis is equivalent to 0.098 m3,
'(Cjzjui V. ft
W i - f - 5 * 3 ^ w d A

The implications of these factors is that augmentation pumping requirements given in Table 2.3 could be reduced by as much a 0.377 m3/s (32.6 tcmd) if abstractions were made at Costessey pits and Heigham over a critical month. For Case A, assuming continuation of the drought to the end of September then the prescribed minimum flow at Costessey could be m et by augmentation pumping at an average rate o f 0.128 m’/s (11 tcmd) in August and 0.247 m’/s (21.3 tcmd) in September. Pumping from storage at Costessey pits would in this case be delayed until September.
The dates when water levels started to recover in the River Wensum for data from 1960 to 1987 are presented in Table 2.4. For two of the lowest flows on record, 1976 and 1982, recovery months were in August and September respectively. Consequently, it seems reasonable to assume that a severe drought would not be expected to continue beyond the end of September.
From the analysis carried out, it is apparent that assumptions concerning abstraction at Costessey for early 1990 make an enormous difference to the predicted augmentation requirem ents. It is essential that these abstraction data be made available before finalising augmentation requirem ents.
Recoverymonth
TABLE 2.4
M onths in which W ater Levels in the R iver Wensum S tarted to Recover for the Y ears 1960 to 1987
Year
August 60 63 64 65 67 74 76 87
September 66 68 73 75 78 79 80 81 82 84 85 86
October 62 70 71 77November 61 69 72 83
7 J mo.oS' 0
a? *7 2 . ' ^
xs ^
2-6
CHAPTER 3
HYDROGEOLOGY
3.1 Geology
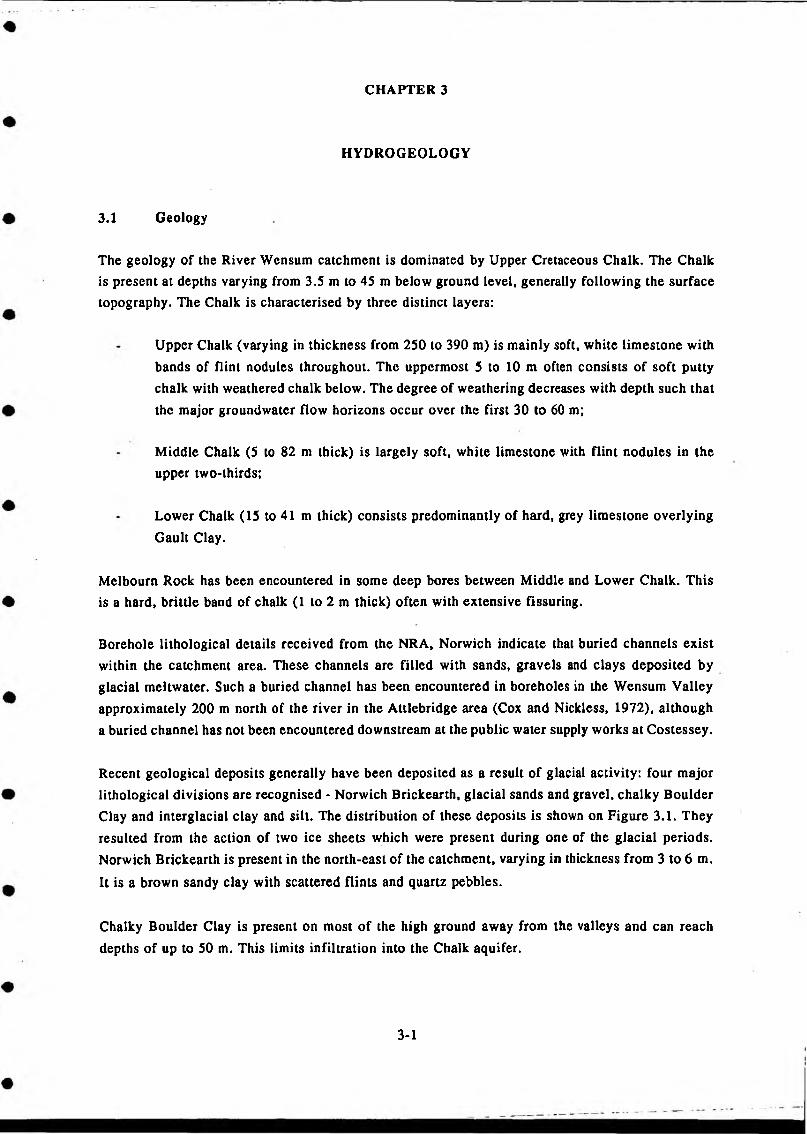
The geology of the River Wensum catchment is dominated by Upper Cretaceous Chalk. The Chalk is present at depths varying from 3.S m to 45 m below ground level, generally following the surface topography. The Chalk is characterised by three distinct layers:
Upper Chalk (varying in thickness from 250 to 390 m) is mainly soft, white lim estone with bands of flint nodules throughout. The uppermost 5 to 10 m often consists of soft putty chalk with weathered chalk below. The degree of weathering decreases with depth such that the major groundwater flow horizons occur over the first 30 to 60 m;
Middle Chalk (5 to 82 m thick) is largely soft, white limestone with flint nodules in the upper two-thirds;
Lower Chalk (15 to 41 m thick) consists predominantly of hard, grey limestone overlying
Gault Clay.
Melbourn Rock has been encountered in some deep bores between Middle and Lower Chalk. This is a hard, brittle band of chalk (1 to 2 m thick) often with extensive fissuring.
Borehole lithological details received from the NRA, Norwich indicate that buried channels exist within the catchment area. These channels are filled with sands, gravels and clays deposited by glacial meltwater. Such a buried channel has been encountered in boreholes in the Wensum Valley approximately 200 m north of the river in the Attlebridge area (Cox and Nickless, 1972), although a buried channel has not been encountered downstream at the public water supply works at Costessey.
Recent geological deposits generally have been deposited as a result of glacial activity: four major lithological divisions are recognised - Norwich Brickearth, glacial sands and gravel, chalky Boulder Clay and interglacial clay and silt. The distribution of these deposits is shown on Figure 3.1. They resulted from the action of two ice sheets which were present during one of the glacial periods. Norwich Brickearth is present in the north-east of the catchment, varying in thickness from 3 to 6 m.
It is a brown sandy clay with scattered flints and quartz pebbles.
Chalky Boulder Clay is present on most of the high ground away from the valleys and can reach depths of up to 50 m. This limits infiltration into the Chalk aquifer.
3-1
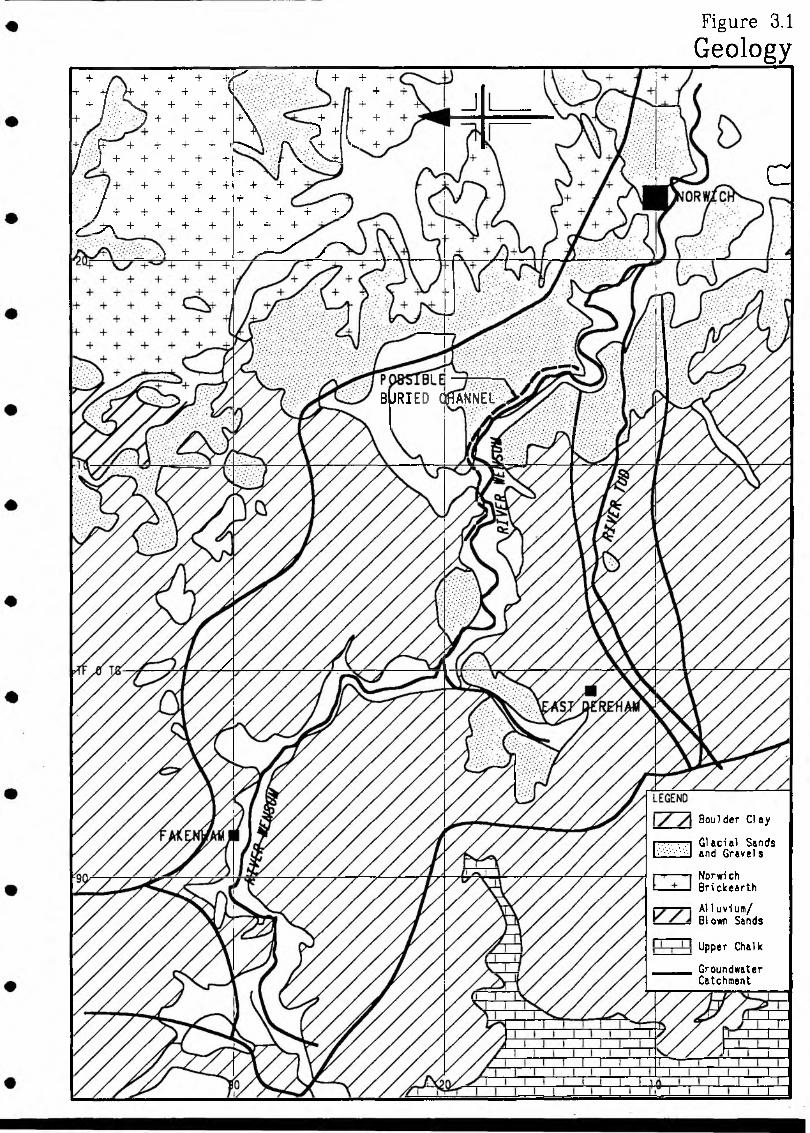
Figure 3.1
Geology+ + + + -*>̂ . [ + +
+ 4 /. . y+ + + + V +•f / x+ + + + +
+ /'O’V y + + + -r̂ . ■■.•■ ■ ■ ■ -f 1 4-+ + + \ ^ +1 +
r / p + + + + 1-'>s \ rv V 1Vs. 4-/ j + + + + + r v \>jrJf + + + + + i
+ + -*- + + +f + + + + + + —
j *r + + + 4- + + + jvr_J? \ + + + + + 4- 4-
+ +-N + + + >—^ / ^
J
BURIED QflANNEL.
c
.z
mmBoulder Clay
Glacial Sands and Gravels
NorwichBrickearth
A11 uvlum/ Blown Sands
Upper Chalk
GroundwaterCatchment
Glacial sands and gravels are also present in the region mainly in river valleys. They have been encountered in a number of boreholes, varying in thickness from 2 to 15 m, often interspersed with chalky Boulder Clay.
3.2 G roundw ater
The Chalk aquifer is the most important and most developed groundwater resource within the catchment. The aquifer is unconfined or semi-confined within the river valley where it is overlain by sand and gravels. Permeability (in the form of fissuring) is generally much higher within valleys than in valley sides where Boulder Clay confines the aquifer. Alternatively, at Beetley, the Chalk aquifer behaves as a leaky aquifer during pump tests (Figure 3.2).
A number of pumping tests have been performed by the NRA during licence evaluations and exploration programmes over the past 20 years. Yields from the Chalk aquifer have been highly variable, although there is a general trend of increasing yield towards the river. The maximum yield from a single borehole is 5 tcmd at Beetley by the River Blackwater while well yields as low as1 tcmd occur towards the head of the catchment.
Aquifer properties derived from the pump tests are also highly variable. Results o f pump test analyses are shown in Table 3.1.
3.3 Piezom etry
The NRA in Norwich collects monthly groundwater levels in the Wensum catchment from a network of observation piezometers. These are indicated in Figure 3.2 and detailed in Table 3.2.

Figure 3.2
Wensum Catchment Hydrogeology

TABLE 3.1
Details of Test Bores within Wensum C atchm ent
Grid reference Approximate Tep of Bottom of Borehole Boreholo T S Aqnifer Potential Comment*datum chalk hole depth diameter behaviour yield
(mAOD) (mAOD) (mAOD) (m) (m) (mVd) (tcmd)
Norfolk Fans TF 8905 3105 41 10 -50.4 91.4 0.457 1 384 0.026 Semi-confined 2.4
Harrison and Co TF 9738 3041 52 32.2 •39.4 91.4 0.305 140 0.01 Confined 1.2
3wanton Merely TO 293 157 30 3.5 • 19 49 0.15 70 0.001 Confined Low
Lyng forgo works:'
Exploratory borehole 1 TO 726 1689 50 11.5 -20 70) 0.2 77 0.00043 Confined 2.0 From 450 m borehole
Exploratory borehole 2 TO 681 1673 50 20 • 10 60)
Exploratory borehole 3 TO 772 1883 40 22 •50 90 0.2 460-870 0.003 Delayed yield 4.5 From 450 m borehole
R Ingland TO 137 132 15 3 -55 70 0.2 2 760 0.052 Uacoofined SJ0 From 450 m borehole
Bectley Exploratory borehole 1 TF 9879 1883 48 -20 -37 85 0.609 416 0.00043 Leaky aquifer 5.0 From each source
Bectley Exploratory borehole 2 TF 9877 1877 48 •20 -38 86 0.914
Note: Aquifer Behaviour based on lithologyS tad T value* from NRA Pump Test Analysis

TABLE 3.2
O bservation Piezom eter Network
Borehole Grid Location Datum Start of reco:ref Nr ref (m AOD)
TF 83/32/35 TF 8331 3258 Syderstone 65.68 Apr 1974
TF 82/38/20 TF 8323 2808 East Rudham 49.08 Apr 1974
TF 72/82/88 TF 788 228 Great Massingham 92.56 Apr 1974TF 93/01/10 TF 9014 3102 Sculthorpe 39.33 Sep 1952
TF 82/67/60 TF 8664 2702 Helhoughton 45.07 Sep 1952TF 93/20/83 TF 9271 3031 Fakenham 54.55 Apr 1974
TF 92/67/13 TF 9615 2734 Great Ryburgh 32.23 Sep 1952TF 92/42/32 TF 9433 2220 Brisley 58.96 Nov 1963
TF 92/81/68 TF 9869 2183 North Elmham 46.47 Apr 1974
TF 91/77/40 TF 9747 1705 Gressenhall 41.31 Sep 1952
TF 91/75/12 TF 9714 1529 Dillington 40.78 Sep 1952
TF 91/62/24 TF 9623 1249 Scarning 53.22 Jun 1974
TG 01/13/69 TF 0162 1390 Etling Green 56.12 Jun 1974
TG 01/73/63 TG 0762 1330 Hockering 43.01 Jun 1974
TG 01/78/78 TG 0773 1884 Sparhamhill * Feb 1988
TG 01/99/09 TG 0908 1993 Great Witchingham 17.20 Sep 1952
TG 12/17/22 TG 1126 2722 Heydon 44.98 Jun 1974
TG 12/57/72 TG 1577 2723 Oulton 46.45 Mar 1978
TG 02/77/67 TG 076 277* Tyby 42.43 Jan 1982
TG 02/57/55 TG 0552 2758* Guestwick 57.21 Oct 1952
TG 02/49/46 TG 0449 2961 Hindolveston 56.39 Jun 1981
TG 03/51/15 TG 051 315 Ridlands Farm, Bruston 68.60 Sep 1979
TG 03/42/19 TG 0410 3290 Melton Constable 82.17 Sep 1975
TG 11/15/17 TG 1115 1575 Weston Longville 49.28 Jun 1974
TG 11/54/12 TG 1515 1426 Taverham 40.20 Oct 1952
TG 11/61/99 TG 1691 1101 Costerney 17.92 Oct 1952
TG 12/19/48 TG 1149 2982 Corpusty 31.34 Jan 1982
Note: * In River Bure catchment.
Observation well data have been used to contour 1989 maximum and minimum water levels as shown in Figure 3.2. Accurate contouring is, however, prevented by a paucity of observation well data
within the river valley. Most existing observation wells are more than 5 km from the river.
It can be seen that the variation in water levels between winter and summer is not great with a maximum of about 3.5 m. Water tends to flow directly towards the river, with very little parallel flow taking place. Gradients appear to be steeper in the lower reaches of the catchment (Lyng to Costessey) possibly indicating a zone o f lower permeability or the effects of abstraction.
Comparing 1989 maximum and minimum groundwater levels with the surface profile suggests that the river gains from groundwater through most of its length (Figure 3.3). Groundwater levels are higher than river levels from Great Ryburgh downstream to Costessey during winter, with only a minor downstream shift in piezometric level in summer. Unfortunately, river levels were not measured during low flows in 1989. Consequently, it is not possible to fully verify these observations.
Figure 3.3
Longitudinal Section of River Wensum from Costessey Mill
O§E
.QI£LU
I8
<D13
m
1cc
£?
T3£O IO o £ 5 2 ir O u.
u i i i i l l I

• • • • • • • •
TABLE 3.4
G roundw ater A bstraction - PWS Boreholes
Year
W inter
Beetley
Summer T ou l Winter
Lyng Nr 1
Summer T o u l Winter
Lyng Nr 2
Summer Total
Cawston and
Gucstwick (Skitfield Road)
Winter Summer T o u l
East Dereham and Hove
Winter Summer T ou l
1970-71 87 113 200 10 13 23 • - - - * - - -
1971-72 116 167 283 2 Nil 2 - - - - - - * -
1972-73 177 204 381 Nil 3 3 - - - - - -
1973-74 194 204 398 NU 18 18 * - 172 159 331 • *
1974-75 223 259 482 8 18 26 - - 161 185 346 - -
1975-76 236 248 484 22 42 64 - - 164 195 359 - *
1976-77 238 260 498 16 30 46 - - 194 243 437 - -
1977-78 236 262 498 NU 44 44 - - 192 241 433 - -
1978-79 278 300 578 19 52 71 - - 265 240 605 - -
1979-80 265 323 588 50 21 71 - * 216 195 411 - -
1980-81 321 337 668 46 28 74 - 105 105 206 200 406 - -
1981-82 323 343 666 Nil Nil NU 68 318 386 169 239 408 228 -
1982-83 361 415 776 8 NU 8 272 217 489 211 246 457 288 222 510
1983-84 405 453 858 NU Nil Nil 358 356 714 216 243 459 264 346 610
1984-85 410 379 789 NU NU Nil 332 330 662 222 253 475 392 417 809
1985-86 371 433 804 NU NU Nil 269 216 485 247 258 503 264 85 349
1986-87 429 433 862 NU NU Nil ? 7 - 313 289 602 260 555 815
1987-88
1988-89
Not available at present Not available at present
Licensed quantity per annum 1 100 30 1 095 546 1 364
Note: Abstraction in thousand cubic metres.Summer - May-October Winter - November-April

3.4 Existing Boreholes
There are a number of PWS boreholes within the Wensum catchment. In addition, a large number of domestic, agricultural and industrial boreholes exist. The licensed quantities are shown in Table 3.3, while the abstraction records for PWS boreholes are shown in Table 3.4.
TABLE 3.3
G roundw ater Licences
Groundwater licences Numberof
licences
Public water supply:Beetley (2 bores) 1Lyng Bore Nr 1 1East Deneham and Hoe (2 bores) 1Causton and Guestwick (3 bores) 1Lyng Bore Nr 2 (+3 raker bores) 1
Sub-total (PWS)
Domestic/agricultural 265
Irrigation 53
Industrial 18
TOTAL 341
Annual Daily Seasonabstraction abstraction
(tcma) (m’/d)
675.0 2 600.0 Annual 30.0 100.0 Annual
1 364.0 4 100.0 Annual546.0 1 855.0 Annual
1 895.0 3 000.0
4 510.0 11 655.0
2 088.5 6 966.3 Annual
3 004.0 40 040.0 Summer
3 867.4 7 362.0 Annual
12 669.9 66 023.3
3.5 W ater Q uality
There are very few data available on the quality of groundwater from the Chalk aquifer. N itrate levels are the most frequently measured quality parameter. Data are shown in Table 3.5. High nitrate levels (up to 24.5 mg/1 as N) occur where the aquifer is unconfined and is receiving recharge directly
from annual rainfall. The high nitrates are present in soils as a result of extensive use of fertilisers
for agriculture. Leaching by rainwater carries the nitrate in solution through to the Chalk.

TABLE 3.5
N itra te Levels in Chalk Boreholes
Borehole National NitrateGrid (mg/1 N)
Reference
Ringland investigation borehole TG 137 132 8.0Costessey investigation borehole TG 162 125 3.0Field Farm, Weston Longville TG 199 111 <0.1Norton Hall, Moreton on the Hill TG 1185 1515 <0.1Old Hall Farm, Attlebridge TG 139 157 12.5Longwater Sand, Gravel Co, Costessey TG 1575 1115 <0.1Manor Farm, Ringland TG 1330 1435 5.8Place, Rogers Farm, Costessey TG 1887 1129 1.9
Sculthorpe Mill TF 8925 3040 9.0Dunton Hall Farm TF 881 303 6.4Station House, E Rudham TF 8400 3635 24.5Ross Foods, Fakenham TF 9275 3020 <0.5Vale Farm, Stibbard TF 9745 2915 23.5Collsink Hall Farm TF 9245 2670 <0.5Harrison, Culmardeston TF 9730 3039 0.4GA Real Prop Co, E Rudham TF 8330 3000 7.1
TF 8320 2998 4.5
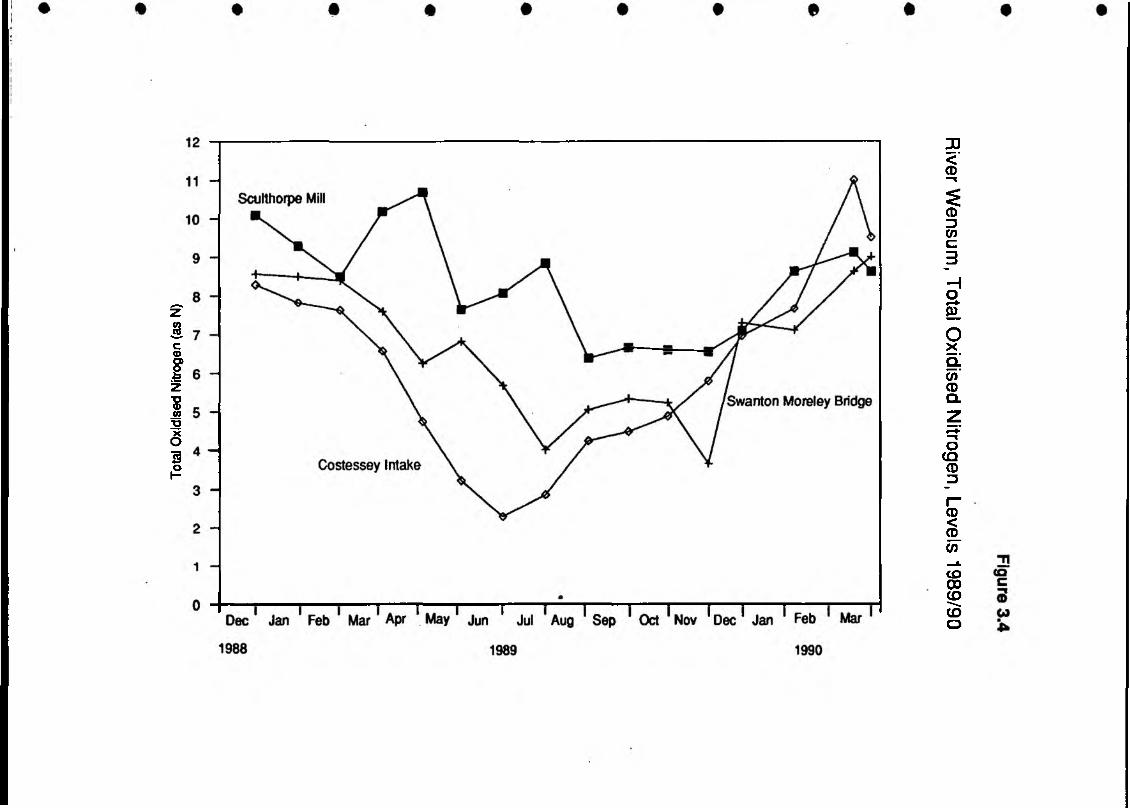
The influence of recharge on nitrate levels is also shown in river water samples. Figure 3.4 shows nitrate levels during 1989 at three locations along the river (Sculthorpe Mill upstream of Fakenham, Swanton Morley, gauging station and Costessey PWS intake). Nitrate levels reduce from upstream to downstream as an increasing proportion o f groundwater baseflow is derived from areas o f confined aquifer. In addition this figure indicates that nitrate levels reduce as river flows reduce: probably as
a result of reduced direct surface runoff.
Although there are over 300 licensed boreholes within the Wensum catchment, the total annual licence is, in fact, less than the licences for PWS at Costessey (12 700 tcma compared with
17 000 tcma, respectively).
Tota
l Ox
idise
d Ni
troge
n (as
N)
River Wensum
, Total Oxidised
Nitrogen, Levels
1989/90
CH APTER 4
AUGM ENTATION W ELL SITES
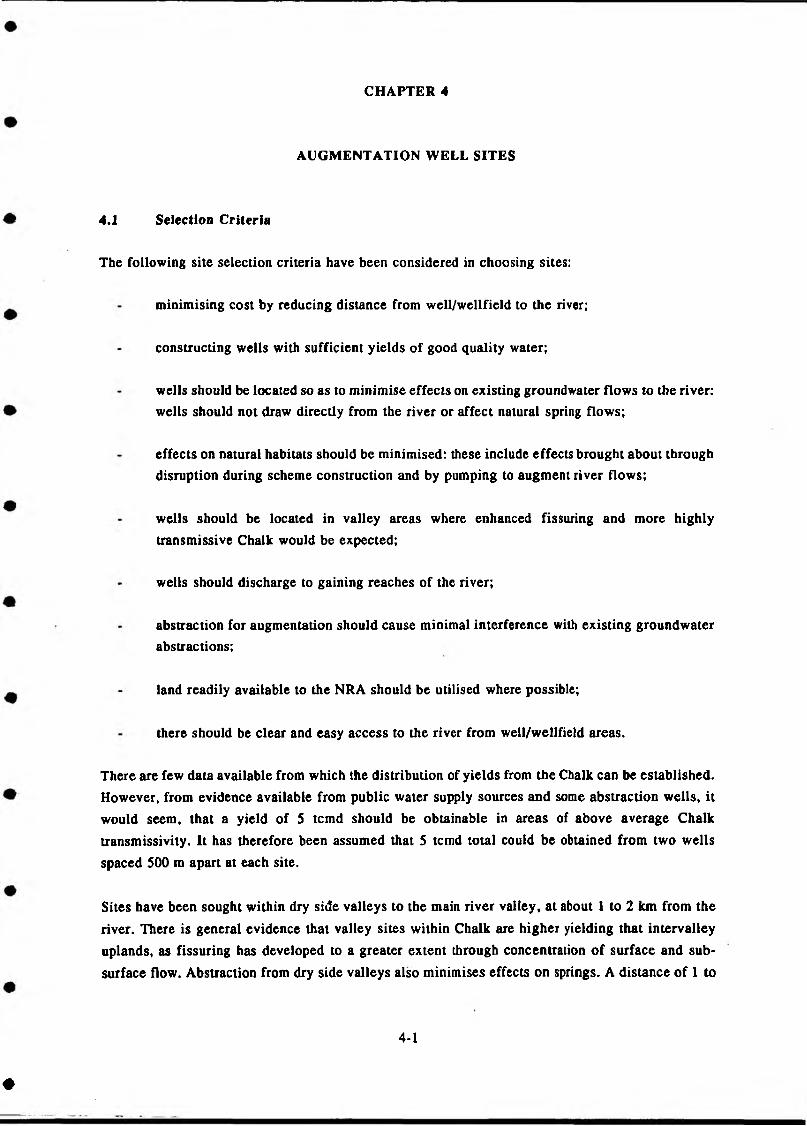
4.1 Selection C rite ria
The following site selection criteria have been considered in choosing sites:
minimising cost by reducing distance from well/wellfield to the river;
constructing wells with sufficient yields of good quality water;
wells should be located so as to minimise effects on existing groundwater flows to the river: wells should not draw directly from the river or affect natural spring flows;
effects on natural habitats should be minimised: these include effects brought about through disruption during scheme construction and by pumping to augment river flows;
wells should be located in valley areas where enhanced fissuring and more highly transmissive Chalk would be expected;
wells should discharge to gaining reaches of the river;
abstraction for augmentation should cause minimal interference with existing groundwater abstractions;
land readily available to the NRA should be utilised where possible;
there should be clear and easy access to the river from well/wellfield areas.
There are few data available from which the distribution of yields from the Chalk can be established. However, from evidence available from public water supply sources and some abstraction wells, it would seem, that a yield of 5 tcmd should be obtainable in areas of above average Chalk
transmissivity. It has therefore been assumed that 5 tcmd total could be obtained from two wells
spaced 500 m apart at each site.
Sites have been sought within dry side valleys to the main river valley, at about 1 to 2 km from the
river. There is general evidence that valley sites within Chalk are higher yielding that intervalley uplands, as fissuring has developed to a greater extent through concentration o f surface and sub
surface flow. Abstraction from dry side valleys also minimises effects on springs. A distance o f 1 to
4-1
#

2 km from the river should create a drawdown of only a few centim etres, perhaps only m illim etres in the vicinity of any wetland surrounding the river. Precise drawdown effects could only be obtained by siting observation wells in wetland areas.
Piezometry indicates that the River Wensum gains from the groundwater over much of its length. Three gauging sites are located along the river (Fakenham, Swanton Morley and Costessey). The possibility therefore exists for linking augmentation to flows at three points distributed along the river course.
The NRA has ready access to two possible sites within the catchment at Fakenham and North Elmham. Both these have been considered.
4.2 Potential Sites
Nine potential sites were chosen:
Fakenham;Billingford;North Elmham;Worthing Road, Swanton Morley;Sparham Hole;Lyng Road, Pockthorpe;Felthorpe Road, Attlebridge;Ringland Lane, Ringland;Honingham Lane, Ringland.
The sites are shown in Figure 4.1.
At Fakenham the NRA has access to an area of land (approximately 300 m2) located in a shallow side valley of the Wensum. There are two high yielding wells close-by (abstraction licences 2.9 tcmd total) indicating that the NRA site is potentially high yielding, although abstraction would inevitably affect the existing wells. The existing wells are licensed from April to September and may be little used by the time augmentation is needed in late summer. The side valley is also wetland which m ight be affected by abstraction. There would only be space, probably, for development of one well on the
site.
At North Elmham where the NRA has access to an existing well, test data indicate that potential
yield is low (although the well has not been acidised). The hillside site does not appear favourable
for obtaining high yields. The existing well is also only about 0.5 km from the river.

Figure 4.1
Possible Augmentation Sites
North Walsham'
20 -
iCo 11 i s hal 1
AJ 40
Heigh am R-j PWS Ac Tree Works
Costessey
Ayl shamM illGauging■Station
L__.
h f
PWS R iver Intake
ATTLEBRI )GE
Costessey P its : PWS Storage
RINGLAND
- 10 -
Corpu s ty Re ep h am j
COo
POCKTHORPE •L y n g '
■SPARHAM HOLE
-TF 0 TG;
Swantorij ■^Morl ey i
SWVlTON MORLEY
NORTH 1MHAM
FAKENHAM
-90-
r Fakenham
£iver
B e e tle y V V • \ East
10
C a s t le Acre
S e a l s k m 1 O 5km
20
Legend
•Augmentati on Si te
Ri verA Gauging S ta tio n
R iv e r WensumCatchm ent

The remaining sites are not associated with land readily available to the NRA, but are all located in dry side valleys. At Billingford, abstraction for augmentation is likely to affect an existing high yielding, licensed well although, as at Fakenham, the license allows use in the period April to September only.
The site at Swanton Morley has no existing large abstraction wells close by. It is located within 1 km of Swanton Morley airfield, which might be cause for some concern. Airfields are sources of potential pollution, with industrial solvents and fuel. However, in the Wensum catchment, Chalk is overlain generally by boulder clay which should largely retain surface pollution. Groundwater from a wellfield at Swanton Morley could be discharged to the Wensum about 50 m upstream of the Swanton Morley gauging site, allowing close linking of augmentation with river discharge. Cascades at the gauging site would also produce aeration of the discharged groundwater.
The site at Attlebridge and two sites at Ringland are within 1 to 2.5 km of the Attlebridge Landfill. However, they do not lie within the zone considered by NRA to be at risk from future contamination. Considerable thicknesses of sands and gravels exist in this area of the Wensum catchment. The side valleys chosen could be features formed within Glacial Drift. However, a high yielding well (abstraction licence 3.3 tcmd) at Ringland Lane indicates that high yields are available in the Ringland area. To reduce interference with the existing well, the site in Honingham Lane, Ringland would be preferred. The existing well is licensed for use from April to September only.
4.3 Environmental Assessment
4.3.1 Criteria for Assessment
The environmental effects of this scheme broadly fall into three categories. Firstly, the immediate short-term effect of the siting and construction of the boreholes and associated pipe runs. The pipelines in particular may pass through mature hedge lines or woodlands, and other sensitive wetland or grassland habitats on route to the river. Secondly, the drawdown in the watertable caused by the boreholes may locally affect wildlife sites in the vicinity. For example, mature beech trees are particularly susceptible to changes in the watertable and die off as a result of watertable decline. Similarly, any wetland sites would be damaged by drawdown and the resulting drying out of the habitat. Thirdly, there is the long-term effect of pumping groundwater into the river which may alter the ecological balance. Both the Nar and Wensum are proposed as Sites of Special Scientific Interest by the Nature Conservancy Council on account of their ecological richness.
Pumping groundwater from Chalk may affect the vegetation types that exist over the clay catchment areas on the Wensum. It is not yet known what level of flow is required to sustain the ecological richness of the rivers in times of drought These long-term effects require detailed investigation which is outside the timespan of the Phase 1 study. They are therefore not covered in this report but would be dealt with in the Phase 2 study.
4-3

For this report, the assessment concentrated on possible drawdown effects and the impact of the pipeline routes. A nominal 1 km cone of depression was assumed around the proposed borehole location and a survey made within that area for potential habitats affected. It should be noted that the 1 km figure is fairly notional, since drawdown effects are difficult to predict. It is assumed that a woodland on a ridge would be less affected that one within a valley as depth to water is much greater on ridges. The actual size of the cone of depression may also vary, (the Nature Conservancy Council assumes a 3 km diameter ‘cone’ around a borehole), but again it is difficult to accurately predict this effect.
Generally, it was found that the choice of dry side valley sites coincided with largely arable land uses, with minimal habitat affected within the immediate area of the proposed borehole. Of more immediate concern was the actual routing of the pipes, since wildlife interest, particularly wetland sites, increase in proximity to the river. Sketch plans showing wellfield areas, pipeline routes and discharge points have been prepared for schemes which are considered to be most reasonable on environmental grounds (Figures 4.2a to 4.2d). (Sketch plans for all sites under review will be included in the final report).
4.3.2 Assessment of Sites
Fakenham
The site lies at the head of a small poplar plantation, of minor interest in terms of conservation (Figure 4.2a). Further towards the river the lower half of the plantation is of conifers, before crossing an area of wet marsh and willow scrub of some interest. A practical route for the pipe would be along an access track adjacent to the east side of the plantation, and then across to the wet area, taking care to avoid mature trees.
Billingford
The borehole site is in a largely arable area, with a pine plantation to the north (Figure 4.2b). Unlike the previous site, arable land goes right to the river bank, so pipe routes should cause minimal environmental damage. However, the Norfolk Archaeological Unit has indicated the presence of remains along this stretch of river, so consultation would be necessary as to the exact location of the pipe route.
North Elmham
There are several mature trees in or surrounding the borehole site which may be affected as a result of pumping operations. Any pipeline routes would have to pass north of the site to avoid archaeological remains to the south. The pipe route would cross wetland adjacent to the river, but disturbance could be kept to a minimum by following the line of the farm access track.
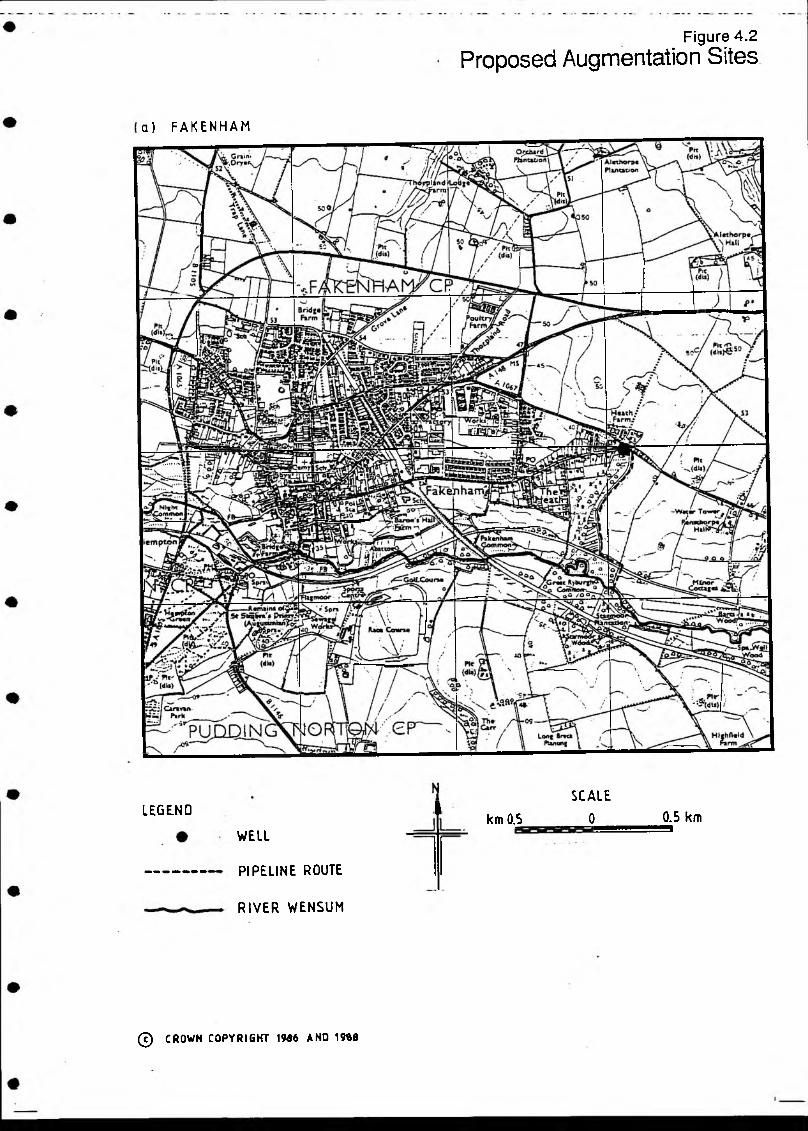
Figure 4.2Proposed Augmentation Sites
a) FAKENHAM
LEGEND
WELL
PIPELINE ROUTE
R IVER WENSUM
km 0.5
SCALE
0 0.5 km9
@ CROWN COPYRIGHT 19«6 AND 19*6

Figure 4.2
Proposed Augmentation Sites
( c ) POCKTHORPE
(d) RINGLAND
LEGENO
V 7 / / / / X WELL F IELD
---------------PIPEL INE ROUTE
RIVER WENSUM
N
A
kmO.S
SCALE
0 0.5km
0 CROWN COPYRIGHT 1985

Figure 4.2
Proposed Augmentation Sites
( b) BILLING FO R D AND SWAN TON MORLEY
> l \
--------Z . . . \ \V Ftcid Barn
LEGENO
Y////71
I
II
km 0.5
WELLFIELD
P IPEL INE ROUTE
RIVER WENSUM
BILHNGFORD
SWANTON MORLEY
N
il
J L _
SCALE
0 0.5km
© CROWN COPYRIGHT 198S AND 1987

Worthing Road, Swanton Morley
The borehole site lies in an arable area, although a small young ash woodland lies nearby on top of the ridge (Figure 4.2b). This woodland may be affected by drawdown, but it is of relatively recent origin and therefore of minor conservation interest. Of greater concern are the large mature oak trees which line the hedgerows either side of the road where it is proposed to run the pipelines. It is essential that these trees are avoided, which would mean that the pipes would need to run inside the field rather than in the verge. The southern side of the road is preferable as most of the oaks are in the northern verge. Adjacent to the river, the route crosses a small area of semi-improved grassland of some interest, before entering the river.
Sparham Hole
The borehole site is adjacent to an established woodland containing some mature beech, which would probably be affected by changes in the watertable. In addition, the pipe route would cross a complex mosaic of damp woodland and pools, which should be avoided, before entering the river. The presence of archaeological remains adjacent to the river also emphasises the fact that this site should be omitted on environmental grounds.
Lyng Road, Pockthorpe
The borehole site lies on the line of a major road, both sides of which are lined with magnificent miature oak trees (Figure 4.2c). Any effect on these trees caused by drawdown is to be avoided. In order to avoid dwellings and further woodland features, any proposed pipe run would have to be in the eastern verge. This would mean crossing the road before entering the river, passing through a small area of pasture. In view of possible drawdown effects on the oak trees, it would be preferable to avoid this site on environmental grounds.
Felthorpe Road, Attlebridge
The borehole site lies in a reseeded pasture of little value, bounded to the north by a disused railway line developing into broadleaved woodland. Two Sites of Special Scientific Interest (SSSIs) lie to the north, both about 1.5 km away from the site. Care would be needed in routing the pipes to avoid disturbing the rail line on the one hand, and routing it through the village on the other.

The borehole site should present few problems being in arable land with woodland restricted to the higher slopes surrounding the site (Figure 4.2d). The pipe route runs around the back of Ringland, crossing semi-improved pasture of some conservation interest. However, since the meadow area is large and the pipe disturbance area small, its effect should not be significant.
Honingham Lane, Ringland
The borehole site is surrounded by arable land of little value for wildlife (Figure 4.2d). However, the pipe route would cross an interesting area of semi-imp roved meadow alongside the river. In order to minimise damage to this area, the pipe should be routed along the edge of the meadow, adjacent to an area of scrub woodland.
4.3.3 Costessey Pits
It has been noted that a large volume of water is potentially available for use from these pits. Whilst not botanically rich, the pits are an important habitat for birds and are part of a complex system of mature woodland and open water. In addition, the area is used extensively for informal recreation by the public and is heavily used by anglers. Any significant drawdown of water levels in the area would therefore have a detrimental effect and should be carefully considered before such a course of action is undertaken.
4.4 Engineering Feasibility
4.4.1 General
Each site has been visited to appraise its suitability with regard to the following elements:
pipeline route; river discharge site; power supply.
Within the time available it has not been possible to contact the statutory authorities, landowners, occupiers or other organisations with an interest in the proposed development to determine if there are any major obstructions or difficulties to be expected at each of the proposed sites.
Ringland Lane, Ringland

(a) Pipeline Route
Owing to the location of the proposed wellfields relative to the river discharge sites almost all the pipelines will run downhill for their entire length. Normally, this would be undesirable because of the negative pressures induced when the pumps are shut down; however, it is proposed that air valves are installed at appropriate locations along the route to prevent this.
Each pipeline route has been chosen to minimise the number of road and field crossings required and where possible to avoid developed areas. Each of the sites was examined to see if there were any suitable streams or drainage channels to transfer the water to the river, minimising the length of pipeline required. All the streams and ditches located near to the wellfield sites had low or negligible flows and followed circuitous routes before meeting the main river. There is a high risk that were water to be discharged to a ditch during drought conditions, much of it would be blocked by reed growth and absorbed into wetland with very little reaching the intended discharge point.
Ditches do not generally fall within the NRA’s ‘main river’ responsibility. If maintenance of a ditch is the responsibility of a local landowner then this could create difficulties if used for augmentation discharge.
(b) River Discharge Site
Because of the low level of dissolved oxygen normally present in groundwater it will be necessary to aerate the water prior to its discharge to the river.
(c) Power Supply
During a brief appraisal of each wellfield site the location of overhead power lines close to a site was noted.
(d) Permanent Scheme Implementation
Since the proposal stage, the validity of temporary pipeline construction has been re-assessed. If a temporary pipeline were to be installed above ground it would still be subject to the same statutory notices as an underground pipeline and would also require continuous compensation to the landowners or occupiers. It has been found that irrigation pipe which might be used on a temporary basis is not readily available in the quantities required, ie about 2 000 m per wellfield. The majority of the cost of a buried pipeline will be procurement, stringing, jointing, field and dilch crossings and road crossings, rather than the excavation and laying, giving little financial saving for a surface pipeline. For these reasons it is felt that there is insufficient benefit to be gained from temporary construction and therefore a permanent pipeline is recommended.

4.4.2 Detailed Requirements of Possible Sites
(a) Fakenham j
A single borehole would be developed on the site of a disused sewage pumping station (Figure 4.2a). The pipeline route would follow a farm track southwards before discharging on the left bank of the River Wensum. Two field boundary crossings would be required. The total length of pipeline would be approximately 1 100 m. Discharging to the ditch next to the borehole is not practicable since it would probably only contribute to the marsh area just north of the river.
(b) North Elmham
The existing observation borehole approximately 400 m north of the church and to the east of the B1110 North Elmham to Guist road would be developed with a pipeline running approximately due west downhill, crossing one field boundary and a railway line before discharging into the River Wensum from the right bank. The total length of the pipeline would be approximately 650 m.
Visual inspection of the railway line indicates that it is probably disused and it may well be acceptable to auger bore beneath, through the embankment. Ownership of this line is yet to be discovered.
(c) Billingford
The wellfield would be developed approximately 1 000 m north of the B1145 Billingford to North Elmham road and on the southern side of a track known as Short Lane in arable land (Figure 4.2b). The pipeline would run south-west along field boundaries to a discharge point on the left bank of the River Wensum. Total pipeline length would be 1 650 m; three field crossings and one farm track crossing would be required.
(d) W orthing Road, Swanton M orley
The wellfield would be developed on arable land to the south-east of Swanton Morley airforce base (Figure 4.2b). The pipeline route would then follow the line of the unclassified road as far as Mill Street. Crossing this road it would then skirt round to the north of Waterfall Farm before discharging on the right bank of the River Wensum. The total pipeline length would be approximately 1 300 m; one unclassified road crossing and six field boundary crossings be required.
The feasibility of using the sewage treatment works outfall as a common discharge point was examined; however, the treated effluent flows under gravity through a 6 inch pipe which will be insufficient to take the full flow.

The discharge point would be sited above the two weirs at Waterfall Farm and would enable very good mixing and aeration of the groundwater.
(e) Spar ham Hole
The wellfield would be developed to the north of Sparham Hole plantation in arable land. The pipeline route would then be approximately south-east downhill to the discharge on the left bank of the River Wensum. It may not be possible to take the pipe through the plantation, therefore the route is slightly longer with around nine or ten field boundaries to cross. It would be necessary to cross one unclassified road. The total pipeline length would be approximately 1 450 m.
(0 Lyng Road, Pockthorpe
The wellfield would be developed on the east side of the unclassified road towards Pockthorpe from the A 1067 (Figure 4.2c). The pipeline would be laid in the field alongside the road and then cross the road, dropping down to the floodplain before discharging on the left bank of the River Wensum. The floodplain crossing would be in soft ground for 150 m. The total length of the pipeline would be approximately 1 200 m.
Discharging upstream of the two weirs at Pockthorpe Mill would provide better aeration of the water than would be obtained if an alternative, more difficult route to discharge near the mill is attempted.
(g) Felthorpe Road, Attlebridge
The wellfield would be developed on arable land to the south of a disused railway line. The pipeline route would follow the base of the railway embankment rising slightly over the first 500 m. The route would then cross an unclassified road and run south-west down towards the floodplain before crossing a ditch and discharging on the left bank of the River Wensum. The total pipeline length would be approximately 1 600 m; five field boundary crossings would be required.
The possibility of using the disused railway line for the pipeline route was investigated but found to be unsatisfactory as the line is overgrown and used as a bridlepath. Ownerships and easements would cause difficulties with access.

(h) Ringland Lane, Ringland
The wellfield would be developed on arable land to the north-west of Ringland. The pipeline would run south-east across arable land and along a short length of farm track before crossing the edge of the River Wensum floodplain to discharge from the right bank approximately SO m upstream of the road bridge. Approximately eight field boundaries would need to be crossed. The total pipeline length would be approximately 1 600 m.
This is evidence of a power supply near to this site but it may only be sufficient to supply a nearby borehole used for irrigation purposes.
(i) Honingham Lane, Ringland
The wellfield would be developed on arable land near Dryhill plantation to the south-west of Ringland (Figure 4.2d). The pipeline would run downhill for its entire length across arable land and cross two unclassified roads. The discharge point would be on the right bank of the River Wensum. Total pipeline length would be approximately 1 650 m.
The possibility of using the disused railway line for the pipeline route was investigated but found to be unsatisfactory as the route is overgrown and ownership or easements may be a problem.
4.5 Selected Sites
As river abstraction data for early 1990 are not available it has not been possible to produce a single predicted recession curve for the River Wensum at Costessey Mill (Chapter 2). The predicted recession alters dramatically depending on assumed abstraction. In turn, this makes a large difference to the periods and quantities required for augmentation.
Assuming that the abstraction in early 1990 averaged 0.4 m3/s and that the maximum additional quantity possible would be abstracted at Heigham downstream of Costessey Mill under drought conditions (see Section 2.4.4), then quantities required for augmentation are shown in Table 4.1.

TABLE 4.1
Augmentation Summary
Date Deficit at Assumed Net deficit at Costessey MillCostessey Mill* available at Abstraction Abstraction
Heigham at mean rate at maximum rateat Costessey at Costessey
1 6 -3 1 Aug 7.2 24.1 0 01 -3 0 Sep 23.8 24.1 0 10.81 - 31 Oct 40.7 24.1 16.6 27.7
Note: Assumes abstraction at the mean licensed rate All units : tcmd.
The difference in Costessey abstraction at mean and maximum rates is 11.1 tcmd. Although, in the hydrological calculations, the mean rate was adopted in combination with an assumed early 1990 abstraction to indicate minimum augmentation requirements, it is likely in a drought situation, that abstraction would be occurring at the maximum rate. Hence, the net deficit at maximum rate of abstraction should also be considered in assessing the number of augmentation sites required.
In Chapter 2 it was also indicated that augmentation requirements could be reduced by abstracting from storage at Costessey Pits. The environmental and recreational value of the pits has been discussed in Section 4.3.3. It is considered that draining these pits would have a detrimental effect and therefore the availability of this storage has not been taken into account in calculating augmentation requirements.
Three augmentation schemes are recommended as follows:
FakenhamWorthing Road, Swanton Morley Honingham Lane, Ringland
Fakenham has been chosen as the only suitable site with land readily available to the NRA and therefore affording the possibility of reasonably easy scheme construction without purchase of land for the wellfield. It has the disadvantages, however, of being in a side valley with existing wetland and being close to existing licensed, high yielding wells. Possible objections to the scheme may be lodged by the owner of the wells. Only one well could be located in the small site area available with an anticipated yield of 2.5 tcmd.
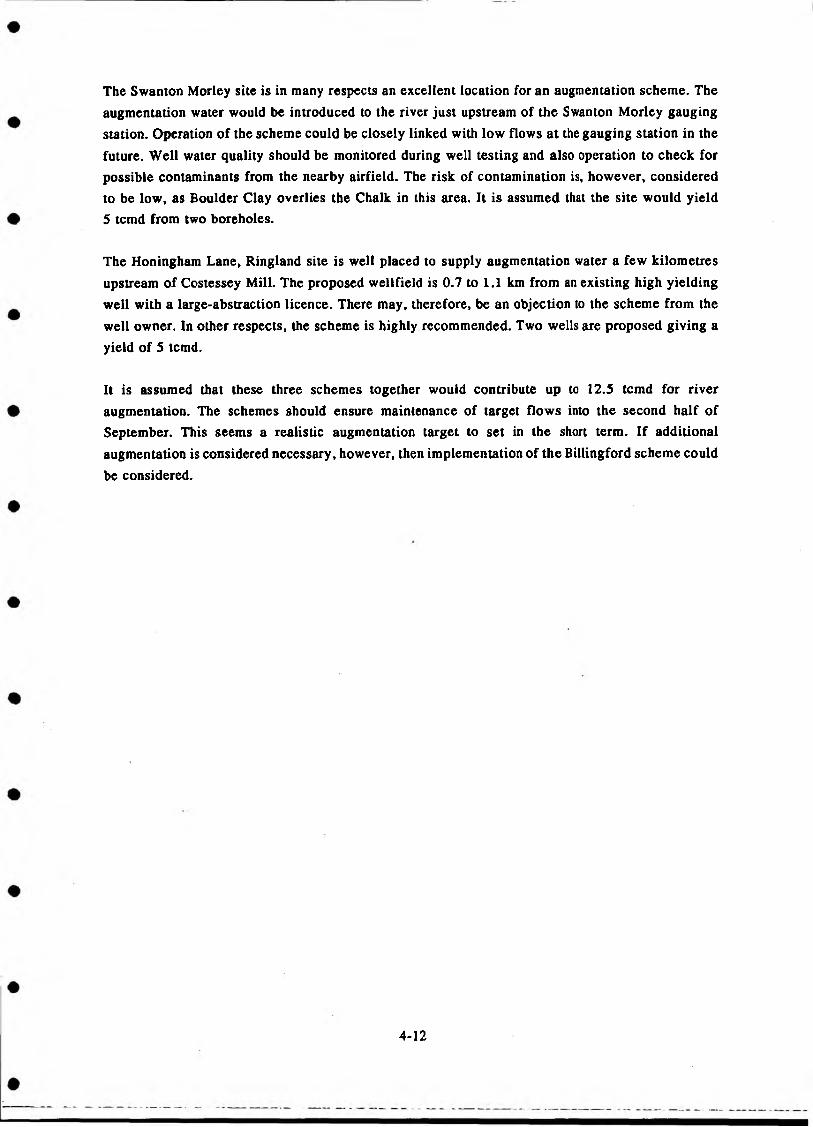
The Swanton Morley site is in many respects an excellent location for an augmentation scheme. The augmentation water would be introduced to the river just upstream of the Swanton Morley gauging station. Operation of the scheme could be closely linked with low flows at the gauging station in the future. Well water quality should be monitored during well testing and also operation to check for possible contaminants from the nearby airfield. The risk of contamination is, however, considered to be low, as Boulder Clay overlies the Chalk in this area. It is assumed that the site would yield5 tcmd from two boreholes.
The Honingham Lane, Ringland site is well placed to supply augmentation water a few kilometres upstream of Costessey Mill. The proposed wellfield is 0.7 to 1.1 km from an existing high yielding well with a large-abstraction licence. There may, therefore, be an objection to the scheme from the well owner. In other respects, the scheme is highly recommended. Two wells are proposed giving a yield of 5 tcmd.
It is assumed that these three schemes together would contribute up to 12.5 tcmd for river augmentation. The schemes should ensure maintenance of target flows into the second half of September. This seems a realistic augmentation target to set in the short term. If additional augmentation is considered necessary, however, then implementation of the Billingford scheme could be considered.
4-12

CHAPTER 5
PRELIMINARY DESIGNS AND CONSTRUCTION COSTS
5.1 Introduction
Technical requirements and preliminary designs of various components which make up each augmentation scheme are discussed in Sections 5.2 to 5.5. The costs of these components are brought together in Section 5.6 and the cost of individual selected schemes presented. Consultancy inputs for design of the schemes are discussed in Section 5.7.
5.2 Wells
A typical augmentation well design is illustrated in Figure 5.1. Following initial drilling to the top of Chalk, steel conductor casing would be installed and grouted in place through overburden/Glacial Drift. This would ensure stability of the upper hole prior to drilling through the Chalk aquifer.
The uppermost 30 m or so of more highly fissured Chalk would be drilled at sufficient diameter for installation of nominal 300 mm diameter casing and screen. The borehole would be completed as open hole some 15 to 35 m below screen, depending on further yield available at these depths.
The casing and screen proposed would be thermoplastic. The screen is installed to protect the production pump from any falling chalk debris. It would have the largest manufactured slot size available of 3 to 4 mm width.
Two wells have been allowed per augmentation site. If sufficient yields are not obtained then allowance has been made in costing for acidising treatment of the wells using hydrochloric acid.
5.3 Pumps and Electricity Supply
Electric submersible multistage centrifugal pumps would be used to pump water from the borehole to the discharge point located at the river.
Each pump would have its own control panel housed in a GRP kiosk located at the wellhead.
It is anticipated that the pumping head for each pump would be in the range 50 to 75 m. Each wellfield would have two duty pumps (2 500 m3/d each) with a maximum total running power requirement of 80 kW.
5-1
#

Figure 5.1Typical Augmentation Well

None of the sites selected appears to have a suitable electricity supply nearby that could be extended. Due to time constraints and the number and sites available in the initial screening it has not been possible to contact Eastern Electricity PLC to determine the magnitude of works required at each site. Under normal circumstances the provision of a 3-phase 415 V supply using overhead lines might take between 3 and 9 months. It is essential that NRA negotiates the rapid provision of an electricity supply to each site in order to effectively implement this project.
The option of using diesel generators (approximately 160 kVA) has been examined but the environmental impact of engine noise is considered unacceptable.
5.4 Pipelines
5.4.1 Pipeline Sizing
It is normal practice to consider the pipeline size and cost together with the running costs of a water transfer scheme. Since it is expected that this development would only run for a maximum of4 months per year the operating costs are unlikely to be significant in relation to the capital cost and outweighed by the scheme's benefit. Nominal pipeline diameters between 150 mm and 350 mm were considered for each scheme. For a flow of 5 tcmd a pipe diameter of 200 mm produces a headloss gradient of 14 m/km which is acceptable for a scheme of this type.
5.4.2 Material Options
On cost and technical grounds the review has been limited to 200 mm diameter ductile iron, 250 mm outside diameter medium density polyethylene (MDPE) and 8 inch nominal bore unplasticised polyvinyl chloride (PVC-U) pipes. Since this scheme is not intended for potable water the cheaper polymer black MDPE pipe can be considered, rather than the blue MDPE.
(a) Availability
The suppliers of the pipes considered have been contacted to determine the probable delivery period for pipes, which is given below.
Ductile iron 12 weeks PVC-U 4 weeks MDPE 4 weeks
It should be noted that delivery periods for fittings such as bends, tees, etc are usually considerably longer than for pipes.

#
(b) Cost Comparison
Significant items for ductile iron, MDPE and PVC-U pipelines have been quantified and approximately costed. Work which would be required irrespective of pipe material has not been costed. Unit costs have been determined using information obtained from pipeline manufacturers.
For a typical scheme with 2 000 m of pipeline the costs are as follows:
MDPE £58 920PVC-U £74 910Ductile Iron £77 400
The reduced cost of MDPE has been obtained by assuming that the pipeline will be laid using a trenchless mole ploughing technique thus saving the need for trench excavation, pipe bedding and reinstatement.
(c) Technical Review
Maximum pipeline pressure will occur at the pipeline connection to the wellfield pipework and is not likely to exceed 3 bar. Site hydraulic test pressure will be 1.5 x operating pressure, ie 4.5 bar.
Ductile iron pipe is usually manufactured with a 16 bar pressure rating.
MDPE pipe comes in a variety of pressure ratings. For this scheme SDR 17,6 bar pipe would be used.
PVC-U pipe is supplied in three pressure ratings. For this scheme Class C, 9 bar pipe would be used.
Ductile iron pipe has greater resistance to surge pressures than either PVC-U or MDPE. The reduced tolerance to surge in plastic pipes can be overcome by carrying out a detailed surge analysis of each scheme and installing the necessary surge protection, normally air valves. Both PVC-U and ductile iron pipe will require more careful site handling because of their mechanical joints and additionally will require thrust blocks at bends and fittings to provide restraint.
MDPE is effectively a single length of pipe once butt fusion jointing has been carried out, and due to tension in the pipe and skin friction along the pipe wall, minimal restraint along its length will be required, provided the ends are secured.
(d) Recommendation
In view of the cost saving between MDPE and other pipe materials and the urgent nature o f this scheme we recommend that black MDPE pipes and fittings are specified for the pipeline route.
5-3
#

5.5 Discharge to River
Due to the relatively low dissolved oxygen content of the augmentation water it will be preferable to make some attempt to aerate the water before it enters the river. Normal types of aeration structure are required to be sited above normal river level to prevent siltation and fouling by debris when not in use. Owing to the river banks being low and the shallow nature of the floodplain, this type of structure would have to be sited at the normal water level and protected by a trash screen. Erosion of the material around the structure will be prevented by surrounding it with a small area of stone pitching.
A cheaper alternative to partially aerate the water would be simply to discharge the water directly from the pipe into the river. However, this might cause erosion of river bed exposed at low flows and is therefore not recommended.
5.6 Summary
For each of the sites selected preliminary costs have been prepared and are shown in Tables 5.1 to 5.3. The estimates do not include for land purchase at the wellfield sites or for compensation along the pipeline routes. These costs would have to be established separately by NRA Estates Department prior to implementing the project.
Budget costs for engineering construction aspects of the three schemes for the River Wensum are as follows:
Fakenham £ 81 000Worthing Road, Swanton Morley £151 000Honingham Lane, Ringland £161 000
Total £393 000
These costs are much higher than for the works originally envisaged for the project. Increased cost has resulted from a need for more complex, buried pipeline routes of a permanent nature, crossing land which is not owned or easily accessible to the NRA. The schemes are similar to those envisaged as resulting from the longer term Phase 2 and Phase 3 of the augmentation study.
5.7 Consultancy Inputs
Estimates of hydrogeological inputs for Phase 1 remain the same as originally envisaged, as design, tendering and supervision of well construction are much as originally programmed. The engineering aspects of Phase 1 implementation have however changed. Whereas temporary schemes on land readily accessible to the NRA were originally envisaged, the requirement for land purchase and negotiation for land access combined with complexity of pipeline routes, makes temporary schemes impractical and uneconomic.
5-4

The permanent nature of schemes proposed requires greater engineering inputs in design, tendering and site supervision. Design and implementation of permanent schemes were originally envisaged in Phase 3 of the study, following on from the Phase 2 investigation of long term requirements.
For budgeting purposes the following is an assessment of design time required by engineering staff for three schemes for the River Wensum:
Water Engineer : 33 daysMechanical/Electrical Engineer : 13 days Draughtsman : 16 days
Including expenses, a total sum of £18 000 should be allowed.
Due to the extent and nature of the works together with the number of project sites, full time site supervision of the civil construction contract would be required. The mechanical and electrical contract would require limited site inputs from a mechanical engineer.
For budgeting purposes the following is an assessment of the supervision time for the three schemes.
Resident Engineer 30 daysProject Manager 5 daysMechanical Engineer 9 daysDraughtsman 5 days
Including expenses a total sum of £15 500 should be allowed for. The estimated costs for design (£18 000) and supervision (£15 500) would be additional to the Phase 1 budget consultancy inputs as originally proposed.
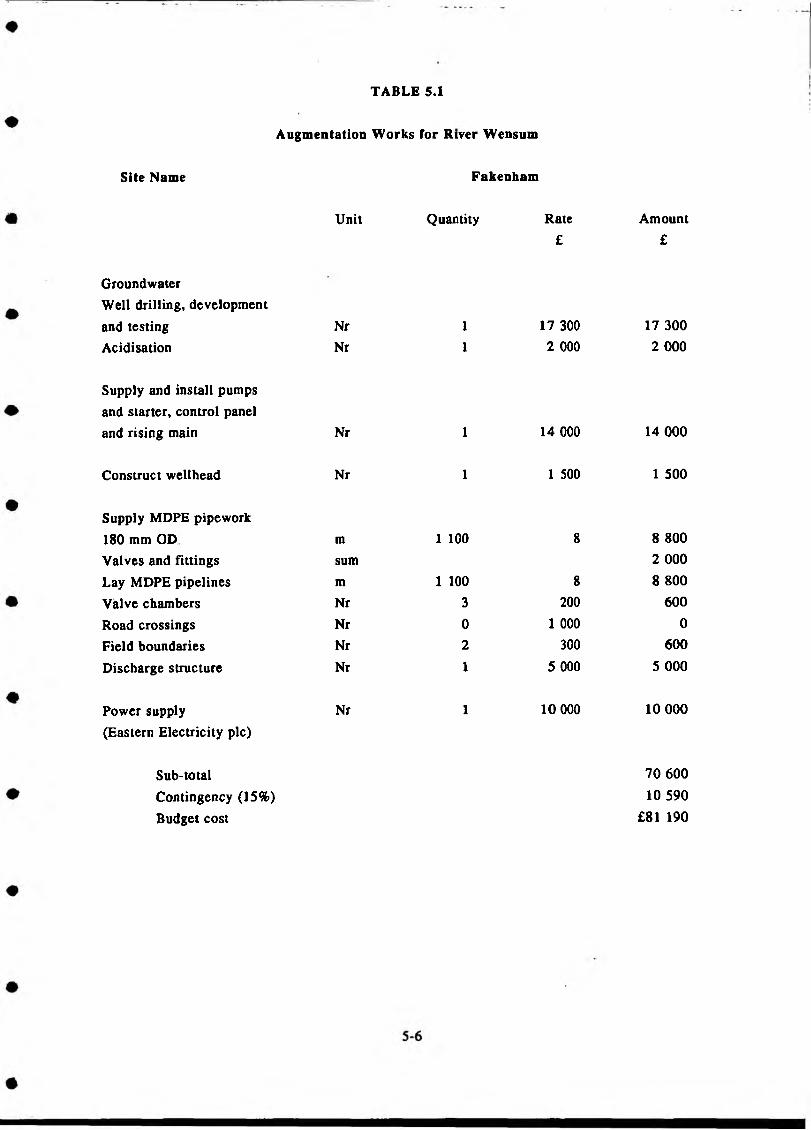
TABLE 5.1
Augmentation Works for River Wensum
Site Name
Unit
GroundwaterWell drilling, developmentand testing NrAcidisation Nr
Supply and install pumps and starter, control paneland rising main Nr
Construct wellhead Nr
Supply MDPE pipework180 mm OD mValves and fittings sumLay MDPE pipelines mValve chambers NrRoad crossings NrField boundaries NrDischarge structure Nr
Power supply Nr (Eastern Electricity pic)
Fakenham
Quantity Rate Amount£ £
1 17 300 17 3001 2 000 2 000
1 14 000 14 000
1 1 500 1 500
1 100 8 8 8002 000
1 100 8 8 8003 200 6000 1 000 0
2 300 6001 5 000 5 000
1 10 000 1 0 000
Sub-totalContingency (15%) Budget cost
70 600 10 590
£81 190

TABLE 5.2
Augmentation Works for River Wensum
Site Name Honingham Lane, Ringland
GroundwaterWell drilling, development
Unit Quantity Rate£
Amount£
and testing Nr 2 17 300 34 600Acidisation
Supply and install pumps and starter, control panel
Nr 2 2 000 4 000
and rising main Nr 2 14 000 28 000
Construct wellhead Nr 2 1 500 3 000
Supply MDPE pipework250 mm OD m 1 650 15 24 750Valves and fittings sum 5 000Lay MDPE pipelines m 1 650 14 23 100Valve chambers Nr 3 200 600
Road crossings Nr 2 1 000 2 000
Field boundaries Nr - 300 0
Discharge structure Nr 1 5 000 5 000
Power supply (Eastern Electricity pic)
Sub-totalContingency (15%) Budget cost
Nr 1 10 000 10 000
140 050 21 008
£161 058
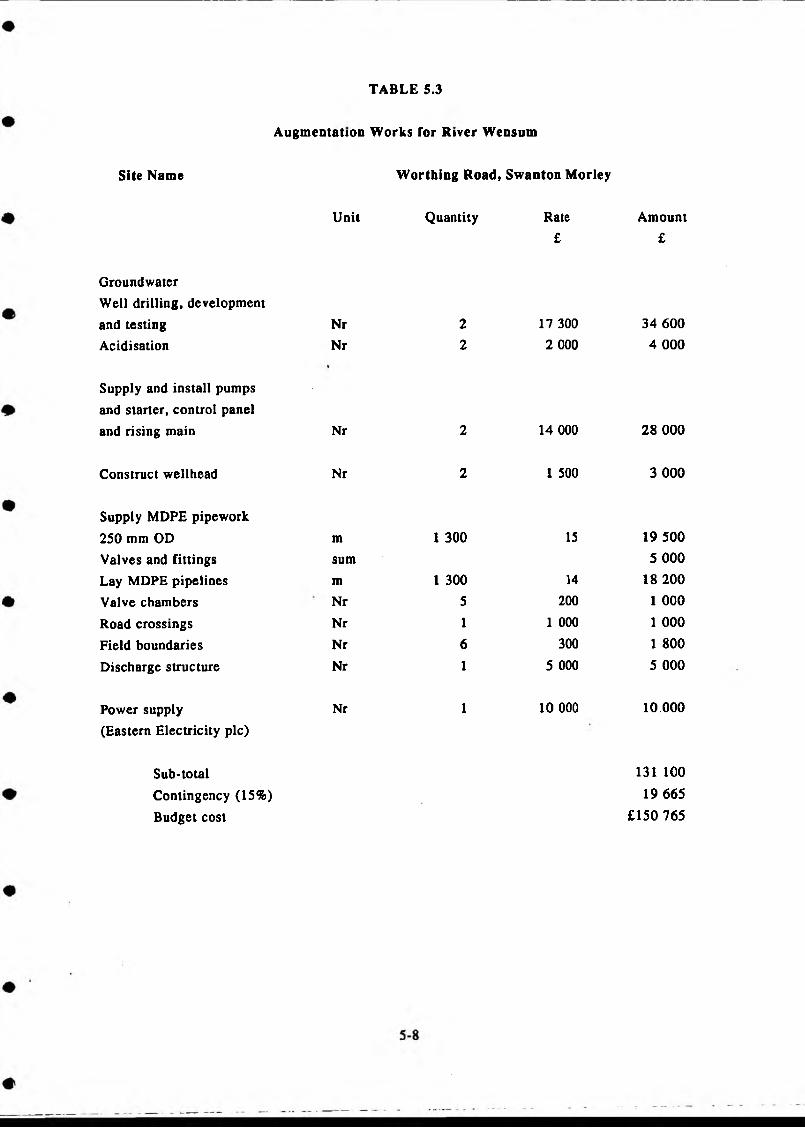
TABLE 5.3
Augmentation Works for River Wensum
Site Name
Unit
GroundwaterWell drilling, developmentand testing NrAcidisation Nr
Supply and install pumps and starter, control paneland rising main Nr
Construct wellhead Nr
Supply MDPE pipework250 mm OD mValves and fittings sumLay MDPE pipelines mValve chambers NrRoad crossings NrField boundaries NrDischarge structure Nr
Power supply Nr (Eastern Electricity pic)
Sub-totalContingency (15%) Budget cost
Worthing Road, Swanton Morley
Quantity Rate Amount£ £
2 17 300 34 6002 2 000 4 000
2 14 000 2 8 000
2 1 500 3 000
1 300 15 19 5005 000
1 300 14 18 2005 200 1 0001 1 000 1 0006 300 1 8001 5 000 5 000
1 10 000 10.000
131 100 19 665
£150 765

CHAPTER 6
PROGRAMME
6.1 Phase 1
6.1.1 Introduction
A programme for design, tendering and implementation of two augmentation schemes for the River Wensum is shown in Figure 6.1. River augmentation to meet minimum target flows is predicted as being required from mid to late August. The programme indicates that the first of the three schemes could be ready by the end of August.
The programme is, however, extremely tight and would, in any situation other than an emergency, be regarded as undesirably rushed and probably unrealistic. In reply to enquiries, some contractors and suppliers have, at this time, expressed interest in undertaking the work. The programme needs to proceed as shown in order to secure suppliers* and contractors* services at the earliest opportunity.
The programme assumes:
(a) Landowners would be contacted immediately on approval to proceed with schemes in order to obtain necessary permissions for access to undertake pipeline route surveys.
(b) Negotiation of purchase of land would be successfully completed prior to award of a drilling contract at the end of June.
(c) Negotiation of access to land for pipelaying and serving of land entry notice would be sufficiently well underway by the end of June to ensure the overall schemes can proceed as planned.
(d) The drilling contractor could start work on the first well almost immediately within the mobilisation period.
(e) Arrangements for electricity supplies and well pump and pipeline material orders would have to be made in advance of well drilling. The normal procedure would be to establish well yields in advance of ordering the engineering components of a scheme. There are few firm data on the distribution of yields for chalk boreholes and there is, therefore, a significant risk that a yield of 2.5 tcmd might not be obtained at some wells. To some extent, oversized pumps could be throttled back to a reduced safe yield. However, there are locations in the Chalk at which only
6-1
#

MONTH
Week No.
Project planning report Approval to proceed
Well design & document preparation Tender period Evaluation Award Mobilisation Well drilling
Design and document preparation Order pumps Pumps delivered to site installation and commisioning Negotiate electricity supply Electricity supply installed
Design and document preparation Order pipes Pipes delivered to site Tender period Evaluation Award Mobilisatton Construction
'̂ 1 'V S "V/VJWVJW ........................... - V"
Site supervisionHead office Engineering support
18
MAY
20
SEPTEMBER OCTOBER
36 38 40 42 44 46
HONINGHAM LANE RUNNING!I____ L
SWANTON MORLEY RUN..1...1..£ TNIN
FAKENHAM RUN
■ ■ ■ ■ .... ............................................
NINGi
Figure 6.1
River Wensum Phase 1 Implementation - Activities Programme

very low yields are obtained (less than 0.5 tcmd) and a risk remains that sites may fail to produce yields of the order required. Conversely, if yields larger than 2.5 tcmd were obtained from single wells, then these could not be utilised with the pumps available.
A major concern within the programme is the time required for electricity supplies to be arranged. Initial enquiries with the electricity company indicated that a lead-in time of at least 3 months was required before any new work of this nature could be undertaken. It is recommended that immediate contact be established between the NRA and the electricity company, setting out requirements. Otherwise there is little likelihood of power supplies being available by end of August.
Whilst, as a firm, Mott MacDonald has experience of obtaining clearance from relevant authorities for construction works (PUSWA procedure), we are reluctant to become involved in land purchase or wayleave arrangements, since our previous experience has shown that the cost of engineering staff undertaking this work can be inordinately high. We recommend that this work either be undertaken by the Estates Office of the NRA or by a firm with the necessary estates experience, appointed by the NRA.
6.1.2 Design and Tendering
(a) Statutory Undertakings
Pipeline route plans will be issued to all statutory undertakings to ascertain if any diversion of existing services will be required.
(b) Survey and Detailed Design
A detailed level survey would be carried out to determine the precise route and optimum hydraulic design of the pipeline. Plan and long section drawings would be produced for each pipeline. Possible pressure surge problems associated with pump start up and failure would be taken into account in design.
(c) Contract Preparation
It is recommended that all the augmentation schemes along the River Wensum are amalgamated so that only three contracts are required to implement each of the following elements of the project:
drilling and well development and testing;supply and installation o f mechanical and electrical equipment;construction of the pipeline and river discharge structures.
Bills of quantities, specifications and tender documents would be drawn up using appropriate forms of contracts.
(d) Procurement
The manufacture and supply of the electric submersible well pumps is critical to the overall implementation of each scheme. Preliminary discussions with manufacturers indicate that 11 weeks would be required between placement of a firm order and delivery to site. It is clear that a firm order for the pumping plant at the beginning of Week 24 will be required in order to enable satisfactory commissioning of the schemes by the end of Week 35.
Manufacture and supply of the necessary pipework and fittings for each scheme is estimated at around4 weeks although this is very dependent on the demand at the time of purchase. It is recommended that NRA should procure the pumps and pipeline pipework based on schedules of items, specifications and recommendations for suppliers provided by the Consultant.
6.2 Phase 2 Requirements
6.2.1 Hydrological Data Collection
For the hydrological studies in Phase 2, the principal task will be the setting up of a hydraulic model for the river systems for simulating flows and water levels. This would be used in conjunction with the groundwater model to provide an integrated picture of water movement within the surface water and groundwater systems.
The principal data required for running and calibrating the hydraulic model will be river channel cross-section data together with current meter gauging during an extended low flow period. The Phase 1 data assessment has shown that very few channel cross-section data are available for the catchment. Cross sectional surveys and gauging will therefore be required at 300 to 400 m intervals along the river channel. The timing of the survey will depend on the nature of the river flow recession during the coming summer months. Once the river flow has declined to a pre-determined threshold and continuing dry weather appears likely, the survey would proceed.
Hydrological modelling has also been reassessed in Stage 1. The most appropriate hydrological model for interlinking with groundwater modelling is considered to be the Stanford Watershed Model. Hourly rainfall data are required as one input in calibration. Hourly (and daily) rainfall will be required for stations within the catchment for the period 1953 to 1990. Daily potential evapotranspiration data would also be required for this period, if available. Relevant existing river flow data have already been received. Flow data and abstraction data for the period in 1990 leading up to modelling would also be required.
6-3
6.2.2 Observation Piezometers
The piezometry described in Section 3.3 was estimated from a small number of piezometers mostly situated some distance from the river. In order to assess the effects of pumping from augmentation sites as well as to correlate between river and valley groundwater levels during computer model studies a number of additional observation boreholes need to be drilled and constructed. These piezometers should be sited within 1 000 m of the river.
It is proposed that drilling should be performed using the NRA’s own rig. This rig drills at 6 inches to 8 inches diameter using the cable tool percussion method and is capable of drilling up to 50 m. It is recommended that drilling is programmed to start as soon as possible so that data records of the recession during 1990 can be used for model calibration.
Up to 11 observation boreholes should be drilled in the Wensum Valley. These are positioned as follows:
at least one piezometer per augmentation site (maximum five in total). These should be situated between the River Wensum and the augmentation site to study the influence o f borehole pumping on baseflow;
at least six piezometers within 1 000 m of the river between Lyng and Fakenham to provide data for computer model calibration.
These observation boreholes should be drilled to intercept at least the top 15 m of chalk and would be cased/screened using PVC-U plastic casing. The total depth drilled will be of the order of 350 m maximum. The boreholes should be incorporated within the observation network as soon as complete so that monthly records are available to calibrate the groundwater model.

CHAPTER 7
CONCLUSIONS AND RECOMMENDATIONS
Hydrology
(a) The target minimum flow at Costessey Mill below which augmentation would be required has been taken as the lowest recorded flow (0.S14 m’/s) plus the licensed abstraction at Costessey Pits.
(b) Abstraction data at Costessey Pits for early 1990 have not been available for recession analysis. Predictions of augmentation requirements for late summer 1990 vary enormously depending on the abstraction assumed in early 1990. It is essential that these abstraction data be made available before finalising augmentation requirements.
(c) For 1990, augmentation would be required at the earliest in mid-July. If, however, a large part of public water supply abstraction were to be switched from Costessey to Heigham, making maximum use of river resources available below Costessey Mill, then the requirement for augmentation might be delayed to September.
(d) In general, river flows begin to recover by the end of September. In 1976, the most severe recession on record, recovery occurred in late August. In 4 out of 28 years, recessions have continued into November.
Augmentation Schemes
(a) Three augmentation schemes are proposed for the River Wensum, supplying the following quantities:
Fakenham (2.5 tcmd)Swanton Morley (S tcmd)Honingham Lane, Ringland (S tcmd)
With a total 12.S tcmd available, it is estimated that the minimum target flow could be maintained into the latter half of September, possibly beyond, depending on abstraction at Costessey Pits.
(b) In deisigning each scheme it is assumed that each well would provide 2.5 tcmd. A total of five wells would therefore be required.

(c) A fourth scheme might be developed at Billingford providing a further 5 tcmd.
Scheme Costs
(a) It is not considered economical to construct schemes with temporary overland pipework. Temporary electricity supplies are considered undesirable.
(b) Each scheme would require up to 2 km of supply pipeline.
(c) The estimated costs of individual schemes are:
Fakenham £81 000S wanton Morley £151 000Ringland £161 000
Total £393 000
(d) The cost of consultancy design and supervision, additional to budget costs as originally envisaged at the proposal stage, would be £33 500 due to the permanent nature of schemes proposed.
(e) Costs do not cover land purchase, compensation for access for pipelaying or the work involved in contacting or negotiating with landowners. This work would best be undertaken by experienced estates personnel.
Programme
(a) The programme indicates that the first of the three schemes might be operational by the end of August 1990, all three schemes by mid-September. The programme is extremely tight.
(b) In order to have the schemes working on programme, pipeline materials, well pumps and electricity supplies would have to be ordered or confirmed in advance of well completion and confirmation of yields. In normal circumstances this would not be recommended as wells might not produce the required yields.
(c) Negotiation for purchase of and access to land would need to be completed by the end of June.
(d) Arrangements for electricity supplies need to be discussed and agreed with Eastern Electricity as a matter of urgency.

(e) The programme for construction has been tailored for implementation in 1990. The programme is extremely tight and would, in any situation other than an emergency, be regarded as undesirably rushed and probably unrealistic. We would rate the chance of completing construction to programme as being remote.
7.5 Observation Wells
Up to 11 observation wells should be drilled as a matter of urgency to provide piezometric data for the Phase 2 modelling studies. The drilling rig owned by the NRA would be suitable for this work.

REFERENCES
Cox, F C and Nickless, G F P 1972 Some aspects of the glacial history of Central Norfolk. Bull Geol. Surv 42, pp 78-98.
Cox, F C 1985 The Tunnel-valleys of Norfolk. East Anglia Proc. Geol. Ass. 96(4), pp 357-369.
Sir M MacDonald & Partners
Natural Environmental Research Council (NERC)
1989
1975
Source Reliable Output Study.
Low flow studies.
R-l
#

APPENDIX 1
TREND ANALYSIS RESULTS

APPENDIX 1 TREND ANALYSIS RESULTS
Various statistical tests were carried out on the runoff data at Costessey Mill for the period of record when no abstractions took place from the river. The tests for randomness, persistance and trend indicate that there is no evidence of any trends in the data. This is evidenced by the fact that the observed statistic (as calculated from the runoff data) falls within the expected range.
GENERAL RANDOMNESS TESTS
1) NUMBER OF MEDIAN-CROSSESEXPECTED: 13 +/- 7 (FOR A RANDOM SERIES) OBSERVED: 9
2) NUMBER OF TURNING-POINTSEXPECTED: 16+/- 4 (FOR A RANDOM SERIES) OBSERVED: 17
PERSISTANCE TESTS
3) FIRST-ORDER SERIAL CORRELATIONEXPECTED: -0.04 +/- 0.38 (FOR A CIRCULAR SERIES) OBSERVED: 0.23
4) SPEARMAN RANK TEST
EXPECTED: -0.04 +/- 0.38 (FOR A RANDOM SERIES) OBSERVED: 0.25
TREND TESTS
#

5) RANK ORDER TEST
EXPECTED: -0.04 +/- 0.38 (FOR A RANDOM SERIES) OBSERVED: -0.38
6) MANN-WHITNEY U TEST
EXPECTED: 91 +/- 40 (FOR A RANDOM SERIES) OBSERVED: 56
7) WALD-WOLFOWITZ RUNS TESTEXPECTED: 14 +/- 5 (FOR A RANDOM SERIES) OBSERVED: 15