low cvp+infrastructure+roadmap main+report
TRANSCRIPT

Transport Energy InfrastructureRoadm
ap to 2050
MAIN
REPORT
Prepared for the LowCVP
by Element Energy Ltd
Celine Cluzel & Alastair Hope–M
orley
JUN
E 2015

Project Steering Group
AutogasLimited
BOC Lim
itedBEAM
ACalorGas LtdEDF EnergyElectricity N
etworks Association
National Grid
Office for Low
Emission Vehicles
Renewable Energy Association
Transport for LondonTransport ScotlandU
K Petroleum Association
LowCVP
Project Manager
Jonathan Murray,
Policy and Operations Director
ContractorPrepared by Elem
ent Energy Ltd
AuthorsCeline CluzelAlastair Hope-M
orley
Transport Energy InfrastructureRoadm
ap to 2050
MAIN
REPORT
JUN
E 2015
Disclaimer
While
theauthorsconsiderthatthe
dataand
opinionscontainedin
thisreportare
sound,allpartiesm
ustrely
upontheir
own
skilland
judgement
when
usingit.
Theauthors
donot
make
anyrepresentation
orwarranty,expressed
orimplied,asto
theaccuracy
orcompletenessofthe
report.

3
Contents
Background and objectives
Approach
Transport Infrastructure Roadmaps
Conclusions
4
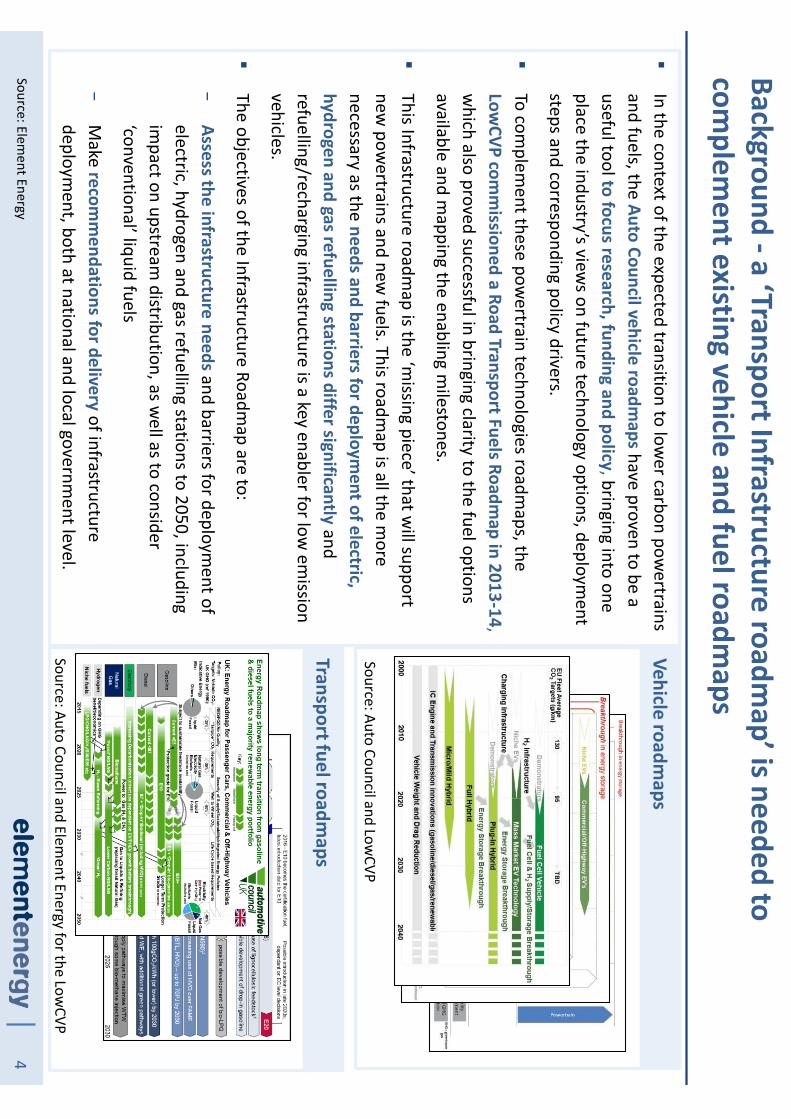
Background -a ‘Transport Infrastructure roadmap’ is needed to
complem
ent existing vehicle and fuel roadmaps
Source: Auto Council and LowCVP
Vehicle roadmaps
Transport fuel roadmaps
Source: Auto Council and Element Energy for the Low
CVP
�In the context of the expected transition to low
er carbon powertrains
and fuels, the Auto Council vehicle roadmaps have proven to be a
useful toolto focus research, funding and policy, bringing into one place the industry’s view
s on future technology options, deployment
steps and corresponding policy drivers.
�To com
plement these pow
ertrain technologies roadmaps, the
LowCVP com
missioned a Road Transport Fuels Roadm
ap in 2013-14, w
hich also proved successful in bringing clarity to the fuel options available and m
apping the enabling milestones.
�This Infrastructure roadm
ap is the ‘missing piece’ that w
ill support new
powertrains and new
fuels. This roadmap is all the m
ore necessary as the
needs and barriers for deployment of electric,
hydrogen and gas refuelling stations differ significantly and refuelling/recharging infrastructure is a key enabler for low
emission
vehicles.
�The objectives of the Infrastructure Roadm
ap are to:
−Assess the infrastructure needs and barriers for deploym
ent of electric, hydrogen and gas refuelling stations to 2050, including im
pact on upstream distribution, as w
ell as to consider ‘conventional’ liquid fuels
−M
ake recomm
endations for delivery of infrastructure deploym
ent, both at national and local government level.
Source: Element Energy

5
The Infrastructure Roadmap covers private and public infrastructure,
for all main road vehicles and both current and future fuels
�Depot based refuelling for fleet operators and return to base operators
�Hom
e recharging for private and (some) com
mercial vehicles
�Public forecourt refuelling/recharging
Refuelling infrastructure types
Fuels / energy vectors considered
�Zero tailpipe em
ission fuels: electricity and hydrogen�
‘Conventional’ liquid fuels: gasoline (E5 to E20, in line with
the Transport Fuels Roadmap), diesel, LPG/bio-propane
�M
ethane: Compressed N
atural Gas (CNG), Liquefied N
G (LNG)
and biomethane
�N
iche/future fuels: methanol, liquid air and a high bioethanol
blend (E85)
�The U
K’s legally binding target to reduce total GHG
emissions by at least 80%
(relative to 1990 levels) by 2050, and transport contributes to c. 25%
of UK total GHG em
issions; �
EU level regulations (gCO
2 /km, Air Q
uality targets and EURO
spec), Directives (Renewable Energy, Fuel Q
uality, Clean Pow
er for Transport) and Transport White Paper
Drivers for change in the transport energy system
Vehicle types
Source: Element Energy

6
Contents
Background and objectives
Approach
Transport Infrastructure Roadmaps
Conclusions
7
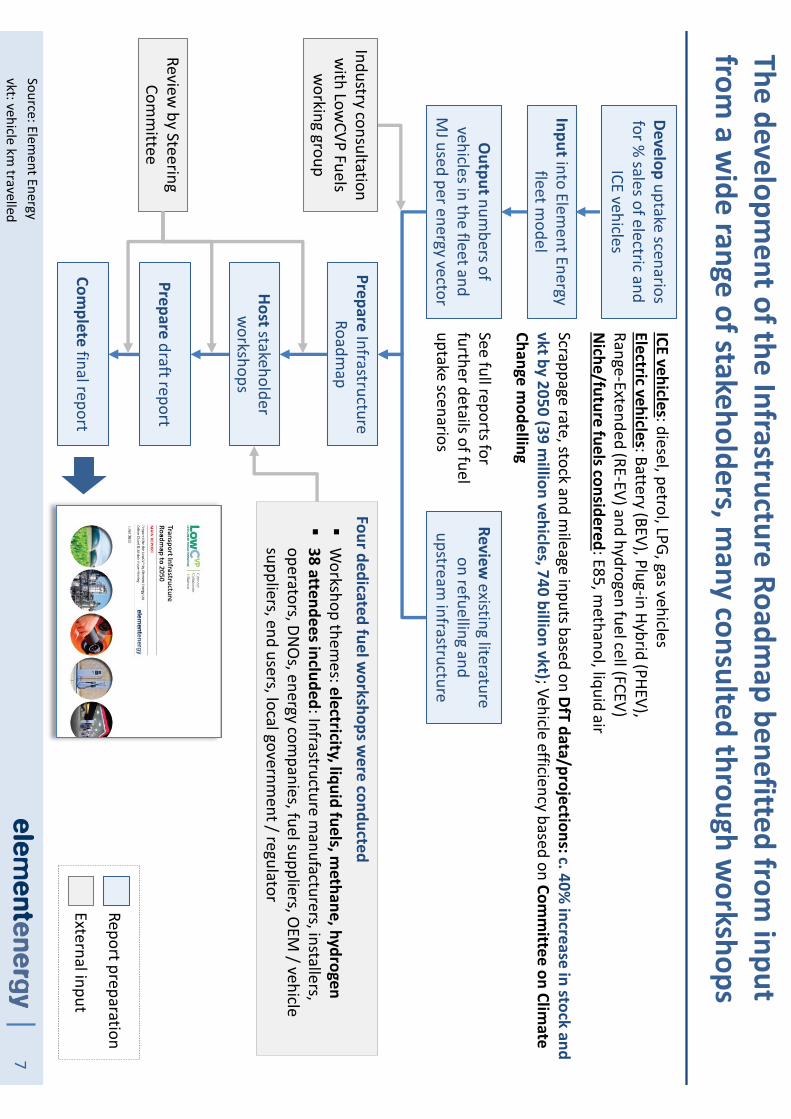
The development of the Infrastructure Roadm
ap benefitted from input
from a w
ide range of stakeholders, many consulted through w
orkshops
Developuptake scenarios
for % sales of electric and
ICE vehicles
Inputinto Element Energy
fleet model
Outputnum
bers of vehicles in the fleet and
MJ used per energy vector
ICE vehicles: diesel, petrol, LPG, gas vehicles Electric vehicles: Battery (BEV), Plug-in Hybrid (PHEV), Range-Extended (RE-EV) and hydrogen fuel cell (FCEV)N
iche/future fuels considered: E85, methanol, liquid air
PrepareInfrastructure
Roadmap
Reviewexisting literature
on refuelling and upstream
infrastructure
Industry consultation w
ith LowCVP Fuels
working group
Review by Steering
Comm
ittee Prepare
draft report
Complete final report
Hoststakeholder w
orkshops
Four dedicated fuel workshops w
ere conducted�
Workshop them
es: electricity, liquid fuels, methane, hydrogen
�38 attendees included: Infrastructure m
anufacturers, installers, operators, DN
Os, energy com
panies, fuel suppliers, OEM
/ vehicle suppliers, end users, local governm
ent / regulator
Report preparation
External input
Source: Element Energy
vkt: vehicle km travelled
See full reports for further details of fuel uptake scenarios
Scrappage rate, stock and mileage inputs based on DfT
data/projections: c. 40% increase in stock and
vkt by 2050 (39 million vehicles, 740 billion vkt); Vehicle efficiency based on Com
mittee on Clim
ate Change m
odelling

8
The future fuel demand and associated infrastructure needs are based on
ambitious vehicle uptake scenarios in line w
ith the UK GHG reduction targets
Source: Element Energy in consultation w
ith LowCVP Fuels W
orking Group. Refer to the full reports (issued separately) for m
ore detail. ‘Diesel’ refers to a blend of B7 and drop-in renewable diesel, as per the Fuel Roadm
ap
Proposed policy-led uptake scenarios –focus on alternative fuels
�The scenarios are not intended to cover all possible outcom
es but instead focus on cases with am
bitious uptake of alternative fuels in line w
ith targets set by the Carbon Plan �
They represent possible futures where low
and ultra low em
ission powertrains are successfully deployed, and are
illustrative rather than based on detailed modelling of technology costs and custom
er decision making behaviour
�In accordance w
ith the LowCVP Fuels Roadm
ap, blends higher than B7 are not considered for the mainstream
fuels and E20 is considered only from
the 2030s
2050
100%
20502020
20152030
PH/RE EVBEV
FCEV
92%80%
15%
40%60%
4%5%
5%2%
2%
2020
15%10%
2030
10%50%
20502040
10%
BEVDiesel, includes hybrid(Bio)m
ethaneFCEV
94%79%
45%
20%10%
5%10%
5%20%
10%1%
1%
15%
20302040
25%
20%
40%
2050
1%
2020Methane
FCEVBEV
Diesel, includes hybridDiesel dual fuel (LPG)
New
truck sales scenario:N
ew bus sales scenario:
New
car/van EV sale scenarios:
Moderate
ambition
CCC targets
60%
20202030
30%3%
100%
9%
2015
100%2050
CCC targetsM
oderate ambition

9
Four different roadmaps have been developed to best capture the
diverse challenges of each type of energy vector
�The roadm
aps and associated recomm
endations are presented next for each energy vector:
Sections for each fuel are indicated by a
specific tag:
�A structured approach w
as adopted to assess the background and status quo for each fuel identifying current supply pathw
ays and trends, geographic distribution and key stakeholders
�This enabled identification of future infrastructure requirem
ents and barriers to deployment supported by
quantification of projected fuel demand and stations num
bers
�The focus of the roadm
ap is on the barriers to infrastructure rollout, the wider barriers to adoption of
alternative fuelled vehicles (such as cost premium
, supply etc.) are not investigated here
�The cost estim
ates also focus on the refuelling/recharging infrastructure (capital costs) and exclude costs such as new
fuel production units, potential vehicle subsidies and costs to set up new distribution system
s
�This report contains only the key findings, the extensive analysis supporting them
is issued separately, in four distinct reports (electricity, m
ethane, liquid fuels, hydrogen)
Source: Element Energy

10
Contents
Background and objectives
Approach
Transport Infrastructure Roadmaps
Conclusions
11
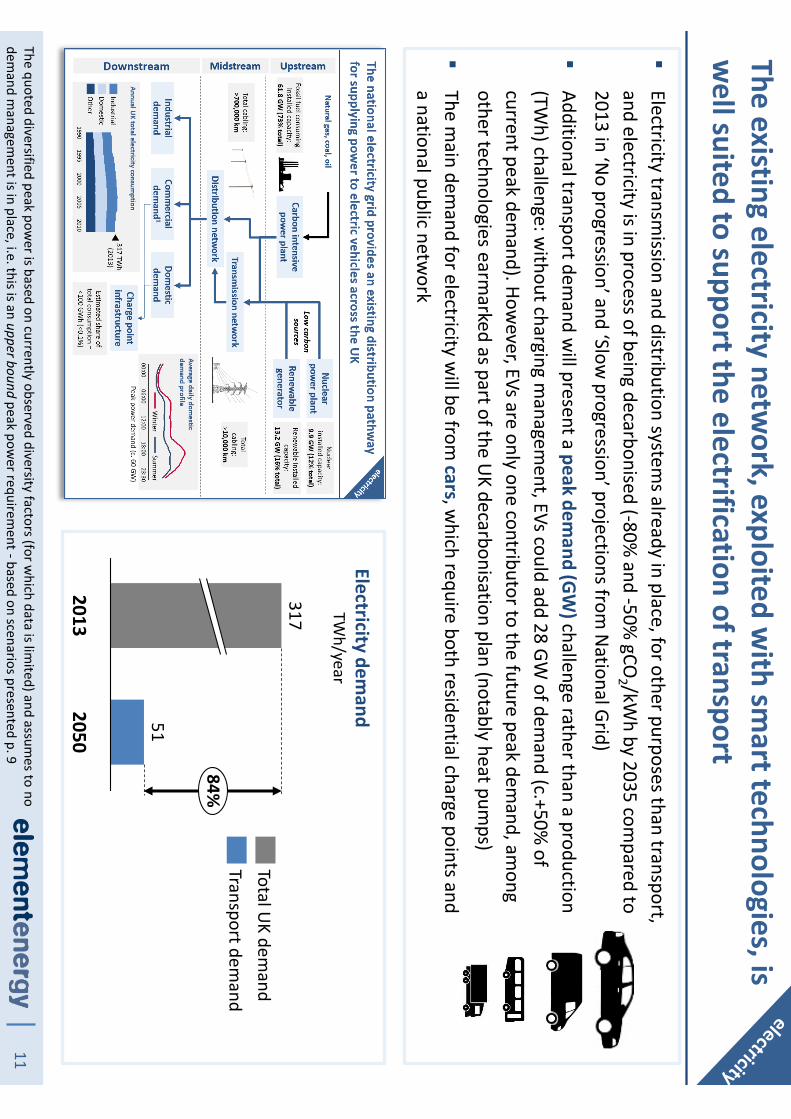
The existing electricity network, exploited w
ith smart technologies, is
well suited to support the electrification of transport
�Electricity transm
ission and distribution systems already in place, for other purposes than transport,
and electricity is in process of being decarbonised (-80% and -50%
gCO2 /kW
h by 2035 compared to
2013 in ‘No progression’ and ‘Slow
progression’ projections from N
ational Grid)
�Additional transport dem
and will present a peak dem
and (GW
)challenge rather than a production (TW
h) challenge: without charging m
anagement, EVs could add 28 GW
of demand (c.+50%
of current peak dem
and). However, EVs are only one contributor to the future peak dem
and, among
other technologies earmarked as part of the U
K decarbonisation plan (notably heat pumps)
�The m
ain demand for electricity w
ill be fromcars, w
hich require both residential charge points and a national public netw
ork
51
84%
20502013
317
Transport demand
Total UK dem
and
Electricity demand
TWh/year
The quoted diversified peak power is based on currently observed diversity factors (for w
hich data is limited) and assum
es tono
demand m
anagement is in place, i.e. this is an upper bound peak pow
er requirement -based on scenarios presented p. 9

12
20152050
20202030
2025
20502020
20302025
Solutions to provide certainty of access to hom
es w/o off-street parking
Charginginfra-
structurenetw
ork
3-7 kW off-street
or shared on-street
Millions of charge points (m
ostly residential) will be needed to support
widespread EV deploym
ent, with uncertainty over charging technologies
Rollout of primarily conductive rapid (40+kW
) charging points in short term
Future type and rates will depend on technology developm
ents
c. 500
Residential
3/7/22 kW
Cars/vans
>40 kW CP (plug and w
ireless) installed w
ith concurrent trials of alternative pow
er delivery systems
Potential rollout of alternative power delivery system
s e.g. dynam
ic charging on highways, battery sw
ap or overhead cables
Public netw
orkTechnology
Depot / w
orkplaces
Cars/vans
Buses and HGVs
EV related DSR com
mercial
arrangements
formalised 300-370k
4-7 m
illion10-15 m
illion
8-10k100-200k
400 -550k
4-5k20-25k
Up to c. £20bn for transm
ission and £30-45bn for distribution*
*To handle decarbonisation of the grid and uptake of EVs, heat pum
ps and distributed generation such as PV panels
c.2,200 Dependant on
BEV/ PHEV split and charging rates
Full national coverage
Cost£20-40m
c.1,100
£130-230m
Cost estimates are cum
ulative costs from 2015
CP = Charge point
£300-530m
c. 10 charge points per site
Introduce smart system
s alongside conventional netw
ork upgrades
Dashed lines represent high uncertainty
Major m
ilestone /enabler
Investment in electricity netw
orks (transm
ission & distribution)
–cum
ulative from 2015
Legend
Total sites
Cars
Vans
HDVs
Thousand vehicles
Projections are based on policy-led uptake scenarios presented on page 9
Data supported quantification of infrastructure requirem
ents
Infrastructure roadmap
Plug-in electric vehicles stock
20,000-25,0003,400-4,000
130
4,000-8,000700-
1,300
20
1,500-2,500250-400
10
300
60<5
Many
sites but variable offer
Visible and accessible
network to all
drivers

13
A visible, accessible and reliable public charging network should be
rolled out for light vehicles
End user experience of public charge points Econom
ics of public charge points1
2�The business case for public charge points rem
ains challenging
Recomm
endationsCentral gov.: Continue funding program
and monitor
progress, embed end user experience criteria in
support programs
Local Authorities: support programs w
here local fleets can provide a base load to charge points that can also be accessible to the general public; facilitate exchange betw
een relevant stakeholders (DNO
s, end user, charge point operators) to help optim
um siting;
share best practise findings with other LAs
On-going trial program
s: Share key learnings relevant to business case and end user experience (e.g. current Rapid Charging N
etwork project)
Industry: DNO
s could comm
unicate areas of adequate netw
ork capacity to infrastructure developers to avoid high connection costs
�Current public infrastructure is fragm
ented with several
operators offering various access conditions and variable reported reliability
�Beyond the num
ber of charge points, a network should
meet som
e criteria to be useful to EV drivers:−
Well m
arketed to drivers (e.g. clear signs, uniform
signage across the country)−
Easy to operate (e.g. multi socket connections, sim
ple paym
ent system, etc.)
−Im
mediately accessible (e.g. PAYG, dynam
ic booking system
s, live status information)
Recomm
endations
R&D / industry / LAs: Im
prove and build on existing netw
ork and develop a national platform com
patible with
multiple vehicle types to rem
otely comm
unicate with
public infrastructure (e.g. dynamic booking, sim
ple paym
ent systems, availability notification) and consider
joining cross platform projects (e.g. EM
i 3); embed criteria in
relevant funding programs
Source: Element Energy

14
Solutions to facilitate overnight charging will be required across
residential areas and depots
�Purchasing an EV requires certainty of access to charging, w
hich is best provided by access to overnight hom
e charging
�Am
bitious uptake scenarios and unbalanced access to off street parking in urban/rural areas m
ean many
households will need new
solution for access to ‘home
charging’
Recomm
endationsLocal Authorities: Continue (or begin) to investigate solutions to infrastructure for hom
e owners w
ithout off-street parking and share findings; im
plement a tenants’
right to install infrastructure for rented properties; support car club installation of charge points in dedicated bays; im
plement rules for new
builds and retrofit to be ‘socket ready’ (successfully done in W
estminster City Council)
R&D bodies &
industry: develop identification systems for
residential infrastructure shared between m
ultiple users
Residential areasDepots / w
orkplaces and fleets3
4�Fleet operators of HDVs are likely to be faced w
ith high local netw
ork reinforcement costs (already
observed) –an investm
ent in assets not own by the
fleet operator: an unfamiliar risk and procedure
Recomm
endationsLocal gov. : facilitate the interface betw
een DNO
s and fleet operators and prediction of ‘dem
and cluster’ for optim
ised investment; socialise early adopter case
studies to share lessons learnt
Central gov. and regulator: align EV uptake ambition
with netw
ork reinforcement needs to allow
/encourage ‘top-dow
n’ strategy (upfront investment in advance of
need)
R&D bodies: support trial of new
technologies (e.g. inductive, ultra fast conductive, ‘autom
atic plug-in’ etc.) that w
ould be more practical for fleets than current
technologiesCentral G
overnment: Continue to m
onitor private sector investment trends for residential and depot based
infrastructure and adjust support as needed
Source: Element Energy

15
Mitigating the im
pact of electric vehicles on the network w
ill require new
technologies and new com
mercial arrangem
ents
�W
ithout managem
ent of the charging time, EVs could (w
hen added to other technologies such as heat pumps)
require large investment in new
distribution infrastructure (substations, cables) and possibly new generation /
interconnection capacity. The Smart Grid Forum
identified that ‘smart’ technical and com
mercial solutions could
save in the order of £15bn on distribution network reinforcem
ent costs by 2050
�DN
Os w
ill need information on EV location and uptake to plan investm
ent and smart solutions rollout accurately
�Research is needed to understand relative im
pact of 3kW vs 7kW
charge point deployments
�Although less studied benefits to the grid could also be available: as flexible loads, recharging EVs could provide im
portant grid balancing services to maintain grid frequency, to m
anage supply and reduce renewable curtailm
ent
Recomm
endations
Central Gov. &
regulators: support DNO
s to access geographically disaggregated EV uptake data;
Installers and DNO
s: improve platform
for compiling charge point installation notifications (as stipulated by IEC)
Regulators, electricity suppliers and DNO
s: develop new com
mercial arrangem
ents and tariffs required for the uptake of sm
art charging solutions and for customer engagem
ent [Ofgem
’s Low Carbon Fund already supports these activities]
On-going trial program
s:disseminate findings on local netw
ork managem
ent solutions to DNO
s and related stakeholders
R&D bodies &
DNO
s: Investigate network related topics: charging/dem
and managem
ent technologies, Vehicle-2-Grid, im
pact on battery life, co-locating energy storage devices with rapid charge points to alleviate strain on w
eak grid
Impact on electricity netw
ork5Refer to the full report for m
ore detail on smart solutions
Source for quoted costs: Smart Grid Forum
, Assessing the Impact of Low
Carbon Technologies on UK pow
er distribution, 2012

16
Many opportunities exist for Heavy Duty Vehicles to use natural gas
supported by mature refuelling technologies
�The U
K benefits from an extensive and advanced (unique high pressure netw
ork ) gas grid, although not fully exploited for transport applications yet.
�Even if the current netw
ork in the UK is lim
ited (<50 stations), internationally 1000s of gas stations are active indicating technology m
aturity
�The projected added dem
and from transport is negligible com
pared with the current gas dem
and. How
ever, further distribution infrastructure might be required for Liquefied N
atural Gas (terminals)
�The m
ain demand for gas w
ill be fromheavy duty vehicles, w
hich require both bunkered refuelling (at depots) and public refuelling for the case of long haul applications
UK natural gas dem
and
2013
64,001ktpa
(850 TWh/year)3,770
ktpa(50 TW
h/year)
2050
-94%
Buses demand
seriesHGVs dem
andTotal U
K demand
Transport demand for gas based on uptake scenarios presented on p. 9
Future gas dem
and from
transport is negligible
compared to
current gas dem
and
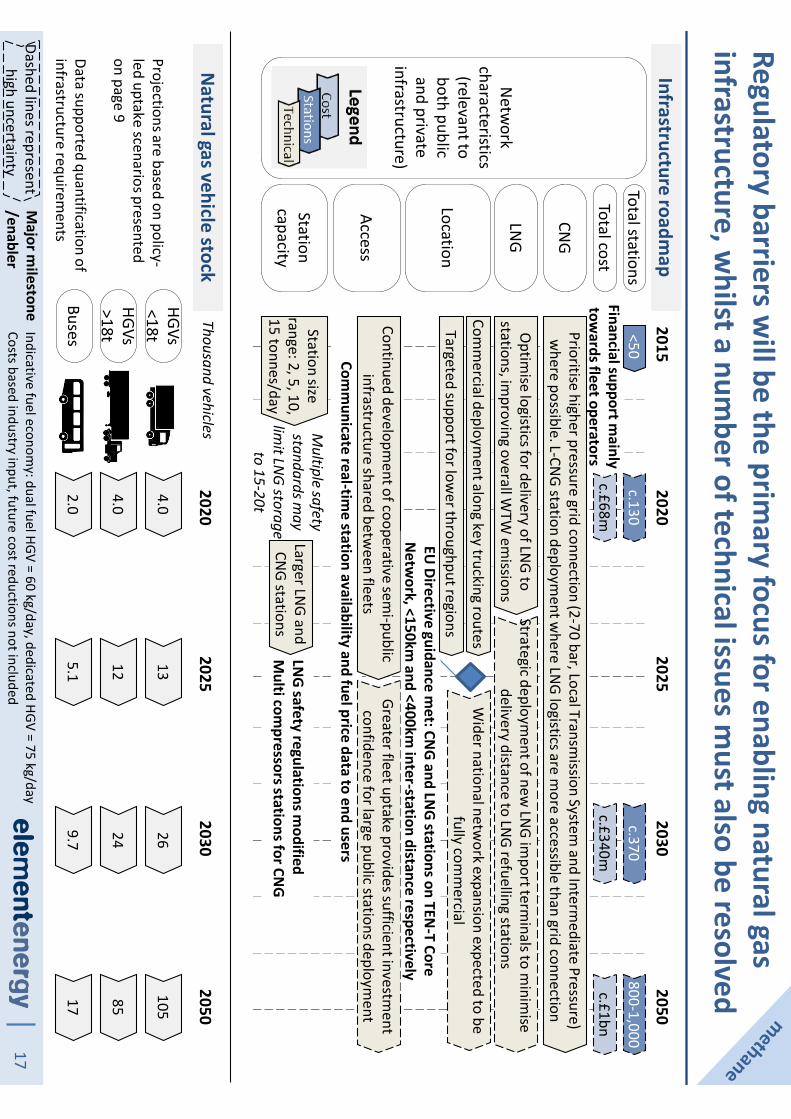
17
Financial support mainly
towards fleet operators
Comm
unicate real-time station availability and fuel price data to end users
20152050
20202030
2025
Comm
ercial deployment along key trucking routes
Wider national netw
ork expansion expected to be fully com
mercial
Regulatory barriers will be the prim
ary focus for enabling natural gas infrastructure, w
hilst a number of technical issues m
ust also be resolved
Prioritise higher pressure grid connection (2-70 bar, Local Transmission System
and Intermediate Pressure)
where possible. L-CN
G station deployment w
here LNG logistics are m
ore accessible than grid connection
c.370
Netw
ork characteristics
(relevant to both public and private
infrastructure)
Location
Optim
ise logistics for delivery of LNG to
stations, improving overall W
TW em
issionsStrategic deploym
ent of new LN
G import term
inals to minim
ise delivery distance to LN
G refuelling stations
Total stations
CNG
LNG
c.£340mTotal cost
AccessContinued developm
ent of cooperative semi-public
infrastructure shared between fleets
Greater fleet uptake provides sufficient investment
confidence for large public stations deployment
<50800-1,000
c.£1bn
c.130
c.£68m
Dashed lines represent high uncertainty
Major m
ilestone /enabler
EU Directive guidance m
et: CNG
and LNG
stations on TEN-T Core
Netw
ork, <150km and <400km
inter-station distance respectively
Multiple safety
standards may
limit LNG storage to 15-20t
LNG
safety regulations modified
Multi com
pressors stations for CNG
Larger LNG and
CNG stations
Station capacity
Targeted support for lower throughput regions
HGVs<18tHGVs>18t
Buses
Thousand vehicles
Projections are based on policy-led uptake scenarios presented on page 9
Data supported quantification of infrastructure requirem
ents
Natural gas vehicle stock
105
8517
2624
9.7
1312
5.1
4.0
4.0
2.0
Infrastructure roadmap
20502020
20302025
Station size range: 2, 5, 10, 15 tonnes/day
Indicative fuel economy: dual fuel HGV = 60 kg/day, dedicated HGV = 75 kg/day
Costs based industry input, future cost reductions not included

18
Planning guidance for Local Authorities will help speed up station
deployments w
ith key outstanding safety issues addressed
Consult with experienced Local Authorities,
regulators, industry and utilities
Planning guidanceSafety issues
12
Issue a Call for Evidence to understand m
ost comm
only adopted standards
Collate existing relevant standards
�Health and safety regulations and codes of practice only partially address infrastructure requirem
ents
�For exam
ple, natural gas infrastructure operators have identified on-site storage allow
ances and safety distances to be incom
patible with refuelling
station deployment due to
regulator unfamiliarity w
ith the use of natural gas as a road fuel
Recomm
endationsRegulators: Re-evaluate and consider am
endment of existing standards for
on-site natural gas storage allowances
and safety distances
�A num
ber of well inform
ed, robust standards have been developed to address technical issues associated the installation of natural gas refuelling stations
�Infrastructure operators have identified inconsistent interpretation of these standards by Local Authorities to significantly delay station installation
Recomm
endationsCentral G
overnment: develop planning guidance docum
ent to facilitate the uniform
implem
entation of infrastructure equipment standards
Develop guidance document
NGV N
etwork = N
atural Gas Vehicle Netw
ork, a platform of gas grid operators, gas and LN
G suppliers, CN
G/LNG station providers, gas vehicle O
EMs and other related stakeholders
Cross cutting recomm
endation: Central Gov., LAs and regulators: Establish regular dialogue w
ith the NGV N
etwork, to
address planning, safety and other technical issues as well as get industry input on funding/infrastructure strategies
19
End user experience should be harmonised across U
K network through
standardisation of equipment and im
proved comm
unication systems
�Industry asserted that econom
ics for operating infrastructure in high throughput areas does not need support, as evidenced by com
mercial organisations
offering turn-key solutions
�A m
inority of UK infrastructure projects have received
grant funding1; further support should target areas of
lower vehicle throughput/low
er base demand
�Areas for optim
isation include costs for high pressure grid connection and venting prevention technologies
Recomm
endationsCentral G
overnment: Focus on long term
support for natural gas vehicle deploym
ent and the associated infrastructure w
ill follow grow
ing demand if the correct
regulatory and legislative arrangements are in place
Gas netw
ork operators: allow com
petition in LTS connection to reduce connection costs
R&D bodies: Reduce costs for venting prevention /
methane capture technologies
Station economics and support
End user experience3
4�Inconsistent infrastructure im
plementation has led
to a fragmented driver experience at stations
�Vehicle tank receptacles are com
patible with
different nozzles types and dispensing pressures but no standard stipulates a specific requirem
ent
�Station dow
ntime (e.g. for m
aintenance) is often not com
municated to drivers and fuel price variations
can significantly impact fleet operations
Recomm
endations
Central Gov. &
regulators: Work w
ith industry to develop the m
ost appropriate nozzle/pressure standard to m
eet UK fleet operator needs for CN
G, LNG and L-
CNG stations
Industry: Develop comm
unication system to notify
drivers of technical/economic factors for infrastructure
(e.g. station type, fuel price and maintenance schedules)
1 -e.g. TEN-T funded projects and O
LEV £4m fund for future station deploym
entsLTS: Local Transm
ission System (high pressure gas grid)

201 Clean Pow
er for Transport program –
Directive on ‘the deployment of alternative fuels infrastructure’ (O
ctober 2014)
Innovative approaches such as semi-private stations provide a transition
strategy before wider vehicle and station deploym
ent in the 2020s-2030s
�A num
ber of fleet operators have deployed semi-private
refuelling facilities under cooperative contractual arrangem
ents allowing pre-agreed operators to share each
others facilities
�Advantages of this approach include m
aximising station
throughput and reducing dependency on public infrastructure rollout
�O
pportunities for further adoption of cooperative station ow
nership models w
ill enable a transition to significant vehicle uptake w
hen sufficient investor confidence exists for larger public infrastructure deploym
ent
Recomm
endationsCentral G
overnment: consider counting sem
i-private stations (w
here facility is shared between m
ultiple, pre-agreed users) as ‘public’ in the Im
plementation plan to be subm
itted to the EC as part of Directive 2014/94/EU
1
Industry: develop comm
ercial arrangements that facilitate further
adoption of the cooperative model
Depot infrastructure sharing5
Publically accessiblePrivate or sem
i-private
Natural gas refuelling station netw
ork
Key infrastructure operators:

21
While further research is needed, m
easures that minim
ise the GHG em
issions related to distribution and dispensing of gas should be adopted
Well-to-Tank (W
TT) emissions
6�In keeping w
ith national targets for reducing transport GHG emissions,
emissions relating to logistics and dispensing of gas should be m
inimised
�Current analysis is incom
plete and UK non-specific, how
ever some
emission factors are w
ell understood:−
CNG station siting activities should aim
to access high pressure grid connection points
−LN
G / L-CNG station siting activities should aim
to optimise delivery
logistics and adopt state-of-the-art venting prevention and capture system
s�
Biomethane achieves greater W
TT emission savings than natural gas but
UK production is lim
ited and incentives in place divert it to applications other than transport
Recomm
endationsLocal Authorities: Consider W
TT emission factors in conjunction w
ith planning guidance w
hen approving natural gas station installations
Central Governm
ent: Future infrastructure strategy should consider UK
specific findings (on-going ETI led analysis)
R&D bodies: Reduce costs for venting prevention / m
ethane capture technologies
National Grid upper and
lower bound scenarios for
biomethane production
�N
ational Grid has developed several scenarios of biom
ethane production, in the highest case it’s 35TW
h/year i.e. <5%
of total gas demand
�U
nder present incentives, the ‘N
o progression scenario’ is the m
ost likely case
UK biom
ethane production potentialGraph units: ktpa (TW
h shown as reference)
114114
4996
14 TWh
2015
1,048ktpa
35 TWh
2025
2,624ktpa
2035
Gone GreenN
o Progression
Source: Element Energy

22
The widespread use of hydrogen for m
obility will require substantial
growth in existing production and distribution infrastructure
Refer to the full report for full referencing of the analysis
�Production of hydrogen is currently lim
ited to meet m
ostly an industrial demand and often used on-
site, with lim
ited distribution by road in gaseous and liquid forms
�Strong grow
th in demand for m
obility, driven by uptake of hydrogen vehicles such as passenger cars, com
mercial vehicles, buses and fork lift trucks, w
ill need to be met by new
production
�A successful rollout in all vehicle types (i.e. reaching m
illions of vehicles after 2030) will require a
quadrupling of existing production capacity, met by conventional and green sources
�W
hile the relative growth of hydrogen in each vehicle type rem
ains uncertain, it is clear that a national refuelling netw
ork will be required to support passenger cars and private custom
ers
Current total UK hydrogen production
capacity and future transport demand
kt/year
2,300
690
2050
+233%
2015
Transport demand
Existing production capacity-based on scenario presented p. 8
Source: Element Energy

23
Basic national coverage
Public access
HRS #’sFirst 65 ‘sm
all’ HRS
HDV depots
Pressure
350 bar
Van/small truck depots
Indoor forklifts350 bar
Next c. 250 ‘m
edium’
and ‘large HRSN
ext c. 700 ‘medium
’ and ‘large’ HRS
Continued growth
based on demand
700 bar SAE-compliant fuelling for cars. HRS
investors encouraged to make 350 bar H
2 available to support other vehicle types w
here needed
Up to 5 additional c.
1t/day depot-based HRSEm
ergence of multi-tonne/day depots in m
ajor urban areas, covering m
ultiple routes eachN
ationwide deploym
ent of large bus depots
Gradual growth in indoor HRS as m
arket develops, m
oving from sm
all (<50kg/day) to large (>100kg/day)Conversion of m
ultiple large logistics centres from
batteries to fuel cells with indoor large HRS
The H2 infrastructure roadm
ap reflects the diverse refuelling needs of different vehicle types and the uncertainty about the speed of the rollout
Location
20152050
20202030
2025
Full national coverage
Dashed lines represent high uncertainty
Major m
ilestone /enabler
Production capacity largely for industry application
Provide base load to underutilised network in early years
H2 supply and
logisticsc. 3 ktpa
Production capacity
Transport dem
and
Provision of new centralised capacity
to support on-site deployments2015 production
capacity exceeded
c. 190 ktpac. 2.3 M
tpa
Increasing forecourt integration/decreasing stand-alone HRS
Limited use of depot-based refuelling
where cost-effective/convenient
HRS: hydrogen refuelling station
Cars
Vans
HDVs
Thousand vehiclesHydrogen vehicle stock
4,200-16,800
750-3,000
130
680-1,400100-2008
180-350
30-60
3
2<1<1
Infrastructure roadmap
20502020
20302025
c.£40mc.£180m
£400-700mc.£6,800bn
Projections are based on policy-led uptake scenarios presented on page 9
Data supported quantification of infrastructure requirem
ents

24
Industry and government w
ill need to work closely to secure the
deployment of the early public HRS netw
ork and hydrogen vehicles
Securing deployment of the early public HRS netw
ork1�
A certain number of HRS (e.g. 65 set out by the
H2 M
obility strategy) is likely to be needed to meet the
needs of the earliest customers and to continue to
attract OEM
s to the UK
�Low
utilisation means that these early HRS w
ill need public funding to attract private investm
ent
�HRS investors w
ill also require confidence from vehicle
suppliers on the timing and am
bition of vehicle deploym
ents
�Custom
er incentives are likely to be needed to encourage early vehicle sales as O
EMs transition to
lower cost second generation vehicles
�The netw
ork will also need to offer a consistent and high
quality customer experience, in term
s of the station ‘look and feel’, ease of use, paym
ent methods etc.
Source: Element Energy
Recomm
endationsCentral G
overnment: Provide financial support
to early HRS, using funding conditions to ensure high quality user experience and coherent geographic strategy. Provide support to vehicles through existing U
LEV incentives
Local Governm
ent: Help provide ‘base load’ dem
and to public HRS (e.g. FCEV procurement
for public fleets) and make sites available for
refuelling stations where possible
OEM
s: Provide transparency on numbers and
locations of vehicle deployments (as far as
possible) to maxim
ise confidence of HRS investors
HRS operators/suppliers: Work closely w
ith vehicle suppliers and their custom
ers to ensure that HRS siting and specifications m
eet their needs

25
Ensuring infrastructure is compatible w
ith all vehicle types and publicly accessible w
ill maxim
ise station utilisation
Maxim
ising utilisation of early stationsCoordination
23�
As the network grow
s, coordination of HRS siting is likely to be needed to optim
ise coverage and custom
er convenience
�Coordination is also likely to be needed on cross-cutting topics e.g. securing deploym
ents of ‘green hydrogen’ production capacity, m
etering and billing, progress tow
ards fully forecourt-integrated stations
�If use of standalone HRS continues, HRS operators should w
ork closely to define a consistent approach to siting and ‘look and feel’ to allow
drivers to find and use the infrastructure
Recomm
endationsAll H
2 stakeholders: Identify an appropriate forum to
allow discussion of these coordination activities, and to
present an aligned UK strategy in outreach to
international OEM
s to maxim
ise appetite to bring vehicles to the U
K
�Early netw
ork is likely to use 700 bar refuelling, based on requirem
ents of OEM
passenger cars
�O
ther vehicle types (e.g. vans, small trucks)
currently use 350 bar tanks which are not
compatible w
ith higher pressure dispensers
�The use of dual-pressure stations (700/350bar) allow
s public HRS to meet refuelling dem
ands of these vehicles, increasing early usage w
here dem
and exists
�Fleet vehicle users should also be encouraged to use public HRS rather than depot solutions w
here feasible to further increase utilisation
Recomm
endationsHRS investors: W
ork with vehicle suppliers to
identify needs for dual-pressure HRS sites
Local government: Encourage fleet stations to be
publicly accessible for private customers w
here feasible (e.g. through planning system
)
Source: Element Energy

26
Existing regulations should be amended to harm
onise the planning approval process, thereby stream
lining infrastructure installation
Siting and planning process4�
Lack of guidance on HRS safety requirem
ents can lead to planning delays and inconsistent user experience
�Transition from
standalone to forecourt-integrated sites likely tow
ards 2020
�W
ork to include hydrogen in the Blue Book
1 is underway to represent hydrogen,
in particular addressing electrical hazardous zones and safety distances, giving clear guidance for use by developers and petroleum
officers in designing and approving HRS on forecourts
Recomm
endationsLocal Authority planning team
s and regulatory authorities: Support the approval of integrating hydrogen infrastructure into existing forecourts; produce guidance docum
ents for standalone HRS
1National Guidance docum
ent jointly published by the Energy Institute and Association for Petroleum and
Explosives (APEA) used to assess and sign off the safety of new forecourt installations and upgrades
Innovation opportunities5�
Reducing the cost of HRS, H2 production
and distribution and vehicles will be
required to allow m
ass-market
deployments
�Q
uality assurance of H2 (low
er cost analysis, continuous m
onitoring etc.) needs to be further developed and standardised
�Engineering solutions are required for large scale depot refuelling beyond current fleet sizes (e.g. c.100 bus depot requiring c.2 tonnes/day)
�Full integration of w
ater electrolysers into the grid w
ill require further trials of technical and com
mercial arrangem
ents
Recomm
endationsInnovation funding bodies: W
ork with industry
to define clear innovation needs that can be delivered through R&
D funding and trials

27
New
policy may be required in the m
edium term
to ensure that the future hydrogen production m
ix delivers CO2 em
issions savings
Hydrogen production pathways
6�Current U
K hydrogen production capacity is insufficient to m
eet transport demand from
the m
id 2030s
�Therefore new
production capacity will need to
be introduced concurrently with vehicle dem
and grow
th, taking into account GHG emission
reduction targets
�A strategy w
ill be needed on how this capacity
will be delivered (based on the expected
volumes of hydrogen vehicles) w
hile ensuring that the overall production m
ix delivers very low
well-to-w
heel emissions
Recomm
endationsCentral G
overnment: Consider policy m
echanisms
to ensure sufficient volumes of low
carbon hydrogen sources
R&D bodies: Investigate low
cost green hydrogen production technologies
Technology type1.
Distributed water electrolysis
2.Conventional w
ater electrolysis3.
Coal gasification + carbon capture and storage4.
Centralised SMR + carbon capture and storage
5.IGCC + carbon capture and storage
6.Distributed steam
methane reform
ing 7.
Conventional steam m
ethane reforming
8.Internal gasification com
bined cycle9.
Coal gasification
Source: A portfolio of power-trains for Europe: a fact-based analysis, M
cKinsey & Co, 2011
Targets: technical targets to reduce carbon footprint of hydrogen as a transport fuel

28
A fully functioning infrastructure for dominant liquid fuels exists to
supply the UK vehicle parc
Based on vehicle uptake scenarios presented p. 9, they assume a 50:50 split betw
een diesel & petrol cars
�Liquid fuels (petrol and diesel) are the current dom
inant fuels for all road transport vehicles and as such have a extensive distribution and refuelling system
s, for both public forecourts and private bunkering
�Dem
and for liquid fuels in transport will significantly decrease post-2030, w
ith a total decrease of 50% to
80% by 2050 com
pared to today (depending on the uptake of Plug-in hybrid EV vs. battery or fuel cell EVs)
�The case of LPG
is different, with a possible increase in dem
and (mostly based on Air Q
uality policy drivers) from
c. 100 kt today to around 300-400 kt by 2030, well w
ithin UK production capacity
�Am
ong niche/future fuels investigated, liquid air is the most prom
ising one, especially for transport refrigeration units
Liquid fuel transport demand
Million tonnes/year
26238
913
20152030
3135
2050
3
-53%
7
3
16
4
2050
-81%
Light vehicles (petrol & diesel)
Heavy vehicles (diesel)High zero em
ission vehicle uptake

29
Infrastructure growth
entirely market driven
Operators trial niche fuel w
ith sm
all numbers of fleet vehicles
Key findings from trials inform
future operator investm
ent
With a predicted dem
and decrease for liquid fuels, forecourts may
have to integrate new fuels and/or receive support in certain locations
Continued slow rate of closures from
c.8,600 stations
Increased coexistence of multi-fuel
infrastructure to maxim
ise utilisation
Public forecourts
Growing proportion of bunkered dem
and w
ill shift to utilise forecourts with fuel cards
Private depots
20152050
20202030
2025
Support measures for som
e areas might be needed to m
aintain network
c. £250m-£600m
investment required for
upgrades and capacity installations
Trial integration of multiple
fuel infrastructures
Dashed lines represent high uncertainty
Major m
ilestone /enabler
c. 2,000c.1,400
c. 3,000
Niche fuels
Diesel
Integration
E20 forecourt investm
ent
Coverage
Potential transition to E20 would
require upgrades to existing forecourts
Dependent on feasibility of m
ulti-fuel integration and/or specific support
mechanism
s
Public selling points
LPG
Depot infrastructure fully comm
ercial –grow
th to follow dem
and
Cars
Vans
HDVs Thousand vehiclesLiquid fuel vehicle stock
6,000-31,0001,000-5,000
360
32,000
4,300
700
32,000
4,300
700
30,000
4,000
700
By 2050 cars are mostly RE-EVs / PHEVs
50-80%
decrease in fuel
demand on
2015 levels
Infrastructure roadmap
20502020
20302025
c.2,000
Projections are based on policy-led uptake scenarios presented on page 9
Data supported quantification of infrastructure requirem
ents

30
Delays to planning to modify forecourts should be m
inimised to avoid
investor uncertainty and financial support may be needed in certain areas
Station economics and support
1�Steep decline in dem
and beyond 2030 is likely to significantly im
pact com
mercial viability of fuel retailing,
(particularly for small public
forecourts located in rural areas of the U
K to start with, but m
ore w
idespread issue in long term)
�A transition to a higher biofuel blend w
ill require large investments
for tank replacements and/or
upgrades
Recomm
endationsCentral G
overnment: Consider
mechanism
s to ensure minim
um filling
station coverage, particularly in rural areas
Local Authorities: Identify any local supply shortages and forecourts m
ost affected by declining fuel dem
and
Planning permission guidance
2�Acquiring planning perm
ission to upgrade existing forecourt facilities can often be delayed or rejected
�Delays for upgrade approval can cause partial unavailability and negatively im
pact comm
ercial operation, thereby directly accelerating forecourt closure, particularly for underutilised areas
Recomm
endationsCentral G
ov. and LAs: Work w
ith regulators to identify com
mon causes
of delays and improve planning
permission guidelines as appropriate
Innovation opportunities3�
Biodiesel and bioethanol require additional handling considerations
�Higher bioethanol blends can dam
age regular refuelling facilities by causing stress corrosion cracking of steel and degradation of elastom
ers, therefore significant investm
ent will be
required to upgrade existing infrastructure
Recomm
endationsR&
D bodies: Investigate cost reduction opportunities for station upgrades to handle higher biofuel blends
Source: Element Energy

31
As declining liquid fuel demand causes station closures, facilitating
optimal use of rem
aining forecourts is likely to be required
Multi-fuel infrastructure integration
4�The transport system
is expected to be decarbonised through m
ultiple alternative fuels / energy vectors
�Existing forecourts are strategically sited to optim
ally service driver needs by m
ajor roads and junctions
�Co-locating infrastructure for m
ultiple fuels at forecourts could ensure utilisation is m
aintained
Recomm
endationsRegulators: Develop standards for co-locating m
ultiple infrastructures and w
ork with central governm
ent to develop planning guidance for Local Authorities
R&D bodies: Identify technical barriers to co-locating
multiple infrastructures (e.g. high pow
er rapid charge points adjacent to liquid fuels)
Industry and gov.:Liaise with APEA to update Blue Book
1
accordingly
Comm
unication of forecourt availability 5�
As forecourt closures continue (and new
blends are introduced), there will be an
increasing need to ensure drivers can easily access inform
ation detailing station & blend
availability and location
�Com
munication system
s to inform drivers of
real-time fuel availability at nearby public
forecourts supported by a national database could be developed
�Central coordination of softw
are developm
ent will ensure a consistent
interface between drivers and public
infrastructuree.g. allow
ing use with existing
navigation system providers
Recomm
endations
Industry: Develop comm
unication system
+
1National Guidance docum
ent jointly published by the Energy Institute and Association for Petroleum and
Explosives (APEA) used to assess and sign off the safety of new forecourt installations and upgrades

32Source: Elem
ent Energy and industry input
Methanol
�Consulted industry stakeholders are doubtful of the potential of m
ethanol in the UK, on the basis of
safety concernsand need for new
HGVs engine developm
ent (HGVs are target vehicles for m
ethanol in the U
K)
�Furtherm
ore, the air quality benefits and CO
2 benefits are not unclear
�If used for U
K transport, high blend m
ethanol will likely be bunkered
(not at forecourts)
�U
K would need to develop codes of
practise for storage and handlingof
methanol as w
ell as planning guidance; input from
industry players and countries fam
iliar with
methanol w
ill be valuable
Liquid Air (LAIR)�
Existing liquid nitrogen (LIN) production
will be used first, before dedicated
liquid air production is started
�LIN
/LAIR will be used m
ostly for cooling and/or for hybrid applications, as opposed to becom
ing a prime m
over
�It is expected LAIR w
ill be used exclusively by fleets w
ith depot refuelling
�Specialist skilled w
orkers will be
neededfor liquid air distribution (e.g.
cryogenic engineers and technicians )
�Skill-set overlap w
ith other sectors must
be investigated and consistent training program
mes developed as required
�Production of LIN
/ LAIR require electricity but the energy vector can also be used as a form
of energy storage
E85�
Consulted industry stakeholders are doubtful of the potential of E85, on the basis of the lack of vehicle supply, barriers to adoption of new
grade at inland term
inals and forecourtsand
low energy content(adding
issue to consumer
acceptance and fuel duty issue if price parity w
ith E5/E10 (per km
) must be
supported)
�Adoption of E85 could not be possible if E20 is adopted (lim
it to number of grades)
�Distribution w
ould be as for E10: blended at inland term
inals and transported by trucks to forecourts
Liquid air has the highest potential and developing a distribution infrastructure for transport m
ight require investment in U
K skills

33
Local Authorities will have a significant role in the delivery of the
Infrastructure Roadmap
Source: Element Energy for Birm
ingham City Council, A City Blueprint for Low
Carbon Fuel refuelling Infrastructure, 2015
�In practice, the Infrastructure Roadm
ap must be translated into infrastructure strategies developed and led at
local level as demand for fuels and opportunities are specific to a region/city. Cities also have varying focus on CO
2em
issions or Air Quality issues
�Local refuelling strategies m
ust account for: •
the local demand from
fleet and public transport, and the current infrastructure in place•
the local opportunities for production of low carbon fuel or distribution (e.g. access to high pressure gas grid,
to high voltage network)
Birmingham
City strategy
�Encourage and contribute to the uptake of low
carbon vehicles –e.g.
adoption in Council fleet, setting local incentives�
Use planning guidance to deliver strategy recom
mendations for
infrastructure –e.g. regarding siting and technical specifications
�Assist infrastructure providers in finding/assessing land for installation –
e.g. identify ow
ner, provide road access and traffic data�
Streamline planning processes for renew
able fuel production and infrastructure
�Include low
carbon fuels for transport into the development of energy
system strategies –
e.g. transport considerations can be integrated to review
of waste strategy (biom
ethane can produce heat, electricity or used as fuel)�
Work closely w
ith private fleets on demonstration and deploym
ent activities for low
carbon vehicles –e.g. encourage form
ation of stakeholder group for experience sharing, joint procurem
ent and consortia formation for funding
Specific actions LAs can take to support the rollout of refuelling infrastructure

34
Contents
Background and objectives
Approach
Transport Infrastructure Roadmaps
Conclusions

35
The deployment of public refuelling infrastructure for transport w
ill require significant new
investment and long term
policy clarity
1Includes stations capital costs only, opportunities for cost reduction to 2050 are not included. Investm
ent related to grid reinforcement not included
£0.2bn
£2.1bn
£10bn
20202050
2030
Methane
ElectricityLiquid fuels
Hydrogen
Cumulative public
infrastructure investment 1
Investment to deliver the future refuelling/recharging
infrastructure will require:
–Strong confidence for private investors, i.e. clear and long term
government position for different
fuels and policy drivers, confidence in long term
revenues to justify upfront investment
–Funding support in som
e cases in early years (w
hen asset utilisation levels are low)
–Coordination across governm
ent, regulators and industry to rem
ove certain barriers to installation of new
infrastructure e.g. lack of/unclear planning guidance, harm
onisation of safety procedures, integration of new
fuels in existing forecourts
Early investments
needing support Private investm
ents in profitable assets

36
Both central and local Governments and industry have roles to play in
this deployment –
coordination of efforts will be needed
AQ = Air Q
uality, LA = Local Authorities
Role of Central Government
�The Roadm
ap could be used for future policy design, for exam
ple supporting early infrastructure investm
ents, m
echanisms to encourage
continued/increased production of low
carbon fuels, targeted R&
D activities, identifying strategic needs in specific U
K locations�
Coordinating LAs and com
municating consistent
infrastructure planning guidelines w
ill avoid delays and ensure consistent infrastructure rollout
Role of Local Authorities
�The Roadm
ap could be translated into local strategies developed and led at local level as dem
and for fuels and opportunities are specific to a region/city w
ith varying focus on CO
2 emissions or AQ
issues�
Local strategies should consider local dem
and from fleet and
public transport, existing infrastructure, and local opportunities for production and/or distribution
of low
carbon fuel
Role of industry
�The Roadm
ap highlights the im
portance of deploying a nationally harm
onised infrastructure for each fuel type requiring an industry led, coordinated approach
�This role extends to ensuring a consistent and high quality custom
er offer for new
fuels�
Industry are also well
positioned to pursue infrastructure cost reduction opportunities provided a business case can be established

37
End user experience key to acceptance and uptake of new fuels; further
innovation is required to fully meet the needs of m
ass-market custom
ers
EVs : Electric Vehicles, WTT = W
ell-to-Tank
�Ensuring sufficient access to public refuelling/recharging infrastructure as w
ell as harm
onising the end user experience of infrastructure is key to supporting low em
ission vehicle uptake
�Innovation w
ill be needed:–
Comm
unication/IT solutions:for sharing charge points or refuelling stations across private users, for new
services such as dynamic booking, forecourt choice and
availability –
Technologies: e.g. to identify most appropriate recharging technology for depots;
hydrogen metering and quality assurance; optim
ising equipment for handling higher
biofuel blends–
Comm
ercial arrangements: e.g. to m
inimise netw
ork impact of EVs w
ith ‘smart’
solutions (e.g. Demand Side M
anagement) allow
water electrolysers to secure
revenues from providing grid services
�M
inimising W
TT emissions associated w
ith production and logistics of fuels (in particular m
ethane and hydrogen as decarbonisation targets are already in place for electricity) should be considered for future infrastructure siting and technology selection decisions

38
�The roadm
ap captures the future infrastructure development
needs based on today’s knowledge of refuelling/recharging
technologies and based on ambitious uptake scenarios for
alternative fuels
�The Roadm
ap will have to be updated on a regular basis for its
outputs to remain relevant as technologies evolve:
−Innovations on infrastructure technologies are expected, especially around charging technologies, w
here deployment
of new solutions could significantly change the strategy (e.g.
dynamic w
ireless vs. ultra fast charging)
−Vehicles are expected to change too, notably w
ith the introduction of autonom
ous vehicles. Opportunities and
development enablers for autonom
ous vehicles to refuel/recharge during non-operational w
indows, thus
removing the need for driver-infrastructure interaction need
to be better understood and included in future roadmaps
The Infrastructure Roadmap w
ill have to be updated to evolve with
the expected innovations in both refuelling and vehicle technologies
Source: Element Energy

39
Acronyms and references

40
Acronyms
BEVBattery Electric Vehicle
CCCCom
mittee on Clim
ate ChangeCN
GCom
pressed Natural Gas
COM
AHControl of M
ajor Accident HazardCP
Charge PointDECC
Department of Energy &
Climate Change
DfTDepartm
ent for Transport DN
O
Distribution Netw
ork Operators
DSR Dem
and Side Response EC
European Comm
issionETI
Energy Technologies InstituteEU
European Union
EV Electric Vehicle
FCEVFuel Cell Electric Vehicle
FCH JUFuel Cell Hydrogen Joint U
ndertaking H
2Hydrogen
HGVHeavy Goods Vehicle
HRSHydrogen Refuelling Station
HSEHealth and Safety Executive
ICEInternal Com
bustion EngineIEC
International Electro-technical Comm
issionIGEM
Institute for Gas Engineers and Managers
ktpathousands tonnes per annum
LALocal Authority
LBMLiquid Biom
ethane
LCNG
Liquefied and Compressed N
atural GasLIN
Liquid Nitrogen
LNG
Liquefied Natural Gas
LPGLiquefied Petroleum
GasLTS
Local Transmission System
Mt
Million tonnes
NGVA
Natural Gas Vehicle Association
OEM
Original Equipm
ent Manufacturer
OLEV
Office for Low
Emission Vehicles
PAYGPay AS You Go
PHEVPlug-in Hybrid Electric Vehicle
R&D
Research and Development
REEVRanger Extender Electric Vehicle
SGF Sm
art Grid Forum
SME
Small and m
edium enterprises
SMR
Steam M
ethane Reforming
STOR
Short Term O
perating Response TEN
-TTrans-European Transport N
etworks
ToUTim
e of Use
TSO
Transmission system
operatorTTW
Tank-to-Wheel
ULEV
Ultra-Low
Emissions Vehicle
WE
Water Electrolysis
WTT
Well-to-Tank
WTW
Well-to-W
heel

41
Main references
Refer to the Technical Appendix (issued separately) for a full list of references
−A portfolio of pow
er-trains for Europe: a fact-based analysis, 2011−
AEA for DfT, Modes 3 study, 2011
−DECC, Energy consum
ption in the UK, 2014
−DfT presentation at N
GV day, Low Carbon Truck and Refuelling Infrastructure Dem
onstration Trial Evaluation, June 2014−
DFT, RTFO Biofuel Statistics, 2014
−DU
KES Chapter 3, 4, 5, 2015−
ECF, Fuelling Europe’s Future: How auto innovation leads to EU
jobs, 2013−
Ecofys, UK Biofuel Industry overview, 2013
−Elem
ent Energy and E4Tech for the FCH JU, Development of W
ater Electrolysis in the European Union, 2014
−Elem
ent Energy for Birmingham
City Council, A City Blue Print for Low Carbon Fuel Refuelling Infrastructure, 2015
−Elem
ent Energy for CLNR, Review
of existing comm
ercial arrangements and em
erging best practice, 2013−
Element Energy for the Com
mittee on Clim
ate Change, Infrastructure in a low-carbon energy system
to 2030: Transmission and
distribution, 2013−
Element Energy, Ecolane and al. for the Com
mittee on Clim
ate Change, Pathways to high penetration of EVs, 2013
−ERTRAC, Energy Carriers for Pow
ertrains, 2014−
ETI, An affordable transition to sustainable and secure energy for light vehicles in the UK, 2013
−European Parliam
ent and Council, Directive 2009/30/EC, 2009−
JRC, WTT analysis of future autom
otive fuels and powertrains in the European context, 2014
−Liquid Air Energy N
etwork, Liquid Air on the Highw
ay, 2014−
National Grid, Future Energy Scenarios, 2014
−Ricardo AEA, Assessm
ent of the existing UK infrastructure capacity and vehicle fleet capability for the use of biofuels, 2011
−Roads2Hycom
Deliverable 2.1 and 2.1a, 2007−
Smart Grid Forum
, Assessing the Impact of Low
Carbon Technologies on UK pow
er distribution, 2012−
UK H
2 Mobility Phase 1, public report, 2013
−U
KPIA, Statistical Review, 2014−
UKPN
for Low Carbon London, Im
pact and opportunities for wide-scale Electric Vehicle deploym
ent, 2014