low-cost transducer based on surface scattering … · low-cost transducer based on surface...
TRANSCRIPT

IEEE
Proof
Low-Cost Transducer Based On SurfaceScattering Using Side-PolishedD-Shaped Optical FibersVolume 7, Number 5, October 2015
Y. S. OngW. KamS. W. HarunR. ZakariaWaleed S. Mohammed
DOI: 10.1109/JPHOT.2015.24816061943-0655 Ó 2015 IEEE
IEEE
Proof
1Low-Cost Transducer Based On Surface2Scattering Using Side-Polished3D-Shaped Optical Fibers4Y. S. Ong,1,2,3 W. Kam,1,2,3 S. W. Harun,2 R. Zakaria,2 and5Waleed S. Mohammed3
61Department of Physics, University of Malaya, Kuala Lumpur 50603, Malaysia72Photonic Research Centre, Faculty of Science, University of Malaya,8Kuala Lumpur 50603, Malaysia93Center of Research in Optoelectronics, Communications and Control Systems (BU-CROCCS),10Bangkok University, Bangkok 10120, Thailand11
12DOI: 10.1109/JPHOT.2015.2481606131943-0655 Ó 2015 IEEE. Translations and content mining are permitted for academic research only.14Personal use is also permitted, but republication/redistribution requires IEEE permission.15See http://www.ieee.org/publications_standards/publications/rights/index.html for more information.
16Manuscript received August 24, 2015; revised September 17, 2015; accepted September 17, 2015.17Date of publication Month 00, 0000; date of current version Month 00, 0000. This work was supported18by the Research University Grant RU 001-2014 and Grant UM.C/625/1/HIR/MOHE/SCI/01. Corre-19sponding author: R. Zakaria (e-mail: [email protected]).
20Abstract: This work presents a new low-cost and environmentally friendly optical trans-21ducer based on surface scattering in a side-polished fiber mounted on a glass groove.22The surface roughness caused by polishing is used to estimate the change in refractive23index on top of the fiber. Changing the surrounding index affects the scattering properties24and, consequently, the leakage of the guided mode. This effect is experimentally investi-25gated through the change in the attenuation coefficient when the surrounding refractive26index is changed by dropping different weight ratios of glucose solutions onto the po-27lished side. The measured change of the attenuation coefficient is consistent with the fi-28nite-element calculations. The effect of different polished depths was theoretically29investigated to optimize the working conditions.
30Index Terms: Author, please supply index terms/keywords for your paper. To download31the IEEE Taxonomy go to http://www.ieee.org/documents/taxonomy_v101.pdf AQ1.
321. Introduction33Optical-fiber transducers are commonly used as sensors in various sensing fields such as34chemical sensing [1] and humidity sensing [2], the automotive industry, and even molecular bio-35technology analysis monitoring. Studies on this technology have drawn much attention to pro-36duce high-durability sensors that can be used in hazardous environment and extreme conditions37such as extreme temperature or corrosive medium. Numerous structures apply this optical-fiber38transduction, such as Bragg grating in optical fibers, tapered fiber optics [2], D-shaped fiber op-39tics [3], [4], reflection-based sensors, and ring- or knot-based fiber optics [5]. An optical fiber op-40erates as a transducer when a fraction of power and the evanescent field propagate in the outer41environment. Hence, the sensing part of the fiber is sensitive to the variation of the surrounding42medium, which can be detected through the loss of light energy or phase changes.43Tapered fibers provide a low confinement of light because of the small radius at the waist,44which is the main reason that it is sensitive to any change in the outer environment. Tapered fiber45has been implemented in a large number of applications such as optical filtering [6], coupling [7],
Vol. 7, No. 5, October 2015 Page 1
IEEE Photonics Journal Transducer Based On Surface Scattering

IEEE
Proof
46and refractive index sensing [8], [9] because of its flexibility. Nonetheless, D-shaped fiber is an47asymmetrical structure, which is formed by polishing one side of the fiber to the core. This48asymmetry enables a few applications of the fiber, such as in intermodal interferometers [10]49and polarization-maintaining fibers [11].50The reduction of light confinement in the D-shaped fiber increases the evanescent field in the51surrounding, which confirms that the D-shaped fiber is a potential fiber for monitoring the change in52refractive index [12]. In practice, some applications require sensors that can be exposed to unpro-53tected environments. D-shaped fibers are typically carefree transducers that require no packaging54[13] for protection from dusty environments [14] and do not undergo undesired dynamic bending55[15] because they are easy to clean and are rigidly supported by a substrate, respectively.56This paper introduces a low-cost fiber transducer based on the change of the light-scattering57properties on the surface of side-polished single-mode fiber in changing environments. Increas-58ing the cladding's refractive index reduces the index difference between the scatterers (which59are formed because of the surface roughness) and the surrounding. Thus, the scattering coef-60ficient decreases, and there is less light leakage during propagation in the fiber core, as illus-61trated in Fig. 1. The sensitivity of this change depends on the polishing depth and surface62roughness condition of the polished fiber.63It is worth mentioning that the proposed D-shape fiber device shows high mechanical stability.64Manipulating the scattering effects makes the fabrication process of this device as cost-effective65as the no-coating or vacuum systems.
662. Experiment Methodology
672.1. Device Fabrication68The process begins with the groove fabrication. The following is a simple scheme for making69the fiber groove. Two pieces of tape are placed on a glass slide under a microscope to allow for70a small gap between the pieces of tape, as shown in Fig. 2(a). The desired gap is approximately71125 !m, in order to fit the optical fiber. This stage may require several repetitions because of72the manual technique of fiber placement. During the process, both sides of the gap are exam-73ined under the microscope to ensure a parallel groove. The gap is subsequently filled with a7410 : 1 volume ratio of hydrofluoric acid to hydrochloric acid to etch the glass substrate. With pro-75per timing, this step creates a smooth groove with a depth that fits half of the optical fiber [16],76as shown in Fig. 2(b) and (c). Rough groove is not desired as it may produce obvious grain77that could compress or bend the optical fiber. The groove was etched for 5 minutes to achieve a
Fig. 1. Scattering effect of reflection at the rough interface for different refractive indices. The inten-sity of the reflected light and scattered light is represented by the thickness of the arrow (not toscale). The dotted line represents the remaining cladding or rough core surfaces.
Vol. 7, No. 5, October 2015 Page 2
IEEE Photonics Journal Transducer Based On Surface Scattering

IEEE
Proof
78!70 !m depth. The entire etching process was performed in a sonicator to ensure consistent79etching along the groove. A cleaved piece of a single-mode optical fiber (SMF) SMF-28 was sub-80sequently mounted in the groove using epoxy. The mounted fiber was left in open air to cure.81A glass substrate was used because of its chemically inert properties and mechanical82strength compared to its polymer counterpart [17]. Moreover, it can be improvised into micro-83fluidic or lab-on-chip platforms because of its biocompatibility and optical transparency [18].84U-shaped grooves were created in this process because of the gap's width between the scotch85tape and the isotropic etching on glass using the acid mixture solution.86After curing, the fiber that was mounted in the groove was subsequently polished using871200-grit polishing fine sandpaper. To provide some consistency in the polishing process, an in-88house polishing tool was made by modifying a USB fan, where the blades were removed and the89sand-polishing sheet was fixed around the center. The polishing process ended after the desired90fiber diameter was roughly determined. The rough determination of desired fiber diameter was91done by manual observation of red light leakage during polishing process. Red light is feed into92the optical fiber during the process and the process is terminated once the red light is observed93from polished surface. The fiber was observed using an optical microscope afterward to measure94the diameter of the polished area. This process provides an indication of the distance between95the core centers and the interface. Note that the distance between the core and the interface96must be less than 6 !m to ensure the presence of evanescent wave at the sensing region. The97depth of polishing can be controlled using the fabricated groove. Depth of the groove will influ-98ence the distance of polishing which the process will stop when the sand paper touch the groove.99To better estimate the actual distance to the core from the surface, the loss in fiber was measured100and compared to the simulations as described later. The estimated length of the polished fiber101is approximately 15 mm, which acts as the sensing part of the device. Sandpapers of different102coarseness grades were used to assist in the polishing process, and the roughness was mea-103sured using a Dektak 150 Surface Profiler. The entire fabrication process is shown in Fig. 2.
1042.2. Experiment Setup105Fig. 3 shows the optical setup used to characterize the fiber optic transducer. The amplified106spontaneous emission (ASE 1500-1550 nm) was used as an input source, and the output was107coupled to an optical spectrum analyzer (OSA) to observe the changes. Deionized (DI) water108and different weight ratio of glucose solutions with different refractive indices of 1.327–1.3474109were placed on the polished surface of the optical fiber. The transmittance was recorded to ana-110lyze the effect of the changes on the measured signal.
Fig. 2. Fabrication process of a cheap transducer device. (a) Taping the groove. (b) Mixture of HCLand HF solution. (c) Etching process. (d) Epoxy fiber on the groove. (e) Polishing characterizationsetup. (f) Fiber subjected to in-house polishing tool.
Vol. 7, No. 5, October 2015 Page 3
IEEE Photonics Journal Transducer Based On Surface Scattering

IEEE
Proof 111Solutions of different refractive indices were controlled by mixing different concentrations of
112distilled water and glucose. The refractive index of the solutions for two wavelengths was mea-113sured using the Prism Coupler and Loss Measurement SPA-4000 [19], as shown in Table 1.
1143. Results and Discussion
1153.1. Experimental116In this experiment, changes of the refractive index affect the scattering properties of the po-117lished side of the fiber. This effect was measured based on the change in the attenuation coef-118ficient of the light while propagating in the fiber. Extracting the exact coefficient for each index119requires the breaking of the sample at different lengths (cut-back method). Another approach is120to use the scattering effects for side coupling [20]. The relative scattering attenuation coefficient121ð"Þ was measured by covering the polished side at different lengths. The coverage length ðlsoÞ122was also measured from microscope images that were obtained using an optical microscope,123which was placed on top of the fiber. The output power for each length was also recorded.124From the output intensity, the attenuation coefficient was subsequently calculated using Beer–125Lambert Law
I ¼ Ioe%"L: (1)
126Considering that different refractive indices were dropped onto the D-shape fiber, the relation of127the " coefficient can be written as
lnIsoIo
! "¼ ð"air % "soÞlso % "airðlairÞ þ 2"tpl tp
# $: (2)
Fig. 3. Experimental setup for fiber optic sensor characterization. Red light confirms the sensitivearea. The lower right microscope photo measures the diameter of the polished area.
TABLE 1
Refractive index of distilled water and glucose solutions at 632.8 nm and 1550 nm wavelengths
Vol. 7, No. 5, October 2015 Page 4
IEEE Photonics Journal Transducer Based On Surface Scattering

IEEE
Proof
128The first term of (2) on the right-hand side represents the attenuation difference from the solu-129tion and air on a sensing part with length lso. "air is the attenuation coefficient of the polished130part of the fiber ðlairÞ due to air, and "so is the attenuation coefficient of the D-shaped fiber that131was covered by the solution. "tp is the attenuation coefficient of the tapered part ðltpÞ. The first132term should yield a positive value if the scattering attenuation reduces. I0 is the reference inten-133sity of the ASE signal in air. Iso is the intensity of the transmitted light when a liquid with a cer-134tain refractive index and length of coverage lso is also placed on the sensing part of the fiber.135In this experiment, few samples were prepared using the proposed sand-polishing method.136The samples were labeled from A to D. Fig. 5 shows a linear-scale measurement change with137the transmittance (signal/reference or Iso=I0) against the coverage length for sample A. The rela-138tive scattering attenuation coefficient ð"air % "so) was extracted using the analogy of the linear fit139of the measurements in Fig. 5 to (2). This approach was subsequently used for weight ratio of140glucose solution, and the relative attenuation coefficient for each retrieved sample is shown in141Fig. 6.142Fig. 6 shows that the relative attenuation coefficient increases with the refractive index of the143solution because of the decrease in core confinement when the index of the upper region in-144creases. Stronger evanescent waves appear in the sensing region; hence, the scattering effect145increases. Note that different weight ratio of glucose solution affect the solution index. The sen-146sitivity of the measurements in terms of the relative attenuation coefficient per refractive index147unit (RIU) can be estimated from the slope of the linear fit. For the data in Fig. 6, the estimated148sensitivity is approximately 1130 m%1 per refractive index unit. The large difference among
Fig. 5. Graph of ln ðI j=IoÞ versus the amount of DI water on the polished part of the D-shaped fiber(Sample A).
Fig. 4. Diagram of a side-polished D-shape fiber with the polished length lair and tapered length l tp. AQ2
Vol. 7, No. 5, October 2015 Page 5
IEEE Photonics Journal Transducer Based On Surface Scattering

IEEE
Proof
149these samples is attributed to the inaccuracy of the manual approach in determining the polish-150ing depth and the imaging resolution, as previously mentioned. To investigate this effect, the fol-151lowing subsection finite-element method (FEM) was used to calculate the polishing depth effect152on the modal power confinement [22].
1533.2. Numerical Analysis154Here, different polishing conditions were considered, as shown in Fig. 7(a). Two main param-155eters were investigated: the polishing depth and the surrounding refractive index. Using FEM,156the field profiles and modal effective index for each case were calculated, as shown in Figs. 8157and 9. The calculated effective indices were subsequently used to extract the attenuation coeffi-158cient caused by the surface roughness as with surface scattering [22]:
" ¼ 4#2$3
% h þ 2&
% & (3)
159where # is the root mean square surface roughness, $ is the transverse propagation constant in
160the core region ð$ ¼ffiffiffiffiffiffiffiffiffiffiffiffiffiffiffiffiffiffiffiffiffik20n2 % %2
qÞ, & is the transverse propagation in the cladding region
161ð& ¼ffiffiffiffiffiffiffiffiffiffiffiffiffiffiffiffiffiffiffiffiffi%2 % k2
0n2q
Þ, % is the mode propagation constant, and h is the height of the remaining
162core. Surface roughness, mode's propagation constant and core dimension are factors that163dictate surface scattering strength in this attenuation coefficient relationship. Rougher surface164able to enhance surface scattering phenomenon, as it is “stronger” scatterer. The relative
Fig. 7. Core dimensions and claddings for COMSOL stimulation sweeping. (a) Different polishingdepth. (b) Placing different solutions on the D-shaped fiber.
Fig. 6. Relative attenuation coefficient ð"air % "sampleÞ versus the refractive index of the solutionfrom Sample A.
Vol. 7, No. 5, October 2015 Page 6
IEEE Photonics Journal Transducer Based On Surface Scattering

IEEE
Proof
165attenuation coefficient was found by subtracting the attenuation coefficient when air was the sur-166rounding from that of the solution (water and different weight ratio of glucose solutions, as167shown in Fig. 7(b)).168In the calculations in Fig. 8, the 1531 nm wavelength was selected. The polishing was as-169sumed to be uniform, and the fiber was considered to be straight. The refractive indices of the170core and cladding were 1.4497 and 1.4445, respectively. The different media with different re-171fractive indices are listed in Table 1. This value shows that the polishing plane was closer to the172core as it approached zero (when the polishing plane reached the fiber's center.) Light confine-173ment inside the core of the propagating mode from the electric field distribution is shown in174Fig. 8. As shown in the figures, light tends to spread in the substrate region when the polishing175depth increases. Polishing the fiber to the core region enables a weak evanescent wave to
Fig. 8. Mode profiles for different polishing depths with air on top (the white dashed line representsthe outline of the core and the polishing plane).
Fig. 9. Propagation constant versus the core dimension for different claddings.
Vol. 7, No. 5, October 2015 Page 7
IEEE Photonics Journal Transducer Based On Surface Scattering

IEEE
Proof 176appear in the sensing region. In addition to the reduction of power confinement, the fundamental
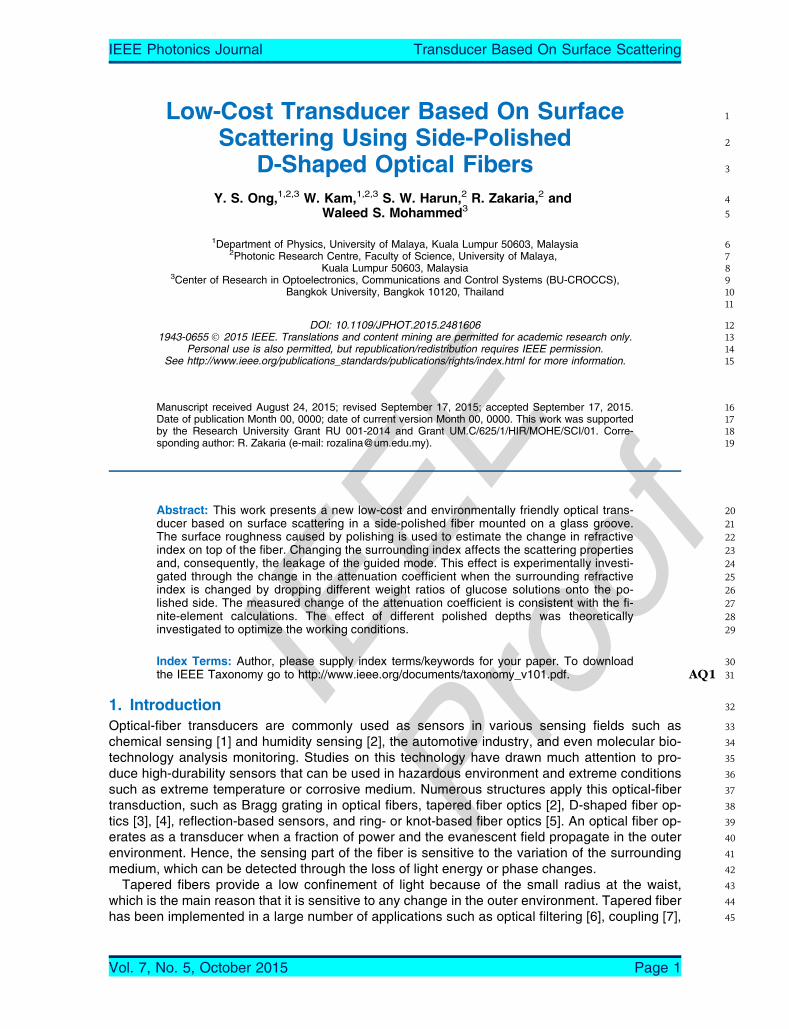
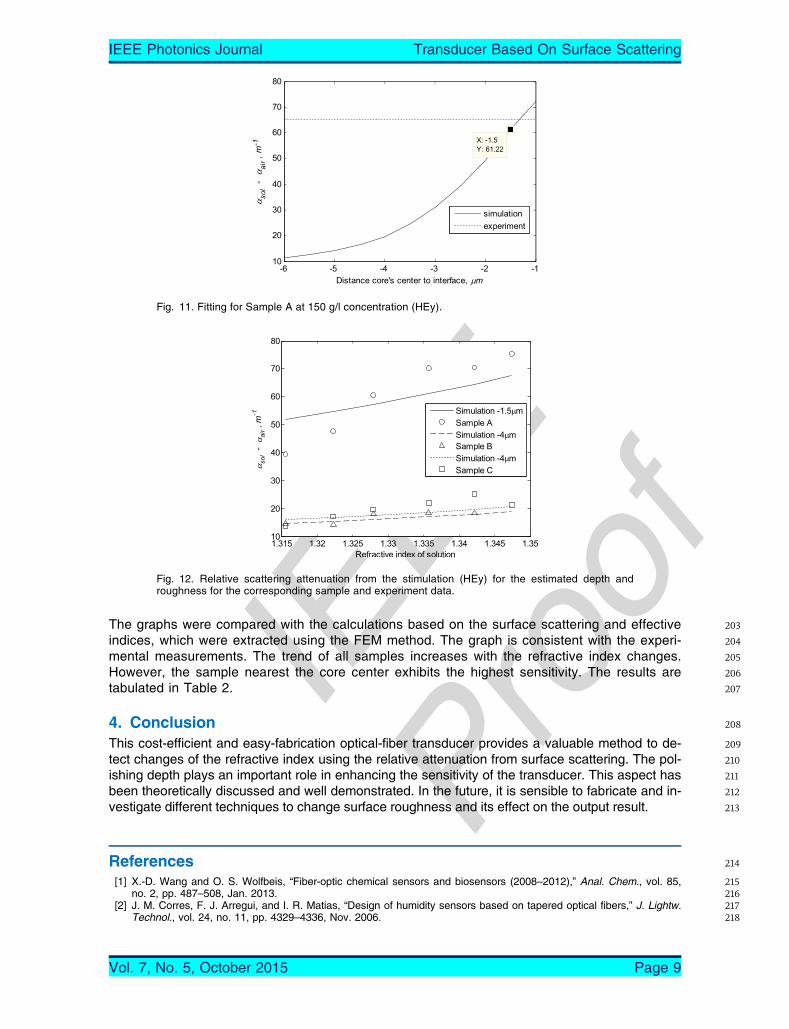
177mode splits into two with different propagation constant because of the induced asymmetry to178the fiber (see Fig. 9). The difference of two propagation constants becomes observable when179the fiber becomes more asymmetric, which is favorable for polarization maintenance.180The attenuation coefficient because of surface scattering was calculated using (3) and plotted181in Fig. 10 for two modes of polarization (HEx and HEy) versus the distance from the core center182at two different surrounding refractive indices.183The graph in Fig. 10 shows a non-linear increment of the relative attenuation coefficient with184the polishing depth. The relative attenuation appears to increase more rapidly after a distance of185%4 !m when the core diameter decreases. This distance is approximately the radius of the core,186which shows that the core begins to be exposed, which increases the effect of the surrounding187on the guiding-mode properties and the scattering properties of the surface roughness. When a188higher-refractive-index solution is placed on the interface, the evanescent wave increases in the189sensing region because of the reduction of the attenuation coefficient ", and the guided light is190pushed up towards the surface. This phenomenon is consistent with the positive slope in Fig. 6.191As previously mentioned, three samples were prepared with similar roughness and different192polishing depth values, as shown in Table 2. Here, the change in performance is obviously be-193cause of the effect of the polishing depth.194The surface roughness values in Table 2 ðRqÞ were measured using a surface profiler and195the estimated distance core center from the interface come from measured diameter of polished196area. The estimated distance core center from the interface was compared with the simulation197result to reconfirm the polishing depth. The measured etched depth, which was obtained198from experimental data, is consistent with the simulation using (3), as shown in Fig. 11 for199sample A. This comparison between using HEy polarization and using both polarizations is not200significant.201Samples B and C have larger distances from the core center. Hence, the evanescent wave202strength is expected to decrease, as clearly shown by the reduction of their slopes in Fig. 12.
Fig. 10. Attenuation coefficient of the rms roughness 192.315 nm (Sample B) based on the calcula-tion of the effective index by COMSOL.
TABLE 2
Roughness, diameter, polishing depth, and sensitivity of the samples
Vol. 7, No. 5, October 2015 Page 8
IEEE Photonics Journal Transducer Based On Surface Scattering
IEEE
Proof
203The graphs were compared with the calculations based on the surface scattering and effective204indices, which were extracted using the FEM method. The graph is consistent with the experi-205mental measurements. The trend of all samples increases with the refractive index changes.206However, the sample nearest the core center exhibits the highest sensitivity. The results are207tabulated in Table 2.
2084. Conclusion209This cost-efficient and easy-fabrication optical-fiber transducer provides a valuable method to de-210tect changes of the refractive index using the relative attenuation from surface scattering. The pol-211ishing depth plays an important role in enhancing the sensitivity of the transducer. This aspect has212been theoretically discussed and well demonstrated. In the future, it is sensible to fabricate and in-213vestigate different techniques to change surface roughness and its effect on the output result.
214References215[1] X.-D. Wang and O. S. Wolfbeis, “Fiber-optic chemical sensors and biosensors (2008–2012),” Anal. Chem., vol. 85,216no. 2, pp. 487–508, Jan. 2013.217[2] J. M. Corres, F. J. Arregui, and I. R. Matias, “Design of humidity sensors based on tapered optical fibers,” J. Lightw.218Technol., vol. 24, no. 11, pp. 4329–4336, Nov. 2006.
Fig. 11. Fitting for Sample A at 150 g/l concentration (HEy).
Fig. 12. Relative scattering attenuation from the stimulation (HEy) for the estimated depth androughness for the corresponding sample and experiment data.
Vol. 7, No. 5, October 2015 Page 9
IEEE Photonics Journal Transducer Based On Surface Scattering

IEEE
Proof
219[3] M.-H. Chiu, C.-H. Shih, and M.-H. Chi, “Optimum sensitivity of single-mode D-type optical fiber sensor in the inten-220sity measurement,” Sens. Actuators B, Chem., vol. 123, no. 2, pp. 1120–1124, May 2007.221[4] C.-H. Chen, T.-C. Tsao, J.-L. Tang, and W.-T. Wu, “A multi-D-shaped optical fiber for refractive index sensing,”222Sensors, vol. 10, no. 5, pp. 4794–4804, May 2010.223[5] K. S. Lim et al., “Current sensor based on microfiber knot resonator,” Sensors Actuators A, Phys., vol. 167, no. 1,224pp. 60–62, May 2011.225[6] X. Jiang, Y. Chen, G. Vienne, and L. Tong, “All-fiber add-drop filters based on microfiber knot resonators,” Opt.226Lett., vol. 32, no. 12, pp. 1710–1712, 2007.227[7] A. Boucouvalas and G. Georgiou, “External refractive-index response of tapered coaxial couplers,” Opt. Lett., vol. 11,228no. 4, pp. 257–259, 1986.229[8] C. Bariáin, I. R. Matías, F. J. Arregui, and M. López-Amo, “Optical fiber humidity sensor based on a tapered fiber230coated with agarose gel,” Sensors Actuators B, Chem., vol. 69, no. 1/2, pp. 127–131, Sep. 2000.231[9] M. Zibaii et al., “Non-adiabatic tapered optical fiber sensor for measuring the interaction between "-amino acids in232aqueous carbohydrate solution,” Meas. Sci. Technol., vol. 21, no. 10, Sep. 2010, Art. ID. 105801.233[10] L. Gao, T. Zhu, J. Zeng, and K. S. Chiang, “Temporal response measurement of magnetic fluids based on D-shaped234fiber intermodal interferometer,” Appl. Phys. Exp., vol. 6, 2013, Art. ID. 052502.235[11] C. Ruiz Zamarreño, P. Zubiate, M. Sagües, I. Matias, and F. Arregui, “Experimental demonstration of lossy mode236resonance generation for transverse-magnetic and transverse-electric polarizations,” Opt. Lett., vol. 38, no. 14,237pp. 2481–2483, Jul. 2013.238[12] A. O. Dikovska et al., “Optical sensing of ammonia using ZnO nanostructure grown on a side-polished optical-fiber,”239Sensors Actuators B, Chem., vol. 146, no. 1, pp. 331–336, Apr. 2010.240[13] K. Lim, S. Harun, H. Arof, and H. Ahmad, “Fabrication and applications of microfiber,” in Selected Topics on Optical241Fiber Technology, D. M. Yasin, Ed. Rijeka, Croatia: InTech, 2012, pp. 473–508.242[14] M. Fujiwara, K. Toubaru, and S. Takeuchi, “Optical transmittance degradation in tapered fibers,” Opt. Exp., vol. 19,243no. 9, pp. 8596–8601, Apr. 2011.244[15] I. Matias, “Transmitted optical power through a tapered single-mode fiber under dynamic bending effects,” Fiber245Integr. Opt., vol. 22, no. 3, pp. 173–187, 2003.246[16] C. Iliescu, K. L. Tan, F. E. Tay, and J. Miao, “Deep wet and dry etching of Pyrex glass: A review,” Proc. ICMAT, 2005,247pp. 75–78.248[17] C. Iliescu, H. Taylor, M. Avram, J. Miao, and S. Franssila, “A practical guide for the fabrication of microfluidic devices249using glass and silicon,” Biomicrofluidics, vol. 6, no. 1, Mar. 2012, Art. ID. 016505.250[18] J. M. Nagarah and D. A. Wagenaar, “Ultradeep fused silica glass etching with an HF-resistant photosensitive resist251for optical imaging applications,” J. Micromech. Microeng., vol. 22, no. 3, Mar. 2012, Art. ID. 035011.252[19] W. Lim et al., “Graphene oxide-based waveguide polariser: From thin film to quasi-bulk,” Opt. Exp., vol. 22, no. 9,253pp. 11 090–11 098, May 2014.254[20] H. Fallah et al., “Demonstration of side coupling to cladding modes through zinc oxide nanorods grown on multi-255mode optical fiber,” Opt. Lett., vol. 38, no. 18, pp. 3620–3622, Sep. 2013.256[21] J. A. Tamada, M. Lesho, and M. J. Tierney, “Keeping watch on glucose,” IEEE Spectrum, vol. 39, no. 4, pp. 52–57,257Apr. 2002.258[22] C. Viphavakit et al., “Realization of a polymer nanowire optical transducer by using the nanoimprint technique,”259Appl. Opt., vol. 53, no. 31, pp. 7487–7497, Nov. 2014.
Vol. 7, No. 5, October 2015 Page 10
IEEE Photonics Journal Transducer Based On Surface Scattering