low-cost private schools in tanzania
TRANSCRIPT
Policy Research Working Paper 9360
Low-Cost Private Schools in Tanzania
A Descriptive Analysis
Shwetlena SabarwalCeleste Sununtnasuk
Deepika Ramachandran
Education Global PracticeAugust 2020
Pub
lic D
iscl
osur
e A
utho
rized
Pub
lic D
iscl
osur
e A
utho
rized
Pub
lic D
iscl
osur
e A
utho
rized
Pub
lic D
iscl
osur
e A
utho
rized

Produced by the Research Support Team
Abstract
The Policy Research Working Paper Series disseminates the findings of work in progress to encourage the exchange of ideas about development issues. An objective of the series is to get the findings out quickly, even if the presentations are less than fully polished. The papers carry the names of the authors and should be cited accordingly. The findings, interpretations, and conclusions expressed in this paper are entirely those of the authors. They do not necessarily represent the views of the International Bank for Reconstruction and Development/World Bank and its affiliated organizations, or those of the Executive Directors of the World Bank or the governments they represent.
Policy Research Working Paper 9360
This paper discusses the potential role of low-cost private secondary schools in Tanzania. The share of private enroll-ment has been negatively correlated with the availability of public schools. With the 2016 Fee-Free Basic Education Policy, the public secondary education system is experi-encing significant demand pressures. The government has limited resources to address these pressures. Using micro-data from the Morogoro region, the paper finds that private
schools have excess capacity that can allow for absorption of additional students at relatively low cost through potential public-private partnerships. The paper finds no evidence that service delivery or student performance is worse in private schools relative to their public counterparts. These findings provide empirical evidence on some key enabling conditions for potential public-private partnerships for sec-ondary education in Tanzania.
This paper is a product of the Education Global Practice. It is part of a larger effort by the World Bank to provide open access to its research and make a contribution to development policy discussions around the world. Policy Research Working Papers are also posted on the Web at http://www.worldbank.org/prwp. The authors may be contacted at [email protected].

Low-Cost Private Schools in Tanzania: A Descriptive Analysis
Shwetlena Sabarwal The World Bank
Celeste Sununtnasuk International Food Policy
Research Institute
Deepika Ramachandran The World Bank
JEL Codes: I22, I28, J20, J24
Keywords: Private schools; Public-Private Partnership; Universal Access; Education Systems; Tanzania.
Acknowledgements: We are grateful for inputs from Mariam Adil, Samer Al-Samarrai, James Habyarimana, Kanishka Kacker, Dmitry Chugunov, Ravinder Casley Gera, Inaam Ul Haq, and Research In Improving Systems of Education (RISE) team. Financial support from the Strategic Impact Evaluation Fund and Multi-Donor Education and Skills Fund are gratefully acknowledged. The findings, interpretations, and conclusions expressed in this paper are entirely those of the authors. They do not necessarily represent the view of the World Bank, its Executive Directors, or the countries they represent.
2
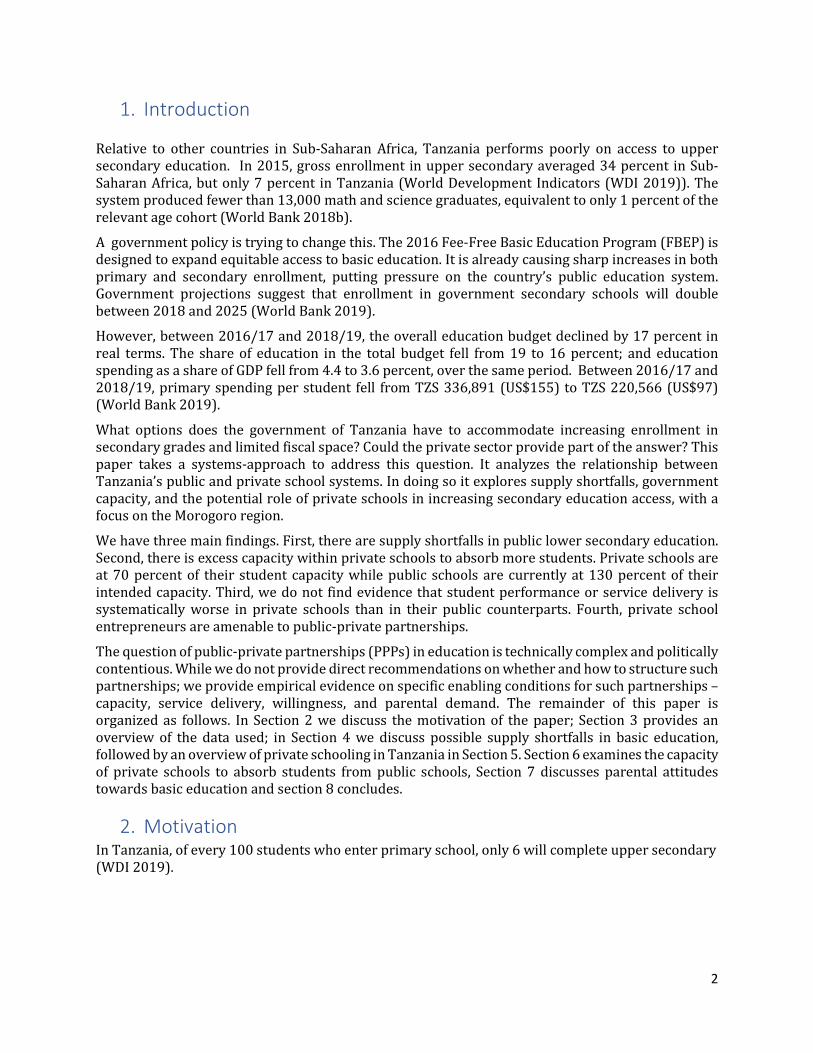
1. Introduction
Relative to other countries in Sub-Saharan Africa, Tanzania performs poorly on access to upper secondary education. In 2015, gross enrollment in upper secondary averaged 34 percent in Sub-Saharan Africa, but only 7 percent in Tanzania (World Development Indicators (WDI 2019)). The system produced fewer than 13,000 math and science graduates, equivalent to only 1 percent of the relevant age cohort (World Bank 2018b).
A government policy is trying to change this. The 2016 Fee-Free Basic Education Program (FBEP) is designed to expand equitable access to basic education. It is already causing sharp increases in both primary and secondary enrollment, putting pressure on the country’s public education system. Government projections suggest that enrollment in government secondary schools will double between 2018 and 2025 (World Bank 2019).
However, between 2016/17 and 2018/19, the overall education budget declined by 17 percent in real terms. The share of education in the total budget fell from 19 to 16 percent; and education spending as a share of GDP fell from 4.4 to 3.6 percent, over the same period. Between 2016/17 and 2018/19, primary spending per student fell from TZS 336,891 (US$155) to TZS 220,566 (US$97) (World Bank 2019).
What options does the government of Tanzania have to accommodate increasing enrollment in secondary grades and limited fiscal space? Could the private sector provide part of the answer? This paper takes a systems-approach to address this question. It analyzes the relationship between Tanzania’s public and private school systems. In doing so it explores supply shortfalls, government capacity, and the potential role of private schools in increasing secondary education access, with a focus on the Morogoro region.
We have three main findings. First, there are supply shortfalls in public lower secondary education. Second, there is excess capacity within private schools to absorb more students. Private schools are at 70 percent of their student capacity while public schools are currently at 130 percent of their intended capacity. Third, we do not find evidence that student performance or service delivery is systematically worse in private schools than in their public counterparts. Fourth, private school entrepreneurs are amenable to public-private partnerships.
The question of public-private partnerships (PPPs) in education is technically complex and politically contentious. While we do not provide direct recommendations on whether and how to structure such partnerships; we provide empirical evidence on specific enabling conditions for such partnerships – capacity, service delivery, willingness, and parental demand. The remainder of this paper is organized as follows. In Section 2 we discuss the motivation of the paper; Section 3 provides an overview of the data used; in Section 4 we discuss possible supply shortfalls in basic education, followed by an overview of private schooling in Tanzania in Section 5. Section 6 examines the capacity of private schools to absorb students from public schools, Section 7 discusses parental attitudes towards basic education and section 8 concludes.
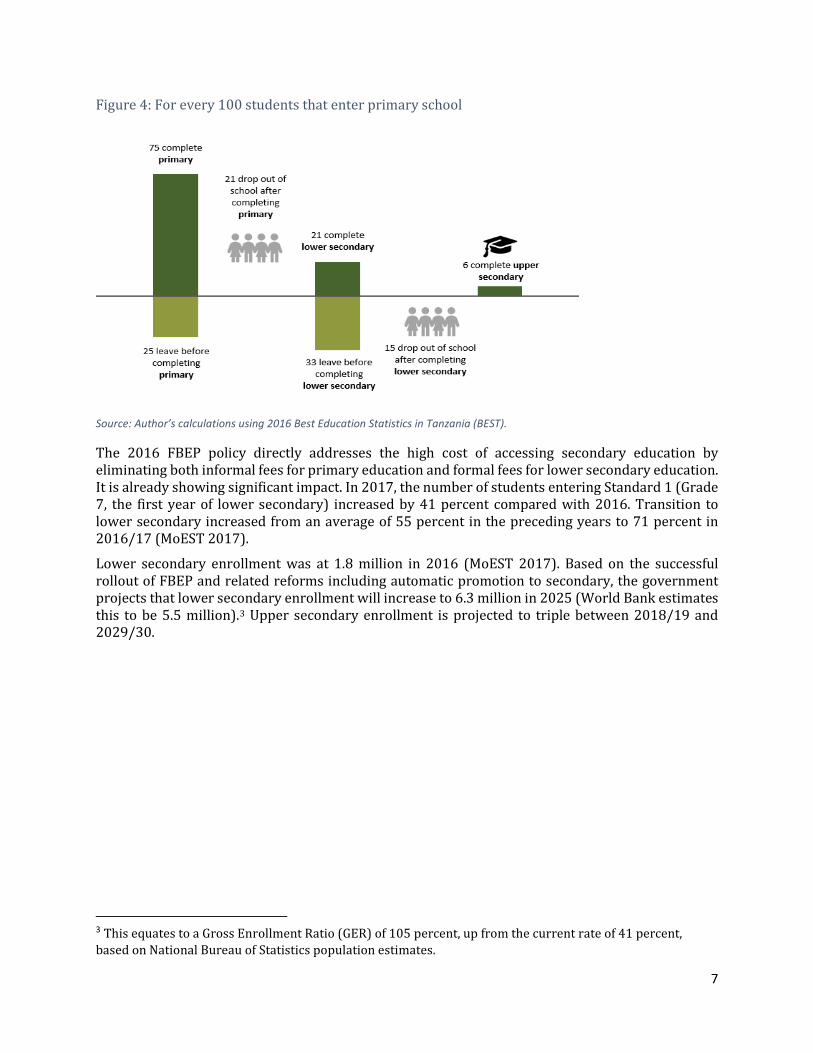
2. Motivation In Tanzania, of every 100 students who enter primary school, only 6 will complete upper secondary (WDI 2019).
3
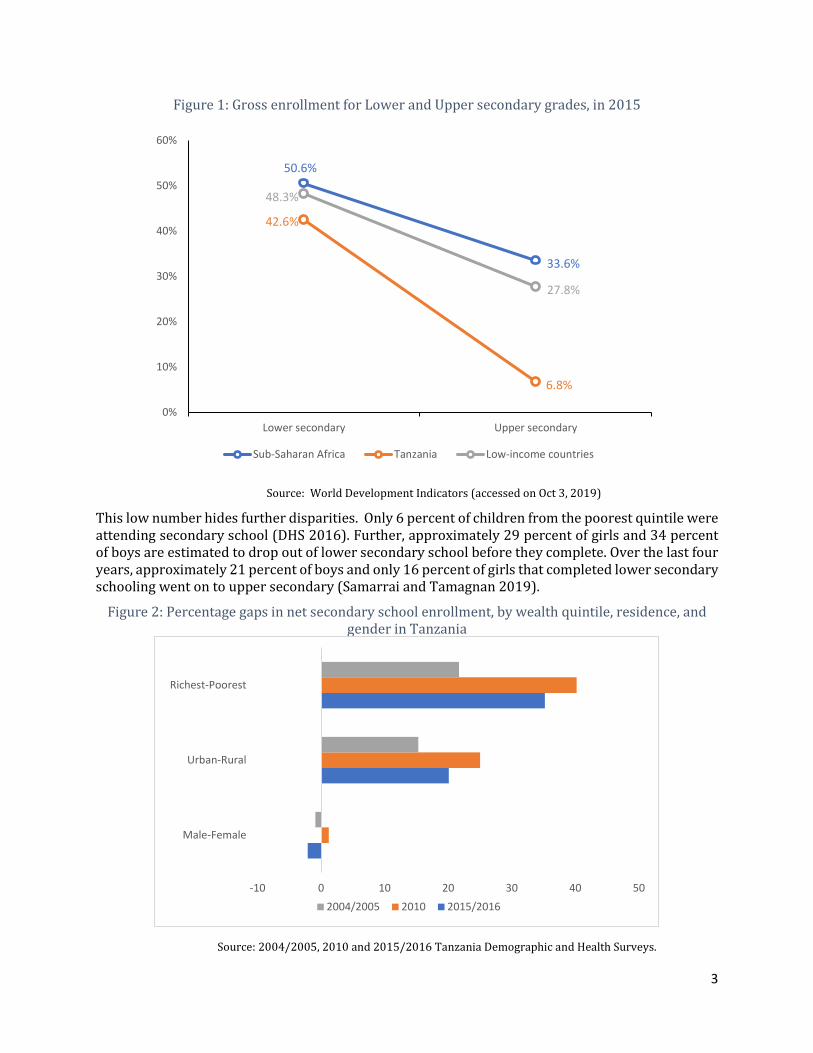
Figure 1: Gross enrollment for Lower and Upper secondary grades, in 2015
Source: World Development Indicators (accessed on Oct 3, 2019)
This low number hides further disparities. Only 6 percent of children from the poorest quintile were attending secondary school (DHS 2016). Further, approximately 29 percent of girls and 34 percent of boys are estimated to drop out of lower secondary school before they complete. Over the last four years, approximately 21 percent of boys and only 16 percent of girls that completed lower secondary schooling went on to upper secondary (Samarrai and Tamagnan 2019).
Figure 2: Percentage gaps in net secondary school enrollment, by wealth quintile, residence, and gender in Tanzania
Source: 2004/2005, 2010 and 2015/2016 Tanzania Demographic and Health Surveys.
50.6%
33.6%
42.6%
6.8%
48.3%
27.8%
0%
10%
20%
30%
40%
50%
60%
Lower secondary Upper secondary
Sub-Saharan Africa Tanzania Low-income countries
-10 0 10 20 30 40 50
Male-Female
Urban-Rural
Richest-Poorest
2004/2005 2010 2015/2016

4
However, these enrollment rates have spiked with the FBEP policy (MoEVT 2016 – 17). Between 2015 and 2018, the introduction of FBEP increased primary and secondary school enrollment rates by 20 and 24 percent, respectively and secondary transition rates rose from 67 to 71 percent in 2018 (World Bank 2019b). At the same time there is evidence that primary and secondary education systems are already under considerable pressure in terms of input availability (see Section 3). Given these trends, how should Tanzania plan education service delivery in preparation for current and projected sharp enrollment increases?
One possibility for accommodating the rapidly increasing secondary enrollment is for private schools to play a role. Globally, private schools are increasingly important in education service delivery, even for poor families. Roughly one in eight primary school students around the world attends a private school. In middle-income countries, one in four secondary students attend a private school (World Bank 2018a). In fact, in some contexts, parents seem willing to bypass lower-quality public schools in favor of better-quality private ones with higher fees (Andrabi et al 2008).
Why are private schools increasingly important in conversations about public education service delivery? This can be for several reasons. First, of particular relevance to this paper, private schools can fill a supply gap when the nearest public schools are far away, or when there is demand to expand faster than public infrastructure can be built (Oketch et al 2010, Tooley 2005). Private schools may also be more innovative than public schools because they have more autonomy (Patrinos et al 2009). Private schools may have lower rates of teacher absence (Bold et al 2017). Also, competition from private schools may improve the performance of nearby public schools (Kosec 2014, Sandström and Bergström 2005).
However, despite growing global relevance, private school involvement as a part of any government’s official education strategy tends to be highly controversial. This is partially because private schools may exacerbate existing inequalities in education access - a particular concern if these schools skim off the higher-income or higher-performing students, leaving only the more disadvantaged students in the public system. Some have argued that even if private schools bring short-term benefits, they may undermine effective public schooling in the longer term. Also, cross-country data analysis finds no private school advantage in terms of student performance in a majority of countries, when controlling for other factors (Sakellariou 2017).
One possible solution that may minimize risks but maximize potential benefits of private schools is well-designed public-private partnerships. These are contracts between the government and a private sector provider, where the government acquires a service for a specified time period, for instance, with the aim to increase enrollment and minimize inequality (Taylor 2003). PPPs in education may be able to ensure increased access by harnessing the excess capacity, management efficiency, and creative potential of the private sector without sacrificing the equity goals typically associated with the public sector. PPP designs can address both supply- and demand-side constraints. The most prevalent demand-side mechanisms include vouchers and subsidies and supply-side mechanisms include private finance initiatives where the private sector is contracted to operate/maintain/manage schools or even to provide services like teacher training, curriculum design and textbook provision (Patrinos 2009).
Would PPPs in basic education be a viable strategy for Tanzania? This paper provides a first-stage empirical exploration of this question. It examines some important enabling conditions for potential PPPs in secondary education in Tanzania through different information sources and perspectives. We rely largely on in-depth data on public and private schools in the Morogoro region of Tanzania, buttressed by national statistics and a nationally representative parental SMS survey.

5
3. Data
For national statistics, the paper relies on data from the Ministry of Education, Science, and Training (MoEST) Basic Education Statistics (BEST) and the World Bank’s World Development Indicators (WDI). Other data come from three sources.
1. 2013 school survey undertaken as the baseline of an impact evaluation (IE) by the World Bank. This is referred to henceforth as the 2013 IE data. The study sample includes 396 lower secondary schools from five regions of Tanzania: Simiyu, Shinyanga, Morogoro, Lindi and Geita.1 Around 16 percent of the interviewed schools are private and the remaining are public. The survey includes information from head-teacher and teacher surveys, along with tests for Form III (Grade 9) students. As a part of data collection, students were tested in independently-created curriculum-based tests on English, Mathematics and Kiswahili. For the purposes of this analysis, we include only schools from the Morogoro region (166 schools), as we can merge it with other data sources, including administrative data on student performance.
2. 2015 school survey in Morogoro undertaken by the World Bank. This is referred to henceforth as the 2015 Morogoro data. This survey collected information from 142 schools in the Morogoro region of Tanzania, 53 of which were public schools and 89 of which were private schools. Roughly, 62 percent of the schools were at pre-primary/primary level and the remaining (38 percent) were at the secondary level (lower secondary, upper secondary or both). It included interviews with head-teachers on school demographics, operational costs, management and student outcomes. The survey was not designed to be nationally representative.
For private schools, an additional module on possible partnership with the government was included. Private schools were randomly selected to be administered one of two versions of this module. The first version phrases questions in a personalized manner, asking respondents directly their opinions on partnering with the government. The second version phrases questions in a generalized manner, asking respondents their opinions on partnerships of the average private entrepreneur.
Average PSLE marks and CSEE grade point averages (GPA) from 2013 to 2016 were merged with the 2015 Morogoro data to assess differences between public and private schools over time. PSLE marks and CSEE GPAs were provided by the National Examination Council of Tanzania (NECTA).
3. 2017 SMS survey of parents undertaken by TWAWEZA, a prominent civil society organization focused on improving education service delivery in Tanzania. This is referred to henceforth as the 2017 SMS data. Every year TWAWEZA conducts a Sauti za Wananchi (Voices of Citizens) survey using mobile phones to regularly collect information from a nationally representative panel of mainland Tanzanian citizens. To help avoid bias toward the wealthiest households (who are more likely to own mobile phones) and those in urban areas (who are more reliably able to charge them), all respondents recruited for the survey were offered a simple mobile phone and solar charger.
The 2017 survey, used in this paper, collected information from 1,396 households across Tanzania who had a child in primary school and/or a child in secondary school. The respondent for the questionnaire was the head of the household. Of the households surveyed, 1,251 had at least one child in public school, 77 had at least one child in private school, and 68 households had children in both public and private schools. This was the 23rd round of calls made to the panel of households.
1 At the time of sampling (2012), old regional demarcations applied, due to which the schools sampled from Simiyu and Geita belong originally to Shinyanga. This means that data from Simiyu and Geita are not regionally representative.

6
4. Supply shortfalls in secondary education
In 2001, Tanzania eliminated school fees at the primary level, which increased primary enrollment rates from 58.8 percent in 2000 to 80.7 percent by 20022 (Government of Tanzania 2011, MoEST 2005). There is evidence that the significant increases in enrollment, particularly among girls and children from households in the lowest wealth quintile, can be attributed to the fee-free primary school policy (Hoogeveen and Rossi 2013). Uganda went through a similar spike in 1997, when it abolished primary school fees (Figure 3).
Figure 3: Gross Primary School Enrollment Rates, 1990-2017
Source: World Development Indicators (WDI), 1990-2017
However, the increase in the lower secondary enrollment rate has not been as steep. The secondary gross enrollment rate increased from 7 to 22 percent from 2000 to 2007 (SEDP 2010) while the primary GER during the same time went from 67 to 111 percent (WDI). At only 23 percent, low rates of secondary enrollment persist today (MoEST 2016). A key reason for these low rates has been the high cost of secondary schooling.
2 The graph below shows that the increase in primary school enrollment in Tanzania began in 2000. This increase in 2000-2001 could have been in anticipation of the policy eliminating primary school fees.
40%
60%
80%
100%
120%
140%
1990 1992 1994 1996 1998 2000 2002 2004 2006 2008 2010 2012 2014 2016
Tanzania Uganda Kenya Sub-Saharan Africa
Implementation of free primary education in Tanzania
7
Figure 4: For every 100 students that enter primary school
Source: Author’s calculations using 2016 Best Education Statistics in Tanzania (BEST).
The 2016 FBEP policy directly addresses the high cost of accessing secondary education by eliminating both informal fees for primary education and formal fees for lower secondary education. It is already showing significant impact. In 2017, the number of students entering Standard 1 (Grade 7, the first year of lower secondary) increased by 41 percent compared with 2016. Transition to lower secondary increased from an average of 55 percent in the preceding years to 71 percent in 2016/17 (MoEST 2017).
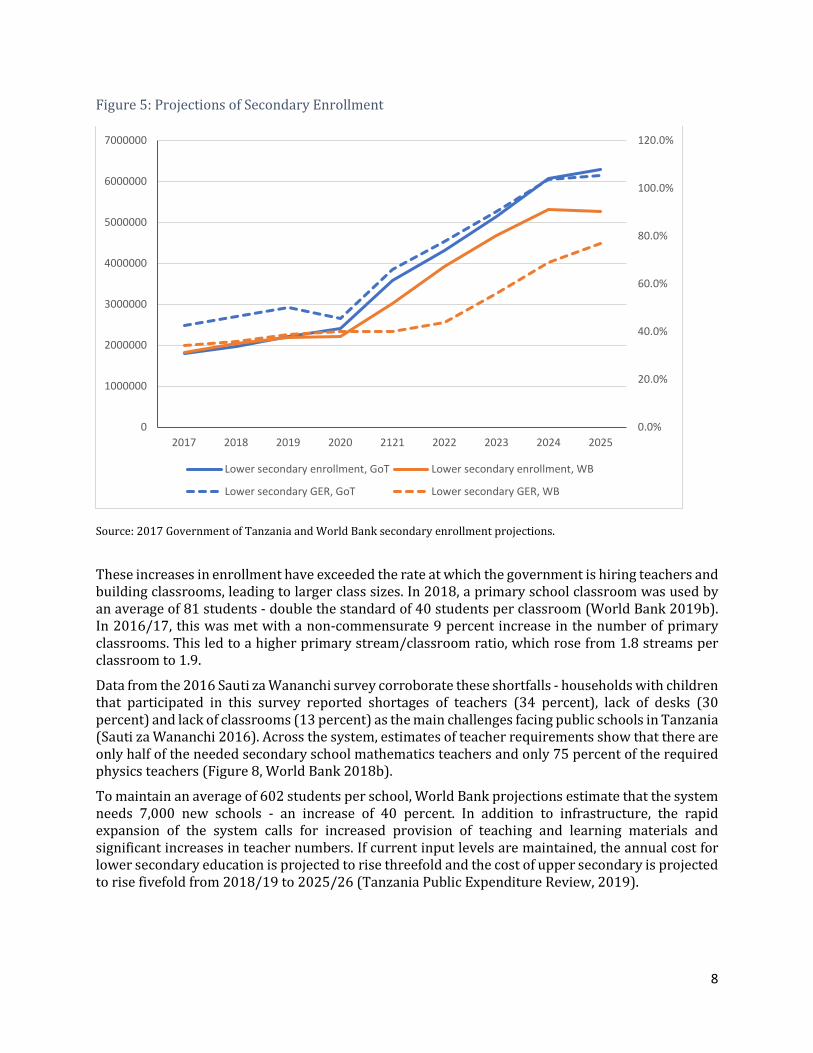
Lower secondary enrollment was at 1.8 million in 2016 (MoEST 2017). Based on the successful rollout of FBEP and related reforms including automatic promotion to secondary, the government projects that lower secondary enrollment will increase to 6.3 million in 2025 (World Bank estimates this to be 5.5 million).3 Upper secondary enrollment is projected to triple between 2018/19 and 2029/30.
3 This equates to a Gross Enrollment Ratio (GER) of 105 percent, up from the current rate of 41 percent, based on National Bureau of Statistics population estimates.
8
Figure 5: Projections of Secondary Enrollment
Source: 2017 Government of Tanzania and World Bank secondary enrollment projections.
These increases in enrollment have exceeded the rate at which the government is hiring teachers and building classrooms, leading to larger class sizes. In 2018, a primary school classroom was used by an average of 81 students - double the standard of 40 students per classroom (World Bank 2019b). In 2016/17, this was met with a non-commensurate 9 percent increase in the number of primary classrooms. This led to a higher primary stream/classroom ratio, which rose from 1.8 streams per classroom to 1.9.
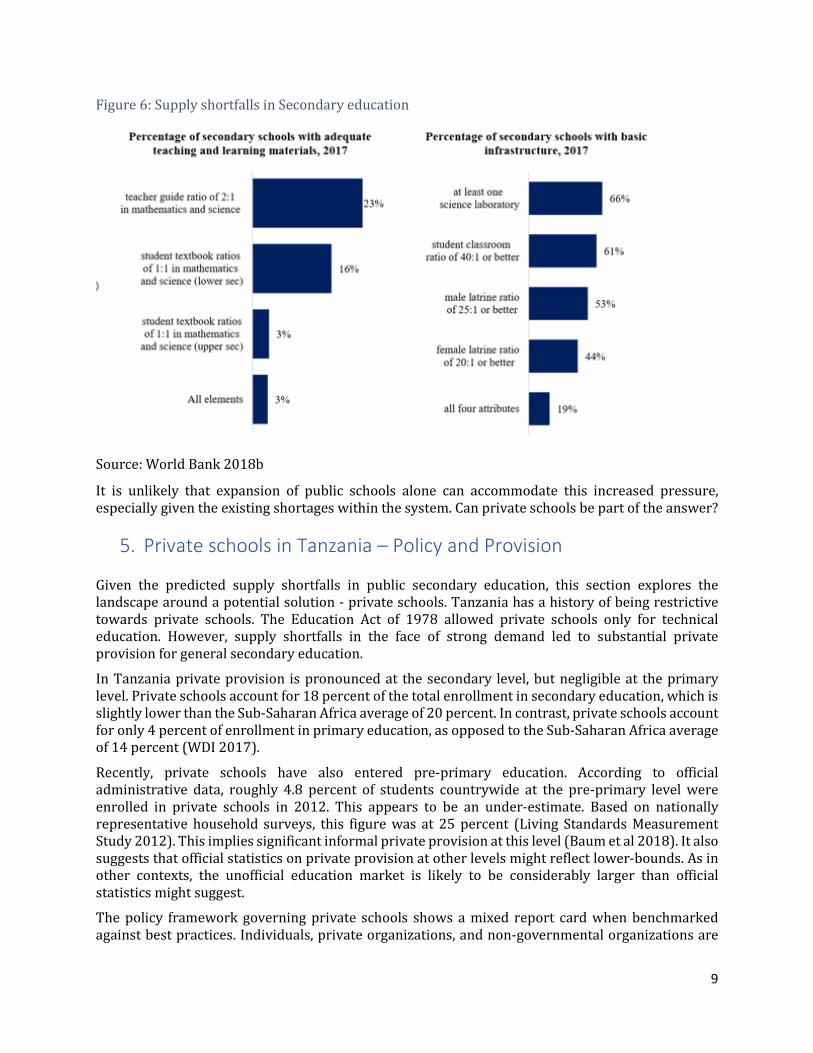
Data from the 2016 Sauti za Wananchi survey corroborate these shortfalls - households with children that participated in this survey reported shortages of teachers (34 percent), lack of desks (30 percent) and lack of classrooms (13 percent) as the main challenges facing public schools in Tanzania (Sauti za Wananchi 2016). Across the system, estimates of teacher requirements show that there are only half of the needed secondary school mathematics teachers and only 75 percent of the required physics teachers (Figure 8, World Bank 2018b).
To maintain an average of 602 students per school, World Bank projections estimate that the system needs 7,000 new schools - an increase of 40 percent. In addition to infrastructure, the rapid expansion of the system calls for increased provision of teaching and learning materials and significant increases in teacher numbers. If current input levels are maintained, the annual cost for lower secondary education is projected to rise threefold and the cost of upper secondary is projected to rise fivefold from 2018/19 to 2025/26 (Tanzania Public Expenditure Review, 2019).
0.0%
20.0%
40.0%
60.0%
80.0%
100.0%
120.0%
0
1000000
2000000
3000000
4000000
5000000
6000000
7000000
2017 2018 2019 2020 2121 2022 2023 2024 2025
Lower secondary enrollment, GoT Lower secondary enrollment, WB
Lower secondary GER, GoT Lower secondary GER, WB
9
Figure 6: Supply shortfalls in Secondary education
Source: World Bank 2018b
It is unlikely that expansion of public schools alone can accommodate this increased pressure, especially given the existing shortages within the system. Can private schools be part of the answer?
5. Private schools in Tanzania – Policy and Provision
Given the predicted supply shortfalls in public secondary education, this section explores the landscape around a potential solution - private schools. Tanzania has a history of being restrictive towards private schools. The Education Act of 1978 allowed private schools only for technical education. However, supply shortfalls in the face of strong demand led to substantial private provision for general secondary education.
In Tanzania private provision is pronounced at the secondary level, but negligible at the primary level. Private schools account for 18 percent of the total enrollment in secondary education, which is slightly lower than the Sub-Saharan Africa average of 20 percent. In contrast, private schools account for only 4 percent of enrollment in primary education, as opposed to the Sub-Saharan Africa average of 14 percent (WDI 2017).
Recently, private schools have also entered pre-primary education. According to official administrative data, roughly 4.8 percent of students countrywide at the pre-primary level were enrolled in private schools in 2012. This appears to be an under-estimate. Based on nationally representative household surveys, this figure was at 25 percent (Living Standards Measurement Study 2012). This implies significant informal private provision at this level (Baum et al 2018). It also suggests that official statistics on private provision at other levels might reflect lower-bounds. As in other contexts, the unofficial education market is likely to be considerably larger than official statistics might suggest.
The policy framework governing private schools shows a mixed report card when benchmarked against best practices. Individuals, private organizations, and non-governmental organizations are
10
legally permitted to own and operate private schools in Tanzania. However, according to the Education Act of 1978 (which has not been amended, to the best of the authors’ knowledge), there are 14 criteria upon which a school can be denied registration. The challenge here is that some of these criteria and minimum requirements are opaque and are open to distortion (World Bank 2014, 2015). For instance, a school can be refused registration if “the premises of the proposed school or the equipment will not allow of effective tuition in the subjects to be taught in the school.” On the other hand, policies governing private schools’ autonomy and quality assurance are well-formulated and enforced through inspections. Also, policy affords private schools moderate levels of autonomy. They can set teacher salaries, deploy and dismiss teachers (subject only to labor laws) but they have to adhere to centralized requirements on teacher qualifications, class sizes, and pedagogy.
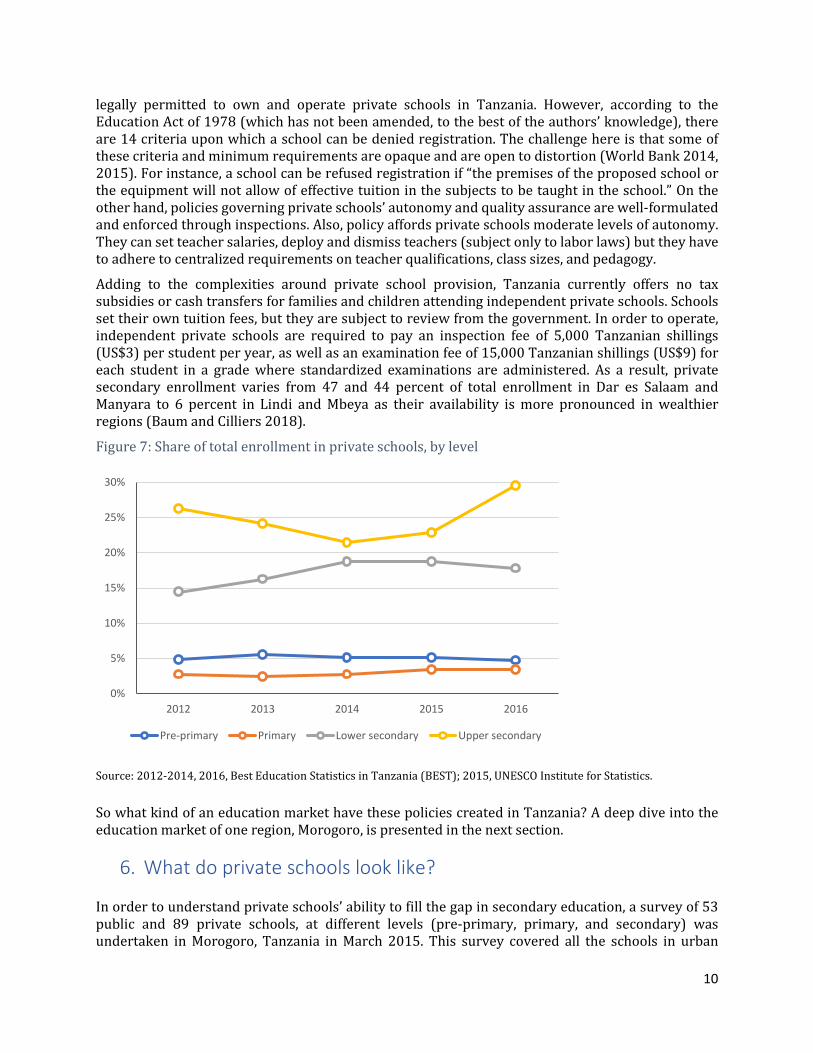
Adding to the complexities around private school provision, Tanzania currently offers no tax subsidies or cash transfers for families and children attending independent private schools. Schools set their own tuition fees, but they are subject to review from the government. In order to operate, independent private schools are required to pay an inspection fee of 5,000 Tanzanian shillings (US$3) per student per year, as well as an examination fee of 15,000 Tanzanian shillings (US$9) for each student in a grade where standardized examinations are administered. As a result, private secondary enrollment varies from 47 and 44 percent of total enrollment in Dar es Salaam and Manyara to 6 percent in Lindi and Mbeya as their availability is more pronounced in wealthier regions (Baum and Cilliers 2018).
Figure 7: Share of total enrollment in private schools, by level
Source: 2012-2014, 2016, Best Education Statistics in Tanzania (BEST); 2015, UNESCO Institute for Statistics. So what kind of an education market have these policies created in Tanzania? A deep dive into the education market of one region, Morogoro, is presented in the next section.
6. What do private schools look like?
In order to understand private schools’ ability to fill the gap in secondary education, a survey of 53 public and 89 private schools, at different levels (pre-primary, primary, and secondary) was undertaken in Morogoro, Tanzania in March 2015. This survey covered all the schools in urban
0%
5%
10%
15%
20%
25%
30%
2012 2013 2014 2015 2016
Pre-primary Primary Lower secondary Upper secondary

11
Morogoro. In this section we summarize some key features of private schools in Morogoro and contrast them with those of public schools. Therefore, unless explicitly mentioned, data for this section come from the 2015 Morogoro data. In some places, these data are supplemented with 2013 IE data (details in Section 2).
Roughly half of the private schools in our sample are owned and managed by a faith-based organization, a third are owned and managed by a private business and the rest fall under the category of community/NGO/Trade Union schools.
Figure 8: Types of private schools in Urban Morogoro
Type of private schools Percentage Faith based/religious organization 54% Private business 38% Community 3% Charity/NGO 3% Trade Union 1%
Source: Authors' calculations using 2015 Morogoro data. Private schools are newer than public schools by an average of 6 years. Nearly 45 percent of public and approximately 61 percent of private schools in the sample were established between 2005-2014.
6.1 Size and Capacity
In the 2015 Morogoro data we find that private schools have significantly higher capacity for additional enrollment at the preprimary/primary level and slightly higher capacity for additional enrollment at the secondary level. Nearly 86 percent of private pre-primary/ primary schools have capacity for additional enrollment, compared to only 27 percent in public schools. At the secondary level, 83 percent of private schools have capacity for additional enrollment, compared to 65 percent in public schools. Around 86 percent of private schools admit every student who wishes to attend their school but only 42 percent of public schools admit every student who applies.
Figure 9: Filled capacity in public and private schools, by level
Primary Private 85% Public 175%
Secondary Private 65% Public 107%
Source: Authors' calculations using 2015 Morogoro data.
Private schools are smaller—the average number of students in public schools is 661 compared with 247 in private schools. Size comparison by education level is provided in Figure 10. On average, private schools have half as many students in these levels as public schools, though the number of students for both public and private schools is widely distributed around the respective means.

12
Figure 10: Average number of students, by level
Source: Authors' calculations using 2015 Morogoro data.
Consequently, average primary and secondary class sizes are significantly smaller in private schools than public schools. Note that both public and private schools are gender-balanced.
Based on national data, in primary grades, private schools are at 70 percent of their student capacity while public schools are currently at 130 percent of capacity (MoEST, 2016). In lower secondary schools, private schools have even greater excess capacity; private schools are only 57 percent filled while public schools are at 107 percent of capacity.
6.2 Teachers
Public school teachers in our 2015 Morogoro data sample have higher levels of education. Among the total teachers in the 142 schools surveyed, 62 percent are public school teachers and 38 percent are private school teachers. Nearly 42 percent of public school teachers have a bachelor’s degree compared to 22 percent of teachers in private schools. This is driven largely by the high number of private pre-primary teachers and high number of public lower secondary teachers in the sample. Looking exclusively at lower secondary schools, the percentage of teachers with a bachelor’s degree is not statistically significant between public and private schools, at 67 and 71 percent, respectively. Also, private schools are significantly more likely to have uncertified teachers. Nearly, 21 percent of the private schools have full time teachers without certification whereas the number is 13 percent for public schools. Accordingly, teacher salaries in private schools are significantly lower, possibly driven by the lower qualifications required for pre-primary teachers.
Based on the 2013 IE data, we find that compared to public schools, teachers are less likely to be absent and more likely to be in class and teaching in private schools. As a part of data collection, schools were visited in February-March 2013 for headteacher and teacher surveys and again in October 2013 for unannounced visits to measure teacher attendance. During unannounced visits, nearly 20 percent of public-school teachers were absent, as compared to only 7 percent of private school teachers. The likelihood of a teacher being in school but out of class was higher in public schools than private schools (41 and 30 percent, respectively). Similarly, the likelihood of a teacher being in class but not teaching was higher in public schools relative to private schools (13 and 6 percent, respectively). All these differences are statistically significant. In addition, when data are disaggregated by level, a public preprimary/primary school is likely to have 30 more students per teacher than a private preprimary/primary school. However, there is no discernable difference between public schools and private schools at the secondary level (Table 2).
856
442
571
327
Public Private Public Private
Primary Secondary

13
On the other hand, teacher turnover rates were significantly higher in private schools. Between February and October, around 17 percent of public school teachers had left the school, while nearly 39 percent of private school teachers had left the school. It is possible that control over teacher dismissals allows private schools to enforce higher effort among teachers than public schools. However, due to this and lower salaries, private schools may suffer from unstable teacher tenures which may influence attrition rates and quality of service delivery.
6.3 Financing
The information presented in this section, which comes from 2015, is likely to be somewhat outdated, as FBEP – which eliminates all school fees for lower secondary public schools – was introduced in 2016. However, it is instructive because it helps contextualize the education market for secondary schools in Tanzania.
Over half (57 percent) of public schools and nearly all private schools in our 2015 Morogoro data charge tuition. Also, private schools charge higher non-tuition fees than their public school counterparts. These fees cover registration/admission, food, transportation, textbooks, and extracurricular activities. Families of students in private schools pay close to 9.5 times more in non-tuition fees at the pre-primary/primary level and 2.1 times more at the secondary level (Table 3). However, based on self-reported data, nearly 65 percent of private schools claim to provide scholarships to marginalized students, compared to 17 percent of public schools. This number stands at 53 percent at the pre-primary/ primary level and 74 percent at the secondary level for private schools.
While private schools do not receive government funding, they appear to be financially sustainable. Nearly, 69 percent of private schools own the land on which the school resides and 71 percent own the school building. Of those which do not own the school building, only 56 percent pay a rent. Only 11 schools reported currently having outstanding debt, credit or loans, and an equal number of private schools reported plans to borrow money in the next year. Based on the 2015 Morogoro data, on average, in both types of schools, outgoing expenses (including registration and approval fees, taxes, recurring expenses) are less than the tuition and non-tuition fees collected.4
FBEP may change the financial sustainability of public school systems and sharpen the divide between public and private schools, as families of students in private schools pay significantly higher tuition and non-tuition fees.
6.4 Student Performance According to 2015 Morogoro data, there is some evidence that private schools fared better on some national examinations. While schools’ self-reported percentages of students sitting the 2014 PSLE and CSEE exams were higher among public schools, the difference was not statistically significant (Table 4). Passing rates of the PSLE and CSEE exams, however, were higher among private schools and significantly higher for the PSLE.
Administrative data provided by the National Examination Council of Tanzania (NECTA) on average PSLE marks and CSEE grade point averages (GPA) from 2013 to 2016 were merged with our 2015 Morogoro data. This merge shows that the average PSLE marks were significantly higher among private schools over all four years. One anomaly is that while overall secondary pass rates are higher for private schools compared to public schools, CSEE GPAs, a measure of secondary school success, were lower among private schools in all years except 2014 (see Table 3 and Figure 11).
4 More details on schooling costs in private and public schools can be found in Baum and Cilliers (2018).

14
More evidence on lower secondary student performance was derived from the 2013 IE data. A total of 12,500 Form III (Grade 9) students were tested in interpedently-created curriculum-based tests on English, Mathematics and Kiswahili (more details in Filmer et. al 2020). On average, student performance was slightly higher in private schools than public schools (most pronounced in English), but the gaps are not statistically significant and were not controlled for student characteristics due to limited data.
Figure 11: Average performance of Public and Private schools in Public Examinations

15
Figure 12: Average performance of Public and Private schools in independently administered tests for Grade 9
Given the negligible differences in student performance between public and private schools and the slightly higher average scores in private schools in independently administered tests, there is a case for private schools to cater to the excess demand created by FBEP. There is potential for a well-designed PPP to absorb the additional students without compromising on their learning outcomes.
32
15
22
19
12
10
7
19
22
27
13
20
16
9
7
5
13
17
0 5 10 15 20 25 30 35
Speaking (out of 46)
Writing (out of 26)
Reading (out of 28)
Arithmetic Operations(out of 39)
Geometry (out of 36)
Algebra (out of 25)
Speaking and Listening (out of 16)
Reading (out of 32)
Grammar, Vocabulary, Usage And Writing…
Kisw
ahili
Mat
hsEn
glish
Average score in different section by type of school in different subjects
Public
Private
52
47
41
68
42
35
32
60
0 10 20 30 40 50 60 70 80
Total
English
Maths
Kiswahili
Average score by type of school in different subjects
Public
Private

16
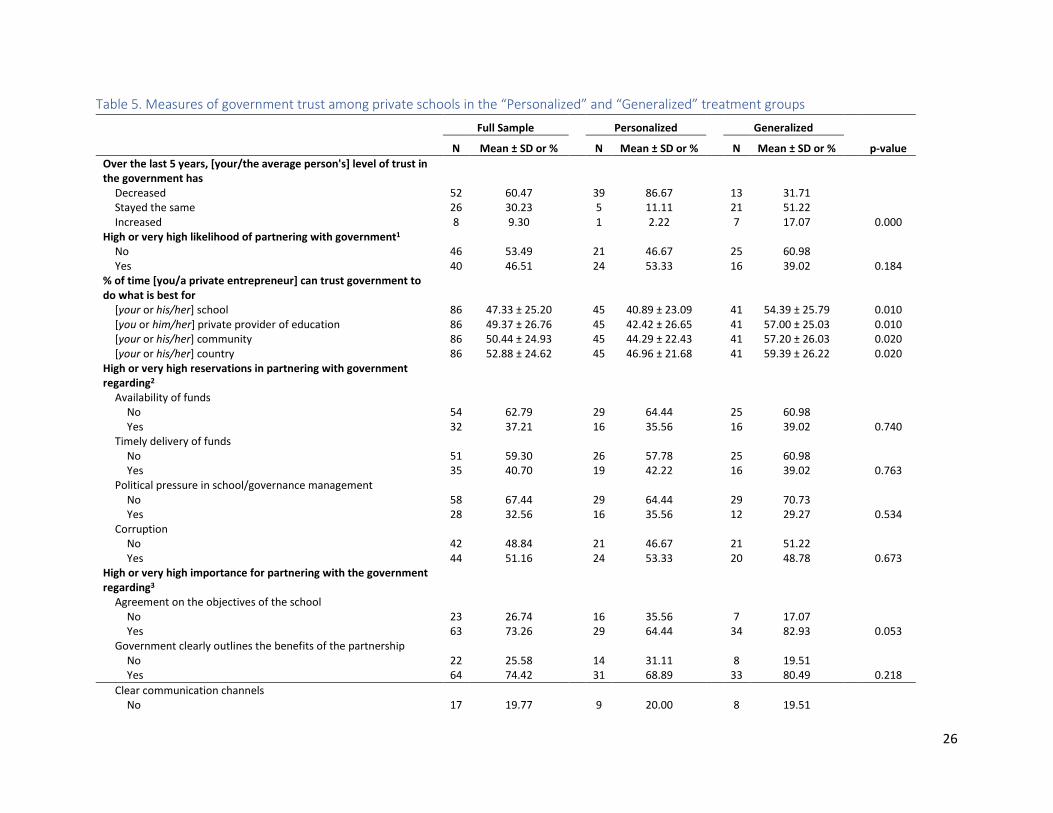
6.5 Do private schools want to partner with the government?
Within existing literature on education PPPs, the private sector’s motivation and reservations for partnering with the government have not received much attention. However, this aspect is critical to the success of these partnerships.
For the 2015 Morogoro school survey, private school providers were asked about potential partnership with the government. We randomize the delivery of these questions to better elicit underlying beliefs. Private schools were randomly selected to be asked in one of two ways: in a direct and personalized way (e.g. what are your views?) or in a generalized way (e.g. what are the average private school owner’s views?). Of the 87 private schools, 46 schools (53 percent) were given personalized questions and 41 schools (47 percent) were given generalized questions.
The personalized group expressed a higher likelihood of partnering with the government over the generalized group by 14 percentage points (53 percent in personalized vs. 39 percent in generalized). On the whole, slightly less than half (47 percent) of the private school owners who were interviewed were willing to partner with the government. Corruption was the most cited issue that would threaten the likelihood of a partnership, with 51 percent of all respondents reporting it as a major concern. Among the issues of most importance for a partnership, private school owners rated clear communication channels and clarity of accountability as the most important criteria for partnership.
7. Parental Demand
In 2017, as part of its annual Sauti za Wananchi survey, TWAWEZA collected information on households’ beliefs and attitudes towards the schooling of their children from a broad cross-section of Tanzanian households through mobile phone surveys. Of the 1,396 households surveyed which had at least one child in school, the vast majority (95 percent) had at least one child in a public school and 87 percent of households had at least one child in primary school. With a majority of households sending their children to public primary schools, these data provide limited evidence on the broad question of private schools for basic education and are not disaggregated by public and private school children. However, even limited insights on parental views are likely to build our understanding, regardless of school type. This section dissects these data to better understand parents’ beliefs and decision-making processes.
We find that households place a high priority on teacher readiness and raising educational standards, above potential financial benefits to the household. For example, when asked which government program would be preferred if implemented at the same cost, households preferred a teacher support and training program over a free school uniform program by nearly seven to one. By a similar ratio, households agreed or strongly agreed with the phrase, “It is better to raise educational standards, even if we have to pay school fees” over “It is better to have a free schooling for our children, even if the quality of education is low.” Responses were similar irrespective of whether the household had a child in public or private school, or children in both.
For households which had at least one child in primary school, parents were asked various questions regarding their involvement in their child’s schooling and attributes of schools that most influence their choice of secondary school. Roughly half of households with a child in primary school visit the child’s school or meet with the child’s teacher once or twice a year, while it is much rarer for a household to meet with the school’s management this frequently. Households believe that parents are more responsible than teachers for student performance, by 8.6 percentage points. When asked to name the two most important attributes of schools that influence their choice of secondary school, households chose motivated teachers and CSEE pass rates, highlighting the prioritization of teacher quality and academic success among households. The third most prioritized attribute was the ability

17
for the child to still live in the village while attending school. Somewhat surprisingly, low school fees was the least important attribute chosen by households.
Figure 13: Most important attributes for choice of secondary school among parents
Source: Authors' calculations using 2017 SMS data from the Sauti za Wananchi survey. Using the SMS survey, the sample was disaggregated into two groups - households who would keep their child in a public school (41 percent) and those who would switch to a private school (39 percent), if both types of schools were free.
8. Conclusion Using information from different data sources, we conducted a systems-level analysis to understand the impact of the FBEP on the secondary public school system and the capacity of private schools to absorb increases in enrollments.
We find that the implementation of free basic education will likely result in dramatic increases in enrollments in secondary education (both lower and upper). This will put the already over-stretched public education system under greater pressure. The Government of Tanzania estimates that lower secondary enrollment alone would grow by 250 percent over the next eight years. The school system is unlikely to be in a position to absorb these enrollment increases, at least in the short term, without significantly compromising on quality.
How can Tanzania best ensure that secondary education is available to all? Can private schools contribute to this goal? While Tanzania has a significant supply gap in secondary schooling, which is likely to worsen, we find some enabling conditions for potential public-private partnerships. Based on data from the Morogoro region, we find that private schools have significant excess capacity at the primary and secondary levels. Private schools are at 70 percent of their student capacity while public schools are currently at 130 percent of their intended capacity. Private schools are, on average,
18
newer, have smaller class sizes and better teacher attendance than public schools. On average, student performance in public and private schools tends to be comparable. In Morogoro, most private schools are financially stable but nearly half express willingness to partner with the government. As such, in the short term, there is space to expand enrollment through partnerships with these schools at relatively little cost. At the national level, estimates suggest that increasing the share of lower secondary enrollment that is under public-private partnerships would reduce the annual cost of lower secondary significantly (World Bank 2019b).
In 2015, families of students in private schools paid close to 9.5 times more in non-tuition fees at the pre-primary/primary level and 2.1 times more at the secondary level. These differences are likely to be exacerbated with the introduction of FBEP. However, parents are willing to pay for basic education if they are guaranteed better quality. Consequently, unless PPPs are explicitly designed to ensure access to quality basic education for disadvantaged students, existing inequalities may widen.
On the whole, Tanzania is likely to face significant supply shortfalls in basic education. At the same time, detailed micro-data from one region (Morogoro) show that private schools have the capacity, service delivery, parental demand, and willingness to partner with the government on basic education service delivery. This suggests several entry points to explore welfare-enhancing public-private partnerships in Tanzania’s secondary education.

19
References Alderman, Harold, Peter F. Orazem, and Elizabeth M. Paterno. 2001. “School Quality, School Cost, and the Public/Private School Choices of Low-Income Households in Pakistan.” The Journal of Human Resources, 36(2): 304-326. http://dx.doi.org/10.2307/3069661
Al-Samarrai, Samer, and Marie Evane Tamagnan. 2019. ‘Gender Equity and Fee-Free Basic Education in Tanzania’. Mimeo. World Bank.
Andrabi, Tahir, Jishnu Das, and Asim Ijaz Khwaja. 2008. “A Dime a Day: The Possibilities and Limits of Private Schooling in Pakistan.” Comparative Education Review 52(3): 329–55
Baum, Donald R. and Jacobus Cilliers. 2018. “Private Schools Vouchers for Expanding Secondary School Access? The Case of Tanzania.” International Journal of Educational Management, (just accepted).
Baum, Donald R., Rachel Cooper, and Oni Lusk-Stover. 2018. “Regulating market entry of low-cost private schools in Sub-Saharan Africa: Towards a theory of private education regulation.” International Journal of Educational Development 60: 100-112. https://doi.org/10.1016/j.ijedudev.2017.10.020
Filmer, Deon, James Habyarimana, and Shwetlena Sabarwal. 2020. “Teacher Performance-Based Incentives and Learning Inequality” Working Paper. Washington, DC: World Bank.
Freitag, Markus and Richard Traunmüller. 2009. “Spheres of Trust: An Empirical Analysis of the Foundations of Particularised and Generalised Trust.” European Journal of Political Research, 48(6): 782-803. https://doi.org/10.1111/j.1475-6765.2009.00849.x
Government of Tanzania and International Institute for Educational Planning. 2011. Tanzania: Education Sector Analysis: Beyond Primary Education, the Quest for Balanced and Efficient Policy Choices for Human Development and Economic Growth. Dakar: UNESCO, Dakar Office, Pōle de Dakar.
Heyneman, Stephen P., and Jonathan M. B. Stern. 2013. “Low-cost Private Schools for the Poor: What Public Policy is Appropriate.” International Journal of Educational Development, 35: 3-15. https://doi.org/10.1016/j.ijedudev.2013.01.002
Hoogeveen, Johannes and R. Ruhinduka. 2009. “Poverty Reduction in Tanzania since 2001: Good Intentions, Few Results.” Paper prepared for the Research and Analysis Working Group of the MKUKUTA Monitoring System. Dar es Salaam: Ministry of Finance and Economic Affairs.
Hoogeveen, Johannes, and Mariacristina Rossi. 2013. “Enrollment and Grade Attainment Following the Introduction of Free Primary Education in Tanzania.” Journal of African Economies, 22(3): 375-393. https://doi.org/10.1093/jae/ejt003
Joshi, Arun R., and Isis Gaddis. (Eds.). 2015. “Preparing the Next Generation in Tanzania: Challenges and Opportunities in Education.” Washington, DC: World Bank. https://doi.org/10.1596/978-1-4648-0590-5
Kingdon, Geeta Gandhi. 2007. “The Progress of School Education in India.” Oxford Review of Economic Policy, 23(2): 168-195. https://doi.org/10.1093/oxrep/grm015

20
Kosec, Katrina. 2014. “Relying on the Private Sector: The Income Distribution and Public Investments in the Poor.” Journal of Development Economics 107 (March): 320–42.
Lassibille, Gérard, Jee-Peng Tan, and Suleman Sumra. 2000. “Expansion of Private Secondary Education: Lessons from Recent Experience in Tanzania.” Comparative Education Review, 44 (1): 1-28. https://www.jstor.org/stable/1189224
Oketch, Moses, Maurice Mutisya, Moses Ngware, and Alex C. Ezeh. 2010. “Why Are There Proportionately More Poor Pupils Enrolled in Non-state Schools in Urban Kenya in Spite of FPE Policy?” International Journal of Educational Development 30 (1): 23–32.
Ministry of Education, Science and Technology (MoEST), United Republic of Tanzania. 2005. “National Basic Education Statistics in Tanzania (BEST). 1995-2005 National Data.”
Ministry of Education, Science and Technology (MoEST), United Republic of Tanzania. 2016. “National Basic Education Statistics in Tanzania (BEST). 2012-2016 National Data.”
Patrinos Harry, Osoio-Felipe & Guaqueta Juliana, "The role and impact of public-private partnerships in education" World Bank, 2009
Phillipson, Bob. (Ed.). 2008. “Low-cost Private Education: Impacts on Achieving Universal Primary Education.” London, UK: Commonwealth Secretariat.
Sakellariou, Chris. 2017. “Private or Public School Advantage? Evidence from 40 Countries Using PISA 2012– Mathematics.” Applied Economics 49 (29): 2875–92.
Sandström, F. Mikael, and Fredrik Bergström. 2005. “School Vouchers in Practice: Competition Will Not Hurt You.” Journal of Public Economics 89 (2–3): 351–80.
Sturgis, Patrick and Patten Smith. 2010. “Assessing the Validity of Generalized Trust Questions: What Kind of Trust are we Measuring?” International Journal of Public Opinion Research, 22(1): 74-92. https://doi.org/10.1093/ijpor/edq003
Tabarrok, Alexander. 2013. “Private Education in India: A Novel Test of Cream Skimming.” Contemporary Economic Policy, 31(1): 1-12. https://doi.org/10.1111/j.1465-7287.2011.00286.x
Taylor, R. J. 2003. “Contracting for Health Services.” In Private Participation in Health Services Handbook, eds. A. Harding and A. Preker, 195–204. Washington, DC: World Bank
Tooley, James. 2005. “Private Schools for the Poor: Education Where No One Expects It.” Education Next 5 (4): 11.
Tooley, James and Pauline Dixon. 2005. “Private Education is Good for the Poor: A Study of Private Schools Serving the Poor in Low-income Countries.” Washington, DC: Cato Institute.
Tooley, James and Pauline Dixon. 2007. “’De facto’ Privatisation of Education and the Poor: Implications of a Study from Sub-Saharan Africa and India.” Compare: A Journal of Comparative and International Education, 36(4): 443-462. https://doi.org/10.1080/03057920601024891
URT (United Republic of Tanzania). 2007. Household Budget Survey. Dar es Salaam, Tanzania: National Bureau of Statistics.

21
Uwezo. 2017. “Are Our Children Learning? Uwezo Tanzania Sixth Learning Assessment Report.” Dar es Salaam: Twaweza East Africa.
World Bank, 2014. Tanzania: Engaging the private sector, Country Report: Systems Approach for Better Education Results. Washington, D.C.
World Bank. 2018a. “World Development Report 2018: Learning to Realize Education’s Promise.” Washington, DC: World Bank. https://openknowledge.worldbank.org/handle/10986/28340
World Bank. 2018b. Program appraisal document: Secondary Education Quality Improvement Program. Washington, D.C.
World Bank. 2019a. “Education Financing in Tanzania: Update” Mimeo. Washington, DC.
World Bank. 2019b. ‘Tanzania Public Expenditure Review FY19: Are Resources and Policies Aligned?” Washington DC: World Bank.

22
Table 1. Public and private school characteristics Full Sample Public Private N Mean ± SD or % N Mean ± SD or % N Mean ± SD or % p-value Age of school 139 13.6 ± 13.7 53 17.4 ± 17.5 86 11.3 ± 10.2 0.011 School levels taught
Pre-primary only 39 27.9 1 1.9 38 43.2 Primary only 6 4.3 4 7.7 2 2.3 Lower secondary only 46 32.9 29 55.8 17 19.3 Upper secondary only 1 0.7 0 0.0 1 1.1 Pre-primary and primary 41 29.3 16 30.8 25 28.4 Lower and upper secondary 7 5.0 2 3.9 5 5.7 0.000
Students Number of students 141 402.5 ± 387.7 53 661.0 ± 433.0 88 246.7 ± 253.9 0.000 Maximum capacity of students 136 413.4 ± 313.5 51 542.8 ± 294.6 85 335.8 ± 300.0 0.000 % of capacity filled 136 92.69 ± 61.76 51 130.20 ± 80.73 85 70.18 ± 29.73 0.000 % female students 139 50.64 ± 15.40 53 51.71 ± 9.36 86 49.98 ± 18.17 0.524
Number of teachers Full-time teachers w/ certification 142 21.3 ± 21.3 53 37.6 ± 24.1 89 11.6 ± 11.4 0.000 Full-time teachers 142 21.7 ± 21.2 53 37.8 ± 24.1 89 12.2 ± 11.5 0.000
Classes Avg. primary student class size 47 539.3 ± 396.0 20 812.8 ± 441.7 27 336.7 ± 186.3 0.000 Avg. secondary student class size 53 436.1 ± 315.8 31 539.1 ± 353.0 22 290.9 ± 176.6 0.004 Pupil-teacher ratio 137 20.1 ± 11.2 50 18.7 ± 10.9 87 20.9 ± 11.3 0.258 No 42 30.2 30 57.7 12 13.8 Yes 97 69.8 22 42.3 75 86.2 0.000
Student entrance exam required No 77 55.4 38 73.1 39 44.8 Yes 62 44.6 14 26.9 48 55.2 0.001
Student/parent interviews required No 69 49.6 32 61.5 37 42.5 Yes 70 50.4 20 38.5 50 57.5 0.030
Lacking textbooks No 61 43.88 11 21.15 50 57.47 Yes 78 56.12 41 78.85 37 42.53 0.000
Note: Significant differences between public and private schools tested by a two-sided t-test for continuous variables and χ2 for categorical variables.

23
Table 2: Pupil-teacher ratios
Public Private N Mean ± SD or % N Mean ± SD or % p-value Pre-primary 17 40.58±6.59 63 18.11±1.29 0 Primary 20 69.34±40.57 27 22.06±1.67 0.1815 Lower secondary 30 11.35±0.8 22 18.8±3.84 0.034 Upper secondary 2 6.74±3.66 5 9.68±3.09 0.6169

24
Table 3. School fees paid and collected
Full Sample Public Private N Mean ± SD or % N Mean ± SD or % N Mean ± SD or % p-value Tuition fees required
No 24 17.14 23 43.40 1 1.15 Yes 116 82.86 30 56.60 86 98.85 0.000
Scholarships offered No 55 47.41 25 83.33 30 34.88 Yes 61 52.59 5 16.67 56 65.12 0.000
Receives non-government funding No 120 86.33 45 86.54 75 86.21 Yes 19 13.67 7 13.46 12 13.79 0.956
Yearly school fees paid (TSh)1 Registration/approval fees 81 6.32 ± 13.95 0 81 6.32 ± 13.95 Taxes 81 18.32 ± 60.99 0 81 18.32 ± 60.99 Recurring expenses 135 10,640.03 ± 118,744.06 52 71.50 ± 99.58 83 17,261.28 ± 151,414.99 0.415 Scholarships 110 1,063.80 ± 10,307.24 30 0.04 ± 0.16 80 1,462.71 ± 12,082.73 0.510
Yearly school fees collected (TSh)1 Tuition 139 27,104.87 ± 297,634.90 53 89.57 ± 165.03 86 43,753.83 ± 378,268.83 0.403 Non-tuition 137 9,076.69 ± 98,605.41 52 251.19 ± 544.23 85 14,475.83 ± 125,156.50 0.415
Note: Significant differences between public and private schools tested by a two-sided t-test for continuous variables and χ2 for categorical variables. 1 In 100,000 TSh.

25
Table 4. PSLE and CSEE exam participation and passing rates
Full Sample Public Private N Mean ± SD or % N Mean ± SD or % N Mean ± SD or % p-value Primary School Leaving Exam (PSLE)
% of students sitting the exam last year1 39 86.46 ± 28.49 19 91.05 ± 20.69 20 82.10 ± 34.31 0.333 % of students passing the exam last year1 39 78.14 ± 28.40 19 72.39 ± 23.56 20 83.60 ± 31.97 0.222 Average PSLE marks (out of 250)2
2013 30 138.45 ± 29.29 16 116.73 ± 19.48 14 163.28 ± 15.20 0.000 2014 35 137.30 ± 26.62 17 116.41 ± 14.65 18 157.03 ± 19.16 0.000 2015 39 147.51 ± 33.18 18 121.01 ± 24.42 21 170.22 ± 20.29 0.000 2016 42 152.81 ± 35.40 18 119.98 ± 18.76 24 177.44 ± 22.30 0.000
Certificate of Secondary Education Examination (CSEE) % of students sitting the CSEE last year1 51 91.10 ± 23.36 30 92.27 ± 22.05 21 89.43 ± 25.58 0.674 % of students passing the CSEE last year1 51 69.18 ± 24.02 30 61.63 ± 20.70 21 79.95 ± 24.78 0.006 Average CSEE GPA2
2013 41 4.88 ± 0.86 28 5.31 ± 0.24 13 3.94 ± 0.97 0.000 2014 43 1.56 ± 0.75 28 1.19 ± 0.23 15 2.27 ± 0.88 0.000 2015 43 4.00 ± 0.76 28 4.45 ± 0.20 15 3.16 ± 0.71 0.000 2016 44 3.98 ± 0.71 28 4.41 ± 0.18 16 3.24 ± 0.67 0.000
Note: Significant differences between public and private schools tested by a two-sided t-test for continuous variables and χ2 for categorical variables. 1 As reported by respondents in the 2015 Morogoro school census. 2 Administrative data provided by the National Examination Council of Tanzania (NECTA).
26
Table 5. Measures of government trust among private schools in the “Personalized” and “Generalized” treatment groups
Full Sample Personalized Generalized N Mean ± SD or % N Mean ± SD or % N Mean ± SD or % p-value
Over the last 5 years, [your/the average person's] level of trust in the government has
Decreased 52 60.47 39 86.67 13 31.71 Stayed the same 26 30.23 5 11.11 21 51.22 Increased 8 9.30 1 2.22 7 17.07 0.000
High or very high likelihood of partnering with government1 No 46 53.49 21 46.67 25 60.98 Yes 40 46.51 24 53.33 16 39.02 0.184
% of time [you/a private entrepreneur] can trust government to do what is best for
[your or his/her] school 86 47.33 ± 25.20 45 40.89 ± 23.09 41 54.39 ± 25.79 0.010 [you or him/her] private provider of education 86 49.37 ± 26.76 45 42.42 ± 26.65 41 57.00 ± 25.03 0.010 [your or his/her] community 86 50.44 ± 24.93 45 44.29 ± 22.43 41 57.20 ± 26.03 0.020 [your or his/her] country 86 52.88 ± 24.62 45 46.96 ± 21.68 41 59.39 ± 26.22 0.020
High or very high reservations in partnering with government regarding2
Availability of funds No 54 62.79 29 64.44 25 60.98 Yes 32 37.21 16 35.56 16 39.02 0.740
Timely delivery of funds No 51 59.30 26 57.78 25 60.98 Yes 35 40.70 19 42.22 16 39.02 0.763
Political pressure in school/governance management No 58 67.44 29 64.44 29 70.73 Yes 28 32.56 16 35.56 12 29.27 0.534
Corruption No 42 48.84 21 46.67 21 51.22 Yes 44 51.16 24 53.33 20 48.78 0.673
High or very high importance for partnering with the government regarding3
Agreement on the objectives of the school No 23 26.74 16 35.56 7 17.07 Yes 63 73.26 29 64.44 34 82.93 0.053
Government clearly outlines the benefits of the partnership No 22 25.58 14 31.11 8 19.51 Yes 64 74.42 31 68.89 33 80.49 0.218
Clear communication channels No 17 19.77 9 20.00 8 19.51

27
Full Sample Personalized Generalized N Mean ± SD or % N Mean ± SD or % N Mean ± SD or % p-value
Yes 69 80.23 36 80.00 33 80.49 0.955 Clarity of accountability criteria
No 13 15.12 8 17.78 5 12.20 Yes 73 84.88 37 82.22 36 87.80 0.470
Informed of the delivery of funds No 21 24.42 15 33.33 6 14.63 Yes 65 75.58 30 66.67 35 85.37 0.044
Agree or strongly agree to the following: [I/education entrepreneurs] Better off running private school than PPP school
No 78 90.70 42 93.33 36 87.80 Yes 8 9.30 3 6.67 5 12.20 0.378
[I/education entrepreneurs] Not aware of PPP opportunities No 66 76.74 32 71.11 34 82.93 Yes 20 23.26 13 28.89 7 17.07 0.195
[I/education entrepreneurs] Eager to build PPP to expand school No 65 75.58 31 68.89 34 82.93 Yes 21 24.42 14 31.11 7 17.07 0.130
Public financing for [my/private] schools will have a large impact on student learning
No 76 88.37 39 86.67 37 90.24 Yes 10 11.63 6 13.33 4 9.76 0.605
[My/private] schools are better than the average public school in [my/the same] community
No 79 91.86 41 91.11 38 92.68 Yes 7 8.14 4 8.89 3 7.32 0.790
In PPPs, [my/the] public sector is likely to have a political agenda No 66 76.74 39 86.67 27 65.85 Yes 20 23.26 6 13.33 14 34.15 0.022
Note: Significant differences between the “Personalized” and “Generalized” treatment groups tested by a two-sided t-test for continuous variables and χ2 for categorical variables. 1 Personalized questionnaire asks respondents "your" likelihood while the generalized questionnaire asks "a private entrepreneur's" likelihood. 2 Personalized questionnaire asks respondents to rate their own reservations "as an education entrepreneur" while the generalized questionnaire asks reservations "for an average education entrepreneur." 3 Personalized questionnaire asks respondents to rate their own importance "as an education entrepreneur" while the generalized questionnaire asks importance "for an education entrepreneur."