low cost carriers and the changing fortunes of airports in...
TRANSCRIPT

WestminsterResearchhttp://www.westminster.ac.uk/westminsterresearch
Low cost carriers and the changing fortunes of airports in the UK
Halpern, N., Graham, A. and Dennis, N.
NOTICE: this is the authors’ version of a work that was accepted for publication in
Research in Transportation Business and Management. Changes resulting from the
publishing process, such as peer review, editing, corrections, structural formatting, and
other quality control mechanisms may not be reflected in this document. Changes may
have been made to this work since it was submitted for publication. A definitive version
was subsequently published in Research in Transportation Business and Management,
Available online 25 May 2016, DOI 10.1016/j.rtbm.2016.05.002.
Research in Transportation Business and Management is available online at:
https://dx.doi.org/10.1016/j.rtbm.2016.05.002
© 2016. This manuscript version is made available under the CC-BY-NC-ND 4.0 license
http://creativecommons.org/licenses/by-nc-nd/4.0/
The WestminsterResearch online digital archive at the University of Westminster aims to make the
research output of the University available to a wider audience. Copyright and Moral Rights remain
with the authors and/or copyright owners.
Whilst further distribution of specific materials from within this archive is forbidden, you may freely
distribute the URL of WestminsterResearch: ((http://westminsterresearch.wmin.ac.uk/).
In case of abuse or copyright appearing without permission e-mail [email protected]

1
Low cost carriers and the changing fortunes of airports in the UK
Abstract
This paper investigates how low cost carrier (LCC) developments have affected the traffic and financial performance of UK airports from 2002 to 2014. Considerable growth in traffic was experienced from 2002 to 2007, especially at regional airports as a result of LCC expansion. This was replaced with a more volatile period from 2008 to 2014 where many of the regional airports that experienced the greatest increases in traffic during the early years, then experienced the largest reductions. This has clearly had an impact on their financial well-being, resulting in reduced profits for many airports. It has also meant that many regional airports that seemed like attractive investments as a result of LCC expansion are now less financially appealing, especially given that the LCC sector in the UK appears to be shifting capacity to larger regional airports, and in some cases, London airports.
Key terms: Low cost carriers, UK airports, traffic trends, financial performance.
1. Introduction
The UK was one of the first European countries to experience substantial growth of low cost carrier (LCC) services due to the rapid expansion of easyJet and Ryanair in the late 1990s. This had major consequences for UK airports, especially those serving the regions, which were able to exploit the opportunities provided by these new airlines and significantly grow their traffic. However, the boom period has been replaced with a more challenging situation in recent years that has been brought about by the maturing of the LCC sector in combination with more volatile economic times. In addition, the LCC business model continues to evolve with evidence, for instance, of a greater use of larger and more centrally located airports, a larger unit fleet size, and a longer average sector length.
The aim of this paper is to assess how LCC developments have affected airports in the UK, especially those serving the regions. In particular, the paper investigates how LCC operations have affected airport traffic and financial performance. The paper is therefore written from an airport rather than an airline perspective. Strong and weak performing airports are identified and implications for the future are considered. The findings are based on an analysis of airport schedules and financial data from 2002 to 2014
In terms of the structure of this paper, Section 2 provides the context with a literature review that looks in general at the development of the LCC sector including the relationship with airports, and then links this to previous research related to the UK. The literature review also leads to the formulation of two key research questions. This is followed in Section 3 by a discussion of the methodological approach and data sources that have been used. The results are presented and discussed in Section 4. Section 5 provides a conclusion including implications of the findings for future managerial practice.
2. Literature Review
2.1. Development of the LCC sector
Increased liberalisation of air transport markets and the subsequent development of LCCs has been well documented (e.g. Gudmundsson, 1998; Lawton, 2002). Typical features of the

2
original LCC business model included a high seating density and single class of service, no free in-flight food/drink or other frills, use of a single aircraft type, direct selling via the internet, high aircraft and crew utilisation, and point-to-point short/medium-haul routes. This created much discussion regarding how legacy or network carriers were reacting to LCCs (Dennis 2007; Franke, 2004; Windle and Dresner, 1999), including the setting up of their own subsidiaries or ‘airlines within airlines’ (Gillen and Gados, 2008; Morrell, 2008) and the role of leisure carriers in serving tourism demand (Beiger and Wittmer, 2006; Williams, 2011).
In spite of a large failure rate, as high as 77 per cent in Europe (Budd et al., 2014), the LCC sector has continued to grow rapidly and be of considerable interest to researchers (e.g. Budd and Ison 2014; Gross and Luck, 2013). However, as the sector has evolved and matured, more types of LCCs have emerged (Dobruszkes, 2013), and the distinctiveness between LCCs and both mainline and leisure business models has become increasingly blurred. Notable changes witnessed within the LCC industry include more focus on attracting business travellers (by providing more flexibility in terms of ticket sales and priority boarding), engagement in code sharing and membership of alliances, and the addition of ‘frills’ such as seat allocation (Aviation Strategy, 2014; de Wit and Zuidberg, 2012; Klophaus et al., 2012). Moreover, there has also been considerable discussion about the viability of long-haul operations, particularly with more efficient longer range aircraft such as the Boeing 787 Dreamliner (Daft and Albers, 2012; Morrell, 2008; Poret et al., 2015).
Another key characteristic of the original LCC model, which made it stand out from the other existing models, was the use of secondary airports as substitutes for primary airports in the same area (Barbot, 2006; Barrett, 2004a; Zhang 2008). De Neufville (2008) identified around 30 such secondary airports worldwide, including a few ex-military airports, and noted that around half of these had previously been underutilised. Moreover, as well as using secondary airports, LCCs moved into regional airports, again many underutilised, and often some distance from main population centres. Such LCCs were able to stimulate new demand from a much wider region, primarily by offering significantly lower fares (Dennis, 2007; Pantazis and Liefner, 2006). As a result there were some routes that appeared to serve ‘nowhere’ at least at one or both airports on the route (Barrett, 2004b).
The choice of airport was chosen to fit in with the LCC operating model and in particular to allow LCCs to reduce costs and exploit density economies through high utilisation of aircraft with quick turnaround times and lack of congestion (Pitt and Brown, 2001). Another important requirement was low aeronautical charges and other user costs (Francis et al., 2003), or at least flexibility in negotiating airport charges deals, especially if in competition with other airports (Barrett, 2004a; Gillen and Lall, 2004). Mason and Morrison (2008) constructed an ‘attractiveness of airport’ index as a key element of the LCC model and this included four factors (airport cost, airport size, number of competing airlines and monopoly routes) whilst by contrast through asking eight European LCCs themselves Warnock-Smith and Potter (2005) found the four most important factors to be the demand/catchment area, convenient slot times, quick turnaround facilities and aeronautical charges. Whilst it is certainly true that there were many services that developed from regional and secondary airports in the initial stages of the evolution of the LCC sector, in reality the situation was more complex than this. For example, Dobruszkes (2006) identified five different types of European airports used by LCCs, namely medium or large traditional airports; secondary urban airports of large cities; regional airports serving a large city fairly

3
close; remotely located regional airports with access to leisure tours or tourist areas; and traditional airports of beach tourism - in further research he confirmed that a range of different types of airports were used (Dobruszkes, 2013). Moreover, in recent years there has been a drift away from the use of secondary airports and indeed in a study of 20 European LCCs, Klophaus et al. (2012) only found three airlines that used predominantly secondary airports. One of the major trends has been LCCs moving into primary airports for a number of reasons including a more convenient location, which will be more attractive to business markets and provide an opportunity for flight connections, at the same time as limits to growth for secondary airports due to market maturity (de Wit, 2012; Fageda et al., 2015). At primary airports the LCCs may also be able to offer a pricing premium, compete head-on with network carriers or feed/code-share their services. Moreover, the average aircraft size of LCCs appears to be increasing and so more centrally located primary airports rather than more remote secondary or regional airports are now needed to ensure that there is enough demand to fill the aircraft.
One of the other consequences of aviation liberalisation and the subsequent evolution of the LCC sector, is that the airline environment has become more dynamic with a high degree of switching and churn (de Wit and Zindberg, 2016). This has encouraged greater competition between airports, particularly in Europe where pan-European airlines have emerged (Thelle et al., 2012). At the same time there has been privatisation of some airports, and corporatisation of many others, which has led to a more commercially focused airport industry. Offering airport charging discounts as well as other incentives to encourage LCCs (and other airlines) has become commonplace (ACI-Europe, 2015; Jones et al., 2013; Malina et al., 2012). Such incentives may make sense because of the high fixed airport costs and low marginal airport cost of attracting additional services but do not guarantee long-term sustainability. A more stable environment can be created by having long-term contracts between airlines and airports, which Bush and Starkie (2014) have contended is the way forward.
Arguably airport operators can off-set reductions in aeronautical revenues with higher non-aeronautical or commercial revenues. Graham and Dennis (2007) noted that LCC passengers are not necessarily budget spenders on commercial facilities – a view supported by Njoya and Niemeier (2011). However, whilst Francis et al. (2003) and Gillen and Lall (2004) found that LCCs did favourably contribute to non-aeronautical revenues, Castillo-Manzano (2010) observed the opposite. Given this situation, it seems likely that the presence of LCCs could have a major impact on airport financial performance and efficiency, but this has been scantly explored in the literature. Two rare examples include Choo and Oum (2013) who found that efficiency at US airports decreased when there was a low level of LCC presence but increased when LCC services became dominant. For Spanish airports, Coto-Millan et al. (2014) found that LCC traffic had a positive impact on efficiency although this was solely due to scale efficiency produced by the significant increase in LCC traffic.
2.2 The UK situation and the focus of this paper
As mentioned in the introduction to this paper, the UK was one of the first European countries to witness LCC growth, and has been at the forefront of some of the general developments which have been discussed in Section 2.1. The impact of early stages of this development on airport traffic performance has been well documented from a UK perspective (CAA, 2006) and from a UK regional airport perspective (CAA, 2005; 2007). However, there is an absence of more recent detailed analysis that has followed the evolution of this sector. Clearly of relevance here must be the fact that the early stages of LCC expansion in the UK
4
coincided with the UK airport industry as a whole adopting a more commercial management outlook (Ison et al., 2011).
As regards research on LCC developments and airport financial performance, whilst there has been some coverage of the UK situation, the results are not up-to-date, nor totally comparable because of different time periods and samples. Graham and Dennis (2007) found no apparent link between LCC operations and profitability, whilst Lei and Pagliari (2013) observed that most airports dominated by LCCs experienced below average growth in operating profit. As regards cost, Graham and Dennis (2007) found lower unit costs for LCC dominated UK airports. Voltes-Dorta and Lei (2013) also concluded that LCC passengers imposed significantly lower costs to UK airports. Furthermore, Bottasso and Conti (2012) observed that the cost advantage of private airports started to fall in the late 1990s as the LCC market developed rapidly, suggesting that such traffic could have a cost-reduction effect on all types of airports.
Finally considering revenues, Graham and Dennis (2007) found lower unit revenues at airports dominated by LCC traffic, whilst Papatheodorou and Lei (2006) noted that other airline models had a higher contribution to aeronautical revenues. For Graham and Dennis (2007), the situation for non-aeronautical revenues was less clear, but nevertheless overall the airports which were dominated by LCCs still had lower unit revenues. Lei and Papatheodorou (2010) also observed lower non-aeronautical spend for LCC passengers, a finding that was confirmed by Lei et al. (2010), although it was noted that with the smallest airports in their sample, the LCC passengers were the largest contributors to commercial revenues.
In summary, it is evident that the LCC sector has experienced considerable growth within the last two decades. Moreover, the traditional LCC business model has evolved and has become more varied as the industry has matured, and there is growing convergence between LCCs and other airline operations. Undoubtedly such trends have had a major impact on airport traffic and financial performance. However, whilst the UK has been at the forefront of many of these developments, and arguably one of the first to experience maturity, there is a lack of an up-to-date and comprehensive analysis of this, particularly over a sufficiently long-term period and from an airport viewpoint. Therefore, in analysing the impact of LCC developments on UK airport traffic and financial performance between 2002 and 2014, the following research questions are addressed in this paper:
• What have been the growth patterns of LCCs at UK airports and how has the evolution of the LCC model affected traffic developments at UK airports?
• What have been the impacts of LCC developments on the financial performance of UK airports?
3. Methodology
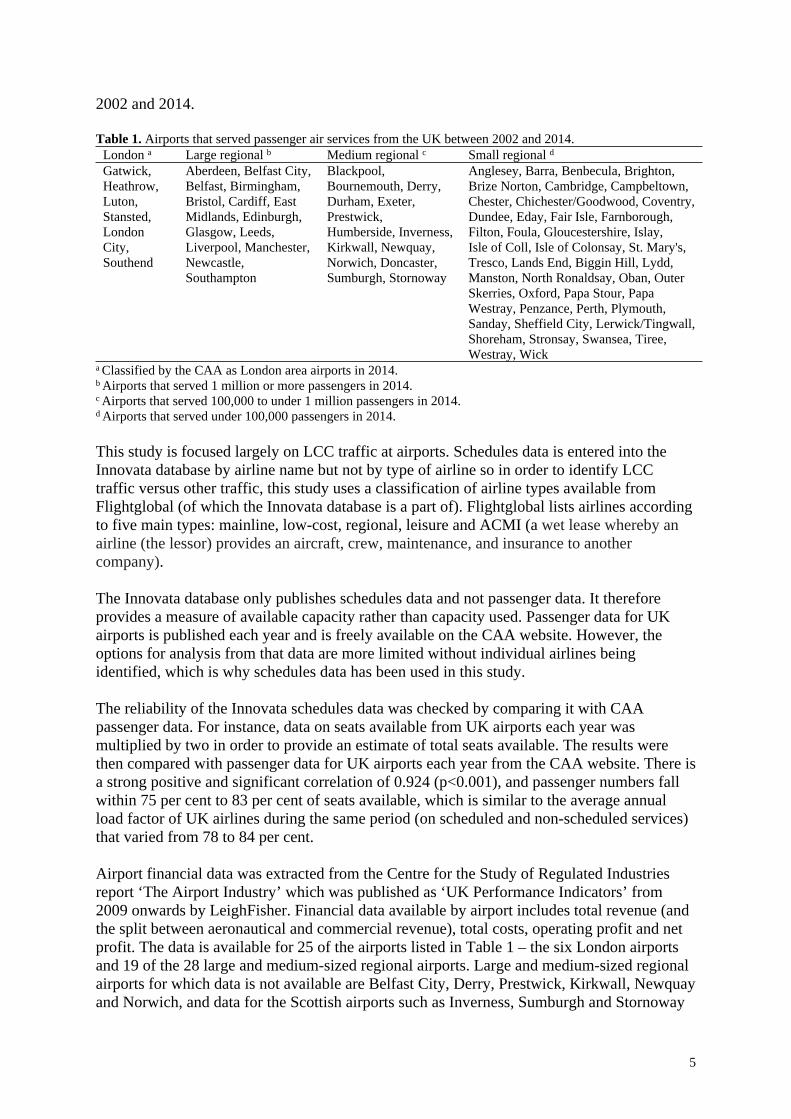
Traffic data for this study was extracted from the Innovata Flight Schedules Database that contains airline schedules according to points served, aircraft type and seat capacity, flight frequency, and available seat kilometres. The data includes almost every operating scheduled airline in the world. It also covers schedules for many leisure carriers. Innovata´s European dataset includes schedules to and from UK airports since 2002, and this study uses schedules data ‘from’ all UK airports during the period 2002 to 2014. This means that it is one-way data. Table 1 provides a list of airports that served airline schedules from the UK between
5
2002 and 2014.
Table 1. Airports that served passenger air services from the UK between 2002 and 2014.London a Large regional b Medium regional c Small regional d
Gatwick, Heathrow, Luton, Stansted, London City, Southend
Aberdeen, Belfast City, Belfast, Birmingham, Bristol, Cardiff, East Midlands, Edinburgh, Glasgow, Leeds, Liverpool, Manchester, Newcastle, Southampton
Blackpool, Bournemouth, Derry, Durham, Exeter, Prestwick, Humberside, Inverness, Kirkwall, Newquay, Norwich, Doncaster, Sumburgh, Stornoway
Anglesey, Barra, Benbecula, Brighton, Brize Norton, Cambridge, Campbeltown, Chester, Chichester/Goodwood, Coventry, Dundee, Eday, Fair Isle, Farnborough, Filton, Foula, Gloucestershire, Islay, Isle of Coll, Isle of Colonsay, St. Mary's, Tresco, Lands End, Biggin Hill, Lydd, Manston, North Ronaldsay, Oban, Outer Skerries, Oxford, Papa Stour, Papa Westray, Penzance, Perth, Plymouth, Sanday, Sheffield City, Lerwick/Tingwall, Shoreham, Stronsay, Swansea, Tiree, Westray, Wick
a Classified by the CAA as London area airports in 2014.b Airports that served 1 million or more passengers in 2014.c Airports that served 100,000 to under 1 million passengers in 2014.d Airports that served under 100,000 passengers in 2014.
This study is focused largely on LCC traffic at airports. Schedules data is entered into the Innovata database by airline name but not by type of airline so in order to identify LCC traffic versus other traffic, this study uses a classification of airline types available from Flightglobal (of which the Innovata database is a part of). Flightglobal lists airlines according to five main types: mainline, low-cost, regional, leisure and ACMI (a wet lease whereby an airline (the lessor) provides an aircraft, crew, maintenance, and insurance to another company).
The Innovata database only publishes schedules data and not passenger data. It therefore provides a measure of available capacity rather than capacity used. Passenger data for UK airports is published each year and is freely available on the CAA website. However, the options for analysis from that data are more limited without individual airlines being identified, which is why schedules data has been used in this study.
The reliability of the Innovata schedules data was checked by comparing it with CAA passenger data. For instance, data on seats available from UK airports each year was multiplied by two in order to provide an estimate of total seats available. The results were then compared with passenger data for UK airports each year from the CAA website. There is a strong positive and significant correlation of 0.924 (p<0.001), and passenger numbers fall within 75 per cent to 83 per cent of seats available, which is similar to the average annual load factor of UK airlines during the same period (on scheduled and non-scheduled services) that varied from 78 to 84 per cent.
Airport financial data was extracted from the Centre for the Study of Regulated Industries report ‘The Airport Industry’ which was published as ‘UK Performance Indicators’ from 2009 onwards by LeighFisher. Financial data available by airport includes total revenue (and the split between aeronautical and commercial revenue), total costs, operating profit and net profit. The data is available for 25 of the airports listed in Table 1 – the six London airports and 19 of the 28 large and medium-sized regional airports. Large and medium-sized regional airports for which data is not available are Belfast City, Derry, Prestwick, Kirkwall, Newquay and Norwich, and data for the Scottish airports such as Inverness, Sumburgh and Stornoway

6
is only presented in a condensed form as Scottish Highland and Islands airports. In addition, none of the small regional airports in Table 1 are included in the financial analysis due to a lack of available data. The small regional airports are not considered individually in any traffic analysis, due to the low amount of traffic served by them (collectively, the small airports served 0.3 per cent of the seat capacity from UK airports in 2014). The latest year for which the financial data was available for this study is 2013/141. For the traffic analysis, it was the calendar year 2014.
In most cases there is at least some private participation in the London airports and the large and medium-sized regional airports, and many of them are totally privately owned. This reflects the airport privatisation process that began in 1987 with the privatisation of BAA. Some of the airports are now under common ownership with the most important groupings being MAG owning Stansted, Manchester, East Midlands and Bournemouth; Global Infrastructure Partners (GIP) owning Edinburgh (as well as having partial involvement with London City until March 2016 and Gatwick); the Peel Group owning Doncaster and partially Liverpool and Durham; and the Rigby group owning or managing Blackpool, Coventry, Derry, Exeter and Norwich. Moreover the Spanish infrastructure company Ferrovial has major investments in Heathrow, Glasgow, Aberdeen and Southampton whilst the Ontario Teachers’ Pension Plan is a key shareholder of both Birmingham and Bristol (and London City since March 2016). 4. Findings and discussion
4.1 General traffic trends from UK airports
The years under consideration in this study can be divided into three distinct periods (see Fig. 1 and Table 2). Between 2002 and 2007 there was considerable growth, especially in the regions, which led to an increase in the regional market share from 32 to 41 per cent. This is the continuation of a trend that has seen the proportionate share of regional seat capacity in the UK grow during the last few decades (e.g. see CAA 2005; 2007). Much of this growth was due to liberalisation of the European air transport market and the subsequent emergence of the LCC sector that provided opportunities for rapid growth in capacity from a growing number of regional airports. Some smaller and so-called secondary London airports, most notably Luton and Stansted also benefitted from such developments. At the same time Heathrow, and to a certain degree Gatwick, became more congested.
Total seat capacity from UK airports peaked at 156 million in 2007 and declined to 140 million by 2010. Despite three years of growth from 2012 to 2014, the capacity of 147 million in 2014 remains some way below the peak in 2007. The period from 2007 to 2014, and especially to 2012, has been a much more volatile era where the rapid growth of the regions at the expense of London was reversed, and the London airports regained market share to 62 per cent by 2014.
Most of the regional airports in the UK experienced strong growth in seat capacity from 2002 to 2007 but that growth has matured and in many cases declined since then with many of the airports that had the largest gains between 2002 and 2007 then experiencing heavy losses between 2007 and 2012, especially Cardiff and medium-sized regional airports such as
1 The financial reports for most airports is for the 12-month financial year or calendar year. There are a few exceptions and one that affects the results (e.g. in Table 9 of this paper) is for BAA airports in 2006/7 when the financial year is from April to December.

7
Prestwick, Doncaster, Bournemouth, Newquay, Blackpool and Durham. Many larger regional and London airports also experienced losses between 2007 and 2012 although their losses were not as great. One London airport that has done well during the more volatile era has been Southend, a small international airport located approximately 70 kilometres from central London, where easyJet opened a base in 2011 with services to Alicante, Amsterdam, Barcelona, Belfast, Faro, Malaga, Jersey, Palma de Majorca and Ibiza.
2002 2003 2004 2005 2006 2007 2008 2009 2010 2011 2012 2013 20140
20
40
60
80
100
120
140
160
180
London Large regional Medium regional Small regional
Mill
ion
seat
s
Fig. 1. Seat capacity from UK airports (one-way), by airport category.
Table 2. Seats available from UK airports in 2014 (one-way) with average annual change for selected periods.Average annual change (%)
Airport Seats 2014 2002-2014 2002-2007 2007-2012 2012-2014London 91 287 818 0.8 2.2 -1.2 2.7-Heathrow 47 632 992 -1.0 -2.5 -0.1 0.6-Gatwick 21 883 647 4.0 7.3 -0.1 4.5-Stansted 11 968 132 2.9 15.0 -6.3 6.0-Luton 6 249 210 7.1 16.0 -1.0 4.1-London City 2 875 647 5.0 11.0 -2.1 7.7-Southend 678 190 1991.5 -8.4 5333.3 27.3Large regional 51 901 061 4.0 11.7 -1.8 1.1-Manchester 13 030 599 5.4 12.0 -0.8 3.6-Edinburgh 6 246 370 2.0 4.4 -0.4 1.9-Birmingham 5 990 910 2.8 5.0 0.7 1.7-Glasgow 4 590 895 -0.3 2.8 -3.4 1.1-Bristol 3 750 078 10.4 22.8 0.1 2.4-Newcastle 2 767 982 7.0 23.1 -3.3 1.2-East Midlands 2 707 955 10.3 30.3 -3.1 2.8-Liverpool 2 476 964 5.6 27.1 -3.2 -7.7-Belfast 2 444 463 2.2 15.8 -3.9 -6.0-Aberdeen 2 274 259 3.4 7.4 -1.4 5.0-Leeds 2 052 470 14.1 34.3 -1.0 2.2-Belfast City 1 663 776 -0.2 1.3 -1.4 -0.7-Southampton 1 282 334 7.5 28.9 -3.3 -3.6-Cardiff 622 006 5.0 45.8 -10.1 -0.8Medium regional 3 578 768 3.8 37.7 -8.9 -4.6-Prestwick 550 105 -2.3 22.6 -11.4 -10.9

8
-Exeter 492 965 24.2 94.1 -4.9 -4.9-Inverness 404 939 4.1 22.7 -4.9 -3.6-Doncaster 404 761 -1.3 a 28.9 a -9.1 1.1-Bournemouth 394 312 21.4 118.8 -9.1 1.1-Derry 244 755 8.2 40.1 -4.4 -7.9-Norwich 236 878 3.8 38.0 -8.9 -4.6-Newquay 144 048 -2.1 14.2 -10.7 -2.6-Sumburgh 130 261 -0.2 -3.4 1.7 4.0-Blackpool 128 759 652.4 6116.3 -14.6 -2.4-Humberside 121 342 -0.3 3.9 -4.4 1.9-Kirkwall 118 376 -0.5 17.2 -8.9 -4.1-Durham 112 294 -4.7 10.9 -13.9 -3.3-Stornoway 94 973 3.0 15.7 -1.3 -9.4Small regional 393 090 -1.9 26.0 -10.5 -14.6All UK airports 147 160 737 1.8 5.8 -1.8 1.9
a From 2005 for Doncaster.
There are a number of reasons that were likely to have been behind the fall in capacity between 2007 and 2012. The onset of the financial crisis in 2008 and subsequent recession depressed both business and leisure demand for travel, along with one-off challenging events such as the Eyjafjallajökull ash cloud which closed European airspace for a number of days. The weak pound particularly hit UK outbound tourism to the Eurozone. Higher fuel prices meant that airlines could no longer viably offer the bargain fares that stimulated demand so much in the period prior to 2007.
The cost of air travel was also pushed up by significant rises in the Air Passenger Duty (APD) which is the tax paid to the government by all terminal passengers passing through UK airports that was introduced in 1994. In 2002, the tax for economy passengers was £5 for European Economic Area (EEA) destinations and £20 for non-EEA destinations. This was doubled in February 2007, just before the onset of the financial crisis, and subsequently in November 2009 it was increased again as a new system of four bands, based on distance flown, was introduced. In spite of intense lobbying pressure from many in the travel and tourism sectors, these taxes continued to rise2. The APD is still a fairly minor part of the total cost for flights between the UK and Europe, which make up the majority of flights flown from UK regions. However, it has a greater impact on domestic journeys where the tax is incurred twice (once in each direction).
As regards the mix of domestic and international passengers from airports in the UK, the proportion of domestic to total seat capacity from UK airports fell from 27 per cent in 2002 to 18 per cent in 2014. At regional airports, where the dependency on domestic services is much greater, the proportion of domestic to total seats declined from 56 per cent in 2002 to 33 per cent in 2014, while at London airports it declined from 13 to nine per cent. As well as the higher impact of the APD on domestic routes, the liquids ban on hand baggage (since 2006) as indeed the increasing practice of charging for hold baggage, has arguably also undermined air travel, where there is a viable surface alternative, and additionally improved rail services on certain routes are likely to have had an impact.
4.2 LCC traffic trends from UK airports
2 By 2014, APD had increased to £13 per economy passenger travelling 2000 miles or less (the cheapest band) and £97 per economy passenger travelling more than 6000 miles (the most expensive band). However, some concessions were made in 2015, when the number of bands was reduced to two and with children under 12 being exempt.

9
The more challenging operating environment since 2007 has resulted in some stabilisation and retrenchment of airline activity in the UK, especially from LCCs at regional airports (see Fig. 2 and 3). The LCC share of seat capacity has increased almost every year at London airports with only one period of decline of 0.4 per cent in 2007. However, from regional airports, LCC seat capacity increased from 9.7 million seats (26 per cent of total seats from the regions) in 2002 to a high of 29.5 million (49 per cent) in 2008. It then declined to 24.3 million (43 per cent) in 2010 and has stabalised since then on 24.5 million (44 per cent) in 2014. This means that some LCC capacity has been transfered from regional to London airports. From all UK airports, LCC seat capacity increased from 23.1 million (19 per cent) in 2002 to 56.6 million (37 per cent) in 2008. It then declined to 50.3 million (36 per cent) in 2010 but has increased since then to 56.8 million (39 per cent) in 2014.
2002 2003 2004 2005 2006 2007 2008 2009 2010 2011 2012 2013 2014-
10
20
30
40
50
60
70
Mainline Low-cost Regional Leisure ACMI
Mill
ion
seat
s
Fig. 2. Seats by type of carrier from UK regional airports (one-way), 2002 to 2014.

10
2002 2003 2004 2005 2006 2007 2008 2009 2010 2011 2012 2013 20140
10
20
30
40
50
60
70
80
90
100
Mainline Low-cost Regional Leisure ACMI
Mill
ion
seat
s
Fig. 3. Seats by type of carrier from UK London airports (one-way), 2002 to 2014.
Another clear movement in past years has been a decline in the amount of charter traffic through airports in the UK. This partly reflected an on-going trend in outbound leisure travel where passengers were shifting from the traditional package holiday destination in the sun to more independent and flexible travel products offered by LCCs, including short break holidays. According to CAA data, the total number of charter passengers travelling through UK airports (two-way) decreased from 38.3 million (20 per cent of total passengers) in 2002 to 18.3 million (eight per cent) in 2014. Some leisure carriers responded by replacing charter services with scheduled services, which artificially inflated the amount of scheduled seat capacity, which grew rapidly from 2.1 million in 2002 to 13.1 million in 2007. Monarch, for example, has traditionally been a leisure carrier but now operates scheduled flights from many airports only previously served on a charter basis such as Leeds and East Midlands. However, this trend is not so evident in later years, possibly due to a number of factors such as a decline in the highly discretionary short break market as the difficult economic conditions started to take effect, and more aggressive responses by an increasingly consolidated European tour operating industry.
In general, medium-sized regional airports without much natural catchment area of their own have fared worst (often after experiencing rapid growth from LCCs prior to 2008) as services have been consolidated onto the larger regional airports. There is evidence of this in Table 2 as the London airports and larger regional airports have generally performed better in recent years. This may reflect the evolution of the LCC industry as described in Section 2.1. In the early years, LCCs such as Ryanair were able to use a Boeing 737-200 aircraft with 130 seats from anywhere to anywhere and fill it based on low fares, which would divert or stimulate enough demand. Over time Ryanair has increased the average unit size of its fleet by replacing their 130-seat Boeing 737-200s with 189-seat Boeing 737-800s. Subsequently, demand has faltered leading to routes being axed or reduced in frequency. Many routes that were once operated daily were reduced to around three times per week. Examples include Liverpool-Pisa and East Midlands-Berlin.

11
The trend for LCCs to use larger aircraft on routes from the UK can be seen at the aggregate level in Table 3. The average aircraft capacity of LCCs from all UK airports increased from 141 seats in 2002 to 168 in 2014 while average sector length has increased from 709 kilometers to 1199. In addition, the difference between average aircraft capacity and sector length of LCC routes from London versus regional airports has narrowed.
Table 3. LCCs at UK airports (one-way), 2002 to 2014.All airports London airports Regional airports
Year
Average aircraft capacity(seats)
Average sector length(kms)
Average aircraft capacity(seats)
Average sector length(kms)
Average aircraft capacity(seats)
Average sector length(kms)
2002 141 709 149 812 132 5672003 150 742 157 839 142 6182004 154 825 161 915 146 7192005 159 892 167 962 152 8182006 164 921 169 977 159 8632007 165 1004 170 1062 162 9492008 168 1011 171 1075 165 9532009 168 1038 171 1096 166 9802010 167 1098 170 1152 164 10402011 167 1147 171 1177 162 11152012 167 1140 171 1146 164 11322013 168 1170 171 1161 165 11802014 168 1199 172 1190 163 1211
Of the individual LCCs operating from regional airports, easyJet, Ryanair and Norwegian all increased the average unit size of their fleet between 2002 and 2014 (see Table 4). Norwegian has undergone the most dramatic transformation during this period. The airline served Newcastle-Stavanger in 2002 with two daily flights on a 50-seat Fokker 50 aircraft. The airline stopped the service in December that year so that it could concentrate its capacity on domestic operations in Norway. 2002 also marked a key change in the airline’s history because, close to bankruptcy, the company decided to change its business model from a regional carrier to a LCC after the purchase of regional airline Braathens S.A.F.E by SAS meant that Norwegian´s contract to operate regional services on the west coast of Norway (which they were doing on behalf of Braathens S.A.F.E) came to an end. The airline started using a Boeing 737-300 aircraft instead of the Fokker 50, and has pursued rapid growth since then, increasing average aircraft capacity from 148 seats to 189 seats when they took delivery of their first Boeing 737-800 in January 2008. In May 2013, Norwegian started low-cost long-haul routes from Oslo and Stockholm to New York and Bangkok, and is currently expanding European and long-haul routes from a base at Gatwick where they were the third largest carrier by 2014 according to seat capacity from the airport.
Norwegian was granted a UK operating licence and AOC for its subsidiary Norwegian UK in November 2015 and plans to begin operating under the new license in 2016 from Gatwick where it already has ten aircraft based. The airline is likely to pursue further UK expansion and potential new long-haul routes from the UK to Asia, South America and South Africa. This should contribute to strong growth in LCC traffic from the UK in coming years but most likely from Gatwick rather than from the regions.
Table 4. LCCs from UK regional airports (one-way), 2002 and 2014.
Carrier Seats % a Departures % bASKs (million) % c
Average seats per departure
Average sector length (km)
2002 total 9 716 712 42 73 890 45 5 5154.8 34 132 568 -easyJet 3 809 964 49 25 743 49 2197.1 40 148 577

12
-Go 2 704 127 54 20 363 54 1711.8 43 133 633-Ryanair 1 891 771 26 15 394 31 851.4 16 123 450 -Aer Lingus 680 180 30 7037 41 210.7 21 97 310 -bmibaby 617 470 100 5089 100 535.7 100 121 868 -Norwegian 13 200 100 264 100 8.1 100 50 615 2014 total 24 468 100 43 150 370 44 29 628.7 43 163 1211 -easyJet 10 565 844 43 65 249 43 10 176.6 38 162 963 -Ryanair 8 218 957 43 43 532 43 11 052.2 47 189 1345 -Jet2 3 324 987 100 19 429 100 6708.6 100 171 2018 -Aer Lingus 1 578 596 44 16 946 58 739.6 43 93 468 -Wizz Air 272 340 13 1513 13 398.6 12 180 1464 -Germanwings 228 168 21 2154 27 178.9 23 106 784 -Norwegian 177 222 9 962 9 184.7 6 184 1042 -Vueling 78 765 18 440 18 118.9 24 179 1510 -Air Baltic 12 246 10 101 11 19.3 11 121 1573 -nas air 9879 28 37 28 49.0 29 267 4957 -Blue Air 1096 1 7 1 2.5 1 157 2308
a Seats from UK regional airports as a proportion of seats from all UK airports.b Departures from UK regional airports as a proportion of departures from all UK airports.c ASKs from UK regional airports as a proportion of ASKs from all UK airports.
Airports in the UK generally had a much greater dependency on LCCs in 2014 compared to in 2002 due largely to growth that took place up to 2008 (see Table 5). Nationally, the share of mainline carrier British Airways declined from 34 per cent to 21 per cent. British Airways maintained its dominance overall nationally and at London airports. However, this is not the case at the regional airports where the airline had the greatest market share in 2002 with 32 per cent but was only the fourth largest carrier by 2014 with six per cent, losing share to LCCs easyJet and Ryanair, and also to regional carrier Flybe. In addition, British Airways experienced reduced market share to LCCs easyJet and Ryanair at London airports.
At large regional airports, British Airways was top with 32 per cent share of all seats in 2002 but by 2014, the airline was out of the top three with just seven per cent, and has been replaced by LCCs easyJet and Ryanair as the two main carriers. Ryanair´s dominant position at medium-sized regional airports has been maintained although that dominance is somewhat reduced (from 43 to 30 per cent). Thomson Airways, a leisure carrier, has made gains at the medium-sized regional airports and was the third largest by 2014 with 11 per cent of the seats. LCCs and other carriers such as Flybe also benefited from the demise of the large mainline carrier Bmi which ceased operations in October 2012 when it was acquired from Lufthansa by the owners of British Airways, International Airlines Group (IAG) and subsequently integrated into British Airways.
Table 5. Top 3 carriers and their proportion of total seats available from UK airports (one-way), 2002 and 2014.2002 2014
Airports Carrier 1 Carrier 2 Carrier 3 Carrier 1 Carrier 2 Carrier 3
London 34.8% BA 6.6% FR 5.3% BD 29.5% BA 15.3% U2 11.8% FR
Large regional 32.0% BA 10.7% BD 10.7% U2 19.9% U2 13.8% FR 13.6% BE
Medium regional 42.6% FR 28.4% BA 9.8% UK 29.9% FR 29.8% BE 10.9% TOM
Small regional 70.1% BA 10.4% 5Y 7.6% CB 37.8% IOS 23.1% BE 7.8% LM
All UK regional 32.3% BA 10.2% BD 10.0% U2 18.9% U2 14.7% BE 14.7% FR
All UK airports 34.2% BA 7.0% BD 6.5% U2 20.7% BA 16.7% U2 12.9% FRNote: BA – British Airways; FR – Ryanair; BD – Bmi; 5Y – Atlas Air; U2 – easyJet; UK – KLM UK; CB – ScotAirways; IOS – Isles of Scilly Skybus; BE – Flybe; TOM – Thomson Airways; LM – Loganair.

13
Changes in the share of LCC seats at UK airports for selected periods can be seen in Table 6. 2008 is used instead of 2007 because although seat capacity from UK airports peaked in 2007, the peak in LCC capacity was in 2008. The share has continued to grow at London airports, especially Southend, Stansted and Gatwick. However, it has declined or stagnated since 2008 at many regional airports, especially the medium-sized regional airports where Ryanair contributed much of the initial growth but has since revised its strategy and has increasingly transferred its operations to larger regional airports with a greater and more established local market – airports that it initially avoided. This has led to reductions in service at regional airports nearby. For example, in Scotland, Prestwick was the original base for Ryanair operations where they grew seat capacity from 0.8 million in 2002 to 1.7 million in 2008 but then reduced this to 0.6 million by 2014, which is significant given that Ryanair was responsible for 100 per cent of the scheduled seat capacity from the airport in 2002 and 2014. Instead, much of Ryanair’s growth in Scotland has been from Edinburgh, a much larger regional airport located 115 kilometres from Prestwick, where the airline has increased seat capacity from 0.2 million in 2002 to 0.5 million in 2008 and 0.9 million in 2014, and became the third largest carrier at the airport by 2014 after easyJet and British Airways with 14 per cent of the seat share. Around half the capacity added at Edinburgh has been switched from Prestwick.
The same trend is apparent in the north of England where the UKs largest regional airport Manchester has regained its dominant position at the expense of lesser-sized regional airports nearby such as Liverpool that is located approximately 50 kilometres away. The total growth in LCC capacity is more noticeable here which suggests that the market share gains were achieved from the mainline and regional carriers by operating from the most favoured airport. In an unusual move, British Airways launched a Heathrow-Leeds service in 2012 with slots it acquired from Bmi who themselves dropped the route some years ago. Jet2 remains a major airline in the north of England, especially at Leeds where it is the largest carrier with a 41 per cent seat share in 2014. Jet2 also has a strong presence as the second largest carrier at Newcastle with a 15 per cent seat share in 2014. Further south, Ryanair has grown operations at the UKs third largest regional airport Birmingham from 0.1 million seats in 2002 to 0.8 million in 2014. The airline has also increased its presence at the fifth largest regional airport Bristol from 0.1 million in 2002 to 0.9 million in 2014.
As mentioned earlier, average aircraft size has increased for many of the major LCCs operating from the UKs regional airports and it seems to be that LCC aircraft have simply become too large for some of the airports and routes that were previously served. This has led to the proportion of LCC services falling since 2008 at regional airports such as Cardiff, East Midlands, Glasgow and Newcastle (see Table 6). Some of the shortfall has been taken up by regional operators such as Flybe or Eastern Airways. In addition, Aer Lingus has replaced Airbus 320s with ATR turbo-props on many services between the UK regions and Ireland (e.g. Glasgow-Dublin, Manchester-Cork). Some airports with significant business travel potential have also seen growth of new routes such as Birmingham-Toulouse and Bristol-Munich with Bmi Regional. In the US, Jet Blue has diversified into Embraer 190s as many of their routes cannot support aircraft with 150 or more seats. However, this has not yet happened with the main LCCs in Europe, and more specifically in the UK.
At Cardiff and East Midlands the demise of LCC bmibaby lies behind the reduction in LCC capacity. While at Newcastle it is easyJet that has dramatically reduced capacity with Jet2 becoming the largest LCC here although they have not increased capacity. At Glasgow, it was the failure of local carrier Flyglobespan that accounted for the difference. The mainline

14
and regional carriers have generally managed to hold a market share of over 50 per cent at the larger regional airports (e.g. Birmingham, Manchester, Edinburgh, Glasgow, Newcastle and the combined Belfast airports) but have often vacated the smaller large regional airports altogether (e.g. KLM dropping its route to Amsterdam from Liverpool). In some cases there has been a down-sizing to regional aircraft to feed the hubs rather than using 737-size equipment.
Table 6. LCC seats and the proportion of LCC seats available from UK airports (one-way) for selected years.2002 2008 2014
Airport LCC seats % total LCC seats % total LCC seats % totalLondon 13 358 94 16.1 27 093 821 30.0 32 363 244 35.5 -Heathrow 1 341 463 2.5 1 613 477 3.4 2 161 362 4.5-Gatwick 1 430 015 9.7 7 002 266 37.2 12 543 380 57.3-Stansted 7 451 768 83.9 13 024 436 91.5 11 515 255 96.2-Luton 3 012 099 89.0 5 413 602 86.3 5 441 357 87.1-London City 123 595 6.9 40 040 1.2 82 136 2.9-Southend 0 0.0 0 0.0 619 754 91.4Large regional 8 599 615 24.5 25 842 560 48.6 22 872 801 44.1 -Manchester 374 065 4.7 2 046 792 18.9 4 199 669 32.2-Edinburgh 1 694 490 33.6 2 901 993 47.1 3 134 390 50.2-Birmingham 343 855 7.7 2 091 071 36.8 1 302 295 21.7-Glasgow 1 241 904 26.2 2 180 459 45.3 1 775 285 38.7-Bristol 809 392 48.6 2 888 679 79.3 2 943 192 78.5-Newcastle 144 159 9.6 1 379 707 48.4 1 198 086 43.3-East Midlands 728 839 60.2 2 808 253 89.8 1 582 082 58.4-Liverpool 1 340 014 90.3 3 371 088 96.9 2 397 381 96.8-Belfast 1 590 031 82.4 3 483 807 96.5 2 232 534 91.3-Aberdeen 129 415 8.0 277 873 12.5 191 208 8.4-Leeds 93 249 12.2 1 318 658 66.6 1 393 716 67.9-Belfast City 0 0.0 620 487 29.2 405 804 24.4-Southampton 0 0.0 0 0.0 0 0.0-Cardiff 110 202 28.4 473 693 43.4 117 159 18.8Medium regional 1 112 173 45.2 3 627 416 54.6 1 595 299 44.6 -Prestwick 765 552 100.0 1 655 377 99.1 550 105 100.0-Exeter 0 0.0 0 0.0 0 0.0-Inverness 64 084 23.6 195 338 38.2 195 228 48.2-Doncaster - - 264 889 43.2 186 417 46.1-Bournemouth 110 379 100.0 512 841 72.1 301 264 76.4-Derry 75 093 60.7 367 416 89.7 241 542 98.7-Norwich 0 0.0 4541 1.2 0 0.0-Newquay 51 030 26.7 170 344 38.3 5790 4.0-Sumburgh 0 0.0 0 0.0 0 0.0-Blackpool 0 0.0 275 210 93.2 114 953 89.3-Humberside 0 0.0 4541 3.2 0 0.0-Kirkwall 0 0.0 0 0.0 0 0.0-Durham 46 035 18.1 176 919 45.0 0 0.0-Stornoway 0 0.0 0 0.0 0 0.0Small regional 4924 1.0 25 340 2.9 0 0All UK airports 23 075 652 19.1 56 589 137 37.5 56 831 344 38.6
As mentioned in Section 2.2, there is a perception that lower airport charges are of greater importance to LCCs compared to other operators. Table 7 shows the unit costs and percentage of fuel and airport costs to total operating costs for five UK based scheduled airlines; mainline carriers British Airways and Virgin Atlantic, LCCs easyJet and Jet2, and regional carrier Flybe. It can be seen that for most of the airlines, airport costs have actually fallen as a percentage of total cost, as would be expected given the large increase in fuel cost, which has actually become much less of a burden in subsequent years. This however, is not

15
the case for LCC easyJet where airport costs form a particularly high proportion of the airlines total operating costs. The cost is generally highest for LCCs easyJet and Jet2, and for regional carrier Flybe. It is generally lower for mainline carriers British Airways and Virgin Atlantic, Despite the high proportion for LCCs, it can be argued that the minimisation of airport costs, which was once central to the business strategy of LCCs, has become less critical although, for those with many domestic and very short haul flights, such charges are still a substantial part of the total cost burden.
Table 7. Airline unit costs and the proportion of total costs on fuel and airport charges for selected years.Airline Item 2002/3 2007/8 2013/14British Airways -Unit cost a 4.7 4.7 6.4
-Fuel cost b 12.6 28.2 36.3-Airport cost c 21.9 22.1 18.9
Virgin Atlantic -Unit cost a 3.2 3.8 4.5-Fuel cost b 16.7 27.6 37.0-Airport cost c 22.4 19.6 19.4
easyJet -Unit cost a 5.1 4.4 5.8-Fuel cost b 11.4 25.9 30.5-Airport cost c 33.1 36.8 35.4
Jet2 -Unit cost a - 4.2 5.1-Fuel cost b - 27.4 31.7-Airport cost c - 25.9 24.2
Flybe -Unit cost a 9.7 10.6 11.1-Fuel cost b 9.8 16.5 19.1-Airport cost c 39.7 28.0 28.8
Data source: CAA UK Airline Financial Tables.a Total operating expenses (in pence) per available seat kilometre.b Aircraft fuel and oil expenses as a proportion of total operating expenses.c Airport and handling expenses (includes landing and departure fees, en-route and navigation service charges, handling charges and parking fees, station costs, passenger services and passenger embarkation fees) as a proportion of total operating expenses.
4.3 Analysis of airport financial data
Table 8 shows the operating margins for UK airports for selected years. A mixed situation occurred between 2002/3 to 2007/8 but in many cases, margins were lower after 2007/8, especially for Leeds, Cardiff, Doncaster, Blackpool and Durham. Many of these airports have experienced operating losses both during and after the period of LCC expansion. In 2013/14, Leeds had an operating profit of -3.8 million, Cardiff -4.1 million, Doncaster -20.9 million and Durham -4.0 million. Financial data for 2013/14 is not available for Blackpool however 2012/13 data shows an operating profit of -2.3 million and the airport has experienced losses in each of the years since 2002/3, as has Durham.
Table 8. Airport operating margin (per cent) for selected years.Operating margin (per cent)
Airport 2002/3 2007/8 2013/14London 33.4 22.7 32.5-Heathrow 36.5 21.5 39.0-Gatwick 29.0 19.7 24.8-Stansted 31.4 31.3 0.8-Luton 22.7 17.6 23.6-London City 19.7 44.5 29.0-Southend 5.0 6.7 -16.2Large regional 28.7 30.0 21.5-Manchester 25.8 27.8 21.4-Edinburgh 34.9 40.5 31.1

16
-Birmingham 30.5 21.9 24.5-Glasgow 32.3 30.8 15.0-Bristol 48.7 45.6 41.3-Newcastle 22.9 35.6 33.3-East Midlands 34.5 35.9 11.1-Liverpool -1.8 13.3 n/a-Belfast 21.1 34.0 6.5-Aberdeen 36.0 36.6 27.0-Leeds 9.5 -8.1 -14.1-Southampton 20.7 24.0 8.9-Cardiff 37.9 33.0 -23.5Medium regional 6.5 -12.3 -52.3-Exeter 12.2 -2.1 -3.2-Doncaster n/a -81.5 -275.8-Bournemouth 12.2 21.6 -0.5-Blackpool -20.0 -51.8 n/a-Humberside 17.0 5.1 -0.6-Durham -9.5 -21.6 -87.5
Fig. 4 and 5 show the proportion of revenue from aeronautical sources at London and regional airports respectively. Whilst these values reflect many factors, including the amount of outsourcing undertaken by the airports and the mix of traffic, they also demonstrate the relative importance of the aeronautical and commercial aspects of the business. Between 2002/3 to 2008/9 there are opposing trends. London airports recorded an increase in their reliance on aeronautical versus commercial revenue while the opposite is the case for regional airports where growth in LCC seat share was particularly strong during that period and the relationship between aeronautical revenue and LCC seat share was negative. As discussed in Section 2.2, this may have been the result of a greater emphasis on commercial activities, encouraged by a more business-like approach as the result of privatisation in the preceding years at many of the regional airports, coupled with pressures from the LCCs to keep charges low as they rapidly expanded air services in the regions. The reduction in importance of aeronautical revenues at regional airports has since flattened out. Whilst pressures on airport charges certainly remained even with increases in fuel costs, commercial revenue generation undoubtedly became more challenging during this period due to a combination of factors such as less disposable income for travellers, more competition from internet retailers, and reduced spending due to the liquid security restrictions and even the ‘one-bag rule’ imposed by some LCCs at UK airports (which has subsequently been somewhat relaxed). There will also have been a loss of aeronautical revenue at regional airports from reduced traffic, especially from LCCs.

17
2002/3 2003/4 2004/5 2005/6 2006/7 2007/8 2008/9 2009/102010/112011/122012/132013/1400
10
20
30
40
50
60
Aeronautical revenue share LCC seat share
Shar
e (%
)
Fig. 4. Aeronautical revenue and one-way LCC seat share from London airports, 2002/3 to 2013/14.Pearson´s correlation .923, p.000 (significant at the 0.01 level, 2-tailed).Note: One of the reasons for the increase in aeronautical share from 2007/8 at the London airports was the inclusion of NATS air traffic control charges from April 2008 in the accounts at airports including Heathrow and Gatwick. Previously NATS charged the airlines directly.
2002/3 2003/4 2004/5 2005/6 2006/7 2007/8 2008/9 2009/102010/112011/122012/132013/140
10
20
30
40
50
60
70
Aeronautical revenue share LCC seat share
Shar
e (%
)
Fig. 5. Aeronautical revenue and one-way LCC seat share from regional airports, 2002/3 to 2013/14.Pearson´s correlation -.949, p.000 (significant at the 0.01 level, 2-tailed).
Tables 9 and 10 provide a summary of the traffic and financial developments at London and regional airports respectively from 2002/3 to 2013/14, and further demonstrate the differing fortunes of the airports. For regional airports, total revenue per seat decreased as total seats, driven largely by growth in LCC seats increased. As illustrated in Fig. 5, this negative relationship is particularly strong with respect to aeronautical revenue which decreased from

18
£14.30 per seat in 2002/3 to £8.80 in 2007/8 at a time when seat capacity increased from 38.1 million to a high of 63.9 million. Total cost per seat also decreased during that time. However, the decrease in cost was not as strong as the decrease in revenue meaning that operating profit per seat fell from £6.50 in 2002/3 to £4.70 in 2007/8. In line with discussions in Section 2.1, this suggests that regional airports were under pressure to compete for LCC traffic by offering attractive packages of airport charges during the period of growth from 2002/3 to 2007/8. There appear to be some cost-related economies of scale involved because total cost per seat declined as traffic increased. However, the cost-related economies of scale and impact on commercial revenue per seat was not sufficient to compensate for reductions in aeronautical revenue per seat. The situation from 2008/9 is less clear but in general, it seems as though unit revenues (both aeronautical and commercial) have increased as seat capacity has been lost, and that cost-related economies of scale have been eroded slightly.
For London airports, the relationship between revenues, costs and seat capacity is fairly unclear. This may be because revenue streams at larger airports are less directly dependent on traffic as they often benefit from revenues such as from rents (e.g. for airline maintenance facilities) and charges for based aircraft. In addition, airport charges may be regulated. Even with freedom to charge what they want, there would be less pressure to offer attractive packages to LCCs because of the wider opportunities that they have to attract traffic but also because of their limited spare capacity and slot access. Similarly with costs, there are less economies of scale to be gained from increased traffic compared to for regional airports that are likely to be operating much further below capacity. For larger airports, there may be greater investment needs associated with developing additional capacity for increased traffic.
Table 9. Traffic and financial performance at London airports, 2002/3 to 2013/14.Total revenue p/seat (£)
Aeronautical revenue p/seat (£)
Commercial revenue p/seat (£)
Total cost p/seat (£)
Operating profit p/seat (£)
Total seats (million)
LCC seats (%)
2002/3 18.0 7.4 10.7 12.0 6.0 82.9 16.12003/4 18.2 7.6 10.6 12.2 6.0 87.3 20.02004/5 18.7 8.2 10.6 12.5 6.3 91.5 21.52005/6 21.8 9.8 12.0 15.2 6.6 85.0 26.72006/7 17.5 8.2 9.3 12.5 5.0 88.6 28.62007/8 23.3 11.3 12.0 18.0 5.3 92.0 28.22008/9 27.5 14.5 13.0 22.9 4.6 90.2 30.02009/10 31.5 17.1 14.4 29.7 1.8 86.5 30.62010/11 32.5 17.3 15.2 24.5 8.0 84.2 30.82011/12 34.7 19.2 15.5 26.3 8.4 86.1 31.22012/13 37.2 21.1 16.1 28.4 8.8 86.6 31.92013/14 40.8 22.4 15.0 27.5 13.3 88.0 33.1
Note: the financial year for BAA airports in 2006/7 is from April to December while the traffic data is from January to December. This explains the inconsistency in data for 2006/7.
Table 10. Traffic and financial performance at regional airports, 2002/3 to 2013/14.Total revenue p/seat (£)
Aeronautical revenue p/seat (£)
Commercial revenue p/seat (£)
Total cost p/seat (£)
Operating profit p/seat (£)
Total seats (million)
LCC seats (%)
2002/3 23.7 14.3 9.4 17.1 6.5 38.1 25.52003/4 22.1 12.6 9.5 15.6 6.5 42.0 33.22004/5 20.0 11.2 8.8 14.0 6.0 48.5 34.72005/6 19.7 10.6 9.1 13.8 5.9 53.5 40.42006/7 18.0 9.2 8.7 13.7 4.3 57.5 42.62007/8 17.5 8.8 8.7 12.8 4.7 63.9 43.7
19
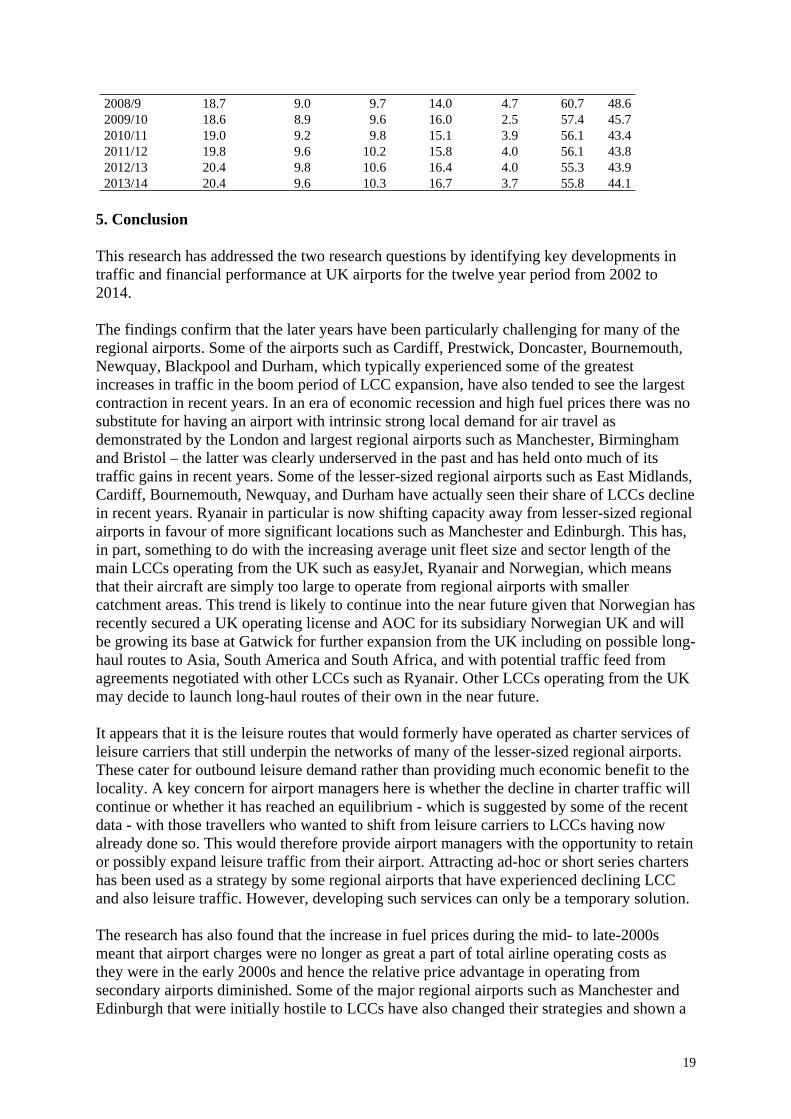
2008/9 18.7 9.0 9.7 14.0 4.7 60.7 48.62009/10 18.6 8.9 9.6 16.0 2.5 57.4 45.72010/11 19.0 9.2 9.8 15.1 3.9 56.1 43.42011/12 19.8 9.6 10.2 15.8 4.0 56.1 43.82012/13 20.4 9.8 10.6 16.4 4.0 55.3 43.92013/14 20.4 9.6 10.3 16.7 3.7 55.8 44.1
5. Conclusion
This research has addressed the two research questions by identifying key developments in traffic and financial performance at UK airports for the twelve year period from 2002 to 2014.
The findings confirm that the later years have been particularly challenging for many of the regional airports. Some of the airports such as Cardiff, Prestwick, Doncaster, Bournemouth, Newquay, Blackpool and Durham, which typically experienced some of the greatest increases in traffic in the boom period of LCC expansion, have also tended to see the largest contraction in recent years. In an era of economic recession and high fuel prices there was no substitute for having an airport with intrinsic strong local demand for air travel as demonstrated by the London and largest regional airports such as Manchester, Birmingham and Bristol – the latter was clearly underserved in the past and has held onto much of its traffic gains in recent years. Some of the lesser-sized regional airports such as East Midlands, Cardiff, Bournemouth, Newquay, and Durham have actually seen their share of LCCs decline in recent years. Ryanair in particular is now shifting capacity away from lesser-sized regional airports in favour of more significant locations such as Manchester and Edinburgh. This has, in part, something to do with the increasing average unit fleet size and sector length of the main LCCs operating from the UK such as easyJet, Ryanair and Norwegian, which means that their aircraft are simply too large to operate from regional airports with smaller catchment areas. This trend is likely to continue into the near future given that Norwegian has recently secured a UK operating license and AOC for its subsidiary Norwegian UK and will be growing its base at Gatwick for further expansion from the UK including on possible long-haul routes to Asia, South America and South Africa, and with potential traffic feed from agreements negotiated with other LCCs such as Ryanair. Other LCCs operating from the UK may decide to launch long-haul routes of their own in the near future.
It appears that it is the leisure routes that would formerly have operated as charter services of leisure carriers that still underpin the networks of many of the lesser-sized regional airports. These cater for outbound leisure demand rather than providing much economic benefit to the locality. A key concern for airport managers here is whether the decline in charter traffic will continue or whether it has reached an equilibrium - which is suggested by some of the recent data - with those travellers who wanted to shift from leisure carriers to LCCs having now already done so. This would therefore provide airport managers with the opportunity to retain or possibly expand leisure traffic from their airport. Attracting ad-hoc or short series charters has been used as a strategy by some regional airports that have experienced declining LCC and also leisure traffic. However, developing such services can only be a temporary solution.
The research has also found that the increase in fuel prices during the mid- to late-2000s meant that airport charges were no longer as great a part of total airline operating costs as they were in the early 2000s and hence the relative price advantage in operating from secondary airports diminished. Some of the major regional airports such as Manchester and Edinburgh that were initially hostile to LCCs have also changed their strategies and shown a

20
greater willingness to offer incentives for new routes and traffic growth. For all airlines, the ability to attract realistic yields has become a bigger driver of network planning than simply seeking market share. Nevertheless, the negative relationship between aeronautical revenues and the proportion of LCC seats at regional airports suggests that LCCs still put considerable pressure on airport management to provide an attractive package of airport charges. This suggests that these airports are more dependent on commercial revenues which may be a difficult direction for airport management to follow, if some of the evidence that indicates that UK LCC passengers spend less can be further supported with other research. Generating the optimal mix of aeronautical and commercial revenue will continue to be a major challenge for managers of these airports.
With first the rise, then the fall in traffic levels over the last decade and a half, airport managers have needed to control their costs and grow their revenues. The extent to which this has been realised differs greatly however. The reduction of services and capacity at some of the airports has clearly had an impact on their overall financial well-being. This is reflected most obviously in reduced operating profits for many airports. Regional airports that seemed relatively attractive investments in the LCC boom days are also now much less financially appealing - as is evident with a number of secondary sales of these airports in recent years. Such sales seem likely to continue into the future. Indeed whilst the UK airport industry was one of the first countries to embrace private sector involvement at regional as well as major airports, it has also been one of the first countries to see two airports, namely Cardiff and Prestwick being handed back to the government. The latter was sold for just £1.
References
ACI-Europe (2015). Airport Charges Survey 2014, Brussels: ACI Europe.
Aviation Strategy (2014). Europe’s LCCs: Evolutionary surge, Aviation Strategy, 193, 1-4.
Barbot, C. (2006). Low-cost airlines, secondary airports, and state aid: An economic assessment of the Ryanair–Charleroi Airport agreement, Journal of Air Transport Management, 12(4), 197-203.
Barrett, S. (2004a). How do the demands for airport services differ between full-service carriers and low-cost carriers? Journal of Air Transport Management, 10(1), 33-39.
Barrett, S. (2004b). The sustainability of the Ryanair model, International Journal of Transport Management, 2(2), 89-98.
Bieger, T. and Wittmer, A. (2006). Air Transport and tourism – perspectives and challenges for destinations, airlines and governments, Journal of Air Transport Management, 12(1), 40-46.
Bottasso, A. and Conti, M. (2012). The cost structure of the UK airport industry, Journal of Transport Economics and Policy, 46(3), 313-332.
Budd, L. and Ison, S. (eds) (2014). Low Cost Carriers, Farnham: Ashgate.
Budd, L., Francis, G., Humphreys, I. and Ison, S. (2014). Grounded: Characterising the market exit of European low cost airline, Journal of Air Transport Management, 34, 78-85.
21
Bush, H. and Starkie, D. (2014). Competitive drivers towards improved airport/airline relationships, Journal of Air Transport Management, 41, 45-49.
CAA (2005). UK Regional Air Services, CAP 754, London: CAA.
CAA (2006). No Frills Carriers: Revolution or Evolution? CAP 770, London: CAA.
CAA (2007). Air Services at UK Regional Airports: An Update on Developments, CAP 775, London: CAA.
Castillo-Manzano, J. (2010). Determinants of commercial revenues at airports: Lessons learned from Spanish regional airports, Tourism Management, 31(6), 788–796.
Choo, Y. and Oum, T. (2013). Impacts of low cost carrier services on efficiency of the major U.S airports, Journal of Air Transport Management, 33, 60-67.
Coto-Millan, P., Casares-Hontanon, P., Inglada, V., Agüeros, M., Pesquera, M., Badiola, A. (2014). Small is beautiful? The impact of economic crisis, low cost carriers, and size on efficiency in Spanish airports (2009-2011), Journal of Air Transport Management, 40, 34-41.
Daft, J. and Albers, S. (2012). A profitability analysis of low-cost long-haul flight operations, Journal of Air Transport Management, 19, 49-54.
Dennis, N. (2007). Stimulation or saturation? Perspectives on the European low-cost airline market and prospects for growth, Journal of the Transportation Research Board, 52-59.
de Neufville, R. (2008). Low-cost airports for low-cost airlines: flexible design to manage the risks, Transportation Planning and Technology, 31(1), 35-68.
de Wit, J. and Zuidberg J. (2012). The growth limits of the low cost carrier model, Journal of Air Transport Management, 21, 17–23.
de Wit, J. and Zuidberg, J. (2016). Route churn: an analysis of low-cost carrier route continuity in Europe, Journal of Transport Geography, 50, 57-67.
Dobruszkes, F. (2006). An analysis of European low-cost airlines and their networks, Journal of Transport Geography, 14(4), 249-264.
Dobruszkes, F. (2013). The geography of European low-cost airline networks: a contemporary analysis, Journal of Transport Geography, 28, 75-88.
Fageda, X., Suau-Sanchez, P. and Mason, K. (2015). The evolving low-cost business model: Network implications of fare bundling and connecting flights in Europe, Journal of Air Transport Management, 42, 289-296.
Francis, G., Fidato, A. and Humphreys, I. (2003). Airport-airline interaction: the impact of low-cost carriers on two European airports, Journal of Air Transport Management, 9(4), 267-273.

22
Franke, M. (2004). Competition between network carriers and low-cost carriers—retreatbattle or breakthrough to a new level of efficiency, Journal of Air Transport Management, 10 (1), 15-21.
Gillen, D. and Gados, A. (2008). Airlines within airlines: Assessing the vulnerabilities of mixing business models, Research in Transportation Economics, 24(1), 25-35.
Gillen, D. and Lall, A. (2004). Competitive advantage of low-cost carriers: some implications for airports, Journal of Air Transport Management, 10(1), 41-50.
Graham, A. and Dennis, N. (2007). Airport traffic and financial performance: a UK and Ireland case study, Journal of Transport Geography, 15(3), 161-171.
Gross, S. and Luck, M. (eds) (2013). The Low Cost Carrier Worldwide, Farnham: Ashgate.
Gudmundsson, S. (1998). Flying too Close to the Sun: The Success and Failure of the New-Entrant Airlines, Aldershot: Ashgate.
Ison, S., Francis, G., Humphreys, I. and Page, R. (2011). UK regional airport commercialisation and privatisation: 25 years on, Journal of Transport Geography, 19(6), 1341-1349.
Jones, O., Budd, L. and Pitfield, D. (2013). Aeronautical charging policy incentive schemes for airlines at European airports, Journal of Air Transport Management, 33, 43-59.
Klophaus, R., Conrady, R. and Fichert, F. (2012). Low cost carriers going hybrid: Evidence from Europe, Journal of Air Transport Management, 23, 54-58.
Lawton, T. (2002). Cleared for Take-Off: Structure and Strategy in the Low-Fare Airline Business, Aldershot: Ashgate.
Lei, Z. and Papatheodorou, A. (2010). Measuring the effect of low-cost carriers on regional airports’ commercial revenue, Research in Transportation Economics, 26(1), 37–43.
Lei, Z. and Pagliari, R. (2013). Airport traffic growth and airport financial performance, in Forsyth P., Gillen D., Hüschelrath K., Niemeier H-M. and Wolf W. (eds) (2013). Liberalization in Aviation, Farnham: Ashgate.
Lei, Z., Papatheodorou, A. and Szivas, E. (2010). The effect of low-cost carriers on regional airports’ revenue: evidence from the UK in Forsyth P., Gillen D., Muller J. and Niemeier H-M. (eds) (2008). Airport Competition: The European Experience, Aldershot: Ashgate.
Malina, R., Albers, S. and Kroll, N. (2012). Airport incentive programmes: A European perspective, Transport Reviews, 32(4), 435-453.
Mason, K. and Morrison, W. (2008). Towards a means of consistently comparing airline business models with an application to the low cost airline sector, Research in Transportation Economics, 24(1), 75-84.

23
Morrell, P. (2008). Can long-haul low-cost be successful? Research in Transportation Economics, 24(1), 61-67.
Njoya, E. and Niemeier, H-M. (2011). Do dedicated low-cost passenger terminals create competitive advantages for airports, Research in Transportation Business and Management, 1(1), 55-61.
Pantazis, N. and Liefner, I. (2006). The impact of low-cost carriers on catchment areas of established international airports: The case of Hanover airport, Germany, Journal of Transport Geography, 14(4), 265-272.
Papatheodorou, A. and Lei, Z. (2006). Leisure travel in Europe and airline business models: A study of regional airports in Great Britain, Journal of Air Transport Management, 12(1), 47-52.
Pitt, M. and Brown, A. (2001). Developing a strategic direction for airports to enable the provision of services to both network and low-fare carriers, Facilities, 19(1/2), 52-60.
Poret, M., O’Connell, J. and Warnock-Smith, D. (2015). The economic viability of long-haul low cost operations: Evidence from the transatlantic market, Journal of Air Transport Management, 42, 272-281.
Thelle, M.H., Pedersen, T.T. and Harhoff, F. (2012). Airport Competition in Europe, Copenhagen: Copenhagen Economics.
Voltes-Dorta, A. and Lei, Z. (2013). The impact of airline differentiation on marginal cost pricing at UK airports, Transportation Research Part A, 55, 72-88.
Warnock-Smith, D. and Potter, A. (2005). An exploratory study into airport choice factors for European low-cost airlines, Journal of Air Transport Management, 11(6), 388-392.
Williams, G. (2011). Comparing the economic and operating characteristics of charter and low cost scheduled airlines, in O’Connell, J. and Williams, G., Air Transport in the 21st Century, Farnham: Ashgate.
Windle, R. and Dresner, M. (1999). Competitive responses to low cost carrier entry, Transportation Research Part E, 35(1), 59-75.
Zhang A., Hanaoka S., Inamura H. and Ishikura T. (2008). Low-cost carriers in Asia: Deregulation, regional liberalization and secondary airports, Research in Transportation Economics, 24(1), 36–50.