low-carbon hydrogen production using small modular reactors
TRANSCRIPT

Low-Carbon Hydrogen ProductionUsing Small Modular ReactorsIs energy from small modular nuclear reactors a competitiveway of producing hydrogen in the future hydrogen economy?
Master’s thesis in Product development and Production engineering
BALDER HAGERTLUDVIG BLOMGREN
DEPARTMENT OF INDUSTRIAL AND MATERIALS SCIENCE
CHALMERS UNIVERSITY OF TECHNOLOGYGothenburg, Sweden 2021www.chalmers.se


Master’s thesis 2021
Low-Carbon Hydrogen ProductionUsing Small Modular Reactors
Is energy from small modular nuclear reactors a competitive way ofproducing hydrogen in the future hydrogen economy?
BALDER HAGERTLUDVIG BLOMGREN
Department of Industrial and Materials ScienceIMSX30
Chalmers University of TechnologyGothenburg, Sweden 2021
Low-Carbon Hydrogen Production Using Small Modular Reactors: Is energy fromsmall modular nuclear reactors a competitive way of producing hydrogen in the futurehydrogen economy?
© BALDER HAGERT, 2021.© LUDVIG BLOMGREN, 2021.
Supervisor: Simon Wakter & Lars Dahlström, Energy Division, AFRYSupervisor and Examiner: Professor Johan Malmqvist, Department of Industrialand Materials Science, Chalmers University of Technology
Master’s Thesis 2021Department of Industrial and Materials ScienceIMSX30Chalmers University of TechnologySE-412 96 Gothenburg, SwedenTelephone +46 31 772 1000
Typeset in LATEX, template by Magnus GustaverPrinted by Chalmers DigitaltryckGothenburg, Sweden 2021
iv
Low-Carbon Hydrogen Production Using Small Modular Reactors: Is energy fromsmall modular nuclear reactors a competitive way of producing hydrogen in the futurehydrogen economy?BALDER HAGERTLUDVIG BLOMGRENDepartment of Industrial and Materials ScienceChalmers University of Technology
AbstractHydrogen has been proposed as a way to achieve decarbonisation within many sec-tors from transportation to industry. In order to achieve this reduction in emissionsthe hydrogen itself must be produced with low carbon emissions. The study hasinvestigated what applications hydrogen will most likely have a prominent role in,and what requirements different demands put on the supply. The development ofsmall modular nuclear reactors (SMR) has been investigated as well as their poten-tial as an energy source in low-carbon hydrogen production. The research approachof the study consisted of a literature study, followed by an interview study. Theinterview study consisted of interviews with 12 experts in the areas of hydrogen ap-plications and nuclear power. The study also included calculations deciding not onlyproduction cost but also the final delivered cost of hydrogen. The study found thatthere are some applications where the demand for hydrogen is certain, including inthe production of ammonia and methanol. Other possible hydrogen uses includesteel production and transportation are also found as probable areas with grow-ing demands for hydrogen in the future. The study found that SMRs have manysynergies with hydrogen production, including process heat, continuous production,modularity and SMRs being less location-specific compared to other alternatives.Finally, the results of the study include calculations of the delivered cost of hydro-gen, proving that, under certain assumptions and when accounting for cost of thewhole supply chain, small modular reactors provide a competitive source of energy.To summarise, the study has found that there is a need for low-carbon hydrogenin the future and that it is important to consider the delivered cost of hydrogen,which includes production, transportation, and storage cost. It was found that it isimportant to be technology-neutral when considering energy sources for producinghydrogen and that nuclear and SMRs should be included as an option.
Keywords: Hydrogen, Electrolysis, Levelised Cost of Hydrogen, LCOH, Small Mod-ular Reactors, SMR
v


AcknowledgementsWithout the great deal of support and assistance we have gotten during the courseof this thesis, non of this would have been possible. First of all, we would like tosincerely thank our supervisor and examiner at Chalmers University of Technology,Professor Johan Malmqvist. Johan’s expertise and experience in structuring andproviding feedback, has been invaluable in guiding us through the academic workperformed during this spring.
We would also like to extend our deepest gratitude to everyone at AFRY for pro-viding us with this opportunity. Specifically, to Simon Wakter and Lars Dahlströmwhom have shared a never-ending source of experience and valuable as well as upto date insights. Further more, we would like to share our appreciation to DanielJohansson and Richard Martin. Firstly, for taking a chance in mentoring us at anearly stage of our individual masters programmes. This is an experience we feelhave not only been valuable now, but will be for a long time to come. Secondly, foraiding us in finding an interesting subject to explore, and lastly, for supporting usduring this process.
Further, we are thankful for everyone participating in interviews and sharing theirexpertise. Without you, we would have never reached our goal.
Finally, we extend our sincerest gratitude to friends and family for always supportingus and for stimulating discussions as well as happy distractions.
Balder Hagert & Ludvig Blomgren, Gothenburg, May 2021
vii

Contents
Abstract v
Acknowledgements vii
List of Figures xiii
List of Tables xv
List of Abbreviations xvii
1 Introduction 11.1 Background . . . . . . . . . . . . . . . . . . . . . . . . . . . . . . . . 11.2 Problem Statement . . . . . . . . . . . . . . . . . . . . . . . . . . . . 21.3 Collaboration with AFRY . . . . . . . . . . . . . . . . . . . . . . . . 31.4 Purpose & Research Questions . . . . . . . . . . . . . . . . . . . . . . 31.5 Demarcations . . . . . . . . . . . . . . . . . . . . . . . . . . . . . . . 41.6 Outline of thesis . . . . . . . . . . . . . . . . . . . . . . . . . . . . . . 5
2 Research Approach 72.1 Overall Research Approach . . . . . . . . . . . . . . . . . . . . . . . . 72.2 Literature Study . . . . . . . . . . . . . . . . . . . . . . . . . . . . . 82.3 Interview Study . . . . . . . . . . . . . . . . . . . . . . . . . . . . . . 92.4 Synthesis and analysis . . . . . . . . . . . . . . . . . . . . . . . . . . 11
3 Hydrogen Demand 133.1 Industrial Applications . . . . . . . . . . . . . . . . . . . . . . . . . . 13
3.1.1 Ammonia Production . . . . . . . . . . . . . . . . . . . . . . . 143.1.2 Methanol Production . . . . . . . . . . . . . . . . . . . . . . . 153.1.3 Metallurgical Industry . . . . . . . . . . . . . . . . . . . . . . 15
3.2 Transportation Applications . . . . . . . . . . . . . . . . . . . . . . . 173.2.1 Fuel Cell Electric Vehicles (FCEV) . . . . . . . . . . . . . . . 173.2.2 Internal Combustion Engines (ICE) . . . . . . . . . . . . . . . 193.2.3 Buses, Trucks, and Trains . . . . . . . . . . . . . . . . . . . . 203.2.4 Aviation . . . . . . . . . . . . . . . . . . . . . . . . . . . . . . 213.2.5 Maritime Applications . . . . . . . . . . . . . . . . . . . . . . 22
3.3 Hydrogen for Power Generation and Grid Balancing . . . . . . . . . . 233.4 Summary of Hydrogen Demand . . . . . . . . . . . . . . . . . . . . . 23
ix

Contents
4 Hydrogen Supply 254.1 Hydrogen Production - Fossil Fuel . . . . . . . . . . . . . . . . . . . . 25
4.1.1 Steam Reforming . . . . . . . . . . . . . . . . . . . . . . . . . 264.1.2 Gasification . . . . . . . . . . . . . . . . . . . . . . . . . . . . 27
4.2 Hydrogen Production - Electrolysis . . . . . . . . . . . . . . . . . . . 274.2.1 Basic Concept . . . . . . . . . . . . . . . . . . . . . . . . . . . 284.2.2 Alkaline Electrolyser (AEC) . . . . . . . . . . . . . . . . . . . 294.2.3 Proton Exchange Membrane (PEM) . . . . . . . . . . . . . . . 314.2.4 Solid Oxide electrolyser (SOEC) . . . . . . . . . . . . . . . . . 33
4.3 Hydrogen Storage . . . . . . . . . . . . . . . . . . . . . . . . . . . . . 344.3.1 Compressed Hydrogen Vessels . . . . . . . . . . . . . . . . . . 354.3.2 Underground Storage . . . . . . . . . . . . . . . . . . . . . . . 354.3.3 Liquefied Hydrogen Vessels . . . . . . . . . . . . . . . . . . . . 38
4.4 Hydrogen Transport . . . . . . . . . . . . . . . . . . . . . . . . . . . 384.4.1 Road . . . . . . . . . . . . . . . . . . . . . . . . . . . . . . . . 394.4.2 Pipeline . . . . . . . . . . . . . . . . . . . . . . . . . . . . . . 394.4.3 Shipping . . . . . . . . . . . . . . . . . . . . . . . . . . . . . . 40
4.5 Cost of Hydrogen Production . . . . . . . . . . . . . . . . . . . . . . 404.6 Summary of Hydrogen Supply . . . . . . . . . . . . . . . . . . . . . . 42
5 Small Modular Reactors 455.1 Basic Concept . . . . . . . . . . . . . . . . . . . . . . . . . . . . . . . 455.2 Nuclear Reactor Technologies . . . . . . . . . . . . . . . . . . . . . . 46
5.2.1 Light-Water Reactor (LWR) . . . . . . . . . . . . . . . . . . . 465.2.2 Molten Salt Reactor (MSR) . . . . . . . . . . . . . . . . . . . 475.2.3 High-temperature Gas Reactor (HTGR) . . . . . . . . . . . . 47
5.3 Economics . . . . . . . . . . . . . . . . . . . . . . . . . . . . . . . . . 485.4 Reactor Benchmark . . . . . . . . . . . . . . . . . . . . . . . . . . . . 50
5.4.1 NPM, NuScale, US . . . . . . . . . . . . . . . . . . . . . . . . 505.4.2 BWRX-300, GE-Hitachi, US & Japan . . . . . . . . . . . . . . 515.4.3 Xe-100, X-energy, US . . . . . . . . . . . . . . . . . . . . . . . 515.4.4 Integral MSR, Terrestrial Energy, Canada . . . . . . . . . . . 525.4.5 RITM-200, Rosatom, Russia . . . . . . . . . . . . . . . . . . . 525.4.6 HTR-PM, China . . . . . . . . . . . . . . . . . . . . . . . . . 52
5.5 Barriers to the Concept of SMR . . . . . . . . . . . . . . . . . . . . . 525.5.1 Licensing . . . . . . . . . . . . . . . . . . . . . . . . . . . . . 535.5.2 Deployment . . . . . . . . . . . . . . . . . . . . . . . . . . . . 535.5.3 Promotion of the Technology . . . . . . . . . . . . . . . . . . 54
5.6 Timeline . . . . . . . . . . . . . . . . . . . . . . . . . . . . . . . . . . 545.7 Summary of Small Modular Reactors . . . . . . . . . . . . . . . . . . 55
6 Hydrogen and Small Modular Reactors 576.1 Market Opportunity . . . . . . . . . . . . . . . . . . . . . . . . . . . 576.2 Nuclear Electrolysis . . . . . . . . . . . . . . . . . . . . . . . . . . . . 596.3 Analysis of the Synergies Between Hydrogen and Small Modular Re-
actors . . . . . . . . . . . . . . . . . . . . . . . . . . . . . . . . . . . 606.3.1 Process Heat . . . . . . . . . . . . . . . . . . . . . . . . . . . 60
x
Contents
6.3.2 Availability and Continuous Production . . . . . . . . . . . . . 616.3.3 Location . . . . . . . . . . . . . . . . . . . . . . . . . . . . . . 616.3.4 Modularity . . . . . . . . . . . . . . . . . . . . . . . . . . . . 62
6.4 Alternative Production Methods . . . . . . . . . . . . . . . . . . . . . 626.4.1 Reforming with CCS . . . . . . . . . . . . . . . . . . . . . . . 626.4.2 Renewable Electrolysis . . . . . . . . . . . . . . . . . . . . . . 63
6.5 Delivered Cost . . . . . . . . . . . . . . . . . . . . . . . . . . . . . . . 656.6 Summary of Hydrogen and Small Modular Reactors . . . . . . . . . . 67
7 Cost Comparison of Hydrogen from Different Supply Architectures 697.1 Analysing Levelised Cost of Hydrogen . . . . . . . . . . . . . . . . . . 697.2 Assumptions . . . . . . . . . . . . . . . . . . . . . . . . . . . . . . . . 70
7.2.1 Energy Source . . . . . . . . . . . . . . . . . . . . . . . . . . . 707.2.2 Production Method . . . . . . . . . . . . . . . . . . . . . . . . 717.2.3 Transport & Storage . . . . . . . . . . . . . . . . . . . . . . . 72
7.3 Hydrogen Production Cost . . . . . . . . . . . . . . . . . . . . . . . . 737.4 Delivered Cost . . . . . . . . . . . . . . . . . . . . . . . . . . . . . . . 747.5 Conclusion of Cost Comparison . . . . . . . . . . . . . . . . . . . . . 75
8 Discussion 778.1 Hydrogen - The Fuel of the Future? . . . . . . . . . . . . . . . . . . . 77
8.1.1 Industrial Applications . . . . . . . . . . . . . . . . . . . . . . 788.1.2 Transportation . . . . . . . . . . . . . . . . . . . . . . . . . . 798.1.3 Conclusion of Discussion of Hydrogen . . . . . . . . . . . . . . 80
8.2 Small Modular Reactors . . . . . . . . . . . . . . . . . . . . . . . . . 808.3 Hydrogen and Small Modular Reactors . . . . . . . . . . . . . . . . . 828.4 Delivered Cost . . . . . . . . . . . . . . . . . . . . . . . . . . . . . . . 848.5 First Step . . . . . . . . . . . . . . . . . . . . . . . . . . . . . . . . . 858.6 Final Remarks . . . . . . . . . . . . . . . . . . . . . . . . . . . . . . . 868.7 Contributions of Work . . . . . . . . . . . . . . . . . . . . . . . . . . 878.8 Research Approach and Validity of Result . . . . . . . . . . . . . . . 888.9 Sustainability and Ethical Considerations . . . . . . . . . . . . . . . . 89
9 Conclusions and Future Work 919.1 Conclusions . . . . . . . . . . . . . . . . . . . . . . . . . . . . . . . . 919.2 Future Work . . . . . . . . . . . . . . . . . . . . . . . . . . . . . . . . 92
References 93
A Electrolyser Benchmark I
B SMR Benchmark III
xi

Contents
xii
List of Figures
2.1 The research approach illustrated in this study. . . . . . . . . . . . . 11
3.1 The chapter describes the demand part of the overall structure. . . . 13
4.1 The chapter explains the supply part of the overall structure. . . . . . 254.2 Graph illustrates the relation between electrical and thermal energy,
based on equation 4.2. . . . . . . . . . . . . . . . . . . . . . . . . . . 294.3 Schematic of the AEC functionality. . . . . . . . . . . . . . . . . . . . 304.4 Schematic of the PEM functionality . . . . . . . . . . . . . . . . . . . 314.5 Schematic of the SOEC functionality . . . . . . . . . . . . . . . . . . 334.6 A cost comparison of hydrogen distribution methods. TPD stands
for tonnes per day. . . . . . . . . . . . . . . . . . . . . . . . . . . . . 38
5.1 The chapter is in regards to the energy source part of the overallstructure. . . . . . . . . . . . . . . . . . . . . . . . . . . . . . . . . . 45
5.2 Illustrating how "economy of multiples" can compensate for loss of"economy of scale" factor. . . . . . . . . . . . . . . . . . . . . . . . . 48
5.3 Illustrating a projected timeline of SMR deployment and introductionto the hydrogen market. . . . . . . . . . . . . . . . . . . . . . . . . . 54
6.1 The figure on left illustrates low-temperature electrolysis while thefigure on the right illustrates high-temperature electrolysis. Bothwith a nuclear energy source. . . . . . . . . . . . . . . . . . . . . . . 59
6.2 A map of Europe illustrating demand clusters and potential storagesites in salt caverns. . . . . . . . . . . . . . . . . . . . . . . . . . . . . 66
6.3 A map of the US illustrating demand clusters and the areas with thelargest potential for wind power as well as existing LNP. . . . . . . . 67
7.1 The chapter describes the system part of the overall structure. . . . . 697.2 The production cost of hydrogen for different supply sources. . . . . . 737.3 The delivered cost of hydrogen for different supply architectures. . . . 74
8.1 Illustrating the structure of the chapter, including a discussion on thetopic and discussion on the study in general. . . . . . . . . . . . . . . 77
xiii

List of Figures
xiv

List of Tables
2.1 A selection of keywords used in the initial literature search . . . . . . 82.2 Interview subjects . . . . . . . . . . . . . . . . . . . . . . . . . . . . . 10
3.1 Summary of hydrogen demand . . . . . . . . . . . . . . . . . . . . . . 24
4.1 Levelised cost of hydrogen based on steam methane reforming pro-duction. All numbers are shown $/kgH2 . . . . . . . . . . . . . . . . 26
4.2 Underground storage comparison . . . . . . . . . . . . . . . . . . . . 364.3 Summary of hydrogen production methods. . . . . . . . . . . . . . . 43
5.1 Benchmark over some of the most developed SMRs . . . . . . . . . . 50
6.1 Future demand in amount of hydrogen, electricity and finally numberof SMRs . . . . . . . . . . . . . . . . . . . . . . . . . . . . . . . . . . 58
6.2 SWOT analysis for Reforming with CCS architecture . . . . . . . . . 636.3 SWOT analysis for Renewable Electrolysis architecture . . . . . . . . 64
7.1 The cost of heat and electricity and capacity factor from differentenergy sources. . . . . . . . . . . . . . . . . . . . . . . . . . . . . . . 71
7.2 The costs associated to different electrolysers. . . . . . . . . . . . . . 717.3 The cost of transporting and storing hydrogen and corbon dioxide. . . 73
A.1 Some commercial electrolysers currently on the market. . . . . . . . . II
B.1 Benchmark over other SMR designs far ahead in development. . . . III
xv

List of Tables
xvi

List of Abbreviations
GHG - Greenhouse GasRES - Renewable Energy SystemSMR - Small Modular Reactor
IEA - International Energy AgencyCCS - Carbon Capture and StorageFCEV - Fuel Cell Electric VehiclesICE - Internal Combustion EngineBEV - Battery-powered Electric VehicleTCO - Total Cost of Ownership
LCOH - Levelised Cost of HydrogenLCOE - Levelised Cost of ElectricityAEC - Alkaline ElectrolyserPEM - Proton Exchange MembraneSOEC - Solid Oxide ElectrolyserOPEX - Operational ExpenditureCAPEX - Capital ExpenditureCRF - Capital Recovery Factor
LWR - Light-Water ReactorPWR - Pressurised Water ReactorBWR - Boiling Water ReactorMSR - Molten Salt ReactorHTGR - High-temperature Gas ReactorLNP - Large Nuclear Power PlantFOAK - First-of-a-kindNOAK - Nth-of-a-kindWNA - World Nuclear AssociationNRC - US Nuclear Regulatory CommissionCNSC - Canadian Nuclear Safety CommissionDOE - U.S. Department of Energy
xvii

List of Tables
xviii

1Introduction
In this chapter, first, a background to the work will be given together with a problemstatement. Next, the collaboration with the company with which the study wasconducted together with, AFRY, is outlined. The purpose and goals of the workare explained as well as the research questions. Demarcations set for the work arepresented and finally, an outline of the thesis is given.
1.1 BackgroundClimate change is one of mankind’s biggest challenges and poses a great threat to theplanet and its inhabitants. In order to overcome the challenge, both the emissionsof greenhouse gases (GHG) and the concentration of GHGs in the atmosphere mustdrop sharply. However, despite this, both emissions and the concentration of GHGsare currently increasing. This results in rising global average temperatures which inturn creates more desert landscapes and causes rising sea levels. If something is notdone, this will eventually create great disharmony in the way we live and operateas of today. To reverse the effects, the situation requires a change towards moresustainable means of consumption, the way we produce energy, and what types ofenergy sources we use in transportation, to name a few.
The European Union’s latest effort in its strive towards becoming the first climate-neutral continent is "The European Green Deal". The initiative aims to reach anefficient use of resources and a circular economy by, for example, decarbonising theenergy sector [1]. More than 75% of GHG emissions are related to the productionand use of energy in the EU. In total, the EU plans to invest at least 1 trillion eurosto reach its targets [1]. One key part of the EU:s strategy aims at the increaseduse of hydrogen in the energy sector. The use of pure hydrogen, for combustion orelectrification, does not emit GHG. This makes it a necessary alternative to helpdecarbonise hard-to-abate sectors such as parts of the transport sector and certaincarbon-intensive industrial processes [2]. However, hydrogen does not occur natu-rally in its pure form and requires considerable amounts of energy to produce byseparating it from other elements. Today, this is mainly done by using fossil fuels[3]. For hydrogen to be an alternative, and be considered low-carbon hydrogen, theproduction methods and the supplied energy need to be low-carbon as well. Be-cause of inefficiencies in the production, the amount of energy required to producelow-carbon hydrogen is significantly higher than the amount of low-carbon that isproduced, in terms of energy. This means that it is not only the use of hydrogen thatneeds to increase but also the low-carbon energy it takes to produce it sustainably.
1
1. Introduction
As an example, the German hydrogen strategy estimates that around 90 to 110TWh of hydrogen will be needed in 2030. At the same time, it is estimated thatonly around 14 TWh can be supplied domestically with current initiatives [4]. Thiswould in turn require 20 TWh of low-carbon energy. Assuming it would take thesame energy consumption to produce the remaining 76 to 90 TWh of hydrogen,the total low-carbon energy demand for hydrogen production would roughly be 140TWh.
The question that arises is where all of this energy is supposed to come from. Theconsensus within the EU is to solely rely on renewable energy sources (RES) long-term. In Sweden, a project called Hybrit is currently investigating the possibility ofbuilding the first-ever fossil-free steel production site using hydrogen [5]. If success-ful, the factory would require 15 TWh of renewable energy. This is about 75% ofthe energy produced from solar and wind in Sweden today [6]. So, even though theexpansion of RES is necessary in several ways, it is questionable if it can meet theincreased energy demand in the required time frame. Furthermore, it introduces riskregarding what will happen with decarbonisation using hydrogen, if the deploymentof renewables cannot keep up.
Another energy source, classified as low-carbon, that is not mentioned as frequentlyfor this application is nuclear power. The energy produced from a nuclear reactorreleases very small amounts of GHG emissions and could, from a theoretical stand-point, stand as an addition to RES. Recent advances within the nuclear industryhave also been made to combat some of the downsides associated with the technol-ogy. One of these is the concept of the small modular reactor (SMR). A small reactoris defined as having a capacity of 300 MW electric (MWe), or less [7]. This meansthat instead of building one large reactor of 1000 MWe or above, you could buildseveral smaller ones. SMRs are also meant to have a simpler and more standardiseddesign. This opens the possibility for them to be largely factory-built and assembledon-site [8]. Additionally, building several, allowing a steeper learning curve, leadsto a decrease in construction delays and capital cost per reactor. These traits aresupposed to increase the flexibility and ease mainly some of the financial concernsthat surround nuclear today. The reactors also aim to increase the safety of produc-ing nuclear energy by implementing passive safety features, as well as reducing therisk of proliferation of nuclear weapons [9]. The first serial-produced SMRs for civiluse are already operational on icebreakers in Russia [10]. In addition, the interestin SMR has grown over the last few years and many other designs are on their wayto being realised in the US, UK, Canada, and China [11].
1.2 Problem StatementThe EU is putting a lot of effort and faith in the coming age of hydrogen. Followingthis, the production of hydrogen also needs to shift from using traditional fossil fuelsas the primary source of energy, to a more sustainable source. The current consensusis seemingly centred on the expansion of RES for this application. But as mentioned,there is a gap between the large amounts needed and the strategy for supplying this
2

1. Introduction
demand. On the other hand, is the recent progress of SMR development in thenuclear industry that aims to mitigate some of the major downsides and concernswith the technology. Is it feasible, as well as competitive, to include nuclear into themix of low-carbon energy sources that can be used to produce sustainable hydrogen?Especially in dire times where more solutions are needed rather than fewer.
1.3 Collaboration with AFRYThe study was conducted together with and at the request of, AFRY - Energy &Power Division. The company has over 60 years of experience working with nuclearenergy and the surrounding areas. The company has experience executing nuclearenergy projects in over 35 countries together with energy companies, contractors,constructors, and authorities. They have expertise within all areas of the life cycleof conventional nuclear plants and within construction, upgrades, safety, and main-tenance.
Relating to this, small modular reactors is one of the latest areas in the field ofnuclear power where AFRY has a dedicated effort on SMR deployment and find-ing new applications for nuclear beyond electricity. AFRY is actively working withclients, cooperating with other companies and innovations and other developmentswithin SMR and nuclear beyond electricity are followed closely.
The other main theme, hydrogen, is not a new industry, and an area in which AFRYhas long experience working within. Hydrogen has been used for a long time butprimarily produced with and from fossil fuels. A growing business within this field isto instead use electrolysis, supplied with low-carbon energy. The primary interest forAFRY was to understand different applications for hydrogen in the future, potentialmethods for more sustainable production, and finally the possible connection toSMRs. Building further knowledge in these areas will be of interest to the company,to better understand where competence might be lacking and have to be developed.In addition, to better meet the future needs of their clients.
1.4 Purpose & Research QuestionsIn collaboration with Chalmers University of Technology and AFRY - Energy &Power Division, the study aimed to learn what use areas there are for hydrogen ina more sustainable future. Further more, what is required in terms of its produc-tion, and what methods exist to make it a competitive product compared with thealternatives?
Also, since much low-carbon hydrogen is needed in the near future; it investigatedunder which conditions nuclear, and more specifically small modular reactors, canbe a competitive way of generating the energy needed in its production.
3

1. Introduction
The synergy between hydrogen production and nuclear energy generation was in theend analysed and discussed. The work also addressed what foundations there are torealise this in a foreseeable future. The purpose of the thesis has been summarisedin the following four research questions and will be answered throughout the report:
1. What does the hydrogen value chain look like?2. What is an SMR and how does it differ from conventional nuclear power?3. Under what conditions can an SMR be a viable alternative for hydrogen pro-
duction?4. What are the major barriers for hydrogen produced by SMRs to become a real-
ity?
1.5 DemarcationsThe demarcations of this study are presented below. They are categorised based onthe three main topics examined in this report.
Hydrogen Demand• The study is not meant as an exhaustive compilation of all future and poten-
tial applications of hydrogen. Some of the more prominent ones not analysedin this study include hydrogen for producing cement and hydrogen for heatingresidential and commercial buildings.
Hydrogen Supply• The study only briefly examined the two most prominent ways of producing
carbon-rich hydrogen. These are steam methane reforming and coal gasi-fication. Only steam methane reforming was further analysed throughoutthe study. Other carbon-rich methods, such as producing hydrogen as a by-product from various industries, fell outside the scope of this study.
• In terms of low-carbon hydrogen production, the main focus was on electroly-sis. This means that new and/or innovative production methods such as pho-toelectrolysis, the usage of biological processes, or other, fell outside the scope.
• The study focused on the usage of the most prominent electrolysis techniques.These are alkaline electrolyser, proton exchange membrane and solid oxideelectrolyser. This means that new and innovative techniques, such as the an-ion exchange membrane, fell outside the scope.
• The study analysed the current and future development of the mentionedelectrolysis techniques. This means that the study did not investigate the pos-sibility of technically optimising these techniques.
4

1. Introduction
• In terms of hydrogen storage, the study focused on physical storage methods.This means that chemical storage, such as storing hydrogen in ammonia orvarious metal hybrids, fell outside the scope. It also means that the transportof chemically stored hydrogen fell outside the scope.
Nuclear Energy• In terms of nuclear energy, the main topic of the study was SMRs. This means
that hydrogen production utilising energy from large and conventional nuclearpower plants fell outside the scope of the study.
• The study analysed the current and future development of different SMR de-signs. This means that the study did not investigate optimising these designsor the nuclear technology used.
• As there are several other studies on the subject, the study did not focus onbarriers relating to the handling of radioactive waste. This means that thesupply chain surrounding the final storage of radioactive waste fell outside thescope of this study.
• The study focused on utilising SMRs for the sole purpose of hydrogen pro-duction. This means that other areas of application for SMRs fell outside thescope of this study.
1.6 Outline of thesisThis section aims to describe the content of each chapter in this report. The generaloutline of the study will be based on a 3S approach introduced by Canan Acar andIbrahim Dincer [12]. The 3S stands for service, system, and source. In this report,it will instead be renamed to demand, supply and energy source. The demand isin this case defined as different hydrogen applications. The supply is defined as thehydrogen supply chain, including production, storage, and transport of hydrogen.Lastly, the energy source is defined as the source of energy needed to produce hy-drogen. Because the scope of the study is hydrogen production combined with theuse of an SMR, the focus of the energy source will be on nuclear energy and SMRs.How the approach has been utilised can be read further in chapter 2.
Chapter 2 describes the research method. The general research approach has beento source literature and to interview experts on the subjects of hydrogen and SMR.The 3S approach has been used to find synergies of the utilisation of SMRs for hy-drogen production.
Chapter 3 describes the applications creating a hydrogen demand. This includes ex-isting hydrogen applications and potential future demands. The applications havemainly been divided into industrial applications and transportation applications.
5

1. Introduction
Chapter 4 describes the key components included in the hydrogen supply chain.This includes the main production methods of hydrogen, both those used today butalso the main low-carbon method proposed for the future. It also includes otherimportant factors, such as storage and transport of hydrogen, which are importantto consider when evaluating the competitiveness of the complete system, or the com-plete supply architecture.
Chapter 5 describes source of energy needed for hydrogen production. Because ofthe scope of the study, the source described in this chapter is nuclear energy andmore specifically SMRs. The general concept of SMR is explained as well as theeconomics, current development and key barriers that need to be overcome. Otherenergy sources have been analysed to some extent, to compare the complete SMRand hydrogen production system with alternative systems. These alternative sourceswill however be described in chapter 6.
Chapter 6 identifies synergies of SMRs that can have a positive effect on the hy-drogen demand and/or the supply. This means the identification of some majorfactors that can make an SMR competitive in terms of hydrogen production. Themain alternatives to produce low-carbon hydrogen are also analysed using SWOTanalysis. This has been done to compare what an SMR does well in comparisonwith other sources and their respective hydrogen supply architectures.
Chapter 7 evaluates the competitiveness of the SMR and hydrogen alternative incomparison to other low-carbon production methods under a set of assumptions.The assumptions do not mirror every individual case but rather reflect under whatgeneral conditions an SMR can become a competitive alternative.
Chapter 8 is a discussion on hydrogen, SMR, and the combination of the two. Itdiscusses the general development of hydrogen demand for industrial and transporta-tion applications, as well as identifying some key needs and requirements for them.Next, the general development of SMRs and the main existing barriers needed to besolved for the concept to become fully realised is discussed. Lastly, the combinationof the two topics is discussed. It outlines in which way the supply, as well as how thiscan bring positive effects towards the hydrogen demand. It also discusses in whichway the hydrogen market can help the concept of SMRs overcoming its individualbarriers. Finally, a discussion on the overall results and the research approach ispresented, as well as a general discussion on ethical considerations regarding thestudy and its topics.
Chapter 9 concludes the study as well as highlights areas that could be of interestfor future studies.
In the appendix, an electrolyser benchmark and an SMR benchmark can be viewed.
6

2Research Approach
This chapter outlines the research approach used to answer the research questions.First, an overview of the research approach is given, followed by more detaileddescriptions of the stages and how they were used to answer the research questions.
2.1 Overall Research ApproachThe overall research design for this thesis is visualized in an overview below. It isdivided into method stages as well as what the methods are intended to be used for.The research method is inspired by the book The Good Research Guide (2014) byMartyn Denscombe [13], which served as practical guidance in the execution of thedifferent stages.
A literature study and an interview study were chosen to be the primary tools forgathering information. The literature study answered the two first overall questionsposed in the study, while the interview study served to confirm these findings, as wellas to provide more nuanced information in form of future predictions and opinions.In the synthesis the third and fourth question was answered.
1. Literature study(a) Find hydrogen applications with needs and requirements for competitive-
ness.(b) Find and research main components in the hydrogen supply chain. Cur-
rent status and future trends.(c) Define and clarify the concept of SMRs, functionality, current develop-
ment, barriers to deployment, and how they differ from conventional nu-clear power.
2. Interview study(a) Confirm and clarify findings from the literature study.(b) Gather additional information in the form of challenges, opportunities,
projections, and opinions.3. Data synthesis and analysis
(a) Identify synergies between hydrogen supply and SMRs.(b) Consider under what conditions hydrogen production with the help of an
SMR is competitive.(c) Compare competitiveness with the most recognised low-carbon hydrogen
supply architectures.(d) Use the result and findings from interviews to discuss the future of SMR
and hydrogen production.
7
2. Research Approach
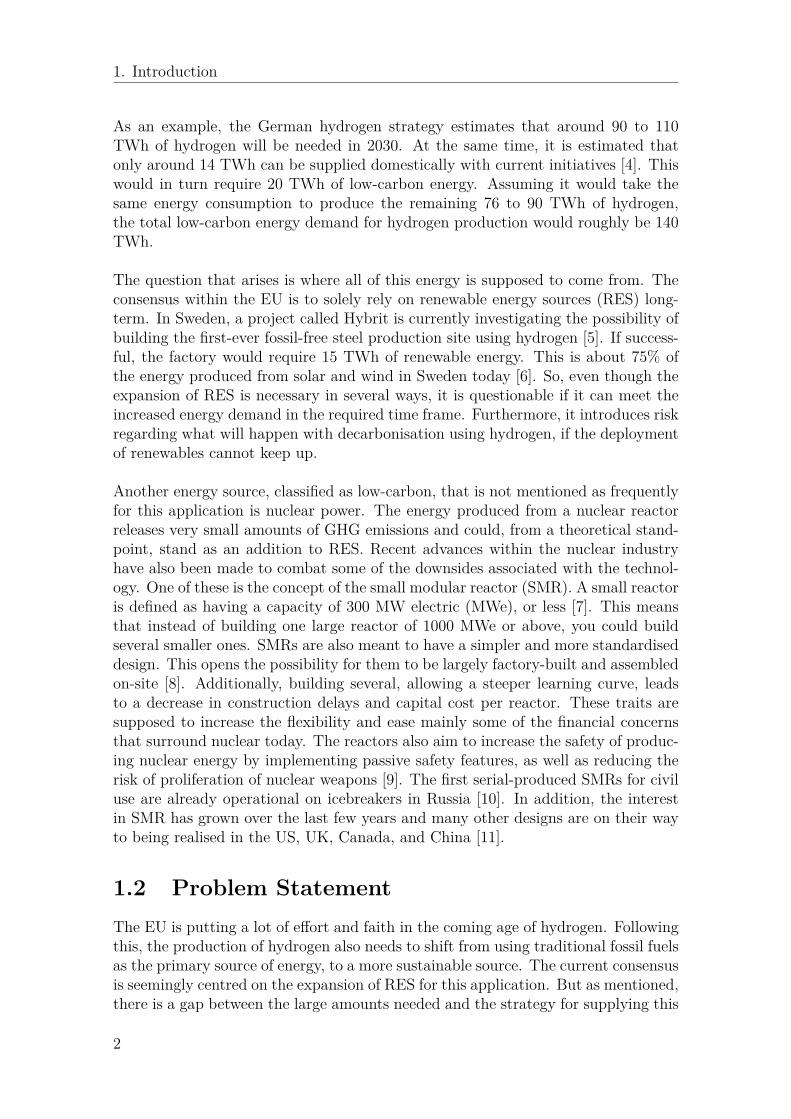
2.2 Literature StudyThe literature study was focused on three main areas; hydrogen demand, hydrogensupply and SMRs. Regarding the topic of hydrogen demand, the intention was tofind current and future applications for the energy-carrier and how it can benefitdifferent sectors such as industry and transportation. Similarly, information on cur-rent supply, including production methods and distribution networks was pursued,both current and future supply scenarios. Finally, information on SMRs and thematurity of the technology was a part of the literature study. The focus was onthe characteristics and commercialization of SMRs as well as the technical featuresrelating to the production of hydrogen.
To perform the literature search in a systematic way a methodology adopted fromDenscombe was followed [13]. First, the scope of the study was decided. Then,the search itself was conducted. To gain the necessary information several sourcesof documentary data were used, including scientific journals, articles, and books.The databases which was used were Chalmers Library, Scopus, and Google Scholar.The search were divided in the three main categories (demand, supply, and SMR).Examples of keywords that were used in the search can be seen in table 2.1.
Table 2.1: A selection of keywords used in the initial literature search
Hydrogen Demand Hydrogen Supply Small Modular ReactorHydrogen Application
Hydrogen UseHybrit
Steel ProcessingAmmonia
Aviation HydrogenHydrogen FuelFuel Cell Cars
Hydrogen ProductionElectrolysisAlkalinePEMSOEC
Hydrogen StorageHydrogen Transport
LCOH
Small Modular ReactorSMR ConceptSMR Designs
SMR EconomicsNuclear LCOE
Nuclear Hydrogen Production
To find further information, sources that are within the scope and referenced intexts found was also pursued. An example of this is the "International Journalof hydrogen energy", where several hydrogen articles were found. On the topic ofSMR, AFRY also aided by providing several sources containing relevant informa-tion. Other sources of information were also required, including governmental data,official statistics and company websites. The sources found were continuously cate-gorized and saved.
Secondly, the quality of the information was evaluated and sources were screened forrelevance [13]. Certain criteria were used to limit the possible sources and to ensuretheir quality and relevance. A checklist adopted from Denscombe was used to ensurethe credibility of the sourced documents [13]. The basic screening questions werefor example; has the credibility of the source/author/sponsorship been considered,have website sources been evaluated in terms of their accuracy and how recently
8

2. Research Approach
they have been updated, and is possible bias taken into account. An example isinformation regarding current and future status. Here a search filter has been usedto exclude sources not published within the period of 2015 to 2021.
Primarily, the literature study answered the first and second research questions. Thegoal was to provide an output that details hydrogen applications, key componentsin the hydrogen supply chain and outlines the basic principles of SMRs. The infor-mation found was used as input to the interview study, and was also confirmed bythe interview study which will be detailed next. Finally, the information acted as aninput to answer the third and fourth research questions in the synthesis of the study.
After the interview study, new information and areas discovered meant the literaturestudy had to be revisited. For example, several experts provided different types ofliterature which had to be further investigated. This was done using the samemethod as described in this section.
2.3 Interview StudyThe subject of SMR and hydrogen can be considered a capital-intensive and nichemarket and is therefore quite narrow. There are several key and complex variablesacross different areas that all play an important role when investigating the area.It was therefore determined that a interview study was suitable for the thesis. Theinterview study was used for three purposes with an emphasis on the final two, theseare:
• First, certain information was confirmed. In the study, this was mainly interms of requirements for the hydrogen applications and production methods.
• Second, the interview study clarified certain information that was touchedupon in the literature study. As an example, certain functionality regardinghydrogen production methods or SMRs were explained further. Also, clarifi-cations were given on how hydrogen is used in different processes. In otherwords, topics that were unclear or hard to explain by only sourcing it fromliterature.
• Third, the interview study provided additional information that is hard tocome by when only sourcing literature. This was meant to enable developingthoughts around subjects such as challenges, opportunities, projections, andopinions.
To achieve these points, the main method was to perform semi-structured inter-views. This means that certain questions were asked to confirm already knowninformation, and to some extent clarify or expand on it. The main purpose of per-forming interviews in this study however, was to better grasp the complexity of thetopics, and the potential connection between them. For this, the interview had tobe unstructured to allow the interviewee to speak their mind [13].
9

2. Research Approach
The information gathered in the literature study served as a basis for structuringthe interviews to confirm rather clear and brief information statements. In addition,it was used to understand the explanatory thoughts of the interviewee.
In addition to helping structure the interviews, the input from the literature studywas utilised in sampling interviewees. A non-probability sample of participants wasnecessary for the study. The objective of the study was to explore two complextopics, meaning individuals who have key information regarding them were neces-sary to achieve that. Theoretical sampling was also utilised, meaning that as moreprimary and secondary data was revealed, additional participants were identified.This further lead to a form of snowball sampling where participants recommend orrecruit further participants that they feel are relevant to the investigated topic. Thiswas performed to some degree, but mainly the participants recommended additionalliterature to source, instead of actual people. This continued until a data saturationpoint was reached. Another source for sampling was webinars and online confer-ences. Although the information provided during webinars were rather general, theparticipants were individuals with deep knowledge and connection to the relevantindustries.
The interview subjects has been categorised under two main areas, one with a focuson nuclear energy and one on hydrogen, and can be viewed in table 2.2. However,some crossover between the areas exists in the interviews. The interviewees will bereferenced by their assigned letter for the continuation of the report.
Table 2.2: Interview subjects
Area Interviewee Subject Role Sector and Country
A Policy, Licensing, Financing Lawyer, Advisor inthe area of energy Energy, US
B Licensing, Financing,Hydrogen Researcher Nuclear, UK
C SMR, Economics, Licensing Researcher, Professorin Reactor Physics Nuclear, Sweden
D SMR, Safety, Licensing Safety Consultant,MSc Nuclear Engineering Nuclear, SwedenNuclear
Energy
E Licensing, Policy, Hydrogen Political Advisor,PhD Reactor Physics Energy, Sweden
F Steel industry, Storage,Hydrogen market
Head of R&D atenergy company Energy, Sweden
G Steel industry Senior Process Engineer Metals and mining,Sweden
H Process industry,Refining Consultant/Manager Process Industry, Refining,
Sweden
I Electrolysis, Fuel cells Associate Professor Fuel Cells, Electrolysis,Sweden
J Economics, Policy Consultant/Manager Hydrogen,UK
K Carbon capture & storage Research Engineer Carbon capture & storage,Sweden/Norway
Hydrogen
L Biorefining Senior Process Engineer Biorefinery,Sweden
10

2. Research Approach
The interviews were recorded and transcribed. The analysis of the data was donethrough organising it under main topics. Each transcription was analysed and im-portant parts were highlighted. The findings helped connect different hydrogenproduction methods and their dependencies, and was utilised in the data synthesispart. This, in turn, helped to answer research questions three and four, as well asconfirming and clarifying research questions one and two.
2.4 Synthesis and analysisThe main objective in the synthesis and analysis was to connect the informationfrom the literature study and the interview study. This was done for each of thetopics of this study, hydrogen, and SMR. As mentioned in section 1.6, the approachwas inspired and adapted from the 3S approach introduced by Canan Acar andIbrahim Dincer [12]. In their article "Review and evaluation of hydrogen productionoptions for better environment", the 3S stands for service, system and source. Inthis report, this has been translated into demand, supply and energy source. Theapproach is illustrated in figure 2.1.
Figure 2.1: The research approach illustrated in this study.
The demand was analysed first to find what general needs and requirements the hy-drogen demand put on production. This entails what is demanded by the productionof hydrogen for it to become competitive in various applications. As stated, theseare general needs and requirements such as amount, price, production rate, andlocation. These could be uniformly illustrated for all the applications researchedin this study. For individual and more comprehensive requirement specifications,every application would have to be analysed in detail. The applications were alsoanalysed to discuss their future potential.
The supply contains analyses of the current and future supply chain surroundinghydrogen. The areas touched upon are not a generic supply chain that works inevery case but rather supply chain parameters that can build a particular supplyarchitecture. Depending on which source of energy is being proposed, different sup-ply architectures were created to fulfil the requirements expressed from the demand.All the different options in regards to supply have not been covered. Instead, the
11

2. Research Approach
study has focused on those most discussed in the literature and during interviews.The hydrogen supply was analysed to find uncertainties and/or synergies where thestrengths of an SMR could contribute towards, or make a case for, a competitivehydrogen supply chain. The demand part and supply part together answers researchquestion one.
The energy source can contain a number of different energy source alternatives suchas renewables, natural gas, and nuclear energy. Since this study focused on findingopportunities for the utilisation of an SMR, this is what has been analysed. It hasfocused on researching the general concept of an SMR and what strengths nuclearenergy has in comparison to other sources. This was done to find opportunities forcreating a competitive supply architecture. It was also analysed at what stage theconcept is in development and what barriers might exist. This was used to discussthe future of utilising an SMR for the purpose of hydrogen production. The energysource part answers research question two.
As mentioned, the choice of energy source affects the final supply architecture. Thiscan in turn play a part in whether the needs expressed by the applications can befulfilled. Therefore, the final part of the study included how the strengths of utilisingan SMR as a source can have beneficial synergies for the demand and supply ofhydrogen. Together, the energy source and the supply create a supply architecture.Except for a supply architecture utilising an SMR, two main alternative low-carbonsupply architectures were also analysed using SWOT analysis. This was done tocompare a potential SMR and hydrogen supply architecture with the two mostrecognised low-carbon hydrogen supply architectures. They were compared in termsof production cost and the final delivered cost (accounting for the total cost of thesupply). Finally, the two topics were discussed with the help of the result of theanalysis and information gathered from interviews. The analysis of the completeoverview (demand, supply and source) and the discussion regarding the two maintopics answers research questions three and four.
12
3Hydrogen Demand
Hydrogen is already used in many applications with the current demand being dom-inated by use in oil refining and production of ammonia. About 33% of hydrogenproduced globally is used in refineries, over 27% is used for synthesizing ammonia,methanol production is using 10%, and some 6% is used by other industries [14].
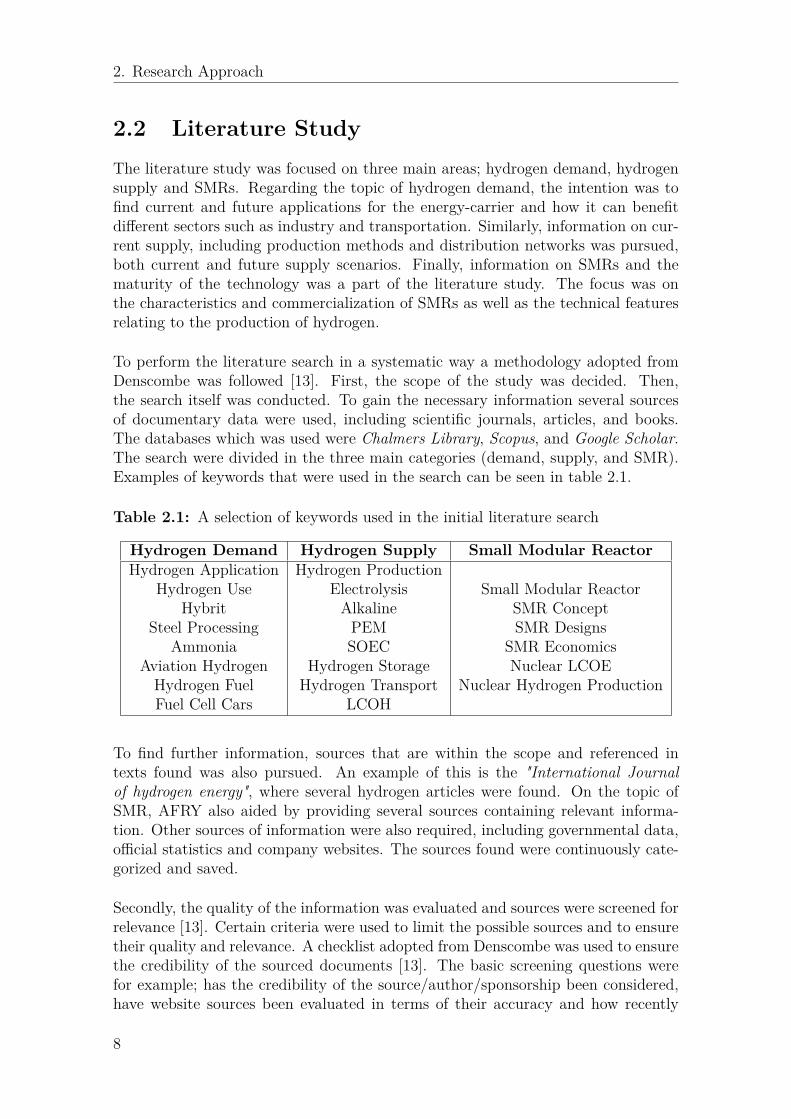
The use of hydrogen in all sectors is predicted to increase. One report, initiatedby the EU commission, envisioned that hydrogen could provide up to 24%, or upto 2250 TWh, of the total energy demand in the EU by 2050 [15]. This chapterdescribe the demand part from the overall structure, as illustrated in figure 3.1.This includes some of the many current, as well as future, applications of hydrogen.By describing these, the potentially massive demand for hydrogen in the future isillustrated, as well as what is required for hydrogen to become competitive withother substitutes.
Figure 3.1: The chapter describes the demand part of the overall structure.
3.1 Industrial ApplicationsGlobal hydrogen use today is dominated by industrial applications, over 90% ofhydrogen consumed today is used as an industrial feedstock. It is utilised in oilrefining, ammonia (NH3) production, and methanol (CH3OH) production. Exceptfor the applications mentioned above, many future applications could also becomelarge consumers of hydrogen. These applications include using hydrogen in energy-intensive industries where high-grade heat is required, such as in the steel industry.This could prove to be a more efficient route to decarbonization than electrification[16].
Much of the current demand for hydrogen relies on fossil energy sources and willmost likely have to reduce their emissions. Experts, including interviewee A, D, E,and J, therefore predict that the largest demand for low-carbon hydrogen will be inindustrial applications in the forthcoming years. In these applications, the demand
13

3. Hydrogen Demand
is certain and predictable. Interviewee F, G, and J further predict that demand fromthe steel industry will increase with the many investments and projects currentlyplanned and in progress. In the following sections, hydrogen demand from industrialapplications will be outlined. Oil-refining was not a part of the study due to itsconnection to fossil fuels and the focus being on future applications.
3.1.1 Ammonia ProductionToday, the second-largest demand for hydrogen arises from the production of am-monia at 31 MtH2/yr [17]. Ammonia is produced by combining H2 and N2 throughthe Haber-Bosch process at about 250 - 350 bar and at a temperature of 450-550°C [14]. Out of the total demand for ammonia, over 80% of the ammonia producedis used in fertilisers such as urea and ammonium nitrate [14, 17]. The remainder isused for explosives, synthetic materials, and other speciality materials. Again, mostof the hydrogen today is produced using fossil sources of energy, with the produc-tion of ammonia emitting about 2.5 tonnes of CO2 per tonne ammonia [18]. Theproduction of ammonia stands for 1-2% of global energy consumption [19] and todecarbonize this sector could provide large environmental benefits. Ammonia couldalso be used in many other applications than the ones mentioned above. For ex-ample, it could help to decarbonize sectors like aviation and shipping in the future,something that was stated by interviewees B and J.
Combining hydrogen and nitrogen to create ammonia solves some of the challengeshydrogen faces as an energy carrier and fuel in the applications mentioned above.Interviewee J explained how converting it implies a cost in energy, but opens up foreasier storage and more applications. Ammonia is in liquid form much closer to at-mospheric pressure, and stores almost twice as much energy compared to hydrogen,easing storage and transportation issues [3]. Ammonia can also be burned in shipengines with little modifications, and be used to power long-distance transport suchas heavy trucks and trains [3].
Demand for ammonia in existing applications is predicted to increase by 1.7% peryear up to 2030, and then continue to rise. If ammonia is established as an energycarrier and used as a fuel in its own right, the increase in demand could be muchlarger and the industry could have a role similar to oil refineries today [17]. Oneinitiative to improve the sustainability of the production process comes from theworld’s largest ammonia producer, YARA. The company is assessing the feasibilityof using hydrogen produced by electrolysis in their operations [20].
The main challenges with producing ammonia, and doing it sustainably, is the ex-treme pressure and temperature required for the Haber-Bosch process. Extensiveresearch in the sustainable synthesis of ammonia has been performed without suc-cessfully finding a low pressure and low-temperature process [19].
14

3. Hydrogen Demand
In 2030 it is estimated that the demand for hydrogen to produce ammonia will be37 MtH2/yr [17]. The price of hydrogen at which ammonia could be competitive asan end fuel product, is calculated to be between 0.90-1.50 $/kgH2 [3, 18].
3.1.2 Methanol ProductionMethanol is another chemical, made from hydrogen, which is used for a diverserange of industrial applications and predicted by experts, including interviewees B,J, and L, to play a large part in future demand. End products include adhesives,plastics, and as a component in fuels [18]. Similar to ammonia, low-carbon methanolis also predicted to play a large part in the decarbonization efforts of hard-to-abatesectors such as transport and industry, and as an energy carrier as it is easy to storeand transport [21]. Methanol can be used directly in internal combustion engineswith only small modifications or could be blended with diesel or gasoline to reduceemissions [14]. Methanol production is the third-largest consumer of hydrogen, us-ing more than 12 MtH2/yr [17]. The production of methanol mainly relies on thehydrogenation of carbon dioxide (CO2) at a pressure of 50-100 bar and at a tem-perature of 250°C [21].
To produce methanol from hydrogen, a source of CO2 must be added. The CO2can come from direct air capture, or carbon-capturing from industrial plants [18].Depending on the way the CO2 feedstock is acquired and on the use of the methanol,carbon sequestration varies [18]. The release of carbon when methanol is used as afuel for combustion is a challenge. Another challenge lies in using a hydrogenationreaction to produce methanol, which require a lot of energy [21].
One initiative in using hydrogen as feedstock to produce methanol is in Icelandat Carbon Recycling International´s George Olah plant. Hydrogen produced fromelectrolysis and CO2 captured from a power plant is used to produce 4000 tonnes ofmethanol per year and recycle 5500 tonnes of CO2 in the process [16].
The demand for methanol from existing applications is predicted to increase by 3.6% per year up to 2030, up to a demand of 19 MtH2/yr. A larger increase in de-mand is to be expected if methanol is established as an energy carrier or as a fuel[17]. The price at which low-carbon hydrogen for methanol production can competewith fossil sources is 0.80-1.50 $/kgH2 [18]. This estimation is dependant on manyfactors, region and carbon price being two.
3.1.3 Metallurgical IndustryIn the metallurgical industry, hydrogen can be used as a reducing agent, for metalalloying, and the production of carbon steels. The method to produce steel fromiron ore using hydrogen is called DRI and is the fourth-largest source of hydrogendemand today [17]. Low-carbon hydrogen is expected to replace fossil feedstockin steel manufacturing, where coke is the traditional feedstock [14]. Interviewee G
15
3. Hydrogen Demand
explains how most large steel manufacturers in Europe include DRI in their futureroadmaps aiming to reach the Paris agreement. Reducing iron ore with low-carbonhydrogen instead offers a huge potential to reduce GHG emissions in the carbon-intensive steel production [14]. Today, steel production is one of the largest emittersof CO2 accounting for about 7-9 % of global emissions [18]. Producing one tonne ofsteel results in direct emissions of 1.4 tonnes CO2.
Interviewees F and G outlined the process of using DRI with hydrogen and whatrequirements are implied on the supply of hydrogen in the process. About 600-700cubic meters of hydrogen is needed per metric tonne of DRI. The gas circulatesin the reactor and system but is continuously consumed in the process of reducingoxygen from the iron ore. The gas will also have to be heated to a temperatureof around 900-1000°C, depending on the design parameters. The requirements ofthe hydrogen supply is further that it can be supplied continuously, since a steelplant operates at least 8000 hours per year and has low flexibility in varying theproduction. Interviewee G further explained that the large volumes, high energydemand of around 3.5 MWh/tonne, and price-competitive market imply a certainsensitivity to price.
There are many initiatives around the world to reduce emissions from steelmak-ing and implement a more sustainable alternative utilizing hydrogen. One exampleis HYBRIT, a collaborative effort between SSAB, LKAB, and Vattenfall [22]. In2030, LKAB expects to be able to produce 2.7 million tonnes of DRI per year [23].HYBRIT estimates that the energy demand of the process will be 3.5 MWh/tonnecrude steel [22]. The cost of the finished steel is estimated to be 20-30% higher com-pared to conventional methods [24, 25]. Interviewee F confirmed that this numberwas from the beginning of the project in 2018, and primarily depended on threefactors. The factors highlighted were the price of coking coal, the price of emittingcarbon, and the price of electricity. One additional important factor emphasisedby interviewee G, is that the concept and end-product are estimated to be moreattractive in the future due to the higher cost of emitting CO2, and an increase indemand for more sustainable products [25]. Finally, with insight into the project ofHYBRIT, interviewee F talks about the challenges in the project. One of these chal-lenges, or uncertainties, is the large-scale transport of hydrogen where the final costis still not known. The transport of hydrogen, as well as the storage solution, is dueto be tested in different pilot-project during the coming years. Other than HYBRIT,European steel making companies such as Voestalpine, Liberty steel, and Salzgitter,are all investing in hydrogen direct reduction as a future alternative [24, 26].
One of the challenges to driving a sustainable transition in the steel industry hasbeen that heavy industry sectors (such as steel) often work in a business-to-businessmarket [24]. End-customer preferences for sustainability have thus been left out infavour of cost and availability as key business-drivers.
16
3. Hydrogen Demand
The Hydrogen Council, a consortium of over 100 leading companies with an interestin hydrogen, calculates that to reach a lower cost than conventional blast furnacescoupled with carbon capture and storage technology (CCS), a hydrogen cost of1.20-2.30 $/kgH2 is required, depending on region. Further more, according to theInternational Energy Agency (IEA), to compete with natural gas coupled with CCSa hydrogen cost of 0.7-2.0 $/kgH2 is required [17]. The demand for hydrogen usedin steel production is estimated to 8 MtH2/yr in 2030 [17].
3.2 Transportation ApplicationsRegarding the area of transportation there are many prospects of the use of hydrogenin the future, but already today there are hydrogen vehicles in operation and havebeen for some time. Applications range from cars, busses, and trains driven byelectricity generated from hydrogen in fuel cells to applications in aviation andshipping. The consensus among experts in the area, is that hydrogen will be themost beneficial alternative for longer ranges and applications, such as long-haultrucks, busses, and trains. As previously stated interviewees B, D, I, and J predictthat current industrial applications will be the first adopters of low-carbon hydrogen.With cars, trucks, busses, trains, ships, and aviation following in the years anddecades after. Important to remember is that the applications within transportwill play an important role, especially in hard-to-abate sectors such as aviation andshipping, discussed below.
3.2.1 Fuel Cell Electric Vehicles (FCEV)Cars driven by electric motors have seen a growing popularity in the latest years.The energy for the electric motors can be supplied from different sources, either frombatteries or from fuel cells utilising hydrogen to generate electricity. Many large carmanufacturers are currently developing and even selling hydrogen vehicles includingHyundai, Honda, and Toyota [27].
Electric hydrogen vehicles utilise a fuel cell stack as their energy source. A hydro-gen fuel cell is an electro-chemical device that transforms the chemical energy inhydrogen to electricity driving the electric motor [28]. Fuel cells are categorised af-ter the electrolyte they use, with the most common one being the proton exchangemembrane (PEM) fuel cell. It utilises a solid polymer as the electrolyte and porouscarbon electrodes containing platinum as the catalyst [28]. The reason PEM fuelcells are preferred in transportation applications is their short start-up time, lowoperating temperatures (60-80 °C), system robustness, and high power density [29].Except for the energy in the form of electricity, only water and heat are generatedin the fuel cell [28].
The Hydrogen Council, sees great potential in FCEVs. In a report, the council pre-dicts that by 2030, 1 in 12 cars in prominent regions such as Germany, South Korea,and California will be powered by hydrogen. In 2050, they predict an increase to25% globally or about 400 million passenger vehicles to be powered by hydrogen
17
3. Hydrogen Demand
[16]. As mentioned, many car manufacturers believe in the future of the fuel cellelectric vehicle. Today, several models are available such as the Toyota Mirai, theHyundai NEXO, and the Honda Clarity [14].
The benefits of no tailpipe emissions for FCEVs is obvious, but FCEVs can also ben-efit from a higher efficiency than the conventional internal combustion engine (ICE)[28]. This, the lower running cost, together with a lower maintenance cost becauseof fewer moving parts makes FCEVs competitive with conventional ICE vehicles[14]. FCEVs have also proven to have some unique benefits relative to their closestcompetitor, the battery-powered electric vehicle (BEV). The high energy density ofhydrogen provides FCEVs to drive for a long range [28]. To give a competitive rangeof 500 kilometers, around 5 kg of hydrogen needs to be stored under high pressure(around 700 bar) in the tank of a car [30]. The tank to store hydrogen could also bemanufactured at a lower cost than if compared to a battery [28]. Finally, a vehiclewith a hydrogen tank allows for fast refueling, comparable to filling a gasoline ordiesel vehicle [14].
Two of the main challenges FCEVs faces are regarding the refuelling infrastructureand the competition against other technologies, such as BEVs. Regarding the refu-elling infrastructure, there will be little incentive for customers to buy a FCEV untila refuelling station network has been established. On the other hand, it will not becommercially viable to construct a network until enough FCEVs exist on the road[14]. This is one of the reasons interviewee I believes that the industrial applicationswill have to lead the way, to then allow more decentralized demands to benefit fromthe already built infrastructure. Further challenges exist in that hydrogen cannotuse existing distribution networks for liquid fuels, meaning large investments at highrisk will be required [14]. This is driven by the requirement for refuelling stationsto be placed close to main roads and in a decentralized structure to reach a largeshare of consumers.
Regarding BEVs, the rather high cost of the fuel cell as well as the higher efficiencyof the BEV are the main challenges. The efficiency of a BEV can be around 60%"well-to-wheel", while FCEV reach around 30% [16]. This leads to the BEV being amore competitive option for short to medium range applications [18].
In a report by the Hydrogen Council [18], in collaboration with the consultancycompany McKinsey & Company, the cost that different hydrogen applications needto reach to be competitive was analysed. It was concluded that the hydrogen option,when compared to BEVs and ICE vehicles, is predicted to first become competitivein applications where long range is needed (500km+) [18]. This could be large familySUVs or larger vehicles for commercial use such as taxi fleets. This view was sharedby interviewees I and J, who believes that FCEVs will be competitive only in certaindemand patterns. The report suggests these applications could be competitive assoon as between 2025-2030 [18].
18

3. Hydrogen Demand
In conclusion, FCEVs have benefits in allowing for long range, quick refueling timesand being price competitive with conventional ICE vehicles. The main challengesexist in establishing a refuelling network, and in competing with BEVs, which ben-efits from higher efficiency. The potential demand could be significant, but is alsohighly uncertain and depends heavily on the development of competing alternatives.
3.2.2 Internal Combustion Engines (ICE)In addition to utilizing fuel cells to generate power, hydrogen can also be burned di-rectly in a combustion engine. This was how some of the first ICE were powered over200 years ago [17]. The development has come a long way since then, and today’s H2internal combustion engines (H2ICE) can reach increasingly high efficiencies, keepemissions well below regulations, and reach satisfactory power outputs [14].
Using hydrogen in ICEs opens up many advantages. The vast production infrastruc-ture and the mature industry surrounding ICEs are examples. Also, ICEs providefuel flexibility, provided the engine control is suitably adapted [31]. "Flex-fuel" ve-hicles could ease the transition from fossil fuels to hydrogen and allow the refuellingnetwork to be built over this period of transition [31]. Further advantages of utilizingH2ICEs in vehicles is their tolerance to lower hydrogen purity, leading to cheaperfuel [31]. Finally, they could be introduced relatively easily, with a possibility ofretrofitting engines, and the technology does not rely on any rare materials [31].Both FCEVs and BEVs require a ramp-up of production of scarce materials, whichhas proven difficult. Which gives H2ICEs an advantage [31].
Between the years 2000-2010, several concept cars were developed by various auto-motive manufacturers. Many were adopted from previous models to run on hydro-gen, with the BMW H2 7 being the most well-known, produced in 100 units between2005-2007 [14]. Due to some major challenges of H2ICEs, further commercialisationhas not been pursued. Research has continued, with a focus on advancing the ma-turity of hydrogen engines.
The challenges include the difficulty to make ICEs running on hydrogen both ef-ficient, adequately powerful, and durable at the same time [31]. Also, the enginecharacteristics put demands on the onboard storage of hydrogen. The infrastructurerequired is, as in the case of FCEVs, a principal challenge. Instead, many researchersbelieve that using hydrogen to chemically create a liquid fuel. That is both easierto store and distribute is the way forward, and is what should be researched [31].
Another way hydrogen ends up as a part of the supply chain of fuels is when pro-ducing renewable fuels, such as bio-diesel. Interviewee H explained that in refining,hydrogen is used in the hydrogenation of renewable fuels to bind to, and get rid ofoxygen. An increased amount of hydrogen is required when refining renewable fuelsin comparison to refining conventional fuels. Interviewee H gave an example of alarge project on the west coast of Sweden where Preem will produce 700 000 tonnesof renewable fuels per year.
19
3. Hydrogen Demand
3.2.3 Buses, Trucks, and TrainsAs explained earlier, utilising hydrogen in fuel cells for powering vehicles can comewith several benefits. It allows for a simple system with relatively low weight, al-lows for long range, and also for fast refuelling. These characteristics prove to beeven more advantageous when applied to means of transportation that operate overlonger distances and more continuously [16]. With FCEVs facing increased compe-tition from BEVs, the focus in FCEV development has shifted towards heavy-dutyapplications. Where a central refuelling structure infrastructure can be utilised, andwhere the high energy density introduces less weight than BEVs [14]. These char-acteristics highlight the promising potential of fuel cell-powered buses, trucks, andtrains in the future [32][33]. This view is shared by experts in the field, includinginterviewees B, I, and J.
In a cost analysis by the Hydrogen Council, it was concluded that hydrogen busesand trucks are the most cost-efficient way to decarbonize the respective segmentsin the short to medium term [18]. This view seems to be shared when also look-ing at the automotive industry. Where several manufacturers are developing fuelcell trucks, including Toyota, Daimler, Volvo, Hyundai, and Nikola Motor Company[34, 35, 36, 37]. Fuel cell buses have been in use for some time and have a greatadvantage in that they reduce emissions locally in city centres. This advantage cre-ates and even bigger opportunity for both buses and trucks when diesel engines areplanned to be banned in many city centres for several countries [14].
Regarding trains, there are examples of companies already operating hydrogen-powered trains. One example is Alstom in Germany, whom has developed hydrogenrunning trains that can reach speeds of around 140 km/h and ranges of up to 1000km, sufficient for an entire day [14]. Further, many countries and companies are in-vesting in a future with hydrogen trains, including Vivarail in UK, Inlandsbanan inSweden, Pesa Bydgoszcz SA in Poland, and Stadler Rail Group (Switzerland) sup-plying California with hydrogen trains [14]. According to present plans in Franceand the UK, diesel trains will be replaced by fuel cell trains by 2035 and 2040 respec-tively [38]. Trains powered by hydrogen fuel cells are best suited for longer routes,not already electrified, and with short downtimes allowing little time for charging.Interviewee I highlights examples of train routes in northern Norway where hydro-gen trains are the best potentially fossil-free option. Routes that have a relativelylow frequency of operation is also especially well suited for hydrogen trains [18].
Fuel cell trucks, busses, and trains face some of the same problems as fuel cell cars.For example, the challenge of infrastructure for refuelling. But these applicationshave an advantage in allowing for a more centralized infrastructure, with long rangesand defined routes [39]. As an example, some estimates that only 350 refuelling sta-tions could cover the whole United States [39]. Nikola Motors (together with Shell,Air Liquide, Hyundai, NEL, and Toyota) further plan to build their infrastructurewith 700 stations, which they will allow rivals to use, by 2028 [38]. The cost of fuelcells and hydrogen storage system is also a challenge. But prices are predicted todrop in the coming years [14, 38].
20
3. Hydrogen Demand
Regarding the cost perspective, reports show that hydrogen buses can out-competebattery-powered buses when the range exceeds 400km [18]. In these applications, along range decrease down-time and thereby reducing cost. When it comes to totalcost of ownership (TCO), fuel contributes up to 25% and will be the largest oppor-tunity to reduce the total cost [18]. It was calculated that a price of 4-5 $/kgH2was required to reach cost parity [18]. Similarly, regarding trucks, fuel costs are asignificant part of the TCO of up to 60% [18]. In 2030, at 4-5 $/kgH2, medium andlong-range fuel cell trucks could become a more competitive alternative to BEVs andICEs [18]. Finally, fuel cell trains are already today more competitive than electrictrains over longer distances and for low-frequency routes [18].
3.2.4 AviationIn a report by Fuel Cells and Hydrogen Joint Undertaking (FCHJU), backed bythe European Commission, the potential of hydrogen propulsion in aviation wasassessed [40]. The conclusion of the report states that "hydrogen propulsion has thepotential to be a major part of the future propulsion technology mix", but that "itwill require significant research and development, investments, and accompanyingregulation" [40]. There are several options to power an airplane with hydrogen. Itcould either be used directly for combustion, in fuel cells, or in the production ofsynthetic or bio-fuels [18, 41]. With regards to climate impact, using hydrogen forcombustion could reduce the impact by 50-75%. For the usage of fuel cells or inthe production of fuels these numbers stand at 75-90% and 30-60% respectively [40].
Aircraft utilising hydrogen for propulsion are most competitive for short-range andmedium-range routes, including regional and commuter aircraft [18, 40]. Long-rangeaircraft would require new designs, such as increasing the airframe length to accom-modate fuel tanks, if they are to run on hydrogen [40]. For larger aircrafts themost realistic option is to replace the fossil fuels used to produce jet-fuel kerosenewith synthetic alternatives that have been produced using hydrogen [18]. One man-ufacturer aiming to develop hydrogen aircraft is Airbus, with concepts for short-,medium- and long-range [42].
Hydrogen in aviation faces much of the same problems as other applications, suchas lack of infrastructure and storage issues [41]. Another challenge lies in the de-velopment of the design and layout of the aircraft itself. Increasing power density,reducing cost, and extending the lifetime of fuel cells are pointed out as importantfactors for the future [41].
Regarding cost competitiveness of the fuel, the Hydrogen Council estimates synfuelcould become cost-competitive with bio-kerosene in 2030 [18]. Given a bio-fuel costof 1.50 $/liter, hydrogen must reach a cost of 2.70 $/kgH2 [18]. FCHJU estimatesthat in 2050, aviation’s demand for liquid hydrogen could grow to 40 million tonnesa year [40].
21
3. Hydrogen Demand
3.2.5 Maritime ApplicationsAs a whole, the international shipping and maritime sector stands for 2.5% of globalcarbon emissions [18, 17]. According to current trends, international shipping isfurther expected to more than triple by 2050 [17]. The sector is reliant on heavyoil fuels and affects the air quality around ports. Hydrogen is seen as the leadingoption for tackling these issues and decarbonizing this sector [17]. Ships poweredby fuel cells are most relevant for passenger ships. Bringing positive benefits suchas decreasing local emissions, and reduces both water pollution and noise [16]. Inlarger-scale operations, such as international shipping, hydrogen-based fuels suchas ammonia, are believed to be the best option, with many research projects anddemonstration projects ongoing [17, 43]. Ammonia has a higher energy density thanfor example liquid hydrogen and current engines could be modified for the usage ofthis fuel. Availability and cost of bio-fuels are also uncertain, since the demand forbiomass is expecting to grow in other sectors as well and there is a limited supply [17].
Several companies and countries see the potential of utilising hydrogen as a fuelfor shipping in the future. Projects are underway in Sweden, Norway, and France[14]. ABB is collaborating with Hydrogène de France to develop large-scale fuelcell-powered ships [14]. The CEO of Maersk, the largest container shipping line andvessel operator in the world, said that they will have small-scale ships running onfuels such as ammonia and methanol before 2025 [44].
Utilising hydrogen as a fuel for ships comes with some challenges. Although some ofthe infrastructures for ammonia already exist, a huge scale-up of both distributionand production would be required. To satisfy shipping demand in the long term, itis estimated that 500 Mt/year of ammonia is required, three times today’s globalproduction [17]. Another challenge is the storage volume required, with ammoniarequiring three times the volume of conventional oil-based fuels. This would eitherrequire a redesign of the ships, shorter distance trips, or reduced cargo capacity [45].
The application does however benefit from some infrastructure already existing.Synergy effects with material handling in ports (forklifts, trucks, etc), and the de-mand being more centralised to fewer locations are also added benefits [17]. Forsmaller applications, such as ferries, it is estimated that they could become com-petitive with fuel cells in 2030-2035 [18]. For larger-scale operations, a CO2 price ofup to 326 $/tCO2 would be required to make ammonia a cost-competitive fuel [17].For further data on the price-point of where hydrogen is used to produce ammonia,see section 3.1.1.
22
3. Hydrogen Demand
3.3 Hydrogen for Power Generation and Grid Bal-ancing
A final application of hydrogen that will be outlined in this report, is the use ofhydrogen generation and storage to use for power and balance an electricity system.Hydrogen’s potential for storing large amounts of chemical energy, which can easilybe transformed to electricity, makes it interesting in the context of balancing grids[46, 47]. Hydrogen can be stored in different ways and can thereby also balanceseasonal variations or a larger share of RES in the overall energy system [17, 46].In the context of nuclear power generation, benefits from producing and storing hy-drogen have been investigated [46]. Operating a nuclear plant at a constant level issimpler and cheaper in terms of fuel and maintenance, and producing hydrogen tocompensate for variations in demand could increase the operating life [46].
Hydrogen generated by electrolysis can be stored in a number of ways, further de-scribed in section 4.3. To reconvert hydrogen to electricity internal combustionengines, gas turbine power plants, or fuel cells are all possible options [47]. Thehydrogen could also be used directly in industry or as fuel for vehicles [47]. Onechallenge, highlighted by interviewee B, is induced by the low round-trip efficiencyof converting electricity to chemical energy and then back to electricity again.
Producing hydrogen in order to balance the power system could have an importantrole in the future. But is heavily dependent on developments in electrolysers andlarge-scale storage [46]. Experts, including interviewee J, see a challenge in thissolution relating to the problem of optimising hydrogen production of RES to hoursof low energy cost, and the storage thereby needed to be able to supply a steadydemand of hydrogen.
3.4 Summary of Hydrogen DemandThe chapter has provided an overview of the many different applications hydrogen isused in and where it could be used in the future. There are some applications wherethe demand is more certain, such as ammonia and methanol production. Othersectors, such as the transport sector, have a potentially larger demand for hydrogenbut is more difficult to predict. Regarding cars for shorter distances the FCEVfaces competition from BEVs. For longer distances and larger-in-size applicationsthe hydrogen alternative seems to be more competitive. No expert can say for surewhich applications will have the largest demand but some estimations has been giventhrough the chapter. The demand from different sectors is summarised in table 3.1below. The estimations is gathered from the previous sections, from interviews withexperts, and from reference [17] and [18]. It is aimed at giving an overview of thecurrent status. The total demand from the selected applications is summarisedin the table and is estimated to be up to 450 MtH2/yr in 2050. If not includingFCEVs, which by many experts is deemed the most uncertain, the demand is still150 MtH2/yr. The next chapter contains different ways meeting this huge demand.
23
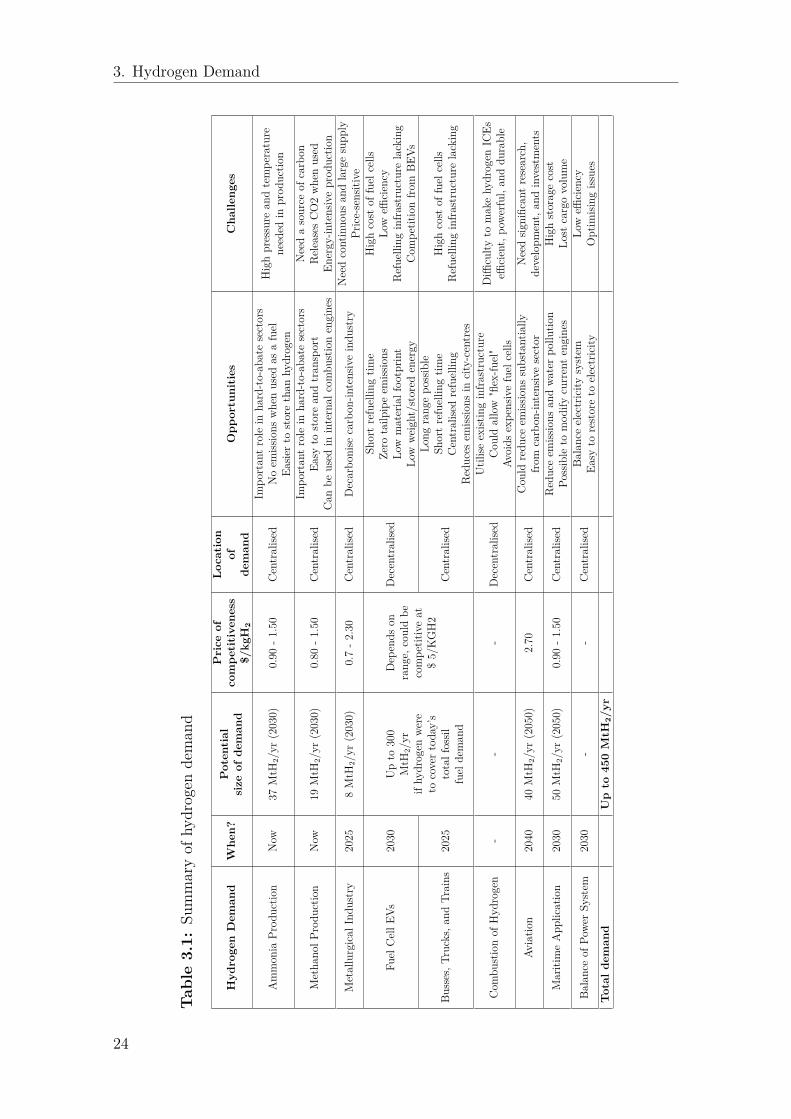
3. Hydrogen Demand
Tab
le3.1:
Summaryof
hydrogen
deman
d
Hyd
rogenDem
and
Whe
n?Potential
size
ofde
man
d
Price
ofcompe
titivene
ss$/
kgH
2
Location
ofde
man
dOpp
ortunities
Cha
lleng
es
Ammon
iaPr
oductio
nNow
37MtH
2/yr
(2030)
0.90
-1.50
Centralise
dIm
portan
trole
inha
rd-to-ab
atesectors
Noem
issions
whenused
asafuel
Easie
rto
storethan
hydrogen
Highpressure
andtempe
rature
needed
inprod
uctio
n
Metha
nolP
rodu
ction
Now
19MtH
2/yr
(2030)
0.80
-1.50
Centralise
dIm
portan
trole
inha
rd-to-ab
atesectors
Easy
tostorean
dtran
sport
Can
beused
ininternal
combu
stionengines
Needasource
ofcarbon
ReleasesCO2whenused
Energy
-intensiveprod
uctio
n
Metallurgical
Indu
stry
2025
8MtH
2/yr
(2030)
0.7-2
.30
Centralise
dDecarbo
nise
carbon
-intensiveindu
stry
Needcontinuo
usan
dlargesupp
lyPr
ice-sensitive
Fuel
CellE
Vs2030
Upto
300
MtH
2/yr
ifhy
drogen
were
tocovertoda
y’s
totalfossil
fuel
deman
d
Dep
ends
onrang
e,couldbe
compe
titiveat
$5/KGH2
Decentralise
d
Shortrefuellin
gtim
eZe
rotailp
ipeem
issions
Low
materialfoo
tprin
tLo
wwe
ight/storedenergy
Highcost
offuel
cells
Low
efficiency
Refuelling
infra
structurelacking
Com
petit
ionfro
mBE
Vs
Busses,T
rucks,
andTr
ains
2025
Centralise
d
Long
rang
epo
ssible
Shortrefuellin
gtim
eCentralise
drefuellin
gReduces
emiss
ions
incity-centres
Highcost
offuel
cells
Refuelling
infra
structurelacking
Com
bustionof
Hyd
rogen
--
-Decentralise
dUtilise
exist
inginfra
structure
Cou
ldallow
"flex-fu
el"
Avoids
expe
nsivefuel
cells
Diffi
culty
tomakehy
drogen
ICEs
efficient,po
werfu
l,an
ddu
rable
Aviatio
n2040
40MtH
2/yr
(2050)
2.70
Centralise
dCou
ldredu
ceem
issions
substantially
from
carbon
-intensivesector
Needsig
nifican
tresearch,
developm
ent,
andinvestments
MaritimeApp
lication
2030
50MtH
2/yr
(2050)
0.90
-1.50
Centralise
dReduceem
issions
andwa
terpo
llutio
nPo
ssible
tomod
ifycurrentengines
Highstoragecost
Lost
cargovolume
Balanceof
Powe
rSy
stem
2030
--
Centralise
dBa
lanceelectricity
system
Easy
torestoreto
electricity
Low
efficiency
Optim
ising
issues
Total
deman
dUpto
450MtH
2/yr
24

4Hydrogen Supply
As illustrated in the previous chapter, today hydrogen is mainly used for ammoniaproduction, oil refining and the production of various other chemicals. In 2018,around 74 million tonnes of hydrogen were produced for this purpose [17]. Out ofthis 74 million tonnes, only five percent was produced using a low-carbon productionmethod. The rest was produced using fossil fuels [48]. If the hydrogen use is to growas projected, then the supply also needs to shift towards low-carbon production.
This chapter aims to describe the supply part of the overall structure, as illustratedin figure 4.1. This includes an overview of the main ways of producing, transporting,and storing hydrogen. A description of the most prominent ways of production willbe presented with the main focus on the most discussed low-carbon method, elec-trolysis. Different ways of storing and transporting hydrogen will be also described.After storage and transport, hydrogen techno-economics in the form of levelisedcost of hydrogen (LCOH) will be presented. The focus will be on the productionof hydrogen using electrolysis. The LCOH for other production methods and alsocost for storage and transport have been gathered directly from literature. Finally,a summary of the chapter is presented.
Figure 4.1: The chapter explains the supply part of the overall structure.
4.1 Hydrogen Production - Fossil Fuel
This section describes the two most prominent ways of producing hydrogen usingfossil fuels. These are steam reforming and gasification. Although gasification standsfor a significant share in producing hydrogen, it is not as widely used outside ofChina, whereas steam reforming is used on a more global scale. Therefore, bothmethods will be described in short but only steam reforming will be further analysedthroughout the report. Producing hydrogen as a by-product from various industriesusing fossil fuels has also fallen outside of the scope of this study.
25
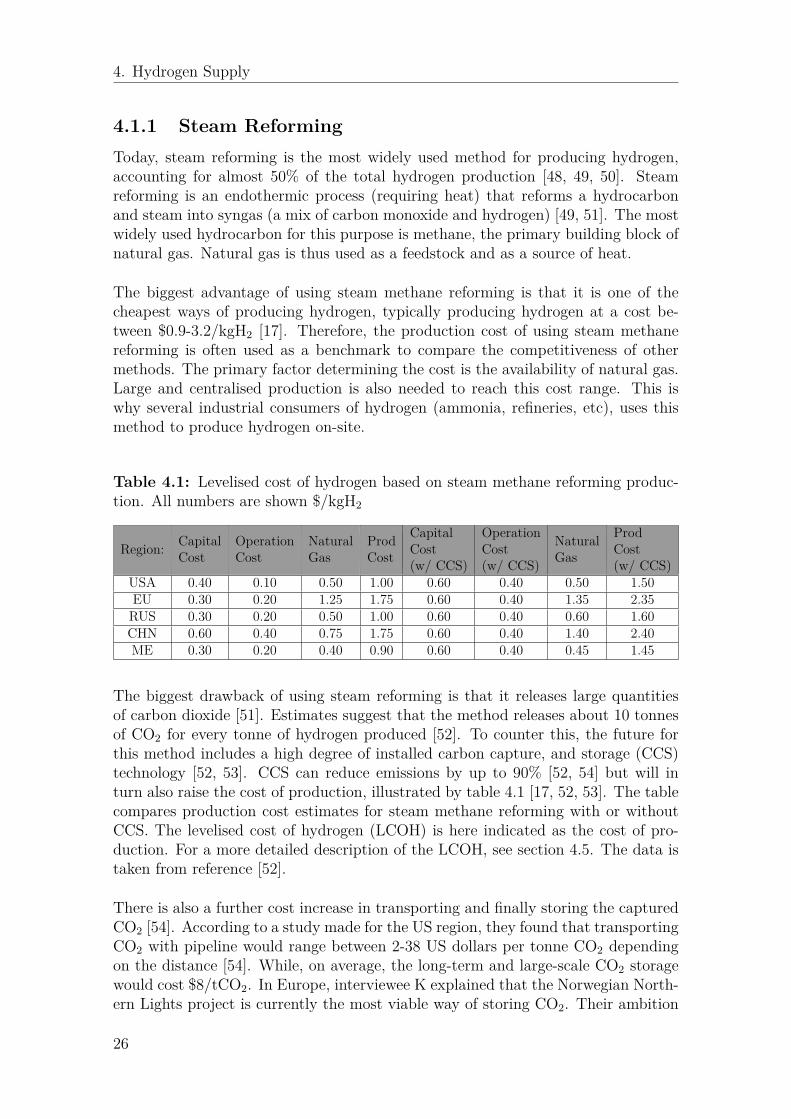
4. Hydrogen Supply
4.1.1 Steam ReformingToday, steam reforming is the most widely used method for producing hydrogen,accounting for almost 50% of the total hydrogen production [48, 49, 50]. Steamreforming is an endothermic process (requiring heat) that reforms a hydrocarbonand steam into syngas (a mix of carbon monoxide and hydrogen) [49, 51]. The mostwidely used hydrocarbon for this purpose is methane, the primary building block ofnatural gas. Natural gas is thus used as a feedstock and as a source of heat.
The biggest advantage of using steam methane reforming is that it is one of thecheapest ways of producing hydrogen, typically producing hydrogen at a cost be-tween $0.9-3.2/kgH2 [17]. Therefore, the production cost of using steam methanereforming is often used as a benchmark to compare the competitiveness of othermethods. The primary factor determining the cost is the availability of natural gas.Large and centralised production is also needed to reach this cost range. This iswhy several industrial consumers of hydrogen (ammonia, refineries, etc), uses thismethod to produce hydrogen on-site.
Table 4.1: Levelised cost of hydrogen based on steam methane reforming produc-tion. All numbers are shown $/kgH2
Region: CapitalCost
OperationCost
NaturalGas
ProdCost
CapitalCost(w/ CCS)
OperationCost(w/ CCS)
NaturalGas
ProdCost(w/ CCS)
USA 0.40 0.10 0.50 1.00 0.60 0.40 0.50 1.50EU 0.30 0.20 1.25 1.75 0.60 0.40 1.35 2.35RUS 0.30 0.20 0.50 1.00 0.60 0.40 0.60 1.60CHN 0.60 0.40 0.75 1.75 0.60 0.40 1.40 2.40ME 0.30 0.20 0.40 0.90 0.60 0.40 0.45 1.45
The biggest drawback of using steam reforming is that it releases large quantitiesof carbon dioxide [51]. Estimates suggest that the method releases about 10 tonnesof CO2 for every tonne of hydrogen produced [52]. To counter this, the future forthis method includes a high degree of installed carbon capture, and storage (CCS)technology [52, 53]. CCS can reduce emissions by up to 90% [52, 54] but will inturn also raise the cost of production, illustrated by table 4.1 [17, 52, 53]. The tablecompares production cost estimates for steam methane reforming with or withoutCCS. The levelised cost of hydrogen (LCOH) is here indicated as the cost of pro-duction. For a more detailed description of the LCOH, see section 4.5. The data istaken from reference [52].
There is also a further cost increase in transporting and finally storing the capturedCO2 [54]. According to a study made for the US region, they found that transportingCO2 with pipeline would range between 2-38 US dollars per tonne CO2 dependingon the distance [54]. While, on average, the long-term and large-scale CO2 storagewould cost $8/tCO2. In Europe, interviewee K explained that the Norwegian North-ern Lights project is currently the most viable way of storing CO2. Their ambition
26

4. Hydrogen Supply
is to reach a cost of between $36-65/tCO2, which includes shipping to, and storing,the CO2 in their North Sea storage facility. Future cost increase for this methodcould also be dependent on carbon prices and taxes [53]. However, with a capturerate of 90%, carbon taxes on the remaining 10% will have a limited effect on finalcost.
4.1.2 GasificationGasification is similar to steam reforming except that it also uses oxygen in the pro-cess. The feedstock, oxygen and steam, react to form hydrogen, carbon monoxide-and dioxide [49]. The CO2 can further be reacted with steam to form additionalhydrogen, in a so-called "water-gas-shift". Typically the feedstock that is used iscoal. Today, around 19% of worldwide hydrogen production is done using coal gasi-fication [48]. 80% of these facilities are located in China [52].
Similar to steam methane reforming, gasification has a low production cost [49],estimated at $1.2-2.2/kgH2 [17]. The drawback is similar as well, in that it releaseslarge quantities of GHG emissions. The future for this method also includes theinstalment of CCS.
Another option is to use biomass (such as industrial, agricultural, and forestryresidues and waste) instead of coal as a feedstock. Although the process is some-what more complicated, it can be considered more environmentally friendly since ituses biomass and not coal [55]. However, according to interviewee L, biomass is alsobeing proposed as a feedstock for a wide range of other applications. For example,different kinds of synthetic fuels. When discussing this subject further with inter-viewee L, they believed that biomass can have a higher value than only using it forpure energy purposes.
4.2 Hydrogen Production - ElectrolysisAlthough the technology for electrolysis has been around for several hundred yearsthe method still only takes up 4% of global production [48, 56]. The reason beingthat it is a more expensive method than those using fossil fuels. But because ofthe increased concerns in regards to climate change, the method has seen new liferecently. Electrolysis of water only requires energy in the form of electricity and/orheat and the process does not release emissions. Any low-carbon energy source, suchas nuclear or renewables, can thereby potentially reduce the emissions of producinghydrogen. With cost increases for fossil-fuel-based production methods and costdecreases of using electrolysers, this method may potentially also compete econom-ically in the future [51]. In may 2021, the IEA published a comprehensive study onhow the world can reach a net-zero energy system (removing the same amount ofGHG emissions from the atmosphere as is released) by 2050 [57]. According to thestudy, 54% of all hydrogen should be produced using low-carbon electrolysis in 2030to reach this goal. By 2050, this number is increased to 62%.
27
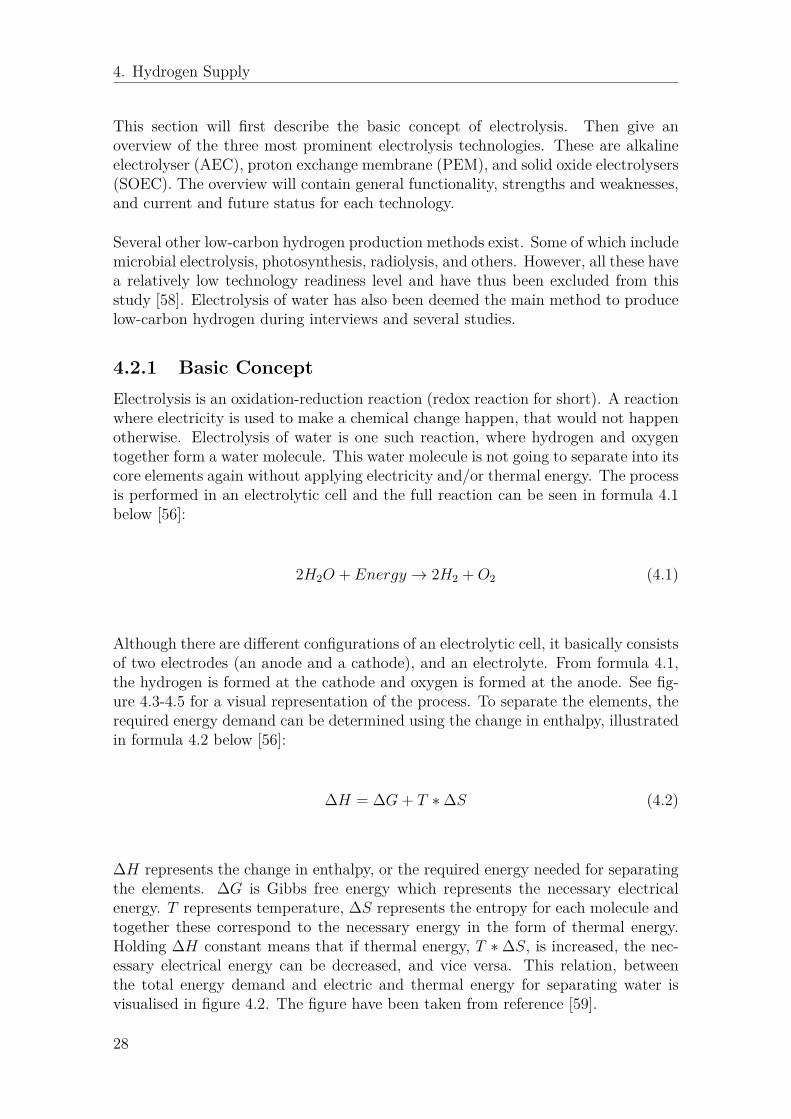
4. Hydrogen Supply
This section will first describe the basic concept of electrolysis. Then give anoverview of the three most prominent electrolysis technologies. These are alkalineelectrolyser (AEC), proton exchange membrane (PEM), and solid oxide electrolysers(SOEC). The overview will contain general functionality, strengths and weaknesses,and current and future status for each technology.
Several other low-carbon hydrogen production methods exist. Some of which includemicrobial electrolysis, photosynthesis, radiolysis, and others. However, all these havea relatively low technology readiness level and have thus been excluded from thisstudy [58]. Electrolysis of water has also been deemed the main method to producelow-carbon hydrogen during interviews and several studies.
4.2.1 Basic ConceptElectrolysis is an oxidation-reduction reaction (redox reaction for short). A reactionwhere electricity is used to make a chemical change happen, that would not happenotherwise. Electrolysis of water is one such reaction, where hydrogen and oxygentogether form a water molecule. This water molecule is not going to separate into itscore elements again without applying electricity and/or thermal energy. The processis performed in an electrolytic cell and the full reaction can be seen in formula 4.1below [56]:
2H2O + Energy → 2H2 +O2 (4.1)
Although there are different configurations of an electrolytic cell, it basically consistsof two electrodes (an anode and a cathode), and an electrolyte. From formula 4.1,the hydrogen is formed at the cathode and oxygen is formed at the anode. See fig-ure 4.3-4.5 for a visual representation of the process. To separate the elements, therequired energy demand can be determined using the change in enthalpy, illustratedin formula 4.2 below [56]:
∆H = ∆G+ T ∗∆S (4.2)
∆H represents the change in enthalpy, or the required energy needed for separatingthe elements. ∆G is Gibbs free energy which represents the necessary electricalenergy. T represents temperature, ∆S represents the entropy for each molecule andtogether these correspond to the necessary energy in the form of thermal energy.Holding ∆H constant means that if thermal energy, T ∗∆S, is increased, the nec-essary electrical energy can be decreased, and vice versa. This relation, betweenthe total energy demand and electric and thermal energy for separating water isvisualised in figure 4.2. The figure have been taken from reference [59].
28
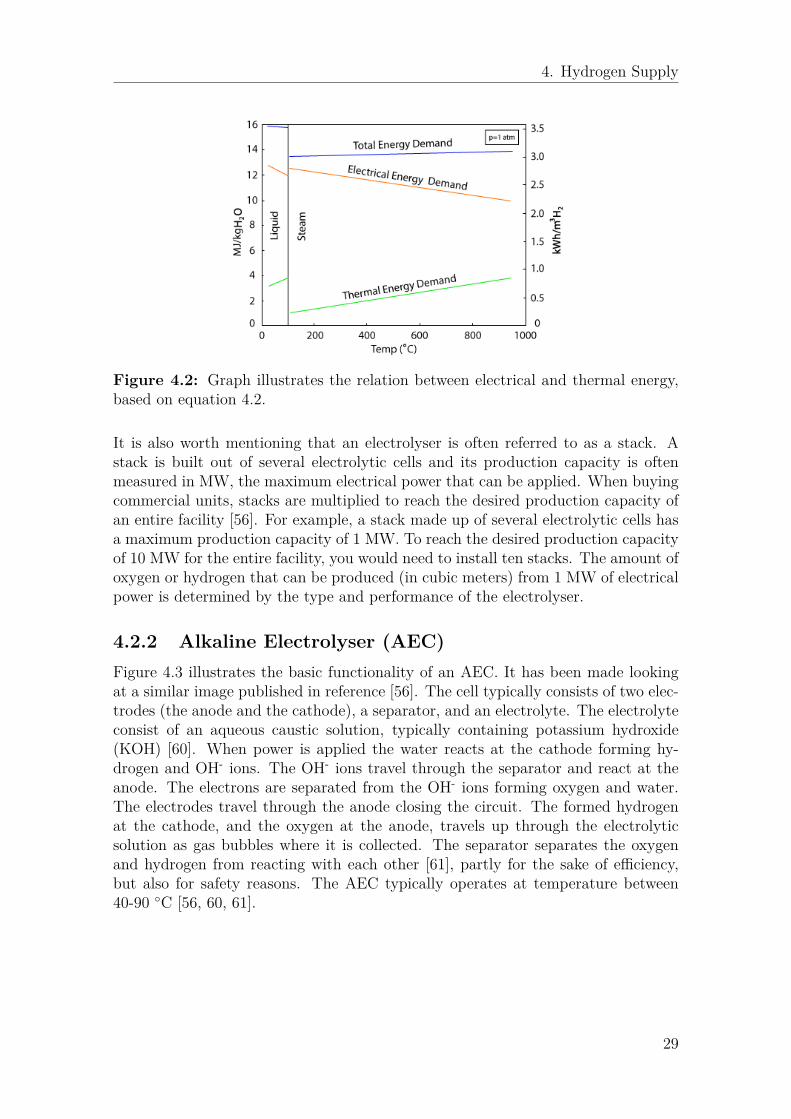
4. Hydrogen Supply
Figure 4.2: Graph illustrates the relation between electrical and thermal energy,based on equation 4.2.
It is also worth mentioning that an electrolyser is often referred to as a stack. Astack is built out of several electrolytic cells and its production capacity is oftenmeasured in MW, the maximum electrical power that can be applied. When buyingcommercial units, stacks are multiplied to reach the desired production capacity ofan entire facility [56]. For example, a stack made up of several electrolytic cells hasa maximum production capacity of 1 MW. To reach the desired production capacityof 10 MW for the entire facility, you would need to install ten stacks. The amount ofoxygen or hydrogen that can be produced (in cubic meters) from 1 MW of electricalpower is determined by the type and performance of the electrolyser.
4.2.2 Alkaline Electrolyser (AEC)Figure 4.3 illustrates the basic functionality of an AEC. It has been made lookingat a similar image published in reference [56]. The cell typically consists of two elec-trodes (the anode and the cathode), a separator, and an electrolyte. The electrolyteconsist of an aqueous caustic solution, typically containing potassium hydroxide(KOH) [60]. When power is applied the water reacts at the cathode forming hy-drogen and OH- ions. The OH- ions travel through the separator and react at theanode. The electrons are separated from the OH- ions forming oxygen and water.The electrodes travel through the anode closing the circuit. The formed hydrogenat the cathode, and the oxygen at the anode, travels up through the electrolyticsolution as gas bubbles where it is collected. The separator separates the oxygenand hydrogen from reacting with each other [61], partly for the sake of efficiency,but also for safety reasons. The AEC typically operates at temperature between40-90 ◦C [56, 60, 61].
29
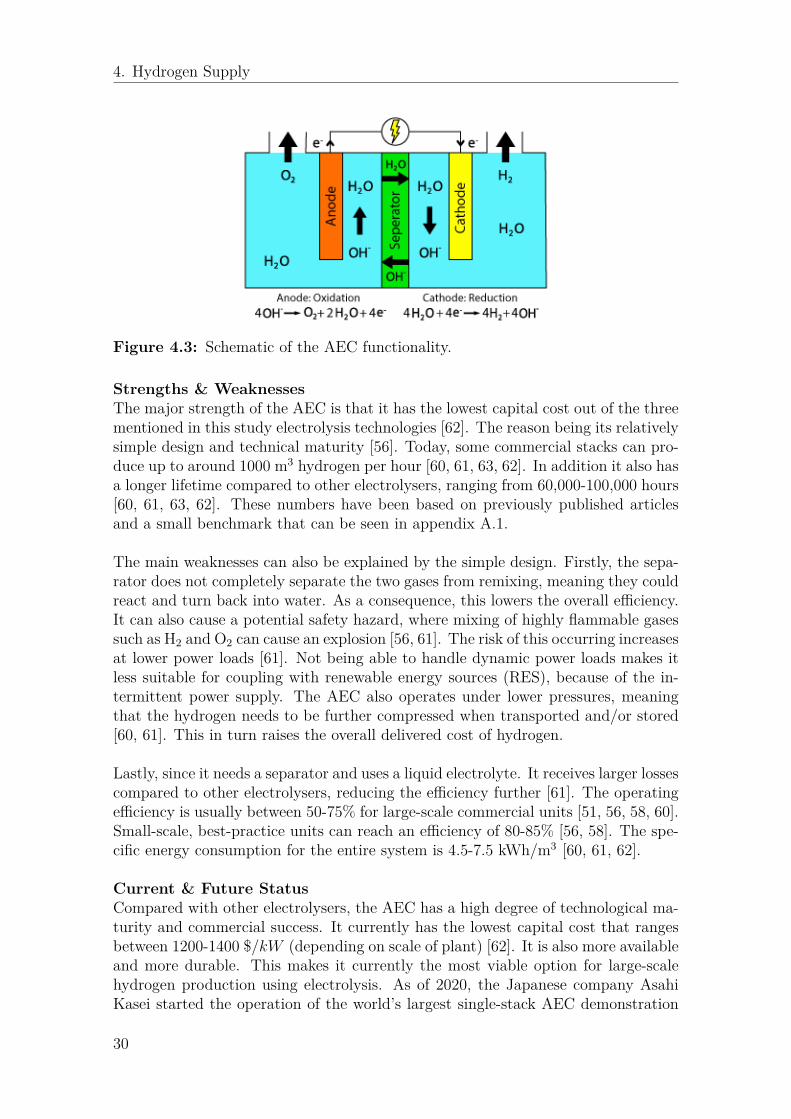
4. Hydrogen Supply
Figure 4.3: Schematic of the AEC functionality.
Strengths & WeaknessesThe major strength of the AEC is that it has the lowest capital cost out of the threementioned in this study electrolysis technologies [62]. The reason being its relativelysimple design and technical maturity [56]. Today, some commercial stacks can pro-duce up to around 1000 m3 hydrogen per hour [60, 61, 63, 62]. In addition it also hasa longer lifetime compared to other electrolysers, ranging from 60,000-100,000 hours[60, 61, 63, 62]. These numbers have been based on previously published articlesand a small benchmark that can be seen in appendix A.1.
The main weaknesses can also be explained by the simple design. Firstly, the sepa-rator does not completely separate the two gases from remixing, meaning they couldreact and turn back into water. As a consequence, this lowers the overall efficiency.It can also cause a potential safety hazard, where mixing of highly flammable gasessuch as H2 and O2 can cause an explosion [56, 61]. The risk of this occurring increasesat lower power loads [61]. Not being able to handle dynamic power loads makes itless suitable for coupling with renewable energy sources (RES), because of the in-termittent power supply. The AEC also operates under lower pressures, meaningthat the hydrogen needs to be further compressed when transported and/or stored[60, 61]. This in turn raises the overall delivered cost of hydrogen.
Lastly, since it needs a separator and uses a liquid electrolyte. It receives larger lossescompared to other electrolysers, reducing the efficiency further [61]. The operatingefficiency is usually between 50-75% for large-scale commercial units [51, 56, 58, 60].Small-scale, best-practice units can reach an efficiency of 80-85% [56, 58]. The spe-cific energy consumption for the entire system is 4.5-7.5 kWh/m3 [60, 61, 62].
Current & Future StatusCompared with other electrolysers, the AEC has a high degree of technological ma-turity and commercial success. It currently has the lowest capital cost that rangesbetween 1200-1400 $/kW (depending on scale of plant) [62]. It is also more availableand more durable. This makes it currently the most viable option for large-scalehydrogen production using electrolysis. As of 2020, the Japanese company AsahiKasei started the operation of the world’s largest single-stack AEC demonstration
30
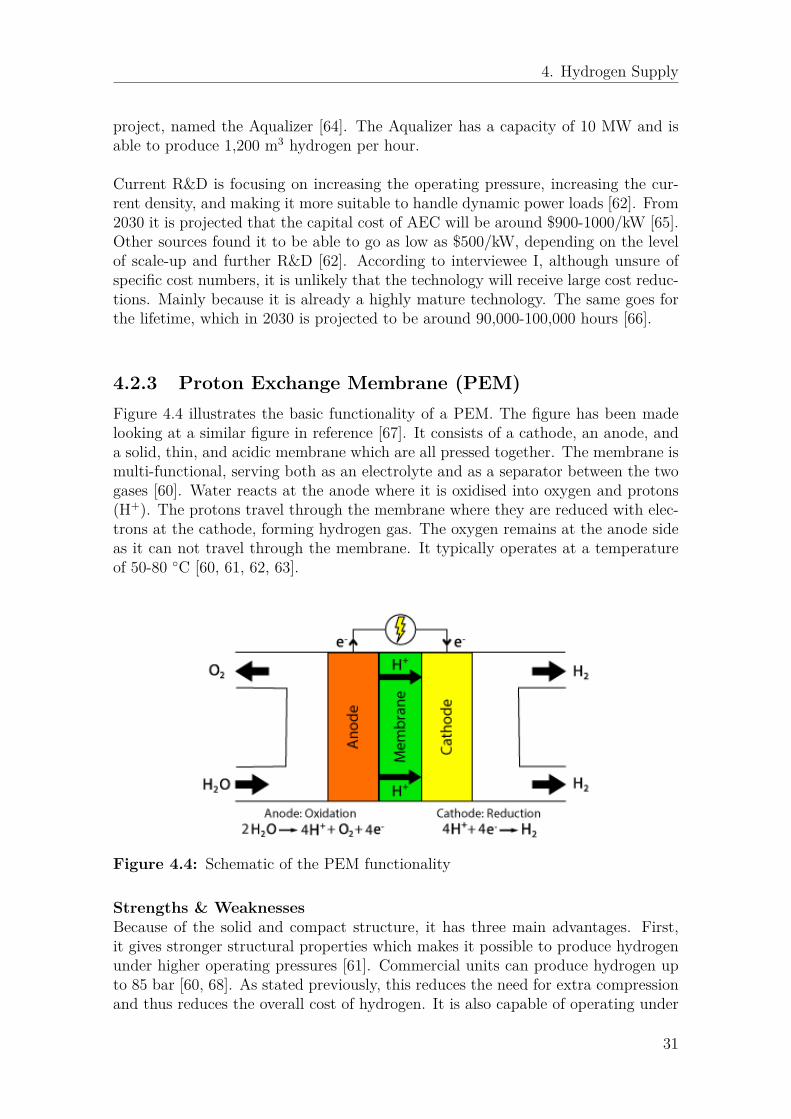
4. Hydrogen Supply
project, named the Aqualizer [64]. The Aqualizer has a capacity of 10 MW and isable to produce 1,200 m3 hydrogen per hour.
Current R&D is focusing on increasing the operating pressure, increasing the cur-rent density, and making it more suitable to handle dynamic power loads [62]. From2030 it is projected that the capital cost of AEC will be around $900-1000/kW [65].Other sources found it to be able to go as low as $500/kW, depending on the levelof scale-up and further R&D [62]. According to interviewee I, although unsure ofspecific cost numbers, it is unlikely that the technology will receive large cost reduc-tions. Mainly because it is already a highly mature technology. The same goes forthe lifetime, which in 2030 is projected to be around 90,000-100,000 hours [66].
4.2.3 Proton Exchange Membrane (PEM)Figure 4.4 illustrates the basic functionality of a PEM. The figure has been madelooking at a similar figure in reference [67]. It consists of a cathode, an anode, anda solid, thin, and acidic membrane which are all pressed together. The membrane ismulti-functional, serving both as an electrolyte and as a separator between the twogases [60]. Water reacts at the anode where it is oxidised into oxygen and protons(H+). The protons travel through the membrane where they are reduced with elec-trons at the cathode, forming hydrogen gas. The oxygen remains at the anode sideas it can not travel through the membrane. It typically operates at a temperatureof 50-80 ◦C [60, 61, 62, 63].
Figure 4.4: Schematic of the PEM functionality
Strengths & WeaknessesBecause of the solid and compact structure, it has three main advantages. First,it gives stronger structural properties which makes it possible to produce hydrogenunder higher operating pressures [61]. Commercial units can produce hydrogen upto 85 bar [60, 68]. As stated previously, this reduces the need for extra compressionand thus reduces the overall cost of hydrogen. It is also capable of operating under
31
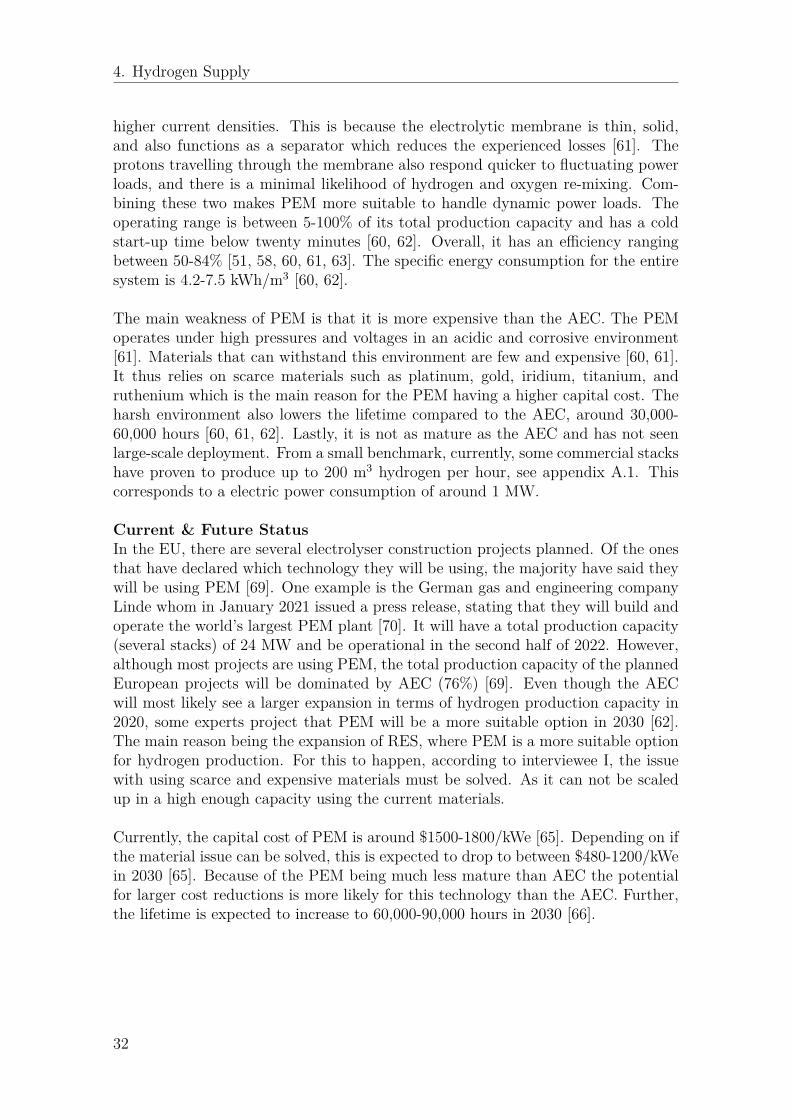
4. Hydrogen Supply
higher current densities. This is because the electrolytic membrane is thin, solid,and also functions as a separator which reduces the experienced losses [61]. Theprotons travelling through the membrane also respond quicker to fluctuating powerloads, and there is a minimal likelihood of hydrogen and oxygen re-mixing. Com-bining these two makes PEM more suitable to handle dynamic power loads. Theoperating range is between 5-100% of its total production capacity and has a coldstart-up time below twenty minutes [60, 62]. Overall, it has an efficiency rangingbetween 50-84% [51, 58, 60, 61, 63]. The specific energy consumption for the entiresystem is 4.2-7.5 kWh/m3 [60, 62].
The main weakness of PEM is that it is more expensive than the AEC. The PEMoperates under high pressures and voltages in an acidic and corrosive environment[61]. Materials that can withstand this environment are few and expensive [60, 61].It thus relies on scarce materials such as platinum, gold, iridium, titanium, andruthenium which is the main reason for the PEM having a higher capital cost. Theharsh environment also lowers the lifetime compared to the AEC, around 30,000-60,000 hours [60, 61, 62]. Lastly, it is not as mature as the AEC and has not seenlarge-scale deployment. From a small benchmark, currently, some commercial stackshave proven to produce up to 200 m3 hydrogen per hour, see appendix A.1. Thiscorresponds to a electric power consumption of around 1 MW.
Current & Future StatusIn the EU, there are several electrolyser construction projects planned. Of the onesthat have declared which technology they will be using, the majority have said theywill be using PEM [69]. One example is the German gas and engineering companyLinde whom in January 2021 issued a press release, stating that they will build andoperate the world’s largest PEM plant [70]. It will have a total production capacity(several stacks) of 24 MW and be operational in the second half of 2022. However,although most projects are using PEM, the total production capacity of the plannedEuropean projects will be dominated by AEC (76%) [69]. Even though the AECwill most likely see a larger expansion in terms of hydrogen production capacity in2020, some experts project that PEM will be a more suitable option in 2030 [62].The main reason being the expansion of RES, where PEM is a more suitable optionfor hydrogen production. For this to happen, according to interviewee I, the issuewith using scarce and expensive materials must be solved. As it can not be scaledup in a high enough capacity using the current materials.
Currently, the capital cost of PEM is around $1500-1800/kWe [65]. Depending on ifthe material issue can be solved, this is expected to drop to between $480-1200/kWein 2030 [65]. Because of the PEM being much less mature than AEC the potentialfor larger cost reductions is more likely for this technology than the AEC. Further,the lifetime is expected to increase to 60,000-90,000 hours in 2030 [66].
32

4. Hydrogen Supply
4.2.4 Solid Oxide electrolyser (SOEC)The AEC and PEM, while different, still operate similarly. The SOEC can be de-scribed as quite different than the two first mentioned. The SOEC can operateat temperatures of up to 1000 ◦C, but typically it is in the range of 600-850 ◦C[60, 62, 68, 71]. This means that water steam is provided as a feedstock and not liq-uid water. It thus takes advantage of equation 4.2, where supplying thermal energydrastically reduces the need for electrical energy. The SOEC operates at at ambientatmospheric pressure [66].
Figure 4.5: Schematic of the SOEC functionality
From figure 4.5, it can be seen that the SOEC consists of an anode, a cathode, anda solid electrolyte. Water steam reduces at the cathode forming hydrogen and oxy-gen ions (O−2) [60]. The hydrogen is collected and the oxygen ions are transportedthrough the electrolyte. At the anode, the oxygen ions oxidise forming oxygen. Inaddition to water steam, the cathode can also be fed with CO2, either in combi-nation or as a stand-alone feedstock [71]. In the end, this produces hydrogen andcarbon monoxide (syngas) at the cathode and oxygen at the anode. Figure 4.5 havebeen made looking at a similar figure in reference [72].
Strengths & WeaknessesThe main advantage of the SOEC is that it can reach a considerably higher electri-cal efficiency compared to the AEC and the PEM. The electrical efficiency can evengo beyond 100%, since it utilise thermal energy in a high enough capacity [62, 61].Because electrical energy is more expensive to produce than thermal, this is seen asa major advantage [59]. Another advantage, when compared with the PEM, is thatit uses abundant earth materials [71]. This reduces cost and the risk of a potentialbottleneck emerging when scaling up production. Lastly, the SOEC can operate asa fuel cell, switching between hydrogen and electricity production. In co-electrolysismode, it can produce syngas from water and/or recycled CO2 [62]. This has fur-ther advantages if implemented in industries such as refineries or chemical processindustries.
33

4. Hydrogen Supply
The downside of the technology is that it is the least developed technology out of thethree mentioned in the study. Technically, it has proven to work in laboratory anddemonstration-scale with current stacks being able to produce from 1-3 m3 hydro-gen per hour [71]. However, it has seen limited commercial deployment [62, 63, 71].The main problem for the SOEC stems from the high operating temperatures. Thehigh temperatures lead to fast degradation of the cell components, and low long-term durability of system components such as sealings and interconnects [71, 61].Currently, SOEC stacks have demonstrated a lifetime of 10,000-30,000 hours [66].According to interviewee I, because of the high temperatures, there is also a needto produce hydrogen at a steady rate. If the production rate is constantly varying,the materials will be under significant thermal stresses. It will also require a lot ofenergy in order to reach the desired temperature again.
Current & Future StatusIn the US, two commercial plants exist which uses SOEC to turn CO2 into carbonmonoxide [71]. The German electrolyser company Sunfire also has a commercialSOEC producing hydrogen at 200 ◦C, see appendix A.1. No commercial units existto produce hydrogen in the 600-850 ◦C temperature range. This is said to be onthe brink of being realised, however. The largest current demonstration project hasa total production capacity of 40 m3 hydrogen per hour and is located in Germany[71]. Other planned demonstration projects, in Germany but also the Netherlands,have decided to increase this to a production capacity up to 300-740 m3 hydrogenper hour [71]. Of the previously mentioned European electrolyser projects, threepercent of the total production capacity is said to be implemented with SOEC [69].In March 2021, the Danish company Haldor Topsoe announced they will build alarge-scale SOEC electrolyser manufacturing facility [73]. The facility will be ableto produce 500 MW of SOEC capacity each year. This can also be expanded to 5GW in future endeavours. The manufacturing facility is expected to be operationalin 2023.
Since the SOEC has the lowest level of maturity out of the three it also has thehighest capital cost. Currently, this is estimated to be $2400/kWe or above [62, 71].In 2030 and 2050 this is projected to drop to $1200/kWe and $640/kWe respectively,mainly through economiy of scale [71]. The lifetime is also projected to increase tobetween 40,000-60,000 hours [66].
4.3 Hydrogen StorageHydrogen storage can be divided into physical and chemical storage. Physical stor-age includes methods for storing hydrogen in its pure form, while chemical storagebinds hydrogen to either various types of metal hybrids or by forming substancessuch as methanol or ammonia, as mentioned in the previous chapter. Physical stor-age methods can be viewed as technically and commercially more mature and aredescribed below [74]. Methods for chemical storage have fallen outside the scope ofthis study.
34
4. Hydrogen Supply
4.3.1 Compressed Hydrogen VesselsSince hydrogen has a very low density, one way of effectively storing it is to com-press it and store it in high-pressure tanks. For the most part, in cylindrical steeltanks, with a volume of 0.05 m3 but also in larger storage vessels with a volumeabove thousand cubic meters [74]. At ambient temperature (20 ◦C) and normalpressure (1 bar), hydrogen has a volumetric density of 0.089 kg/m3 [75]. If insteadcompressed to 100 bar, the density increase to 7.797 kg/m3 [76]. In practical terms,this means you need less volume of storage for the same content of hydrogen. Ahigh compression rate also means you can achieve a higher gravimetric density, thepercentage of hydrogen weight relative to the weight of the whole system (hydrogenand storage medium) [75]. A high gravimetric density is better for transport, asyou can transport a larger quantity of hydrogen for the same distance. However,a higher compression rate raises the performance, and thus the cost of the storagemedium [77]. This means there is a trade-off between the cost of storage and thecost of transport. For storage applications, the hydrogen is typically compressed toaround 200-250 bar [48].
Compressing and storing hydrogen is one of the most mature and widely used meth-ods [77]. It is simple and has the advantage of fast charging and discharging of themedium, or fast injection and withdrawal of hydrogen [74]. The main drawback,which is not only evident for this method, is that it needs further energy for com-pression [75]. This means you will have an energy penalty on the overall energycontent of hydrogen. Depending on the level of compression and scale of storage,the energy required to do so can reach between 1-4 kWh/kgH3 [76, 78]. Anotherdrawback is that, even with compression, the volumetric density is rather low incomparison with other storage methods, such as liquefied hydrogen vessels. Thismeans that this method is less suitable for large-scale hydrogen storage.
4.3.2 Underground StorageAs mentioned, compressed hydrogen stored in various tanks and vessels above groundis not suitable for large-scale storage, both because of cost and geographical footprintreasons. Instead, storing large quantities of compressed hydrogen can be achievedin underground geological structures where the hydrogen is compressed to around200 bar before injecting it [74]. The three main prospects are aquifers, depletedhydrocarbon deposits, and salt caverns. According to interviewees B and K, theseprospects are also what is being proposed for CO2 storage. Although all three havebeen proven to work for storing natural gas and CO2, only salt caverns have experi-ence of storing hydrogen [79]. Since they all use some sort of natural and geologicalfoundation, they are also all very location-specific. Lastly, the fourth method, notmentioned as frequently, is lined rock cavern storage which to a large degree arti-ficially made and is much less location-specific compared to the others mentioned.Table 4.2 summarises some of the characteristics for each method as well as theassociated cost. The cost does not account for the benefit of being able to injectand withdraw hydrogen gas several times a year [80]. This benefit, if included, couldreduce the cost for the salt and lined rock cavern storage’s.
35

4. Hydrogen Supply
Table 4.2: Underground storage comparison
Type: Injection &WithdrawCycle/Year:
HydrogenExperience:
LocationSpecific:
Cost:($/kgH2)
Aquifer 1-2 No Yes 1.29 [80]Depleted
HydrocarbonReserve
1-2 No Yes 1.23 [80]
Salt RockCavern
10-12 Yes Yes 1.61 [80]
Lined RockCavern
10-12 No Less 2.77 [80]
Aquifers are underground porous rock formations containing water. This type ofrock is also called permeable rock [79]. This means it can let fluids travel throughthe porous spaces of the rock. To be suitable for gas injection it needs to fulfill sev-eral storage characteristics. These include depth, tightness, pressure, permeability,and porosity [79]. It also needs an impermeable roof covering the stored gas and adome-shaped structure to keep the gas in the defined space [78]. It has been deemeda suitable option since hydrocarbon reserves have in most cases been formed via anaquifer [78].
During injection of gas, the water is displaced to create the storage space. Thewater is also what confines the gas from percolating through the permeable rockformations while the impermeable rock is what keeps it from percolating upwards.
The main upside of using an aquifer compared to a depleted hydrocarbon reserveis that there is less risk of the hydrogen being contaminated by other hydrocar-bons [79]. Meaning reacting with other substances forming methane or hydrogensulfide. There are also more aquifers in the world, as suitable depleted hydrocarbonreserves are only limited to certain regions [81]. The downside is that, whereas adepleted hydrocarbon reserve has already proven to work for storing gas, as it hasdone for millions of years, an aquifer has not [79]. This means that more testinghas to be performed (rock tightness, leakage paths, reactivity between rock andhydrogen) to check its suitability, increasing cost. Lastly, since the gas is storedwithin the porous rock formations, the gas experiences large flow resistance whilebeing injected or withdrawn from the storage [81]. This means that the injectingand withdrawing cycle can only be performed a maximum of two times a year [79].
36
4. Hydrogen Supply
Depleted hydrocarbon deposits are, as mentioned, usually, an aquifer wherenatural gas and/or oil have accumulated over millions of years [79]. In contrast toan aquifer, there is less need for testing one of these sites since it has proven tocontain gas already. Although some testing needs to be done to test the suitabilityof hydrogen instead of natural gas. It also has the benefit of already having certainnecessary equipment on-site, which reduces capital cost further [79].
The drawbacks can be seen as the opposite of those mentioned for aquifers. Theyare more regional specific and there is a higher chance of hydrogen being contam-inated during storage. Hydrogen contamination is also more evident if a depletedoil reserve is used rather than a natural gas reserve [79]. Lastly, since it functionssimilar to an aquifer, the maximum injecting and withdrawing cycle can only beperformed two times a year [79].
Salt caverns are, as opposed to the previously mentioned, made artificially. Asalt cavern is typically made from drilling a well in a salt formation or a salt dome.A natural structure that occurs when different kinds of minerals (mainly salt) arepushed upwards, expanding sedimentary rock that may lie on top of the salt. Afterthe well is drilled, water is pumped in to dissolve the salt which in the end createsa cavity [81]. The salt dome is considered impermeable meaning it is tight enoughto store gas in. It can be viewed as similar to a cylindrical steel tank only it usesrock and salt instead of steel for sealing and mechanical support. In addition, thesalt dome is significantly larger than a steel tank.
Since the storage is artificially made, it comes at a higher expense compared to theaquifer or depleted hydrocarbon reserve [79]. But since all hydrogen is stored in asingle space, not in porous rock formations, it can repeat the injection and withdrawcycle several times a year [79, 81]. Also, as previously mentioned, it is currently theonly underground storage method that has experience in storing hydrogen. Withsuccessful hydrogen storage facilities in Teeside, UK and Texas, US [78].
Lined rock cavern is similar to salt cavern storage where a well is drilled deepunderground. However, since the foundation is made out of rock and not salt, thenecessary tightness for storing gas is questionable [79]. To solve this, the well needsto be lined with steel to make the whole storage impermeable [78]. The spacebetween the rock and the steel is further filled with concrete. The advantages aresimilar to salt cavern storage but that it also significantly reduces the downside ofhaving location-specific storage [79]. The downside is that it increases the cost of thestorage significantly [79]. A facility like this exists in Skallen, Sweden for storage ofnatural gas [78]. A lined rock cavern is also currently the hydrogen storage methodproposed for the HYBRIT project in Sweden [82].
37
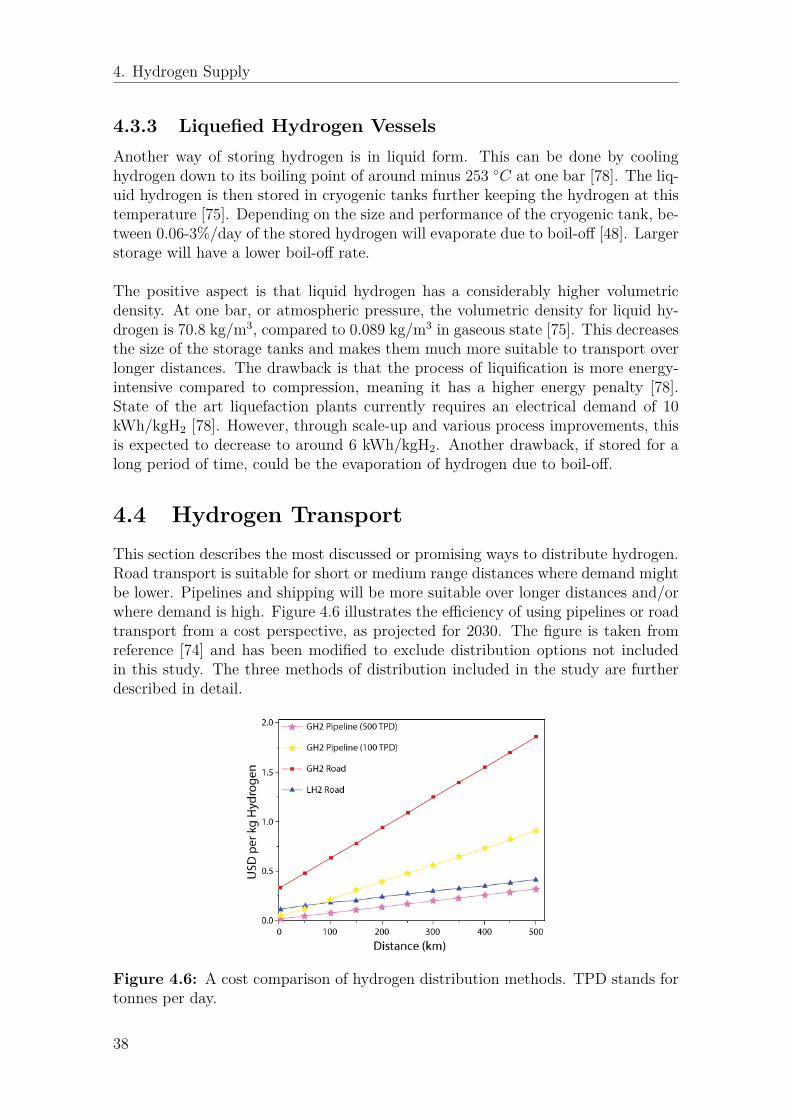
4. Hydrogen Supply
4.3.3 Liquefied Hydrogen VesselsAnother way of storing hydrogen is in liquid form. This can be done by coolinghydrogen down to its boiling point of around minus 253 ◦C at one bar [78]. The liq-uid hydrogen is then stored in cryogenic tanks further keeping the hydrogen at thistemperature [75]. Depending on the size and performance of the cryogenic tank, be-tween 0.06-3%/day of the stored hydrogen will evaporate due to boil-off [48]. Largerstorage will have a lower boil-off rate.
The positive aspect is that liquid hydrogen has a considerably higher volumetricdensity. At one bar, or atmospheric pressure, the volumetric density for liquid hy-drogen is 70.8 kg/m3, compared to 0.089 kg/m3 in gaseous state [75]. This decreasesthe size of the storage tanks and makes them much more suitable to transport overlonger distances. The drawback is that the process of liquification is more energy-intensive compared to compression, meaning it has a higher energy penalty [78].State of the art liquefaction plants currently requires an electrical demand of 10kWh/kgH2 [78]. However, through scale-up and various process improvements, thisis expected to decrease to around 6 kWh/kgH2. Another drawback, if stored for along period of time, could be the evaporation of hydrogen due to boil-off.
4.4 Hydrogen TransportThis section describes the most discussed or promising ways to distribute hydrogen.Road transport is suitable for short or medium range distances where demand mightbe lower. Pipelines and shipping will be more suitable over longer distances and/orwhere demand is high. Figure 4.6 illustrates the efficiency of using pipelines or roadtransport from a cost perspective, as projected for 2030. The figure is taken fromreference [74] and has been modified to exclude distribution options not includedin this study. The three methods of distribution included in the study are furtherdescribed in detail.
Figure 4.6: A cost comparison of hydrogen distribution methods. TPD stands fortonnes per day.
38

4. Hydrogen Supply
4.4.1 RoadBoth liquid and compressed gaseous hydrogen can be transported by truck, eitherin a liquid truck or a tube trailer. The tube trailer carries several cylindrical steeltanks that contain hydrogen at a pressure of 200-300 bar [74]. Depending on weightregulations on the truck, the weight of a storage tank, and the number of tanks, theamount of hydrogen a truck can carry ranges from 180-540 kg [74]. The weight ofthe tanks is typically the determining factor. If composite tanks are used instead,the carried amount can reach 560–720 kg [75]. Nonetheless, this is considered highlyinefficient and is only recommended at shorter distances and in lower amounts [74].
The liquid truck can carry more hydrogen per distance due to the increase in vol-umetric density [75]. The larger amounts make it a more suitable option for long-distance transport. Even though the liquification process in itself is more costlythan compression, the most economical solution is to use cryogenic tankers whichcan carry about 2.5-4 tonnes of hydrogen [75, 74].
Figure 4.6 illustrates the cost for using this method for both gaseous and liquidhydrogen. Other sources estimates the cost for road transport of either gaseous orliquid hydrogen to be in $1-2/kgH2, over a 100-500 km distance [83]. However, thesecosts also include cost of processing (liquefaction or compression).
4.4.2 PipelinePipelines are the most cost-effective method for transporting large amounts of hy-drogen over long distances continuously [74]. Several thousands of kg hydrogen canbe transported every hour. The initial cost of construction is high with a capital in-vestment that can range from 2.2-4.5 million $/km [83]. Today, the global hydrogenpipeline system is estimated to reach 16,000 km [74]. This is small in comparisonto natural gas which exceeds 2,000,000 km. Instead of new pipeline development,one proposal is to re-purpose the natural gas grid for it to function with hydrogen.This is estimated to be able to reduce the cost by 60% [74, 83]. Plans like thisare currently underway within the EU hydrogen strategy [2, 69]. The plan includesretrofitting 6,800 km of the natural gas grid to hydrogen until 2030 and 22,900 kmby 2040 [69]. However, the technical suitability needs to be assessed [2]. Since itis unsure if several of the natural gas grid components can function with hydrogen[74]. A new regulatory framework also needs to be put in place [2].
Figure 4.6 illustrates the cost for using this method depending on amount of hy-drogen. Other sources estimates these cost to be in $0.1-1/kgH2 over a the samedistance [83].
39
4. Hydrogen Supply
4.4.3 ShippingFor transport across the ocean, newly constructed or retrofitted pipelines can proveto be difficult [83]. Instead, shipping is being proposed with liquid hydrogen tankers.This is the case for Japan which will have limited resources to produce their ownhydrogen and will instead rely on imports, mainly from Australia [84]. In 2019,Japan developed the first liquid hydrogen tanker which has a volume capacity ofaround 9000 m3 [74]. With a volumetric density of 70.8 kg/m3 this amounts to closeto 640 tonnes. Once the demand for hydrogen grows, it is also expected that ports,ships, and liquid hydrogen process facilities will improve to meet this demand [74].The cost can range from 1-2 $/kg for distances up to 1000 km [83]. Using the samesource, for distance up to 5000 km the cost goes above $2/kgH2.
Another promising option for shipping hydrogen is to do it by storing it as an energycarrier in ammonia. However, as mentioned in section 4.3, methods of chemicalstorage (e.g ammonia) has not been covered in this study so neither has the shippingof it.
4.5 Cost of Hydrogen ProductionThe cost of hydrogen production can be determined by the levelised cost of hy-drogen. The total cost of installing and operating a hydrogen production facility,divided by the total hydrogen output each year. It is typically measured in $/kgH2.The LCOH by using electrolysis is illustrated by the following equation:
LCOH = CAPEX +OPEX (4.3)
The operational expenditure (OPEX) for electrolysis is dominated by the total costof electricity [85]. This is the cost of electricity (cel in $/kWh) multiplied with thesystems electricity consumption (qel,system in kWh/m3). Density (ρH2) inverted isapplied to receive the result in $/kg. The cost of electricity will in this case be de-termined by an energy source and its levelised cost of energy (LCOE). The LCOE issimilar as the LCOH but in regards to cost of energy generation instead of hydrogenproduction. Other cost in OPEX are the operation and maintenance cost (O&M in$/kg). For electrolysis, this typically stands for 2% of the initial CAPEX/year [66].The OPEX is illustrated in equation 4.4.
OPEX = cel ∗ qel,system
ρH2
+O&M (4.4)
40

4. Hydrogen Supply
In the case of the SOEC, thermal energy is also used in the operational expenditure.This decreases the amount of electricity used, but still needs to be accounted for interms of cost. This is illustrated in equation 4.5:
OPEX = cel ∗ (qel,EC + qel,BoP ) + cth ∗ qth
ρH2
+O&M (4.5)
Where the amount of electrical energy (qel,EC) in relation to thermal energy (qth) canbe determined from figure 4.2. qel,BoP is the electrical energy necessary to operatethe rest of the system (excluding the electrolyser). The sum of qel,EC and qel,BoP isequal to qel,system.
The capital expenditure (CAPEX) is the total cost for installing a electrolyser facil-ity. Illustrated by equation 4.6. The investment cost (Cinv) is the upfront cost forthe system (in $/kW ). The CRF is the capital recovery factor, a ratio used to de-termine the annual cash payments in order to pay back the initial investment. TheCRF is illustrated with equation 4.7. The CRF , investment cost, and electricityconsumption is divided by hours in a year and the capacity factor (Cf ). This factordescribes how much the facility is utilised each year. If it is utilised less, paymentsare being done without using the equipment. Lastly, the density inverted is used togive the result in $/kg.
CAPEX = Cinv ∗ qel ∗ CRF8760 ∗ Cf ∗ ρH2
(4.6)
CRF = i ∗ (1 + i)N
(1 + i)N − 1 (4.7)
From equation 4.7, the CRF is determined by the interest rate (i) and the paybackperiod (N in years) in years. In this case, the payback period is determined by thelifetime of the system, seen in equation 4.8.
N = telectrolyser ∗ (1 + (1− Cf ))8760 (4.8)
The total operational lifetime of the electrolyser (telectrolyser in hours) determinesthe maximum lifetime. But since the capacity factor determines the utilisationeach year. If utilised less, the electrolyser will have a longer lifetime. This is thusaccounted for in the equation. It is divided by hours in a year to have the result inyears instead of hours.
41
4. Hydrogen Supply
4.6 Summary of Hydrogen SupplyThe chapter has provided an overview of the important factors in the hydrogen sup-ply chain. Starting with production, 95% of all hydrogen is produced using fossilfuels. Out of this 95%, steam methane reforming is the most prominent methodglobally. This has the benefit of producing hydrogen at a low cost and is often lo-cated close to demand. For reforming to become a viable option in the future, thesefacilities will need to be installed with CCS. The technology itself and capturedCO2, which will further need to be transported and stored, increases the overall costof utilising this method.
The most prominent way of producing hydrogen without fossil fuels is electroly-sis. The electrolysis method uses low-carbon energy sources to separate hydrogenfrom water molecules. The three most promising technologies using electrolysisare alkaline- (AEC), proton exchange membrane- (PEM), and solid oxide (SOEC)electrolysers. The specific data for these three methods as well as steam methanereforming are summarised in table 4.3. In general, it can be stated that the AECand PEM use electricity to separate hydrogen from water. The SOEC uses high-temperature heat in addition to electricity to achieve the same purpose, reducingthe need for electricity. Although some more than others, all three are expected toreceive cost reductions through scale-up.
The nature of hydrogen also make it a a difficult substance to handle. Meaningthat not only the production of hydrogen needs to be consider in the supply chain,but also the storage and transport of it. In terms of storage, although more newand innovative solutions exist, this study has focused on the most mature meth-ods, including compression and liquefaction of hydrogen. Compression is less costlyand requires less energy to process. However, the volumetric density is low in pro-portion to liquid hydrogen. In turn, this makes it more costly to transport. Forcompressed gas, it can either be stored in steel tanks above ground or undergroundin geological caverns. For larger amounts, the latter mentioned is preferred. Variousunderground storage methods exist, such as aquifers, depleted hydrocarbon reserves,salt and lined rock caverns. For liquefied hydrogen, it is often stored above groundin cryogenic tanks. In regards to transport, three alternatives exist, namely road,pipeline or shipping. Transporting by road can be competitive if it is done with liq-uefied hydrogen. For compressed gas, it is only recommended for shorter distancesand in smaller amounts. Pipelines are the most preferred option for transportinglarge amounts of hydrogen continuously. They can be difficult to construct acrossoceans however, making shipping a more competitive option for this purpose. Ship-ping is done with liquefied hydrogen. Another future and promising method is toship ammonia, however, this method has not been analysed in this report.
Lastly, equations have been given on how to calculate the levelised cost of hydro-gen. In this study, this is used to calculate the cost competitiveness of hydrogenproduction using different means of electrolysis. This is done in chapter 7. In thefollowing chapter, the main energy source analysed in this study will be presented.
42
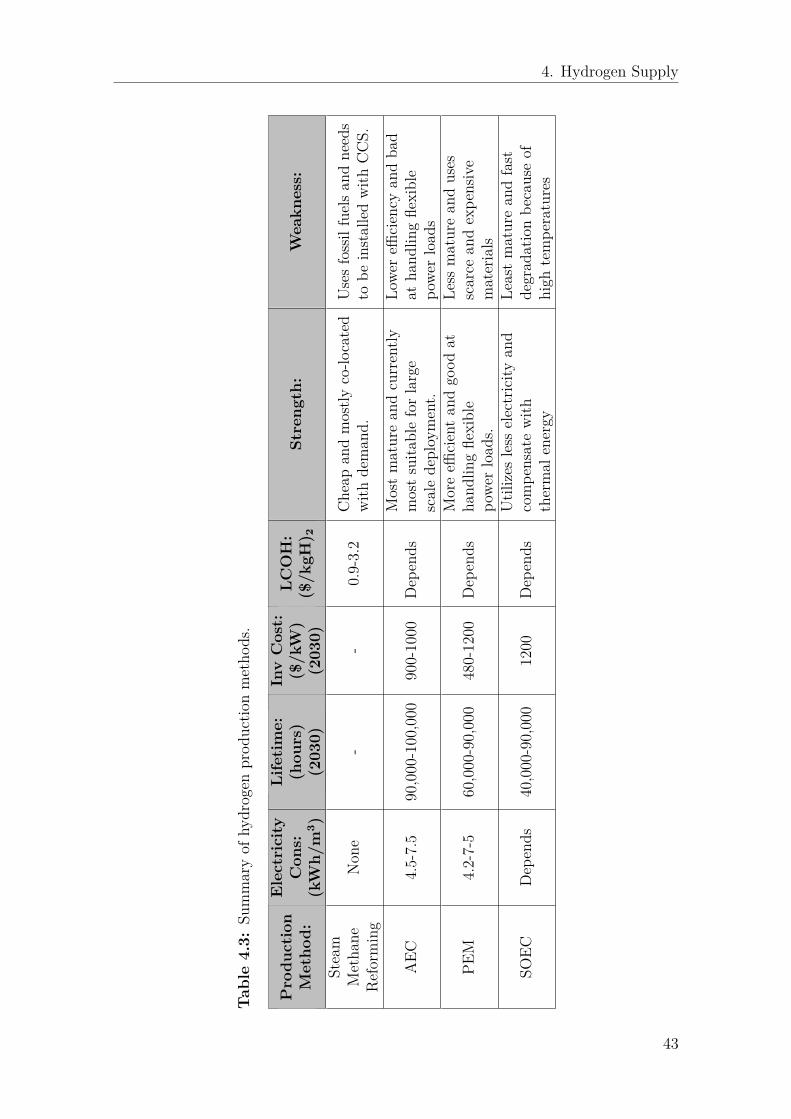
4. Hydrogen Supply
Tab
le4.3:
Summaryof
hydrogen
prod
uctio
nmetho
ds.
Produ
ction
Metho
d:
Electricity
Con
s:(kW
h/m
3 )
Lifetime:
(hou
rs)
(2030)
InvCost:
($/kW
)(2030)
LCOH:
($/k
gH) 2
Streng
th:
Weakn
ess:
Steam
Metha
neReforming
Non
e-
-0.9-3.2
Cheap
andmostly
co-lo
cated
with
deman
d.Usesfossilfuelsan
dneeds
tobe
installedwith
CCS.
AEC
4.5-7.5
90,000-100,000
900-1000
Dep
ends
Mostmaturean
dcurrently
mostsuita
bleforlarge
scaledeploy
ment.
Lowe
reffi
ciency
andba
dat
hand
lingflexible
powe
rload
s
PEM
4.2-7-5
60,000-90,000
480-1200
Dep
ends
Moreeffi
cientan
dgo
odat
hand
lingflexible
powe
rload
s.
Less
maturean
duses
scarce
andexpe
nsive
materials
SOEC
Dep
ends
40,000-90,000
1200
Dep
ends
Utilizes
less
electricity
and
compe
nsatewith
thermal
energy
Leastmaturean
dfast
degrad
ationbe
causeof
high
tempe
ratures
43

4. Hydrogen Supply
44

5Small Modular Reactors
In this chapter, the energy source of the overall structure is presented, as seen infigure 5.1. A number of energy sources are possible to support hydrogen production.The scope of the study is on nuclear energy and hydrogen production and the chapterwill therefore describe the concept of Small Modular Reactors (SMR). First a generaldescription is given, followed by common nuclear reactor technologies utilised inSMRs. Next, different economic aspects of SMRs is described. This is followed by areactor benchmark, comparing different SMR designs. Finally, some barriers to theconcept are described, as well as a potential timeline for the deployment of SMRs.
Figure 5.1: The chapter is in regards to the energy source part of the overallstructure.
5.1 Basic ConceptA SMR is loosely defined as a nuclear reactor having a power output capacity of lessthan 300 MWe, even though designs with higher output exist [11]. With “Small”referring to capacity and “Modular” referring to the modularisation of the plantmanufacturing and deployment. New builds of conventional nuclear power plants,with high costs and potentially overrunning schedules, are two of the reasons a needfor change has been highlighted. The smaller scale and modular design of SMRsaim to solve some of these challenges [86, 87, 88]. The economics of scale originatesfrom the number of units instead of the size of the units. Several units can then bebuilt together to add capacity incrementally and form a larger complex [87]. SMRscan be said to differ from conventional large designs in 5 areas: Safety, Scalability,Flexibility, Deployability, and Economics [86].
45
5. Small Modular Reactors
Safety inherently comes from the smaller design allowing for increasingly passivesafety systems and simpler designs. Passive safety means that the reactor does notneed the intervention of an operator or electronic feedback to shut down the reactorsafely. For example, safety features could rely on natural foces such as gravity ordifferences in density [87, 89]. This fact also opens up for smaller planning zonesand increases siting possibilities [86].
Scalability comes from the reactors modularity and their ability to be incremen-tally built to adapt to the required scale. The plant can be built over time adaptingto demand and provide economic benefits [86, 90].
Flexibility refers both to SMRs ability to be employed for different applicationsand also to the role in the power system [86]. Most SMRs are designed with someload-following capabilities for sharing grids with more intermittent sources [91]. Ap-plications considered, in addition to electricity generation, include heating for in-dustry and district heating, desalination, and hydrogen production [89].
Deployablity refers to the ability of constructing and inspecting the reactors al-most entirely in factories. The possibility to do site works parallel to manufacturingin factories reduces the timetable, with vendors estimating a build time of 3-5 years[86] as compared to up to 10 years for traditional large nuclear power plants [92].
Economic benefits is a factor of many elements that have been mentioned. Apossibility of shorter construction times, a higher level of modularisation, and stan-dardisation are some. Instead of economy of scale, economics of multiples originatesfrom many similar units being built over time and an increased learning rate canbe achieved [93]. Finally, being factory-built to a higher degree allows for bettercontrol of the manufacturing process and could reduce delays [93]. This is describedfurther in section 5.3.
5.2 Nuclear Reactor TechnologiesTo provide a better understanding of current and future nuclear technology, thissection will describe the technologies relevant for the study. This includes light-water reactors, high-temperature gas reactors and molten salt reactors. But othersnot mentioned here exist as well. The technologies researched in this study havebeen chosen since they are used in many SMR designs. There are however SMRsutilising other technologies not mentioned here. Some examples of designs utilisingthe technologies described here will be given in section 5.4.
5.2.1 Light-Water Reactor (LWR)Light-water reactors (LWR) are by far the most common type of reactor design inuse today. Water is used as both coolant and moderator and design can either usean indirect or direct steam cycle. The pressurised water reactor (PWR) utilises anindirect steam cycle and accounts for about 63% of all reactors in use today [94].
46
5. Small Modular Reactors
The boiling water reactor (BWR) instead utilises a direct steam cycle and standsfor about 18% of the current fleet [94]. The feedstock typically used is low enricheduranium in the form of pellets [95].
They work similarly, since they both uses nuclear fission to heat water. However,in the PWR, the coolant is under a pressure of about 15.5 MPa to prevent it fromboiling when heated to around 325◦C. The coolant is routed through a steam gen-erator where heat is transferred to a secondary cycle at a lower pressure generatingsteam. The steam drives a turbine which in turn drives a generator producingelectricity. The coolant in the primary system is then circled back to the core tobe heated again [95]. Many SMRs utilise an integral PWR (iPWR) design, mean-ing the steam generator is integrated with the pressure vessel. In the BWR thecoolant is boiled at a pressure of around 7.2 MPa and a temperature of 286◦C atthe core exit. The steam generated is routed to a turbine to generate electricity [95].
The fact that the technology is commercial today means it offers a ready meansof producing hydrogen through electrolysis of water and fits together with low-temperature electrolysis such as the AEC and PEM technologies.
5.2.2 Molten Salt Reactor (MSR)In contrast to the LWR, a molten salt reactor utilises, as the name indicates, moltensalt as the coolant. In addition, to act as a coolant, when a mixture of sodium, zir-conium, and uranium fluorides is used, the coolant also acts as the fuel. More recentdesigns, called advanced high-temperature reactors (AHTR) instead uses coated fuelparticles with low-enriched uranium [95].
The reactor operates at a lower pressure of around 0.5 MPa and the core outlet tem-peratures can reach as high as 700-1000◦C. The heat is transferred to a secondarycompact molten salt cycle to then be transferred to a third energy conversion loop[95]. The potential for high reactor outlet coolant temperatures of the molten salt re-actor enables the opportunity to utilise high-temperature electrolysis such as SOECcells to produce hydrogen [95]. It can also only generate electricity and thus becoupled with low-temperature electrolysis as well.
5.2.3 High-temperature Gas Reactor (HTGR)The high-temperature gas reactor (HTGR), also known as very high-temperaturereactor, is cooled by helium and moderated by graphite. The fuel is in the formof ceramic-coated particles to withstand high temperatures. The coolant can be upto 950◦C at the core outlet. Reactors using this technology have been designed indifferent scales, from 200 MWt (thermal) to 2400 MWt [95].
High-temperature electrolysis is an option that allows the electrolysers to operateat high efficiencies [95]. Similarly to an MSR, this can also be coupled to a high-temperature electrolysis technique as well as a low-temperature technique.
47
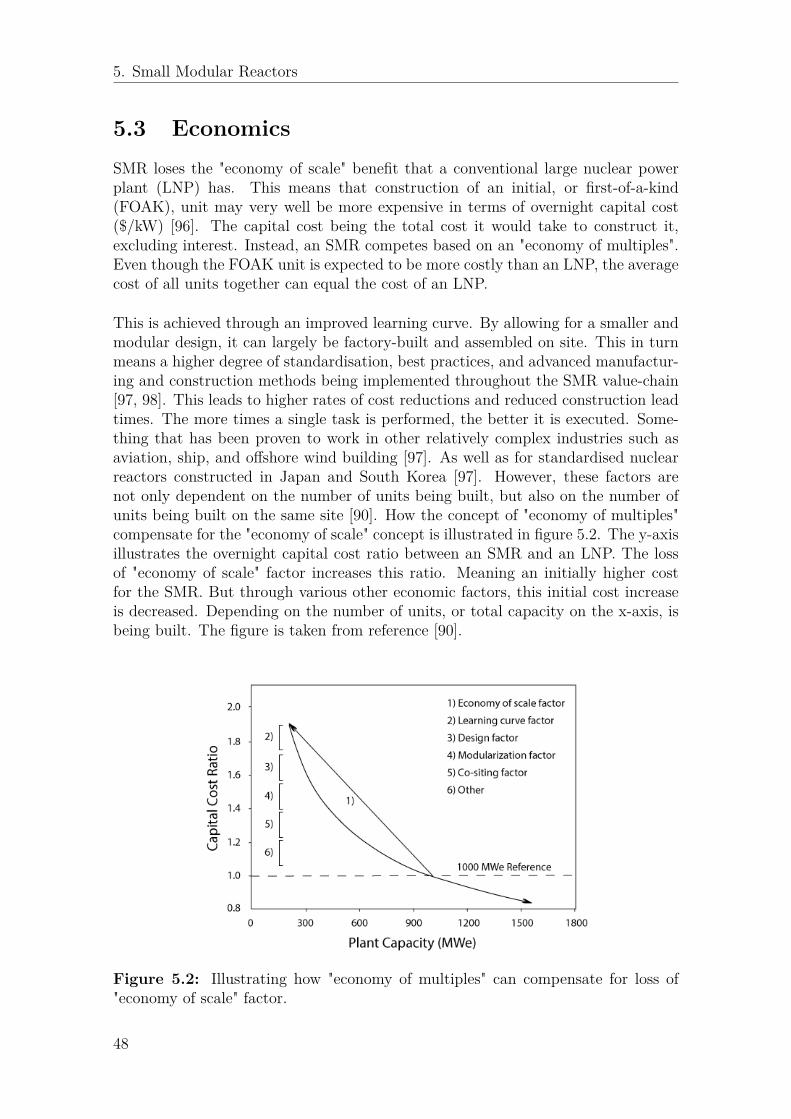
5. Small Modular Reactors
5.3 EconomicsSMR loses the "economy of scale" benefit that a conventional large nuclear powerplant (LNP) has. This means that construction of an initial, or first-of-a-kind(FOAK), unit may very well be more expensive in terms of overnight capital cost($/kW) [96]. The capital cost being the total cost it would take to construct it,excluding interest. Instead, an SMR competes based on an "economy of multiples".Even though the FOAK unit is expected to be more costly than an LNP, the averagecost of all units together can equal the cost of an LNP.
This is achieved through an improved learning curve. By allowing for a smaller andmodular design, it can largely be factory-built and assembled on site. This in turnmeans a higher degree of standardisation, best practices, and advanced manufactur-ing and construction methods being implemented throughout the SMR value-chain[97, 98]. This leads to higher rates of cost reductions and reduced construction leadtimes. The more times a single task is performed, the better it is executed. Some-thing that has been proven to work in other relatively complex industries such asaviation, ship, and offshore wind building [97]. As well as for standardised nuclearreactors constructed in Japan and South Korea [97]. However, these factors arenot only dependent on the number of units being built, but also on the number ofunits being built on the same site [90]. How the concept of "economy of multiples"compensate for the "economy of scale" concept is illustrated in figure 5.2. The y-axisillustrates the overnight capital cost ratio between an SMR and an LNP. The lossof "economy of scale" factor increases this ratio. Meaning an initially higher costfor the SMR. But through various other economic factors, this initial cost increaseis decreased. Depending on the number of units, or total capacity on the x-axis, isbeing built. The figure is taken from reference [90].
Figure 5.2: Illustrating how "economy of multiples" can compensate for loss of"economy of scale" factor.
48
5. Small Modular Reactors
These factors may compensate for the loss of the "economy of scale" benefit. But themain economic advantage of SMRs is decreasing the financial risk that comes withthe construction of nuclear power. A risk that can be considered the highest financialrisk of any energy generation related project [90]. Some discouraging examples existin the ongoing EPR (European Pressurised Reactor) projects in France, Finland,and the UK. An LNP project requires high up-front capital and takes considerabletime to construct. The global average is six years [99]. This in turn entails a longpay-back time for the project. Combining this with the fact that projects like thesesometimes lead to large cost-overruns and possible construction delays. But alsothat liberalised markets in general often deals with a high degree of uncertainty,leads to a high risk that needs to be paid for [96, 90]. Often as a premium thatis transferred to, and is in relation to, the capital investment [90]. An SMR cancounter this in the following ways:
• First, the lower up-front capital and reduced lead-times for each SMR unit(because smaller in size), leads to a risk reduction in itself. The longer theconstruction period, the higher the percentage of the capital cost is transferredin interest [90]. This means that if less investment is tied in, combined withshorter construction periods, the amount of interest paid is reduced.
• Second, because of the learning curve effect, even if there is a constructiondelay on the first SMR unit, the likelihood of this occurring, or the negativeoutcome from it, is decreased while constructing the second unit [98]. An-other point in relation to this, for an LNP, the consequence of a delay is alsotransferred to the entire project. Meaning the consequence is directly tied tothe total investment cost. While for an SMR, it is only transferred to thatparticular unit, and thus, the consequence is only tied to the investment costof a single unit and not the entire project. This minimises the consequence initself.
• Third, when one unit is built, it can start generating energy and thus a po-tential profit. This means that an SMR project can help in self-financing theconstruction of additional units. An LNP can only start paying back once theentire plant is built [8, 98].
In conclusion, the modular design also provides a more modular economic model.It responds better to market opportunity or uncertainty since an investor can eitherexpand, halt, or abandon a project in a more timely manner. The less "putting alleggs in one basket" advantage can attract more merchant financing and increase thesuitability of nuclear in more liberalised markets, such as the European and NorthAmerican power markets. It also opens up an introduction to the hydrogen market.
In terms of actual cost, different sources projects that the LCOE could be inthe range from $48-120/MWh [96, 98, 100, 101, 102]. With a median value at$71.5/MWh.
49
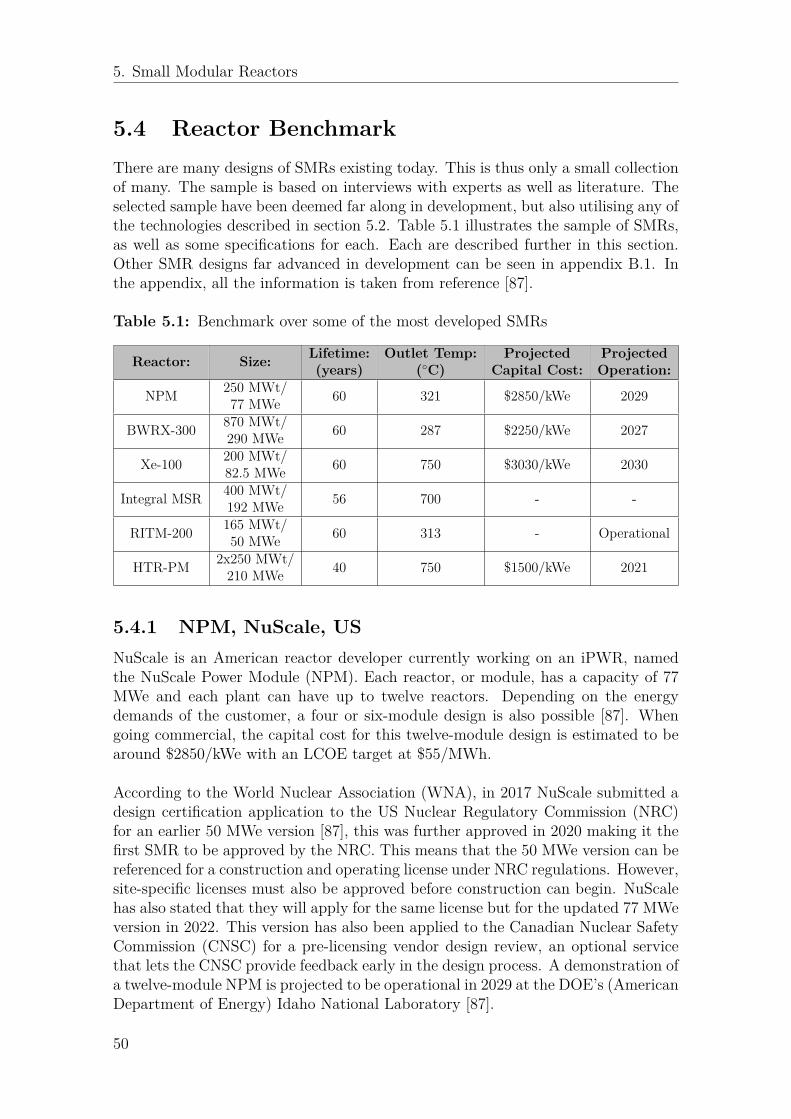
5. Small Modular Reactors
5.4 Reactor BenchmarkThere are many designs of SMRs existing today. This is thus only a small collectionof many. The sample is based on interviews with experts as well as literature. Theselected sample have been deemed far along in development, but also utilising any ofthe technologies described in section 5.2. Table 5.1 illustrates the sample of SMRs,as well as some specifications for each. Each are described further in this section.Other SMR designs far advanced in development can be seen in appendix B.1. Inthe appendix, all the information is taken from reference [87].
Table 5.1: Benchmark over some of the most developed SMRs
Reactor: Size: Lifetime:(years)
Outlet Temp:(◦C)
ProjectedCapital Cost:
ProjectedOperation:
NPM 250 MWt/77 MWe 60 321 $2850/kWe 2029
BWRX-300 870 MWt/290 MWe 60 287 $2250/kWe 2027
Xe-100 200 MWt/82.5 MWe 60 750 $3030/kWe 2030
Integral MSR 400 MWt/192 MWe 56 700 - -
RITM-200 165 MWt/50 MWe 60 313 - Operational
HTR-PM 2x250 MWt/210 MWe 40 750 $1500/kWe 2021
5.4.1 NPM, NuScale, USNuScale is an American reactor developer currently working on an iPWR, namedthe NuScale Power Module (NPM). Each reactor, or module, has a capacity of 77MWe and each plant can have up to twelve reactors. Depending on the energydemands of the customer, a four or six-module design is also possible [87]. Whengoing commercial, the capital cost for this twelve-module design is estimated to bearound $2850/kWe with an LCOE target at $55/MWh.
According to the World Nuclear Association (WNA), in 2017 NuScale submitted adesign certification application to the US Nuclear Regulatory Commission (NRC)for an earlier 50 MWe version [87], this was further approved in 2020 making it thefirst SMR to be approved by the NRC. This means that the 50 MWe version can bereferenced for a construction and operating license under NRC regulations. However,site-specific licenses must also be approved before construction can begin. NuScalehas also stated that they will apply for the same license but for the updated 77 MWeversion in 2022. This version has also been applied to the Canadian Nuclear SafetyCommission (CNSC) for a pre-licensing vendor design review, an optional servicethat lets the CNSC provide feedback early in the design process. A demonstration ofa twelve-module NPM is projected to be operational in 2029 at the DOE’s (AmericanDepartment of Energy) Idaho National Laboratory [87].
50

5. Small Modular Reactors
5.4.2 BWRX-300, GE-Hitachi, US & JapanGE-Hitachi is a joint venture between the American company General Electrics andthe Japanese company Hitachi. They have developed a 290 MWe BWR named theBWRX-300 [103]. This is a full passive safety reactor, which they have described as"the simplest, yet most innovative BWR design since GE began developing nuclearreactors in 1955". The BWRX-300 strongly focuses on optimising the cost of con-structing and operating a nuclear reactor [103]. This is done by further simplifyingan earlier NRC-licensed reactor. After initial reactors have been built, they expectthat the capital cost could be around $2250/kWe, provided that serial production istaking place.
According to the WNA, in 2019 the reactor design was submitted to the CNSCfor a pre-licensing vendor design review [87]. In 2020 they also submitted the firstlicensing report to the NRC. They are targeting being operational in the US by 2027and 2028 in Canada. They are also currently evaluating the economic feasibility ofconstructing a single BWRX-300 in Estonia and Poland.
5.4.3 Xe-100, X-energy, USX-energy is an American reactor developer currently working on a HTGR called Xe-100. The design consist of four modules with an 82.5 MWe and 200 MWth capacityper module. The outlet coolant temperature can reach 750 ◦C [103]. Although thedesign is not yet complete, X-Energy hopes their design will be finalised by the year2022 or 2023 [87]. They have also submitted a pre-licensing vendor design review tothe CNSC. At the moment it is estimated that the four-module design would costaround $1 billion. Dividing this with the total capacity of a four-module design, theaverage capital cost becomes $3030/kWe.
According to theWNA, in 2020 X-energy was awarded $80 million in funding to builda commercial-scale reactor that can be ready in 2027. The funding was providedby the DOE within their Advanced Reactor Demonstration Program. Within thesame year, the US Department of Defence also awarded a contract to develop theirdesign as a microreactor (below 10 MWe). Lastly, Jordan has signed a letter ofintent (2019), which could let X-energy build a 75 MWe four-module design by theyear 2030 [104]. Jordan has also been in discussion with other SMR vendors suchas Rolls Royce, the CNNC (China National Nuclear Corporation), NuScale, andRosatom.
51
5. Small Modular Reactors
5.4.4 Integral MSR, Terrestrial Energy, CanadaTerrestrial Energy is a Canadian nuclear developer. They are developing an integralmolten salt reactor with a thermal capacity of 440 MW and an electric capacity of195 MW [103]. The outlet temperature can reach 700 ◦C. The plan is to utilise twomodules per nuclear plant, however this could be scaled [87]. They expect the LCOEto be competitive to natural gas [87]. Assuming this means the LCOE from naturalgas in Canada, the average LCOE from natural gas ranges from $60-70/MWh [105].Terrestrial Energy is aiming to commission a commercial reactor sometime duringthe 2020s [103].
5.4.5 RITM-200, Rosatom, RussiaIn Russia, the RITM-200 reactor is already in use for marine purposes [87]. Morespecifically it is used on three icebreakers [103]. Construction of the RITM-200 onland is further planned to begin in 2024 and finished in 2027. The RITM-200 isa iPWR with a capacity of 175 MWt and 50 MWe [87]. It is envisioned that theland-based plant can be designed with two or more modules [103].
5.4.6 HTR-PM, ChinaOne reactor, based out of China, is the HTR-PM, a HTGR reactor with an outlettemperature of 750 ◦C. A demonstration of a plant that uses two modules is ex-pected to be operational in the second half of 2021 [103]. Each module has a 250MWt capacity and together drives a 210 MWe steam turbine [87].
The demonstration project will lay the foundation for the eventual six module (250MWt/module) design [87]. Factory and series produced units is projected to reacha capital cost of $1500/kW with an LCOE of $50/MWh [87].
5.5 Barriers to the Concept of SMRWith any new technology, there will be barriers hindering the development or de-ployment of it. In the case of SMRs, a concept building on previous technology andexperience from nuclear technologies that has existed commercially for many years.The development is not the primary problem. Instead, barriers foremost relating tothe deployment are highlighted by experts to be the most critical. In this section,the barriers relating to licensing and promotion of the technology will be described,as well as more general barriers relating to the deployment.
52

5. Small Modular Reactors
5.5.1 LicensingBefore a reactor design can be implemented commercially, it needs to be certifiedby a relevant regulatory body [90, 94]. For example, in Europe, the design mustbe certified in accordance with the European Utilities Requirements (EUR) butalso in accordance with national standards. In the UK, there is a four-step processtaking around four years, in the US it is the NRC, and in Canada it is the CNSC [94].
Proven and mature technology, such as the LWR implemented in an SMR design,should be more effective in licensing. In contrast to newer non-LWR advanced nu-clear technologies such as the MSR or the HTGR. The designs being licensed in thenear term will be dominated on proven LWR-technology [90]. The main responsi-bility of the regulatory authority and the licensing process is to assure all safety,environmental, regulatory, and policy issues have been addressed and resolved [90].The enhanced safety designs might also open up for the licensing authority to licenseSMRs with greater emphasis on probabilistic risk assessment (PRA) techniques [90].
Taking the US and the NRC as an example, near-term designs of SMRs utilisingPWR technology will be held to the same standards as conventional LNP. Some ofthe matters in licensing that are specific to SMRs are for example; smaller facilitieswith less security needed, greater redundancy, more passive features, smaller fuelinventory meaning a smaller amount of radioactivity released in an accident, and apotentially reduced emergency planning zone. Meaning a SMR and a LNP is notdirectly comparable. The modular nature of the SMR designs also requires licensingauthorities to deal with multi-module licensing and the issue of separate licenses foreach module, manufacturing licensing for the factories producing the modules, andcontrol-room staffing when using multiple modules [90].
The potential issue of licensing was brought up by many of the experts interviewed.Interviewees A, B, C, D, and E all brought up potential barriers originating fromlicensing issues. One of these, mentioned by interviewees A, C, D, and E, is thematter of licensing a design in many countries. As mentioned, the design needs tobe licensed in the country of origin, but also the country of deployment. This ishighlighted as a matter that could lead to large costs and time-consuming processesof having to re-license a design in many countries. No country is willing to lowerits standards, or for that matter admit that its standards are too low and increasethem. In a newcomer country, this issue becomes even more pronounced with humanresources and experience missing. Another issue is brought up by interviewees B andD in that not only the designs need licensing, but also the manufacturing process.The issue of licensing is seen as a huge barrier if SMR are to reach its full potential.
5.5.2 DeploymentAlthough licensing is the key barrier that needs to be overcome to fully realise thepotential of SMRs. Some other issues regarding the deployment were discussed dur-ing the interviews. One, highlighted by interviewees A and B, is that many of thenew developers are small in size. They do not have experience in large construction
53
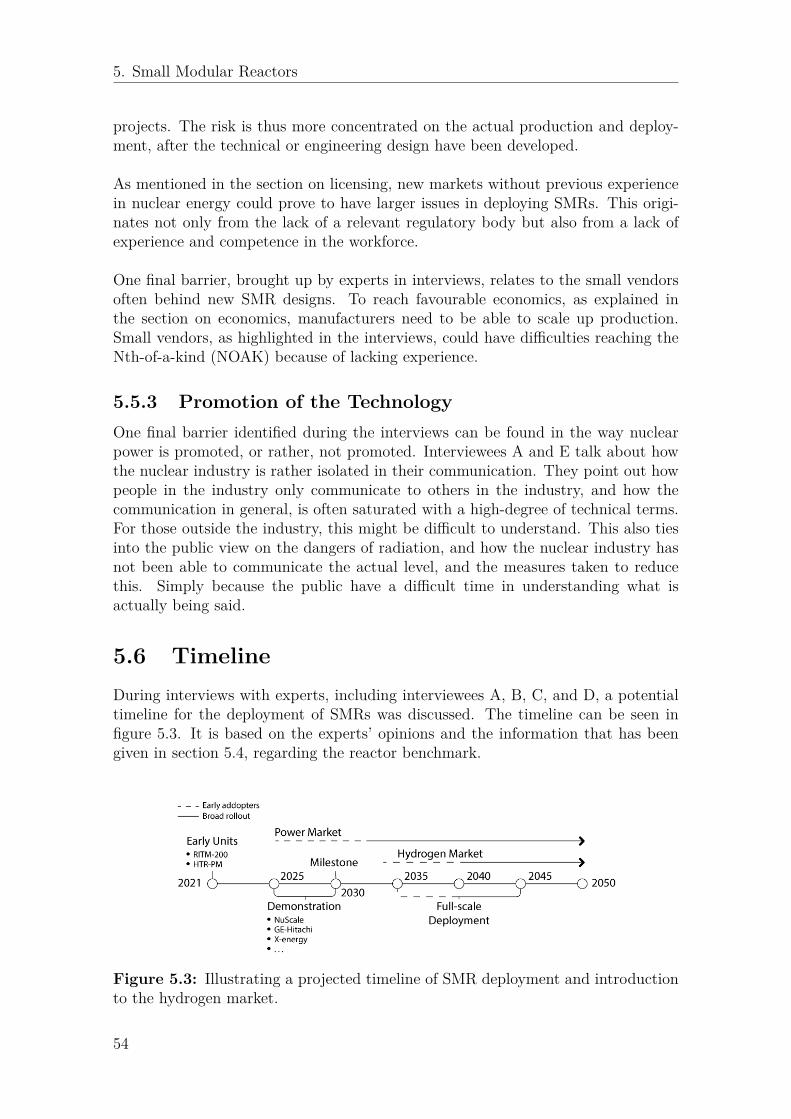
5. Small Modular Reactors
projects. The risk is thus more concentrated on the actual production and deploy-ment, after the technical or engineering design have been developed.
As mentioned in the section on licensing, new markets without previous experiencein nuclear energy could prove to have larger issues in deploying SMRs. This origi-nates not only from the lack of a relevant regulatory body but also from a lack ofexperience and competence in the workforce.
One final barrier, brought up by experts in interviews, relates to the small vendorsoften behind new SMR designs. To reach favourable economics, as explained inthe section on economics, manufacturers need to be able to scale up production.Small vendors, as highlighted in the interviews, could have difficulties reaching theNth-of-a-kind (NOAK) because of lacking experience.
5.5.3 Promotion of the TechnologyOne final barrier identified during the interviews can be found in the way nuclearpower is promoted, or rather, not promoted. Interviewees A and E talk about howthe nuclear industry is rather isolated in their communication. They point out howpeople in the industry only communicate to others in the industry, and how thecommunication in general, is often saturated with a high-degree of technical terms.For those outside the industry, this might be difficult to understand. This also tiesinto the public view on the dangers of radiation, and how the nuclear industry hasnot been able to communicate the actual level, and the measures taken to reducethis. Simply because the public have a difficult time in understanding what isactually being said.
5.6 TimelineDuring interviews with experts, including interviewees A, B, C, and D, a potentialtimeline for the deployment of SMRs was discussed. The timeline can be seen infigure 5.3. It is based on the experts’ opinions and the information that has beengiven in section 5.4, regarding the reactor benchmark.
Figure 5.3: Illustrating a projected timeline of SMR deployment and introductionto the hydrogen market.
54
5. Small Modular Reactors
Interviewees A, C, and D stated that demonstration of SMRs can take place in themid to late 2020s. This is also the projected timeline for many of the SMR develop-ers. In order for this to happen, interviewee A mentioned that some governmentalfunding is going to be needed in the early stages. If proven successful, commercialunits can start deploying in the early or mid-2030s, as stated by interviewees A, B,C, and D.
After this, the timeline becomes harder to predict. Interviewee A and B mentionthat for large-scale deployment, or series production, you are probably looking at2040 or beyond. Interviewee B further expands on this by stating that it is not onlyregulations around reactors that are going to be an issue, it is also regulations inregards to the factories and supply chain that needs to be accounted for. Intervie-wee C instead believes that 2035 is a more accurate date for large-scale deployment.This is further expanded on by stating that the RITM-200 reactor in Russia hasalready started series production in some regard. The question is rather where thenext SMR will be deployed outside of Russia. The US, Canada, and China are allpotential candidates.
Either way, all interviewees agree that the initial commercial units will most likelybe targeted towards the power market. This is a well-known and regulated marketwith standard procedures. It thus involves less risk than for the hydrogen market.When the concept of SMR is proven in a high enough degree, and the hydrogenmarket have stabilised, an SMR introduction towards hydrogen will be more likely.
5.7 Summary of Small Modular ReactorsSmall modular reactors (SMR), their functionality, and the economics of them havebeen described. SMRs differ from conventional large nuclear power plants in five ar-eas; Safety, Scalability, Flexibility, Deployability, and Economics. Different reactortechnologies exist in SMR designs and provide different opportunities. Light-waterreactors are the most common and fit together with low-temperature electrolysis.Molten salt reactors and high-temperature reactors can produce higher tempera-tures, enabling high-temperature electrolysis. Regarding the economics, SMRs cancompete on an "economy of multiples" with many smaller units and being factory-built, driving down the cost.
There are many vendors and designs of SMRs, with some having reached a moreadvanced stage in development than others. Nuscale, GE-Hitachi, and X-energy arehighlighted as examples of designs utilising different reactor technologies. Barriersto the concept of SMRs include licensing, with long processes that are individualto each country and regulatory body. Further barriers are concerns regarding thedeployment and the promotion of the technology. Finally, the timeline of the conceptof SMRs indicates that demonstration could take place in the mid to late 2020s, withcommercial units in the mid-2030s.
55

5. Small Modular Reactors
56
6Hydrogen and Small Modular
Reactors
In this chapter, the concept of utilizing SMRs to produce the large amounts ofhydrogen needed in the future is described. This is done by first describing the largeopportunity that exists in the large amounts of energy needed to produce hydrogen.Further, the synergies between small modular reactors and hydrogen production arehighlighted. Finally, the alternative ways of supplying energy and their respectivehydrogen supply architecture are discussed as well as how the total cost of deliveredhydrogen can be calculated.
6.1 Market OpportunityAs stated in chapter 3, regarding hydrogen demand, there are many applications inwhich hydrogen is used today. There are also many potential applications where itcan be used in the future. Current sources of demand include industrial applicationssuch as ammonia and methanol production, and also the steel industry. Regardingthe area of transportation, there are already today vehicles utilising hydrogen as fueland experts see a large potential within the sectors of long haul trucks, busses, andtrains. As stated in chapter 4, today over 95% of the hydrogen is produced usingfossil fuels. Following the increased cost of emitting carbon, and increased demandfor climate-neutral products. The demand for low-carbon hydrogen is expected toincrease. The first large demand for low-carbon hydrogen is predicted by experts tocome from the industrial processes which already today have an established demandthat is only expected to increase.
An effort will be made to illustrate the potential demand for hydrogen in the fu-ture. Table 6.1 illustrates the future hydrogen demand for a couple of applications,these have previously been presented in chapter 3. It also illustrates the amountof electricity it would take to produce these amounts of hydrogen, assuming 54%would be produced using electrolysis in 2030 and 62% in 2050, as recommended bythe IEA [57]. Further more, electrolysers electricity consumption is assumed to be 5kWh/m3 and a hydrogen density of 0.082 kg/m3 is used. Finally, it translates howmany SMRs with a 100 MWe capacity would be needed to satisfy this electricitydemand. This is done under the assumption that 20% of the total demand wouldutilise nuclear electrolysis, twice of what nuclear energy currently satisfy in terms ofglobal electricity generation [106]. Further more, 8760 hours in a year is used and anuclear capacity factor of 90%.
57
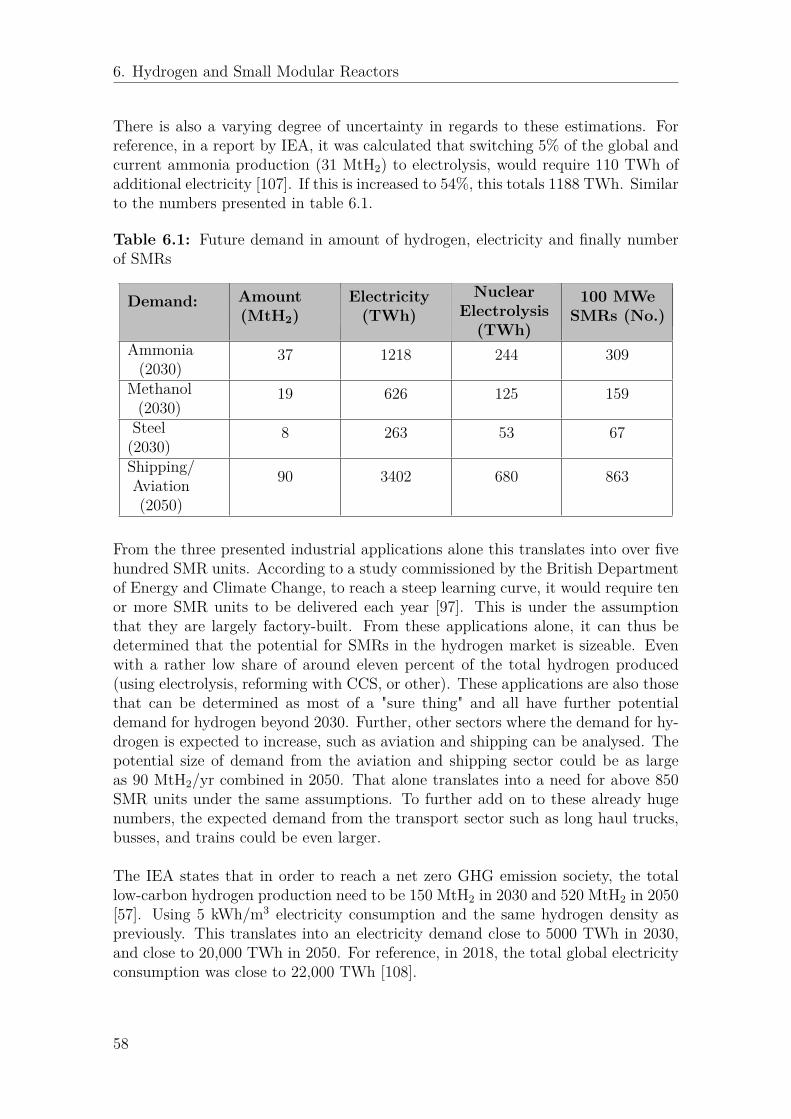
6. Hydrogen and Small Modular Reactors
There is also a varying degree of uncertainty in regards to these estimations. Forreference, in a report by IEA, it was calculated that switching 5% of the global andcurrent ammonia production (31 MtH2) to electrolysis, would require 110 TWh ofadditional electricity [107]. If this is increased to 54%, this totals 1188 TWh. Similarto the numbers presented in table 6.1.
Table 6.1: Future demand in amount of hydrogen, electricity and finally numberof SMRs
Demand: Amount(MtH2)
Electricity(TWh)
NuclearElectrolysis(TWh)
100 MWeSMRs (No.)
Ammonia(2030)
37 1218 244 309
Methanol(2030)
19 626 125 159
Steel(2030)
8 263 53 67
Shipping/Aviation(2050)
90 3402 680 863
From the three presented industrial applications alone this translates into over fivehundred SMR units. According to a study commissioned by the British Departmentof Energy and Climate Change, to reach a steep learning curve, it would require tenor more SMR units to be delivered each year [97]. This is under the assumptionthat they are largely factory-built. From these applications alone, it can thus bedetermined that the potential for SMRs in the hydrogen market is sizeable. Evenwith a rather low share of around eleven percent of the total hydrogen produced(using electrolysis, reforming with CCS, or other). These applications are also thosethat can be determined as most of a "sure thing" and all have further potentialdemand for hydrogen beyond 2030. Further, other sectors where the demand for hy-drogen is expected to increase, such as aviation and shipping can be analysed. Thepotential size of demand from the aviation and shipping sector could be as largeas 90 MtH2/yr combined in 2050. That alone translates into a need for above 850SMR units under the same assumptions. To further add on to these already hugenumbers, the expected demand from the transport sector such as long haul trucks,busses, and trains could be even larger.
The IEA states that in order to reach a net zero GHG emission society, the totallow-carbon hydrogen production need to be 150 MtH2 in 2030 and 520 MtH2 in 2050[57]. Using 5 kWh/m3 electricity consumption and the same hydrogen density aspreviously. This translates into an electricity demand close to 5000 TWh in 2030,and close to 20,000 TWh in 2050. For reference, in 2018, the total global electricityconsumption was close to 22,000 TWh [108].
58
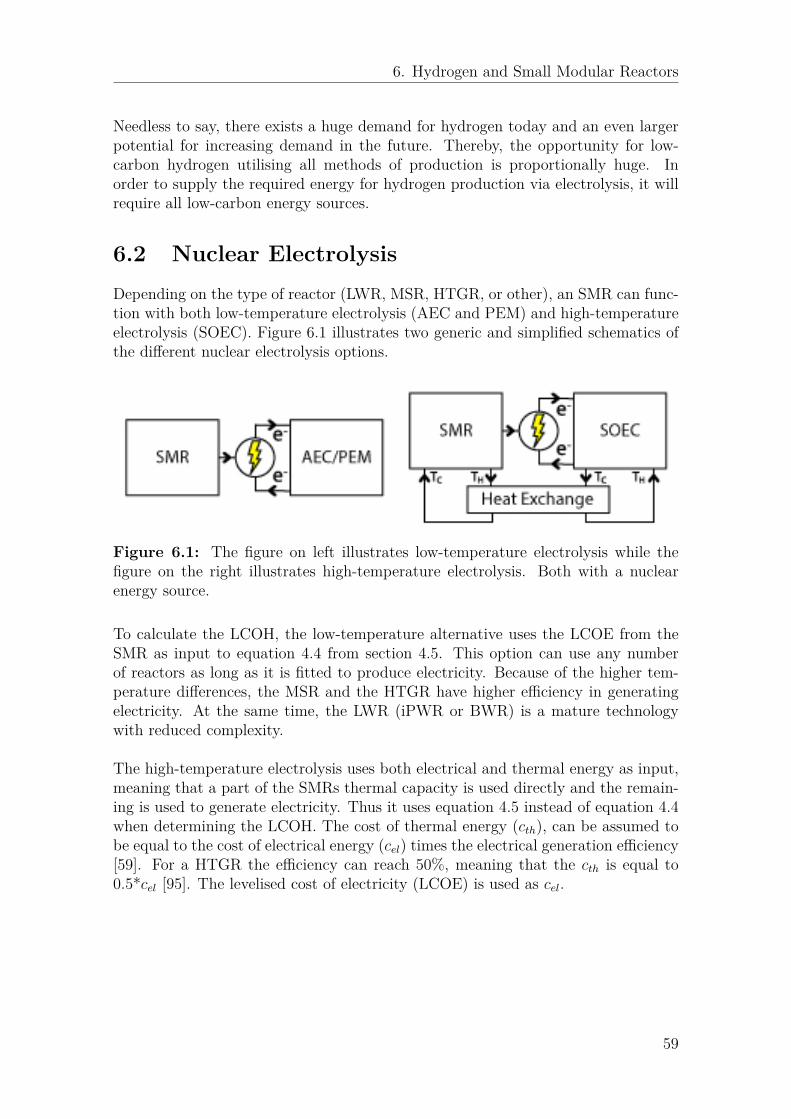
6. Hydrogen and Small Modular Reactors
Needless to say, there exists a huge demand for hydrogen today and an even largerpotential for increasing demand in the future. Thereby, the opportunity for low-carbon hydrogen utilising all methods of production is proportionally huge. Inorder to supply the required energy for hydrogen production via electrolysis, it willrequire all low-carbon energy sources.
6.2 Nuclear ElectrolysisDepending on the type of reactor (LWR, MSR, HTGR, or other), an SMR can func-tion with both low-temperature electrolysis (AEC and PEM) and high-temperatureelectrolysis (SOEC). Figure 6.1 illustrates two generic and simplified schematics ofthe different nuclear electrolysis options.
Figure 6.1: The figure on left illustrates low-temperature electrolysis while thefigure on the right illustrates high-temperature electrolysis. Both with a nuclearenergy source.
To calculate the LCOH, the low-temperature alternative uses the LCOE from theSMR as input to equation 4.4 from section 4.5. This option can use any numberof reactors as long as it is fitted to produce electricity. Because of the higher tem-perature differences, the MSR and the HTGR have higher efficiency in generatingelectricity. At the same time, the LWR (iPWR or BWR) is a mature technologywith reduced complexity.
The high-temperature electrolysis uses both electrical and thermal energy as input,meaning that a part of the SMRs thermal capacity is used directly and the remain-ing is used to generate electricity. Thus it uses equation 4.5 instead of equation 4.4when determining the LCOH. The cost of thermal energy (cth), can be assumed tobe equal to the cost of electrical energy (cel) times the electrical generation efficiency[59]. For a HTGR the efficiency can reach 50%, meaning that the cth is equal to0.5*cel [95]. The levelised cost of electricity (LCOE) is used as cel.
59

6. Hydrogen and Small Modular Reactors
In terms of scale, several electrolysers and SMRs can be used in order to reachthe desired capacity. For a large- and central demand, this means an economicbenefit of co-siting several SMR units. For a smaller- and decentralised demand,less SMR units would be needed. Meaning that the economic benefit of co-sitingcould be reduced. This will likely result in a higher LCOE and thus a higher LCOH.However, each demand needs an economic analysis on its own.
6.3 Analysis of the Synergies Between Hydrogenand Small Modular Reactors
Utilising energy from an SMR to produce hydrogen proves to provide many syn-ergies. In this section the synergies of heat from the reactor and heat demand inprocesses will be analysed. Further, high availability and a continuous supply of thereactor is another beneficial quality. Finally, the synergies in locating the energysource, and the modular nature of both electrolysers and SMRs are highlighted asthe primary synergies.
6.3.1 Process HeatOne synergy between hydrogen production and small modular reactors is the heatsupplied by a reactor and the heat demand from industries. Processes with a de-mand for hydrogen such as ammonia production, methanol production, and steelproduction all require process heat, as explained in chapter 3. As an example, whenH2 and N2 are combined using the Haber-Bosch process to create ammonia. Theprocess temperature is 450-550°C. Process conditions when producing methanol arearound 250°C. Heat is needed in steel production as well, where before the DRI thegas needs to be heated to around 900°C.
Further, the hydrogen production itself can benefit from adding heat to increase theefficiency, as outlined previously in section 4.2.1. High-temperature electrolysis hasa large potential to increase the electrical efficiency in hydrogen production whenpaired to a heat source such as a reactor.
In chapter 5, different designs of SMRs and the underlying technologies were de-scribed. Light water reactors can supply primary heat at up to around 300°C. Heatat this temperature could increase the efficiency of the processes mentioned above.Waste heat from the reactor could also increase efficiency in some applications.Molten salt reactors and high-temperature gas reactors could supply heat at evenhigher temperatures, up to 1000°C. The efficiency of processes could be increased,in addition to enabling high-temperature electrolysis.
60

6. Hydrogen and Small Modular Reactors
6.3.2 Availability and Continuous Production
Many of the processes discussed in this report, such as steel production and produc-tion of ammonia and methanol, rely on a continuous supply of energy and hydrogen.One clear example of this need for continuity in supply is in the production of steel,explained in section 3.1.3. Steel plants are cited to operate for more than 8000 hoursper year and have low flexibility in varying their production rate. Similar conditionsapply to other process industries.
Nuclear power is known to have the highest capacity factor of any other energysource. This enables nuclear plants, and SMRs in particular, to supply energy con-tinuously at the demanded rate. Hydrogen can thereby be produced at the requiredrate, supplying industries, and keeping production at high utilisation. If energy cannot be supplied at the demanded rate, facilities will require storage facilities to storehydrogen when they are able to produce. Increased size in variation will require anincreased size of storage and increased cost.
A fact is that electrolysers, used to produce hydrogen, have a high capital cost.To have a high level of utilisation of the electrolysers will therefore prove to beimportant to decrease cost. Nuclear production ensures a reliable energy source,regardless of weather patterns, and thereby ensures high utilisation of expensiveelectrolysis capacity.
6.3.3 Location
Another synergy between hydrogen production and SMRs is the flexibility in locat-ing. Industries requiring large amounts of hydrogen (ammonia, methanol, etc) areoften located in centralised industrial areas. An SMR could thereby operate at fullcapacity and supply many points of hydrogen demand. An SMR can also be locatedcloser to other industries having a smaller size and capacity, requiring a smallerplanning zone.
Being able to locate the energy source closer to demand will also decrease the needfor transporting and storing hydrogen. First, supply will be more certain, reducingthe need for storage. Second, lesser distances mean shorter distances for trans-porting energy or hydrogen. As explained, transporting hydrogen can be done indifferent ways, but all of them induce a cost. The cost of transport, together withstorage, is what is most uncertain today. By utilizing an SMR, this cost could inlarge part be avoided.
One final point relating to locating the energy source to produce hydrogen is thesmall footprint of SMRs. In relation to renewable sources, such as wind and solarPV, the geographical footprint of SMR per energy unit supplied is very small.
61

6. Hydrogen and Small Modular Reactors
6.3.4 ModularityOne final point of synergy between hydrogen production and SMRs is in the modu-larity of the techniques. Both electrolysers and SMRs are modular, meaning that alarger facility is built by many smaller units. In the case of SMRs, smaller reactormodules can be added to allow for adopting capacity to demand. The same appliesfor electrolysers, where stacks can be added to reach the desired production capacity.
As presented in section 5.3, the modular design also allows for a more flexible eco-nomic model. The fact that both technologies are modular, allows for a closer matchof capacity between the energy source and the production. This in turn induces lesscost invested in overcapacity. It also enables increasing capacity as required at thesame rate as demand increases. By increasing capacity, incrementally large one-timeinvestments and long periods without income during construction are avoided.
6.4 Alternative Production MethodsThe study has introduced mainly two different ways of producing hydrogen. Al-though there are others, the ones discussed in this study are steam reforming andelectrolysis. Steam reforming uses natural gas as an energy source while electrolysiscan use any number of energy generation sources. For the hydrogen to be producedin a low-carbon way, the steam reforming can further be installed with carbon cap-ture and storage (CCS). In the case of electrolysis, the energy can be generated fromeither nuclear power or RES (mainly wind and solar). Other low-carbon ways, forexample, the usage of biomass, have been mentioned but been further excluded fromanalysis in this study.
The choice of energy source and production method leads to different paths through-out the supply chain. With the help of SWOT analysis, this section describes thecombined energy and production method of reforming with CCS and RES withelectrolysis, and how these affect further choices throughout the supply chain. Theanalysis presented in this section relies on information from chapter 4 and informa-tion gathered during the interviews. More specifically from interviewees A, B, D, E,J, K, and L.
6.4.1 Reforming with CCSThe SWOT analysis of reforming with CCS can be seen in table 6.2 and is explainedin the following section. Although the use of CCS is expensive, the total productioncost of hydrogen is still relatively cheap compared with the alternatives. It is alsodispatchable, meaning it has the advantage to produce on demand. Thus, the mainopportunity of using steam methane reforming with CCS is that there is not muchthat needs to change. Companies using this method of production will not requireto make substantial changes to their main process. Interviewee B explains this bystating:
62
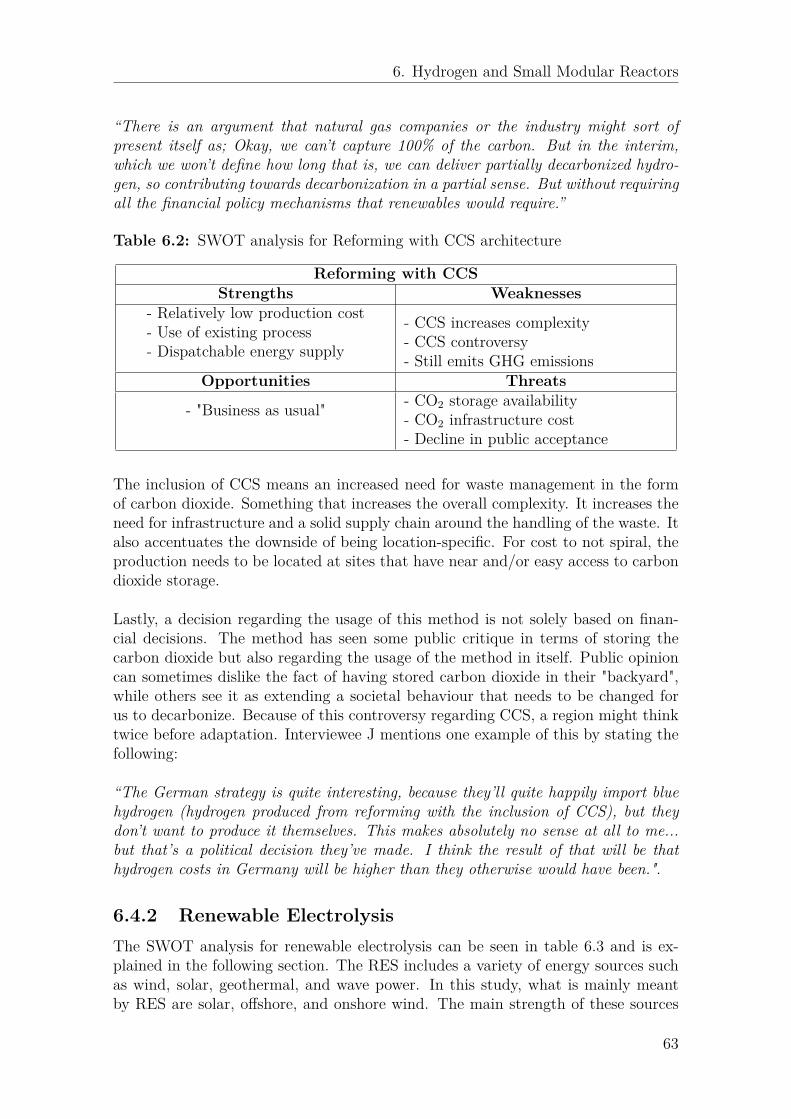
6. Hydrogen and Small Modular Reactors
“There is an argument that natural gas companies or the industry might sort ofpresent itself as; Okay, we can’t capture 100% of the carbon. But in the interim,which we won’t define how long that is, we can deliver partially decarbonized hydro-gen, so contributing towards decarbonization in a partial sense. But without requiringall the financial policy mechanisms that renewables would require.”
Table 6.2: SWOT analysis for Reforming with CCS architecture
Reforming with CCSStrengths Weaknesses
- Relatively low production cost- Use of existing process- Dispatchable energy supply
- CCS increases complexity- CCS controversy- Still emits GHG emissions
Opportunities Threats
- "Business as usual" - CO2 storage availability- CO2 infrastructure cost- Decline in public acceptance
The inclusion of CCS means an increased need for waste management in the formof carbon dioxide. Something that increases the overall complexity. It increases theneed for infrastructure and a solid supply chain around the handling of the waste. Italso accentuates the downside of being location-specific. For cost to not spiral, theproduction needs to be located at sites that have near and/or easy access to carbondioxide storage.
Lastly, a decision regarding the usage of this method is not solely based on finan-cial decisions. The method has seen some public critique in terms of storing thecarbon dioxide but also regarding the usage of the method in itself. Public opinioncan sometimes dislike the fact of having stored carbon dioxide in their "backyard",while others see it as extending a societal behaviour that needs to be changed forus to decarbonize. Because of this controversy regarding CCS, a region might thinktwice before adaptation. Interviewee J mentions one example of this by stating thefollowing:
“The German strategy is quite interesting, because they’ll quite happily import bluehydrogen (hydrogen produced from reforming with the inclusion of CCS), but theydon’t want to produce it themselves. This makes absolutely no sense at all to me...but that’s a political decision they’ve made. I think the result of that will be thathydrogen costs in Germany will be higher than they otherwise would have been.".
6.4.2 Renewable ElectrolysisThe SWOT analysis for renewable electrolysis can be seen in table 6.3 and is ex-plained in the following section. The RES includes a variety of energy sources suchas wind, solar, geothermal, and wave power. In this study, what is mainly meantby RES are solar, offshore, and onshore wind. The main strength of these sources
63
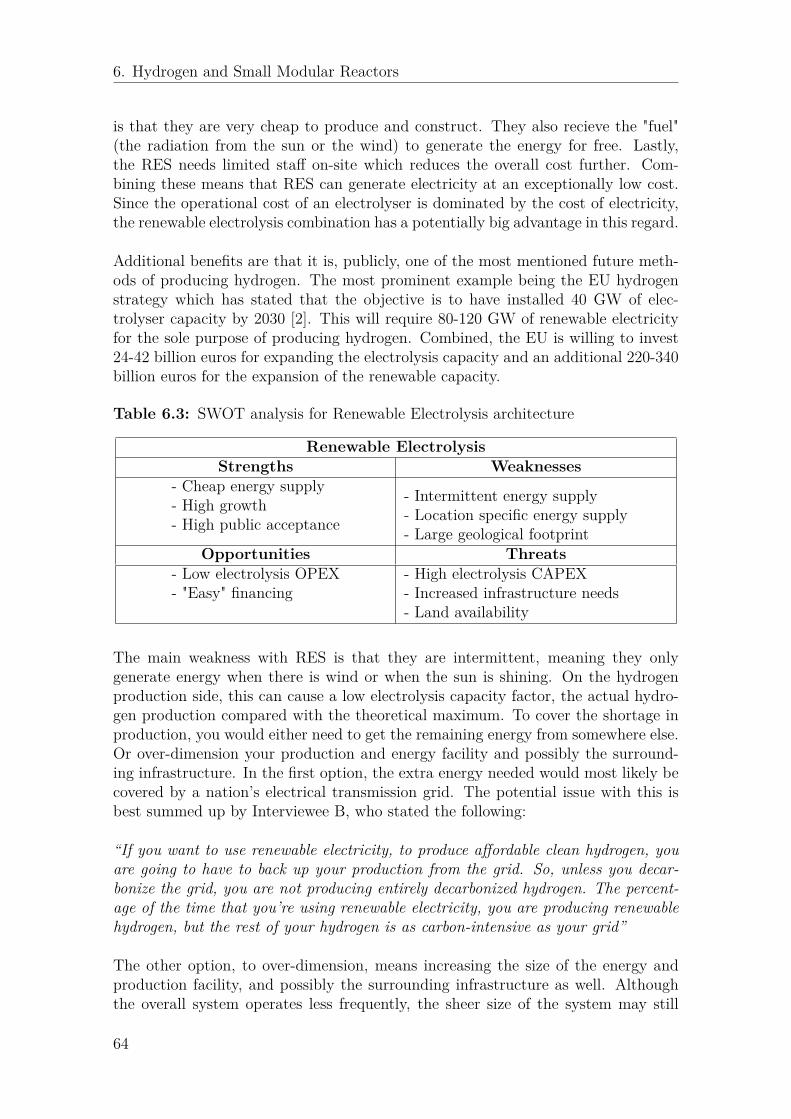
6. Hydrogen and Small Modular Reactors
is that they are very cheap to produce and construct. They also recieve the "fuel"(the radiation from the sun or the wind) to generate the energy for free. Lastly,the RES needs limited staff on-site which reduces the overall cost further. Com-bining these means that RES can generate electricity at an exceptionally low cost.Since the operational cost of an electrolyser is dominated by the cost of electricity,the renewable electrolysis combination has a potentially big advantage in this regard.
Additional benefits are that it is, publicly, one of the most mentioned future meth-ods of producing hydrogen. The most prominent example being the EU hydrogenstrategy which has stated that the objective is to have installed 40 GW of elec-trolyser capacity by 2030 [2]. This will require 80-120 GW of renewable electricityfor the sole purpose of producing hydrogen. Combined, the EU is willing to invest24-42 billion euros for expanding the electrolysis capacity and an additional 220-340billion euros for the expansion of the renewable capacity.
Table 6.3: SWOT analysis for Renewable Electrolysis architecture
Renewable ElectrolysisStrengths Weaknesses
- Cheap energy supply- High growth- High public acceptance
- Intermittent energy supply- Location specific energy supply- Large geological footprint
Opportunities Threats- Low electrolysis OPEX- "Easy" financing
- High electrolysis CAPEX- Increased infrastructure needs- Land availability
The main weakness with RES is that they are intermittent, meaning they onlygenerate energy when there is wind or when the sun is shining. On the hydrogenproduction side, this can cause a low electrolysis capacity factor, the actual hydro-gen production compared with the theoretical maximum. To cover the shortage inproduction, you would either need to get the remaining energy from somewhere else.Or over-dimension your production and energy facility and possibly the surround-ing infrastructure. In the first option, the extra energy needed would most likely becovered by a nation’s electrical transmission grid. The potential issue with this isbest summed up by Interviewee B, who stated the following:
“If you want to use renewable electricity, to produce affordable clean hydrogen, youare going to have to back up your production from the grid. So, unless you decar-bonize the grid, you are not producing entirely decarbonized hydrogen. The percent-age of the time that you’re using renewable electricity, you are producing renewablehydrogen, but the rest of your hydrogen is as carbon-intensive as your grid”
The other option, to over-dimension, means increasing the size of the energy andproduction facility, and possibly the surrounding infrastructure as well. Althoughthe overall system operates less frequently, the sheer size of the system may still
64

6. Hydrogen and Small Modular Reactors
be able to produce the correct amount of hydrogen. However, the larger system in-creases capital expenditure. Another issue with this is that although the producedhydrogen amount may be correct, it may not be produced exactly at the time it isneeded. This means that the hydrogen also needs to be stored for when it is needed,for days when there is no sun or wind. The overall system thus contains storage aswell. Interviewee J sums it up by stating the following:
“The big issue with hydrogen becomes if you’ve got variable renewables, you need abig electrolyser and you need lots of storage...
Lastly, sun and wind availability differ from region to region and the solar or windinstallations require a large geographical footprint. These energy sources are thuslargely location-specific, meaning that the hydrogen production needs to be co-located at the energy site. In this case, the hydrogen then needs to be transportedto the demand site. An alternative is that the energy needs to be transported to theproduction site, which is optimally located close to demand. This is summed up bycontinuing the quote from interviewee J:
"... and then you either need to transport the power from the renewables to the end-user, where you then convert it to hydrogen, or you need to transport the hydrogenfrom the production to the end-user. Either way, that’s going to be expensive. Soyou know, when we look at production costs, post-2030, we can see green (hydrogenproduced from renewable electrolysis) in some locations being almost competitive withblue. But when you look at the delivered cost, that’s a different story.”
6.5 Delivered CostThe total system cost includes more than just the production cost. The deliveredcost is something many experts have talked about, including interviewee J. Today,many of the companies with a demand for hydrogen produce it at their own siteco-located with the demand. This is possible since most hydrogen is produced fromnatural gas. As mentioned, to decrease the environmental impact, one alternativeis to install CCS on the reforming of natural gas. This adds cost in equipment butalso costs associated with transporting and storing the carbon dioxide which hasbeen captured.
If other energy sources, such as renewable energy sources, are to be used the energyproduction and location of demand are less likely to coincide. For one, there arelocations where there is better or worse availability of RES. To supply sufficientamounts of energy also require large resources in terms of land, another reason RESmight not be able to be co-located with the demand for hydrogen. Therefore, to theproduction cost of hydrogen from RES, a cost of transporting the hydrogen needsto be added. In addition, since RES is an intermittent energy source, storage willbe needed to store hydrogen in large amounts when unable to produce. The costof storage will therefore also have to be added to the production cost to get thedelivered cost.
65
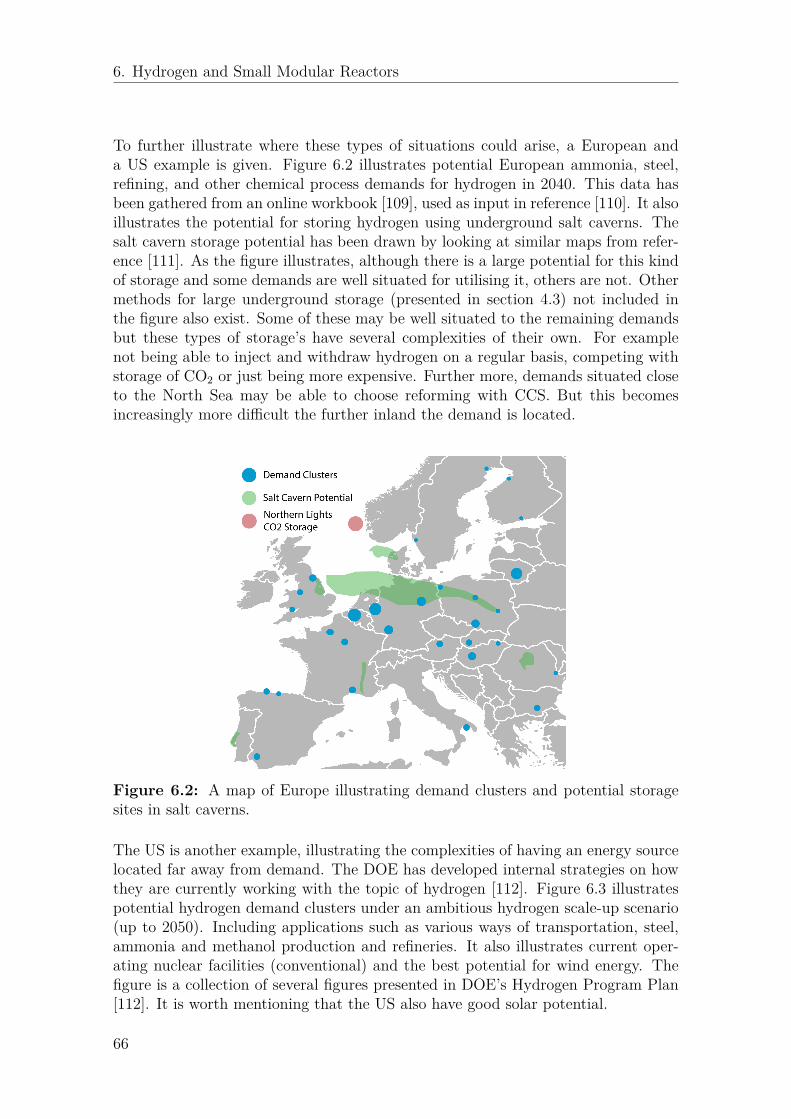
6. Hydrogen and Small Modular Reactors
To further illustrate where these types of situations could arise, a European anda US example is given. Figure 6.2 illustrates potential European ammonia, steel,refining, and other chemical process demands for hydrogen in 2040. This data hasbeen gathered from an online workbook [109], used as input in reference [110]. It alsoillustrates the potential for storing hydrogen using underground salt caverns. Thesalt cavern storage potential has been drawn by looking at similar maps from refer-ence [111]. As the figure illustrates, although there is a large potential for this kindof storage and some demands are well situated for utilising it, others are not. Othermethods for large underground storage (presented in section 4.3) not included inthe figure also exist. Some of these may be well situated to the remaining demandsbut these types of storage’s have several complexities of their own. For examplenot being able to inject and withdraw hydrogen on a regular basis, competing withstorage of CO2 or just being more expensive. Further more, demands situated closeto the North Sea may be able to choose reforming with CCS. But this becomesincreasingly more difficult the further inland the demand is located.
Figure 6.2: A map of Europe illustrating demand clusters and potential storagesites in salt caverns.
The US is another example, illustrating the complexities of having an energy sourcelocated far away from demand. The DOE has developed internal strategies on howthey are currently working with the topic of hydrogen [112]. Figure 6.3 illustratespotential hydrogen demand clusters under an ambitious hydrogen scale-up scenario(up to 2050). Including applications such as various ways of transportation, steel,ammonia and methanol production and refineries. It also illustrates current oper-ating nuclear facilities (conventional) and the best potential for wind energy. Thefigure is a collection of several figures presented in DOE’s Hydrogen Program Plan[112]. It is worth mentioning that the US also have good solar potential.
66
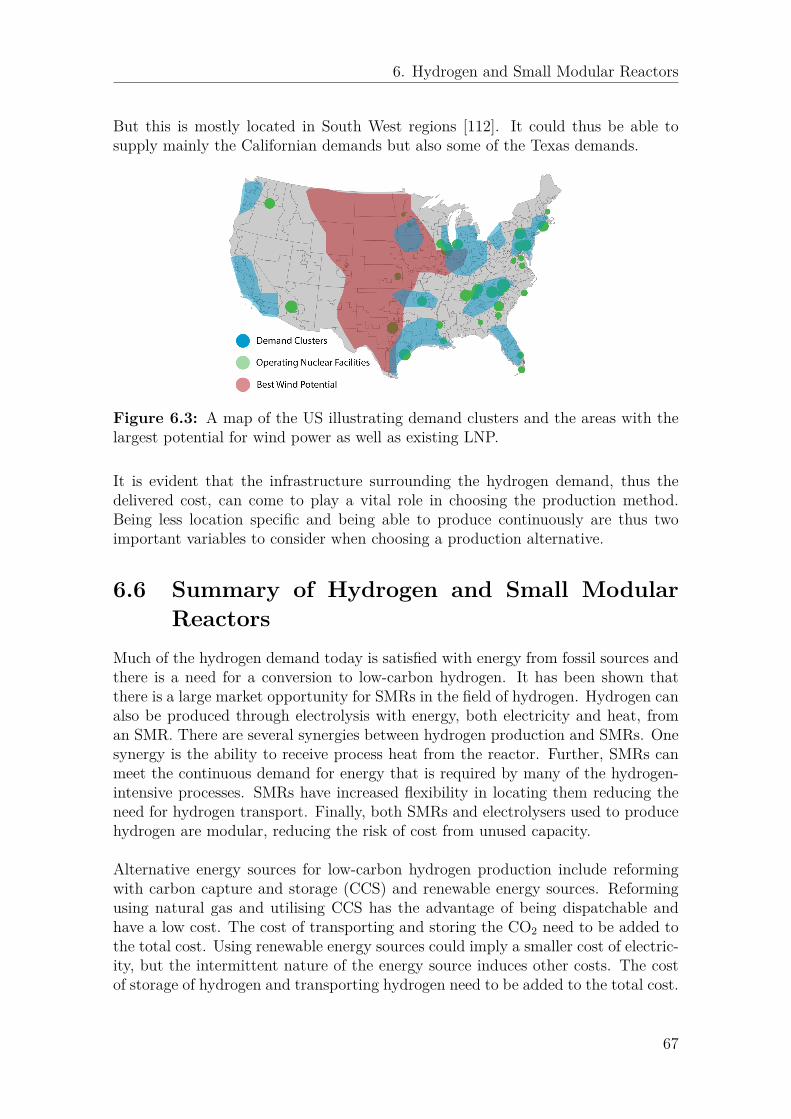
6. Hydrogen and Small Modular Reactors
But this is mostly located in South West regions [112]. It could thus be able tosupply mainly the Californian demands but also some of the Texas demands.
Figure 6.3: A map of the US illustrating demand clusters and the areas with thelargest potential for wind power as well as existing LNP.
It is evident that the infrastructure surrounding the hydrogen demand, thus thedelivered cost, can come to play a vital role in choosing the production method.Being less location specific and being able to produce continuously are thus twoimportant variables to consider when choosing a production alternative.
6.6 Summary of Hydrogen and Small ModularReactors
Much of the hydrogen demand today is satisfied with energy from fossil sources andthere is a need for a conversion to low-carbon hydrogen. It has been shown thatthere is a large market opportunity for SMRs in the field of hydrogen. Hydrogen canalso be produced through electrolysis with energy, both electricity and heat, froman SMR. There are several synergies between hydrogen production and SMRs. Onesynergy is the ability to receive process heat from the reactor. Further, SMRs canmeet the continuous demand for energy that is required by many of the hydrogen-intensive processes. SMRs have increased flexibility in locating them reducing theneed for hydrogen transport. Finally, both SMRs and electrolysers used to producehydrogen are modular, reducing the risk of cost from unused capacity.
Alternative energy sources for low-carbon hydrogen production include reformingwith carbon capture and storage (CCS) and renewable energy sources. Reformingusing natural gas and utilising CCS has the advantage of being dispatchable andhave a low cost. The cost of transporting and storing the CO2 need to be added tothe total cost. Using renewable energy sources could imply a smaller cost of electric-ity, but the intermittent nature of the energy source induces other costs. The costof storage of hydrogen and transporting hydrogen need to be added to the total cost.
67

6. Hydrogen and Small Modular Reactors
To calculate the delivered cost of hydrogen, the cost of storing and transportinghydrogen needs to be taken into account. In the case of reforming with CCS, thecost of transporting and storing CO2 need to be added to the production cost.Comparing sites of demand with sites of storage and production it becomes clearthat the delivered cost of hydrogen needs to be considered.
68

7Cost Comparison of Hydrogen
from Different SupplyArchitectures
The chapter illustrates the complete system, or architecture, shown in figure 7.1,by comparing the different alternatives under a set of assumptions. This includesresults from calculation determining the levelised cost of hydrogen (LCOH) usingdifferent energy sources. First, the data used, which has been illustrated in previouschapters, will be gathered and presented together with the assumptions for thecalculations. The calculated production cost is then presented, followed by thecalculated delivered cost.
Figure 7.1: The chapter describes the system part of the overall structure.
7.1 Analysing Levelised Cost of HydrogenThe LCOH utilising different energy sources will be determined. To give a com-parable number between different supply architectures, the total delivered cost iscalculated. As mentioned previously, the delivered cost includes additional costssuch as storage and transport for supply architectures that require it.
The analysis compares nuclear electrolysis to alternative methods mentioned pre-viously, namely renewable electrolysis. These two methods of producing hydrogenutilising electrolysis are the main focus, while steam methane reforming is used as abaseline since it is the most used method today. The addition is that carbon captureis added as a cost in the case of reforming, together with the cost for transportingand storing the carbon dioxide.
69
7. Cost Comparison of Hydrogen from Different Supply Architectures
Nuclear and renewable electrolysis have each been divided into two scenarios. Fornuclear, the first scenario, called the ’standard’, is based on a summary of differentmodels and predictions for what levelised cost of electricity (LCOE) SMRs are pre-dicted to reach. The second scenario, dubbed ’best case’ is based on what vendors ofSMRs project to deliver in terms of LCOE. Information on this has been providedpreviously in chapter 5 and will be seen as somewhat of an optimal case. Usingtwo cases for SMR is motivated by the difference between what has been predictedand modeled independently and what vendors hope to deliver. For renewable elec-trolysis, in the best case, both LCOE and the capacity factor is improved from thestandard case. The different cases thereby cover a larger span and enables compar-ing the different assumptions.
The four scenarios compared will thereby be:• Small Modular Reactor with electrolysis, standard (SMR standard)• Small Modular Reactors with electrolysis, best case (SMR best case)• Renewable Energy Source with electrolysis, standard (RES standard)• Renewable Energy Source with electrolysis, best case (RES best case)• Reforming Natural Gas with Carbon Capture and Storage (Reforming CCS)
7.2 AssumptionsIn this section, the data and assumptions are presented. First, the calculations arebased on numbers from 2030 and beyond. Second, a large central demand (indus-try applications) has been assumed, making transport by road and above groundstorage unfeasible. Third, the different alternatives operate under different circum-stances meaning that they all have their own supply architecture. The data andassumptions for each alternative will thus be presented for each stage in the supplyarchitecture; energy source, production method, and transport and storage.
For reforming with CCS, LCOH calculations in regards to production have not beenperformed. This means that there are no assumptions for this alternative regardingenergy and production. Instead, a reference value for this method is taken fromtable 4.1. The reference value taken is aimed at Europe, with an LCOH of $2.35/kg.However, the supply architecture for this alternative also includes the transport andstorage of carbon dioxide. The additional cost for this will be presented in thetransport and storage section.
7.2.1 Energy SourceThe presented data is for the nuclear and renewable alternative (can be seen in table7.1). Both energy sources can produce electricity meaning they can both use low-temperature electrolysis (LTE). The energy parameters for low-temperature electrol-ysis include the cost of electricity (Cel) and the capacity factor (Cf ). The nuclearalternative also has the added benefit of using heat for high-temperature electrolysis(HTE), meaning this alternative also includes cost of thermal energy (Cth).
70
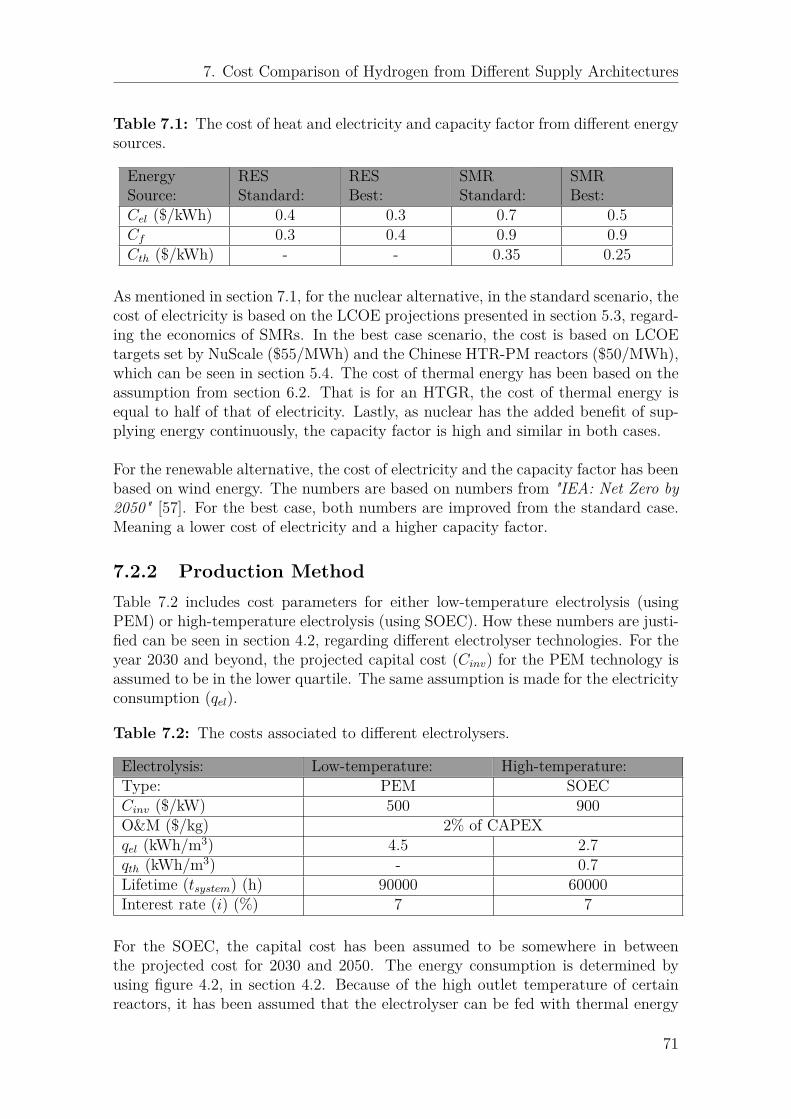
7. Cost Comparison of Hydrogen from Different Supply Architectures
Table 7.1: The cost of heat and electricity and capacity factor from different energysources.
EnergySource:
RESStandard:
RESBest:
SMRStandard:
SMRBest:
Cel ($/kWh) 0.4 0.3 0.7 0.5Cf 0.3 0.4 0.9 0.9Cth ($/kWh) - - 0.35 0.25
As mentioned in section 7.1, for the nuclear alternative, in the standard scenario, thecost of electricity is based on the LCOE projections presented in section 5.3, regard-ing the economics of SMRs. In the best case scenario, the cost is based on LCOEtargets set by NuScale ($55/MWh) and the Chinese HTR-PM reactors ($50/MWh),which can be seen in section 5.4. The cost of thermal energy has been based on theassumption from section 6.2. That is for an HTGR, the cost of thermal energy isequal to half of that of electricity. Lastly, as nuclear has the added benefit of sup-plying energy continuously, the capacity factor is high and similar in both cases.
For the renewable alternative, the cost of electricity and the capacity factor has beenbased on wind energy. The numbers are based on numbers from "IEA: Net Zero by2050" [57]. For the best case, both numbers are improved from the standard case.Meaning a lower cost of electricity and a higher capacity factor.
7.2.2 Production MethodTable 7.2 includes cost parameters for either low-temperature electrolysis (usingPEM) or high-temperature electrolysis (using SOEC). How these numbers are justi-fied can be seen in section 4.2, regarding different electrolyser technologies. For theyear 2030 and beyond, the projected capital cost (Cinv) for the PEM technology isassumed to be in the lower quartile. The same assumption is made for the electricityconsumption (qel).
Table 7.2: The costs associated to different electrolysers.
Electrolysis: Low-temperature: High-temperature:Type: PEM SOECCinv ($/kW) 500 900O&M ($/kg) 2% of CAPEXqel (kWh/m3) 4.5 2.7qth (kWh/m3) - 0.7Lifetime (tsystem) (h) 90000 60000Interest rate (i) (%) 7 7
For the SOEC, the capital cost has been assumed to be somewhere in betweenthe projected cost for 2030 and 2050. The energy consumption is determined byusing figure 4.2, in section 4.2. Because of the high outlet temperature of certainreactors, it has been assumed that the electrolyser can be fed with thermal energy
71
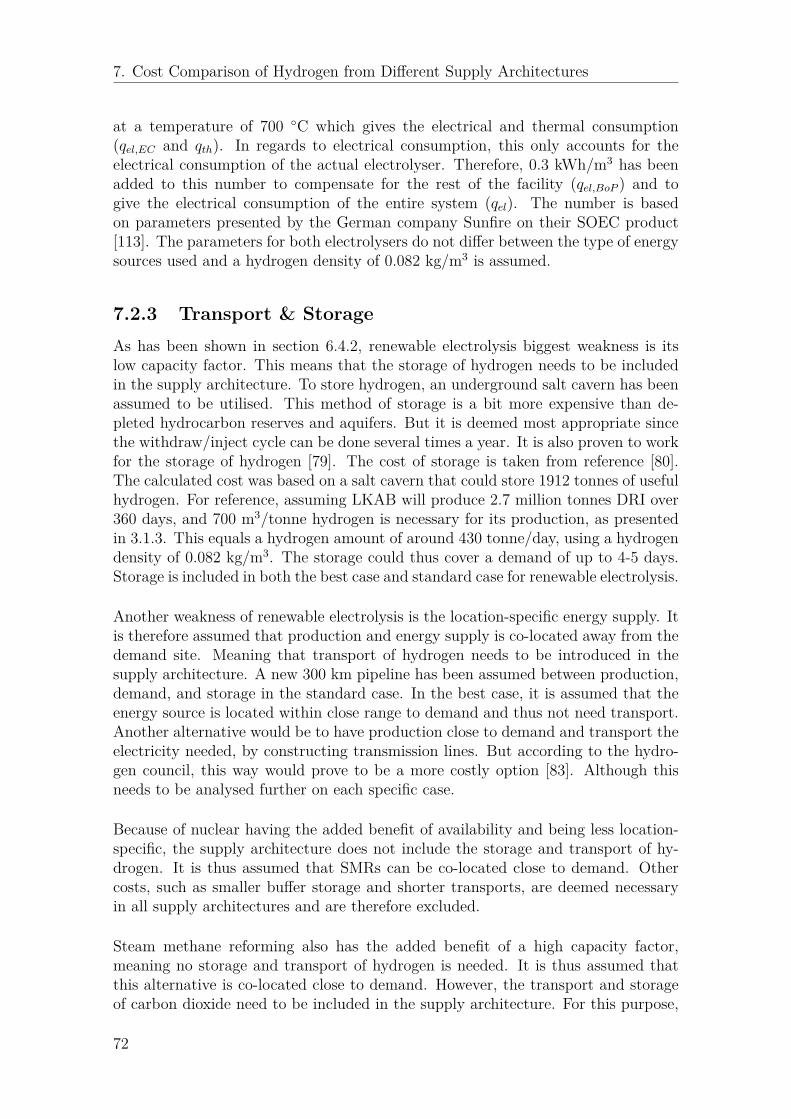
7. Cost Comparison of Hydrogen from Different Supply Architectures
at a temperature of 700 ◦C which gives the electrical and thermal consumption(qel,EC and qth). In regards to electrical consumption, this only accounts for theelectrical consumption of the actual electrolyser. Therefore, 0.3 kWh/m3 has beenadded to this number to compensate for the rest of the facility (qel,BoP ) and togive the electrical consumption of the entire system (qel). The number is basedon parameters presented by the German company Sunfire on their SOEC product[113]. The parameters for both electrolysers do not differ between the type of energysources used and a hydrogen density of 0.082 kg/m3 is assumed.
7.2.3 Transport & StorageAs has been shown in section 6.4.2, renewable electrolysis biggest weakness is itslow capacity factor. This means that the storage of hydrogen needs to be includedin the supply architecture. To store hydrogen, an underground salt cavern has beenassumed to be utilised. This method of storage is a bit more expensive than de-pleted hydrocarbon reserves and aquifers. But it is deemed most appropriate sincethe withdraw/inject cycle can be done several times a year. It is also proven to workfor the storage of hydrogen [79]. The cost of storage is taken from reference [80].The calculated cost was based on a salt cavern that could store 1912 tonnes of usefulhydrogen. For reference, assuming LKAB will produce 2.7 million tonnes DRI over360 days, and 700 m3/tonne hydrogen is necessary for its production, as presentedin 3.1.3. This equals a hydrogen amount of around 430 tonne/day, using a hydrogendensity of 0.082 kg/m3. The storage could thus cover a demand of up to 4-5 days.Storage is included in both the best case and standard case for renewable electrolysis.
Another weakness of renewable electrolysis is the location-specific energy supply. Itis therefore assumed that production and energy supply is co-located away from thedemand site. Meaning that transport of hydrogen needs to be introduced in thesupply architecture. A new 300 km pipeline has been assumed between production,demand, and storage in the standard case. In the best case, it is assumed that theenergy source is located within close range to demand and thus not need transport.Another alternative would be to have production close to demand and transport theelectricity needed, by constructing transmission lines. But according to the hydro-gen council, this way would prove to be a more costly option [83]. Although thisneeds to be analysed further on each specific case.
Because of nuclear having the added benefit of availability and being less location-specific, the supply architecture does not include the storage and transport of hy-drogen. It is thus assumed that SMRs can be co-located close to demand. Othercosts, such as smaller buffer storage and shorter transports, are deemed necessaryin all supply architectures and are therefore excluded.
Steam methane reforming also has the added benefit of a high capacity factor,meaning no storage and transport of hydrogen is needed. It is thus assumed thatthis alternative is co-located close to demand. However, the transport and storageof carbon dioxide need to be included in the supply architecture. For this purpose,
72

7. Cost Comparison of Hydrogen from Different Supply Architectures
a mean value between $36-65/tCO2 has been used from the Norwegian NorthernLights cost presented in section 4.1. It is also estimated that the production methodproduces ten tonnes of CO2 for each tonne of hydrogen. With a 90% capturing rate,this results in a total of nine tonnes of CO2 needed to be stored for each tonneof hydrogen. Thus, the cost is multiplied by a factor of nine and converted into$/kgH2. All numbers are presented in table 7.3 below.
Table 7.3: The cost of transporting and storing hydrogen and corbon dioxide.
Alternative RES SMR ReformingTransport (H2)($/kgH2)
0.48 (Std case) - -
Storage (H2)($/kgH2)
1.61 (Both cases) - -
Storage andTransport (CO2)($/kgH2)
- - 0.5
7.3 Hydrogen Production CostUsing equation 4.3, 4.4, 4.6, 4.7 and 4.8 for the PEM, equation 4.3, 4.5, 4.6, 4.7and 4.8 for the SOEC, with data from table 7.1-7.2 produces the following resultwhich are seen in figure 7.2. It illustrates the production cost for each electrolysisalternative. The values for the reforming alternative are used as a reference valuefor competitiveness. The result has also been compared with other sources who haveshown similar numbers [2, 3, 18].
Figure 7.2: The production cost of hydrogen for different supply sources.
73
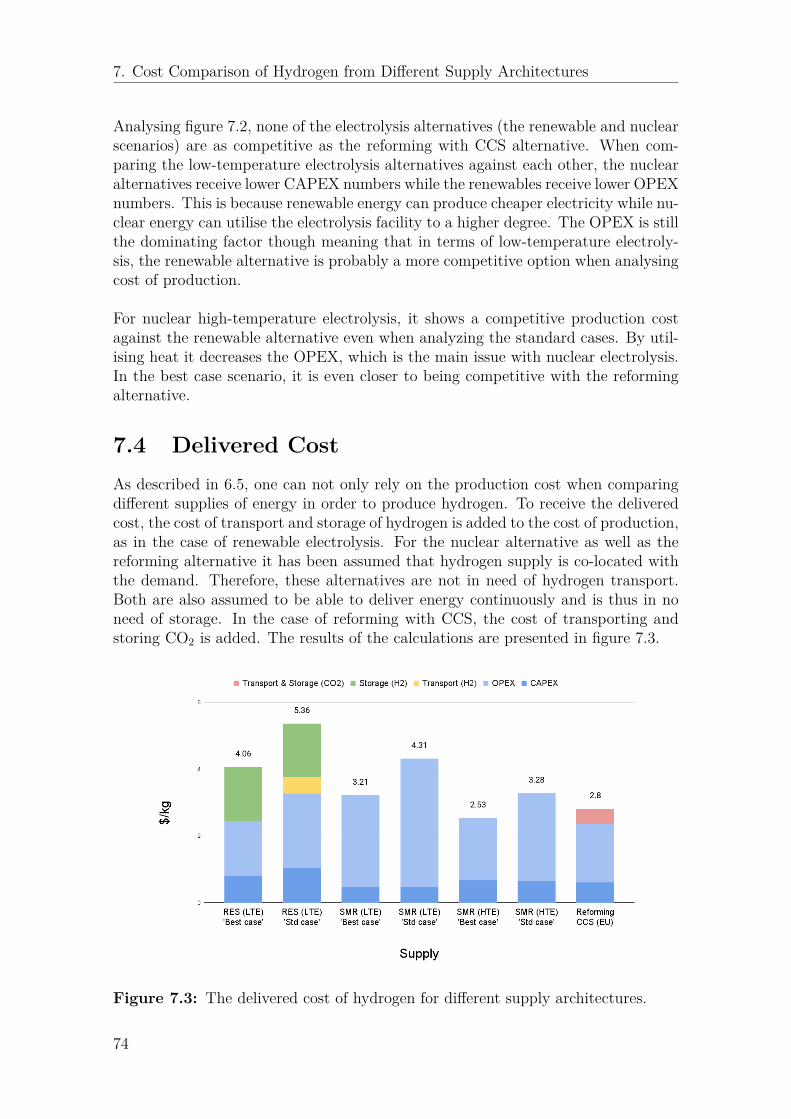
7. Cost Comparison of Hydrogen from Different Supply Architectures
Analysing figure 7.2, none of the electrolysis alternatives (the renewable and nuclearscenarios) are as competitive as the reforming with CCS alternative. When com-paring the low-temperature electrolysis alternatives against each other, the nuclearalternatives receive lower CAPEX numbers while the renewables receive lower OPEXnumbers. This is because renewable energy can produce cheaper electricity while nu-clear energy can utilise the electrolysis facility to a higher degree. The OPEX is stillthe dominating factor though meaning that in terms of low-temperature electroly-sis, the renewable alternative is probably a more competitive option when analysingcost of production.
For nuclear high-temperature electrolysis, it shows a competitive production costagainst the renewable alternative even when analyzing the standard cases. By util-ising heat it decreases the OPEX, which is the main issue with nuclear electrolysis.In the best case scenario, it is even closer to being competitive with the reformingalternative.
7.4 Delivered CostAs described in 6.5, one can not only rely on the production cost when comparingdifferent supplies of energy in order to produce hydrogen. To receive the deliveredcost, the cost of transport and storage of hydrogen is added to the cost of production,as in the case of renewable electrolysis. For the nuclear alternative as well as thereforming alternative it has been assumed that hydrogen supply is co-located withthe demand. Therefore, these alternatives are not in need of hydrogen transport.Both are also assumed to be able to deliver energy continuously and is thus in noneed of storage. In the case of reforming with CCS, the cost of transporting andstoring CO2 is added. The results of the calculations are presented in figure 7.3.
Figure 7.3: The delivered cost of hydrogen for different supply architectures.
74

7. Cost Comparison of Hydrogen from Different Supply Architectures
From figure 7.3, it can be seen that the renewable electrolysis supply architecturereceive an increase in cost from transport and storage of hydrogen. Thus, whenaccounting for the delivered cost, nuclear electrolysis will be a competitive, andeven the less costly electrolysis alternative. Looking at the SMR ’best case’, it canbe seen that high-temperature electrolysis is not only competitive with the RESalternative but also with reforming with CCS. To the reforming alternative, a costfor transporting and storing the carbon dioxide is added, giving the total cost of$2.80/kgH2, compared to $2.53/kgH2 for the SMR alternative.
To validate the result, a comparison to data from the Hydrogen Council can be made[83]. For the renewable alternative, the Hydrogen Council found that the deliveredcost could reach up to $5/kgH2 in 2030 [83], corresponding well to the presentedresult. In their scenario, using other assumptions, transport cost had an increasedpercentage of the total cost however. The cost of production and the cost of storagewere also lower in that case, compared to the result shown in section 7.3.
7.5 Conclusion of Cost ComparisonFour scenarios where compared in terms of production cost and delivered cost ofhydrogen. First, comparing these different types of technology options is complex,since it is difficult to set a precise system boundary in a generic case. Therefore,the presented numbers should not be taken as an absolute value of cost. In orderto achieve a more precise result, each individual case needs to be studied in detail.One of the research questions stated "Under what conditions can an SMR be a vi-able alternative for hydrogen production?". With this in mind, these calculations areinstead aimed at illustrating an answer to this question, and not defining a precisenumber in terms of cost. With this said, it is argued that the result of the calcula-tions, including the assumptions made, can be compared in relation to each other.
Under the assumptions made, the result illustrate that when only considering pro-duction cost, reforming is the cheapest option, followed by the best case RES andthen SMR utilising high-temperature electrolysis. The improved result using high-temperature electrolysis emphasises the strengths and efficiency-gains of utilisingheat from the reactor in the process of producing hydrogen. Even with the SOECinitially being a more costly option. In terms of low-temperature electrolysis, al-though the best case scenario for SMRs could compete in some regard, renewablesare likely looking to be a more competitive option. Under the assumption that pro-duction can be co-located with demand, and storage can be managed cost-effectively.Considering all electrolysis options, being competitive with reforming could proveto be difficult if production stand to be the only determining factor.
75

7. Cost Comparison of Hydrogen from Different Supply Architectures
Further more, the result should be related to that in section 6.5. Two examples wasshown of where future large demands are likely to be located in Europe and theUS, assuming a large-scale deployment of hydrogen. In relation to the demand, italso illustrate that the supply architecture is not always optimally built for certainalternatives. Meaning, production should in some cases not only be the determiningfactor. Nuclear electrolysis have an advantage over renewable electrolysis in regionswith low renewable capacity and semi-optimal storage locations. It could furtherbenefit in places far away from CO2 storage.
76

8Discussion
This chapter contains a discussion of the research conducted in this study. Figure8.1 illustrates the structure of the discussion. First, a discussion on the topic will bepresented. This includes discussion on hydrogen, SMR and the combination betweenthem. This is presented in section 8.1 to 8.6 and is based on the general result of thisstudy and interviews of experts. Second, a discussion is held on the actual study.Section 8.7 to 8.9 discuss the validity of the result and approach in general. Lastly,a discussion is held on the ethical considerations of the topic.
Figure 8.1: Illustrating the structure of the chapter, including a discussion on thetopic and discussion on the study in general.
8.1 Hydrogen - The Fuel of the Future?The hydrogen economy is in very early development and is, at the current stage,surrounded by uncertainties. On the demand side, it is almost presented as if itwould replace the entire energy system including power applications, heating, severalenergy-intensive industries, and transport. This is unlikely to happen since there areother and probably better alternatives for some of these applications. IntervieweeI said the following: "It is not for all applications and we must look at when itis a good idea to use and when it is not. As the debate looks now nobody knows.Many are guessing, hoping, believing, and betting but there will certainly be a lot ofapplications where hydrogen will play an important factor". In regards to intervieweeI’s last sentence, this study has highlighted some of these. It has also accountedfor which ones might have a suitable connection with SMRs. The ones analysedhave been divided into industrial and transportation applications and are furtherdiscussed. In general, it can be stated that the industrial demands are more certainto predict, while transportation has a potentially larger demand but with a higherdegree of uncertainty.
77
8. Discussion
8.1.1 Industrial ApplicationsHydrogen is being proposed as a energy carrier and fuel for a wide range of ap-plications, as outlined in chapter 3. The major industrial ones were described insection 3.1 and included in the study are ammonia, chemical processes industries,refineries, and steel production. For ammonia, refineries, and chemical process in-dustries such as methanol, there is a direct need for hydrogen. Therefore, theseconsumers of hydrogen can be seen as a "sure thing" in terms of demand, at leastin the short- and medium-term. Ammonia and methanol have further been pro-posed as synthetic fuels for various transportation sectors, meaning they have anadditional potential to grow. Refineries producing various transportation fuels area bit more unsure. Since there are substitutes to petrol and diesel in the trans-portation sector, some have predicted that the demand for these fuels will decrease[110]. This translates to a decrease in the sector and thus a decrease in hydrogendemand. Others, for example, interviewees B and H, think it will rather be a shift intheir product inventory. If there is a decrease in demand for petrol and diesel, theremight be an increase in demand for biofuels. The process of producing biofuels alsorequires more hydrogen than for example diesel, described by interviewee H. Thismeans that although this industry will likely decrease as a whole, their future needfor hydrogen might still be on similar levels as today. This is all very speculative,and largely dependent on what future fuels will be used in the transportation sector.
The steel industry, described in 3.1.3, also uses hydrogen today and is estimated tobe one of the sectors with the most potential growth. The DRI process for producingsteel is not a new technology and is used in many places to produce steel. Today, theprocess is mainly fed with natural gas. Hydrogen can function as a direct substitutefor natural gas, with only minor changes to the overall process. Although, the qual-ity of the product is weakened and will need to be improved upon somehow. Themajor obstacle is that low-carbon hydrogen is looking to replace natural gas, notcarbon-rich hydrogen as for the previously mentioned industries. Regarding this,interviewee J said that “When we look at the cost gap between carbon-rich hydrogenand low-carbon hydrogen, we can see how that might be bridged. But when we lookat the cost gap between natural gas and hydrogen, it’s much bigger... We think youprobably need a carbon price around 200-250 euros per tonne of carbon emissionsto bridge that gap, which is, you know, a long way off from where we are now, andprobably where we see it naturally developing in the next 20 years”. This could bea potential issue in regions with a large share of natural gas, such as the MiddleEast or North America. Nevertheless, in Europe, most major steel manufacturersinclude DRI fed with hydrogen in their future roadmaps. Regions with a high shareof natural gas are probably looking more towards the instalment of carbon captureand storage (CCS).
All these industrial applications have similar needs in that they have a large- andcentralised demand, require continuous production, and uses process heat to a vary-ing degree. To fulfil the demand with the help of electrolysis, two barriers can beidentified. The first is the sheer size of the demand. Currently, even with the benefitof modularity, the electrolysers are too small to produce the significant amount of
78
8. Discussion
hydrogen that these industries will need. Thus, electrolysers will need to scale up ifthey are to compete with reforming with CCS. The other is price-competitiveness.Chapter 7 illustrated that even if including the cost of storage and transport ofCO2, this could prove to be difficult. On the other hand, CCS is by no means asure thing, the technology is not yet fully mature and has several issues on its own.There is also a varying degree of stigma surrounding it and the availability of natu-ral gas plays a key factor. Still, for electrolysis to become more competitive, eitherthe consumption or cost of electricity needs to decrease. The last option is for theinvestment cost of electrolysers to decrease. A generic "one is always better thanthe other" conclusion cannot be drawn here. Each region and case is different andwill need an analysis on its own. The prerequisites of each case will determine thestrongest alternative in terms of competitiveness. Important and general param-eters to analyse are continuous production, production cost, and co-location withdemand.
8.1.2 TransportationAfter the industrial demands for hydrogen, the study has discussed the vast oppor-tunities in transportation applications in section 3.2. Utilising hydrogen in trans-portation can prove to be one part of the puzzle in decarbonising a sector oftendescribed as hard to abate. Vehicles including passenger cars, busses, trucks, andtrains have already been proven to be able to run on hydrogen. Applications suchas aviation and shipping also have potential demand for hydrogen in the future, onewhich could prove to be significant.
As the study shows in chapter 3.2, in the shorter ranges and smaller-in-size appli-cations, there is an uncertainty on whether battery-powered or fuel cell-poweredelectric vehicles will have the largest share. Battery-powered vehicles (BEVs) haveestablished themselves on the market with many vehicles in operation as well asa growing infrastructure for charging. Fuel-cell electric vehicles (FCEVs) exist butit has been shown that the demand has to reach a certain range and use patternfor them to have a competitive cost. The infrastructure for FCEVs is also lackingand could prove to be challenging to expand. There is a contradiction between lowdemand for FCEVs because of a lacking infrastructure and the demand for buildinga refuelling network lacking because there are few users. One potential effect of hy-drogen being used to a larger extent in society, pointed out by experts interviewedin the study, is that an expansion of a refuelling network could follow the hydro-gen expansion as a whole. Interviewee I summarise this point with the followingexample: "It has gone slow, and would probably continue to do so if it were a singlesystem. But if you connect everything, then that is a different story. When youconstruct HYBRIT, then you could also install a fuel station. If you are doing oneyou might as well do the other. It is those types of synergies that makes it easier tobring about a complete system"
79
8. Discussion
When discussing larger-in-size applications such as trains, trucks, and ships, thestudy points to a large potential for hydrogen to be competitive. Here, the al-ternatives are fewer and provide hydrogen with an advantage in these particularlyhard-to-abate sectors. The more centralised refuelling infrastructure and the needfor long ranges are in favour of the hydrogen alternative. One threat is from biofuelsbut there are also many applications where bio-fuels could be needed and a limitedsupply.
In conclusion, it can be said that in which transport applications and to whatextent hydrogen will be utilised is by no means certain. However, if either the purehydrogen path, synthetic fuels such as ammonia, or bio-fuels are chosen, there will bea demand for low-carbon hydrogen. The difference between them is that the purehydrogen path will be more of a decentralised and smaller demand per location,while bio- or synthetic fuels are produced on a large and centralised level.
8.1.3 Conclusion of Discussion of HydrogenAs far as the study has established, there will most likely be a gap between thesupply of, and demand for, hydrogen. As of now, most of the hydrogen is producedusing fossil sources, which will have to be switched eventually. In addition, thedemand is certain to stay at the same high levels, or by most predictions, increasewith new applications. Many potential applications have been presented in thisstudy, some more certain than others. Whichever application becomes the mostprominent, the need for low-carbon hydrogen is a fact. The cost of this hydrogenis subject to many factors, some of which have been described and accounted forin this study. The result shows that there are different options for supplying thislow-carbon hydrogen and that the cost varies from case to case. Even if the costof low-carbon hydrogen ends up higher than the carbon-intensive counterpart, thisoption should probably not even be considered in times where emissions need tobe reduced. One should also consider the power of the end consumer and theirincreased interest in sustainability and low-carbon solutions.
8.2 Small Modular ReactorsIn regards to the concept of SMR, described in chapter 5 the first thing that needsto be addressed is whether the concept will fully be deployed in the manner in whichit is intended. There are already designs in use today, such as the Russian RITM-200 reactor and soon the Chinese HTR-PM reactor, described in 5.4. Many otherdevelopers have also come far in their development, with planned demonstrationsand commercial projects. But a full-scale production and supply deployment hasyet to be realised. In regards to gaining a more cost-efficient economic model bystandardising and producing smaller and more modular units, interviewees B and Ementioned that there is no reason on paper to dispute some of the claims that aremade.
80

8. Discussion
Although it is natural to be suspicious over these types of promises, interviewee Bsaid that "... the economic theory tells you that this is what should happen, and ithas been shown to happen in other industries”. But interviewee B further explainsthat some uncertainties exist.
Although more established companies also have their reactor designs, much of theSMR development is being led by smaller companies. One uncertainty mentionedis whether these smaller companies can deliver on their promises. Interviewee Bargued that it is one thing to design reactors on paper, and another to physicallyconstruct and deploy the supply chain around them. It is less a factor of technologyreadiness and more a factor of manufacturing readiness. Interviewee A mentionedthat this is something that these smaller companies understand. Further intervie-wee A stated that they are taking efforts to reduce this risk by venturing up withwell-known construction companies. Interviewee A also mentioned that the smallersize of the company can be seen as an opportunity. These companies do not havethe funds to continuously research and update their designs. Meaning they have anincreased urgency in actually bringing them to market. This could help to push thedeployment of SMRs forward. Whether or not this is the case is too early to say.Both Interviewee A and B conclude this topic by stating that everything will be aquestion of demonstration. First in line are NuScale and X-Energy (among others)that will have to deliver on their respective demonstration units. This will be a bigstatement regarding the future of SMRs. As Interviewee B said it, "The proof is inthe pudding".
Nonetheless, the main obstacle to overcome is licensing, described in section 5.5.1.To fully realise the potential of SMRs and the "economy of multiples", export mar-kets would need to be established. This is not possible if there is no harmonisedlicensing procedure across nations. By having to constantly re-design, an SMR willlose many of the economic advantages that come with standardisation. Not only interms of the actual re-design in itself but also the cost of the various documentationand classifications that come with it. Interviewee D highlights this fact with anexample and said "... to buy sixty-four nuclear-grade classified bolts, it would cost€20000. In a regular hardware store, the ’same’ bolts would cost €160. Standard-isation is key. If everyone is to ’do’ SMR in their way, there will be no SMR".Interviewee A further mentioned that perhaps this will be possible in one or twonew markets but certainly not fifteen.
There is optimism regarding some potential new nuclear markets, for example, Es-tonia and Poland. Since these nations lack a licensing and regulation process oftheir own. It can generate the opportunity for them to accept license and regulationprocesses of already established markets. This ensures that no re-design has to takeplace. But interviewees A, C, and D said that these markets are probably too smallin themselves to make any significant impact. If this is true, similar approachesneed to be made between the established markets as well. Interviewee C said thatattempts like this have been made but that nothing has happened for the last thirtyyears or so.
81
8. Discussion
Still, this is probably the number one issue hindering the full-scale potential ofSMRs. It should also be the number one issue to be solved. If unsolvable, however,interviewees A, C, and E state that the US, Chinese, and perhaps some other mar-kets as well, would most likely be big enough to be self-sustainable. But the fullpotential would then not be reached.
Lastly, Interviewee A and E approached the subject of SMR with some caution.They explained that similar attempts to re-invent the nuclear industry have beenmade before. But with little success. In the early, to mid-2000s there was a lot ofhype surrounding the concept of Generation IV nuclear energy. Although a differentconcept, this quickly fell out of favour due to circumstances such as Fukushima, andthe price of oil dropping. Concerns have been raised about whether the same thingwill happen to the concept of SMR. But this could also be a question of timing.The issues surrounding the climate, the need for electrification and sustainable heatgeneration, as well as desalination of water and decarbonization by the means ofhydrogen are more prominent now than ever. All of these factors create opportunitiesto open a door rather than closing it.
8.3 Hydrogen and Small Modular ReactorsChapter 6 describe the connection between hydrogen and small modular reactors.The result shows that the versatility of an SMR opens up for several other mar-ket applications than just the power market alone and that hydrogen production isone of them. In addition, the result shows that SMRs also bring additional ben-efits to this new and potentially extensive market. The first benefit described insection 6.3.1 is the use of process heat, especially for high-temperature reactors.Several industries, such as refineries and steel producers, also use this directly intheir respective processes. An SMR could thus bring multiple benefits in producingthe hydrogen needed as well as the heat that is used for other purposes in theseindustries. Although not covered completely in this study, further research and de-velopment could look at the possibility of utilising this versatility of an SMR to alarger extent. Even though the initial cost of hydrogen could fall out of the price-competitive range, by using an SMR and heat on a system level, the cost of the finalproduct (e.g low-carbon steel) might reach the desired value. As illustrated by thisstudy, a high-temperature reactor is also a competitive way of producing hydrogenif combined with a SOEC. In a best-case scenario, it could even become directlycompetitive with alternatives methods using fossil fuels and carbon capture. Somecritique could be directed towards the combination of the two technologies of SOECand SMRs. As of now, both of them have not been developed to a high enoughdegree. The combination of these two "immature" technologies could thereby bedeemed uncertain. But since the scope of this study is set to 2030 and onward, itwas chosen to look at the current potential of the two technologies. The case forcompetitiveness is strong enough for it to not be excluded at this early stage in thehydrogen economy.
82
8. Discussion
The result show, in section 6.3.2, another benefit of SMRs connected to hydrogenproduction in the availability and continuous production. This is not only a need,but often a requirement for several industries such as ammonia, steel, and refineries,looking at using hydrogen in their respective processes. Using alternatives means ofsupply means that storage has to be introduced and interviewees B, E, and J all hadconcerns about whether this can be managed cost-effectively. Interviewee E furtherexpressed concerns that even though the cost of production using electrolysis is likelyto go down, it does not automatically mean that the cost of storage should followthe same pattern. Interviewee E state this by saying "... maybe the technology fordrilling large underground caverns won’t develop that much, or reducing the energylosses when compressing gas. This is sometimes the mistake I think economists andpoliticians do. They assume that all parameters will have a learning factor, eventhe ones that are physically constrained.". The conclusion is that since some of thetechnologies used in the storage of gas are quite mature, they are unlikely to seesignificantly increased performance or reduced cost. This is not necessarily the casefor all methods of storage. There are other and more innovative ways of storinghydrogen not covered in this study. But it is wrong to believe that all variables inthe hydrogen value chain are suddenly going to receive large cost reductions onlythrough scale-up.
The third benefit shown is the fact that SMRs are less location-specific, describedin section 6.3.3. Today, the most sizeable hydrogen users keep their costs down byhaving supply co-located with demand, which reduces the need for transportationcosts. Several national and regional initiatives (including the EU hydrogen strat-egy) also recognise the importance of this [2, 114, 115, 116]. This means that, ifutilised correctly, hydrogen production using SMRs can have a strong case in certainregions and industrial clusters. For example, it could have an advantage in thosewhere RES has a high degree of geographical limitations, or where the storage ofCO2 is limited. For future and decentralised applications, such as various means oftransportation, the location of production could play an even greater role in regardsto competitiveness. Again, this provides an opportunity for the use of SMRs. Theargument against this would be that the demand for each location is likely to besmaller. The economic benefit of having co-located modules could thereby be lost,resulting in a higher LCOE and thus a higher cost of hydrogen production. Butsince the reforming with CCS alternative needs to be large. It favours either therenewable or the nuclear electrolysis alternative. Thus, here lies a trade-off betweencheaper electricity or a more suitable supply architecture.
83
8. Discussion
The last benefit (or synergy), presented in section 6.3.4, is modularity. The previousbenefits are not exclusive to SMRs alone. For example, an LNP operates similarlyand can very well bring the same benefits as an SMR. But the benefit of modularityis not only directed to the design itself but the economics as well. Since electrolysershave the same benefit, it reduces the risk of investing in overcapacity of the entireenergy and hydrogen system. Something that could very well be seen as a necessityin a market like the hydrogen market. Since it is likely to still be in an early stageof development over the next decade, with several of the key variables being coveredin uncertainties.
8.4 Delivered CostTo test some of these benefits it is important to not only look at the productioncost, but also the delivered cost of hydrogen. The results from the study have madeit clear that the delivered cost needs to be considered in many cases of hydrogendemand. In chapter 7, the cost comparison shows that production cost can differsignificantly from the delivered cost. This will, in the end, affect the different hy-drogen applications.
As mentioned previously, if only considering production cost, the SMR combinedwith the SOEC gave better results than expected, shown in section 7.3. This empha-sises the efficiency gains of utilising the added benefit of heat from the reactor. Evenwithout utilising high-temperature electrolysis, the nuclear option could becomecompetitive with renewables in a best-case scenario. This result was particularly in-teresting because of the large emphasis put on renewables in different national andregional hydrogen strategies, and the oversight of nuclear energy in these. Both thenuclear and renewable alternative probably also have a large potential of decreasingthe cost of hydrogen production further. But as has been illustrated in this study,and mentioned by several experts, this is not the whole story.
When comparing delivered cost, hydrogen production utilising an SMR as the en-ergy source could be a significant competitive low-carbon option. The deliveredcost is presented in section 7.4. This result clearly illustrates under what conditionsan SMRs could become competitive. By further illustrating in section 6.5 that theassumptions are not a single specific case. It makes the technology a real option toproduce hydrogen in the future, and an option that should be considered. It couldbe argued that the additional cost of storage and transport, mainly experienced bythe renewable alternative, can decrease as well as the production cost. This reduc-tion is however not as obvious as to happen, which was mentioned by interviewee Eand discussed in section 8.3.
This will also not change much in the future, storage sites will remain where theyare, and demand is not likely to change locations either. Again, emphasising theneed to consider the delivered cost of hydrogen, as well as including all potentialtechnologies in hydrogen strategies moving forwards.
84

8. Discussion
8.5 First StepWhat is seen in these early stages of hydrogen deployment is alliances and part-nerships forming. One example discussed in this study is the Swedish HYBRITproject between SSAB, LKAB, and Vattenfall. Another example is a German al-liance between the steel company Salzgitter AG, the power company E.ON, andthe hydrogen developer company Linde [117]. Or the example between the fertilisercompany YARA and the French power company ENGIE [118]. There are even na-tional alliances forming, where for example Germany has made agreements to importhydrogen produced in Morocco [119, 120]. What they all have in common is thatthey are looking at using renewable electrolysis.
With the previous discussion in mind, the nuclear industry also has a responsibil-ity in this. The third barrier presented in the results of this study is the isolatedcommunication within the industry itself. The nuclear industry has predominantlyoperated in the power market, a well-known and organised market. Expanding theversatility of nuclear power to other markets also means an expansion of consumerswith different needs. Therefore, the nuclear industry needs to take an increased in-terest in these various new consumers. This study has recognised some of the majorbenefits of SMR and how this relates to a couple of consumer needs in relation tohydrogen. In the future, more thorough research needs to be done on each and everyone of the potential markets. An increased interest could also lead to knowledgeexchange between the two parties. Meaning that just as the nuclear industry learnsabout new market needs, the potential consumer can also form a better understand-ing and view of the benefits of nuclear power.
Furthermore, an increased understanding between the nuclear industry and otherscould lead to potential partnerships. By including other major parties of the econ-omy of a nation it could in turn bring a positive effect on other issues, such asthe issue of licensing. Although this is a highly complex issue and deserves severalstudies and collaborations on its own, the nuclear industry would benefit from anoutside voice aiding them in this matter. A European example is an alliance createdin 2020 between nine organisations mainly dealing in the area of energy [121]. InFebruary 2021, they signed the Tallinn Declaration, targeting nine principles for amore harmonised SMR licensing process. This would also benefit greatly by the aidof stakeholders outside the nuclear and energy industry. Another example is a letterurging the European Commission to stop the hampering of nuclear power, signed byFrance, Czech Republic, Hungary, Poland, Romania, Slovakia, and Slovenia [122].Interviewee E said that more Western European countries also need to be a part ofthis, like Sweden or Finland, to strengthen the message across Europe. Again, bycoupling different sectors of society, the chance of this happening is increased.
85
8. Discussion
Lastly, when analysing the timeline of SMR, utilising them for hydrogen productionpurposes can be viewed as far away in time. By having a forward approach regard-ing licensing surrounding the fabrication and supply chain of SMRs, this could bereduced. In the meantime, it is recommended that owners of existing LNPs examineways of utilising leftover capacity, if any, towards the production of hydrogen. Thiscan also strengthen the idea that nuclear power has potential in this market, evenin its early stages of development.
8.6 Final Remarks
The study on this area has not been whether which alternative is, in general, amore competitive option. There may very well be regions where nuclear electrolysis,renewable electrolysis, or reforming with CCS, have a considerable advantage overone or the other. The study has merely highlighted certain areas of uncertainties,where the strengths of an SMR can make a considerable case for nuclear electroly-sis. Spoken from an industry perspective, interviewee F stated that, "It is almostimpossible to objectively compare the different technological options. It all dependson how far the system boundaries are stretched. Of course, if you are to build a lotof wind farms, then you will end up in worse and worse wind locations. Then maybeyou have to build longer and longer transmission or pipelines. Then maybe you endup in unsuitable storage locations. Somewhere along the chain, a breaking point isreached.". Similar things can be stated for all the alternatives. Meaning that whatis deemed most competitive, is dependent on each case’s prerequisites. In the end, itis about utilising the strengths of each alternative and minimising their weaknesses.The Canadian hydrogen strategy has done this well. It highlights which regionshave strong cases for electrolysis and which have strong cases using other methods,depending on each region’s distribution of energy sources [114]. The idea of havinga "one-solution-fits-all" (such as in the EU strategy) can actually hinder the hydro-gen value chain more than it helps. Interviewee J explained this by saying "Onething that we’re concerned about is that if we can’t achieve the amount of renewabledeployment that is required, then that’s going to stall the roll-out of hydrogen de-ployment". The complexity is further increased if also accounting for other highlycomplex topics, such as energy security and geopolitics, something that this studyhas not even touched upon. Thus, not remaining technologically neutral introducesunnecessary risk to an already difficult and uncertain endeavour. If spoken in or-ganisational terms, the organisation is too big to control every entity’s day-to-daybusiness. Policy needs to aid and set targets on what to achieve and when. Notexplicitly state how it should be achieved in every individual case, since they allcome with different prerequisites. Three major alternatives can bring about changeand help decarbonise several applications using hydrogen. Not utilising them all,wherever possible, is not only a threat to the hydrogen economy. But a threat tothe environment as we know it. To conclude with a quote from interviewee D:
"If you want an entire economy to be based on hydrogen, then you will need eachand every method available to you, in order to produce it"
86

8. Discussion
8.7 Contributions of WorkIn large, an overview has been given of hydrogen; where the demand stems from, andhow it is supplied both today as well as what is predicted for the future. In addition,a similar overview has been given of SMRs and their future as energy sources. Thecombination of these two is the unique aspect of the study. In the literature study,this became evident. For the combination of nuclear hydrogen production, therewhere some literature written, while the combination of SMRs and hydrogen wasmuch more limited. From this, one conclusion is that this study is rather uniquein its approach. Not much research has been conducted on hydrogen productionusing SMRs, emphasising the value of the study. The same proved to be true in theinterview study. Not many experts had knowledge on the combination of the areas,confirming the conclusion that the area is new and unique. The notion that thearea would not be relevant at all can also be disregarded since many of the expertsdisplayed an interest in it.
It is clear that there is value in gathering information on the two areas in one place.It opens the door to new markets for SMRs and for new sources of energy to producehydrogen. The result of the study indicates that there is a rather convincing casefor the combination of the two areas and that it under certain conditions providescompetitive features.
The result of the study has also provided a system-oriented approach to calculatingthe cost of hydrogen from different supply architectures. In interviews and litera-ture, it became evident that the delivered cost of hydrogen is not always accountedfor when making comparisons between different energy sources. Instead, only pro-duction cost is accounted for and compared. In many cases, this gives an advantageto some technologies, while others are easily overlooked. The results show that thecontinuous demand for hydrogen will require storage of hydrogen and that in manycases transport is also needed, both associated with a cost. By expanding the systemboundary, including factors such as delivering and storing hydrogen, the number ofoptions to include in terms of energy supply increase. Increasing the number ofoptions for supplying energy will be instrumental in the future. The need for energywill increase, while traditional ways of supplying it, such as from fossil sources, willnot be an option. In the study, it also became clear that the cost of hydrogen manytimes was compared to fossil options such as steam reforming. In the future, thiswill not be a relevant measure, as fossil sources should not even be considered anoption in the combat against climate change.
87

8. Discussion
8.8 Research Approach and Validity of Result
The research approach described in chapter 2, consisting of a literature study andan interview study, provided the intended result. The literature study aimed atfinding information on hydrogen demand, supply, and production. In addition, itaimed at finding information on small modular reactors, and their functionality inrelation to hydrogen. Many sources of information were found and after screeningmany relevant sources could be utilised. When it came to hydrogen, there was anindication of more articles being written either in the earlier 2000s or in the last fewyears. This indicated that there was hype around the area about fifteen years ago,and then again today. As a main rule, the most updated sources were used. Alsofor SMRs, there was a lot of literature written on the subject.
Next, the interview study aimed to deepen the knowledge on the areas mentioned,as well as widen the scope and include matters such as future predictions, barriers,and opportunities. Twelve interviews were conducted in total, with experts fromthe areas of nuclear energy and hydrogen. The number of interviews covered thesought information well, and saturation of information was reached in the two areasseparately.
Calculations were performed to exemplify the relation between hydrogen productionand the associated costs. In comparison to deeper techno-economical studies, thecalculations performed in the study were less complex. Still, although the individualnumbers differed some, the relation between the results reached corresponded well tothat in literature. The results of the calculations should be seen as approximations ofthe delivered cost of hydrogen under certain assumptions, not precise values of costin every case. The result provides an overview as well as illustrating the relationshipbetween factors affecting the final delivered cost of hydrogen. A further elaboratedapproach could be taken but is left for future studies. For example, something thatwas not included in this scope was the consideration of the different lifetimes andconstruction times between RES and SMRs. This could be detailed further using anLCOH/LCOE discounting method instead of an LCOH/LCOE annualising method,as was used in this study.
The study aimed to research and portray a future scenario, from 2030 and forwardsin most cases. This adds uncertainty to the information and assumptions made fromthat information. In the calculations of delivered cost, the standard case for nuclearenergy is based on predictions from independent modelling. Using these numbersshould ensure that the result is not overly optimistic. The best-case scenario is in-stead based on SMR vendors’ calculations, which could be more optimistic but alsonumbers that will have to be defended by the vendors. One conclusion could bethat that the truth may be somewhere in between these cases in the early phases ofSMRs. After the early phases, it should be mentioned that SMR has large potentialin reducing cost in the future as well, something that has been shown by the resultsof the study.
88

8. Discussion
The assumptions relating to storage and transport are using either averages or, inthe case of storage, the option which seems most feasible. The storage solutionsnot chosen have complexities such as very low rates of cycles per year, or highercost. These variables could thereby vary somewhat but are deemed precise enoughto compare the different supply architectures. It should further be mentioned thatthe cost of storage does not account for certain benefits, such as having several in-jection/withdraw cycles a year. If these are included, the chosen storage solutioncould potentially receive a cost reduction. The quality of the assumptions is deemedsufficient to provide an overview.
8.9 Sustainability and Ethical ConsiderationsIn this section, the two main areas of the study, hydrogen and SMR, will be dis-cussed relating to sustainability and ethical considerations. Through the entiretyof the study, the focus has been on sustainability and finding alternative means ofproducing hydrogen. It has been established that today, hydrogen is almost exclu-sively produced from fossil sources. Highlighting alternative production pathwayswith the goal of producing low-carbon hydrogen is thereby motivated by decreasedenvironmental impact.
With the result showing that nuclear should be considered as an alternative energysource when producing hydrogen, one should again consider what environmentalimpact this could have. Nuclear power is considered a low-carbon means of pro-ducing energy. Studies shows that the life-cycle greenhouse gas emissions of nuclearpower is 15 tonnes CO2-equivalent/GWeh, lower than that of solar PV (39 tonnesCO2/GWeh), and comparable to wind (14 tonnes CO2/GWeh) [123]. The emissionsfrom a natural gas is 469 tonnes CO2/GWeh and from a coal-burning plant 974tonnes CO2/GWeh [123]. Land use, another important aspect, is also less in thecase of nuclear power compared to that of wind power [123]. It can be concludedthat the emissions of nuclear energy are significantly less than those of fossil sourcesand comparable to renewable sources while having less land use.
Another concern of nuclear energy, regarding the ecological aspect, is nuclear waste.Increased use of nuclear energy will also mean an increase in nuclear waste. Theamount of waste is small compared to that of for example of a coal plant, but notinsignificant. To illustrate the scale; a coal-burning plant produces millions of tonnesof waste, while a nuclear plant of the same size produces less than 30 tonnes of waste[123]. The waste of a nuclear power plant is radioactive, and the long-term storageof the waste is an important problem not yet demonstrated on a large scale.
89

8. Discussion
The most prominent ethical aspect when discussing nuclear power is nuclear pro-liferation, or in other words, the spread of nuclear weapons. A global expansion ofnuclear energy to mitigate climate change could imply an increased risk of nuclearproliferation. There are several initiatives to counteract nuclear proliferation, onebeing the UN "Non-Proliferation of Nuclear Weapons" treaty [124]. Through thestudy, information has only been gathered from nations that are signatories of thetreaty.
Regarding hydrogen and its increased production and use, there are further factorsto consider. The main hydrogen production method that has been studied is elec-trolysis. Some electrolysers require rare metals such as platinum. Platinum is alsoused in hydrogen fuel cells, converting hydrogen to electricity in many applications.The rarity of the metal can be seen as a problem from an ecological as well as ethicalaspect. Concerns are being raised about the sustainability of its mining and alsoof the long-term supply of the metal. The world’s platinum resources are extensivebut concentrated in certain regions, primarily in South Africa [125].
90

9Conclusions and Future Work
In this chapter, conclusions of the study will be stated together with suggestions forfuture work.
9.1 ConclusionsLow-carbon hydrogen is considered as one of the solutions to decrease emissions ofgreenhouse gases and to be used as a fuel in an increasing number of applications.It has been found that the demand for low-carbon hydrogen will increase in theproduction of ammonia, methanol, and steel. Most likely, larger-in-size applicationsover longer distances such as trains, busses, and ships will also stand for an increaseddemand for low-carbon hydrogen. The production of low-carbon hydrogen can bedone through different types of electrolysis methods, which have been outlined inthe study. To supply the large energy-demand small modular reactors (SMR) havebeen studied and compared to renewable and fossil energy sources.
The results of the study show that there are several synergies between hydrogenproduction through electrolysis and SMRs. First, the heat from the reactor canincrease the efficiency of the electrolysis process, requiring less electricity. Many ofthe processes requiring hydrogen also benefit from the ability to receive process heatfrom the reactor. Second, these processes often also require a continuous supply ofhydrogen, well-matched to the high availability of a nuclear reactor, resulting inrequiring less storage of hydrogen. Third, SMRs are less location-specific, reduc-ing the need for transporting hydrogen to the demand. Finally, both SMRs andelectrolysers are built up by modules, potentially reducing the cost of overcapacity.Utilising renewable sources instead induces the need for storage and distribution ofhydrogen, adding to the delivered cost of hydrogen.
Barriers to the concept of SMR include intricate licensing processes, specific to eachcountry and regulatory body. Further barriers include risks connected to the de-ployment of reactors and smaller vendors. A lacking promotion of the technologyand communication regarding the benefits and safety was also identified as a barrier.
The importance of accounting for more than the production cost when calculatingthe cost of hydrogen is illuminated by the calculations made. When including thecost of storage and distribution of hydrogen under set assumption it is shown thatSMR is a competitive energy source for hydrogen production. The delivered cost ofhydrogen from an SMR could be $2.53/kgH2. The lowest delivered cost for hydro-gen utilising renewables was $4.06/kgH2 when only assuming the need for storage.For comparison, reforming with CCS was calculated to a delivered cost of $2.8/kgH2.
91

9. Conclusions and Future Work
Gathering the two topics of hydrogen and SMR in the same study has not been donesimilarly before. The results of the study showing that SMR is competitive againstother low-carbon sources of energy are unique and could lay the groundwork forfurther studies. It can be concluded that nuclear power should indeed be includedwhen considering low-carbon hydrogen production. At a stage where we need asmany potential solutions as possible nuclear power and small modular reactors standout as a relevant and competitive alternative. For hydrogen produced by SMRs tobecome a reality, barriers such as licensing need to be prioritised to overcome, andnational hydrogen strategies should strive to be technology-neutral.
9.2 Future WorkThe study does not cover the entirety of the span between hydrogen and small mod-ular reactors, and many areas could be researched further. Some suggestions forfuture work are given here.
• The calculations performed in this study aimed to give an overview of the costcomponents and magnitude of these. More thorough calculations, focusing onthe cost of delivered hydrogen, could be an area of a future study
• It has been stated that many of the processes with a demand for hydrogenalso have a demand for process heat. A closer study of optimising the heatgenerated from SMRs and the heat demand from these industries could besubject to further studies.
• The study introduced the application of balancing renewable and nuclear en-ergy with hydrogen as an intermediate. However, this was not further analysedto a full degree. Future studies could look at this important topic.
• The study has focused on producing hydrogen using SMRs as the energysource. The production of hydrogen is just one of the many potential util-isations of SMRs. Of course, producing electricity to the grid is one of them,but there can be many others.
• The study has in part discussed the issue of licensing. However, how to har-monise licensing processes needs to be done in greater detail and should there-fore be subject to further studies.
92
References
[1] European Commission. A european green deal. November 2020. URL https://ec.europa.eu/info/strategy/priorities-2019-2024/european-green-deal_en.
[2] European Commission. Communication from the commission to the europeanparliament, the council, the european economic and social committee and thecommittee of the regions. A hydrogen strategy for a climate-neutral Europe,2020.
[3] Erik Ingersoll and Kirsty Gogan. Missing Link to a Livable Climate: HowHydrogen-Enabled Synthetic Fuels Can Help Deliver the Paris Goals. Lucid-Catalyst, 2020.
[4] Bundesministeriums für Wirtschaft und Energie. The national hydrogenstrategy. 2020. URL https://www.bmwi.de/Redaktion/EN/Publikationen/Energie/the-national-hydrogen-strategy.html.
[5] SSAB, LKAB, and Vattenfall. Three hybrit pilot projects - towards fossil freeiron and steel. 2020. URL https://www.hybritdevelopment.com/articles/three-hybrit-pilot-projects.
[6] International Energy Agency. Data and statistics: Balances, sweden.2018. URL https://www.iea.org/data-and-statistics/data-tables/?country=SWEDEN&energy=Balances&year=2019.
[7] Nuclear Energy Agency. Current status, technical feasability and economicsof small modular reactors. 2011.
[8] Jasmina Vujić, Ryan M Bergmann, Radek Škoda, and Marija Miletić. Smallmodular reactors: Simpler, safer, cheaper? Energy, 45(1):288–295, 2012. doi:doi.org/10.1016/j.energy.2012.01.078.
[9] Daniel T Ingersoll. An overview of the safety case for small modular reactors.In Small Modular Reactors Symposium, volume 54730, pages 369–373, 2011.
[10] Konsta Värri and Petra Seppälä. Small Modular Reactors: Market Survey.Energiforsk, 2019.
[11] International Atomic Energy Agency. Advances in Small Modular ReactorTechnology Developments. Advanced Reactors Information System, 2018.
[12] Canan Acar and Ibrahim Dincer. Review and evaluation of hydrogen pro-
93

References
duction options for better environment. Journal of cleaner production, 218:835–849, 2019.
[13] Martyn Denscombe. The good research guide: for small-scale social researchprojects. McGraw-Hill Education (UK), fifth edition, 2014.
[14] Hassan Nazir, Navaneethan Muthuswamy, Cindrella Louis, Sujin Jose, JyotiPrakash, Marthe EM Buan, Cristina Flox, Sai Chavan, Xuan Shi, Pertti Kau-ranen, et al. Is the h2 economy realizable in the foreseeable future? part iii:H2 usage technologies, applications, and challenges and opportunities. Inter-national journal of hydrogen energy, 2020.
[15] Fuel Cells and Hydrogen Joing Undertaking FCH JU. Hydrogen roadmapeurope: A sustainable pathway for the european energy transition. 2019.
[16] Hydrogen Council. Hydrogen: scaling up. 2017. URL https : / /hydrogencouncil.com/en/study-hydrogen-scaling-up/.
[17] International Energy Agency. The future of hydrogen. IEA, Paris, 2019. URLhttps://www.iea.org/reports/the-future-of-hydrogen.
[18] Hydrogen Council. Path to hydrogen competitiveness: A costperspective. 2020. URL https : / / hydrogencouncil . com / en /path-to-hydrogen-competitiveness-a-cost-perspective/.
[19] Jonas Baltrusaitis. Sustainable ammonia production, 2017.
[20] Yara. Åpner for historisk satsing på grønt hydrogen og grønn am-moniakk i norge. 2021. URL https://www.yara.com/corporate-releases/apner-for-historisk-satsing-pa-gront-hydrogen-og-gronn-ammoniakk-i-norge/.
[21] Francesco Dalena, Alessandro Senatore, Marco Basile, Sarra Knani, AngeloBasile, and Adolfo Iulianelli. Advances in methanol production and utiliza-tion, with particular emphasis toward hydrogen generation via membrane re-actor technology. Membranes, 8(4), 2018. ISSN 2077-0375. doi: 10.3390/membranes8040098. URL https://www.mdpi.com/2077-0375/8/4/98.
[22] HYBRIT. Hybrit - fossil-free steel: Summary of findings from hybrit pre-feasibility study 2016–2017. 2018. URL ssabwebsitecdn.azureedge.net/-/media/hybrit/files/hybrit_brochure.pdf?m=20180201085027.
[23] LKAB. Hybrit: Ssab, lkab och vattenfall inleder industrialiserin-gen av framtidens fossilfria ståltillverkning – etablerar världens förstaproduktionsanläggning för fossilfri järnsvamp i gällivare. 2021.URL https : / / www . lkab . com / sv / nyhetsrum / pressmeddelanden /hybrit-ssab-lkab-och-vattenfall-inleder-industrialiseringen-av-framtidens- \fossilfria-staltillverkning--etablerar-varldens-forsta-produktionsanlaggning- \for-fossilfri-jarnsvamp-i-gallivare/.
[24] M Ahman, O Olsson, V Vogl, B Nykvist, A Maltais, L Nilsson, and M Nils-son. Hydrogen steelmaking for a low-carbon economy. Stockholm: StockholmEnvironment Centre and Lund University, 2018.
94
References
[25] Martin Pei, Markus Petäjäniemi, Andreas Regnell, and Olle Wijk. Toward afossil free future with hybrit: Development of iron and steelmaking technologyin sweden and finland. Metals, 10(7):972, 2020.
[26] LIBERTY Steel Group. A vision for carbon neutral steel by 2030. 2021. URLlibertysteelgroup.com/about/message-from-the-chairman/.
[27] Christine Mansilla, Cyril Bourasseau, Camille Cany, Benjamin Guinot, AlainLe Duigou, and Paul Lucchese. Hydrogen applications: overview of the keyeconomic issues and perspectives. Hydrogen Supply Chains, pages 271–292,2018.
[28] Tabbi Wilberforce, Zaki El-Hassan, FN Khatib, Ahmed Al Makky, AhmadBaroutaji, James G Carton, and Abdul G Olabi. Developments of electriccars and fuel cell hydrogen electric cars. International Journal of HydrogenEnergy, 42(40):25695–25734, 2017.
[29] Tabbi Wilberforce, Ahmed Al Makky, A Baroutaji, Rubal Sambi, andAG Olabi. Optimization of bipolar plate through computational fluid dynam-ics simulation and modelling using nickle open pore cellular foam material. InProceedings of the International Conference on Renewable Energies and PowerQuality (ICREPQ’17), Malaga, Spain, pages 4–6. Citeseer, 2017.
[30] Ulrich Eberle and Rittmar von Helmolt. Fuel cell electric vehicles batteryelectric vehicles and their impact on energy storage technologies: An overview.Electric and hybrid vehicles, 9:227–245, 2010.
[31] S. Verhelst. Recent progress in the use of hydrogen as a fuel for internal com-bustion engines. International Journal of Hydrogen Energy, 39(2):1071–1085,2014. ISSN 0360-3199. doi: https://doi.org/10.1016/j.ijhydene.2013.10.102.URL https://www.sciencedirect.com/science/article/pii/S0360319913026153.
[32] MA: MIT Energy Initiative Cambridge. Insights into future mobility. 2019.URL https://trid.trb.org/view/1667864.
[33] Deloitte China Ballard Power Systems. Fueling the future of mobil-ity: hydrogen and fuel cell solutions for transportation. 1, 2020. URLhttps://www2.deloitte.com/content/dam/Deloitte/cn/Documents/finance/deloitte-cn-fueling-the-future-of-mobility-en-200101.pdf.
[34] Toyota Motor Corporation. Toyota and hino to jointly develop heavy-dutyfuel cell truck. 2020. URL https://global.toyota/en/newsroom/corporate/32024083.html.
[35] Daimler AG. Fuel cells - daimler global media site. 2020. URL https://media.daimler.com/marsMediaSite/en/instance/ko/Fuel-Cells.xhtml?oid=9265782.
[36] Hyundai Motor Company. Xcient fuel cell. 2021. URL http://trucknbus.hyundai.com/global/en/products/truck/xcient-fuel-cell.
[37] Nikola corporation. 2021. URL https://nikolamotor.com/.
95
References
[38] E4tech fuel cell industry review. 2019. URL www.FuelCellIndustryReview.com.
[39] Bernd Heid, Martin Linder, Anna Orthofer, and Markus Wilthaner. Hy-drogen: The next wave for electric vehicles? 2017. URL https :/ /www.mckinsey. com/ industries / automotive-and-assembly/our-insights /hydrogen-the-next-wave-for-electric-vehicles.
[40] Fuel Cells and Hydrogen Joing Undertaking FCH JU. Hydrogen-poweredaviation: A fact-based study of hydrogen technology, economics, and climateimpact by 2050. 2020.
[41] Ahmad Baroutaji, Tabbi Wilberforce, Mohamad Ramadan, and Abdul GhaniOlabi. Comprehensive investigation on hydrogen and fuel cell technology inthe aviation and aerospace sectors. Renewable and Sustainable Energy Re-views, 106:31–40, 2019. ISSN 1364-0321. doi: https://doi.org/10.1016/j.rser.2019.02.022. URL https://www.sciencedirect.com/science/article/pii/S1364032119301157.
[42] Airbus S.A.S. Airbus reveals new zero-emission concept aircraft. 2020.URL https : / /www . airbus . com/newsroom/press-releases / en / 2020 / 09 /airbus-reveals-new-zeroemission-concept-aircraft.html.
[43] Trevor Brown. Pilot project: an ammonia tanker fueledby its own cargo. 2018. URL www . ammoniaenergy . org /pilot-project-an-ammonia-tanker-fueled-by-its-own-cargo/.
[44] Jasmina Ovcina. Maersk ceo: We expect to order first ships runningon new fuels in three years. 2021. URL https://www.offshore-energy.biz/maersk-ceo-we-expect-to-order-first-ships-running-on-new-fuels-in-three-years/.
[45] UMAS (University Maritime Advisory Services). Zero-emission vessels:Transition pathways. 2018. URL www . lr . org / en-gb / latest-news /lr-and-umas-release-new-zero-emission-vesselstransition-pathways-study/.
[46] S Bennoua, A Le Duigou, M-M Quéméré, and S Dautremont. Role of hydrogenin resolving electricity grid issues. international journal of hydrogen energy,40(23):7231–7245, 2015.
[47] Erik Wolf. Chapter 9 - large-scale hydrogen energy storage. In Patrick T.Moseley and Jürgen Garche, editors, Electrochemical Energy Storage forRenewable Sources and Grid Balancing, pages 129–142. Elsevier, Amster-dam, 2015. ISBN 978-0-444-62616-5. doi: https ://doi .org/10.1016/B978-0-444-62616-5.00009-7. URL https://www.sciencedirect.com/science/article/pii/B9780444626165000097.
[48] Muhammet Kayfeci, Ali Keçebaş, and Mutlucan Bayat. Hydrogen production.In Solar Hydrogen Production, pages 45–83. Elsevier, 2019.
[49] M Balat. Possible methods for hydrogen production. Energy Sources, Part A:Recovery, Utilization, and Environmental Effects, 31(1):39–50, 2008.
96
References
[50] Li Kaiwen, Yu Bin, and Zhang Tao. Economic analysis of hydrogen productionfrom steam reforming process: A literature review. Energy Sources, Part B:Economics, Planning, and Policy, 13(2):109–115, 2018.
[51] Jamie D Holladay, Jianli Hu, David L King, and Yong Wang. An overview ofhydrogen production technologies. Catalysis today, 139(4):244–260, 2009.
[52] The New Nuclear Watch institute. On the role of nuclear power in the devel-opment of a european hydrogen economy. Report 2020, 2020.
[53] Hydrogen Council. Hydrogen decarbonization pathways: Potential supplyscenarios. 2021.
[54] National Petroleum Council. Meeting the dual challenge: A roadmap to at-scale deployment of carbon capture, use, and storage, 2021.
[55] Meng Ni, Dennis YC Leung, Michael KH Leung, and K Sumathy. An overviewof hydrogen production from biomass. Fuel processing technology, 87(5):461–472, 2006.
[56] Diogo MF Santos, César AC Sequeira, and José L Figueiredo. Hydrogenproduction by alkaline water electrolysis. Química Nova, 36(8):1176–1193,2013.
[57] International Atomic Energy Agency. Net Zero by 2050: A Roadmap for theGlobal Energy Sector. IEA Publications, Paris, 2021. URL https://www.iea.org/reports/net-zero-by-2050.
[58] Furat Dawood, Martin Anda, and GM Shafiullah. Hydrogen production forenergy: An overview. International Journal of Hydrogen Energy, 45(7):3847–3869, 2020.
[59] J Sigurvinsson, C Mansilla, P Lovera, and F Werkoff. Can high temperaturesteam electrolysis function with geothermal heat? International Journal ofHydrogen Energy, 32(9):1174–1182, 2007.
[60] Dmitri Bessarabov, Haijiang Wang, Hui Li, and Nana Zhao. PEM electrolysisfor hydrogen production: principles and applications. CRC press, 2016.
[61] Marcelo Carmo, David L Fritz, Jürgen Mergel, and Detlef Stolten. A compre-hensive review on pem water electrolysis. International journal of hydrogenenergy, 38(12):4901–4934, 2013.
[62] Oliver Schmidt, Ajay Gambhir, Iain Staffell, Adam Hawkes, Jenny Nelson,and Sheridan Few. Future cost and performance of water electrolysis: Anexpert elicitation study. International journal of hydrogen energy, 42(52):30470–30492, 2017.
[63] Alfredo Ursua, Luis M Gandia, and Pablo Sanchis. Hydrogen production fromwater electrolysis: current status and future trends. Proceedings of the IEEE,100(2):410–426, 2011.
97
References
[64] Internationales Verkehrswesen. World’s largest single-stack alkaline-waterelectrolysis system. 2020. URL https://www.internationales-verkehrswesen.de/worlds-largest-single-stack-alkaline-water-electrolysis-system/.
[65] Sayed M Saba, Martin Müller, Martin Robinius, and Detlef Stolten. Theinvestment costs of electrolysis–a comparison of cost studies from the past 30years. International journal of hydrogen energy, 43(3):1209–1223, 2018.
[66] SA Grigoriev, VN Fateev, DG Bessarabov, and P Millet. Current status,research trends, and challenges in water electrolysis science and technology.International Journal of Hydrogen Energy, 45(49):26036–26058, 2020.
[67] Rony Escobar-Yonoff, Daniel Maestre-Cambronel, Sebastián Charry, AdrianaRincón-Montenegro, and Ivan Portnoy. Performance assessment and economicperspectives of integrated pem fuel cell and pem electrolyzer for electric powergeneration. Heliyon, 7(3):e06506, 2021.
[68] Sukhvinder PS Badwal, Sarbjit Giddey, and Christopher Munnings. Hydro-gen production via solid electrolytic routes. Wiley Interdisciplinary Reviews:Energy and Environment, 2(5):473–487, 2013.
[69] Hydrogen Europe. Clean hydrogen monitor 2020. 2020. URL www.hydrogeneurope.eu/node/1691.
[70] Linde. Linde to build, own and operate world’s largestpem electrolyzer for green hydrogen. 2021. URLhttps : / / www . linde . com / news-media / press-releases / 2021 /linde-to-build-own-and-operate-world-s-largest-pem-electrolyzer-for-green \-hydrogen.
[71] Anne Hauch, Rainer Küngas, Peter Blennow, Anders Bavnhøj Hansen,John Bøgild Hansen, Brian Vad Mathiesen, and Mogens Bjerg Mogensen.Recent advances in solid oxide cell technology for electrolysis. Science, 370(6513), 2020.
[72] Vikram Menon, Vinod M Janardhanan, and Olaf Deutschmann. Modeling ofsolid-oxide electrolyser cells: From h2, co electrolysis to co-electrolysis. ECSTransactions, 57(1):3207, 2013.
[73] U Frøhlke. Haldor topsoe to build large-scale soec electrolyzermanufacturing facility to meet customer needs for green hy-drogen production. 2021. URL https : / / blog . topsoe . com /haldor-topsoe-to-build-large-scale-soec-electrolyzer-manufacturing-facility- \to-meet-customer-needs-for-green-hydrogen-production.
[74] Hassan Nazir, Navaneethan Muthuswamy, Cindrella Louis, Sujin Jose, JyotiPrakash, Marthe E Buan, Cristina Flox, Sai Chavan, Xuan Shi, Pertti Kaura-nen, et al. Is the h2 economy realizable in the foreseeable future? part ii: H2storage, transportation, and distribution. International Journal of HydrogenEnergy, 2020.
98

References
[75] Hanane Dagdougui, Roberto Sacile, Chiara Bersani, and Ahmed Ouammi. Hy-drogen infrastructure for energy applications: production, storage, distributionand safety. Academic Press, 2018.
[76] Vanessa Tietze, Sebastian Luhr, and Detlef Stolten. Bulk storage vessels forcompressed and liquid hydrogen. Hydrogen Science and Engineering: Materi-als, Processes, Systems and Technology, pages 659–690, 2016.
[77] Hervé Barthélémy, Mathilde Weber, and Françoise Barbier. Hydrogen storage:recent improvements and industrial perspectives. International Journal ofHydrogen Energy, 42(11):7254–7262, 2017.
[78] Joakim Andersson and Stefan Grönkvist. Large-scale storage of hydrogen.International journal of hydrogen energy, 44(23):11901–11919, 2019.
[79] Radoslaw Tarkowski. Underground hydrogen storage: Characteristics andprospects. Renewable and Sustainable Energy Reviews, 105:86–94, 2019.
[80] Anna S Lord, Peter H Kobos, and David J Borns. Geologic storage of hydro-gen: Scaling up to meet city transportation demands. International journalof hydrogen energy, 39(28):15570–15582, 2014.
[81] Fritz Crotogino. Larger scale hydrogen storage. In Storing energy, pages411–429. Elsevier, 2016.
[82] Fredrik Johansson, Johan Spross, Davi Damasceno, Jan Johansson, and HåkanStille. Investigation of research needs regarding the storage of hydrogen gas inlined rock caverns: Prestudy for work package 2.3 in hybrit research program1, 2018.
[83] McKinsey & Co Hydrogen Council. Hydrogen insights: A perspective onhydrogen investment, market development and cost competitiveness. 2021.URL https://hydrogencouncil.com/en/study-hydrogen-scaling-up/.
[84] Commonwealth Scientific and Industrial Research Organisation. National hy-drogen roadmap. 2018.
[85] T Nguyen, Z Abdin, T Holm, and W Mérida. Grid-connected hydrogen pro-duction via large-scale water electrolysis. Energy conversion and Management,200:112108, 2019.
[86] Konsta Värri and Petra Seppälä. Small Modular Reactors: Market Survey.Energiforsk, 2019.
[87] World Nuclear Association. Small nuclear power reactors. 2021.URL www . world-nuclear . org / information-library / nuclear-fuel-cycle /nuclear-power-reactors/small-nuclear-power-reactors.aspx.
[88] Bahman Zohuri. Small modular reactors as renewable energy sources. Springer,2019.
[89] Think Atom. Small Modular Reactors and Where to Use Them. Energiforsk,2020.
99
References
[90] Daniel T Ingersoll and Mario D Carelli. Handbook of small modular nuclearreactors. Woodhead Publishing, 2nd edition, 2020.
[91] OECD and NEA. Nuclear Energy Market Potential for Near Term De-ployment.[S. l.]. OECD Publishing, Paris, 2016. doi: doi.org/10.1787/9789264266865-en.
[92] Statista. Median construction time required for nuclear reactors worldwidefrom 1981 to 2019. 2021. URL https://www.statista.com/statistics/712841/median-construction-time-for-reactors-since-1981/.
[93] B Mignacca and G Locatelli. Economics and finance of small modular reactors:A systematic review and research agenda. Renewable and Sustainable EnergyReviews, 118:109519, 2020.
[94] LK Robertson and LA Lamont. An overview of nuclear power. In 2015 5thInternational Youth Conference on Energy (IYCE), pages 1–6. IEEE, 2015.
[95] Xing L Yan and Ryutaro Hino. Nuclear hydrogen production handbook. CRCpress, 2016.
[96] Sara Boarin, Giorgio Locatelli, Mauro Mancini, and Marco E Ricotti. Finan-cial case studies on small-and medium-size modular reactors. Nuclear technol-ogy, 178(2):218–232, 2012.
[97] C Lewis, R MacSweeney, M Kirschel, W Josten, T Roulstone, and G Lo-catelli. Small modular reactors: Can building nuclear power become morecost-effective? National Nuclear Laboratory: Cumbria, UK, 2016.
[98] Sara Boarin and Marco E Ricotti. An evaluation of smr economic attractive-ness. Science and Technology of Nuclear Installations, 2014, 2014.
[99] Qvist Consulting Ltd. Modellering av svensk elförsörjning: Teknisk under-lagsrapport. Svenskt Näringsliv, 2020.
[100] Artur Wyrwa and Wojciech Suwała. Prospects for the use of smr and igcctechnologies for power generation in poland. In E3S Web of Conferences,volume 22, page 00191, 2017. doi: doi.org/10.1051/e3sconf/20172200191.
[101] B Mignacca and G Locatelli. Economics and finance of small modular reactors:A systematic review and research agenda. Renewable and Sustainable EnergyReviews, 118:109519, 2020. doi: doi.org/10.1016/j.rser.2019.109519.
[102] Gustavo Alonso, Sama Bilbao, and Edmundo del Valle. Economic compet-itiveness of small modular reactors versus coal and combined cycle plants.Energy, 116:867–879, 2016. doi: doi.org/10.1016/j.energy.2016.10.030.
[103] International Atomic Energy Agency. Advances in small modular reactor tech-nology developments. 2020. URL https://aris.iaea.org/Publications/SMR_Book_2020.pdf.
[104] Nuclear Engineering International. Jordan and x-energy agree to accel-
100

References
erate work on smr. 2019. URL https://www.neimagazine.com/news/newsjordan-and-x-energy-agree-to-accelerate-work-on-smr-7527332.
[105] Natural Resources Canada. Energy fact book: 2019-2020. 2019.
[106] Our World in Data. Nuclear energy. 2021.
[107] Paris IEA. World energy outlook 2018. 2021. URL https://www.iea.org/reports/world-energy-outlook-2018.
[108] International Energy Agency. Electricity information: Overview. 2020. URLhttps://www.iea.org/reports/electricity-information-overview.
[109] Agora Energiewende and AFRY Management Consulting. No-regret hydrogen: Data workbook. 2021. URL https : / / public .tableau . com / profile / afry . agora . energiewende . h2 . grid # ! / vizhome /No-regrethydrogenChartingearlystepsforH2infrastructureinEurope/Welcome.
[110] Agora Energiewende and AFRYManagement Consulting. No-regret hydrogen:Charting early steps for h2 infrastructure in europe. 2021.
[111] Dilara Gulcin Caglayan, Nikolaus Weber, Heidi U Heinrichs, Jochen Linßen,Martin Robinius, Peter A Kukla, and Detlef Stolten. Technical potential ofsalt caverns for hydrogen storage in europe. International Journal of HydrogenEnergy, 45(11):6793–6805, 2020.
[112] US Department of Energy. Hydrogen program plan. 2020.
[113] Sunfire. Hydrogen: The renewable feedstock and energy carrier. 2020. URLhttps://www.sunfire.de/en/hydrogen.
[114] Natural Resources Canada. Hydrogen strategy for canada. 2020. URL www.nrcan.gc.ca/climate-change/the-hydrogen-strategy/23080.
[115] The Fuel Cell and Hydrogen Energy Association. Road map to a us hydrogeneconomy. 2020. URL www.ushydrogenstudy.org.
[116] Fossilfritt Sverige. Strategi för fossilfri konkurrenskraft: vätgas. 2021. URLhttps://fossilfrittsverige.se/strategier/vatgas/.
[117] E.ON. Salzgitter ag, e.on and linde start operating an industrial hy-drogen production plant based on electricity from wind power. 2021.URL https : / /www . eon . com / en / about-us /media / press-release / 2021 /salzgitter-ag-eon-and-linde-start-operating-an-industrial-hydrogen-production-\plant-based-on-electricity-from-wind-power.html.
[118] YARA. Yara and engie to test green hydrogen tech-nology in fertilizer production. 2019. URL https :/ / www . yara . com / news-and-media / news / archive / 2019 /yara-and-engie-to-test-green-hydrogen-technology-in-fertilizer-production/.
[119] FuelCellsWorks. Morocco, germany signs green hydrogen coopera-tion agreement. 2020. URL https : / / fuelcellsworks . com / news /morocco-germany-sign-green-hydrogen-cooperation-agreement/.
101

References
[120] FuelCellsWorks. Germany: Federal government plans to import hy-drogen from morocco. 2019. URL https ://fuelcellsworks .com/news/germany-federal-government-plans-to-import-hydrogen-from-morocco/.
[121] Vattenfall Tractabel Synthos CEZ Group Nuclearelectrica e-Lise FoundationFermi Energia, Fortum and 18for0. The tallinn declaration on the future ofsmr licensing. In Fermi Nuclear Energy Conference: LEADING THE FORCE,2021. URL https://www.fortum.com/media/26489/download.
[122] Euractiv. Macron, orban urge eu to ‘actively support’ nuclear power.2021. URL https://www.euractiv.com/section/energy-environment/news/macron-orban-urge-eu-to-actively-support-nuclear-power/.
[123] Jasmina Vujić, Dragoljub P Antić, and Zorka Vukmirović. Environmentalimpact and cost analysis of coal versus nuclear power: The us case. Energy,45(1):31–42, 2012.
[124] United Nations Office for Disarmament Affairs. Treaty on the non-proliferationof nuclear weapons. 2020. URL http://disarmament.un.org/treaties/t/npt.
[125] Bonnie J Glaister and Gavin M Mudd. The environmental costs of platinum–pgm mining and sustainability: Is the glass half-full or half-empty? MineralsEngineering, 23(5):438–450, 2010. doi: doi.org/10.1016/j.mineng.2009.12.007.
[126] NelHydrogen. Atmospheric alkaline electrolyser. 2021. URL https://nelhydrogen.com/product/atmospheric-alkaline-electrolyser-a-series/.
[127] Water2H2. Alkaline electrolyzers. 2021. URL https://www.water2h2.com/alkaline-electrolyzers/.
[128] H-Tec System. Pem electrolysis stacks. 2021. URL https://www.h-tec.com/en/products/pem-electrolysis-stacks/h-tec-series-s/#dataSheetCollapse.
[129] H2B2. El200n. 2021. URL https://www.h2b2.es/el200n/.
[130] NelHydrogen. Pem electrolyser. 2021. URL https://nelhydrogen.com/product/c10-c20-c30/.
[131] Water2H2. Proton pem electrolyzer. 2021. URL https://www.water2h2.com/alkaline-electrolyzers/.
102

AElectrolyser Benchmark
I

A. Electrolyser Benchmark
Tab
leA.1:So
mecommercial
electrolyserscurrently
onthemarket.
Com
pany
:Cou
ntry:
Nam
e:Typ
e:ProdCap
:m
3 /h
ProdCap
:kW
Ene
rgyCon
s:kW
h/m
3Ref:
Asahi
Kasei
Japa
nAqu
alizer
AEC
1200
10000
-[64]
NelHyd
rogen
Norwa
yA3880
AEC
-2200
4,4(stack)
[126]
Sunfi
reGerman
ySu
nfire-H
ylink
Alkaline
AEC
1090
5000
4.7(system)
[113]
Water2H
2Sw
eden
CDQ1000
AEC
1000
-5.0(system)
[127]
H-Tec
System
sGerman
yS30/50
PEM
1,57
5-
[128]
H2B
2US
EL200N
PEM
207
1056
5,1(system)
[129]
NelHyd
rogen
Norwa
yH6
PEM
30-
5.8(system)
[130]
Water2H
2Sw
eden
SDQ200
PEM
50-
5.0(system)
[131]
Sunfi
reGerman
ySu
nfire-H
ylink
SOEC
SOEC
750
2680
3.6(system)
[113]
II
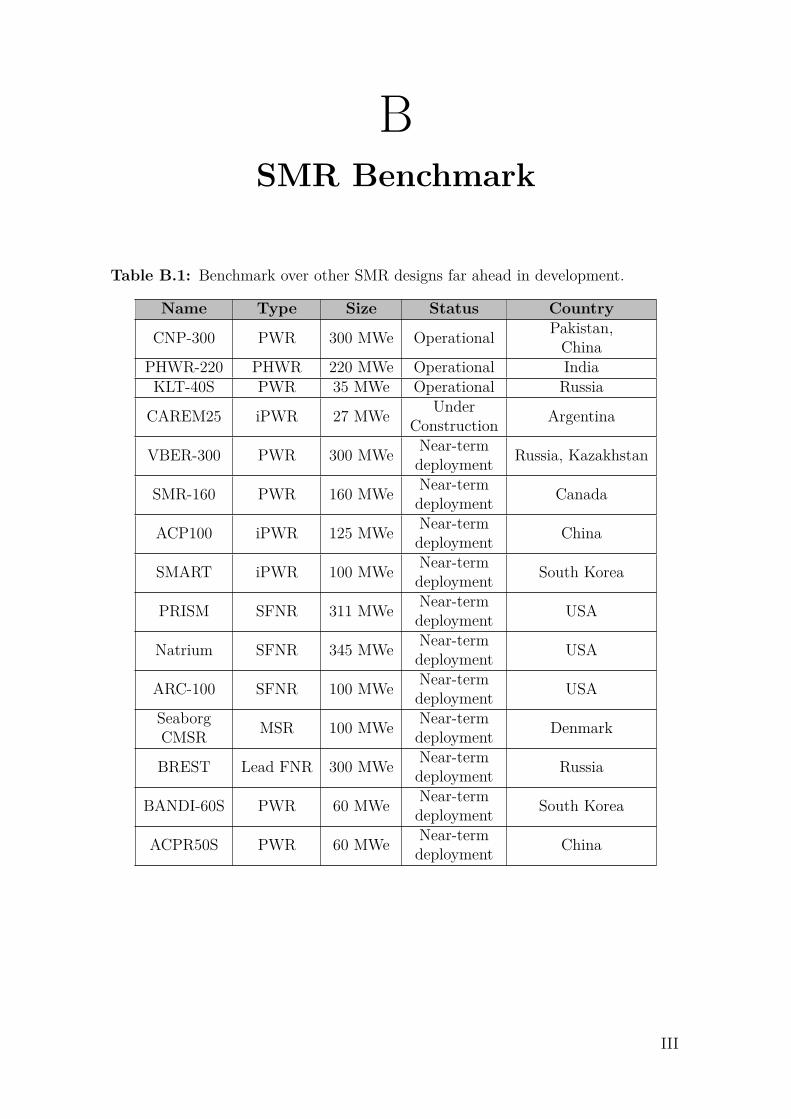
BSMR Benchmark
Table B.1: Benchmark over other SMR designs far ahead in development.
Name Type Size Status Country
CNP-300 PWR 300 MWe Operational Pakistan,China
PHWR-220 PHWR 220 MWe Operational IndiaKLT-40S PWR 35 MWe Operational Russia
CAREM25 iPWR 27 MWe UnderConstruction Argentina
VBER-300 PWR 300 MWe Near-termdeployment Russia, Kazakhstan
SMR-160 PWR 160 MWe Near-termdeployment Canada
ACP100 iPWR 125 MWe Near-termdeployment China
SMART iPWR 100 MWe Near-termdeployment South Korea
PRISM SFNR 311 MWe Near-termdeployment USA
Natrium SFNR 345 MWe Near-termdeployment USA
ARC-100 SFNR 100 MWe Near-termdeployment USA
SeaborgCMSR MSR 100 MWe Near-term
deployment Denmark
BREST Lead FNR 300 MWe Near-termdeployment Russia
BANDI-60S PWR 60 MWe Near-termdeployment South Korea
ACPR50S PWR 60 MWe Near-termdeployment China
III

DEPARTMENT OF SOME SUBJECT OR TECHNOLOGYCHALMERS UNIVERSITY OF TECHNOLOGYGothenburg, Swedenwww.chalmers.se