lovisa holdings limited 2019 half year - asx.com.au · trading performance - sales • total global...
TRANSCRIPT

Lovisa Holdings Limited2019 HALF YEARSHANE FALLSCHEER MANAGING DIRECTORCHRIS LAUDER CHIEF FINANCIAL OFFICER
For
per
sona
l use
onl
y

Some of the information contained in this presentation contains “forward - looking statements” which may not directly or exclusively relate to historical facts. These forward-looking statements reflect the current intentions, plans, expectations, assumptions and beliefs about future events of Lovisa Holdings Limited (LOV) and are subject to risks, uncertainties and other factors, many of which are outside the control of LOV.
Important factors that could cause actual results to differ materially from the expectations expressed or implied in the forward-looking statements include known and unknown risks.
Because actual results could differ materially from LOV’s current intentions, plans, expectations, assumptions and beliefs about the future, you are urged to view all forward-looking statements contained herein with caution.
2
For
per
sona
l use
onl
y

EBIT up 5.1%
$36.5M
Like for Like Sales
-1.8%Revenue up 12.3%
$133.2M
Interim Dividend
18.0 CPS
Fully Franked
NPAT $25.5M
up 2.7%
Total Stores
366Net increase of 40 stores
3
For
per
sona
l use
onl
y

CONTENTS
1. FULL YEAR OVERVIEW
2. FINANCIAL OVERVIEW
3. TRADING PERFORMANCE
4. CASHFLOW AND BALANCE SHEET
5. STORE GROWTH
6. USA UPDATE
7. EUROPE UPDATE
8. OPERATIONAL UPDATE
9. PEOPLE UPDATE
10. TRADING UPDATE AND OUTLOOK
11. SUMMARY
12. APPENDICES4
For
per
sona
l use
onl
y

HALF YEAR OVERVIEW
• EBIT up 5.1% to $36.5m
• Total sales up 12.3% and comparable store sales down -1.8% for the half year, impacted by continued tougher trading conditions in the Australian market and cycling strong first half prior year comparable store sales of +7.4%
• Gross margin increased to 81.0% due to the benefit of currency tailwinds combined with continued disciplined promotional and inventory management
• Continued global rollout strategy with a further net 40 stores opening during the half year
• Rollout in the US and France markets to accelerate, with structures in place to drive momentum
• US market rollout soon to expand outside California
• CODB at 50.4% to sales impacted by investment in global structures and costs of rollout in new territories
• eCommerce trading in the Australian/New Zealand market since October providing enhanced customer interaction capability
• Cash flow from operations lifted 9.4% to $49.1m with operating cash conversion at 121% with working capital management remaining a key focus
• Directors determined to pay a fully franked interim dividend of 18.0cents being a lift of 5.0 cents on the prior comparable period
5
For
per
sona
l use
onl
y

FINANCIAL OVERVIEW
• Revenue up 12.3% with comparable store sales down 1.8% for thehalf year
• Gross profit of $107.8m up 13.0% reflecting improved margins
• CODB increased by 230bps to 50.4% impacted by continued investment in global support structure and new territory expansion combined with negative comp store sales impact
• EBIT increased 5.1% to $36.5m for the half year
• EPS of 24.2 cents per share
• International expansion continued with a net increase of 40 stores during the half year
• Continued strong balance sheet and cashflow generation
• Directors declared a fully franked final dividend of 18.0 cents being a lift of 5.0 cents on the prior comparable period
Continued earnings growth from store rollout and gross margin expansion
6
($000) HY19 HY18 Variance
Actual Actual Actual
Revenue 133,195 118,615 12.3%
Gross profit 107,825 95,388 13.0%
EBITDA 40,698 38,329 6.2%
EBIT 36,489 34,734 5.1%
NPAT 25,517 24,843 2.7%
EPS (cents) 24.2 23.7 0.5 cents
Dividend (cents) 18.0 13.0 5.0 centsFor
per
sona
l use
onl
y

TRADING PERFORMANCE - SALES
• Total Global Sales Revenue up 12.3% to $133.2m from acceleration in store rollout
• Comparable store sales down 1.8% impacted by difficult conditions in the Australian market and cycling strong comp sales from prior year
• We have not seen the same strong fashion trends through the half year that we saw in prior years, which has impacted our ability to cycle the particularly strong Christmas and Boxing day period from prior year
• We remained focused on preserving our gross margin through this period
Total sales up 12.3% from continued global rollout
7
For
per
sona
l use
onl
y
TRADING PERFORMANCE - SALES
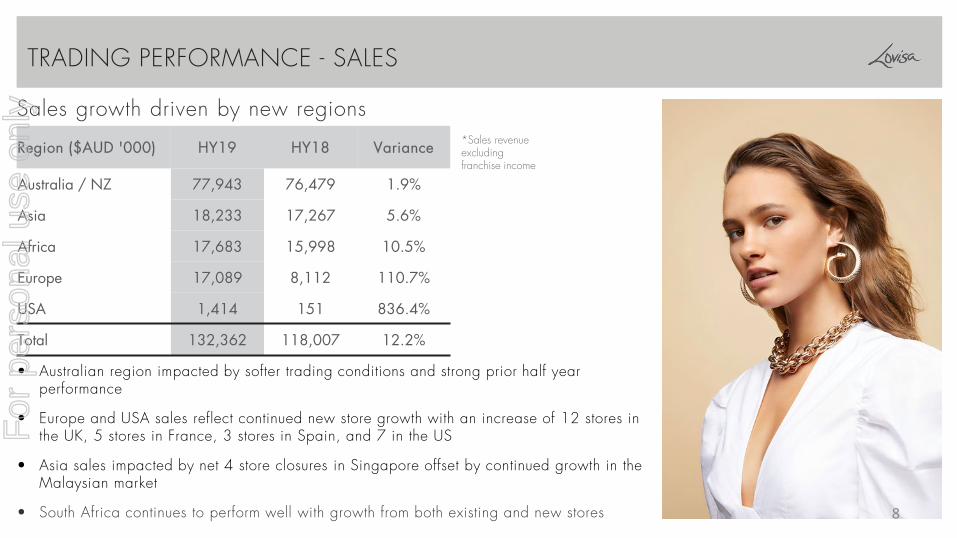
• Australian region impacted by softer trading conditions and strong prior half year performance
• Europe and USA sales reflect continued new store growth with an increase of 12 stores in the UK, 5 stores in France, 3 stores in Spain, and 7 in the US
• Asia sales impacted by net 4 store closures in Singapore offset by continued growth in the Malaysian market
• South Africa continues to perform well with growth from both existing and new stores
Sales growth driven by new regions*Sales revenue excluding franchise income
8
Region ($AUD '000) HY19 HY18 Variance
Australia / NZ 77,943 76,479 1.9%
Asia 18,233 17,267 5.6%
Africa 17,683 15,998 10.5%
Europe 17,089 8,112 110.7%
USA 1,414 151 836.4%
Total 132,362 118,007 12.2%
For
per
sona
l use
onl
y

TRADING PERFORMANCE - GROSS MARGIN
• Gross profit increased 13% to $107.8m
• Gross Margin was 81.0% up 60 basis points from 80.4% in the priorperiod
• Gross Margin on a constant currency basis was 80.5%
• Gross Margin increase driven by the benefit of favourable USD hedge rates through the half combined with tight inventory and promotion management
• The business remained focused on maintaining strong gross margins despite the more challenging trading conditions for the period
Gross margin increased to 81.0%
*Constant currency impact on inventory purchases
9
Gross Margin at Constant Currency*
HY19 HY19 HY18
Currency USD 0.77 0.75 0.75
Sales 133,195 133,195 118,615
Cost of Sales (25,370) (25,984) (23,227)
Gross Profit 107,825 107,210 95,388
Gross Margin 81.0% 80.5% 80.4%
78.3% 75.0% 77.8% 80.4% 81.0%
0.0%
20.0%
40.0%
60.0%
80.0%
100.0%
HY15 HY16 HY17 HY18 HY19
Gross Margin %
For
per
sona
l use
onl
y

COST OF DOING BUSINESS
• Investment into the growth of the business continued with the addition of a number of senior leadership roles into the structure to lead both existing and new territories.
• Acceleration of rollout in new territories has increased CODB with higher initial operating costs
• Investment made into implementation of eCommerce site, live since October
• One-off impact of relocation of Hong Kong logistics operation to Qingdoa, China
• Underlying operating costs remain well controlled with CODB increases focused on entry into new territories and store network growth
Continued investment in global rolloutCODB % Sales
10
50% 50% 47% 48% 50%
0%
10%
20%
30%
40%
50%
60%
HY15 HY16 HY17 HY18 HY19
For
per
sona
l use
onl
y

CASH FLOW
Strong Cash Conversion and capex investment
• Cash flow from operating activities lifted 9.4% to $49.1m with operating cash conversion at 121%
• Capital expenditure of $12.5m for the half year, including payments of $0.3m for key money
• Higher capex spend per store as we build scale and rollout in new markets
• Dividends of $14.8m paid during the period following an 84% increase in FY18 final dividend
• Increase in cash for the year to date of $10.8m, with closing cash balance of $32.3m and $25m of undrawn financing facilities
11
(A$000s) HY19 HY18
Cash from operating activities 49,142 44,929
Net interest paid 99 (6)
Tax paid (12,360) (7,689)
Net cash from operations 36,881 37,234
Property Plant & Equipment (12,161) (7,430)
Key Money (318) -
Net cash used in investing activities (12,479) (7,430)
Share options exercised 1,265 -
Dividends paid (14,779) (7,981)
Net cash used in financing activities (13,514) (7,981)
Opening cash 21,057 11,039
Effect in movement in exchange rates 339 172
Closing cash 32,284 33,034
Net movement in cash 10,888 21,823
For
per
sona
l use
onl
y

BALANCE SHEET
Strong Balance Sheet with Significant Capacity Available To Fund Growth • Balance sheet continues to be strong, with investment in fitout
and inventory for new stores and e-commerce implementation funded from cash flow, and net cash of $32m at half-year end
• Focus on disciplined inventory management continues
• Material headroom in the company’s fixed charge ratio and operating leverage covenants, and $25m financing facilities available, plus $15m acquisition finance facility (subject to bank due diligence)
• Acceleration of the EU and USA rollouts currently able to be funded from our strong balance sheet position, free cash flow generation and available facilities
• This has allowed the payment of an increased interim dividend of 18 cents per share
• We will continue to review dividend levels going forward based on capital requirements of store network expansion
12
(A$000s) HY19 FY18 HY18
Net Cash 32,284 21,057 33,034
Receivables 4,631 4,881 3,781
Inventories 19,474 14,945 14,670
Derivatives 1,268 1,429 -
Total current assets 57,657 42,312 51,485
Property Plant & Equipment 30,574 22,411 19,685
Intangibles 3,890 3,563 2,495
Deferred tax asset 4,835 4,535 4,097
Total assets 96,956 72,821 77,762
Payables 20,591 11,747 14,702
Derivatives - - 609
Provisions 10,191 10,067 11,051
Total current liabilities 30,782 21,814 26,362
Provisions 8,397 5,765 5,222
Total liabilities 39,179 27,579 31,584
Net assets 57,777 45,242 46,178
Covenants HY18 FY18 HY18
Fixed charge ratio > 1.40 2.59 2.68 2.73
Operating leverage < 1.75 0.08 0.06 0.08
For
per
sona
l use
onl
y

STORE GROWTH
International Rollout Accelerates with a Net Increase of 40 Stores
• Number of international stores growing with offshore territories now 58% of the store network
• Net increase of 40 stores for the half year, with 51 new stores opened offset by 11 closures as we constantly focus on network optimisation
• UK store rollout continued momentum with 12 new stores opened during the half year
• Pleasing performance of the US and France markets through the Christmas and post-Christmas Sale periods has given us the confidence to move into full rollout in those regions
• Global Property team in place with resources in key markets, a key component to driving new market leasing deals
• We continue to be diligent in ensuring store locations and rent economics meet internal hurdles
13
Store number growth
Country HY19 FY18 Var Est. Store Capacity
Australia 155 151 4 150+New Zealand 20 20 0 18-20Singapore 18 22 (4) 20-25Malaysia 22 21 1 20-25South Africa 61 56 5 55+United Kingdom 36 24 12 100Spain 8 5 3 TBCFrance 7 2 5 TBCUSA 8 1 7 TBCMiddle East 24 18 6 50Vietnam 7 6 1 10-15Total 366 326 40
For
per
sona
l use
onl
y

USA UPDATE
14
• We are currently trading from 8 stores in California
• Performance to date has been pleasing with strong customer reaction and landlord engagement
• Operating costs of this market currently higher than some other markets, in particular store build costs
• Store metrics and range performance have been consistent with our expectations
• We expect to be trading from other states by the end of the financial year, and now have 2 leasing managers in place in the market
• We see the USA market as a significant long term opportunity and are currently building the structures to support this
• We will continue to apply our diligent approach to new store evaluation to ensure that we maintain the quality of our store network, and will not sacrifice store quality for speed or size of rolloutF
or p
erso
nal u
se o
nly

EUROPE UPDATE
15
• We are currently trading from 36 stores in the UK, 7 in France, and 8 in Spain
• UK rollout has continued with 12 stores opened for the period
• Performance of our stores in Spain has been inconsistent, and we will continue to take a cautious approach and slow any further store openings until we can deliver on the key metrics required to expand in this market
• The performance of our 7 stores in France has been promising giving us the confidence to move to full rollout in this market
• Leasing manager in place in France
• Store cost metrics in the French market are proving to be higher than our current average based on our experience to date
• We will continue to apply our diligent approach to new store evaluation to ensure that we maintain the quality of our store network, and will not sacrifice store quality for speed and size of rollout
For
per
sona
l use
onl
y

OPERATIONAL UPDATE
16
• We continue to focus on investment in people and processes to ensure we remain efficient as we grow and able to execute on our strategic plans
• Key operational and IT changes completed during the half:
• Move of our third party logistics hub from Hong Kong to Qingdao China complete
• Change in logistics provider to deliver a more efficient supply chain complete
• Upgrade of our in-store point of sale hardware and software complete
• Replacement of our global store labour management and rostering system complete
• e-commerce now live in Australia and NZ via Lovisa.com
For
per
sona
l use
onl
y

PEOPLE UPDATE
17
• Significant senior executive appointments were made during the period, including:
• Chief Operating Officer
• Executive Vice President Europe & Africa
• Vice President Retail Stores & Operations USA
• Leasing Manager - France
• Leasing Manager - US East Coast
• Global Property Director relocated from Australia to London to be closer to growth markets
• These roles are critical to the leadership of the business as we drive our global store network expansion
• We are also pleased to announce the appointment of Sei Jin Alt as an independent non-executive Director of the company. Sei Jin brings to the Board broad merchandising, managerial, financial, and operational experience in multiple fashion categories as well as business leadership expertise gained over 20 years in the industry across a number of major US retailers including Francesca’s, JC Penney, Nordstrom and Macy’s
• Nico Van Der Merwe has also joined the Board as Alternate Director to Brett Blundy. Nico has been Chief Financial Officer of BB Retail Capital (BBRC) for the past 12 years and brings significant retail, investment, and financial management experience to the Board.
For
per
sona
l use
onl
y

TRADING UPDATE AND OUTLOOK
18
• We continue to cycle 4 years of particularly strong comparable store sales. This has made a continuation of the strong comparable store sales delivered in FY18 more challenging
• Trading since the end of the half year has seen an improvement across all markets with positive comparable store sales for the period however still below our target comparable store sales range of 3 – 5%
• We continue to focus on ensuring that our strong gross margins are maintained and costs remain well controlled as we invest in the future growth of the business. We expect currency headwinds to begin to have an impact later in the financial year and into FY20 as our average USD hedge rate reduces
• We continue our focus on expanding our store network, and expect the increase in number of stores for the second half of FY19 to be higher than in the second half of FY18
• We will continue to invest in our support structures ahead of the growth curve to drive store network expansion and support the larger business.
For
per
sona
l use
onl
y

SUMMARY
• EBIT of $36.5m and 81.0% gross margin (80.5% on constant currency)
• Comparable store sales of -1.8%
• Lift in margin benefiting from currency tailwinds and tight inventory and promotion management
• Continued CODB investment focused on laying the platform for future growth
• Tight stock and cost control with cash conversion at 121%
• International expansion continued with a further net 40 stores opening during the half year and a total network of 366 stores at half year end
• 58% of store network now outside of Australia
• Rollout underway in the USA and France markets following successful recent trading
• Fully franked final dividend of 18.0 cents per share
19
For
per
sona
l use
onl
y

APPENDICES
20
For
per
sona
l use
onl
y

APPENDIX 1
ASIC Regulatory Guide 230 Disclosing non-IFRS financial information
In December 2011 ASIC issued Regulatory Guide 230. To comply with this Guide, Lovisa Holdings Limited is required to make a clear statement about the non-IFRS informationincluded in the Profit announcement and Full Year presentation for the half year ended 30 December 2018.
In addition to statutory report amounts, the following non-IFRS measures are used by management and the directors as the primary measures of assessing financial performance ofthe Group and Individual Segments:
Non-IFRS measures used in describing the Business Performance include:
• Earnings before interest tax (EBIT)
• Earnings before interest, tax, depreciation, amortisation (EBITDA)
• Comparable Store Growth
In addition to the above the following non-IFRS measures are used by management and the directors to assess the underlying performance of the Group for half year.
• Constant Currency Margin
The directors consider that these performance measures are appropriate for their purposes and present meaningful information on the underlying drivers of the continuing business.
Many of the measures used are common practice in the industry within which Lovisa operates. The Profit Announcement and Half Year presentation has not been audited or reviewed in accordance with Australian Auditing Standards.
Definitions
• EBITDA - Result from operating activities before Depreciation and Amortisation
• EBIT - Result from operating activities
• Comparable Store Growth - Sales performance compared to last periods for stores trading in the retail network greater than one year before foreign currency movements
• Net Cash - Cash on hand less overdraft
• Constant Currency Margin - Stock purchases in USD held constant from prior year21
For
per
sona
l use
onl
y

APPENDIX 2 – PROFIT AND LOSS STATEMENT
22
($’000) HY19 HY18 Variance
Actual Actual Actual
Revenue 133,195 118,615 12.3%
Cost of sales (25,370) (23,227) 9.2%
Gross profit 107,825 95,388 13.0%
Employee expenses (32,451) (28,167) 15.2%
Property expenses (20,074) (16,407) 22.4%
Distribution expenses (3,995) (3,432) 16.4%
Depreciation (4,209) (3,595) 17.1%
(Loss)/profit on disposal of PPE (223) (67) 232.8%
Other expenses (10,384) (8,986) 15.6%
Operating profit 36,489 34,734 5.1%
Finance income 194 18 977.8%
Finance cost (95) (24) 295.8%
Profit before tax 36,588 34,728 5.4%
Income tax expense (11,071) (9,885) 12.0%
Net profit after tax 25,517 24,843 2.7%
EPS (cents) 24.2 23.7 0.5
Dividends cents per share 18.0 13.0 5.0
For
per
sona
l use
onl
y

APPENDIX 3 – KEY RISKS
Foreign Currency • Majority of goods that are imported are priced in USD. Consequently Lovisa is exposed to movements in the USD exchange rate
• As international growth continues Lovisa will be exposed to movements in the exchange rates of the countries it operates
Store Growth • Lovisa’s growth strategy is based on its ability to increase earnings from existing stores and continue to open and operatenew stores on a timely and profitable basis
• Lovisa’s store rollout program is dependant on securing stores in suitable locations on acceptable terms and may be impacted by factors including delays, cost over runs and disputes with landlords
Property • Failure to renew existing leases on acceptable terms or an inability to negotiate alternative arrangements could adverselyaffect Lovisa’s ability to operate stores in preferred locations
Merchandising • Lovisa’s revenues are currently generated from the retailing of jewellery which is subject to change in prevailing fashions and consumer preferences
• Failure by Lovisa to predict or respond to such changes could adversely impact its financial performance• Any failure by Lovisa to correctly judge customer preferences or to convert market trends into appealing product
offerings on a timely basis may result in lower revenue and margins• Any unexpected change in prevailing fashions or customer preferences may lead to Lovisa carrying increased obsolete
inventory• Lovisa’s products are manufactured directly in factories in China, India and Thailand. As a result Lovisa is exposed to
risks including foreign currency, politically instability, increased security requirements for goods, cost and delays in international shipping arrangements, imposition of taxes and other charges
Employment Costs • Lovisa’s employees are covered by enterprise bargaining agreements and other workplace agreements thatperiodically require renegotiation and renewal. Any such renegotiation could result in increased labour costs for Lovisa
Product • Lovisa’s name and its related intellectual product are key assets of the business. The reputation and value associated with Lovisa and related intellectual property rights could be adversely impacted by a number of factors including failure to provide customers with quality of product and service standards they expect, disputes or litgation with third party such as employees, suppliers or customers 23
For
per
sona
l use
onl
y

APPENDIX 4 – GLOBAL BRAND STRATEGY
Vision • Internationally recognised brand• Global footprint• Brand of choice for fast fashion jewellery
Growth Engine • High Margin business operating in small store footprint• Fit out cost generally low with compelling return and pay back period• Inexpensive entry to new territories with ability to leverage off one support centre across the Globe• Successful in all territory entries to date
International Expansion • Continue to leverage current international territories• Leverage the Company’s capital in large international territories• Roll out of UK territory in progress• Pilots complete in France and the US and rollout underway• Consider franchise partners for selected territories
Global Supply Chain • Continue to streamline and optimise supply base in Asia• Optimise air and sea freight whilst maintaining a “speed to market” operating model• Consider Northern Hemisphere Distribution centre
Store Performance • Optimise and improve existing store network• Continue to target high traffic shoppingprecincts
Brand Awareness • Continue to leverage social media and e-commerce platform to connect with customers and increase brandloyalty
• Stay on trend with shifts in the jewellery market• Continue to provide a high quality and diverse product offering
24
For
per
sona
l use
onl
y