louisville final report 2008-07-17 · 118 william street portland, maine 04103 ... study team ......
TRANSCRIPT
Building Louisville’s Local Food Economy: Strategies for increasing Kentucky farm income through expanded food sales in Louisville
FINAL REPORT
Prepared for: Louisville Metro Economic Development Department Funding provided by: Kentucky Agricultural Development Fund and Local Food Economy Work Group Member Contributions July 17, 2008
118 William Street Portland, Maine 04103
207.321.2016 tel 207.321.2018 fax
www.marketventures inc.com

Final Report: Building the Local Food Economy, Louisville, Kentucky Page 2 Market Ventures, Inc./Karp Resources 7/17/2008
Contents
Section 1: Executive Summary ................................................................................... 5 Snapshot of Louisville food economy .......................................................................... 5 Snapshot of Kentucky agriculture ................................................................................ 7 Strategies .................................................................................................................... 8 Recommendations ..................................................................................................... 12
Section 2: Introduction .............................................................................................. 17 Goals ......................................................................................................................... 17 Local Food Economy Work Group ............................................................................. 18 Study team ................................................................................................................ 18 Research questions ................................................................................................... 19 Work plan and methods ............................................................................................. 19
Farmer focus groups .............................................................................................. 20 Section 2: Snapshot of the Louisville Food Economy ............................................ 22
Retail or consumer level ............................................................................................ 22 Consumer demand ................................................................................................. 22 Supermarkets and food stores ............................................................................... 25 Farmers’ markets ................................................................................................... 29 Community Supported Agriculture ......................................................................... 30 Restaurants ............................................................................................................ 32 Institutions .............................................................................................................. 33 Emergency feeding ................................................................................................ 38 Other local foods initiatives and support assets ..................................................... 40
Wholesale .................................................................................................................. 41 Distributors ............................................................................................................. 41 Wholesale direct ..................................................................................................... 43
Manufacturing and processing ................................................................................... 43 Food processing ..................................................................................................... 43 Meat processing ..................................................................................................... 45
Louisville Food Sector Snapshot Conclusions ........................................................... 45 Section 3. Snapshot of Kentucky Agriculture ......................................................... 46
Geographic target and key characteristics ................................................................. 49 Meat and poultry processing ...................................................................................... 52 Agritourism ................................................................................................................ 52 Agriculture programs and supporting assets ............................................................. 53
Kentucky Department of Agriculture ....................................................................... 53 Other state government ......................................................................................... 57 University of Kentucky ............................................................................................ 57 Kentucky State University ...................................................................................... 58 Farm Bureau .......................................................................................................... 59 Kentucky Agricultural Development Board ............................................................. 60 Kentucky Agricultural Council ................................................................................ 60 Other organizations ................................................................................................ 60
Final Report: Building the Local Food Economy, Louisville, Kentucky Page 3 Market Ventures, Inc./Karp Resources 7/17/2008
Conclusion: Kentucky Agriculture Snapshot ............................................................. 62 Section 4. Strategy Overview .................................................................................... 63
Farmer focus group responses .................................................................................. 63 Section 5. Retail Strategies ....................................................................................... 65
Farmers’ markets coordination, expansion and marketing ........................................ 65 Overview ................................................................................................................ 65 Opportunity ............................................................................................................ 65 Strategy .................................................................................................................. 66 Potential impact ...................................................................................................... 67
Create a year-round, indoor public market in downtown ............................................ 67 Overview ................................................................................................................ 67 Key considerations ................................................................................................. 68 Opportunity ............................................................................................................ 70 Financial analysis ................................................................................................... 74 Strategy .................................................................................................................. 75 Potential impact ...................................................................................................... 76
Community Supported Agriculture ............................................................................. 77 Overview ................................................................................................................ 77 Opportunity ............................................................................................................ 77 Strategy .................................................................................................................. 79 Potential impact ...................................................................................................... 79
Section 6. Wholesale Strategies ............................................................................... 80 Local foods distribution company/expanded infrastructure ........................................ 80
Overview ................................................................................................................ 80 Opportunity ............................................................................................................ 80 Strategy .................................................................................................................. 80 Potential impact ...................................................................................................... 81
Restaurants ............................................................................................................... 81 Concept .................................................................................................................. 81 Opportunity ............................................................................................................ 81 Strategy .................................................................................................................. 82 Potential Impact ..................................................................................................... 83
Wholesale farmers’ market ........................................................................................ 84 Overview ................................................................................................................ 84 Opportunity ............................................................................................................ 84 Strategy .................................................................................................................. 84
Schools and institutions ............................................................................................. 85 Concept .................................................................................................................. 85 Opportunity ............................................................................................................ 85 Strategy .................................................................................................................. 86 Potential Impact ..................................................................................................... 87
Expand local presence in supermarkets .................................................................... 87 Overview ................................................................................................................ 87 Opportunity ............................................................................................................ 87 Strategy .................................................................................................................. 87

Final Report: Building the Local Food Economy, Louisville, Kentucky Page 4 Market Ventures, Inc./Karp Resources 7/17/2008
Potential impact ...................................................................................................... 88 Section 7. Infrastructure Strategies .......................................................................... 89
Meat and poultry processing facility ........................................................................... 89 Overview ................................................................................................................ 89 Opportunity ............................................................................................................ 89 Strategy .................................................................................................................. 90 National Models ..................................................................................................... 91 Potential impact ...................................................................................................... 91
Food processing facility ............................................................................................. 92 Overview ................................................................................................................ 92 Opportunity ............................................................................................................ 92 Strategy .................................................................................................................. 93
Section 8. Farm-based Strategies ............................................................................. 95 Agritourism ................................................................................................................ 95
Overview ................................................................................................................ 95 Opportunity ............................................................................................................ 95 Strategy .................................................................................................................. 96 Potential impact ...................................................................................................... 96
New farmer development ........................................................................................... 97 Overview ................................................................................................................ 97 Opportunity ............................................................................................................ 97 Strategy .................................................................................................................. 98 Potential impact ...................................................................................................... 99
Section 9. Recommendations ................................................................................. 100 Strategies for implementation .................................................................................. 100 Organization ............................................................................................................ 105
Section 10. Conclusion ............................................................................................ 107 Appendix A: Local Food Economy Work Group ................................................... 108 Appendix B: Interview List ....................................................................................... 110 Appendix C: Farmer Focus Group Participant Survey ......................................... 112
Farmer Description .................................................................................................. 113 Marketing Channels ................................................................................................. 117
Appendix D: Farmer Focus Group Results ............................................................ 120 Henry County ....................................................................................................... 120 Jefferson County .................................................................................................. 121 Hardin, Larue and Nelson Counties ..................................................................... 123 Oldham County .................................................................................................... 125 Mercer County Focus Group ................................................................................ 127 Washington County Focus Group ........................................................................ 129 Spencer County Focus Group .............................................................................. 131 Shelby County Focus Group ................................................................................ 133 Trimble County Focus Group ............................................................................... 135
Appendix E: CSA Resources .................................................................................. 137 Appendix F: Downtown Agriculture Facility Pro Forma ....................................... 139

Final Report: Building the Local Food Economy, Louisville, Kentucky Page 5 Market Ventures, Inc./Karp Resources 7/17/2008
Section 1: Executive Summary
In September 2007, the Economic Development Department of Louisville Metro Government, in conjunction with local collaborators, retained the consultant team of Market Ventures, Inc. and Karp Resources (“MVI/KR”) to study the potential for increasing sales of locally grown and produced foods in Louisville. The premise of the study is that Louisville, as the state’s largest population center, has the potential to increase substantially the amount of food purchased from Kentucky farmers. The primary goal of the study has been to identify strategies that will most effectively increase Kentucky farmer income through new or expanded sales to Louisville consumers, businesses and institutions. In addition, the team has considered strategies that have additional benefits besides farm income, such as the community revitalization effects of farmers’ markets or the impact that a downtown public market might have on attracting tourists.
Over the course of the study period, the MVI/KR team studied the city’s existing food economy, the present state of Kentucky agriculture, and current initiatives at the local and state level. Through its research and analysis, the consultant team sought to identify the highest potential opportunities for increasing sales of locally grown and produced foods through the city’s various food sectors, including retail, restaurant, wholesale, food processing and manufacturing, institutional food service, and emergency feeding. The team then developed strategies that address the myriad ways that food intersects with the local economy and developed recommendations for making targeted investments, altering public policies or private practices, and undertaking new initiatives that will link or stimulate local supply and demand, as well as address needed infrastructure to support food sales from local farmers.
Principal research methods included key informant interviews, review of secondary data and reports, and focus groups with a diverse group of 90 farmers from the 13 county region around Louisville.
Snapshot of Louisville food economy
Louisville’s 700,000 residents represent $1.60 billion in demand for food purchased for at-home consumption in 2007; this number is expected to grow to $1.79 billion by 2012. The demand for fresh produce is $137 million, growing to $157 million by 2012, while the demand for meat is $234 million, growing to $256 million by 2012. The current demand for food purchased for consumption away from home is $1.39 billion, growing to $1.69 billion in 2012. Combining the estimated demand for food purchased for at-home and away-from-home consumption, the total demand for food at the consumer level is approximately $3 billion per year.
The vast majority of retail food sales take place in supermarkets, which represent 86% of sales. In 2002, supermarkets and grocery stores in Louisville sold approximately $122 million of produce, $110 million of dairy and $171 million of meat/fish/poultry. Based on typical gross margins, annual purchases made by supermarkets and groceries from their suppliers equal about $80 million for produce, $77 million for dairy, and $103 million for meat/fish/poultry, for a total of $259 million.

Final Report: Building the Local Food Economy, Louisville, Kentucky Page 6 Market Ventures, Inc./Karp Resources 7/17/2008
Both visual inspection and interviews with local industry representatives confirm that locally grown and produced foods are sold in Louisville supermarkets. However, neither supermarkets nor the wholesalers and distributors who supply them compile information about the amount of locally grown foods that enter that channel. The Kentucky Department of Agriculture (KDA) has made a significant investment in its Kentucky Proud brand and is working closely with the largest supermarket chains, Wal-Mart and Kroger, to increase the amount of products labeled Kentucky Proud in their stores. State-wide, KDA estimates retail sales of Kentucky Proud products at $80 million.
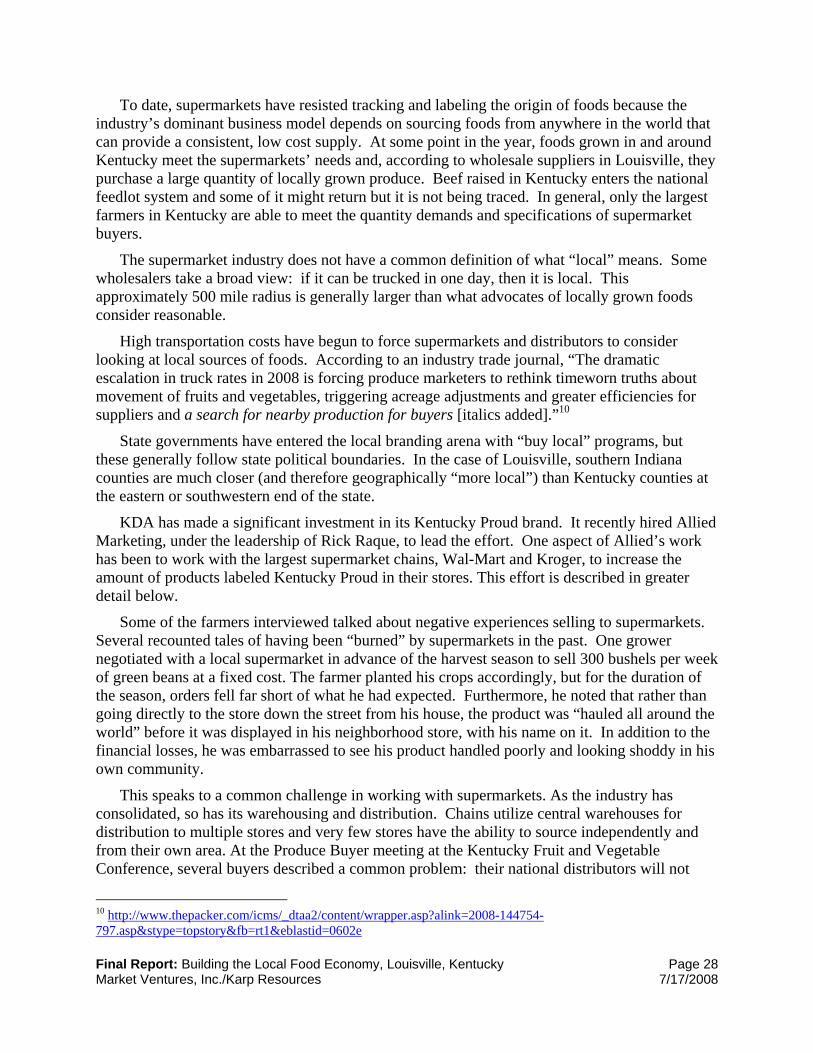
In 2007, 17 farmers’ markets operated in Jefferson County and at least three new ones are expected in 2008. These markets operate independently and are often located in church parking lots or other small public spaces. All of the farmers’ markets are seasonal, one or two day per week operations. Total annual sales of local foods at these farmers’ markets are estimated at $3.6 million.
The project team identified eight community-supported agriculture (CSA) farms that distribute within Jefferson County, supplying 451 shares. Most of the CSA farms distribute at farmers’ markets, where they also sell to retail customers. Based on an average cost per share of $450, Jefferson County CSA farmers generated $202,950 in annual sales in 2007.
There are 442 full service restaurants in Louisville, with sales of $423.5 million. Restaurants in the city purchase about $25 million worth of produce each year and $64 million worth of meat/poultry per year. A number of Louisville’s most acclaimed restaurants already purchase local foods.
The Jefferson County Public School system (JCPS) serves approximately 58,000 lunches, 24,000 breakfasts, and 1,800 snacks every day, plus 10,000-12,000 meals per day during the summer months. JCPS operates a centralized facility that prepares meals for the entire system, which are then delivered to individual schools. However, cafeteria managers in individual schools place their own orders for fresh fruits and vegetables. The central kitchen commissary has ample cold and dry storage capacity as well as a baking division and equipment for large scale food production, but it has neither the staffing capacity nor the equipment to clean and cut fresh produce.
JCPS leaders noted that the snack program could provide an opportunity for more local purchasing of fresh fruits and vegetables. This program is expected to grow from 1,800 snacks a day to 2,200-2,500 in SY2008-09. At present, food costs are $0.40-0.50 per snack and the total purchasing budget for snacks is about $200,000.
The University of Louisville has 12 different dining options on campus, all operated by the food service company Chartwells. Approximately $1.9 million is spent on food for these venues each year. The campus also includes a University Club, which is managed independently. The University has demonstrated a strong interest in on-campus sustainability and local food. In the 2007-2008 school year, the University amended Chartwell’s contract, requiring the company help the University achieve its goals of using at least 10% locally grown produce.
Jefferson County’s eight major hospitals and two correctional facilities serve over 15,500 meals per day, including food for patients as well as cafeteria offerings for staff and visitors.
Final Report: Building the Local Food Economy, Louisville, Kentucky Page 7 Market Ventures, Inc./Karp Resources 7/17/2008
Three national food service providers, Morrison Management, Aramark and Sodexo, manage all food programming in these institutions.
Emergency feeding providers include Kentucky Harvest, a volunteer-run food rescue organization, and Dare to Care, which receives most of its food through USDA’s Emergency Food Assistance Program and food donations from area food businesses, including fruits and vegetables from the Louisville Produce Terminal and the Gordon Foodservice Distribution Center. To date, Dare to Care has never purchased produce directly from farmers but the organization plans to budget an $800,000 for food purchases in order to provide more fresh foods.
On the wholesale level, there are 97 grocery and related produce merchant wholesales in Louisville with sales of $1.3 billion. 58 firms are engaged in food manufacturing in Jefferson County with sales of $1.321 billion.
Snapshot of Kentucky agriculture
Kentucky has 84,000 farms, the fifth largest number of farms per state in the country. The top farm commodities include horses, broilers, cattle and calves, tobacco and corn, which account for 75% of all sales. Vegetable crop receipts equal about $23 million. The principal growth in farm cash receipts over the past 25 years has come from the livestock sector, with the crops sector remaining fairly flat over this period.
Among farmers who grow fruits and vegetables, direct marketing has emerged as the dominant marketing channel, particularly the use of farmers’ markets. The number of farmers’ markets in Kentucky has tripled over the past 10 years and farmers’ markets account for about one-quarter of all Kentucky farm fruit and vegetable sales.
Farms represent an important cultural dimension in Kentucky. Key informants indicated the close relationship that many people in Kentucky, including city dwellers in Louisville, feel to farming and that most Kentucky residents are only one or perhaps only two generations removed from farming. Although Kentucky has undergone a profound shift toward urban/suburban residents, the close connection between citizens and farming creates bonds of understanding and appreciation, and with it potential to develop local foods strategies that make direct, emotional links between urban residents and foods grown in the state.
The 23 county region around Louisville contains 20,014 farms, or 23% of the state’s total. The most prevalent commodities are cattle and calves, followed by tobacco. Farms that grow primarily fresh produce represent only about 2% of the total.
There is currently limited processing infrastructure to slaughter, butcher or further process animals for the state’s numerous small and medium scale producers, many of whom prefer to retain ownership of their animals through slaughter. Leaders within KDA and researchers at UK identified a need for increased meat processing infrastructure in their research and in interviews with the consultant team.
Agri-tourism is growing in popularity. The state’s Office of Agritourism inventoried 268 agritourism businesses in Kentucky, with 35 businesses in the Louisville-Lincoln region, including farms, distilleries, wineries, agri-entertainment and other categories.
Final Report: Building the Local Food Economy, Louisville, Kentucky Page 8 Market Ventures, Inc./Karp Resources 7/17/2008
Throughout Kentucky, government agencies, universities, nonprofit groups and private firms operate a wide range of programs that impact farmers. Some key agriculture programs and supporting assets include: KDA’s Kentucky Proud, farmers’ market, and restaurant rewards programs; the Cooperative Extension Service and various initiatives of the University of Kentucky and Kentucky State University; Farm Bureau; and the Kentucky Agricultural Development Board.
Strategies
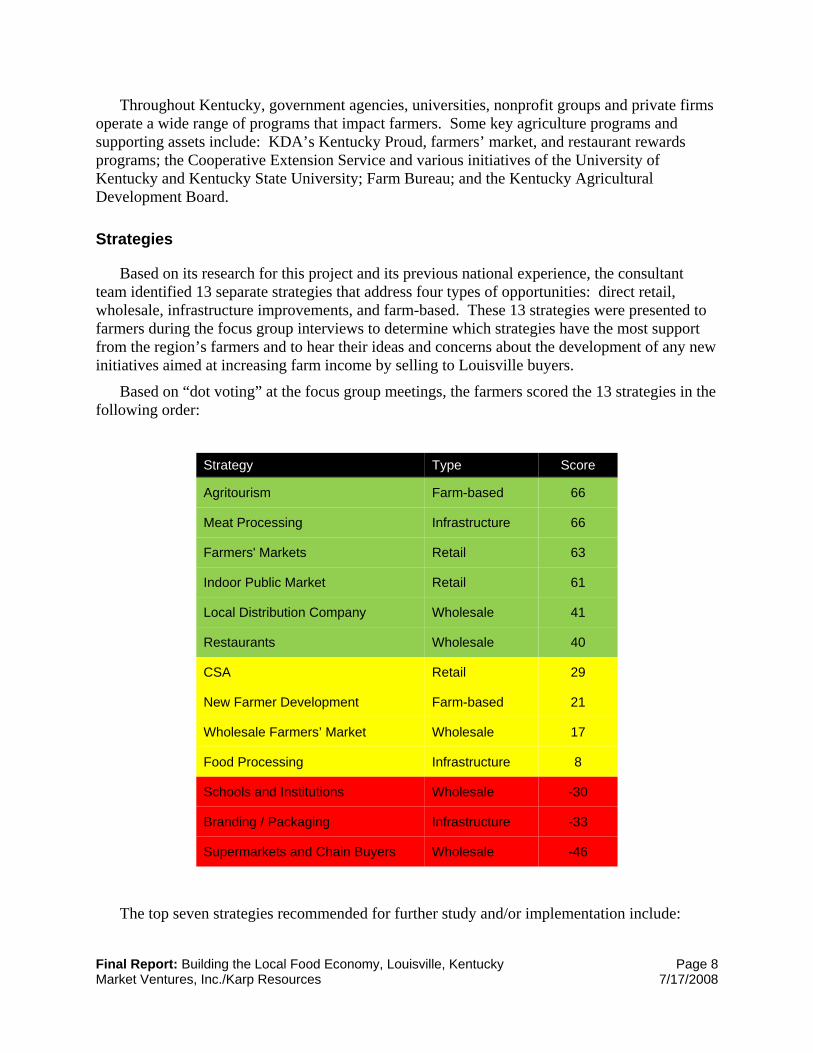
Based on its research for this project and its previous national experience, the consultant team identified 13 separate strategies that address four types of opportunities: direct retail, wholesale, infrastructure improvements, and farm-based. These 13 strategies were presented to farmers during the focus group interviews to determine which strategies have the most support from the region’s farmers and to hear their ideas and concerns about the development of any new initiatives aimed at increasing farm income by selling to Louisville buyers.
Based on “dot voting” at the focus group meetings, the farmers scored the 13 strategies in the following order:
Strategy Type Score
Agritourism Farm-based 66
Meat Processing Infrastructure 66
Farmers' Markets Retail 63
Indoor Public Market Retail 61
Local Distribution Company Wholesale 41
Restaurants Wholesale 40
CSA Retail 29
New Farmer Development Farm-based 21
Wholesale Farmers’ Market Wholesale 17
Food Processing Infrastructure 8
Schools and Institutions Wholesale -30
Branding / Packaging Infrastructure -33
Supermarkets and Chain Buyers Wholesale -46
The top seven strategies recommended for further study and/or implementation include:
Final Report: Building the Local Food Economy, Louisville, Kentucky Page 9 Market Ventures, Inc./Karp Resources 7/17/2008
Farmers’ markets coordination, expansion and marketing
The ability to significantly expand the amount of Kentucky grown foods sold at farmers’ markets will benefit from increased marketing and the creation of an organizational and management infrastructure that drives planned growth. Any efforts to encourage increased centralization of the farmers’ markets must recognize the independence that has guided the farmers’ markets to date and should build on the recent efforts to encourage greater cooperation.
The value of professional management and marketing services will need to be proven to the participating farmers and the sponsoring organizations. Therefore, it is recommended that an initial investment be made to support marketing and farmers’ market coordination for a 3-5 year period. Representatives from the various markets should be encouraged to participate in a coordinating body that works to develop common rules and a marketing program, assisted by a professional marketing firm. Over time, the value of increasing sales for farmers should be reflected in higher charges for rent and marketing fees, which will allow this strategy to be self sustaining following an initial investment period.
20% growth in farm sales from new marketing initiatives and improved operations would mean $720,000 in additional sales for Kentucky farmers. Adding five new farmers’ markets would mean $1,080,000 additional sales to Kentucky growers. Together, increasing per market sales and adding new markets could offer nearly $2 million in sales to regional farmers.
Create a year-round, indoor public market in downtown
Public markets are typically envisioned as a vibrant market hall or district where independent, locally-owned businesses feature food from the region, with an emphasis on fresh produce, meat, poultry, seafood, baked goods, dairy, and specialty food items, plus prepared food for both take-out and to eat on-premises. Some public markets also have a strong wholesale or food production component. Public markets create an important public place within the community, where residents of the city, the region, and tourists all mingle in an architecturally compelling space. They can also be places to promote local foods and educate both consumers and producers about food, food systems, sustainable growing practices, health, nutrition and fitness, and related topics.
The most important factors that determine public market success include a great site, a supportive and compelling physical environment, a culture of public market shopping, professional management, and great vendors. The demand analysis suggests that the retail component of a public market in Louisville can be up to 31,000 gross sf.
Given the somewhat small population base in Louisville and the challenge of finding experienced retail vendors, the concept for a downtown public market should integrate elements of both a combination wholesale/retail environment and a market district. Integrating food businesses that have a strong wholesale trade and creating a facility that supports wholesaling and food production in addition to retail will provide a better foundation for a public market than a retail-only facility. The market district concept seeks to brand a variety of buildings and public spaces as the public market and has common management and marketing that ties the various properties together.

Final Report: Building the Local Food Economy, Louisville, Kentucky Page 10 Market Ventures, Inc./Karp Resources 7/17/2008
A successful public market in Louisville would be expected to provide about $5.1 million in sales to Kentucky farmers, while providing small business development opportunities and jobs and a permanent showcase for Kentucky foods.
Community Supported Agriculture
To strengthen and increase the amount of CSA shares sold to the Louisville region, efforts could be made to utilize collaborative marketing, partner CSA farms with local emergency food providers, local businesses, and institutions (such as hospitals) to create institutional CSA shares, expand the number of CSA farmers by investing in internship and apprenticeship programs, encourage existing CSAs to expand their product mix to include meat and dairy, and increase member involvement. Doubling the number of CSA shares in Louisville would result in $203,000 in new income to Kentucky farmers. Twenty institutional CSA shares at $3,000 per share would result in $60,000 in new income to Kentucky farmers.
Local foods distribution company infrastructure
Place are needed to aggregate and distribute products from farms in the region. Distributors said that they have trucks running throughout the region and often have room on their way back to Louisville, if there is a convenient place to pick up product. The proposed strategy is to build cold storage facilities at centralized locations along established trucking corridors throughout the region, which would serve a large number of smaller farmers. Possible locations include Cooperative Extension facilities, which are usually centrally located and often have substantial space, good access and parking. With minimal facility improvement or additional infrastructure (in some cases simply the construction of a free standing exterior walk-in cooler), farmers could pay a small fee to store their products there and private distributors could pick up their products on their way back to Louisville. Cooperative Extension staff could help coordinate the effort.
If five aggregation points were strategically located in the region and could supply three trucks a week with 10 pallets per truck for 20 weeks, then these facilities would help facilitate the movement of 3,000 pallets of local food each year.
Restaurants
A local food restaurant strategy would increase Louisville’s stature as a top class dining city, focusing on regional identity of products grown and served in restaurants. Importantly, it would require no infrastructure other than web and graphic technology and staff with the knowledge and ability to build rapport with producers and restaurateurs. The focus of this strategy is to increase local foods in Louisville restaurants by raising awareness among urban residents of foods produced in the region and building the supply of locally produced foods that are marketed and sold to restaurants.
Potential elements include:
• Seeking commitments from local restaurants to purchase increasing percentages of their food and wine from local sources, and creating a recognition system to identify and promote those restaurants based on their achievements.
• Funding a “public interest broker” whose job is to broker deals that mutually benefit Kentucky growers and Louisville buyers.
Final Report: Building the Local Food Economy, Louisville, Kentucky Page 11 Market Ventures, Inc./Karp Resources 7/17/2008
• Developing and implementing a “Certified Local Food” qualification system.
• Developing a public advertising campaign that encourages consumers to frequent restaurants that feature local foods and promoting restaurants that feature local foods at events such as the Kentucky Restaurant Association’s annual Taste of Louisville event.
• Developing gas credits or other business tax benefits that provide an incentive to distributors to support purchasing and distribution of local foods.
• Identifying land that could be a potential site for farms or gardens for restaurants.
Modest commitments from Louisville restaurants in purchasing locally grown produce and meat could lead to Kentucky farm sales of about $750,000.
Meat and poultry processing facility
Focus group participants were strongly attracted to developing more meat and poultry processing infrastructure, some based on their own needs and some because it seemed the strategy that would have a great impact. It tied for first place among focus group participants.
Louisville officials could team with neighboring counties to advocate for and perhaps help fund the creation of new meat and poultry processing facilities in neighboring counties. Incentives to draw new businesses could be created and infrastructure to support the facility could be supported or subsidized. Custom processing and butchering services were identified repeatedly as a need and could, more easily than slaughter facilities, be located within Louisville, perhaps as part of the public market facility.
Agritourism
Farmers in the focus groups ranked agritourism as the most popular concept (tied with meat processing), in part because of the long-term benefits of agritourism for educating the public about regional food and agricultural issues. Farmers liked the prospect of increasing on-site sales by “bringing people to the farm,” allowing farmers the opportunity to stay on their farms rather than spend time at farmers’ markets or other off-site places. Overall, there was a sense among the focus groups that statewide efforts to promote agritourism are headed in the right direction and should continue.
A program to strengthen agritourism around Louisville could include:
• Advertising to Louisville’s media markets.
• Linking agritourism to existing tourism and convention and visitor’s bureau efforts by promoting the area’s diverse agriculture venues as an appealing destination and increasing the connection to existing tourism agencies.
• Expanding school trips to local farms and connecting curricula to the local food supply.
• Partnering with KDA and its Division of Agritourism, as well as other Cooperative Extension and other groups, to develop a broad range of products and activities to promote regional farms to Louisville residents and tourists.
• Exploring legislative reform to promote the agritourism industry and limit liability exposure.

Final Report: Building the Local Food Economy, Louisville, Kentucky Page 12 Market Ventures, Inc./Karp Resources 7/17/2008
• Leveraging in-city programs such as farmers’ markets, CSAs, and restaurants that buy local to promote on-farm activities and linking these with maps and promotional materials.
Recommendations
The chart below shows each strategy as ranked by the farmers in the focus groups, an initial ballpark estimate for the costs to implement in the first three years, potential sales that could go to Kentucky farmers, and an Investment Return Ratio, which is the estimated three year return to Kentucky farmers divided by the estimated three year investment cost of the strategy. In terms of greatest dollar potential, the public market, meat and poultry processing facilities, and expanded farmers’ markets are the top three strategies. The second chart outlines some non-monetary benefits as well as some challenges which may limit development or implementation.
In terms of best investment return ratios, the top three are farmers’ markets expansion and marketing, restaurants, and aggregation points:

Final Report: Building the Local Food Economy, Louisville, Kentucky Page 13 Market Ventures, Inc./Karp Resources 7/17/2008
StrategyFarmer rating
3 year investment estimate
3 year return estimate to KY
farmers Investment return ratio
Downtown public market 4 $ 11,000,000 $ 15,300,000 1.4
Meat and poultry processing 1 $ 5,000,000 $ 15,225,000 3.0
Farmers' market coordination and marketing 3 $ 900,000 $ 5,400,000 6.0
Aggregation points for local foods distribution 5 $ 795,000 $ 3,300,000 4.2
Restaurants 6 $ 450,000 $ 2,250,000 5.0
Community Supported Agriculture 7 $ 450,000 $ 789,000 1.8
Agritourism 1 $ 450,000 $ 600,000 1.3
Strategy Community benefits Challenges
Downtown public market
Education, 7 day access to local fresh foods, small business opportunities, jobs, tourism, attract shoppers downtown
Requires private sector investment and leadership; attracting quality vendors
Meat and poultry processing Jobs (particulary butchering at public market)
Licensing, siting/permitting, identifying qualified operator
Farmers' market expansion, coordination, and marketing
Public space activation, more community gathering spaces, consistent messaging and information, education
Potential hesitancy from existing farmers' markets about losing independence; availability of interested farmers

Final Report: Building the Local Food Economy, Louisville, Kentucky Page 14 Market Ventures, Inc./Karp Resources 7/17/2008
Aggregation points for local foods distribution
Strengthens food distributors in Louisville
Gaining collaboration from Coop Extension; farmer ability to increase production; liability issues
Restaurants
Strengthens indepent restaurants and food/dining identity of Louisville
Overcoming restaurateurs' time constraints
Community Supported Agriculture Community connections Recruiting farmers
Agritourism Education, tourism development
Policy barriers (insurance), transportation costs and coordination
The MVI/KR team recommends that multiple strategies be pursued concurrently rather than selecting only one or two for implementation. The private sector should be encouraged whenever possible to assist with the planning and implementation of the strategies, and the strategies should reinforce existing food production and distribution infrastructure, building off current assets. Finally, the team recommends that a regional approach will be most effective in implementing the strategies, including the wide range of organizations that have resources and experience to bring to the table, including Louisville Metro government, local government in surrounding counties, KDA, Cooperative Extension, the universities, Farm Bureau, and the variety of nonprofits engaged with food and farming issues.
Having one regional, lead organization to oversee the implementation for the various strategies will provide efficiencies in staffing and marketing, plus better coordination of the efforts and consistent methodologies to track implementation and evaluate outcomes and impacts. The key tasks for this region-wide organization include:
1. Marketing and coordinating farmers’ markets throughout Louisville and the region, through increased advertising and special events that will attract more customers, by working to centralize and professionalize the management of the farmers’ markets, and by planning the development of new markets in a coordinated way.
2. Creating the position of a “public interest broker” to work with wholesale buyers, including institutions, emergency feeding organizations, food distributions companies, and restaurants, as well as farmers, cooperatives, and packers.
3. Working with private developers to develop a public market in downtown Louisville, particularly with recruiting farmers and vendors, and with marketing.
4. Supporting the development of regional distribution and processing infrastructure, in particular the highly desired additional meat and poultry processing in the Louisville region and the creation of regional cold storage distribution hubs, potentially at Cooperative Extension facilities in neighboring counties.
Final Report: Building the Local Food Economy, Louisville, Kentucky Page 15 Market Ventures, Inc./Karp Resources 7/17/2008
5. Supporting the state’s agritourism efforts and work with Louisville-based educational institutions and tourism agencies to promote local and out-of-state tourism to the region’s farms.
6. Developing the restaurant promotion program, working closely with Louisville restaurateurs who have experience buying directly from farmers and promoting their products on the restaurants’ menus.
7. Expanding and promoting CSA’s to both retail and wholesale customers, potentially linking distribution to existing or newly developed farmers’ market sites.
In addition to implementing the seven top strategies, this effort could include promotional and policy efforts to encourage Louisville residents and visitors to purchase and eat locally grown foods. These could include:
8. Developing an “Eat Local” campaign aimed at Louisville residents, promoted by the Mayor and other local officials. This effort can build off of the accomplishments, communications infrastructure, and branding of the Mayor’s Healthy Hometown Movement.
9. Creating a portion of the Eat Local campaign to be aimed at restaurants, thereby encouraging and formally recognizing restaurants that purchase the most locally grown foods.
10. Extending the Eat Local campaign to local public policy, requiring any food service contracts entered into by local government to have a local foods provision.
11. Developing policies and programs to encourage farming and gardening within Jefferson County, including the potential for developing an Intervale-like education facility.
12. Encouraging education about local foods and farming throughout the educational sector.
The organizational capacity to implement these tasks will likely take time to develop. Initially, the Local Food Economy Work Group can look toward the identification and assignment of existing resources, including personnel, as it continues to build local partnerships. This group will need to make decisions about how the work will get done and determine where it will focus its efforts.
Ideally, implementing the seven strategies recommended above will require an entity to organize the regional partnership, staff to provide leadership and conduct work tasks, and adequate resources to fund the initiative. The MVI/KR team recommends that an organizational “home” for local foods projects be identified that represents the approximately 23 county region in and around Louisville.
Several of the proposed strategies require capital investments, such as the indoor public market, the aggregation point facilities, and the meat and poultry processing facilities. These strategies will likely require a mix of public and private funds and should have strong private sector leadership, supported by the proposed regional partnership.
The Louisville region has a significant opportunity to expand the sales of locally grown foods in the city. The study identified tremendous interest in purchasing locally grown foods from all
Final Report: Building the Local Food Economy, Louisville, Kentucky Page 16 Market Ventures, Inc./Karp Resources 7/17/2008
sectors of the local food economy, including consumers, restaurateurs, retailers, wholesalers, institutions, and distributors. The farmer focus groups revealed strong interest among the region’s farmers to expand their sales in Louisville, particularly by selling directly to consumers.
Louisville can lead the nation in creating a comprehensive approach to expanding sales of locally grown foods throughout its food economy. This effort will reinforce the city’s other innovative strategies, including its health and wellness initiatives, tourism promotion, business and job development, and enhancements to quality of life in downtown and throughout the city. The research, analysis and recommendations in this report should provide the foundation and strategic direction for expanding the sales of locally grown foods in the city.
Final Report: Building the Local Food Economy, Louisville, Kentucky Page 17 Market Ventures, Inc./Karp Resources 7/17/2008
Section 2: Introduction
In September 2007, the Economic Development Department of Louisville Metro Government, in conjunction with local collaborators, retained the consultant team of Market Ventures, Inc. and Karp Resources to study the potential for increasing sales of locally grown and produced foods in the city. The premise of the study is that Louisville, as the state’s largest population center, has the potential to increase substantially the amount of food it buys from Kentucky farmers. By increasing the consumption and utilization of locally grown or produced foods, Louisville can support the region’s farmers while encouraging residents to consume fresh, wholesome farm products.
Over the course of the study period, the Market Ventures, Inc./Karp Resources team (“MVI/KR”) studied the city’s existing food economy, the present state of Kentucky agriculture, and current initiatives at the local and state level. Through its research and analysis, the consultant team sought to identify the highest potential opportunities for increasing sales of locally grown and produced foods through the city’s various food sectors, including retail, restaurant, wholesale, food processing and manufacturing, institutional food service, and emergency feeding. The team then developed strategies that address the myriad ways that food intersects with the local economy. Importantly, the strategies are meant to provide measurable outcomes that increase Kentucky farmer income generated in the Louisville Metro food market. Finally, the team developed recommendations for making targeted investments, altering public policies or private practices, and undertaking new initiatives that will link or stimulate local supply and demand, as well as address needed infrastructure to support food sales from local farmers.
From the outset, the Economic Development Department directed the consultant team to explore the development of a regional farmers’ market/multi-vendor fresh food “public market” that features foods grown and raised in the region, at a highly visible downtown Louisville site. This agricultural facility might include food processing facilities for farmers and local food businesses. The market facility would join other downtown institutions that attract customers from throughout the region as well as downtown residents, the daytime working population, and tourist and convention trade from throughout the country and beyond. The feasibility of a public market is one of the strategies that MVI/KR explored.
The proposed strategies are not intended to address all the challenges or opportunities facing Kentucky farmers. Rather, the study has focused on the opportunities presented for increased sales within Louisville only, although some of the strategies might be helpful to developing exports of Kentucky farm products or promoting Kentucky grown foods to a larger audience.
Goals
The primary goal of the study has been to identify strategies that will most effectively increase Kentucky farmer income through new or expanded sales to Louisville consumers, businesses and institutions. The team has been concerned not only with absolute increases in farm income (which could flow disproportionally to a small number of large farmers) but also with how the strategies might impact farm income for the region’s many more smaller family
Final Report: Building the Local Food Economy, Louisville, Kentucky Page 18 Market Ventures, Inc./Karp Resources 7/17/2008
farms, particularly those in the counties surrounding the city. In addition, the team has considered strategies that have additional benefits besides farm income, such as the community revitalization effects of farmers’ markets or the impact that a downtown public market might have on attracting tourists. The range of impacts or benefits is discussed for each proposed strategy, below.
In developing the strategies, the MVI/KR team sought to identify opportunities for private investment and initiatives under the belief that public investments or interventions should only occur when private actions are insufficient or absent. Secondly, the team has worked whenever possible through existing structures and networks, seeking to take advantage of readily available assets while minimizing the risks associated with creating new distribution or production systems. The team also sought to create self-sustaining strategies. While public funds might be available for targeted investments, no ongoing subsidies are expected.
The identified strategies have been designed so they do not subtract from existing farmers’ markets and other local food initiatives, or simply substitute one market for another. Rather, the goal of the project has been to identify and address untapped opportunities and help grow demand for local foods. This includes marketing strategies that build demand over time, timed to coincide with the expansion of farmer production and marketing capabilities.
Local Food Economy Work Group
To undertake this project, Louisville Metro Government, under the leadership of Mayor Jerry Abramson, teamed with local governments from neighboring Henry, Oldham, Shelby, Spencer, and Trimble counties and the cities of Shelbyville, as well as Wendell Berry, representatives from Brown-Forman Corporation, and the developers of Museum Plaza. A list of Local Food Economy Work Group participants is found in Appendix A.
Funding for the project was provided by the Kentucky Agricultural Development Board and local matches.1
Study team
The project team was led by Ted Spitzer, President of Market Ventures, Inc. of Portland, Maine, in partnership with Karen Karp of Karp Resources, Southold, New York. Shayna Cohen and Brian Schundler of Karp Resources were key team members.
Throughout the project, the team worked closely with Susan Hamilton of the Economic Development Department and met several times with department’s director, Bruce Traughber. Ms. Hamilton arranged many of the interviews and meetings with key informants in both the public and private sectors.
1 The Agricultural Development Board operates through the Governor’s Office of Agricultural Policy and oversees the Agricultural Development Fund. The board distributes 50% of the state monies received from the tobacco Master Settlement Agreement. In 2007, the board distributed $23.3 million to projects and organizations throughout the state with the goal of increasing net farm income and creating sustainable new farm-based business enterprises. The Ag Development Board has been a primary source of innovation and a unique resource for farm advocates in Kentucky. http://agpolicy.ky.gov/board/documents/08%20Annual%20Report.pdf .

Final Report: Building the Local Food Economy, Louisville, Kentucky Page 19 Market Ventures, Inc./Karp Resources 7/17/2008
In addition to providing their insights, Cooperative Extension agents helped to organize and host the farmer focus groups. The project team is grateful for their assistance.
Research questions
In order to target its work, the MVI/KR team developed the following research questions:
1. What are the ways currently that food enters the Louisville economy, what is the magnitude of demand, and how much is locally grown?
2. What is the current status of agriculture in Kentucky, particularly the region around Louisville?
3. What are the marketing channels for Kentucky farmers in Louisville?
4. Which of these marketing channels offer the best opportunities for increasing sales (in the short, medium and long term)?
5. What policies, programs or facilities are needed to encourage or facilitate these new sales?
6. How can changes to farm income that result from these policies, programs or facilities be measured?
The first two questions are meant to provide a snapshot of conditions as they exist in 2007-2008, utilizing the most recent data available. As will be discussed in the methodology section below, there is limited data available to answer questions about the amount of locally grown food being sold in Louisville at present so the consultant team has provided its own estimates. The third question focuses on an analysis of the various ways that Kentucky farmers might be able to access the Louisville food economy. The fourth and fifth questions address specific strategies that might lead to increased farm income from sales in Louisville. The final question addresses how to measure any changes in farm income that result from new sales in Louisville.
Work plan and methods
The original work plan included the following principal tasks:
1. Background, public goals, and existing infrastructure, including review of previous research and reports and key informant interviews
2. Competitive analysis and review of existing infrastructure
3. Demand analysis of both the retail and wholesale sectors, focusing on demand for a downtown public market and demand for local foods from wholesale buyers
4. Supply analysis utilizing both secondary data sources and primary research with regional farmers
5. Concept development
6. Financial analysis
7. Management and development
Final Report: Building the Local Food Economy, Louisville, Kentucky Page 20 Market Ventures, Inc./Karp Resources 7/17/2008
8. Report and presentations with findings and recommendations
Following the research phase, MVI/KR team and the Economic Development Department agreed to determine the business opportunities for many of the identified strategies rather than focus on detailed business planning for a downtown agricultural facility only. Detailed concept development and financial analysis for a public market require a particular site and it was decided that, at this stage, no particular site should be singled out. Therefore, the consultant team’s resources went to analyzing 13 different strategies for increasing sales of locally grown food in Louisville and then focusing on the top seven strategies which the team recommends for implementation.
Primary research included key informant interviews with 65 city and state officials, retailers, restaurateurs, wholesalers, school food representatives, manufacturers, and farmers. A list of those interviewed is found in Appendix B. The MVI/KR team toured retail stores in Louisville, observed the operation of several of the city’s farmers’ markets, and visited food distributors and processors. The team also participated in several local conferences, including the Healthy Food, Local Farms Conference held at Bellarmine University in September 2007, the Women in Agriculture Conference held in Lexington in December 2007, and the Horticultural Society Conference held in Lexington in January 2008.
Farmer focus groups In designing the work plan, the MVI/KR team relied on its experience to anticipate that the
success of this project would depend in large part on the buy-in and enthusiasm of the region’s farmers, which in turn depends on their understanding of how the proposed strategies might help their businesses. Information must flow both ways: the study process should not be designed to simply extract information from farmers but must be part of a dialogue through which farmers can determine how they might participate in any of the proposed strategies. The team designed a focus group format that would allow face-to-face conversations while efficiently reaching a large number of farmers and stimulating discussions about the various strategies. This approach fostered an environment of open dialogue and information sharing about the proposed marketing strategies.
The team conducted nine focus groups that included 90 farmers representing 13 different counties. The meetings were held in the Kentucky counties that ring Louisville, including Hardin, Henry, Jefferson, Mercer, Oldham, Shelby, Spencer, Trimble, and Washington counties. Working with Cooperative Extension agents in each of the counties, the team invited a diverse range of farmers based on: size of farming operation, product type (fruit and vegetable, meat, poultry, dairy, valued added, winery), and years farming. The meetings took place at Cooperative Extension offices. While focus groups are a qualitative research method and the participants were somewhat self-selected, the team sought to achieve representativeness through both the diversity and large number of participants.
During the focus group meetings, the MVI/KR team requested that each farmer complete a brief written questionnaire that provided contact information, years farming, principal crops, marketing outlets, and gross sales. The results of the questionnaire were then put into a computerized database and analyzed with SPSS statistical software. Key measures of diversity included:

Final Report: Building the Local Food Economy, Louisville, Kentucky Page 21 Market Ventures, Inc./Karp Resources 7/17/2008
• Years farming: Focus group participants ranged from those who were just getting started to those with more than 50 years of farming experience. Overall, the groups were evenly balanced between “new” farmers (10 years or less experience), “experienced” farmers (11-30 years of experience), and “long time” farmers (more than 30 years of experience).
• Size of farms: Farms ranged from zero acres in production in 2007 (new farmers planning their first year of operation in 2008) to 1,750, with an average of 140 acres. Half of the participating farmers produced on 50 acres or fewer.
• Products: The largest number of farmers grew fruit and vegetables, followed by meat/poultry.
• Product diversification: Most of the farmers (69% of the participants) had low levels of product diversification: they grew or raised 10 or fewer products, with 28% raising only one or two products. Only 9% could be considered highly diversified farmers, with more than 30 products.
• Marketing mix: Nearly all of the respondents (97%) reported some retail sales, with half of the respondents selling exclusively through retail channels, either on the farm (such as at farm stands) or off the farm (such as at farmers’ markets).
• Sales: Gross sales in 2007 ranged from $270 to $800,000, with an average of $106,000. The high average (compared to a statewide average of about $36,000 in 2002) is due to skewing from a larger than representative number of bigger farms.
A full description of the survey results is found in Appendix C. Appendix D includes notes from each focus group session.
The focus group discussions were centered on 13 different strategies for increasing local foods sales in Louisville. These strategies included retail, wholesale, and food production approaches and are presented in detail below. At the beginning of each meeting, the MVI/KR team presented these 13 strategies utilizing posters that included both text and images, and then asked for clarifying questions but requested that the participants wait for discussion. After questions were answered about what the strategies meant, the farmers were asked to come up to the posters and “vote” by placing one green dot on the strategy they felt would be most likely to increase their farm income, three yellow dots on three strategies that they thought held good promise, and one red dot on the least desired strategy. The focus group leader then led a discussion about the strategies, focusing initially on the ones that received the largest number of green and yellow dots. During the meeting, a member of the MVI/KR team took careful notes about points raised in the discussion. Following the focus group, the MVI/KR team members reviewed their notes and observations, and aggregated all the dots into a single database to determine which strategies had the greatest support.
Final Report: Building the Local Food Economy, Louisville, Kentucky Page 22 Market Ventures, Inc./Karp Resources 7/17/2008
Section 2: Snapshot of the Louisville Food Economy
The development of strategies for increasing sales of Kentucky food products in Louisville starts with an overview of the city’s food economy. Whenever possible, the magnitude of both the market sector and the local foods penetration is noted. This section of the report also seeks to chronicle key assets that currently exist in or around Louisville that might support the expansion of local foods in the economy.
Retail or consumer level
Consumer demand Increasing Kentucky farm sales to Louisville residents means either substituting Kentucky
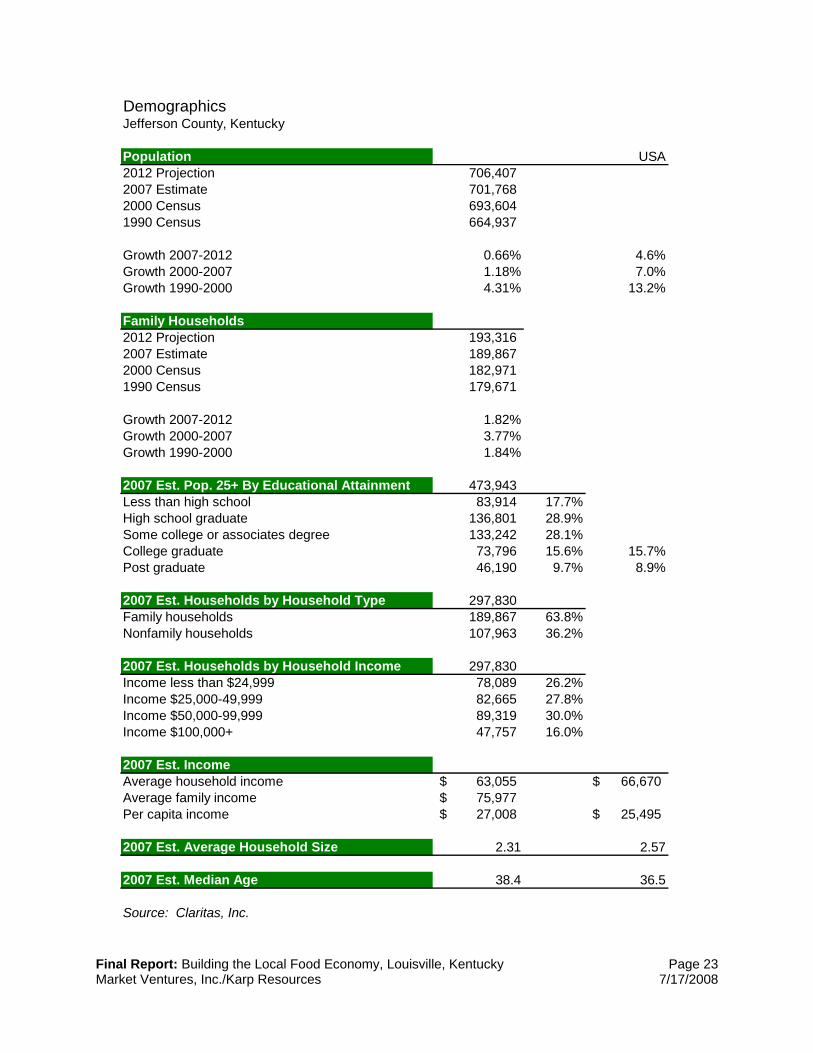
grown foods for foods that come from other places, capturing a share of expanding demand based on population growth, or increasing expenditures on food compared to other consumer goods. In order to understand the overall potential for food sales to Louisville residents, the team compiled key demographic information about Jefferson County (which since the merger of the city and county governments in 2003 has shared the same geography as Louisville). These data include population, household composition, income, age, educational attainment, and other factors that influence buying behavior. Some of these data were purchased from Claritas, a national market research firm that aggregates census and other data sets.
Final Report: Building the Local Food Economy, Louisville, Kentucky Page 23 Market Ventures, Inc./Karp Resources 7/17/2008
DemographicsJefferson County, Kentucky
Population USA2012 Projection 706,407 2007 Estimate 701,768 2000 Census 693,604 1990 Census 664,937
Growth 2007-2012 0.66% 4.6%Growth 2000-2007 1.18% 7.0%Growth 1990-2000 4.31% 13.2%
Family Households2012 Projection 193,316 2007 Estimate 189,867 2000 Census 182,971 1990 Census 179,671
Growth 2007-2012 1.82%Growth 2000-2007 3.77%Growth 1990-2000 1.84%
2007 Est. Pop. 25+ By Educational Attainment 473,943 Less than high school 83,914 17.7%High school graduate 136,801 28.9%Some college or associates degree 133,242 28.1%College graduate 73,796 15.6% 15.7%Post graduate 46,190 9.7% 8.9%
2007 Est. Households by Household Type 297,830 Family households 189,867 63.8%Nonfamily households 107,963 36.2%
2007 Est. Households by Household Income 297,830 Income less than $24,999 78,089 26.2%Income $25,000-49,999 82,665 27.8%Income $50,000-99,999 89,319 30.0%Income $100,000+ 47,757 16.0%
2007 Est. IncomeAverage household income 63,055$ 66,670$ Average family income 75,977$ Per capita income 27,008$ 25,495$
2007 Est. Average Household Size 2.31 2.57
2007 Est. Median Age 38.4 36.5
Source: Claritas, Inc.
Final Report: Building the Local Food Economy, Louisville, Kentucky Page 24 Market Ventures, Inc./Karp Resources 7/17/2008
With approximately 700,000 residents, Jefferson County is the most populated county in Kentucky. As of the 2000 Census, Jefferson County was the 73rd largest county in the United States, out of a total of 3,141 counties.2
Some of the proposed strategies, such as a large downtown public market or expanded utilization of local foods in restaurants, can be expected to attract consumers from the entire metropolitan area. The metropolitan area is defined by the U.S. Census Bureau as the Louisville-Jefferson County, KY-IN Metropolitan Statistical Area (MSA) and includes the Kentucky counties of Jefferson, Bullitt, Henry, Meade, Nelson, Oldham, Shelby, Spencer and Trimble, plus the southern Indiana counties of Clark, Floyd, Harrison and Washington. The MSA has an estimated 2007 population of 1,233,735, making it the 42nd largest MSA in the country.3
While Jefferson County has grown during each interval noted since 1990, its rate of growth is lower than the national average and lower than the Kentucky average (the population of Kentucky grew nearly 5% between 2000 and 2007, and grew nearly 10% between 1990 and 20004). Between 2007 and 2012, the expected population growth rate in Louisville is only 0.66%, compared to a national average of 4.6%. This suggests that demand for food from Louisville Metro residents will not grow substantially because of population increase. Family households, however, have grown faster than the rate of population growth. Families typically buy more groceries than people in unrelated households.
Within Louisville, there are pockets of growth, as well. In particular, the downtown area, particularly on the east side, is experiencing new housing development.
Average household income in Jefferson County at $63,055 trails the national average of $66,670. This is important because higher income households generally spend more for high quality food, particularly “specialty” or organic items. The area has slightly higher educational attainment than the national average, though, which is a positive correlate to higher spending for quality food.
Based on the demographic profile of Louisville residents and typical expenditure patterns as determined by the Bureau of Labor Statistics’ Consumer Expenditure Survey, Claritas estimates the retail sales potential for consumer goods. The chart below shows estimates for overall annual food and beverage expenditures for food at home as well as sub-estimates for the types of products that can be grown locally or manufactured by small producers (such as baked goods, fresh produce, prepared foods, and specialty food items). The total demand for food at home by Louisville residents, according to this estimate, is $1.60 billion in 2007, and is expected to grow to $1.79 billion by 2012. The demand for fresh produce is $137 million and is expected to grow to $157 million by 2012, while the demand for meat is $234 million and expected to grow to $256 million by 2012.
In addition to food purchased for consumption at home, Claritas estimates the current demand for food away from home at $1.39 billion, growing to $1.69 billion in 2012. Combining the two, there is approximately $3 billion in annual demand for food by Louisville residents.
2 http://www.census.gov/population/cen2000/phc-t4/tab02.pdf 3 http://www.census.gov/population/www/estimates/CBSA-est2007-annual.html 4 http://factfinder.census.gov/

Final Report: Building the Local Food Economy, Louisville, Kentucky Page 25 Market Ventures, Inc./Karp Resources 7/17/2008
This $3 billion can be viewed as the “global opportunity” for food sales in Louisville. Kentucky farmers will be competing to capture some share of these sales.
Consumer Expenditures: Food & BeverageClaritas: Jefferson County, Kentucky
Yr 2007 Estimate Yr 2012 Projection(million) (million) Change
Total Food at Home $1,603.17 $1,788.33 11.5%
Market categoriesBaked goods $156.70 $164.59 5.0%Dairy $163.31 $186.26 14.0%Meat $234.31 $255.75 9.2%Poultry $100.81 $107.02 6.2%Prepared foods $115.66 $135.71 17.3%Produce - fresh $136.59 $156.76 14.8%Seafood $33.98 $44.28 30.3%Specialty food $90.78 $97.92 7.9%Sweets $60.85 $71.44 17.4%Beverages - nonalcoholic $166.04 $185.27 11.6%Wine $47.27 $53.15 12.4%Total $1,306.30 $1,458.14 11.6%
Supermarkets and food stores Consumers purchase most of their food for at-home consumption at supermarkets. The
analysis of food purchased at the retail level therefore begins with supermarkets, including industry-wide trends and a description of Louisville’s supermarket sector.
Significant changes have altered the retail food sector nationally over the past 20 years, commencing with the first Wal-Mart supercenter in 1988, which offered fresh and grocery food items in addition to its large selection of discounted department store merchandise. Along with the growth of warehouse clubs such as Costco and Sam’s Club, these nontraditional food stores have grown from controlling 13.8% of the national share of food purchases for at-home consumption in 1986 to a staggering 32.6% in 2006.5 In less than 20 years, Wal-Mart became the country’s largest seller of food for at-home use. Wal-Mart and Kroger (the nation’s second biggest chain) dominate Louisville’s supermarket sector, with 12 Wal-Marts and 10 Krogers in Louisville proper. Furthermore, one of Kroger’s regional warehouses is based in Louisville and serves five surrounding states.
5 Martinez, Steve and Phil Kaufman, “Twenty Years of Competition Reshape the U.S. Food Marketing System,” Economic Research Service, USDA, April 2008.
Final Report: Building the Local Food Economy, Louisville, Kentucky Page 26 Market Ventures, Inc./Karp Resources 7/17/2008
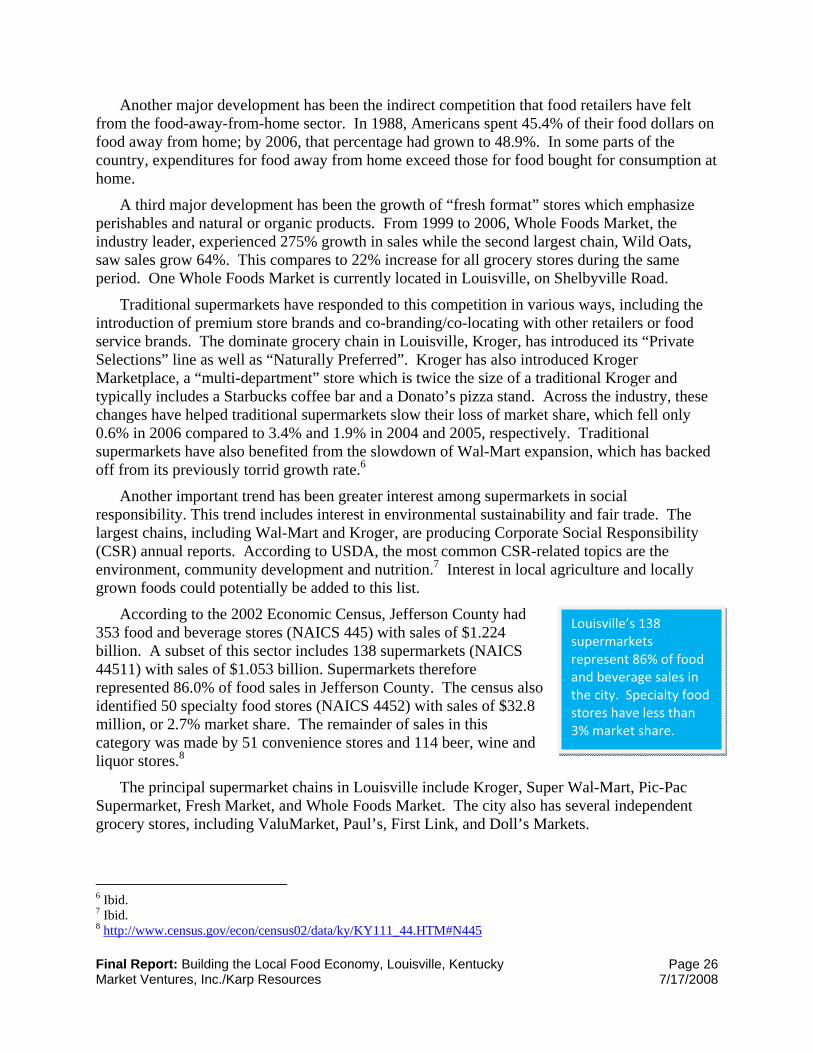
Louisville’s 138 supermarkets represent 86% of food and beverage sales in the city. Specialty food stores have less than 3% market share.
Another major development has been the indirect competition that food retailers have felt from the food-away-from-home sector. In 1988, Americans spent 45.4% of their food dollars on food away from home; by 2006, that percentage had grown to 48.9%. In some parts of the country, expenditures for food away from home exceed those for food bought for consumption at home.
A third major development has been the growth of “fresh format” stores which emphasize perishables and natural or organic products. From 1999 to 2006, Whole Foods Market, the industry leader, experienced 275% growth in sales while the second largest chain, Wild Oats, saw sales grow 64%. This compares to 22% increase for all grocery stores during the same period. One Whole Foods Market is currently located in Louisville, on Shelbyville Road.
Traditional supermarkets have responded to this competition in various ways, including the introduction of premium store brands and co-branding/co-locating with other retailers or food service brands. The dominate grocery chain in Louisville, Kroger, has introduced its “Private Selections” line as well as “Naturally Preferred”. Kroger has also introduced Kroger Marketplace, a “multi-department” store which is twice the size of a traditional Kroger and typically includes a Starbucks coffee bar and a Donato’s pizza stand. Across the industry, these changes have helped traditional supermarkets slow their loss of market share, which fell only 0.6% in 2006 compared to 3.4% and 1.9% in 2004 and 2005, respectively. Traditional supermarkets have also benefited from the slowdown of Wal-Mart expansion, which has backed off from its previously torrid growth rate.6
Another important trend has been greater interest among supermarkets in social responsibility. This trend includes interest in environmental sustainability and fair trade. The largest chains, including Wal-Mart and Kroger, are producing Corporate Social Responsibility (CSR) annual reports. According to USDA, the most common CSR-related topics are the environment, community development and nutrition.7 Interest in local agriculture and locally grown foods could potentially be added to this list.
According to the 2002 Economic Census, Jefferson County had 353 food and beverage stores (NAICS 445) with sales of $1.224 billion. A subset of this sector includes 138 supermarkets (NAICS 44511) with sales of $1.053 billion. Supermarkets therefore represented 86.0% of food sales in Jefferson County. The census also identified 50 specialty food stores (NAICS 4452) with sales of $32.8 million, or 2.7% market share. The remainder of sales in this category was made by 51 convenience stores and 114 beer, wine and liquor stores.8
The principal supermarket chains in Louisville include Kroger, Super Wal-Mart, Pic-Pac Supermarket, Fresh Market, and Whole Foods Market. The city also has several independent grocery stores, including ValuMarket, Paul’s, First Link, and Doll’s Markets.
6 Ibid. 7 Ibid. 8 http://www.census.gov/econ/census02/data/ky/KY111_44.HTM#N445
Final Report: Building the Local Food Economy, Louisville, Kentucky Page 27 Market Ventures, Inc./Karp Resources 7/17/2008
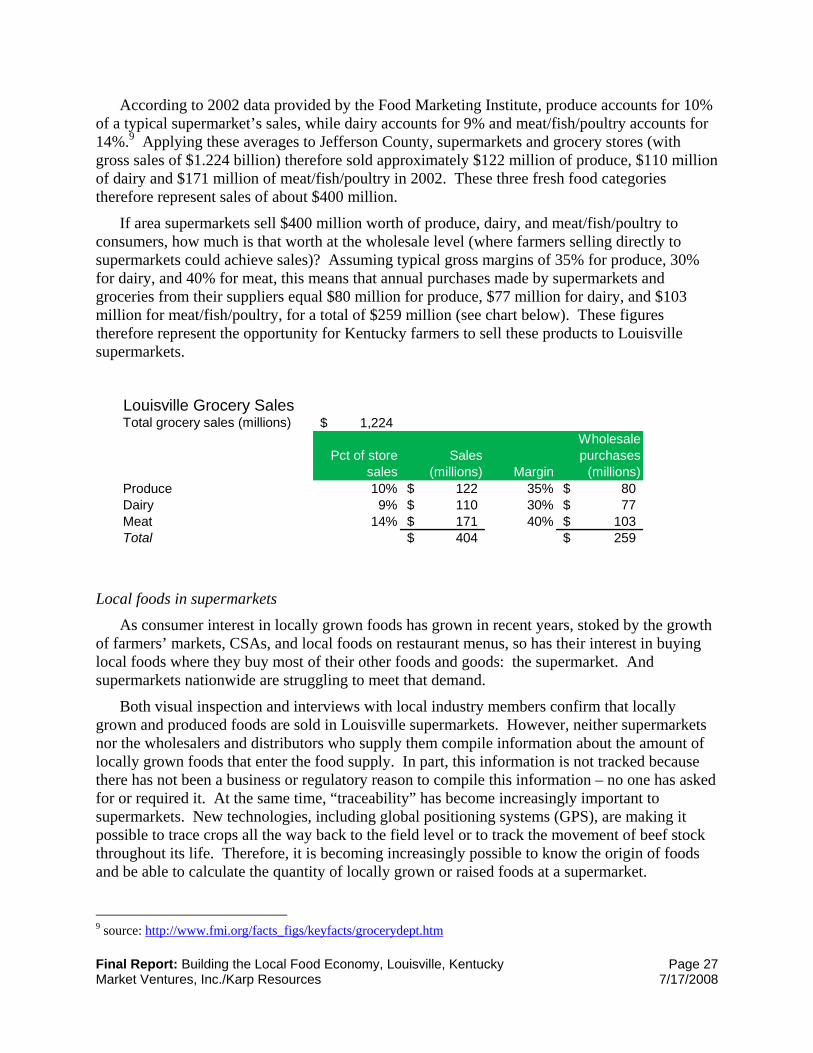
According to 2002 data provided by the Food Marketing Institute, produce accounts for 10% of a typical supermarket’s sales, while dairy accounts for 9% and meat/fish/poultry accounts for 14%.9 Applying these averages to Jefferson County, supermarkets and grocery stores (with gross sales of $1.224 billion) therefore sold approximately $122 million of produce, $110 million of dairy and $171 million of meat/fish/poultry in 2002. These three fresh food categories therefore represent sales of about $400 million.
If area supermarkets sell $400 million worth of produce, dairy, and meat/fish/poultry to consumers, how much is that worth at the wholesale level (where farmers selling directly to supermarkets could achieve sales)? Assuming typical gross margins of 35% for produce, 30% for dairy, and 40% for meat, this means that annual purchases made by supermarkets and groceries from their suppliers equal $80 million for produce, $77 million for dairy, and $103 million for meat/fish/poultry, for a total of $259 million (see chart below). These figures therefore represent the opportunity for Kentucky farmers to sell these products to Louisville supermarkets.
Louisville Grocery SalesTotal grocery sales (millions) 1,224$
Pct of store sales
Sales (millions) Margin
Wholesale purchases
(millions)Produce 10% 122$ 35% 80$ Dairy 9% 110$ 30% 77$ Meat 14% 171$ 40% 103$ Total 404$ 259$
Local foods in supermarkets
As consumer interest in locally grown foods has grown in recent years, stoked by the growth of farmers’ markets, CSAs, and local foods on restaurant menus, so has their interest in buying local foods where they buy most of their other foods and goods: the supermarket. And supermarkets nationwide are struggling to meet that demand.
Both visual inspection and interviews with local industry members confirm that locally grown and produced foods are sold in Louisville supermarkets. However, neither supermarkets nor the wholesalers and distributors who supply them compile information about the amount of locally grown foods that enter the food supply. In part, this information is not tracked because there has not been a business or regulatory reason to compile this information – no one has asked for or required it. At the same time, “traceability” has become increasingly important to supermarkets. New technologies, including global positioning systems (GPS), are making it possible to trace crops all the way back to the field level or to track the movement of beef stock throughout its life. Therefore, it is becoming increasingly possible to know the origin of foods and be able to calculate the quantity of locally grown or raised foods at a supermarket.
9 source: http://www.fmi.org/facts_figs/keyfacts/grocerydept.htm
Final Report: Building the Local Food Economy, Louisville, Kentucky Page 28 Market Ventures, Inc./Karp Resources 7/17/2008
To date, supermarkets have resisted tracking and labeling the origin of foods because the industry’s dominant business model depends on sourcing foods from anywhere in the world that can provide a consistent, low cost supply. At some point in the year, foods grown in and around Kentucky meet the supermarkets’ needs and, according to wholesale suppliers in Louisville, they purchase a large quantity of locally grown produce. Beef raised in Kentucky enters the national feedlot system and some of it might return but it is not being traced. In general, only the largest farmers in Kentucky are able to meet the quantity demands and specifications of supermarket buyers.
The supermarket industry does not have a common definition of what “local” means. Some wholesalers take a broad view: if it can be trucked in one day, then it is local. This approximately 500 mile radius is generally larger than what advocates of locally grown foods consider reasonable.
High transportation costs have begun to force supermarkets and distributors to consider looking at local sources of foods. According to an industry trade journal, “The dramatic escalation in truck rates in 2008 is forcing produce marketers to rethink timeworn truths about movement of fruits and vegetables, triggering acreage adjustments and greater efficiencies for suppliers and a search for nearby production for buyers [italics added].”10
State governments have entered the local branding arena with “buy local” programs, but these generally follow state political boundaries. In the case of Louisville, southern Indiana counties are much closer (and therefore geographically “more local”) than Kentucky counties at the eastern or southwestern end of the state.
KDA has made a significant investment in its Kentucky Proud brand. It recently hired Allied Marketing, under the leadership of Rick Raque, to lead the effort. One aspect of Allied’s work has been to work with the largest supermarket chains, Wal-Mart and Kroger, to increase the amount of products labeled Kentucky Proud in their stores. This effort is described in greater detail below.
Some of the farmers interviewed talked about negative experiences selling to supermarkets. Several recounted tales of having been “burned” by supermarkets in the past. One grower negotiated with a local supermarket in advance of the harvest season to sell 300 bushels per week of green beans at a fixed cost. The farmer planted his crops accordingly, but for the duration of the season, orders fell far short of what he had expected. Furthermore, he noted that rather than going directly to the store down the street from his house, the product was “hauled all around the world” before it was displayed in his neighborhood store, with his name on it. In addition to the financial losses, he was embarrassed to see his product handled poorly and looking shoddy in his own community.
This speaks to a common challenge in working with supermarkets. As the industry has consolidated, so has its warehousing and distribution. Chains utilize central warehouses for distribution to multiple stores and very few stores have the ability to source independently and from their own area. At the Produce Buyer meeting at the Kentucky Fruit and Vegetable Conference, several buyers described a common problem: their national distributors will not
10 http://www.thepacker.com/icms/_dtaa2/content/wrapper.asp?alink=2008-144754-797.asp&stype=topstory&fb=rt1&eblastid=0602e
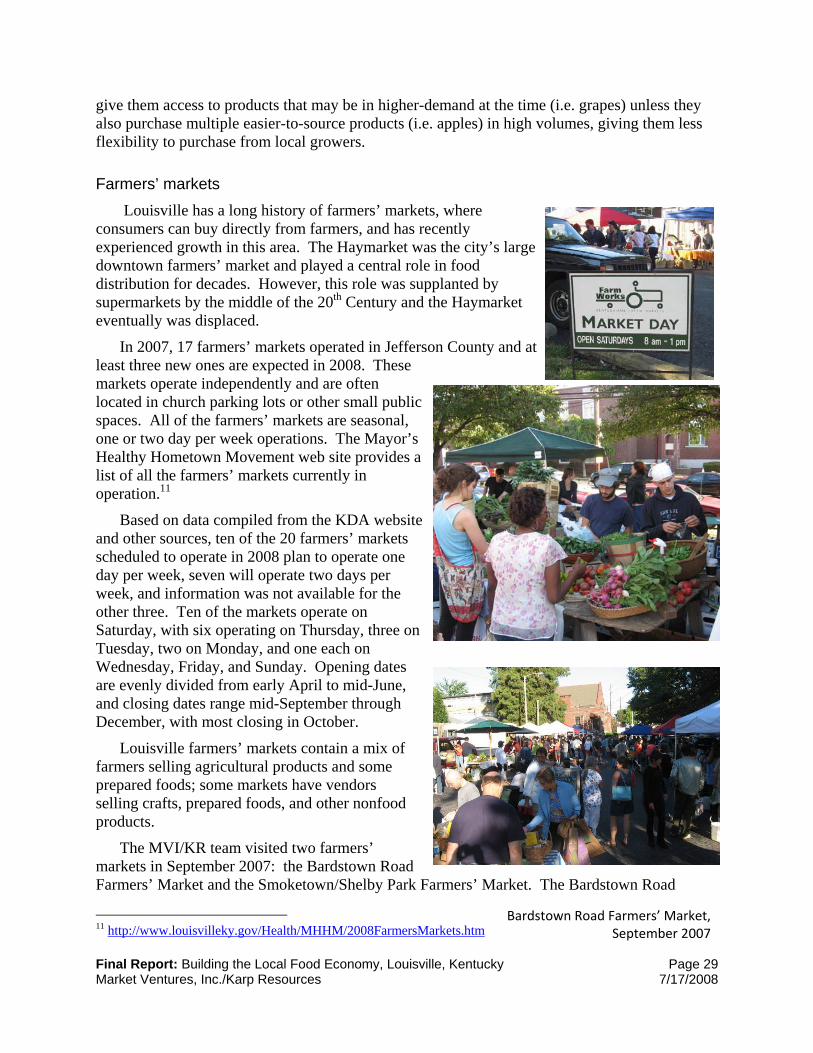
Final Report: Building the Local Food Economy, Louisville, Kentucky Page 29 Market Ventures, Inc./Karp Resources 7/17/2008
give them access to products that may be in higher-demand at the time (i.e. grapes) unless they also purchase multiple easier-to-source products (i.e. apples) in high volumes, giving them less flexibility to purchase from local growers.
Farmers’ markets Louisville has a long history of farmers’ markets, where
consumers can buy directly from farmers, and has recently experienced growth in this area. The Haymarket was the city’s large downtown farmers’ market and played a central role in food distribution for decades. However, this role was supplanted by supermarkets by the middle of the 20th Century and the Haymarket eventually was displaced.
In 2007, 17 farmers’ markets operated in Jefferson County and at least three new ones are expected in 2008. These markets operate independently and are often located in church parking lots or other small public spaces. All of the farmers’ markets are seasonal, one or two day per week operations. The Mayor’s Healthy Hometown Movement web site provides a list of all the farmers’ markets currently in operation.11
Based on data compiled from the KDA website and other sources, ten of the 20 farmers’ markets scheduled to operate in 2008 plan to operate one day per week, seven will operate two days per week, and information was not available for the other three. Ten of the markets operate on Saturday, with six operating on Thursday, three on Tuesday, two on Monday, and one each on Wednesday, Friday, and Sunday. Opening dates are evenly divided from early April to mid-June, and closing dates range mid-September through December, with most closing in October.
Louisville farmers’ markets contain a mix of farmers selling agricultural products and some prepared foods; some markets have vendors selling crafts, prepared foods, and other nonfood products.
The MVI/KR team visited two farmers’ markets in September 2007: the Bardstown Road Farmers’ Market and the Smoketown/Shelby Park Farmers’ Market. The Bardstown Road
11 http://www.louisvilleky.gov/Health/MHHM/2008FarmersMarkets.htm
Bardstown Road Farmers’ Market, September 2007
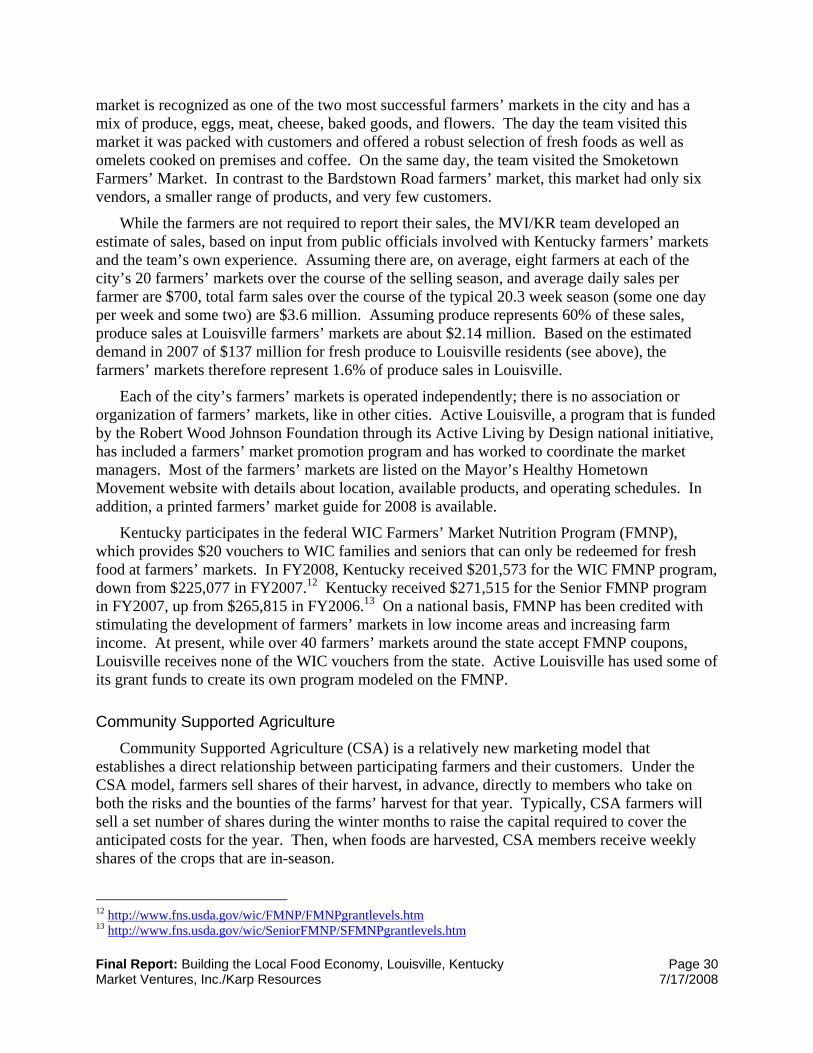
Final Report: Building the Local Food Economy, Louisville, Kentucky Page 30 Market Ventures, Inc./Karp Resources 7/17/2008
market is recognized as one of the two most successful farmers’ markets in the city and has a mix of produce, eggs, meat, cheese, baked goods, and flowers. The day the team visited this market it was packed with customers and offered a robust selection of fresh foods as well as omelets cooked on premises and coffee. On the same day, the team visited the Smoketown Farmers’ Market. In contrast to the Bardstown Road farmers’ market, this market had only six vendors, a smaller range of products, and very few customers.
While the farmers are not required to report their sales, the MVI/KR team developed an estimate of sales, based on input from public officials involved with Kentucky farmers’ markets and the team’s own experience. Assuming there are, on average, eight farmers at each of the city’s 20 farmers’ markets over the course of the selling season, and average daily sales per farmer are $700, total farm sales over the course of the typical 20.3 week season (some one day per week and some two) are $3.6 million. Assuming produce represents 60% of these sales, produce sales at Louisville farmers’ markets are about $2.14 million. Based on the estimated demand in 2007 of $137 million for fresh produce to Louisville residents (see above), the farmers’ markets therefore represent 1.6% of produce sales in Louisville.
Each of the city’s farmers’ markets is operated independently; there is no association or organization of farmers’ markets, like in other cities. Active Louisville, a program that is funded by the Robert Wood Johnson Foundation through its Active Living by Design national initiative, has included a farmers’ market promotion program and has worked to coordinate the market managers. Most of the farmers’ markets are listed on the Mayor’s Healthy Hometown Movement website with details about location, available products, and operating schedules. In addition, a printed farmers’ market guide for 2008 is available.
Kentucky participates in the federal WIC Farmers’ Market Nutrition Program (FMNP), which provides $20 vouchers to WIC families and seniors that can only be redeemed for fresh food at farmers’ markets. In FY2008, Kentucky received $201,573 for the WIC FMNP program, down from $225,077 in FY2007.12 Kentucky received $271,515 for the Senior FMNP program in FY2007, up from $265,815 in FY2006.13 On a national basis, FMNP has been credited with stimulating the development of farmers’ markets in low income areas and increasing farm income. At present, while over 40 farmers’ markets around the state accept FMNP coupons, Louisville receives none of the WIC vouchers from the state. Active Louisville has used some of its grant funds to create its own program modeled on the FMNP.
Community Supported Agriculture Community Supported Agriculture (CSA) is a relatively new marketing model that
establishes a direct relationship between participating farmers and their customers. Under the CSA model, farmers sell shares of their harvest, in advance, directly to members who take on both the risks and the bounties of the farms’ harvest for that year. Typically, CSA farmers will sell a set number of shares during the winter months to raise the capital required to cover the anticipated costs for the year. Then, when foods are harvested, CSA members receive weekly shares of the crops that are in-season.
12 http://www.fns.usda.gov/wic/FMNP/FMNPgrantlevels.htm 13 http://www.fns.usda.gov/wic/SeniorFMNP/SFMNPgrantlevels.htm
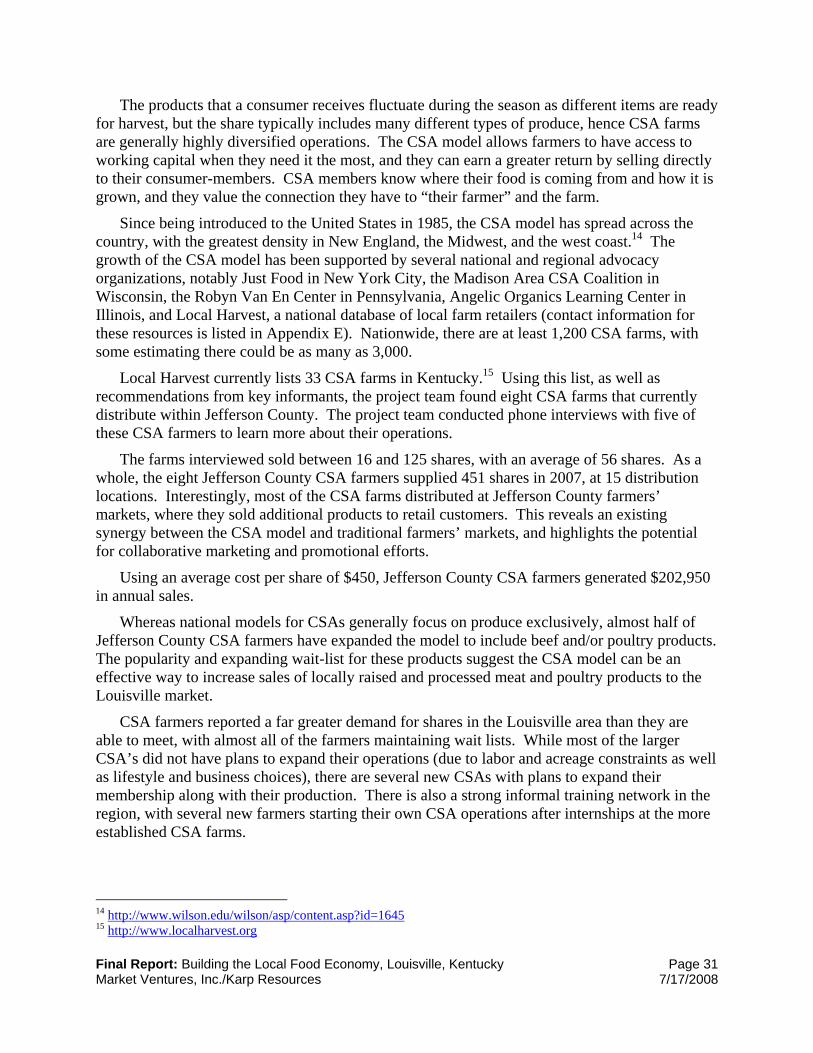
Final Report: Building the Local Food Economy, Louisville, Kentucky Page 31 Market Ventures, Inc./Karp Resources 7/17/2008
The products that a consumer receives fluctuate during the season as different items are ready for harvest, but the share typically includes many different types of produce, hence CSA farms are generally highly diversified operations. The CSA model allows farmers to have access to working capital when they need it the most, and they can earn a greater return by selling directly to their consumer-members. CSA members know where their food is coming from and how it is grown, and they value the connection they have to “their farmer” and the farm.
Since being introduced to the United States in 1985, the CSA model has spread across the country, with the greatest density in New England, the Midwest, and the west coast.14 The growth of the CSA model has been supported by several national and regional advocacy organizations, notably Just Food in New York City, the Madison Area CSA Coalition in Wisconsin, the Robyn Van En Center in Pennsylvania, Angelic Organics Learning Center in Illinois, and Local Harvest, a national database of local farm retailers (contact information for these resources is listed in Appendix E). Nationwide, there are at least 1,200 CSA farms, with some estimating there could be as many as 3,000.
Local Harvest currently lists 33 CSA farms in Kentucky.15 Using this list, as well as recommendations from key informants, the project team found eight CSA farms that currently distribute within Jefferson County. The project team conducted phone interviews with five of these CSA farmers to learn more about their operations.
The farms interviewed sold between 16 and 125 shares, with an average of 56 shares. As a whole, the eight Jefferson County CSA farmers supplied 451 shares in 2007, at 15 distribution locations. Interestingly, most of the CSA farms distributed at Jefferson County farmers’ markets, where they sold additional products to retail customers. This reveals an existing synergy between the CSA model and traditional farmers’ markets, and highlights the potential for collaborative marketing and promotional efforts.
Using an average cost per share of $450, Jefferson County CSA farmers generated $202,950 in annual sales.
Whereas national models for CSAs generally focus on produce exclusively, almost half of Jefferson County CSA farmers have expanded the model to include beef and/or poultry products. The popularity and expanding wait-list for these products suggest the CSA model can be an effective way to increase sales of locally raised and processed meat and poultry products to the Louisville market.
CSA farmers reported a far greater demand for shares in the Louisville area than they are able to meet, with almost all of the farmers maintaining wait lists. While most of the larger CSA’s did not have plans to expand their operations (due to labor and acreage constraints as well as lifestyle and business choices), there are several new CSAs with plans to expand their membership along with their production. There is also a strong informal training network in the region, with several new farmers starting their own CSA operations after internships at the more established CSA farms.
14 http://www.wilson.edu/wilson/asp/content.asp?id=1645 15 http://www.localharvest.org
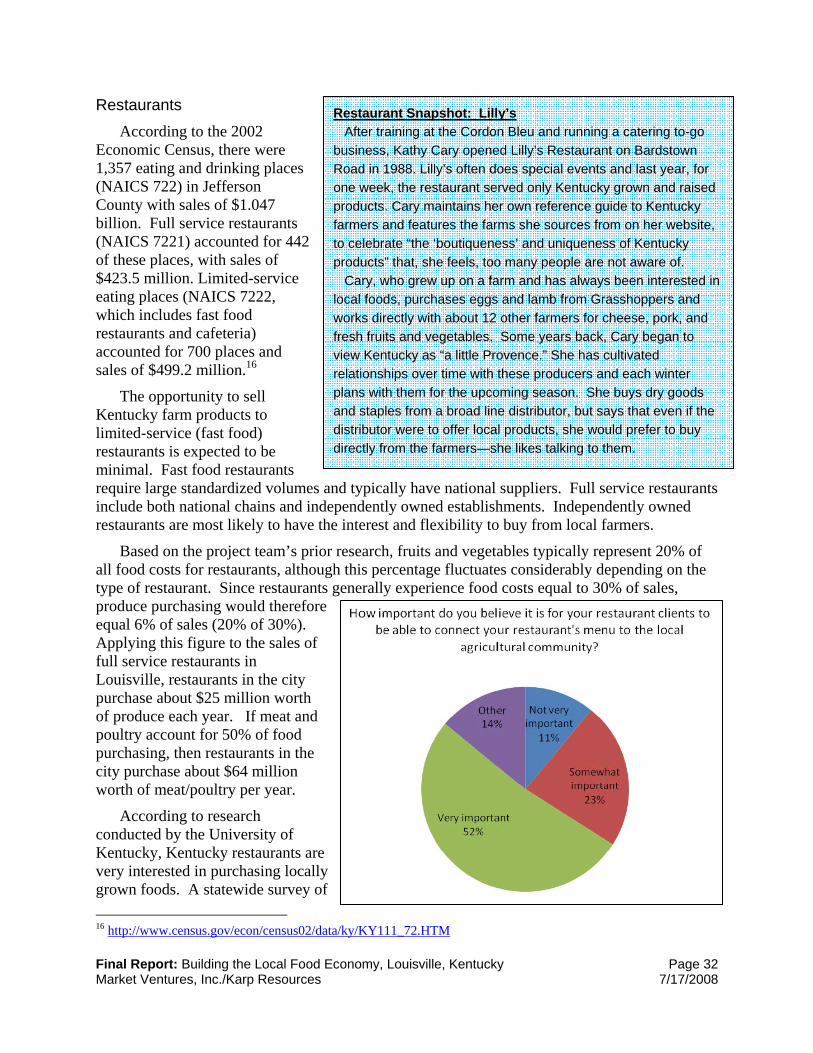
Final Report: Building the Local Food Economy, Louisville, Kentucky Page 32 Market Ventures, Inc./Karp Resources 7/17/2008
Restaurants According to the 2002
Economic Census, there were 1,357 eating and drinking places (NAICS 722) in Jefferson County with sales of $1.047 billion. Full service restaurants (NAICS 7221) accounted for 442 of these places, with sales of $423.5 million. Limited-service eating places (NAICS 7222, which includes fast food restaurants and cafeteria) accounted for 700 places and sales of $499.2 million.16
The opportunity to sell Kentucky farm products to limited-service (fast food) restaurants is expected to be minimal. Fast food restaurants require large standardized volumes and typically have national suppliers. Full service restaurants include both national chains and independently owned establishments. Independently owned restaurants are most likely to have the interest and flexibility to buy from local farmers.
Based on the project team’s prior research, fruits and vegetables typically represent 20% of all food costs for restaurants, although this percentage fluctuates considerably depending on the type of restaurant. Since restaurants generally experience food costs equal to 30% of sales, produce purchasing would therefore equal 6% of sales (20% of 30%). Applying this figure to the sales of full service restaurants in Louisville, restaurants in the city purchase about $25 million worth of produce each year. If meat and poultry account for 50% of food purchasing, then restaurants in the city purchase about $64 million worth of meat/poultry per year.
According to research conducted by the University of Kentucky, Kentucky restaurants are very interested in purchasing locally grown foods. A statewide survey of 16 http://www.census.gov/econ/census02/data/ky/KY111_72.HTM
Restaurant Snapshot: Lilly’s After training at the Cordon Bleu and running a catering to-go business, Kathy Cary opened Lilly’s Restaurant on Bardstown Road in 1988. Lilly’s often does special events and last year, for one week, the restaurant served only Kentucky grown and raised products. Cary maintains her own reference guide to Kentucky farmers and features the farms she sources from on her website, to celebrate “the ‘boutiqueness’ and uniqueness of Kentucky products” that, she feels, too many people are not aware of. Cary, who grew up on a farm and has always been interested in local foods, purchases eggs and lamb from Grasshoppers and works directly with about 12 other farmers for cheese, pork, and fresh fruits and vegetables. Some years back, Cary began to view Kentucky as “a little Provence.” She has cultivated relationships over time with these producers and each winter plans with them for the upcoming season. She buys dry goods and staples from a broad line distributor, but says that even if the distributor were to offer local products, she would prefer to buy directly from the farmers—she likes talking to them.

Final Report: Building the Local Food Economy, Louisville, Kentucky Page 33 Market Ventures, Inc./Karp Resources 7/17/2008
restaurateurs found that 85% indicated that it was somewhat or very important to their customers to connect their menu with local farmers. In terms of particular items, the restaurants are most interested in tomatoes, bell peppers, greens, and melons. Over half of the respondents (56%) said that they advertise their menus as including locally grown produce. In terms of barriers to sourcing local produce, the most frequently mentioned concerns were the consistent availability of products (52%) and consistent quality (33%). Competitive pricing was only mentioned as a barrier by 14% of the respondents.17
A number of Louisville’s most acclaimed restaurants already purchase local foods, among them Lilly’s (considered a pioneer on the Louisville local food scene), Proof on Main, Artemesia, and Park Place. One chef noted that he generally expects to pay 30% more for locally grown foods of any kind, primarily because he buys in small volumes. Several chefs and restaurants owners noted that they work directly with producers, planning in advance of the season for farmers to grow the products and quantities they will need. Additionally, Mark Williams has incorporated local food into Brown-Forman’s corporate dining and Gil Logan, the executive chef for Levy Food Service at Churchill Downs, has made local foods a prominent feature of their operation. Logan estimates that Kentucky Proud items constitute about 6% of their current food purchasing, compared to almost nothing five years ago when all purchasing had to go through a major national distributor.
Several chefs noted that farmers will periodically show up at the backdoor unexpected with product to sell—few successful sales were made or relationships built in this manner. Rather, many chefs work directly with growers to encourage them to grow new products, increase scale, pack differently, etc. Pork, bison, eggs, lamb, milk, and beef were mentioned as products that restaurants are buying currently. While chefs were also purchasing fresh produce, chicken and cheese, these were seen as harder product categories to access.
Institutions
Jefferson County Public Schools The Jefferson County Public School system (JCPS) – the largest in the state – includes over
98,000 students in 90 elementary schools, 24 middle schools, 21 high schools, and 20 other learning centers. During the school year, the JCPS Division of School and Community Nutrition Services serves approximately 58,000 lunches, 24,000 breakfasts, and 1,800 snacks every day. During the summer months, JCPS serves 10,000-12,000 meals per day. Approximately 57% of the student population is eligible for free or reduced meals. JCPS estimates that 96% of the students in the system eat one meal or another as part of the school meal program each day. In addition to serving its own schools, JCPS also prepares meals for other agencies, including several senior citizen centers and Meals on Wheels.
Since 2004, JCPS has worked in partnership with Louisville Metro Government and the University of Louisville on the Partnership for a Green City, which brings together three of the
17 Tim Woods, Matt Ernst, and Jeffrey Herrington, “2006 Kentucky Restaurant Produce Buyer Survey” University of Kentucky Department of Agricultural Economics, October, 2006. Survey returned by 64 restaurants (23% response rate).
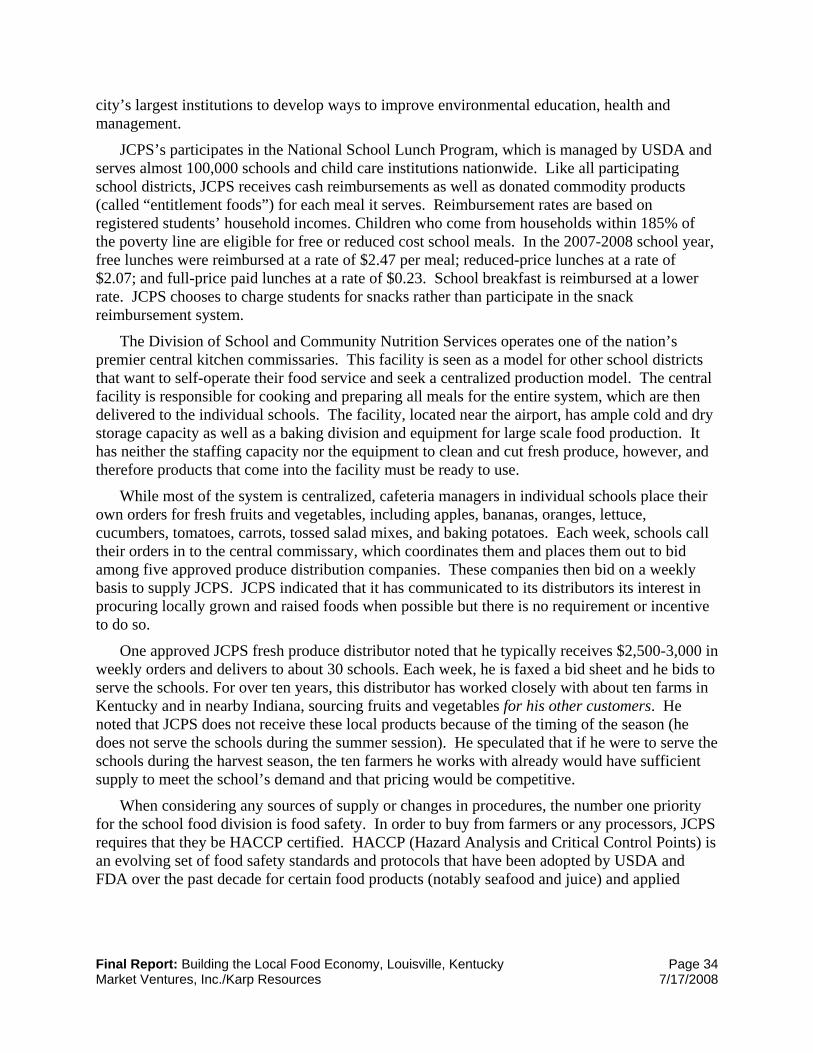
Final Report: Building the Local Food Economy, Louisville, Kentucky Page 34 Market Ventures, Inc./Karp Resources 7/17/2008
city’s largest institutions to develop ways to improve environmental education, health and management.
JCPS’s participates in the National School Lunch Program, which is managed by USDA and serves almost 100,000 schools and child care institutions nationwide. Like all participating school districts, JCPS receives cash reimbursements as well as donated commodity products (called “entitlement foods”) for each meal it serves. Reimbursement rates are based on registered students’ household incomes. Children who come from households within 185% of the poverty line are eligible for free or reduced cost school meals. In the 2007-2008 school year, free lunches were reimbursed at a rate of $2.47 per meal; reduced-price lunches at a rate of $2.07; and full-price paid lunches at a rate of $0.23. School breakfast is reimbursed at a lower rate. JCPS chooses to charge students for snacks rather than participate in the snack reimbursement system.
The Division of School and Community Nutrition Services operates one of the nation’s premier central kitchen commissaries. This facility is seen as a model for other school districts that want to self-operate their food service and seek a centralized production model. The central facility is responsible for cooking and preparing all meals for the entire system, which are then delivered to the individual schools. The facility, located near the airport, has ample cold and dry storage capacity as well as a baking division and equipment for large scale food production. It has neither the staffing capacity nor the equipment to clean and cut fresh produce, however, and therefore products that come into the facility must be ready to use.
While most of the system is centralized, cafeteria managers in individual schools place their own orders for fresh fruits and vegetables, including apples, bananas, oranges, lettuce, cucumbers, tomatoes, carrots, tossed salad mixes, and baking potatoes. Each week, schools call their orders in to the central commissary, which coordinates them and places them out to bid among five approved produce distribution companies. These companies then bid on a weekly basis to supply JCPS. JCPS indicated that it has communicated to its distributors its interest in procuring locally grown and raised foods when possible but there is no requirement or incentive to do so.
One approved JCPS fresh produce distributor noted that he typically receives $2,500-3,000 in weekly orders and delivers to about 30 schools. Each week, he is faxed a bid sheet and he bids to serve the schools. For over ten years, this distributor has worked closely with about ten farms in Kentucky and in nearby Indiana, sourcing fruits and vegetables for his other customers. He noted that JCPS does not receive these local products because of the timing of the season (he does not serve the schools during the summer session). He speculated that if he were to serve the schools during the harvest season, the ten farmers he works with already would have sufficient supply to meet the school’s demand and that pricing would be competitive.
When considering any sources of supply or changes in procedures, the number one priority for the school food division is food safety. In order to buy from farmers or any processors, JCPS requires that they be HACCP certified. HACCP (Hazard Analysis and Critical Control Points) is an evolving set of food safety standards and protocols that have been adopted by USDA and FDA over the past decade for certain food products (notably seafood and juice) and applied
Final Report: Building the Local Food Economy, Louisville, Kentucky Page 35 Market Ventures, Inc./Karp Resources 7/17/2008
throughout the food industry.18 Certification is done by commercial firms. Becoming HACCP certified can be a considerable hurdle and expense for small farms.
JCPS leaders note that “processing is key” because the commissary is not staffed for prepping fresh produce and produce is not received at the main facility, but is distributed directly to each school by distributors. Therefore, it needs to be ready to use when it arrives in the schools.
A significant share of the fresh produce used by JCPS comes from the Department of Defense (DOD) Fresh Program, through which USDA has been able to offer schools a wider variety of fresh produce than would normally be available through traditional USDA purchases.19 Each participating state receives an allocation (a portion of a $50 million national budget) for DOD Fresh products from USDA. School districts are then assigned a maximum allocation based on their student population. JCPS leaders estimate their 2007-2008 school year allotment at $250,000, and noted that it enabled them to access more “high-end” fresh products than their normal budget would allow. Some school districts also purchase fresh produce through DOD Fresh using their own resources.
The consultant team reviewed JCPS’s DOD Fresh procurement records for a sample six month period to determine how much fresh produce could potentially be grown in Kentucky (for example, bananas, pineapples, and oranges were excluded). As the chart below shows, during the six month period JCPS purchased over 440,000 lbs of fresh fruits and vegetables that are capable of being grown (and perhaps processed) in Kentucky. While these cannot be harvested fresh locally throughout the school year, some of the products can be stored for months (such as apples, carrots, and potatoes) and others can be grown indoors (including hydroponic or greenhouse lettuces).
18 http://www.cfsan.fda.gov/~comm/haccpov.html 19 DOD Fresh began in 1995as a partnership between USDA’s Food and Nutrition Service and its Agricultural Marketing Service, and the Department of Defense’s Defense Supply Center Philadelphia as a means to leverage DOD’s purchasing clout and capacity to purchase fresh produce for schools. Following favorable response from eight pilot states, the program was opened to all states. Congress allocates $50 million to the program. Schools may also purchase fresh fruits and vegetables directly from DOD using their conventional cash reimbursements from USDA (section 4 and 11 funds).
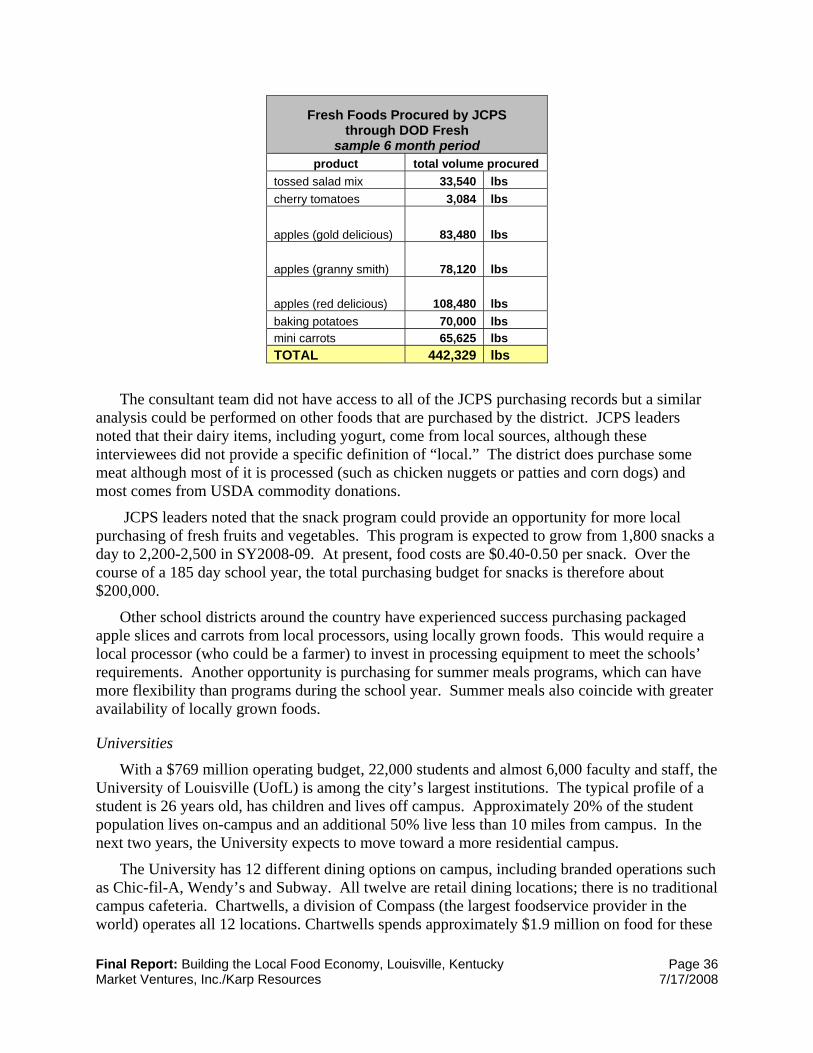
Final Report: Building the Local Food Economy, Louisville, Kentucky Page 36 Market Ventures, Inc./Karp Resources 7/17/2008
Fresh Foods Procured by JCPS through DOD Fresh
sample 6 month period product total volume procured
tossed salad mix 33,540 lbs cherry tomatoes 3,084 lbs
apples (gold delicious) 83,480 lbs
apples (granny smith) 78,120 lbs
apples (red delicious) 108,480 lbs baking potatoes 70,000 lbs mini carrots 65,625 lbs TOTAL 442,329 lbs
The consultant team did not have access to all of the JCPS purchasing records but a similar analysis could be performed on other foods that are purchased by the district. JCPS leaders noted that their dairy items, including yogurt, come from local sources, although these interviewees did not provide a specific definition of “local.” The district does purchase some meat although most of it is processed (such as chicken nuggets or patties and corn dogs) and most comes from USDA commodity donations.
JCPS leaders noted that the snack program could provide an opportunity for more local purchasing of fresh fruits and vegetables. This program is expected to grow from 1,800 snacks a day to 2,200-2,500 in SY2008-09. At present, food costs are $0.40-0.50 per snack. Over the course of a 185 day school year, the total purchasing budget for snacks is therefore about $200,000.
Other school districts around the country have experienced success purchasing packaged apple slices and carrots from local processors, using locally grown foods. This would require a local processor (who could be a farmer) to invest in processing equipment to meet the schools’ requirements. Another opportunity is purchasing for summer meals programs, which can have more flexibility than programs during the school year. Summer meals also coincide with greater availability of locally grown foods.
Universities
With a $769 million operating budget, 22,000 students and almost 6,000 faculty and staff, the University of Louisville (UofL) is among the city’s largest institutions. The typical profile of a student is 26 years old, has children and lives off campus. Approximately 20% of the student population lives on-campus and an additional 50% live less than 10 miles from campus. In the next two years, the University expects to move toward a more residential campus.
The University has 12 different dining options on campus, including branded operations such as Chic-fil-A, Wendy’s and Subway. All twelve are retail dining locations; there is no traditional campus cafeteria. Chartwells, a division of Compass (the largest foodservice provider in the world) operates all 12 locations. Chartwells spends approximately $1.9 million on food for these
Final Report: Building the Local Food Economy, Louisville, Kentucky Page 37 Market Ventures, Inc./Karp Resources 7/17/2008
venues each year. The campus also includes a University Club, which is managed independently of both the University and Chartwells.
University leaders noted that admission standards have increased in the past 5 years and, as a result, students have become more discerning. There has been a slowly increasing demand for, and ability to pay for, higher quality, gourmet, organic and local foods. In recent years, Chartwells has stopped purchasing frozen fruits and vegetables, finding that hiring staff to prep fresh foods is more efficient and results in higher quality. Interestingly, this is the opposite approach from JCPS.
The University has demonstrated a strong interest in on-campus sustainability and local food. Along with Jefferson County Public Schools and Louisville Metro Government, UofL is one of three members of the Partnership for a Green City, a collaborative effort that includes a local food initiative as one of its seven focus areas. Campus buildings are peppered with signs about recycling and sustainability initiatives.
In the 2007-2008 school year, the University amended Chartwell’s contract to state that the company must work with produce suppliers to help the University achieve its goals of using at least 10% locally grown produce. Leaders have defined local as Kentucky-grown or raised because they feel students identify with Kentucky as local and because the Kentucky Proud program is a resource that draws boundaries at state lines.
UofL administrators noted that since Chartwells started sourcing local products, key stumbling points have included the short growing season, the lack of a guarantee on yield, the need to reach out to numerous small producers, and university concerns about farmers’ accountability and food safety. Quality has been an issue at times as well. Chartwells reported a 30% waste factor on local apples ordered last year and little product consistency across orders. Still, when they labeled local apples and put them next to non-local, the local apples sold first, reflecting student preference for locally grown food.
Chartwells does much of its purchasing through the world’s largest group purchasing organization, Foodbuy. In order to meet UofL’s local food goals, Chartwells has had to work with and appeal to various levels of oversight simultaneously. As of late winter, Foodbuy was working with UofL’s primary produce distributor, the Indiana-based Piazza Produce, Inc., to source more local foods. Both KDA and Allied Marketing have met with Chartwells to offer local procurement support.
The University has featured local foods at high profile events on campus and they have seen awareness and demand increase. The local produce mandate has extended to thinking about how other local companies, rather than national chains, could provide services around campus (such as coffee in the bookstore).
Louisville is also home to other universities, suggesting additional opportunities. However, the consultant team did not research food service at these institutions.
Hospitals and Jails
Jefferson County’s eight major hospitals and two correctional facilities serve over 15,500 meals per day, including food for patients as well as cafeteria offerings for staff and visitors.

Final Report: Building the Local Food Economy, Louisville, Kentucky Page 38 Market Ventures, Inc./Karp Resources 7/17/2008
Three national food service providers, Morrison Management, Aramark and Sodexo, manage all food programming in these institutions.
Jefferson County hospitals:
Jefferson County jails: Name Meals per day
(patient and visitor) Food service provider
Jefferson County Jail 6,000 Aramark
Jefferson County Metro: Community Corrections Center
1,650 Aramark
Emergency feeding
Dare to Care
Founded in 1971, Dare to Care (http://www.daretocare.org) is a Louisville-based non-profit emergency food provider, with a food bank as well as a range of programs targeted at children, the elderly, and people with illness or disability. As part of America’s Second Harvest network, Dare to Care partners with and distributes food to over 320 non-profit agencies in a 13 county area in Kentucky and southern Indiana, including food pantries, shelters,
Name Meals per day (patient and visitor)
Food service provider
Baptist Hospital 1,000 Morrison Management
Jewish Hospital 500 Morrison Management
University of Louisville Hospital 2,100 Sodexo
Norton Audubon Hospital 1,600 Morrison Management
Norton Sound Regional Hospital Morrison Management
Kosair Children’s Hospital Morrison Management
Norton Hospital 1,700 Morrison Management
St. Mary & Elizabeth Hospital 1,000 Sodexo

Final Report: Building the Local Food Economy, Louisville, Kentucky Page 39 Market Ventures, Inc./Karp Resources 7/17/2008
child care centers, and residential facilities. In addition to its food bank, Dare to Care operates an emergency food program (distribution of foods and cash raised in community food drives) and Kids Café (which serves hot meals to children in after-school/evening programs at 14 agencies).
Dare to Care receives most of its food through USDA’s Emergency Food Assistance Program (shelf-stable products like dry milk, peanut butter, and canned meats) and food donations from area food businesses. Dare to Care receives daily truckloads of donated fruits and vegetables from the Louisville Produce Terminal and weekly truckloads from the Gordon Foodservice Distribution Center. Kroger and Sysco are also key food donors.
The organization has a 53,000 square foot facility with 80,000 cubic feet of freezer space and 51,000 cubic feet of cooler space, as well as 8 trucks, 4 of which are refrigerated. In fiscal year 2006-2007, Dare to Care shipped 9.45 million pounds of food, including 1.95 million pounds of fresh produce, and served over 83,000 meals at Kids Cafés. The organization had total income of $15.5 million dollars.
To date, Dare to Care has not purchased produce directly from farmers, as has been done by similar organizations in other cities. The organization’s leaders, however, have been lobbying the state and KDA to provide funds that would facilitate emergency food providers’ purchases of Kentucky Proud products. Due to the state’s current fiscal situation, these conversations have stalled.
Next year, Dare to Care plans to budget $800,000 for food purchases, the first time it will purchase fresh food. Their in-house procurement director will source these foods. To the extent that Kentucky farmers can price products competitively and can deliver in the necessary volumes (i.e. full truckloads), Dare to Care is interested in pursuing local growers as suppliers. Though the idea is interesting to them, due to current fuel costs, utilizing the organizations’ truck fleet to transport farm products is not currently an option, unless there is a source of funds to offset the transportation cost.
Kentucky Harvest
Founded in 1987, Kentucky Harvest (http://www.kyharvest.com) is a volunteer-run, Louisville-based food rescue organization. The group rescues approximately 2.7 million pounds of food each year in Louisville from restaurants, caterers, food manufacturers, retailers, and others. Their website lists “star donors” including Panera Bread, Tyson, Yum!, Thornton’s, and the Jefferson County Public Schools.
Kentucky Harvest is charted by USA Harvest, which has 127 chapters around the continental United States (including 4 others in Kentucky) which rescue and distribute an estimate 1.3 million pounds of food each day.
Based on the principle that helping people is about “food raising, not fund raising,” the organization has no budget and no paid staff and does not buy, store, or sell food. Kentucky Harvest organizes a network of about 500 volunteers who use their own transportation to pick-up food from donors and distribute it to 143 agencies with clients who need it. The organization
Final Report: Building the Local Food Economy, Louisville, Kentucky Page 40 Market Ventures, Inc./Karp Resources 7/17/2008
also owns two trucks which were donated (corporate supporters pay for insurance and other costs on these trucks as well).
Kentucky Harvest organizes volunteers to harvest surplus crops from several farms and gardens in the area. Stan Curtis (founder and leader of the organization) noted that this is a large area of potential growth and continued outreach to producers.
Other local foods initiatives and support assets
Food Security Task Force
Convened by the Center for Health Equity, the Community Farm Alliance and ACTIVE Louisville in 2007, the Food Security Task Force is a coalition of community members, government agencies, private sector and non-profit organizations committed to creating a just, sustainable food system in Louisville. One aspect of their work has been the Healthier Corner Store Initiative, developed through the leadership of the YMCA and Center for Health Equity. Task force steering committee includes representatives from Active Louisville, Community Farm Alliance, Louisville Metro Department of Public Health and Wellness, The Center for Health Equity, University of Louisville, YMCA, Louisville Metro Economic Development Department, Dare to Care, Slow Food Bluegrass, Pennyrile Allied Community Services, Sierra Club, Grasshoppers, LLC, Earth's Promise Farm, Women in Transition and Healthy Start.
Slow Food
Slow Food Bluegrass is the Louisville-based chapter of the international organization Slow Food, a fast growing membership association with over 80,000 members in 50 countries. Slow Food promotes a food system that is based on the principles of high quality and taste, environmental sustainability, and social justice. The Louisville chapter, or “convivium,” has about 150 members and an emailing list of 1,500. Slow Food Bluegrass is led by Mark Williams, the executive chef at Brown-Forman. The group organizes events and conferences to promote growers and producers of “good, clean and fair” food throughout the Bluegrass region and facilitates communication about local food activities.
Mayor’s Healthy Hometown Movement
The Mayor’s Healthy Hometown Movement has been a signature effort to promote healthy living in Louisville. The initiative is led by the Louisville Metro Department of Public Health and Wellness, and seeks to “create a community wide culture that encourages and supports healthy lifestyles by promoting increased physical activity, better nutrition, healthy public policy and access to needed resources.” A prominent part of this effort is the promotion of farmers’ markets, as well as encouraging Louisville Metro residents to eat five or more servings of fruits and vegetables per day.20
Sullivan University National Center for Hospitality Studies
Sullivan University, located on Bardstown Road in Louisville, offers an Associates of Science degree in culinary arts. 20 http://www.louisvilleky.gov/Health/MHHM/
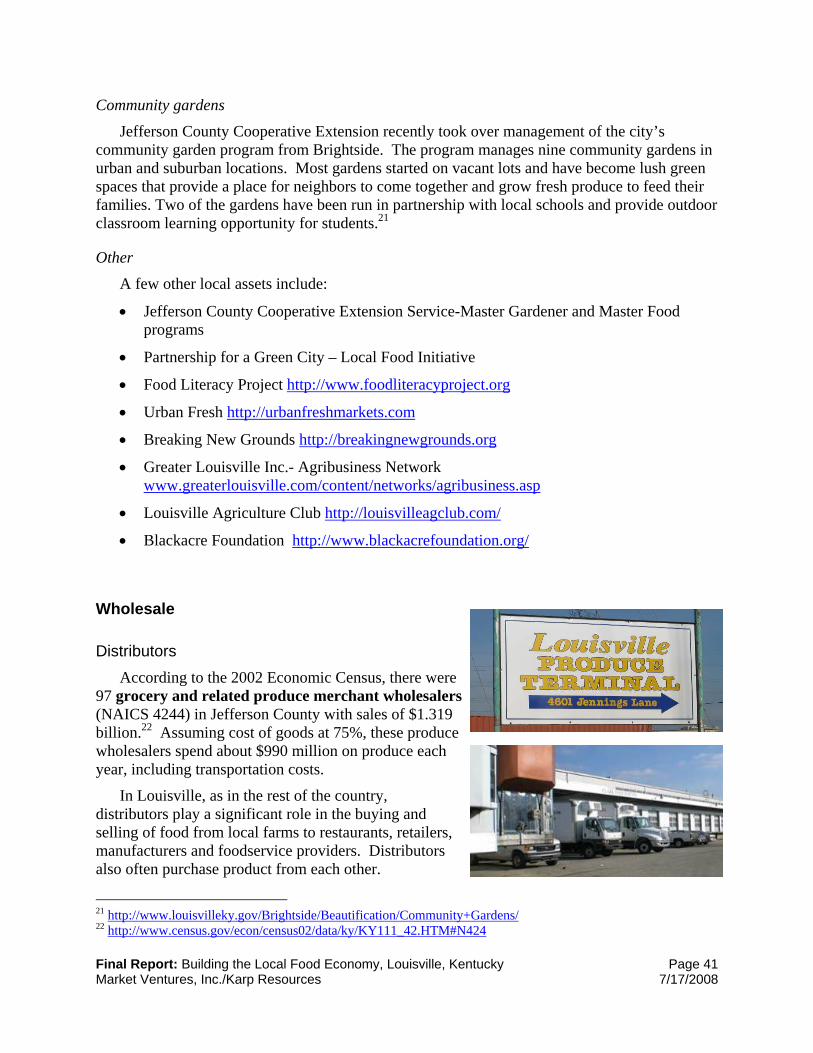
Final Report: Building the Local Food Economy, Louisville, Kentucky Page 41 Market Ventures, Inc./Karp Resources 7/17/2008
Community gardens
Jefferson County Cooperative Extension recently took over management of the city’s community garden program from Brightside. The program manages nine community gardens in urban and suburban locations. Most gardens started on vacant lots and have become lush green spaces that provide a place for neighbors to come together and grow fresh produce to feed their families. Two of the gardens have been run in partnership with local schools and provide outdoor classroom learning opportunity for students.21
Other
A few other local assets include:
• Jefferson County Cooperative Extension Service-Master Gardener and Master Food programs
• Partnership for a Green City – Local Food Initiative
• Food Literacy Project http://www.foodliteracyproject.org
• Urban Fresh http://urbanfreshmarkets.com
• Breaking New Grounds http://breakingnewgrounds.org
• Greater Louisville Inc.- Agribusiness Network www.greaterlouisville.com/content/networks/agribusiness.asp
• Louisville Agriculture Club http://louisvilleagclub.com/
• Blackacre Foundation http://www.blackacrefoundation.org/
Wholesale
Distributors According to the 2002 Economic Census, there were
97 grocery and related produce merchant wholesalers (NAICS 4244) in Jefferson County with sales of $1.319 billion.22 Assuming cost of goods at 75%, these produce wholesalers spend about $990 million on produce each year, including transportation costs.
In Louisville, as in the rest of the country, distributors play a significant role in the buying and selling of food from local farms to restaurants, retailers, manufacturers and foodservice providers. Distributors also often purchase product from each other.
21 http://www.louisvilleky.gov/Brightside/Beautification/Community+Gardens/ 22 http://www.census.gov/econ/census02/data/ky/KY111_42.HTM#N424
Final Report: Building the Local Food Economy, Louisville, Kentucky Page 42 Market Ventures, Inc./Karp Resources 7/17/2008
Louisville Produce Terminal
The Louisville Produce Terminal, located on Jennings Lane not far from the airport, is a privately owned facility that was built by wholesalers relocating from the Haymarket. The Terminal is owned by a cooperative of nine families and is guided by a board comprised of the businesses located there, led by Horton Fruit Company, the largest business. Observers noted that the facility is currently underutilized, with an estimated five businesses in operation. Changes in the produce industry have diminished the central role that terminal markets once played in produce distribution. From appearance, little investment has been made in upgrading or populating the market. Due to its location, scale and existing infrastructure, the Produce Terminal could become an important hub for local foods distribution.
The Horton Fruit Company (http://www.hortonfruit.com) — Founded in Louisville in 1946, Horton Fruit Company is a distributor, re-packer, and (to a limited extent) processor of fruits and vegetables. Operating from a 100,000 square foot facility in and adjacent to the Produce Terminal, the company serves some of the city’s largest buyers, including Kroger, Sysco, Papa John’s, and Wal-Mart, and distributes as far as St. Louis, Chicago, and Pittsburgh.
Responding to its clients’ interest in locally grown foods, the company recently created “Grow Inc.”, a brand that promotes and tracks local foods they purchase from June to October. Their primary local supplier is the Central Kentucky Produce Cooperative, and they have also worked with the group’s nine growers to meet the Louisville buyers’ specifications, retailers in particular. Horton’s is interested in purchasing more local product for its Grow Inc. brand than it already does, and company leaders note that the obstacle is not so much supply as quality supply (i.e. more product consistency, high quality on-farm packaging). Grow Inc. is currently a labeling tool for wholesale buyers, not for consumers—consumer branding could follow if demand increases.
Stanley Brothers – Located within the Louisville Produce Terminal, Stanley Brothers is a produce distributor, one of whose main clients is Kroger. The company sells locally grown products to other Louisville and Lexington-based produce distributors. They purchase from numerous local farms, but note that quality product (and product that is handled professionally post-harvest) is very difficult to find in Kentucky.
Creation Gardens
With 64 employees and 18 trucks, Creation Gardens (http://www.whatchefswant.com) is a distributor of produce, specialty grocery items, and cheese, serving restaurant and foodservice clients. Their East Main Street wholesale facility also has a retail component. Creation Gardens purchases food from all over the world as part of the buying group Produce Alliance. Increasingly, the company purchases fruits, vegetables, cured or smoked meats, and value-added dairy products from local producers. They feature Kentucky, Indiana and Tennessee grown fruits and vegetables, cheeses, and cured/smoked meats, some of which farmers bring to their facility and some of which they pick up on their delivery routes. Like the other distributors, the leadership of Creation Gardens noted that many local farms struggle with post harvest handling and packaging, which results in much higher than industry standard spoilage and shorter shelf life.

Final Report: Building the Local Food Economy, Louisville, Kentucky Page 43 Market Ventures, Inc./Karp Resources 7/17/2008
Creation Gardens is very motivated to increase the local foods portion of their business and noted that aggregation points around the state and increased product consistency would help them do so.
Netter Produce
Netter Produce, the last remaining produce wholesaler in the Haymarket, recently relocated to a new location in Butchertown. Netter serves restaurants, Jefferson County Public Schools, Jefferson County jail, and walk-in trade. Netter works closely with approximately ten farms in Indiana and Kentucky. Some of that local product goes to customers who specifically request local. Like other distributors interviewed, they mentioned professional post-harvest handling as a key limitation to increasing local procurement.
Grasshopper Distribution LLC
Founded in 2006, Grasshopper Distribution LLC is a Louisville-based farmer-owned food distribution company, carrying exclusively product grown in Kentucky, Indiana and Tennessee. The company carries produce, dairy products, and meats. In 2007, the company’s first year of sales, they purchased from 33 growers and 22 buyers (primarily “highly motivated chefs” and independent grocers). In February 2008, the Kentucky Agricultural Development Board awarded Grasshopper Distribution $126,480 in state funds and $56,500 in county funds for capital expenditures to help the company enhance its operations. One of Grasshoppers’ goals is to provide a higher price for participating farmers. In addition to their wholesale business, the company also operates a retail CSA. Their facility is located near downtown in West Louisville.
Wholesale direct Many farmers across the state sell wholesale direct, primarily to restaurants but also to
groceries and other retailers. Farmers tend to view restaurants as a distinct kind of wholesale buyer, and many farmers’ markets or CSA farmers also sell to a handful of restaurants. Some of Louisville’s most celebrated restaurants feature local foods, including Proof, Artemesia, Park Place, and Lilly’s.
Manufacturing and processing
According to the 2002 Economic Census, there were 58 firms engaged in food manufacturing (NAICS 311) in Jefferson County with sales of $1.321 billion. These include two firms engaged in animal slaughtering and processing (NAICS 3116) and 29 bakeries and tortilla manufacturers (NAICS 3118).23
Food processing Louisville is home to both large and small scale food processors, a number of co-packers,
and an innovative shared processing facility called FB3 Development. Large processors include DD Williamson, the world leader in producing caramel coloring, and Brown-Forman, one of the
23 http://www.census.gov/econ/census02/data/ky/KY111_31.HTM#N311

Final Report: Building the Local Food Economy, Louisville, Kentucky Page 44 Market Ventures, Inc./Karp Resources 7/17/2008
largest American-owned companies in the wine and spirits business, which has a large bottling facility in the city. The executive chef of Brown-Forman, Mark Williams, is also president of Slow Food Bluegrass and is a strong proponent of local foods both within his company and throughout the community. Small scale food processors include specialty producers such as Schuckman’s Fish Co. and Smokery.
Founded in Louisville in 1870 and based there today, Brown-Forman employs 4,440 people worldwide with about 1,300 located in Louisville. Brown-Forman is among the ten largest global spirits companies, sells its brands in more than 135 countries and has offices in cities across the globe. In all, Brown-Forman has more than 35 brands in its portfolio of wines and spirits. While the company has a distillery in Louisville, the grain comes predominately from Indiana and Canada. The company has two on-site dining facilities at its main Louisville campus (home to 800 employees): a cafeteria with foodservice by Aramark and an upscale dining room. Mark Williams, the Executive Chef of the dining room, has emphasized local foods on his menus and has worked with the campus’ main cafeteria to do the same, although he faces challenges with product cost and in getting buy-in from Aramark for a more aggressive program to buy local foods.
The MVI/KR team identified a number of businesses in Louisville that support food entrepreneurship, product development, processing and packing:
• FB3, http://www.fb3-d.com – FB3 development was started in 2006 to facilitate product development and manufacturing for the food and beverage industry. According to Sandy Nixon, the firm’s owner, FB3 identifies and then partners with local entrepreneurs to bring their product to market, providing services in product development, manufacturing, food safety and packaging regulations, and marketing. The firm has a 5,000 sf facility on East Market Street near downtown and a second processing facility east of Bardstown Road that processes meat (including specialty cuts, sausage making, and smoking) and processes some specialty foods. All the meat processed there is locally raised and slaughtered. The firm is different from other food processing incubators because of two primary factors: their expensive experience in food manufacturing and their business model: they do not charge the entrepreneurs anything during the product development and testing period, but wait until the products are ready to be marketed. In return, FB3 takes a minority ownership share in the company. They actively seek food entrepreneurs who have the passion and dedication to become successful producers.
• Flavorcraft, (http://flavorcraftllc.com) – Flavorcraft is a contract and private label packer with clients including restaurants, supermarkets, start up and specialty businesses, and institutional foodservice. The company offers product development, production, packaging, regulatory approval, and storage services for products including sauces, dressings, cocktail mixes, syrups, bread mixes, spice mixes, alcohol-infused products, and non-carbonated drinks. Flavorcraft is located in a 25,000 square foot facility with eight loading docks, certified by the Food and Drug Administration, and inspected by AIB International.
• Custom Food Solutions, http://www.customfoodsolutions.com – Custom Food Solutions formulates and manufactures thermally-processed food products (IQF, chilled, and blast-frozen) for foodservice, retail and industrial customers. Founded in 1988, the company produces vegetables, soups, salsas, sauces, glazes, side dishes, fillings, and desserts in its
Final Report: Building the Local Food Economy, Louisville, Kentucky Page 45 Market Ventures, Inc./Karp Resources 7/17/2008
USDA and FDA inspected facilities. They offer research and development services, in-house technical services, and can support proprietary product formulations. Minimum production is 40,000 pounds per month (which can be divided between two products).
• Pop’s Pepper Patch, http://www.popspepperpatch.com – Pop’s Pepper Patch processes more than 50 products for clients in three states, in addition to its own line of pepper-based sauces. Products processed on-site include salsas, cocktail onions and olives, pickles, marinades, and assorted sauces.
• Culinary Standards, http://www.culinarystandards.com – Culinary Standards has been manufacturing frozen prepared foods in their USDA-approved facility in Louisville for over 60 years. Products include soups, entrees (Mexican, Italian, Asian), BBQ cooked meats, vegetable “sides,” chilies, sauces and gravies, dips and spreads, and a line of school lunch menu products (in accordance with National School Lunch Program guidelines). The company also offers clients the services of an in-house product development team.
Additionally, the Community Food Alliance is exploring development of a shared use
commercial kitchen in West Louisville.
Meat processing Louisville is home to a Swift & Company hog processing plant. Swift, which is the third
largest processor of fresh beef and pork in the U.S., was purchased in 2007 by JBS S.A., a Brazilian-based beef processor. The new company will be the largest beef processor in the world.24 According to an interview with a recent Swift employee, the plant processes 2,000 hogs per hour.
While odors from the plant have been a source of tension with nearby residents, the plant represents a valuable asset within the city. Farmers and restaurateurs report that Swift has done small runs of locally-raised natural pork at the beginning of the work week, following their thorough cleaning of the facility.
Key informants indicated that Fresh Link, a supermarket in east downtown, performs meat processing activities in their facility.
Louisville Food Sector Snapshot Conclusions
As this snapshot of the Louisville food economy has shown, the food sector in Louisville is large and diverse. Kentucky-grown foods currently represent a small proportion of all foods being sold so there is substantial room to capture a larger market share.
From our interviews with key informants throughout the city and region, the MVI/KR team found great enthusiasm and knowledge about locally grown foods, as well as significant interest in expanding the amount of locally grown foods in the retail, wholesale, and (to a lesser extent) the food manufacturing subsectors. Larger buyers are particularly concerned about food safety and for meeting their demand for consistent quality. 24 http://www.jbsswift.com/media/releases/2007_07_12_JBS_Swift_closing_FINAL.pdf
Final Report: Building the Local Food Economy, Louisville, Kentucky Page 46 Market Ventures, Inc./Karp Resources 7/17/2008
Section 3. Snapshot of Kentucky Agriculture
According to the 2002 Census of Agriculture, Kentucky had more than 86,500 farms that year, a drop of nearly 15,000 since 1982 but still the fifth largest number of farms per state in the country.25, 26 The Kentucky Department of Agriculture reports that there are currently 84,000 farms in the state with an average farm size of 163 acres, and that farmland accounts for 54% of the total acreage in the state. The top farm commodities by cash receipts in 2005 included horses, broilers, cattle and calves, tobacco and corn, which accounted for 75% of all sales.27
Overall, 2007 was a good year for Kentucky agriculture, with farm cash receipts totaling a record $4.22 billion, despite a late spring freeze and summer drought. Livestock represented the largest portion of sales at over $3 billion (an 11% increase), due largely to higher prices and cattle being sent to market because of poor pasture conditions. Vegetable crop receipts increased more than 15% to $23 million.28
As the chart entitled “Kentucky Farm Cash Receipts” shows, the overall trend of farm cash receipts has been moving upward since the mid-1980s and farm cash receipts are expected to hit record levels in 2008, despite livestock receipts dropping 2.4%. Crop receipts are anticipated to increase 12% between 2007 and 2008. Net farm income is anticipated to remain steady because of higher energy and other input prices, and lower government payments. As the chart demonstrates clearly, the principal growth in farm cash receipts over the past 25 years has come from the livestock sector, with the crops sector remaining fairly flat over this period.
25 http://www.nass.usda.gov/Census/Pull_Data_Census_Sort 26 The definition of a farm for census purposes is any place from which $1,000 or more of agricultural products were produced and sold, or normally would have been sold, during the census year. 27 http://www.kyagr.com/pr/agstats/index.htm 28 http://www.uky.edu/Ag/AgEcon/pubs/ext_other/2008KYOutlook.pdf
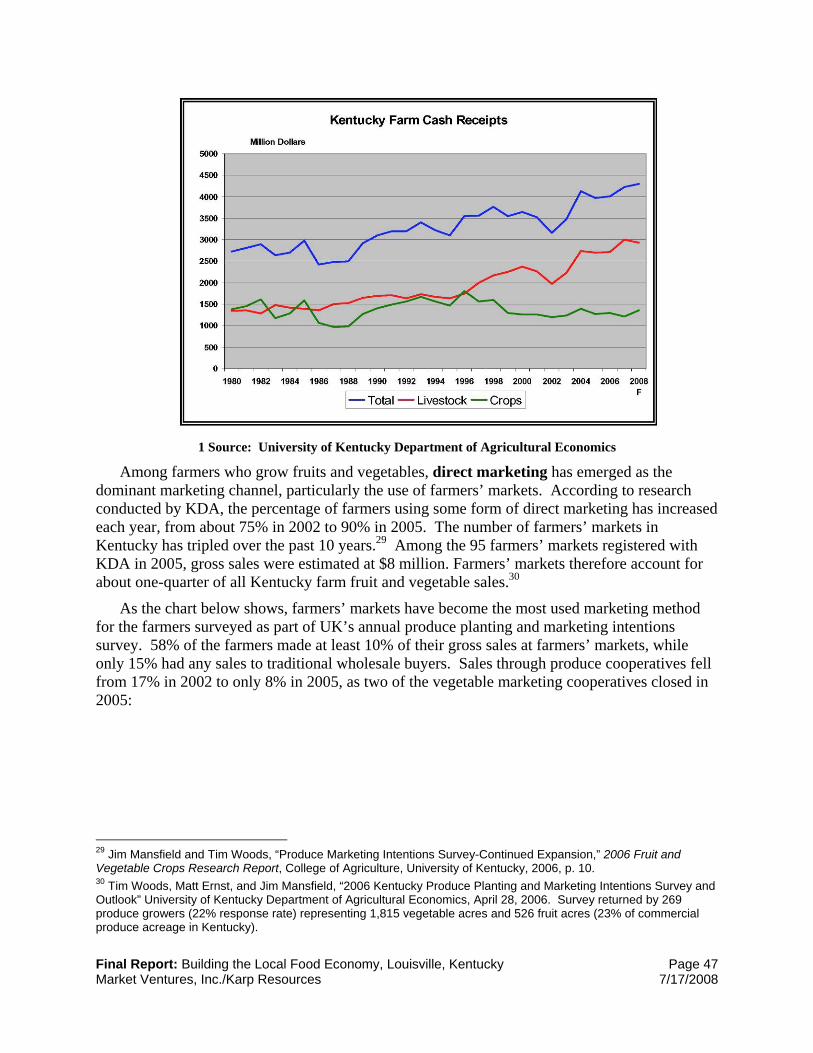
Final Report: Building the Local Food Economy, Louisville, Kentucky Page 47 Market Ventures, Inc./Karp Resources 7/17/2008
1 Source: University of Kentucky Department of Agricultural Economics
Among farmers who grow fruits and vegetables, direct marketing has emerged as the dominant marketing channel, particularly the use of farmers’ markets. According to research conducted by KDA, the percentage of farmers using some form of direct marketing has increased each year, from about 75% in 2002 to 90% in 2005. The number of farmers’ markets in Kentucky has tripled over the past 10 years.29 Among the 95 farmers’ markets registered with KDA in 2005, gross sales were estimated at $8 million. Farmers’ markets therefore account for about one-quarter of all Kentucky farm fruit and vegetable sales.30
As the chart below shows, farmers’ markets have become the most used marketing method for the farmers surveyed as part of UK’s annual produce planting and marketing intentions survey. 58% of the farmers made at least 10% of their gross sales at farmers’ markets, while only 15% had any sales to traditional wholesale buyers. Sales through produce cooperatives fell from 17% in 2002 to only 8% in 2005, as two of the vegetable marketing cooperatives closed in 2005:
29 Jim Mansfield and Tim Woods, “Produce Marketing Intentions Survey-Continued Expansion,” 2006 Fruit and Vegetable Crops Research Report, College of Agriculture, University of Kentucky, 2006, p. 10. 30 Tim Woods, Matt Ernst, and Jim Mansfield, “2006 Kentucky Produce Planting and Marketing Intentions Survey and Outlook” University of Kentucky Department of Agricultural Economics, April 28, 2006. Survey returned by 269 produce growers (22% response rate) representing 1,815 vegetable acres and 526 fruit acres (23% of commercial produce acreage in Kentucky).

Final Report: Building the Local Food Economy, Louisville, Kentucky Page 48 Market Ventures, Inc./Karp Resources 7/17/2008
Percent of Growers Reporting 10% or More Gross Sales from Specific Markets 2002 2003 2004 2005Farmers' Markets 42% 47% 52% 58%On-Farm Direct Markets 49% 44% 37% 46%Direct to Restaurants 5% 7% 7% 17%Direct to Grocery 21% 14% 15% 16%Auctions 9% 8% 10% 16%Wholesale, Non Co-op 17% 15% 17% 15%Wholesale, Cooperatives 17% 15% 11% 8%CSA/Subscription 3% 2% 2% 1%
According to this survey, gross sales of Kentucky’s commercial produce will remain steady or increase from its 2005 level of $32 million. The drop in sales through cooperatives has been offset with higher sales through farmers’ markets and growth at two of Kentucky’s four produce auctions. Commercial vegetable acreage is expected to increase to about 8,100 acres in 2006, while commercial fruit acreage will decrease about 18% from its 2005 level to about 2,500 acres.
Large numbers of Kentucky’s tobacco growers exited tobacco production in 2005 in response to the national tobacco buyout program. Nearly 25% of the producers responding to this survey said they grew tobacco on their farm in 2005, compared to about 45% in the previous five years. The trend toward abandoning tobacco appears to be continuing: over one in three (37%) of those who grew tobacco in 2005 indicated they would not grow tobacco in 2006. Among those who are not planning to grow tobacco in 2006, over half said they would expand their vegetable production.31
In several interviews, the consultant team heard about the state’s efforts to encourage tobacco growers to transition to vegetable production and the Agriculture Development Board’s extensive funding to create produce cooperatives, including storage facilities, around Kentucky. According to one produce distributor, this effort ceased about two years ago because it did not include an adequate plan for distribution. Overall, he felt that it was detrimental to farmers. A number of the farmers interviewed mentioned the produce cooperatives as a reason they are leery of government intervention to assist them in making the transition away from tobacco production.
Kentucky’s production of hogs, cattle and chickens is substantial. The state is the largest source of feeder cattle east of the Mississippi.32 The state hosts several large scale meat processors with nationwide or international sourcing and consumer base. Small ruminants, including sheep and goats, have become more common in Kentucky and offer strong future potential as prices has increased substantially (about 12% between 2006 and 2007) and the topography is generally well suited for their production. About one-half of US consumption of these items is imported, providing opportunities for efficient domestic producers.33
31 Ibid. 32 Bringing Kentucky’s Food and Farm Economy Home, Community Food Alliance Report, 9/02 33 http://www.uky.edu/Ag/AgEcon/pubs/ext_other/2008KYOutlook.pdf
Final Report: Building the Local Food Economy, Louisville, Kentucky Page 49 Market Ventures, Inc./Karp Resources 7/17/2008
In addition to sales, farms represent an important cultural dimension in Kentucky. Numerous key informants indicated the close relationship that many people in Kentucky, including city dwellers in Louisville, feel to farming and that most Kentucky residents are only one or perhaps only two generations removed from farming. Although Kentucky has undergone a profound shift toward urban/suburban residents, the close connection between citizens and farming creates bonds of understanding and appreciation, and with these bonds, the potential to develop local foods strategies that make direct, emotional links between urban residents and foods grown in the state.
Geographic target and key characteristics
While the overall goal of this study is to increase sales to Kentucky farmers, the primary focus has been on strategies targeted at farmers located in the Louisville region. Therefore, particular attention has been given to the characteristics of farms in Jefferson and neighboring counties.
The MVI/KR team identified a 23 county region of Kentucky around Jefferson County as the primary focus of research with area farmers (see the map labeled Louisville Study Region, below). The selected counties include:
Anderson Gallatin Meade Shelby
Boyle Hardin Mercer Spencer
Breckinridge Henry Nelson Trimble
Bullitt Jefferson Oldham Washington
Carroll Larue Owen Woodford
Franklin Marion Scott
The farmer focus groups were drawn from these counties, with particular attention to the seven counties closest to Louisville: Jefferson, Bullitt, Henry, Oldham, Shelby, Spencer and Trimble.
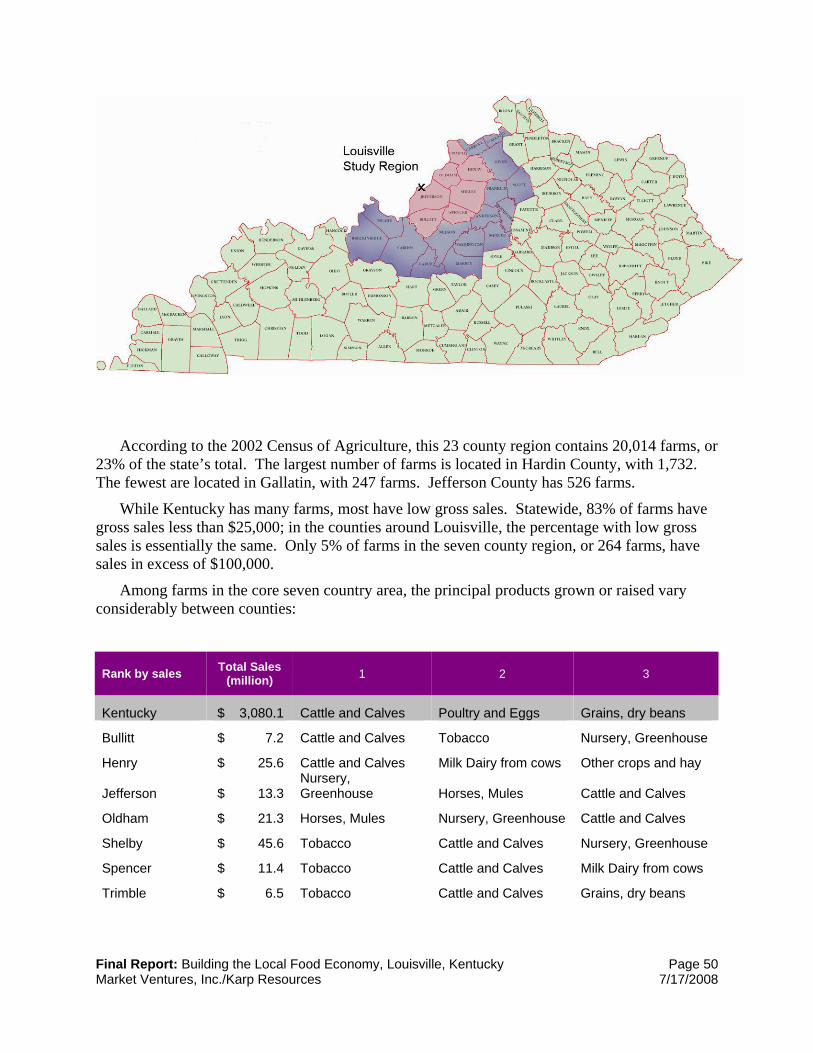
Final Report: Building the Local Food Economy, Louisville, Kentucky Page 50 Market Ventures, Inc./Karp Resources 7/17/2008
According to the 2002 Census of Agriculture, this 23 county region contains 20,014 farms, or 23% of the state’s total. The largest number of farms is located in Hardin County, with 1,732. The fewest are located in Gallatin, with 247 farms. Jefferson County has 526 farms.
While Kentucky has many farms, most have low gross sales. Statewide, 83% of farms have gross sales less than $25,000; in the counties around Louisville, the percentage with low gross sales is essentially the same. Only 5% of farms in the seven county region, or 264 farms, have sales in excess of $100,000.
Among farms in the core seven country area, the principal products grown or raised vary considerably between counties:
Rank by sales Total Sales (million) 1 2 3
Kentucky $ 3,080.1 Cattle and Calves Poultry and Eggs Grains, dry beans
Bullitt $ 7.2 Cattle and Calves Tobacco Nursery, Greenhouse
Henry $ 25.6 Cattle and Calves Milk Dairy from cows Other crops and hay
Jefferson $ 13.3 Nursery, Greenhouse Horses, Mules Cattle and Calves
Oldham $ 21.3 Horses, Mules Nursery, Greenhouse Cattle and Calves
Shelby $ 45.6 Tobacco Cattle and Calves Nursery, Greenhouse
Spencer $ 11.4 Tobacco Cattle and Calves Milk Dairy from cows
Trimble $ 6.5 Tobacco Cattle and Calves Grains, dry beans
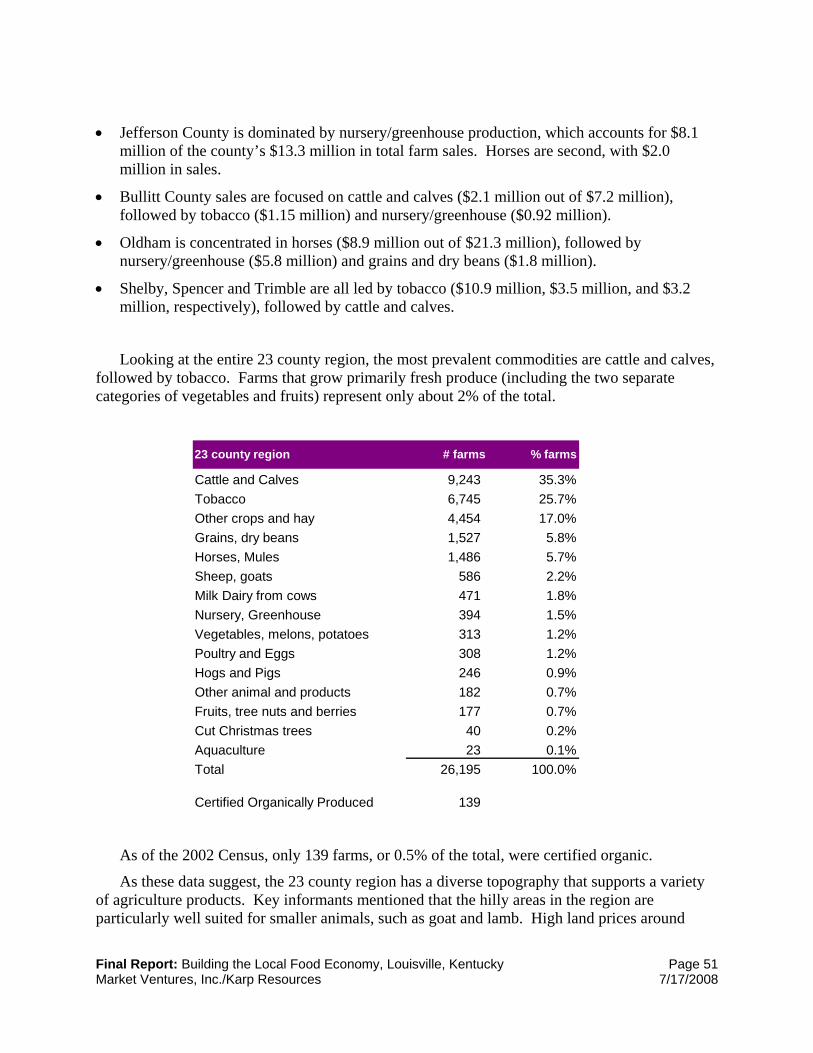
Final Report: Building the Local Food Economy, Louisville, Kentucky Page 51 Market Ventures, Inc./Karp Resources 7/17/2008
• Jefferson County is dominated by nursery/greenhouse production, which accounts for $8.1 million of the county’s $13.3 million in total farm sales. Horses are second, with $2.0 million in sales.
• Bullitt County sales are focused on cattle and calves ($2.1 million out of $7.2 million), followed by tobacco ($1.15 million) and nursery/greenhouse ($0.92 million).
• Oldham is concentrated in horses ($8.9 million out of $21.3 million), followed by nursery/greenhouse ($5.8 million) and grains and dry beans ($1.8 million).
• Shelby, Spencer and Trimble are all led by tobacco ($10.9 million, $3.5 million, and $3.2 million, respectively), followed by cattle and calves.
Looking at the entire 23 county region, the most prevalent commodities are cattle and calves, followed by tobacco. Farms that grow primarily fresh produce (including the two separate categories of vegetables and fruits) represent only about 2% of the total.
23 county region # farms % farms
Cattle and Calves 9,243 35.3%Tobacco 6,745 25.7%Other crops and hay 4,454 17.0%Grains, dry beans 1,527 5.8%Horses, Mules 1,486 5.7%Sheep, goats 586 2.2%Milk Dairy from cows 471 1.8%Nursery, Greenhouse 394 1.5%Vegetables, melons, potatoes 313 1.2%Poultry and Eggs 308 1.2%Hogs and Pigs 246 0.9%Other animal and products 182 0.7%Fruits, tree nuts and berries 177 0.7%Cut Christmas trees 40 0.2%Aquaculture 23 0.1%Total 26,195 100.0%
Certified Organically Produced 139
As of the 2002 Census, only 139 farms, or 0.5% of the total, were certified organic.
As these data suggest, the 23 county region has a diverse topography that supports a variety of agriculture products. Key informants mentioned that the hilly areas in the region are particularly well suited for smaller animals, such as goat and lamb. High land prices around

Final Report: Building the Local Food Economy, Louisville, Kentucky Page 52 Market Ventures, Inc./Karp Resources 7/17/2008
Louisville have made it challenging to maintain working farms. Both the small size of farms and the limited number of farmers growing or raising fresh food products puts current constraints on expanding sales of local foods in Louisville. Several interviewees mentioned that land in nearby Indiana counties is often more productive for larger scale fruit and vegetable production and therefore these areas can help improve the supply for local foods, particularly as Kentucky farmers ramp up production.
Meat and poultry processing
Perdue has a chicken processing plant in Cromwell, KY (Ohio County). In operation for 13 years, this facility processed 50 million live chickens in 2006, resulting in 255 million pounds of meat.34 Laura’s Lean Beef—a company which focuses on producing low-fat beef and which sources from a network of 750 medium-sized cattle producers nationwide—is also based in Kentucky, but does not have processing infrastructure located there.35 As described above, Louisville is home to a Swift & Company hog processing plant.
Leaders within KDA and researchers at UK identified a need for increased meat processing infrastructure in their research and in interviews with the consultant team. There is currently limited processing infrastructure to slaughter, butcher or further process animals for the state’s numerous small and medium scale producers, many of whom prefer to retain ownership of their animals through slaughter. The UK’s 2007 Kentucky Meat Processors Directory (map below) lists 60 meat processing firms. Forty of these are federally inspected facilities and the other 20 are referred to as Kentucky Exempt Plants. Meat processed in the Exempt Plants cannot be sold at retail or in foodservice, including direct sales; it is intended for use on the farm or for sale on a “live basis” as sides, quarters, or whole animals. 36
According to one KDA leader, a lack of meat processing infrastructure geared towards small and mid-scale producers has resulted in more producers selling their animals at auction to feedlots rather than retaining ownership of their animals through slaughter.
Agritourism
In 2002, the Kentucky state legislature passed House Bill 654, creating the Office of Agritourism, an interagency office of the Department of Agriculture and the Tourism Department. The bill defines agritourism as “The act of visiting a working farm or any agricultural, horticultural, or agribusiness operations for the purpose of enjoyment, education or active involvement in the activities of the farm or operation.”37 The Office of Agritourism has inventoried existing on-farm activities and it leads various promotional campaigns to increase the income generated from on-farm activities within nine tourism regions (including the Louisville-Lincoln Region). Their efforts appear to have taken root: the majority of farmers who participated in the focus groups have a strong understanding of the concept, and many felt expanding agritourism would significantly benefit the region’s farmers.
34 http://www.whas11.com/news/local/stories/052107whasmjdLocalPerduePlant.8f692cf6.html 35 In early 2008, Laura’s Lean Beef sold to Colorado’s Meyer Natural Angus. 36 Draft version of the UKY 2007 Survey of KY Meat Processors, Meat Processors Directory 37 http://www.lrc.state.ky.us/Statrev/ACTS2002/0250.pdf
Final Report: Building the Local Food Economy, Louisville, Kentucky Page 53 Market Ventures, Inc./Karp Resources 7/17/2008
In December 2005, the Office of Agritourism retained the Glengariff Group to conduct a market study on the potential of Kentucky’s agritourism industry. They inventoried 268 agritourism businesses in Kentucky, with 35 businesses in the Louisville-Lincoln region, including farms, distilleries, wineries, agri-entertainment and other categories. The study found that 85-90% of Kentucky’s agritourism business came from local or regional customers. The most successful farms provide the broadest range of experiences, products, and educational programs, with many capitalizing on seasonal products and festivals. Local and regional customers will visit an agritourism site more often if there are new activities, programs, and products to enjoy. In a review of national agritourism models, the study found that across all states, the most successful operations shared the following components:
1. A complete commitment to agritourism
2. A diverse and changing experience
3. An effort to link to local, regional and state tourism organizations
4. A focus on the fundamentals of any successful tourism business: a clean operation, with standard hours, in a convenient location, that focused on top quality customer service38
In the Louisville region, Huber’s Farm in Starlight, Indiana and Chaney’s Dairy Barn in Bowling Green epitomize these elements, and both were mentioned numerous times by farmers in the focus groups as examples of successful agritourism operations.
Agriculture programs and supporting assets
Throughout Kentucky, government agencies, universities, nonprofit groups and private firms operate a wide range of programs that impact farmers. This report highlights programs that were frequently mentioned by key informants during the interview process or which reinforce the strategies that the farmers most favored. The consultant team did not attempt to create a complete catalog of agriculture programs or assets, but seeks to describe the most salient ones.
Kentucky Department of Agriculture
Kentucky Proud Kentucky Proud is a trademarked branding initiative for
Kentucky-grown, raised, or processed food products, owned and managed by the Kentucky Department of Agriculture. As of February 2008, nearly 1,000 companies participated in the program. In April 2008, House Bill 626 established Kentucky Proud in state law and enabled the Agriculture Commissioner “to collect fees to fund the farm marketing program,” further entrenching and stabilizing the program. According to KDA, retail sales of Kentucky Proud products exceeded $80 million in 2007, up from $39 million in 2006.39
38 Kentucky Agritourism Market Study, December 2005, Glengariff Group, Inc. 39 http://www.nasda.org/cms/7197/9060/16174/16178.aspx?newsletter=true, http://www.kyagr.com/pr/KYProud-Lane.htm
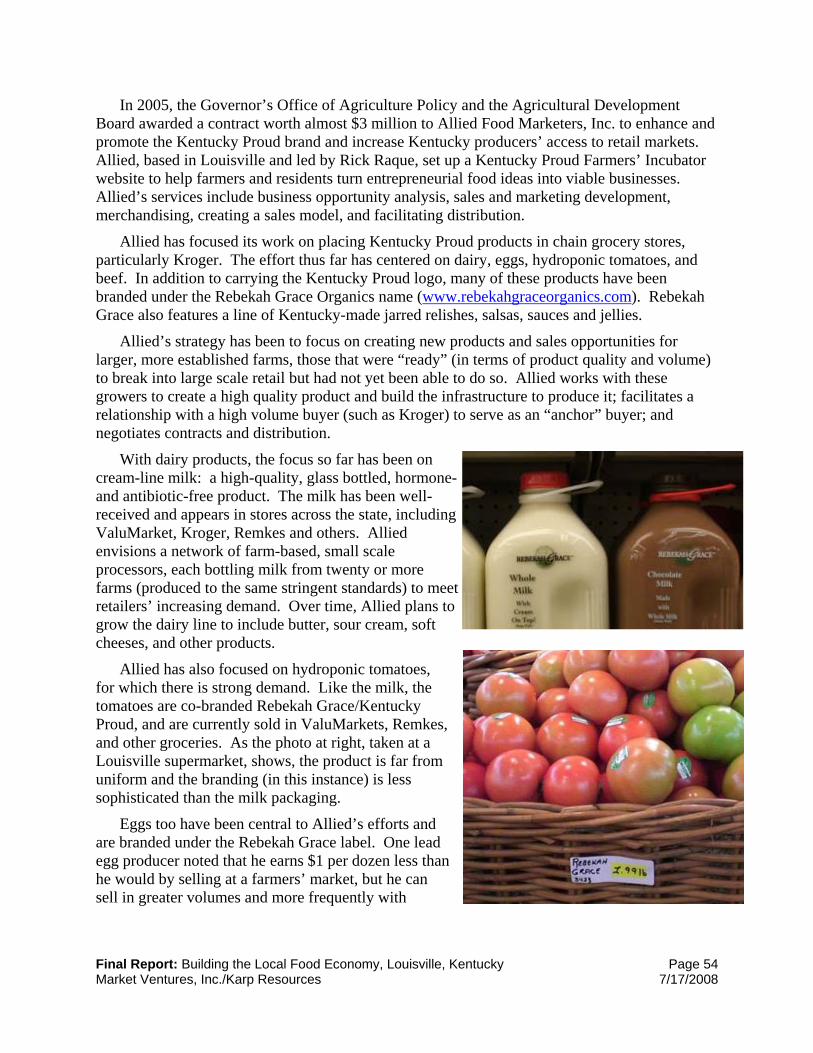
Final Report: Building the Local Food Economy, Louisville, Kentucky Page 54 Market Ventures, Inc./Karp Resources 7/17/2008
In 2005, the Governor’s Office of Agriculture Policy and the Agricultural Development Board awarded a contract worth almost $3 million to Allied Food Marketers, Inc. to enhance and promote the Kentucky Proud brand and increase Kentucky producers’ access to retail markets. Allied, based in Louisville and led by Rick Raque, set up a Kentucky Proud Farmers’ Incubator website to help farmers and residents turn entrepreneurial food ideas into viable businesses. Allied’s services include business opportunity analysis, sales and marketing development, merchandising, creating a sales model, and facilitating distribution.
Allied has focused its work on placing Kentucky Proud products in chain grocery stores, particularly Kroger. The effort thus far has centered on dairy, eggs, hydroponic tomatoes, and beef. In addition to carrying the Kentucky Proud logo, many of these products have been branded under the Rebekah Grace Organics name (www.rebekahgraceorganics.com). Rebekah Grace also features a line of Kentucky-made jarred relishes, salsas, sauces and jellies.
Allied’s strategy has been to focus on creating new products and sales opportunities for larger, more established farms, those that were “ready” (in terms of product quality and volume) to break into large scale retail but had not yet been able to do so. Allied works with these growers to create a high quality product and build the infrastructure to produce it; facilitates a relationship with a high volume buyer (such as Kroger) to serve as an “anchor” buyer; and negotiates contracts and distribution.
With dairy products, the focus so far has been on cream-line milk: a high-quality, glass bottled, hormone- and antibiotic-free product. The milk has been well-received and appears in stores across the state, including ValuMarket, Kroger, Remkes and others. Allied envisions a network of farm-based, small scale processors, each bottling milk from twenty or more farms (produced to the same stringent standards) to meet retailers’ increasing demand. Over time, Allied plans to grow the dairy line to include butter, sour cream, soft cheeses, and other products.
Allied has also focused on hydroponic tomatoes, for which there is strong demand. Like the milk, the tomatoes are co-branded Rebekah Grace/Kentucky Proud, and are currently sold in ValuMarkets, Remkes, and other groceries. As the photo at right, taken at a Louisville supermarket, shows, the product is far from uniform and the branding (in this instance) is less sophisticated than the milk packaging.
Eggs too have been central to Allied’s efforts and are branded under the Rebekah Grace label. One lead egg producer noted that he earns $1 per dozen less than he would by selling at a farmers’ market, but he can sell in greater volumes and more frequently with
Final Report: Building the Local Food Economy, Louisville, Kentucky Page 55 Market Ventures, Inc./Karp Resources 7/17/2008
Rebekah Grace. This producer aggregates eggs from other growers to clean and pack for Rebekah Grace, purchasing them for about $.50 per dozen less than his selling price.
Allied Food Marketers and Rebekah Grace are closely linked private companies, with the same CEO. Several producers interviewed expressed an impression that Allied focuses its efforts on producers interested in supplying the Rebekah Grace brand and may not be as supportive of all growers or those who are making the transition away from tobacco, are newly diversified, or otherwise in need of marketing and business development services. Several farmers were concerned about how they could compete with Rebekah Grace, if they cannot or do not supply the company, given that the brand is perceived to have the backing and resources of state government. Others were very supportive of Allied Marketing and Rebekah Grace and have prospered with it, including one prominent Louisville-based chef who noted that Allied has sourced numerous products for him, enabling him to substantially increase the quantities of local foods he purchases.
Across food and agriculture industry sectors, many of those interviewed responded very positively to the Kentucky Proud brand. Many of the farmer focus group participants label their products with Kentucky Proud (in focus groups in two counties, all of the farmers use the label). One retailer with stores across the state noted that he had seen dramatic increases in sales in Kentucky Proud and has increased his merchandising of the brand. While a Louisville chef supports and showcases the Kentucky Proud brand on his menus, he wished more stringent standards could be placed on Kentucky Proud products, fearing that without them the brand could “become a stigma instead of a value.” One new meat producer concurred, noting that consumers really embrace the brand at the farmers’ market, and that he has gained access to distribution through the program. He also noted that “people see Kentucky Proud as an endorsement, but the standards really need to be increased.”
Others shared this concern, and many farmers and others in the industry had recommendations for improving the program. Several Jefferson County producers noted that they choose not to use the Kentucky Proud label because the standards are not yet strong enough. In particular, they felt that processed products that are not comprised entirely of Kentucky-grown ingredients should not use the label.
One distributor said that Kentucky Proud is a great program, but felt that producers should pay to label products, as a way to ensure producer commitment to the brand and to generate revenue for it. Across the board, distributors wished that farmers would pack in boxes labeled Kentucky Proud, ideally with individual farm designations as well. KDA is currently working on creating Kentucky Proud wax boxes for tomatoes and squash.
Another independent distributor noted that there is “big business in Kentucky Proud,” noting that his customers want it and the program is strong “even in smaller towns.” He observed that consumers have “a good image of what Kentucky Proud is and stands for, but the volumes aren’t there yet.”
Farmers’ Markets
KDA’s Farmers’ Market Program is part of the Division of Value-Added Plant Production in the Office of Agricultural Marketing and Product Promotion. Led by Janet Eaton, the Farmers’ Market Program acts as a resource for farmers’ markets throughout the state. The program
Final Report: Building the Local Food Economy, Louisville, Kentucky Page 56 Market Ventures, Inc./Karp Resources 7/17/2008
maintains a state-wide on-line directory of registered farmers’ markets. In 2007, the directory listed 115 registered farmers’ markets in Kentucky, including fifteen in Jefferson County. 40
The Kentucky Farmers’ Market Association was created as an outgrowth of the Farmers’ Market program following a KDA summit in 2006. In its second year, the association is a volunteer effort led by Janet Eaton and includes 87 statewide members. The group’s top priorities include promoting EBT (electronic benefits transfer) machines at farmers’ markets, streamlining the administration of the Farmers’ Market Nutrition Program, and exploring the use of group-rate insurance to protect multiple vendors selling at a single market. The group also gives farmers a stronger voice in regional and statewide discussions about farmers’ markets. Ms. Eaton hopes that the association will grow to provide uniform promotions and displays and collective advertising, though it is limited by being an all-volunteer association without a paid employee.
Kentucky Proud Country Store and KDA Farm Store
KDA’s website has two sections devoted to the buying and selling of Kentucky farm products: the Kentucky Proud Country Store (http://www.kyagr.com/buyky/cstore/cstore.htm) and the Farm Store (http://www.kyagr.com/buyky/corral/corral.htm). The KDA Country Store is an on-line directory of farms and businesses that produce and sell Kentucky Proud items, including produce, beverages, bakeshop, meat/poultry, general grocery, dairy, seafood, snacks/sweets, merchandise (i.e. crafts, health/beauty products, etc.) The directory includes business names and contact information as well as limited product lists. The KDA Farm Store is an online directory of the state’s agricultural products, including livestock/cattle, orchard/greenhouse, hay/forage, fish/aquaculture, poultry/fowl, wood products, tobacco, seeds, supplies, equipment and agricultural services. Like the Country Store, the Farm Store includes contact information and limited product lists. Neither website enables the user to establish contact with the vendor or to purchase online.
Restaurant Rewards KDA’s Kentucky Restaurant Rewards program subsidizes and promotes restaurants and
caterers who purchase Kentucky grown and produced foods directly from Kentucky farmers.41 Participating businesses receive up to $1,000 per month from KDA to offset the cost of local food purchases: they receive 20% of the cost of purchasing Kentucky Proud products including produce, meat (including meat raised in Kentucky but processed out of state), poultry, dairy, fish, eggs, and value-added products grown and produced in Kentucky with at least 90% Kentucky-grown ingredients. The restaurants are required to use these reimbursements to pay for advertisements and promotional materials that bear the Kentucky Proud logo. The current two year budget for the program is $225,000.
40 http://www.kyagr.com/marketing/farmmarket/directory.htm 41 http://www.kyagr.com/marketing/restrewards/index.htm
Final Report: Building the Local Food Economy, Louisville, Kentucky Page 57 Market Ventures, Inc./Karp Resources 7/17/2008
Other state government
Department of Parks
Under the leadership of Bob Perry (now at the University of Kentucky), the state department of parks created a program to purchase produce from local farmers for its food service operations within the state parks. This effort required significant staff training, teaching the cooks how to handle fresh produce, as well as overcoming inflexible procurement rules that discouraged purchasing in innovative ways. Over time, this effort was seen as a model for other public agencies to purchase local foods and was a precursor to the Restaurant Rewards program. This program was eventually canceled, apparently because of opposition by produce distributors who argued successfully that the farmers received unfair preference.
Public procurement
HB 484, a bill the Kentucky legislature passed in spring of 2008, requires governing boards of public higher education institutions to purchase Kentucky-grown agricultural products if available and extends a purchasing preference already in effect for state agencies. This mandate should go a long way toward encouraging state-run universities and agencies to seek local foods.
University of Kentucky The University of Kentucky College of Agriculture supports agriculture in numerous ways,
including education, research and through the various programs and initiatives of the Cooperative Extension Service.
Cooperative Extension
The Cooperative Extension Service is operated by UK in cooperation with Kentucky State University. Extension offices are located in every county and Extension agents are often trusted leaders within their farming community. Agents provide a range of services to assist area producers. Many of the Extension offices include certified kitchens that are available for food processing, as well as meeting spaces. In focus groups and interviews, the consultant team learned that most of these are underutilized, primarily due to insufficient space to store equipment and/or ingredients.
MarketMaker
MarketMaker is a state-based interactive mapping system that locates businesses and markets of agricultural products. Developed by the University of Illinois Cooperative Extension Service in 2004, MarketMaker is now used in 10 states: Nebraska, Iowa, Michigan, Indiana, Ohio, Mississippi, Georgia, Illinois, Kentucky, and New York. All of the sites are maintained, managed, and hosted by the University of Illinois. 42
MarketMaker is intended to link producers with potential buyers, as well as provide mapped demographic information that enables producers to find markets by household income, ethnic origin, education level, or household type. It also enables buyers to search for producers by
42 http://ky.marketmaker.uiuc.edu/

Final Report: Building the Local Food Economy, Louisville, Kentucky Page 58 Market Ventures, Inc./Karp Resources 7/17/2008
county, product type (e.g. meat, fruit, grain), product form (e.g. canned, fresh, frozen), or product attribute (e.g. organic, fair trade, Kosher). The MarketMaker database includes the state’s food retailers, wholesalers, processors, farmers’ markets, and places to eat and drink.
In Kentucky, MarketMaker reflects a partnership between the University of Kentucky Cooperative Extension Service, Kentucky Department of Agriculture, the Governor’s Office of Agricultural Policy, and Allied Food Marketers. The Kentucky MarketMaker database lists 675 producers, including 6 dairy, 179 fruit/nuts, 8 grain, 65 herb, 114 meat, 75 specialty products, and 228 vegetable. A KDA representative estimated that the website receives 50,000 hits each month, but guessed that many more were for market research or demographic information than for sourcing products. The website does not include regularly updated product availability or volumes, and does not host producer/buyer interactions or transactions. All profile updates must go through the University of Illinois, which limits the rates at which changes can occur.
Farmers interviewed expressed limited knowledge or use of MarketMaker.
Food Systems Initiative and Innovation Center
The Food Systems Initiative, coordinated by Bob Perry, is designed to coordinate the efforts of many different programs within the university that deal with food and link UK’s efforts with those of the Kentucky Agricultural Development Board programs and KDA. Bob Perry was formerly the director of food service for the Kentucky Department of Parks.
The University of Kentucky has created the Food Systems Innovation Center. Though it does not currently have its own facility (they are seeking funding to build), the Center helps local food producers develop products and new markets, with services including microbial testing, nutritional label analysis, HACCP validation studies, and consumer evaluation groups. One leader of this Center noted that farmers’ markets have been their clients’ most lucrative outlet, but that Whole Foods has indicated its interest in working with local food producers, regardless of size.
Kentucky State University Kentucky State University is Kentucky’s 1890 land grant institution and operates the
Cooperative Extension Service with UK. KSU’s Small Farm Program is designed to enhance the income and sustainability of small farmers in Kentucky with a particular emphasis on limited resource persons. The 205-acre KSU Research and Demonstration Farm, located in southern Franklin County, is the home to numerous research projects as well as frequent sustainable agriculture workshops.
With funding from SARE (Sustainable Agriculture Research and Education, a program supported by USDA that administers a competitive grant program with funds from Congress) and KDA, KSU developed a mobile poultry processing unit in partnership with Partners for Family Farms (described below) and Heifer International. The unit includes flash freezing capabilities for aquaculture products. Several key informants noted that the facility, currently docked in Frankfort, is underutilized and rarely moves because there are not suitable docking stations with potable water, electric and sewer connections. Others stated that they did not use the unit because they would have to do their own poultry processing and they prefer having food

Final Report: Building the Local Food Economy, Louisville, Kentucky Page 59 Market Ventures, Inc./Karp Resources 7/17/2008
KY Farm Bureau map of Certified Roadside Farm Markets (each red dot represents a farm)
safety experts handling their animals. Another noted that the facility is not USDA-inspected, making its products legal for sale only within the state.
Farm Bureau Founded in 1919, Kentucky Farm Bureau (KYFB) is the state’s largest membership
organization with more than 400,000 members (http://www.kyfb.com). Comprised of “farm families and their allies”, KYFB is “dedicated to serving as the voice of agriculture by identifying problems, developing solutions and taking actions which will improve net farm income, achieve better economic opportunities and enhance the quality of life for all.”43 KYFB programs and services include insurance offerings, women’s leadership activities, Ag in the Classroom, Young Farmers, and commodity market information.
Since the summer of 1996, KYFB has operated the Certified Roadside Farm Market program, which seeks to organize, create standards for, certify, and promote farms with roadside markets to consumers across the state.44 Although the program was originally developed to promote fruit and vegetable farms, it has expanded and now includes other horticultural products, tree farms, meat producers, dairies, and vineyards. Eighty-two farms across the state participate in the program and appear on the Farm Bureau’s website and promotional map, which is distributed to state parks and tourism outlets. Farmers with roadside stands are perceived by several agricultural leaders around the state to be leaders and innovators in product diversification and agritourism. Three farm stands are located in Jefferson County, plus there are two in Bullitt, two in Spencer, one in Shelby, one in Owen, three in Trimble, one in Hardin and two in Larue counties. Farm Bureau is therefore an obvious partner for efforts to expand agricultural tourism in the Louisville region.
43 http://www.kyfb.com/index.asp
44 http://www.kyfb.com/federation/Roadside%20Market/roadside.asp
Final Report: Building the Local Food Economy, Louisville, Kentucky Page 60 Market Ventures, Inc./Karp Resources 7/17/2008
Kentucky Agricultural Development Board The Agricultural Development Board operates through the Governor’s Office of Agricultural
Policy and oversees the Agricultural Development Fund. The board distributes 50% of the state monies received from the tobacco Master Settlement Agreement. In 2007, the board distributed $23.3 million to projects and organizations throughout the state with the goal of increasing net farm income and creating sustainable new farm-based business enterprises.45 The Ag Development Board has been a primary source of innovation and a unique resource for farmers in Kentucky.
Kentucky Agricultural Council In December 2007, the Kentucky Ag Council’s Task Force on the Future of Agriculture
released its report, “A Pathway for Kentucky’s Agriculture and its Rural Communities: 2007 to 2012 Strategic Plan.” The report represented the work of a statewide planning process to set a common agenda for agriculture across the state.46
The two overarching goals of the plan are very similar to the goals of this study: to increase net income of farm households across the Commonwealth and to strengthen the quality of life in rural communities. The plan identifies the need to diversify the farm economy as central to its message. Accomplishing this involves promoting additional livestock production and a broader array of crop farming that may include horticulture, forestry, and biofuels, in addition to traditional fruits, vegetables and grains. Kentucky must also look to promote other nontraditional forms of farming such as aquaculture and development of agri-tourism.
Other organizations KDA maintains a list of agricultural links on its website that includes dozens of state-wide
and national organizations (http://www.kyagr.com/forms/aglinks.htm). A few that emerged often during the research of this project include:
Community Farm Alliance
Community Farm Alliance (www.communityfarmalliance.org) is a grassroots membership organization with over 2,000 members in 75 Kentucky counties. CFA is based in Lexington and has an office in Louisville. The organization creates farmers’ markets in underserved urban communities, develops Farm-to-Cafeteria programs that link local farmers with institutional buyers, promotes family farm-friendly policies at the state level, and bills itself as providing “a grassroots voice for Kentucky’s citizens–farmer and non-farmer, urban and rural alike–on farm, food, and economic issues.” In Louisville, CFA helped establish the Smoketown-Shelby Park Farmers’ Market and produced a community food assessment for West Louisville. It helped establish Urban Fresh, which provides entrepreneurial opportunities for youth in West Louisville through the creation of urban farm stands. The group has also been interested in developing a food processing facility in West Louisville.
45 http://agpolicy.ky.gov/board/documents/08%20Annual%20Report.pdf 46 http://www.kyagcouncil.org/images/KAC_2007_to_2012_Strategic_Plan_1_.pdf
Final Report: Building the Local Food Economy, Louisville, Kentucky Page 61 Market Ventures, Inc./Karp Resources 7/17/2008
Kentucky Women in Agriculture
Founded in 1999 and incorporated in 2003, Kentucky Women in Agriculture (KWIA) (http://www.kywomeninag.com) seeks to promote agriculture in Kentucky, women within the agriculture industry, and agricultural products. They produce a quarterly newsletter devoted to educating members about and engaging members in agriculture-related policy and legislation and farm-based entrepreneurial endeavors. The organization hosts an annual conference, attended by several hundred people.
Another of the organization’s objectives is to prepare members for leadership roles in agriculture at county, state and national levels. Two members of the organization served on the state’s Agriculture Task Force, charged with creating a strategic plan for agriculture in Kentucky.
Partners for Family Farms
Based in Lexington, Partners for Family Farms (http://www.partnersforfamilyfarms.org) works “to sustain farm life and farmland.” The organization creates educational materials about agriculture’s economic impacts, supports farm diversification, links farmers and consumers, educates buyers and policy-makers about purchasing local products, and develops classroom projects on agriculture and the environment.
Partners for Family Farms partnered with Kentucky State University and Heifer International to build a mobile poultry processing facility and supported the Cynthiana-based meat processor C&W in upgrading from a state-inspected to a USDA-inspected facility. Recent work has included coordinating special events in support and promotion of the Lexington Farmers’ Market; working to structure a catering bid process for the 2010 Alltech World Equestrian Games which stipulates that menus must reflect Kentucky culinary heritage and that ingredients be purchased locally whenever possible; and partnering with Cooperative Extension to educate farmers about large retailers’ needs and expectations.
Kentucky Vegetable Growers Association Established in 1970, the Kentucky Vegetable Growers Association (http://kyvga.org) is a
non-profit organization dedicated to bringing together growers, researchers and others interested in vegetable production. The Association seeks to promote Kentucky-grown produce, encourage young people to work in the vegetable industry, and support and guide the University of Kentucky’s research activities. Each year, the association partners with the Kentucky Horticulture Society and Vineyard Society to host an annual meeting and conference in Lexington.
Kentucky Horticulture Council
The Kentucky Horticulture Council is a consortium of 13 agricultural associations dedicated to promoting Kentucky horticulture and working together on common issues and problems.47 In
47 John Strang presentation, KY Fruit and Vegetable Conference, January 2008.
Final Report: Building the Local Food Economy, Louisville, Kentucky Page 62 Market Ventures, Inc./Karp Resources 7/17/2008
recent years, the Council has received funding from the Agricultural Development Fund for variety trials, demonstration projects, and marketing assistance for farmers.48
Conclusion: Kentucky Agriculture Snapshot
The primary findings from the snapshot of Kentucky agriculture include:
• The overwhelming number of small farms throughout the state and within the Louisville region
• The trend toward direct marketing, including farmers’ markets
• The prominence of the cattle industry, the growth of the small meat and poultry sectors, and the relatively small size of the fruit and vegetable sector
• The close connection Kentucky citizens feel toward farming and agrarian life, even though most residents live in urban areas
• The wide variety of government, university, and nonprofit support systems and resources
48 http://www.ca.uky.edu/AGC/Magazine/2005/spring2005/Articles/htmlfiles/farmershope.htm
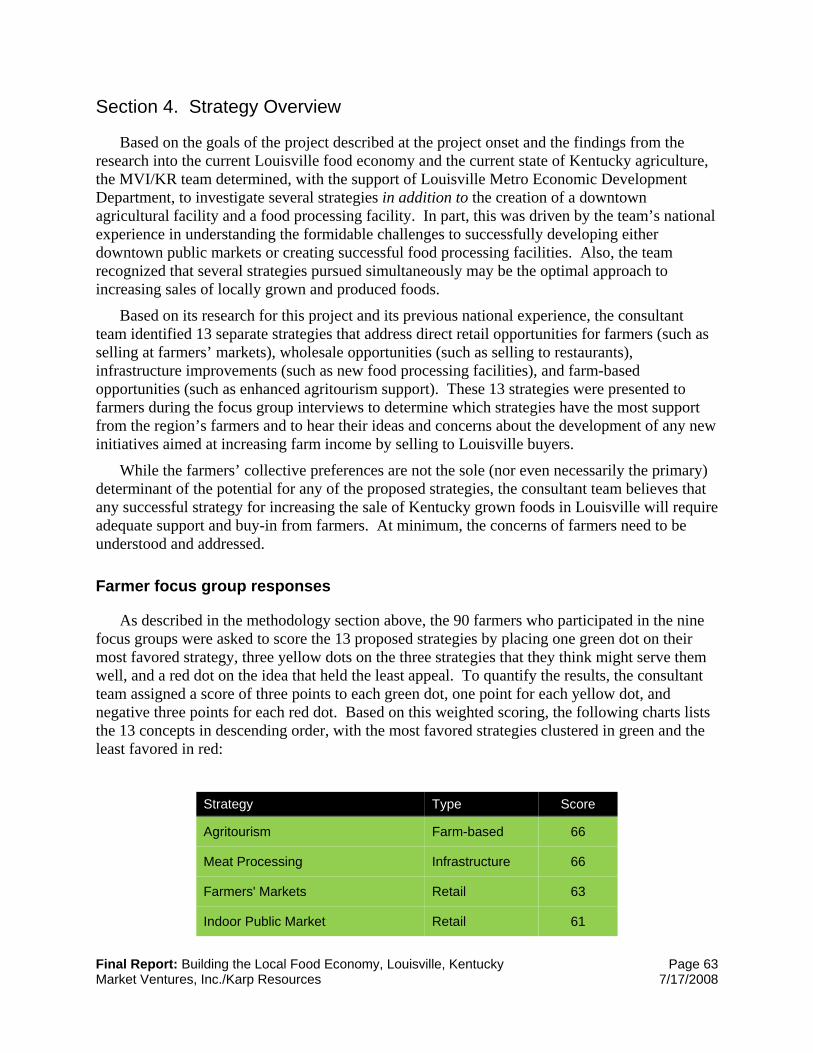
Final Report: Building the Local Food Economy, Louisville, Kentucky Page 63 Market Ventures, Inc./Karp Resources 7/17/2008
Section 4. Strategy Overview
Based on the goals of the project described at the project onset and the findings from the research into the current Louisville food economy and the current state of Kentucky agriculture, the MVI/KR team determined, with the support of Louisville Metro Economic Development Department, to investigate several strategies in addition to the creation of a downtown agricultural facility and a food processing facility. In part, this was driven by the team’s national experience in understanding the formidable challenges to successfully developing either downtown public markets or creating successful food processing facilities. Also, the team recognized that several strategies pursued simultaneously may be the optimal approach to increasing sales of locally grown and produced foods.
Based on its research for this project and its previous national experience, the consultant team identified 13 separate strategies that address direct retail opportunities for farmers (such as selling at farmers’ markets), wholesale opportunities (such as selling to restaurants), infrastructure improvements (such as new food processing facilities), and farm-based opportunities (such as enhanced agritourism support). These 13 strategies were presented to farmers during the focus group interviews to determine which strategies have the most support from the region’s farmers and to hear their ideas and concerns about the development of any new initiatives aimed at increasing farm income by selling to Louisville buyers.
While the farmers’ collective preferences are not the sole (nor even necessarily the primary) determinant of the potential for any of the proposed strategies, the consultant team believes that any successful strategy for increasing the sale of Kentucky grown foods in Louisville will require adequate support and buy-in from farmers. At minimum, the concerns of farmers need to be understood and addressed.
Farmer focus group responses
As described in the methodology section above, the 90 farmers who participated in the nine focus groups were asked to score the 13 proposed strategies by placing one green dot on their most favored strategy, three yellow dots on the three strategies that they think might serve them well, and a red dot on the idea that held the least appeal. To quantify the results, the consultant team assigned a score of three points to each green dot, one point for each yellow dot, and negative three points for each red dot. Based on this weighted scoring, the following charts lists the 13 concepts in descending order, with the most favored strategies clustered in green and the least favored in red:
Strategy Type Score
Agritourism Farm-based 66
Meat Processing Infrastructure 66
Farmers' Markets Retail 63
Indoor Public Market Retail 61
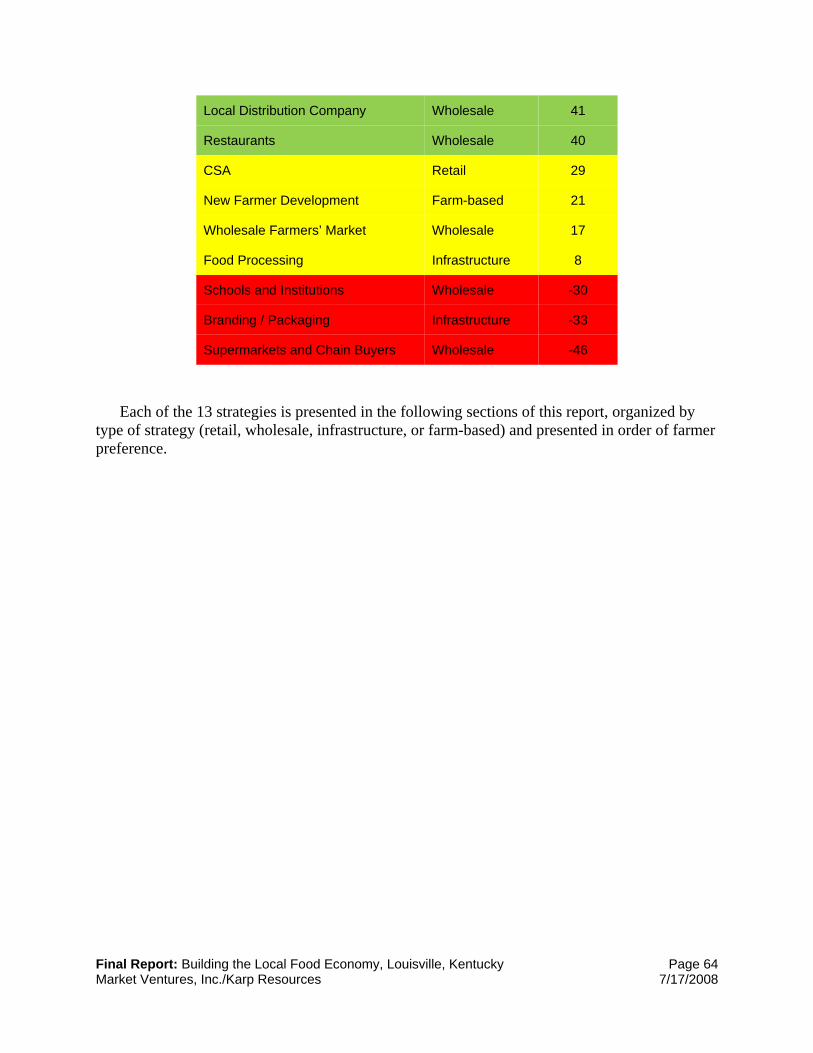
Final Report: Building the Local Food Economy, Louisville, Kentucky Page 64 Market Ventures, Inc./Karp Resources 7/17/2008
Local Distribution Company Wholesale 41
Restaurants Wholesale 40
CSA Retail 29
New Farmer Development Farm-based 21
Wholesale Farmers’ Market Wholesale 17
Food Processing Infrastructure 8
Schools and Institutions Wholesale -30
Branding / Packaging Infrastructure -33
Supermarkets and Chain Buyers Wholesale -46
Each of the 13 strategies is presented in the following sections of this report, organized by type of strategy (retail, wholesale, infrastructure, or farm-based) and presented in order of farmer preference.

Final Report: Building the Local Food Economy, Louisville, Kentucky Page 65 Market Ventures, Inc./Karp Resources 7/17/2008
Section 5. Retail Strategies
Farmers’ markets coordination, expansion and marketing
Overview In 2007, seventeen farmers’ markets operated in Louisville; the consultant team identified 20
that will operate in 2008. These markets are operated independently and are often located in church parking lots. New farmers’ markets could be created, including, perhaps a centrally located one in the downtown. Additional efforts could go toward promoting or strengthening the markets in other ways, through better coordination or centralization of management and increased marketing.
Opportunity While Louisville has a large and growing number of farmers’ markets, sales at the markets
represent a tiny fraction of the foods sold in the city. Most of the markets are small and young, and they operate only one or two days per week for a fairly limited season.
Farmers in the focus groups ranked this strategy highly: third out of 13. Research conducted by UK agricultural economists has found that farmers throughout Kentucky are increasingly utilizing farmers’ markets as a key marketing channel, in part because they can receive premium prices for their products. For example, a UK study found that consumers were willing to pay over 50% more for fresh blueberries at a farmers’ market compared to the prices for local, hand-picked blueberries at a supermarket.49 The interaction between farmers and consumers at farmers’ markets also responds the emotional attachment that Kentucky residents feel to local farms.
The expansion and improvement of farmers’ markets can happen in a variety of ways:
• Expansion of the customer base through increased marketing and improved customer experience
• Strengthening of the tenant mix, including recruitment of additional farmers with new and complementary products
• Longer operating seasons
• Additional days of operation
• Linkages with CSAs or wholesale opportunities to occur on-site at the farmers’ markets
• Addition of signage around sites
• Enhanced management capacity and political voice to address concerns as they arise, such as site retention and parking
• City-wide planning for expansion, including development of a larger downtown farmers’ market (which may or may not be part of a year-round indoor public market facility)
49 http://www.uky.edu/Ag/HortBiz/pubs/ky_blueberry.html

Final Report: Building the Local Food Economy, Louisville, Kentucky Page 66 Market Ventures, Inc./Karp Resources 7/17/2008
• Expansion of the state-run Farmers’ Market Nutrition Program to include farmers’ markets in Louisville
A number of successful farmers’ market organizations operate in cities around the country. One good example is Greenmarket in New York City, which was established in 1976 and currently operates farmers’ markets at 46 sites in all five boroughs, including several year-round markets. Another is Marin Farmers’ Markets, which operates seven certified farmers’ markets in seven different communities in the San Francisco North Bay area. Centralized organizations that run many markets have resources to provide professional management, consistency in recruitment, efficient methods to verify grower practices, common rules, broad-based fundraising efforts, marketing programs that benefit all the markets, and boards of directors and professional staffs that advocate for the markets on a city- and state-wide basis.
Strategy Louisville has a strong tradition of independent farmers’ markets and there has been limited
collaboration between them. Active Louisville, through the Family and Communities Committee of the Mayor’s Healthy Hometown Movement, has made efforts recently to bring the volunteer market managers together to address common concerns and create a guide to all the farmers’ markets. Any efforts to encourage increased centralization of the farmers’ markets must recognize the independence that has guided the farmers’ markets to date and should build on the recent efforts to encourage greater cooperation.
The ability to significantly expand the amount of Kentucky grown foods sold at farmers’ markets will benefit from the creation of an organizational and management infrastructure that drives that growth. However, the value of professional management and marketing services will need to be proven to the participating farmers and the sponsoring organizations. Therefore, it is recommended that an initial investment be made to support marketing and farmers’ market coordination for a 3-5 year period. Representatives from the various markets should be encouraged to participate in a coordinating body that works to develop common rules and a marketing program, assisted by a professional marketing firm. The markets should also begin to systematically collect information about farmer participation, sales, and customer attendance, in order to track change over time.
A farmers’ market coordinator will need to have strong interpersonal skills and relate well and gain the respect and trust of farmers, customers, and market leadership. Ideally this person will have some connection to existing farmers’ markets in Louisville and know the farmers, and will be both facilitative and forward thinking, plus deeply committed to the success of the farmers’ markets.
Over time, the value of increasing sales for farmers should be reflected in higher charges for rent and marketing fees, which will allow this strategy to be self sustaining following an initial investment period. At present, the cost of participation for farmers is very low. At the Bardstown Road Farmers’ Market, for example, vendors are required to pay an annual fee of $100 and then pay $5 per day. A farmer who sells each market day over the full season (April to December) would pay total fees of $480. Assuming this farmer grosses $800 per day, then gross sales would be $60,800 over the course of the season and rents would equal a miniscule 0.8% of

Final Report: Building the Local Food Economy, Louisville, Kentucky Page 67 Market Ventures, Inc./Karp Resources 7/17/2008
sales. Even if the farmer came to only half of the market days, rents would still equal less than one percent of sales.
Following this start-up period, the farmers’ markets should work toward more consistent rental fees that reflect that value of different sites and which pay for the cost of management and marketing. One system in place at other farmers’ markets is a fee scheme based on a percentage of gross sales, up to a maximum per day. This system requires self-reporting of sales but managers who have this system, including the Arlington Farmers’ Market in Arlington, Virginia, report that participating farmers prefer this arrangement and participate willingly.
If rent is set at 3% of sales and the average farmer has gross sales of $800 per day, daily rent would be $24. Rent could be capped at $50 per day (daily sales of $1,667). Applied to an average of 20 farmers per market day over the course of a season, this would result in $36,480 in income to the farmers’ market, compared to $9,600 per year for the same number of farmers with the current rental structure at Bardstown Road. Spread over the city’s 20 farmers’ markets, this approach would generate income of nearly $340,000, which would provide the financial basis for full time management and a robust marketing program.
Potential impact As described above, annual farmer revenue in Louisville’s 20 farmers’ markets is estimated
at $3.6 million. Assuming improved marketing and operations could expand sales by 20%, this would mean $720,000 in additional sales for Kentucky farmers. Based on these estimates, average sales for farmers are currently about $180,000 per farmers’ market. Adding five new farmers’ markets could mean $1.08 million in additional sales to Kentucky growers. Together, increasing per market sales and adding new markets could offer nearly $2 million in sales to regional farmers.
In addition to farmer sales, additional open-air farmers’ markets can have a very positive impact on surrounding properties and their neighborhoods. Farmers’ markets have a proven ability to bring a wide variety of people to a place and create a convivial setting. They also encourage consumption of fresh fruits and vegetables and often feature organically grown items.
Create a year-round, indoor public market in downtown
Overview A number of cities around the country have indoor public markets that feature fresh and
prepared foods grown in the region. Some are historic, such as Findlay Market in Cincinnati, Soulard Market in St. Louis, and Pike Place Market in Seattle, while some are new, such as the Milwaukee Public Market, Ferry Plaza Market in San Francisco, and Chelsea Market in New York. Public markets can be as small as 8-10 vendors or as large as 80 or more vendors, usually selling a mix of fresh and prepared foods. Sometimes these markets have day tables or seasonal outdoor spaces that farmers can rent to sell directly. The lease holders inside the market are sometimes but not usually farmers.
Final Report: Building the Local Food Economy, Louisville, Kentucky Page 68 Market Ventures, Inc./Karp Resources 7/17/2008
Public markets are typically envisioned as a vibrant market hall or district where independent, locally-owned businesses feature food from the region, with an emphasis on fresh produce, meat, poultry, seafood, baked goods, dairy, and specialty food items, plus prepared food for both take-out and to eat on-premises. Some public markets also have a strong wholesale or food production component. Public markets create an important public place within the community, where residents of the city, the region, and tourists all mingle in an architecturally compelling space. The best public markets feature unique foods that come from local producers, whether selling fresh produce, cheese or meat from local farms, or foods that are made within the market such as baked goods, chocolate or candies, and ice cream.
Public markets can also be centralized places to promote local foods and educate both consumers and producers about food, food systems, sustainable growing practices, health, nutrition and fitness, and related topics. Many public markets have demonstration kitchens and extensive classroom instruction programs, and some host television programs. Special events at public markets typically focus on harvest or holiday festivals and other food-themed concepts, helping to educate people about where their food comes from and how it is grown while celebrating the region’s food traditions and bounty.
Key considerations
Mission
Public markets are mission-driven developments. Typically, the mission of a public market includes:
1. Supporting regional farmers and food producers by providing a year-round marketing venue
2. Providing opportunities to small, independent businesses
3. Helping to revitalize the downtown area by attracting residents and tourists
4. Celebrating a region’s food culture
The mission of a public market in Louisville will need to be determined based on the specific goals of its developer/sponsor and, to some degree, its location.
Feasibility definition
In most communities, the initial costs of developing a public market, including land, are paid by public or philanthropic funds, with the assumption that the public market will not carry debt service. The test of financial feasibility therefore is whether the market can operate without subsidy following a reasonable start-up period, typically chosen to be three years. The public benefits of the market, including community revitalization, small business development, support of local agriculture, access to fresh foods, and job generation, are usually seen as the “return” for the public or philanthropic investment. To be economically feasible, therefore, market tenants must be able to operate profitably and pay rents that will cover all of the market’s cost of operations, including a cushion to pay for future capital maintenance needs.
Final Report: Building the Local Food Economy, Louisville, Kentucky Page 69 Market Ventures, Inc./Karp Resources 7/17/2008
Success factors
Through its work researching and analyzing public markets over the past 20 years, MVI has identified five critical factors that help explain public market success. They include:
A great site. Like all retail, location is a critical factor. While not every successful public market might have the following site characteristics, a great public market site is:
• Easily accessible to the entire region (physically and psychologically)
• Visible from highways or major thoroughfares
• Has easy circulation around and through the site
• Provides pedestrian access and generally is in close proximity to downtown
• Offers lots of free, at-grade parking and is near public transportation
• Within a supportive neighborhood context, particularly other independent local businesses, including food businesses and restaurants, and room for an outdoor farmers’ market and public space
Environment. Public market architecture includes both the building shell and the design of each tenant space. Historically, many cities perceived their public markets as important works of civic architecture. A great public market environment is:
• A place people want to be and a comfortable public space that welcomes all elements of
the community
• A landmark structure
• A facility with well designed stalls and infrastructure that support small food retailers
• An environment that provides a rich sensory experience of sights, sounds, smells, and tastes.
• A place that offers customer amenities such as comfortable seating areas and clean restrooms
Culture of public market shopping. Communities throughout the country are awakening to the
benefits of buying locally grown foods. Some communities have developed a culture of public market shopping, with residents who are willing to make it a spending priority and go out of their way to purchase locally grown food.
Professional management. Well-run public markets require highly skilled professional
managers who focus on achieving the market’s mission, supporting the vendors, and ensuring customers have a positive shopping experience. Some of the critical roles that management plays include:
• Property management (including cleaning, security, maintenance, vendor coordination,
and rules enforcement)
Final Report: Building the Local Food Economy, Louisville, Kentucky Page 70 Market Ventures, Inc./Karp Resources 7/17/2008
• Customer service
• Vendor recruitment
• Small business assistance
• Marketing (including advertising, special events/promotions, public relations, education, Internet, and consumer research)
High-quality vendors. The most important determinant of a public market’s long term success is the quality of its vendors. Once the developer of a public market has “set the stage” for the public market in terms of its site, facility and management team, it is the vendors who become “the show.” Their ability to offer high quality and unique products, as well as superior services, will determine whether a sufficient customer base is established over time. Some factors that lead to success as a vendor include:
• Owner-operated businesses – the best merchants in public markets own and operate their
own businesses; national chains are generally not allowed and even regional franchises are discouraged. Owner-operators offer customers the most knowledgeable and attentive service, as well as the accountability that only an owner can provide. As a result, public markets are centers of small business activity, providing opportunities for low-capitalized entrepreneurs. Great personalities are a key to creating loyalty with customers. To compete successfully with supermarkets and chain groceries, vendors within a public market must take advantage of their principal competitive advantage: themselves.
• Farmers and food producers – the presence of farmers and food producers within a public market – and a bounty of locally grown foods – helps differentiate the experience of shopping at a public market with other retail venues. Local, farm-fresh foods make the market authentic. Vendors who create their own products further ensure the uniqueness of the public market shopping experience.
Recently developed public markets have faced challenges in charging adequate rents to cover the full costs of management without overly burdening the vendors. This problem is particularly acute when the entire cost of management must be paid by relatively few vendors within a single public market hall. This problem can be mitigated by developing a multiple-use market district concept, integrating retail, wholesale, food production and nonfood uses and services, and spreading the cost of management over more leasable area. These “public market districts,” such as Pike Place Market and Granville Island Public Market, are more complex to develop but can offer a more robust shopping environment and be more efficient operations.
Opportunity
Farmer interest
Farmers in the focus groups ranked this strategy highly: fourth out of 13. The farmers in the focus groups appeared to be knowledgeable about public markets in other cities and felt a public market would be a good place to showcase and sell their products, although generally not as full-time vendors.

Final Report: Building the Local Food Economy, Louisville, Kentucky Page 71 Market Ventures, Inc./Karp Resources 7/17/2008
Potential customer demand
Demand analysis consists of defining the market’s trade areas, evaluating the demographics of the residents of the different trade areas, and analyzing buying behavior in order to estimate potential expenditures for the different products sold in the market. Both the experience of other public markets and the characteristics of Louisville help shape the trade area decision.
A few general comments can be made about the differences between public markets and supermarkets:
• Public markets compete with the modern supermarket and other retail food outlets for
consumers’ patronage by providing a shopping environment unlike the typical American retail experience, with individually owned businesses linked to the region’s food and agriculture and inviting public spaces.
• While supermarkets strive to obtain a large percentage of the expenditures for food within a small geographic area, downtown public markets realize a small percentage of these expenditures from a much larger area. The trade area of a downtown public market is generally much larger than a supermarket’s.
• It is typical for customers to drive 20 to 30 minutes to shop at a large, successful public market, even if most of their food shopping can be done more conveniently at supermarkets within several minutes of their homes.
• Tourists often seek out authentic public markets because they are unique places, offering a window into the culture of the region where they are located. Maintaining authenticity requires catering first to the needs of area residents, not tourists, which is often a challenging balance for public markets.
According to research that Market Ventures, Inc. has conducted at other downtown public markets, public markets attract a wide range of shoppers in terms of age, ethnicity, and income level. In general, families buy more fresh food than individuals or people living in unrelated households, and people with higher income levels ($50,000 and above) are more frequent shoppers and spend more than people with lower incomes. The highest spending customers are typically women between the ages of 40 and 55. What is unique about public markets, however, is their ability to appeal to both the highest income shoppers and lower income shoppers. While higher income shoppers might be drawn by unique products and superior quality, lower income and elderly shoppers appreciate the ability to purchase smaller quantities, the ability to negotiate with empowered owners, ethnic specialties, and competitive prices.
A downtown public market can be expected to draw from three trade areas:
1. The neighborhoods in close proximity to downtown, for which the public market will be as convenient as other supermarkets or grocery stores (approximately a three mile radius). Depending on where the market is located, this is generally the area within I-264.
2. The area outside of I-264 and the rest of Louisville.
3. The Louisville metropolitan area outside of the city, including southern Indiana.
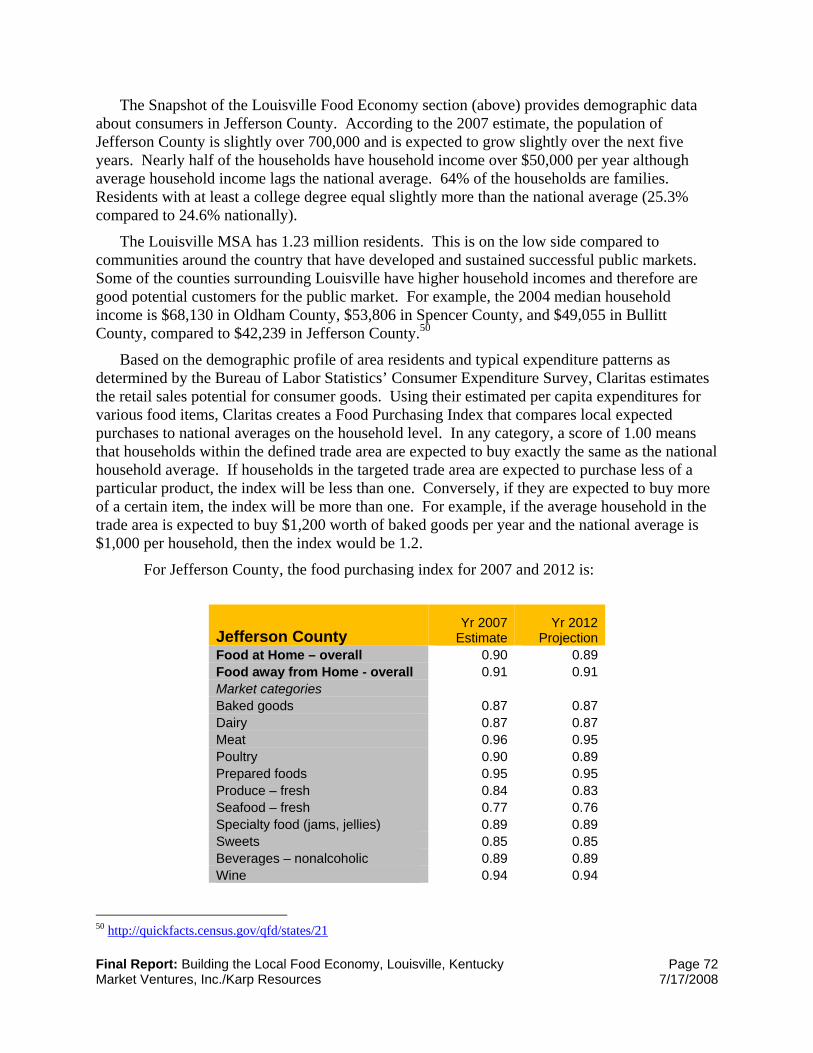
Final Report: Building the Local Food Economy, Louisville, Kentucky Page 72 Market Ventures, Inc./Karp Resources 7/17/2008
The Snapshot of the Louisville Food Economy section (above) provides demographic data about consumers in Jefferson County. According to the 2007 estimate, the population of Jefferson County is slightly over 700,000 and is expected to grow slightly over the next five years. Nearly half of the households have household income over $50,000 per year although average household income lags the national average. 64% of the households are families. Residents with at least a college degree equal slightly more than the national average (25.3% compared to 24.6% nationally).
The Louisville MSA has 1.23 million residents. This is on the low side compared to communities around the country that have developed and sustained successful public markets. Some of the counties surrounding Louisville have higher household incomes and therefore are good potential customers for the public market. For example, the 2004 median household income is $68,130 in Oldham County, $53,806 in Spencer County, and $49,055 in Bullitt County, compared to $42,239 in Jefferson County.50
Based on the demographic profile of area residents and typical expenditure patterns as determined by the Bureau of Labor Statistics’ Consumer Expenditure Survey, Claritas estimates the retail sales potential for consumer goods. Using their estimated per capita expenditures for various food items, Claritas creates a Food Purchasing Index that compares local expected purchases to national averages on the household level. In any category, a score of 1.00 means that households within the defined trade area are expected to buy exactly the same as the national household average. If households in the targeted trade area are expected to purchase less of a particular product, the index will be less than one. Conversely, if they are expected to buy more of a certain item, the index will be more than one. For example, if the average household in the trade area is expected to buy $1,200 worth of baked goods per year and the national average is $1,000 per household, then the index would be 1.2.
For Jefferson County, the food purchasing index for 2007 and 2012 is:
Jefferson County Yr 2007
EstimateYr 2012
Projection Food at Home – overall 0.90 0.89 Food away from Home - overall 0.91 0.91 Market categories Baked goods 0.87 0.87 Dairy 0.87 0.87 Meat 0.96 0.95 Poultry 0.90 0.89 Prepared foods 0.95 0.95 Produce – fresh 0.84 0.83 Seafood – fresh 0.77 0.76 Specialty food (jams, jellies) 0.89 0.89 Sweets 0.85 0.85 Beverages – nonalcoholic 0.89 0.89 Wine 0.94 0.94
50 http://quickfacts.census.gov/qfd/states/21

Final Report: Building the Local Food Economy, Louisville, Kentucky Page 73 Market Ventures, Inc./Karp Resources 7/17/2008
In all cases, these scores are below one, suggesting that household expenditures will be below national averages. In several cases, the scores are well below one, such as seafood at 0.77 and fresh produce at 0.84. Meat ranks highest at 0.96. These indexes are expected to stay flat or dip slightly between 2007 and 2012. These low scores are certainly influenced by the small size of households in this trade area and low household incomes, as well as local food preferences.
Public markets in other communities capture about 0.5-2% of the demand for fresh foods from their immediate trade area and smaller percentages from their larger trade area. The consumer expenditures for foods typically sold in a public market for Jefferson County equal $1.306 billion (see above). A 0.75% market share within Jefferson County would result in demand potential of $9.8 million. Customers would also be expected from outside Jefferson County; 30% additional sales to these residents would bring total demand to $12.7 million. Sales to tourists can also be significant, depending on the site’s location. Assuming another 20% sales to tourists, potential demand would equal $15.3 million.
Based on the sales estimate of $15.3 million and average sales per square foot of $750 (a level that should ensure vendors’ profitability), downtown Louisville is be able to support a public market of about 20,400 net leasable square feet. Based on a typical efficiency factor of 66%, the gross area of the public market is therefore 31,000 square feet.
Market vendors and farmers will benefit from several other sources of demand for their products in the public market. Both market farmers and merchants will be positioned to establish accounts with restaurants and other wholesale buyers, and market management should help promote and facilitate this process. In other public markets, many vendors use their market stalls as a base for catering and corporate sales, which can be highly profitable. The public market provides a high-profile location to create or promote a food business, which can lead to other store locations and sales opportunities. Web-based sales are also an emerging practice among public market vendors. A store in a public market with an e-commerce web site allows a vendor to have both a real and a virtual presence, linked to the public market’s own web site.
Vendors
Attracting an enticing mix of capable vendors is often the most critical challenge of creating and sustaining a successful public market. Together with the right location, properly designed and developed facilities, skilled management, and effective marketing, it is the individual vendors who will determine whether the needs of customers are met and if customers will make the market a regular part of their shopping routine. Once the public market opens, the vendors control most of the market’s destiny.
The consultant team met with several food businesses in Louisville that expressed interest in being public market vendors and which had sufficient business experience to make them good candidates. The public market will require aggressive vendor recruitment and leasing to attract the most qualified vendors. A careful balance will need to be struck between charging enough in rents to cover operating costs and keeping rents low enough so vendors can achieve profitability.
Sites
Several potential sites were examined in the downtown area, including the planned Museum Plaza tower (which had been identified in the original RFP for this project) and the former

Final Report: Building the Local Food Economy, Louisville, Kentucky Page 74 Market Ventures, Inc./Karp Resources 7/17/2008
Disney Tire building on East Jefferson Street between Shelby and Clay. As discussed above, a great site will be:
• Easily accessible to the entire region (physically and psychologically)
• Visible from highways or major thoroughfares
• Have easy circulation around and through the site
• Provide pedestrian access and be close proximity to downtown
• Have lots of free, at-grade parking
• Offer a supportive context, particularly other independent local businesses, including food businesses and restaurants, and room for an outdoor farmers’ market and public space
The demand analysis suggests that the retail component of a public market in Louisville can be up to 31,000 gross sf.
Management
A strong management team is a critical determinant of a public market’s long term success. Public markets are management-intensive operations: market managers need to understand how each business inside the market operates, understand the market’s customers, find replacement tenants if any leave the market, and take the steps that lead to profitability for both merchants and the market as a whole.
Among the myriad tasks that management undertakes, some of the most important include recruiting vendors and farmers; developing and monitoring leases; keeping the site clean and in good operating condition; providing information and assistance to merchants (including statistical analysis from the integrated cash register system); marketing, public relations, and educational activities; and customer relations. The management team must also perform accurate budgeting and bookkeeping and provide timely reports to the market’s sponsoring entity.
Most public markets around the United States operate on either a six or seven day per week schedule. Today, Sunday has become the busiest shopping day in supermarkets. Saturdays are generally the busiest days for public markets. A public market in Louisville should operate either on a six or seven day schedule, with Monday or Tuesday being the day of closure.
Financial analysis The mix of vendors, the size of their stalls, sales potential, and operating costs will be highly
dependent on the location and building characteristics. An initial, generic set of proposed businesses for a public market is included in Appendix F. A vendor pro forma includes estimates for annual sales, cost of goods, rents, and tenant allowances for this set of 23 vendors. A three year generic operations pro forma provides an initial suggestion of the income and expenses that a public market might face in Louisville. This financial analysis will need to be refined for a particular site if one is identified.
Final Report: Building the Local Food Economy, Louisville, Kentucky Page 75 Market Ventures, Inc./Karp Resources 7/17/2008
Strategy Given the somewhat small population base in Louisville and the challenge of finding
experienced retail vendors, the concept for a downtown public market should integrate elements of both a combination wholesale/retail environment and a market district. Integrating food businesses that have a strong wholesale trade and creating a facility that supports wholesaling and food production in addition to retail will provide a better foundation for a public market than a retail-only facility. The market district concept seeks to brand a variety of buildings and public spaces as the public market and has common management and marketing that ties the various properties together.
In most communities, public markets have required public and philanthropic investment to offset the costs of development – in very few cases have they carried any debt service or been expected to generate a financial return from the initial capital. In Milwaukee, for example, the public market attempted to raise all the costs of development (about $11 million) in advance of opening day. The project received $2 million in federal funding through the US Department of Health and Human Services as well as about $1 million from city and state sources. Local philanthropies and individuals donated $6 million. They fell about $1 million short of their goal, which has made the first several years of operation challenging and led to a change in sponsorship. In Portland, Maine, the $9 million cost of developing the Portland Public Market and operating subsidies were paid for by a single philanthropist. An emerging source of capital is New Market Tax Credits, which were utilized with the new Midtown Global Market in Minneapolis.
In Louisville, several groups of private property owners have expressed interest in developing a public market in the downtown. In other cities, private developers have recently created public markets, including the Ferry Plaza Market in San Francisco and Chelsea Market in New York, although these are much larger cities that have strong food cultures and many high-quality, independent food retailers. If private developers understand the investment/return likelihood and are committed to achieving the types of public goals described above, then private developers should be encouraged to create a public market in Louisville. Based on the high potential return to Kentucky farmers and food producers from a successful public market, public investment to help subsidize development costs would be appropriate.
In addition to supporting development costs, there are a number of ways that local government can support the public market, even if a private development group takes the lead in development. These include assistance with:
• Promotion: local government can promote the public market through highway or other directional signage, on websites and promotional materials, and through coordinating special events to coincide with the public market’s marketing program.
• Education: Working with the public schools and other institutions, the city can support educational programs that take place in the public market.
• Health codes: Local health departments and other regulatory agencies must interpret how health codes will be applied to a public market. Rules that make sense for large format supermarkets are not always logical or appropriate for small retailers in a market
Final Report: Building the Local Food Economy, Louisville, Kentucky Page 76 Market Ventures, Inc./Karp Resources 7/17/2008
environment. Some health departments have shown flexibility in applying codes to public markets, enabling the small businesses to operate more efficiently.
• Farmer distribution infrastructure: the ability of farmers to supply the public market will depend in part on improvements to region’s distribution infrastructure. Efforts to improve distribution, such as the concept described below under Local Distribution Company, will help ensure adequate supply of local foods for the public market.
• Vendor financial support: small business loan programs and technical assistance can be very helpful to provide needed capital and skills to start-up vendors.
Potential impact A successful public market in downtown Louisville would provide a range of benefits to the
city and the farming community.
• Small business development and jobs. A public market with 24,300 sf of leasable area would typically have about 25 businesses. In addition to small business opportunities, the public market would support about 150 jobs, including the business owner-operators, staff, and market management.
• Sales of local foods. While all the foods sold in a public market over the course of a year are not locally grown or produced, our research has found that public markets can reasonably sell 60% locally grown products and this percentage can ratchet upward with concerted effort over time. Assuming the public market achieves $10 million in retail sales, this means the public market would sell $6 million worth of locally grown or produced foods. Assuming typical cost of goods of 55%, $3.3 million would go to regional farmers and food producers.
• Wholesale distribution. Depending how and where the public market is developed, it could have substantial wholesale and food production capacity in addition to retail sales. If wholesale transactions represent 1.5 times the retail sales ($15 million) and local foods equal 30% of the transactions, then $4.5 million of local foods would go through the public market. If 40% of this goes to the farmer, annual sales by Kentucky farmers would equal $1.8 million.
• Meat butchering/processing. Meat vendors in the public market could provide the butchering services that were identified as lacking in the region in order to supply restaurants as well as retail consumers.
• Opportunities for farmers. The public market could offer a range of opportunities for Kentucky farmers, including options for selling directly as vendors, day stalls, or in an outdoor farmers’ market, and for selling at the wholesale level to market vendors.
• Showcase for Kentucky foods. The public market can become a permanent showcase for Kentucky grown foods, introducing buyers from around the world to the many unique items produced by Kentucky farmers.

Final Report: Building the Local Food Economy, Louisville, Kentucky Page 77 Market Ventures, Inc./Karp Resources 7/17/2008
• Influence supermarkets. Supermarkets are typically great replicators. The success of a public market in Louisville will lead to redoubled efforts by area supermarkets to sell more local foods.
• Consumer education, arts and entertainment. The public market can be created with infrastructure that supports a variety of public education and arts activities, including programs on food, nutrition, health, civic society, and fitness, as well as music, arts and crafts. The market could be the physical centerpiece for the food and nutrition elements of the Mayor’s Healthy Hometown Initiative.
• Tourism destination. Public markets are proven destinations for individual and group tourists. With a variety of products for sale and programs on offer (including arts/entertainment and cooking classes), markets can function as a central hub and promotable destination.
• Great public space. The public market should create a great public space for the community, leading to revitalization in the area where it is located.
Community Supported Agriculture
Overview Community-supported agriculture, or CSA, is a practice by which a group of buyers share the
risk and benefits of food production with a farmer by becoming share holders in a season’s production, typically by paying for their farm share in advance. Approximately eight CSAs operated in Louisville in 2007, providing 450 farm shares. Efforts could be made to increase the number of CSAs, both focused on individual subscribers and on work places. There could also be efforts to create institutional CSAs, where the buyers are schools, hospitals, restaurants, and church congregations.
Opportunity Focus group participants responded favorably to this concept, ranking it seventh overall with
29 points. This is a strong showing considering not all focus group participants were previously aware of the concept. The strategy was particularly appealing for farmers raising a diverse range of produce, as well as for smaller-scale meat and poultry farmers interested in additional revenue from direct-to-consumer sales.
The response of the focus group supports the information gained from telephone interviews with CSA farmers in Jefferson County: CSA farming is not for everyone, though there is a large and growing consumer demand for those that can adopt the model.
CSA members are typically morally motivated consumers from a highly educated and affluent demographic. The upfront payment structure and the unknown makeup of the weekly share do not appeal to those consumers who prefer to see what they are buying. However, satisfied CSA members place a high value on knowing where their food is grown, how it is
Final Report: Building the Local Food Economy, Louisville, Kentucky Page 78 Market Ventures, Inc./Karp Resources 7/17/2008
grown, and who it is grown by. Because of this, annual turnover has been low for Louisville’s CSA farms and most have waiting lists.
For participating farmers, CSAs present unique challenges and rewards. Supplying shareholders with a wide range of items over the course of a season requires the knowledge and equipment to grow a diverse range of products, often more than 30 different types of vegetables each year. Farms committed to growing a diverse range of products often require a significant labor force, since growing limited areas of numerous products requires significantly more hand labor (for planting, cultivating and harvesting) than a more conventional farm growing a few crops on a larger scale. On the other hand, the CSA model provides farmers with start-up capital when they need it to cover planting costs, provides a financial foundation to plant additional acreage for retail or wholesale sales, and provides a personal connection to the consumers who appreciate their efforts.
Nationally, the CSA model has evolved to include numerous forms. Wholesale models create a relationship were a farmers sell “institutional” shares to emergency food providers, restaurants, retailers or other wholesale buyers. These shares are typically made of larger quantities of a smaller number of crops. This provides a great opportunity for larger farmers interested in shifting to a CSA model, but lacking the broad range of products needed to satisfy traditional CSA customers. Similarly, institutional CSAs typically feature less exotic types of produce. Farmers can focus on the crops they know they can grow, with the knowledge that they have a ready market for their product. Descriptions of several national CSA models are found in Appendix E.
In addition to the potential impact of larger growers selling through institutional CSAs, there appears to be significant opportunity for more traditional CSA farmers in the region. Almost all of the CSA farmers run extensive waitlists and only a few expressed a desire to expand their operation. Citing labor issues and lifestyle choices, most of the established CSAs have reached a plateau in their membership capacity. Given the unmet demand, there is an opportunity to increase the number of new CSA farmers, primarily through recruiting and training new CSA farmers as well as providing resources and support for existing CSA farmers to aid expansion.
While Jefferson County CSA farmers report informal collaborations and support, there is an opportunity to build a stronger network for CSA farmers, customers, and allies. This idea has started with Louisville CSA (www.louisvillecsa.com), a new website run by a volunteer CSA member who lists information about Misty Meadows Farm, Field Day Family Farm, and the Family Farm Project Cooperative CSA (three of the largest and most established CSAs in the region). Currently the website provides Louisville area consumers with information about Community Supported Agriculture, local farmers’ markets, and local agriculture events and issues.51
Finally, there is the potential for greater member involvement in CSA farm operations. Many national models exist where CSA members are actively involved with numerous aspects of their CSA. In New York, the organization Just Food promotes a type of CSA that is ultimately managed by the members and acts as the “go to” organization for the forming of new CSAs and education and support services related to CSAs. A core group of volunteers does all of the
51 www.louisvillecsa.com

Final Report: Building the Local Food Economy, Louisville, Kentucky Page 79 Market Ventures, Inc./Karp Resources 7/17/2008
advertising, recruiting, payment collection, and organization. They write newsletters, provide recipes, and manage a broad range of tasks that allow the farmer to focus on growing premium products. While some CSA farmers in the project area reported having members help with some farming tasks, none had anywhere near as much customer involvement.
Strategy Recognizing the strengths and the weaknesses of the CSA model, the project team has
identified the following recommendations for specific areas where pointed efforts could strengthen and increase the amount of CSA shares sold to the Louisville region.
• Centralized and collaborative marketing with the proposed farmers’ market coordinator as well as additional support for and utilization of www.louisvillcsa.com and Local Harvest
• Partnering CSA farms with local emergency food providers, local businesses, and institutions (such as hospitals) to create institutional CSA shares
• Expanding the number of CSA farmers by investing in internship and apprenticeship programs
• Encouraging existing CSAs to expand their product mix to include meat and dairy—even if it is produced by other farmers
• Increasing member involvement
Potential impact Doubling the number of CSA shares in Louisville would result in $203,000 in new income
to Kentucky farmers. Creating 20 institutional shares at $3,000 per share would result in $60,000 in new income to Kentucky farmers.
Final Report: Building the Local Food Economy, Louisville, Kentucky Page 80 Market Ventures, Inc./Karp Resources 7/17/2008
Section 6. Wholesale Strategies
Local foods distribution company/expanded infrastructure
Overview A local foods distribution company would sell locally grown foods exclusively, most likely
working out of a warehouse in Louisville. The recently established Grasshoppers, LLC, which is farmer owned, is an example of this type of business. This concept might include helping a business like Grasshoppers expand, it might encourage the creation of a new company, or it might provide assistance to conventional produce distributors to carry more local foods or have a local foods division.
Opportunity Farmers in the focus groups were generally supportive of this concept. It received 41 points
and was ranked fifth out of the 13 concepts.
Local foods distribution companies can help fill the emerging demand for locally grown products by establishing strong linkages between farmers and wholesale buyers such as restaurants, retailers, and institutions. This can be a division of an existing food distribution company or a stand-alone entity.
Existing produce distributors in Louisville expressed support for the development of facilities that could serve as aggregation points. Some of them run empty trucks through farming areas and would readily stop to load their refrigerated trucks with local foods if there was a convenient location to do so.
Strategy The recent establishment of Grasshoppers and the development of locally grown lines by
large-scale distributors such as Horton’s (with their Grow Inc. label) suggest that no investments are currently needed to create a new business. Rather, the strategy should focus on creating the infrastructure that can support these existing ventures.
The critical “weak link” in the system appears to be places to aggregate and distribute products from farms in the region. Distributors said that they have trucks running throughout the region and often have room on their way back to Louisville, if there is a convenient place to pick up product.
The proposed strategy is to build cold storage facilities at centralized locations along established trucking corridors throughout the region, which would serve a large number of smaller farmers. Possible locations include Cooperative Extension facilities, which are usually centrally located and often have substantial space, good access and parking. The consultant team visited a number of these facilities over the course of the project. Many are new and have substantial property. With minimal facility improvement or additional infrastructure (in some cases simply the construction of a free standing exterior walk-in cooler), farmers could pay a
Final Report: Building the Local Food Economy, Louisville, Kentucky Page 81 Market Ventures, Inc./Karp Resources 7/17/2008
small fee to store their products there and private distributors could pick up their products on their way back to Louisville. Cooperative Extension staff could help coordinate the effort.
Efforts can also be made to support all existing (and any future) local distribution businesses equally through public education and marketing campaigns, tax incentives and other B2B benefits or incentives. Resources could be used for educating farmers and wholesale buyers about the varieties and quantities of local food available; purchasing or leasing more trucks; and perhaps providing tax incentives to businesses that support local farmers, such as energy or payroll credits.
Potential impact Additional research would be required to explore this concept in more detail. If five
aggregation points were strategically located in the region and could supply three trucks a week with 10 pallets per truck for 20 weeks, then these facilities would help facilitate the movement of 3,000 pallets of local food each year.
Start up costs would include planning/engineering, facility modification, equipment, and staff time. An initial estimate of capital costs, based on the assumption that the aggregation facilities could be located on donated property such as a county extension office and that the facility has adequate power to run the equipment, is about $90,000 per site.
Restaurants
Concept A number of Louisville restaurants are known for buying and serving locally grown foods
and many buy directly from Kentucky farmers. A restaurant promotion program could advertise those restaurants that buy locally and encourage more restaurants to do so. It could also provide information to help link interested growers with restaurant buyers.
Opportunity This concept appealed to farmer focus group participants. Of the 13 concepts presented,
promoting local food in Louisville restaurants ranked 6th.
As described above, there were 1,357 eating and drinking places in Jefferson County in 2002, including 442 full service restaurants. A subset of these, particularly the independent restaurants, would be the focus.
A local food and dining strategy would increase Louisville’s stature as a top class restaurant and dining city, focusing on regional identity of products grown and served in restaurants. This strategy would center on (1) raising awareness among consumers of foods produced in the region that are featured in restaurants, (2) make linkages between farmers and restaurant buyers, and (3) promote participating restaurants. Restaurant members of Louisville Originals would be a likely initial target for such a strategy.
In focus groups, farmers generally agreed that restaurants are a good market for farmers and seemed to view restaurants as separate from other wholesale buyers, because of chefs’ flexibility
Final Report: Building the Local Food Economy, Louisville, Kentucky Page 82 Market Ventures, Inc./Karp Resources 7/17/2008
in purchasing, willingness to experiment with new products, their willingness to pay for high quality items, and the potential for promoting the farm on the menu. Several producers noted that restaurants are excellent customers and promoters of small farms. While one producer expressed the wish that more restaurants would participate in KDA’s Restaurant Rewards program, another felt that restaurants “should stand on their own” without government investment. In almost every county, farmers expressed that they (universally, as farmers) need education on what restaurants want, how to talk to chefs, and how to make contact with them in the first place.
Several chefs expressed a wish that sourcing and procuring local foods were easier and felt that the KDA program was too cumbersome in its reporting and recordkeeping requirements compared to the benefits received by the restaurants or their customers.
Strategy There are several ways that a strategy to increase local foods in Louisville restaurants could
be accomplished. These include:
• Seek commitments from local restaurants to purchase at least 5% of their produce, meat and poultry, and dairy from local sources. Give higher levels of recognition or awards to restaurants that purchase 10%, 15% or higher from local farmers, and highlight the restaurants that achieve the highest percentages.
• Fund a “public interest broker” whose job is to broker deals that mutually benefit Kentucky growers and Louisville buyers (this concept is described in detail in the Schools and Institutions strategy section of this report).
• Develop and implement a “Certified Local Food” qualification system.
• Develop a public advertising campaign that encourages consumers to frequent restaurants that feature local foods. A likely ally to this effort is the Louisville Independent Business Association’s (LIBA), which seeks to preserve the unique character of Metro Louisville by promoting locally-owned businesses and educating citizens on the value of shopping locally. LIBA also offers group branding, promotion and advertising services to its membership. One way in which it does this is through its “Keep Louisville Weird” campaign.
Currently LIBA’s approach and membership are very focused on retail establishments and independent ownership. They are a natural fit to expand membership to food producers, processors and manufacturers by promoting independent restaurants and food businesses that source ingredients and products locally. Of the more than 60 businesses listed as members on their website, several are food companies, including Grasshoppers, Heine Brothers Coffee, and Blue Dog Bakery. www.keeplouisvilleweird.com
• Promote restaurants that feature local foods at events such as the Kentucky Restaurant Association’s annual Taste of Louisville event. In 2006, the Louisville Downtown Management District began organizing the Fleur De Licious, Louisville’s Restaurant Week, in which approximately ten participating downtown restaurants (including Proof on Main and Primo) offered 3-course prix-fix menus for under $35. A local food-focused restaurant week or Taste of Louisville event could be created as well, giving restaurants that already buy local
Final Report: Building the Local Food Economy, Louisville, Kentucky Page 83 Market Ventures, Inc./Karp Resources 7/17/2008
an opportunity to showcase what they do and other restaurants a high-profile opportunity to try out farmers’ products. Such events could offer opportunities to create networking events for farmers and chefs.
• Develop gas credits or other business tax benefits that provide an incentive to distributors to support purchasing and distribution of local foods. If connected with the efforts of a public interest broker, it would support the development of more producer-buyer direct relationships, and break through the “convenience” barrier which currently exists with year round suppliers of non-local foods.
• Inventory privately or publicly-held land to identify any potential sites for farms or gardens for restaurants and identify potential partners for this effort.
Implementation of the aggregation points strategy, discussed above, and other efforts to increase the supply and availability of locally grown foods on the wholesale level would support this restaurant strategy.
National Models
Slow Food NYC Snail of Approval - In the fall of 2007, New York City’s Slow Food convivium launched the “Snail of Approval” program as a way to recognize restaurants, food artisans and retailers for “their contributions to the quality, authenticity, and sustainability of the food supply” of the city. Slow Food members nominate businesses, and businesses are approved based on standards that include taste, procurement practices, freshness of ingredients, and production processes. Approved businesses can place the “Snail of Approval” sticker on their door or window—the sticker bears the Slow Food snail emblem. There are approximately 30 New York City restaurants with this designation. http://www.slowfoodnyc.org/programs/soa
Farm to Chef Express - A project conceived and launched by the Washington and Saratoga County Cornell University Cooperative Extension office, Farm to Chef Express links farmers and farm products from three upstate counties with chefs and restaurateurs in New York City. Farm to Chef provides aggregation, marketing, and distribution services for the area’s farmers. Originally launched in 2004 with a small grant from the New York State Department of Agriculture and Markets, Farm to Chef Express is now incorporated and offers chefs regular and reliable deliveries, an online ordering system that is accessible 24/7, and “one stop shopping” for meats and fresh produce. http://www.farmtochefexpress.org/
Potential Impact As described above, restaurants in Louisville buy about $25 million worth of produce each
year. If 10% of the city’s 442 full service restaurants (who do not currently buy this level of local foods) make local foods a 10% share of their annual purchasing, then Kentucky farmers would see new sales of produce of about $250,000. If 10% of Louisville restaurants made local meat/poultry purchasing 10% of their annual purchasing, then Kentucky farmers would see sales of about $500,000.
Final Report: Building the Local Food Economy, Louisville, Kentucky Page 84 Market Ventures, Inc./Karp Resources 7/17/2008
Wholesale farmers’ market
Overview A wholesale farmers’ market is a facility where wholesale buyers, such as restaurants,
retailers, distributors, and institutions, can buy directly from farmers in wholesale quantities. The Western North Carolina Farmers’ Market in Asheville is an example of a wholesale farmers’ market; typically they are co-located with distributors and sometimes offer retail sales, too. In Louisville, a wholesale farmers’ market could perhaps be co-located with the Produce Terminal Market, which is located near the airport. Typically these markets operate in the early morning hours and provide shed roofs or simple warehouse buildings for farmers to display their products.
Opportunity The concept received a lukewarm reception from the farmers in the focus groups: it was
ranked 9th of 13, with 17 points.
Many of the farmers currently running on-farm retail operations were interested in a wholesale farmers’ market as a place to buy Kentucky-grown products that would supplement products they grow or raise on their own farms. From this perspective, a wholesale farmers’ market would complement the growers’ interest in strategies that support their ability to remain on-the-farm, such as agritourism. Interestingly, these farmers did not see the wholesale farmers’ market as a place to sell their products but rather as a place to buy products from other farmers and therefore support their retail operations. This logic is consistent with the experience of other wholesale farmers’ markets around the country, where farmers with roadside stands are often important buyers on the market.
The restaurateurs and agriculture officials interviewed expressed a variety of views about the feasibility of a wholesale farmers’ market. Some of the restaurateurs said it was a good idea and would work; others thought that Louisville chefs were not yet ready for it. Some felt that the Produce Terminal Market was not a good location because it was too far from the bulk of the independent restaurants (although it is located only about 15 minutes from the downtown).
Strategy A successful wholesale farmers’ market would require both a strong nucleus of farmers to
sell at the market and an adequate number of regular wholesale buyers, such as restaurants, institutions, retailers, and others buying in wholesale (case or pallet) quantities. Based on the fairly weak reception of this idea from both sellers and buyers, it does not appear to be a viable strategy at this time as a stand-alone facility. However, elements of the wholesale farmers’ market concept could be integrated into other programs or facilities, such as the public market or existing open-air farmers’ markets. For example, several early morning hours could be devoted to wholesale transactions at one of the area’s farmers’ markets and advertised to the restaurant and retail community.

Final Report: Building the Local Food Economy, Louisville, Kentucky Page 85 Market Ventures, Inc./Karp Resources 7/17/2008
Schools and institutions
Concept
Jefferson County Public Schools is the largest school system in the state and “self‐operates,” that is, it cooks or prepares nearly all of its meals from a centralized facility rather than outsourcing this function to a private food service company. By contrast, the University of Louisville and the local hospitals, which also serve thousands of meals a day, contract with large food service companies. Both the public schools and the university are interested in utilizing more locally grown foods but are constrained by scale, costs, and health and safety regulations. One way to get more local foods into these institutions is through creating a “public interest broker,” a person or firm that is paid to play the role of a broker for local farmers.
Opportunity Throughout the country, there is increasing interest and experience in serving locally grown
foods in public institutions, including public schools. According to the National Farm to School network, there are currently 1,910 school districts and 8,354 schools in 38 states participating in farm-to-school programs, sourcing locally grown foods.52 Both Jefferson County Public Schools and the University of Louisville have expressed interest in purchasing more local foods but are faced with challenges due to issues of scale, cost and food safety. Nearly 100,000 meals per day are served between these two institutions alone. Their scale and operating model generally prevent individual farmers from selling directly to the school, as can be done with smaller institutions.
As described above, JCPS participates in the national school lunch program and thus receives set reimbursements from the federal government for each meal that it serves. A number of states supplement or match the federal reimbursement, particularly to support additional fruit and vegetable purchasing. In California, for instance, supplementary money is conditional upon the adoption and adherence to more strict nutritional standards. State reimbursement supplements vary, but $0.05 per meal is a common rate or policy target. Kentucky currently has no such school meal mandates or reimbursement match programs.
The University of Louisville’s twelve foodservice venues are operated by Chartwells. These numerous venues enable Chartwells to be flexible in the range of products and volumes they can accept from farmers. In the 2007-2008 school year, UofL amended the Chartwells contract to require the company to purchase at least 10% locally grown produce. Chartwells is working with its longstanding suppliers to help the University achieve this goal.
Among the farmers in the focus groups, this concept was third to last in popularity, receiving a score of -30. Its lack of popularity was based on farmers’ perception that schools’ and institutions’ pricing and volume needs were inappropriate for anything but the largest farms. While the focus group participants were generally not interested in supplying large public institutions, in Henry and several other counties there was more interest in supplying private schools and universities because of a perceived willingness to pay more and have more flexible procurement rules. Farmers in Spencer County pointed to the need to link any local food that 52 http://www.farmtoschool.org/
Final Report: Building the Local Food Economy, Louisville, Kentucky Page 86 Market Ventures, Inc./Karp Resources 7/17/2008
appears in the cafeteria to classroom curricula on food, agriculture, health, and the environment. Farmers are also concerned about the liability issues and insurance requirements of working with institutions (particularly those serving children).
Across counties though, one portion of this concept was well-received: the role of the public interest broker. While farmers were not eager to build relationships with public institutions themselves, the notion of a person—not a farmer and not a buyer—charged with facilitating new relationships was popular and appealing. The desire of the institutions to buy locally grown food, and the existence of successful models in other parts of the country, suggest that there is a good opportunity for sales to Kentucky farmers despite their initial lack of enthusiasm for the concept.
Strategy A strategy to increase the sale of local foods to schools and other public institutions could
include a number of interrelated elements:
• Local buying mandate – initiate a local foods mandate or preference for public food purchasing policy. UofL’s contract requirement with its food service operator provides a good model for other institutions in the city.
• Menu development — Develop menu items for the institutions that take advantage of locally grown food when it is available.
• Public Interest Broker — a public interest broker role could be created to broker deals that mutually benefit a region’s farmers and wholesale buyers (including, but not limited to, institutions). A phased strategy could start with supplying restaurants, since restaurant buyers are perceived as more flexible, and then eventually reaching institutional buyers.
• Reimbursements — state and local supplements could be used to support fresh fruit and vegetable purchases, creating new opportunities for local farmers.
• Summer meals — at least one of JCPS’s produce distributors purchases large quantities of locally grown fruits and vegetables in the summers, but does not supply JCPS during this period. Summer meals can be an excellent opportunity to enhance local food buying because there is more availability, prices are generally competitive, and the procurement rules can be more flexible.
• Expand UofL’s local procurement goal — University of Louisville could expand its local procurement goals by increasing the range of products it seeks to buy locally. While a Chartwells representative was confident that all milk the University purchases is already local, the University could raise the percentage goal and include meats, value-added dairy, and other value-added products. These increases will need to be phased in order for the supply to expand to meet demand.
• Partnership with national firms - Engage national corporations doing business in Louisville in co-developing strategies for purchasing local foods.

Final Report: Building the Local Food Economy, Louisville, Kentucky Page 87 Market Ventures, Inc./Karp Resources 7/17/2008
Potential Impact The food service operator at the University of Louisville has a $1.9 million annual food
budget. If, as the consultant team’s past experience has shown, 20% of this budget is spent on fruits and vegetables and Chartwells meets its existing 10% local produce goal, then $38,000 would be spent on local fruits and vegetables. Expanding the purchasing to additional products, including dairy, meat, and poultry, would help increase this number, as would raising the percentage of local produce as the supply chain is improved.
During the school year, JCPS serves 58,000 lunches, 24,000 breakfasts, and 1,800 snacks every day. During the summer, 10,000-12,000 meals are served each day. Currently, the schools charge students for snacks, but receive reimbursements for breakfast and lunch. An additional 5 cents per meal over the 180-day school year would result in an additional $738,000 for year to spend on school meals, some of which could be from Kentucky farmers. A supplement applied to a six week summer school session would result in an additional $165,000.
Expand local presence in supermarkets
Overview A few supermarket chains dominate food retailing in Louisville, including Kroger, Wal-Mart,
and Valu Market. Recently, Whole Foods has entered the marketplace. One effort underway is being led by Allied Marketing to promote the Kentucky Proud brand with the supermarkets. Additional efforts could be made with Louisville supermarkets to carry and highlight local foods in their stores.
Opportunity While some farmers interviewed were currently or had in the past sold to supermarkets, this
concept was the least popular, ranking 13th out of 13. The farmers in the focus groups were overwhelming negative about selling to supermarkets. They mentioned that historically they have been treated badly by supermarkets because contracts were reneged or not honored and their products were poorly handled or merchandized. Many Kentucky farmers are too small to sell into supermarkets, preferring direct marketing channels instead.
At the same time, supermarkets are the dominate player in the retail sector and a small change in practice could result in significant sales to Kentucky growers. Because of their volume requirements, this opportunity is most appropriate for large-scale growers or producers.
Strategy The state has made a large commitment to the promotion of locally grown foods in
supermarkets through Kentucky Proud and the work of Allied Marketing. Therefore the strategy within Louisville could be to support this investment and work with KDA and Kentucky Proud to maximize the opportunity within the city. This could include:

Final Report: Building the Local Food Economy, Louisville, Kentucky Page 88 Market Ventures, Inc./Karp Resources 7/17/2008
• Supplementing the Kentucky Proud campaign within Louisville supermarkets, particularly by encouraging area supermarkets to participate fully and by promoting the availability of local foods within supermarkets to consumers
• Helping to train store managers to execute in-store education programs for consumers
• Supporting grocers in merchandising local foods, such as by providing sourcing information to local store managers
Potential impact Based on the analysis above, supermarkets in Louisville buy $259 million worth of produce,
dairy and meat each year. Achieving 4-5% from local sources and assuming income to Kentucky farmers would be 20% of the purchase price (subtracting transportation costs and distribution fees), then this would mean $2.1-2.6 million in income to Kentucky farmers.
Final Report: Building the Local Food Economy, Louisville, Kentucky Page 89 Market Ventures, Inc./Karp Resources 7/17/2008
Section 7. Infrastructure Strategies
Meat and poultry processing facility
Overview Several small-scale meat processing facilities are located in the region and one poultry
processing facility is located in Bowling Green. Efforts could be made to create new meat and poultry processing facilities or expand existing facilities. These facilities would be outside Jefferson County but could serve farmers in the region and supply Louisville consumers.
Opportunity Focus group participants were strongly attracted to this concept, some based on their own
needs and some because it seemed that the strategy would have a great impact. It tied for first place among focus group participants.
Beef and Pork
Two USDA-inspected slaughter and processing facilities were mentioned numerous times in focus groups: Boone’s (Bardstown, KY) and Memphis Meats (Memphis, IN). C&W (Cynthiana, KY) was mentioned only in the Henry County focus group. None of the other 37 federally inspected facilities were mentioned. Boone’s slaughters cattle, hogs and lamb. Memphis Meats processes bison for the Kentucky Bison Company, as well as cattle. C&W, which was upgraded to a USDA facility in 1999, processes hogs and cattle.53
While some farmers were satisfied with these options, several noted that the prices were prohibitive, the distances too great, and the quality of the processing not always satisfactory. One Louisville-based food manufacturer noted that Boone’s products are of “mixed quality”, and that he would not buy from them. Focus groups participants reported traveling 45-60 minutes to their slaughter facility, consider this a long way to go, and fear increased fuel costs will make even these options inaccessible.
Several growers in Oldham County expressed interest in summer sausage, jerky, or bratwurst production. One noted that Memphis Meats provides these services, but that they are price-prohibitive for smaller producers.
Poultry
SS Enterprises, based near Bowling Green in Warren County, is currently the only independent USDA inspected poultry slaughter facility in Kentucky, handling chicken (organic and conventional), turkey, pheasant and guinea hen. Several farmers expressed interest in on-farm processing for their birds, noting that transport can be stressful and can result in reduced meat quality and even animal loss. Most did not feel that the “mobile” poultry processing facility at KSU was a good option for them, although one participating farmer uses the facility and is very pleased with it.
53 http://www.partnersforfamilyfarms.org/projects.htm
Final Report: Building the Local Food Economy, Louisville, Kentucky Page 90 Market Ventures, Inc./Karp Resources 7/17/2008
Focus group participants, KDA leaders, and buyers identified a need for an independent chicken processing facility in north central Kentucky. Many noted that more producers would get into the business (or grow the poultry portion of their business) if the infrastructure was there.
Other
Across the board, focus group participants identified a need for processing and slaughter facilities for smaller livestock, including lamb, goats, and rabbits. Though lamb and other small animals can be processed at Boone’s, this facility was perceived as insufficient to meet the demand and processing costs were viewed as too high. Half the producers at the Henry County focus group noted that they would diversify into small animal meat production if new facilities were made available.
Focus group participants across counties noted that specialty processors/butchers for higher end meat products are also needed.
Strategy The vast majority of those interviewed consider Jefferson County to be a central location and
desirable destination for a meat processing or slaughter facility, but recognize that the county’s population density would make locating such a facility challenging (although one producer noted that there are 400 acres of Community Improvement Development land within Jefferson County that would be well-suited for meat processing. The acreage has utility access and infrastructure, is in floodplains, and is not near residential enclaves). Thus, rebuilding slaughter infrastructure may be a regional strategy that Louisville can help lead. Rather than hosting a facility within its borders, Louisville officials could team with neighboring counties to advocate for and perhaps help fund the creation of a new facility in a neighboring county. Incentives to draw new businesses could be created and infrastructure to support the facility could be supported or subsidized. Working collaboratively with surrounding counties could lead to numerous economic and food access benefits for all involved.
Custom processing and butchering services were identified repeatedly as a need and could, more easily than slaughter facilities, be located within Louisville. By “custom” the farmers mean making a request for specialty cuts that are in great demand among chefs and other buyers, and that they can rely on the facility to be consistent in their butchering, something that is lacking with the available processors. A butcher or butchers within a year-round public market in Louisville could provide the infrastructure to meet this need.
Another opportunity is to partner with Swift & Co. to utilize their facilities for small-run, specialty local meat products. Collaborating with farmers and others to identify specialty cuts and ensure consistent supply of these would be a priority.
Further, the research identified the need for slaughtering and butchering of “specialty meats,” such as venison, goat, and other emerging meat products. The ability to process these types of animals should be included in any new facility to meet increasing demand.
For poultry, a number of potential strategies would meet producers’ needs. These include establishing a new, permanent slaughter and processing facility in the Louisville region and
Final Report: Building the Local Food Economy, Louisville, Kentucky Page 91 Market Ventures, Inc./Karp Resources 7/17/2008
exploring development of another “mobile” unit that could travel from farm to farm. Both ideas received interest from the farmers. Some farmers expressed very strong feelings about stress on birds as they are gathered and brought off-farm for processing, and that they would significantly increase their production of birds if on-farm processing were available.
National Models Niman Ranch— Founded as one 11 acre livestock operation in northern California in the
1970s, the Niman Ranch brand is now supplied by over 600 independent American farmers and ranchers. The company produces beef, pork, and lamb products using no-antibiotics, no added hormones and all vegetarian feeds. Their protocols are strict, and the brand is widely trusted, appearing on menus in some of the most acclaimed restaurants nationwide. Interestingly, Niman Ranch has a history of partnering with a Swift processing facility in Idaho to process approximately 200 head of grass-fed cattle per week. Swift is able to process every part of the animal, resulting in prices to farmers that are approximately 20% above commodity beef prices.54 http://www.nimanranch.com
Northeast Livestock Processing Service Company (NELPSC)—Based in upstate New York, NELPSC strives to increase meat processor capacity and make meat processing more efficient and profitable for small and mid-scale producers and processors. The company provides a range of low-cost services including matching producers with processors, facilitating communication, overseeing processing and resolving processing errors, technical assistance on specialty cuts, and scheduling slaughter and processing appointments. Producers report increased yields per animal, increased revenues, and improved relationships with processors. www.cce.cornell.edu/washington/aedp/livestockproc.html
Iowa Small Meat Processors Working Group — In Iowa, which has less than 200 small meat processing plants today compared with 550 forty years ago, consumers’ increased interest in local, organic or naturally raised meats has been translated into support for processors to make those foods available. The Leopold Center for Sustainable Agriculture at Iowa State University created a Small Meat Processors Working Group—including members from the university, Farm Bureau, industry leaders, and Department of Agriculture inspectors—which seeks to help small meat processors expand their capacities and facilities. The group provides technical assistance on business planning and feasibility, financing, plant design and construction, rules and regulations, and labor.55 http://www.valuechains.org/smpwg
Potential impact Interviewees across the board agreed that a poultry processing facility of equal scale to SS
Enterprises could be supported by north central Kentucky producers. Bowling Green’s SS Enterprises currently processes 50,000 birds per year, with a 300 bird per day capacity (the firm plans to expand to 600 birds per day in the next year). They charge $2.50 per bird for in-state customers, which make up approximately 80% of the company’s producer base, and $3 per bird for out-of-state customers.
54 Karen Karp interview with Bill Niman, 2005. 55 New Group Tackles Meaty Issues Faced By Small Processing Plants. 1-15-08
Final Report: Building the Local Food Economy, Louisville, Kentucky Page 92 Market Ventures, Inc./Karp Resources 7/17/2008
If the availability of a new poultry processing facility stimulates new production and marketing opportunities for Kentucky farmers, then a new 50,000 bird per year plant in northern Kentucky would lead to sales for Kentucky farmers of about $875,000 (based on average weight of 5 lbs per chicken and average selling price of $4.00 per lb., minus $2.50 per bird processing costs).
Additional research would be required to determine the appropriate scale and potential impact of additional meat processing facilities.
Food processing facility
Overview The consultant team described this concept as a built facility used to produce value-added
goods from regional farm products. It might function as a shared-use commercial kitchen, a co-packing plant, a fresh cut facility to serve large-scale buyers, or an Individual Quick Freeze (IQF) plant. The facility might be designed so growers could process their own products (such as a shared‐use kitchen), it could provide resources to co-pack for farmers, or offer a combination of the two.
Opportunity The concept received a weak reception from farmers in the focus groups, ranking 10th out of
13. Some farmers were interested in a food processing facility that would enable them to develop, produce, brand and own their products themselves but they did not believe such a facility should necessarily be located in Jefferson County. Others simply wished that the food manufacturers and processors in the area would be more interested in sourcing local ingredients.
In 2003, Kentucky passed House Bill 391, which permits Kentucky farmers who grow and harvest produce to process their own value-added products on the farm and sell them at farmers’ markets, certified roadside stands and at the processor’s farm. According to UK, HB 391 greatly reduced the obstacles faced by smaller-scale farms wanting to process value-added products for direct sale to their customers. These home-based processors may sell jams, jellies, breads, fruit pies, cakes and cookies after they register with the Cabinet for Health Services. There is no registration fee, and farmers can register on-line or in person at their local extension office. 56
Farmers wishing to sell a broader range of canned goods can register as “Home-based Microprocessors.” In order to participate, farmers pay a $50 registration fee, attend a Home-based Microprocessor Workshop, and have their recipes approved by the Cabinet for Health Service.
Spencer County growers expressed interest in a cannery or freezing facility, a mid to large scale company that would source produce at the peak of the season (when there is a glut on the market and it is hardest to sell) to preserve the product for year-round sales, to create a market for non-premium produce, to appeal to institutional markets as well as the “convenience foods” marketplace, and to increase off-season access to local foods. In Jefferson County, by contrast,
56 http://www.ca.uky.edu/agc/micro/
Final Report: Building the Local Food Economy, Louisville, Kentucky Page 93 Market Ventures, Inc./Karp Resources 7/17/2008
farmers expressed interest in “farmer-controlled” processing. They recounted stories of negative past dealings with large Kentucky processors. Several farmers from both counties worried about “making the economics work” in the first few years, as farmers began scaling up production. Across all of the focus groups, farmers were generally leery of large-scale processing facilities because they felt such companies would pay bottom dollar for raw product, prices and sales were not guaranteed, farmers were perceived as “disposable” to such companies, and quality standards were at the whim of the processor.
Farmers from Trimble and several other counties were concerned that, though a processing facility that could service institutions would meet numerous needs across food industry sectors, farmers (at their current capacities) could not provide sufficient product or accept processors’ prices. While envisioning a medium-sized facility that they could sell product to, they also felt that numerous possibilities exist for premium preserved or canned products.
Growers in several focus groups noted that there were ample and underutilized resources for farmers wishing to process their own value-added products, either on their own farm, at commercial kitchens found in many Extension offices, or at other shared-use facilities.
As described in the snapshot of the Louisville food economy, above, the city currently has a number of facilities for food processing, including several co-packing plants and programs for start-up entrepreneurs.
One sector that appears to be underrepresented in the state is cheese production.
Jefferson County Public Schools purchases a small amount of fresh, raw, whole product, but is interested in increasing the amount of local foods entering the school meal program. In particular, JCPS is interested in accessing minimally processed (fresh cut or frozen) fruits and vegetables for meals and for snacks. During the school year, the schools serve about 87,000 meals and snacks each day (this goes down to about 10,000 per day in the summer). JCPS currently purchases sliced apple packs and baby carrots packs from out of state suppliers. These popular snack items could be produced by an in-state processor, who sources the products from local farmers.
Strategy The lack of interest from farmers and the existence of adequate facilities suggest that this
concept should be a low priority for future action. However, there are a number of steps that can be taken to encourage additional food processing as a means to increase Kentucky farm income:
• Promote existing processing opportunities to farmers. While licensed kitchens and co-packing facilities are available in the area, they could be better utilized if they were more aggressively promoted to and supported by agricultural businesses.
• Kentucky-grown products could be promoted more aggressively to existing food manufacturers.
• Explore creation of a medium-scale processing facility. Mid-sized processing facilities could be a viable model for increasing the amount of Kentucky-grown products consumed as value-added products. Mid-sized processing facilities, run by independent entrepreneurs, have potential for tapping into niche markets for specialty foods made
Final Report: Building the Local Food Economy, Louisville, Kentucky Page 94 Market Ventures, Inc./Karp Resources 7/17/2008
with regionally grown products. Such a facility would have small minimum runs but would be large enough to supply larger regional and potentially national retail outlets. This scale facility might also process for the institutional market and retail “convenience” market.
• Leverage value-added products as marketing tools for Louisville tourism and regional agritourism.
• Provide technical assistance to farmers who elect to build on-farm value-added processing facilities, so that their investment and training is streamlined and their efforts turn into revenue and profit more quickly.
• Explore increased dairy processing. Dairy processing is under-represented, though farmer interest in cheeses and yogurts is increasing as is consumer interest in farmstead cheeses.

Final Report: Building the Local Food Economy, Louisville, Kentucky Page 95 Market Ventures, Inc./Karp Resources 7/17/2008
Section 8. Farm-based Strategies
Agritourism
Overview As the largest population center in Kentucky, Louisville residents and tourists visiting
Louisville represent a potentially large target market for ag tourism efforts. Efforts could be made to expand the marketing of agricultural tourism of farms in or near Jefferson County, including efforts to introduce school children to local farms.
Opportunity Farmers in the focus groups ranked agritourism as the most popular concept (tied with meat
processing). Reflecting national trends, it was most popular among diversified fruit and vegetable growers and grape and wine producers. Several focus groups discussed the long-term benefits of agritourism for educating the public about regional food and agricultural issues, and there was particular excitement about increasing connections to Jefferson County schools. Farmers also liked the prospect of increasing on-site sales by “bringing people to the farm,” allowing farmers the opportunity to stay on their farms rather than spend time at farmers’ markets or other off-site places.
The expansion of farm stands would reinforce the opportunity to create a successful wholesale farmers’ market since there would be more demand for local farm products to sell at the farmstands.
Many farmers reported insurance cost as the major obstacle to hosting farm-based activities. A handful of other states have addressed this issue with legislative reform. In Kansas, for instance, the AgriTourism Promotion Act (SB 334) was passed to promote the agritourism industry and limit its exposure to liability. Part of the act provided specific language for warning signage that agritourism operations registered with the state’s Department of Commerce could use on their farms to limit their liability for numerous inherent risks. Also, the act provides a tax-credit for up to 20% of agritourism liability insurance in any tax year.57
In addition to liability concerns, a lack of trained staff to run on-farm retail operations and educational programs, confusion with zoning restrictions, and limited roadside signage were also listed as significant obstacles. The focus groups saw the greatest opportunity for strengthening agritourism in the region through collective advertising to Louisville’s media markets, as well as programs designed to increase the number of farm-to-school trips. Overall, there was a sense among the focus groups that statewide efforts to promote agritourism are headed in the right direction and should continue.
57 http://www.kansasagritourism.org/resources/sb334.htm
Final Report: Building the Local Food Economy, Louisville, Kentucky Page 96 Market Ventures, Inc./Karp Resources 7/17/2008
Strategy Agritourism works best when diversified farms provide a broad range of products and
experiences to a loyal, local customer base. Open farms are also key elements for educating consumers and school groups about the issues facing the local food system.
A program to strengthen agritourism around Louisville could include:
• Advertising to Louisville’s media markets
• Linking agritourism to existing tourism and convention and visitor’s bureau efforts by promoting the area’s diverse agriculture venues as an appealing destination and increasing the connection to existing tourism agencies
• Expanding school trips to local farms and connecting curricula such as biology, history, geography, math, food science, agriculture and agronomy, and health and nutrition to the local food supply
• Partnering with KDA and its Division of Agritourism, as well as other Cooperative Extension and other groups, to develop a broad range of products and activities to promote regional farms to Louisville residents and tourists.
• Exploring legislative reform, such as an AgriTourism Promotion Act that promotes agritourism industry and limits liability exposure, and that provides tax-credits for a percentage of liability insurance.
• Leveraging in-city programs such as farmers’ markets, CSAs, and restaurants that buy local to promote on-farm activities and linking these with maps and promotional materials.
Potential impact As described above, 82 farms across the state participate in the Kentucky Farm Bureau
Certified Roadside Farm Market program. Three farm stands are located in Jefferson County, two in Bullitt, two in Spencer, one in Shelby, one in Owen, three in Trimble, one in Hardin and two in Larue counties. The consultant team did not quantify the sales at farm stands in the Louisville region. Promotions that drive additional visits to farm stands should result in higher sales.
School districts pay a small fee per student to farmers who host school trips. If 5,000 of Louisville’s 98,000 students visited Kentucky farms each year and paid $2.50 per student, farm income would increase $12,500, exclusive of any retail sales that could be made to students or chaperones (such as ice cream).

Final Report: Building the Local Food Economy, Louisville, Kentucky Page 97 Market Ventures, Inc./Karp Resources 7/17/2008
New farmer development
Overview Access to skilled labor was a concern voiced by a farmer during the first focus group. Like
many farmers, he identified the prohibitive cost of skilled labor as a major obstacle to increasing his farm’s production. He wondered if Louisville’s large workforce could be tapped as a resource for regional farmers wanting to sell more products into the Louisville market. In addition, the group raised an overarching concern about attracting younger farmers to the agricultural sector. A significant percentage of regional farmers are approaching retirement age, and there is reasonable concern about how these farmers will be replaced in the near future.
The project team incorporated these comments from the first focus group and developed and presented “New Farmer Development” as an additional concept to the remaining focus groups. The response to this concept was mixed and was ranked 8th out of 13. The majority of farmers agreed that labor shortages were a significant issue, though there was not consensus that Louisville’s working population would be an effective solution. There was a strong concern that urban workers would need too much training, and farmers worried about maintaining their quality standards with a transient labor pool. Other concerns were voiced regarding transportation costs, payroll costs, and the limited housing options outside of Louisville. Overall, farmers consider on-farm labor a complex and perplexing problem, and are generally pessimistic about the ability of a government- sponsored program to address the issue.
Opportunity With labor shortage seen as an unsolvable problem, discussion shifted to ways to grow the
number of new farms, essentially “growing farmers.” There was a consistent concern for finding young farmers to replace older and retiring farmers, and many participants saw an unmet demand for local products sold to the Louisville market and thought that additional farms would bolster the agrarian community and strengthen the market demand. Interestingly, none of the farmers feared potential competition from new farms, reinforcing the idea that there is an unmet demand for regional products in the Louisville area.
Nationally, there are several models of programs designed to train new farmers and increase the number of working farms. An increasingly popular model connects recent immigrants with agricultural knowledge to local land-owners and resources to help them start their own farm businesses. This approach might make sense in Louisville, with its expanding population of recent immigrants. The National Immigrant Farming Initiative (NIFI) is a collaborative effort lead by Heifer International with additional funding provided by USDA’s Risk Management Agency and the W.K. Kellogg Foundation. NIFI was founded in 2003 as a resource for over 20 immigrant-farming projects located across the country.58 As an organization, NIFI supports immigrant farmers by providing training, information sharing, networking opportunities, and funding to individual immigrant farming projects.
One example of a successful farmer development project is the Southeast Immigrant Farm Partners program in Douglasville, Georgia. The Grover Family Farm leases part of their 40 58 http://immigrantfarming.org/index.php?page=About_NIFI
Final Report: Building the Local Food Economy, Louisville, Kentucky Page 98 Market Ventures, Inc./Karp Resources 7/17/2008
acres of farmland to two recent immigrant groups, one from Latin America and another from Southeast Asia. The immigrants utilize their agricultural knowledge to grow specialty crops that are sold through direct marketing channels. Doing so increases their family income, and provides an incubator for immigrants looking at starting their own farms. In Louisville, underutilized parkland could be converted to urban gardens where recent immigrant groups could use their farming experience to grow crops for regional markets.
Another national model for growing the number of farms is the Collaborative Regional Alliance for Farmer Training, or CRAFT. The program was started in 1994 with a coalition of New England farms that hosted farm apprentices and interns. The intention was to provide a broad introduction to different agricultural practices for apprentices spending a growing season at one of the member farms. Each member farm would host one “field trip” for all of the CRAFT apprentices. In addition to a tour and general overview of their operation, each farm host leads a seminar about a sustainable agriculture topic they are particularly familiar with. As a result, interns get a full immersion into broad range of farming practices, while building a network of peers
In New York City, the New Farmer Development Program was founded through the Greenmarket system (a centralized farmers’ market organization), and is a collaboration with the NYS Department of Agriculture and Markets, and Cornell Cooperative Extension. The program links recent immigrants with agricultural backgrounds with existing farms as farm laborers and then works to transition some of these farmers into farm operators. These efforts are sometimes linked with farm succession strategies that have been happening at the county level.
In Kentucky, Robin Verson started KY CRAFT in 2003 modeled after the Angelic Organics Learning Center in Illinois, where she had worked as a farm intern. KY CRAFT started with four farms and has since grown to include nine farms, the majority of which run their own apprentice program. Participating farms host and attend monthly workshops, as well as provide a knowledge base and informal support network for new farmers. The program has largely evolved organically through word of mouth, and Robin posts farmer profiles on the web at www.theruralcenter.com.
Roughly half of the CSA farmers selling shares in Jefferson County participate with KY CRAFT and host farm interns and apprentices. Running an effective internship program addresses both of the concerns originally voiced by focus group participants: it provides a low-cost labor force source, and it provides agricultural experience for young farmers interested in entering the sector. However, it requires significant planning and a learned skill set to run an apprenticeship program that is rewarding and relevant for both the intern and the farmer. CRAFT programs, more than anything, provide a resource for farmers to tailor their own apprentice program to fit their needs, personalities, and specific skills. The results have been effective. Of the nine farmers that currently participate in KY CRAFT, three of them started as apprentices at farms within the network.
Strategy The development of new farms and new farmers could have several components:
• Convert underutilized urban parkland to gardens for food production for local markets
Final Report: Building the Local Food Economy, Louisville, Kentucky Page 99 Market Ventures, Inc./Karp Resources 7/17/2008
• Connect with KY CRAFT program to encourage Louisville links to their apprentice program, education and training workshops, new farmer support, and internship opportunities in rural areas
• Support or instigate succession planning efforts for area farmers, to help ensure that their lands will remain in agriculture production
Potential impact The potential impact from this strategy for increasing sales by Kentucky farmers is likely to
be small in the short term. Developing new farmers to maintain a working landscape and expand the availability of locally grown foods is important, however, particularly as the average age of Kentucky farmers increases. The benefits of this strategy for Louisville are reflected in the job and business opportunities for recent immigrants who are living in the city, as well as for increased supply of local foods.
Final Report: Building the Local Food Economy, Louisville, Kentucky Page 100 Market Ventures, Inc./Karp Resources 7/17/2008
Section 9. Recommendations
The goal of this project is to identify high potential opportunities within Louisville for increasing sales for Kentucky farmers, particularly for small and medium sized farmers within the 23 county study region that support Kentucky’s family farm heritage. Where possible, the project also looked to provide ancillary benefits to the city, such as increasing the supply of fresh, healthy foods for local residents, the community revitalization effects of open-air farmers’ markets, business opportunities from value added food processing, increased access to fresh and healthy foods for the city’s citizens, and the tourist appeal of a year-round public market.
To accomplish these goals, the MVI/KR team identified a range of thirteen different retail, wholesale, processing, and farm-based strategies, and tested these strategies with a cross section of the region’s farmers through nine focus group sessions. The thirteen strategies were then analyzed further, with specific implementation strategies identified and, for the most promising options, their potential impact quantified.
Strategies for implementation
Seven of the thirteen strategies offer good potential for implementation in the immediate or near term. The other six strategies generally evinced little enthusiasm from the farmers in the focus groups or are being implemented by others (such as the Allied Marketing effort to increase Kentucky Proud products in supermarkets). These six strategies should not be abandoned completely: they might be effective in the future, particularly as the region’s farming and distribution capacity grows.
The following chart shows the top seven strategies, ordered by highest potential return to Kentucky farmers. Each strategy shows the ranking by the farmers in the focus groups, an initial ballpark estimate for the costs to implement in the first three years, potential sales that could go to Kentucky farmers, and an Investment Return Ratio, which is the estimated three year return to Kentucky farmers divided by the estimated three year investment cost of the strategy. The second chart outlines some non-monetary benefits as well as some challenges which may limit development or implementation.
In terms of greatest sales potential, the public market, meat and poultry processing facilities, and expanded farmers’ markets are the top three strategies. In terms of best investment return ratios, the top three are expanded farmers’ markets, restaurants, and aggregation points:

Final Report: Building the Local Food Economy, Louisville, Kentucky Page 101 Market Ventures, Inc./Karp Resources 7/17/2008
StrategyFarmer rating
3 year investment estimate
3 year return estimate to KY
farmers Investment return ratio
Downtown public market 4 $ 11,000,000 $ 15,300,000 1.4
Meat and poultry processing 1 $ 5,000,000 $ 15,225,000 3.0
Farmers' market coordination and marketing 3 $ 900,000 $ 5,400,000 6.0
Aggregation points for local foods distribution 5 $ 795,000 $ 3,300,000 4.2
Restaurants 6 $ 450,000 $ 2,250,000 5.0
Community Supported Agriculture 7 $ 450,000 $ 789,000 1.8
Agritourism 1 $ 450,000 $ 600,000 1.3
Strategy Community benefits Challenges
Downtown public market
Education, 7 day access to local fresh foods, small business opportunities, jobs, tourism, attract shoppers downtown
Requires private sector investment and leadership; attracting quality vendors
Meat and poultry processing Jobs (particulary butchering at public market)
Licensing, siting/permitting, identifying qualified operator
Farmers' market expansion, coordination, and marketing
Public space activation, more community gathering spaces, consistent messaging and information, education
Potential hesitancy from existing farmers' markets about losing independence; availability of interested farmers

Final Report: Building the Local Food Economy, Louisville, Kentucky Page 102 Market Ventures, Inc./Karp Resources 7/17/2008
Aggregation points for local foods distribution
Strengthens food distributors in Louisville
Gaining collaboration from Coop Extension; farmer ability to increase production; liability issues
Restaurants
Strengthens indepent restaurants and food/dining identity of Louisville
Overcoming restaurateurs' time constraints
Community Supported Agriculture Community connections Recruiting farmers
Agritourism Education, tourism development
Policy barriers (insurance), transportation costs and coordination
The MVI/KR team recommends that multiple strategies be pursued concurrently rather than selecting only one or two for implementation. In part, we recommend pursuing multiple strategies because the same organizational infrastructure will be needed to implement several of the high potential strategies and the combination of strategies can be mutually reinforcing. Pursing multiple strategies also recognizes that different farmers will be attracted to different opportunities: providing multiple “points of entry” will help distribute the potential benefits of this initiative to a wider range of the region’s farmers. Also, because the success of any strategy is not guaranteed and the strategies will take different lengths of time to achieve results, pursuing multiple strategies will allow each one to evolve at its own pace while recognizing the uncertainty associated with these endeavors, as well as offer area residents a number of ways to engage and benefit from their execution.
While the farmer focus groups provided valuable insight into the perspectives and needs of the region’s farmers, the participants’ responses do not ensure how they or other farmers will act, particularly in an environment where farmers are leery of change based on the legacy of tobacco farming (which some key informants felt has dampened Kentucky farmers’ entrepreneurial spirit). The farming community is also experiencing great uncertainties because of rapidly rising transportation and farm input costs, food price inflation, and labor shortages and succession planning challenges, which might affect attitudes. Over time, as the impacts of the strategies are evaluated and quantified, the most effective strategies will emerge and a narrowing of approach (and further investment) might be warranted.
The private sector should be encouraged whenever possible to assist with the planning and implementation of the strategies and that the strategies should reinforce existing food production and distribution infrastructure, building off current assets. In general, the Louisville food economy has efficient food distribution systems in place that operate in a range of scales. The key is to integrate Kentucky farmers into these systems without reinventing them. Notably, the development of a year-round, indoor public market will best be accomplished in Louisville by a private but public-spirited development group. No local nonprofit or public agency was identified during the study that has the organizational or financial capacity to create a successful public market.
Final Report: Building the Local Food Economy, Louisville, Kentucky Page 103 Market Ventures, Inc./Karp Resources 7/17/2008
Finally, we recommend that a regional approach will be most effective in implementing the strategies. The implementation of the strategies proposed herein all require the ongoing cooperation of players from throughout the region, including local and state government officials, farmers, nonprofits and private firms. This recommendation builds upon the regional approach that has guided this project via the Local Food Economy Work Group. Furthermore, it recognizes the wide range of organizations that have resources and experience to bring to the table, including Louisville Metro government, local government in surrounding counties, KDA, Cooperative Extension, the universities, Farm Bureau, and the variety of nonprofits engaged with food and farming issues.
Having one regional, lead organization to oversee the implementation for the various strategies will provide efficiencies in staffing and marketing, plus better coordination of the efforts and consistent methodologies to track implementation and evaluate outcomes and impacts.
The key tasks for this region-wide organization include:
1. Expanding and promoting farmers’ markets throughout Louisville and the region, through increased advertising and special events that will attract more customers, by working to centralize and professionalize the management of the farmers’ markets, and by planning the development of new markets in a coordinated way.
2. Creating the position of a “public interest broker” to work with wholesale buyers, including institutions, emergency feeding organizations, food distributions companies, and restaurants, as well as farmers, cooperatives, and packers. The public interest broker will seek to identify sales opportunities and to clarify and overcome barriers that currently prevent wholesale transactions from taking place. These might include identifying and screening interested farmers, identifying high value products and seasons (and helping buyers to create appropriate specifications and to identity their quantity needs), working with farmers on their post harvest handling, food safety, and packaging practices to meet the needs of specific buyers, and working with distribution companies to move the product efficiently.
3. Working with private developers to develop a public market in downtown Louisville, particularly with recruiting farmers and vendors, and with marketing.
4. Supporting the development of regional distribution and processing infrastructure, in particular the highly desired additional meat and poultry processing in the Louisville region and the creation of regional cold storage distribution hubs, potentially at Cooperative Extension facilities in neighboring counties. Meat processing infrastructure also includes efforts to identify and develop high quality butchers who are needed to enhance the quality of locally raised meat. This butchering infrastructure could be part of the development of the proposed public market.
5. Supporting the state’s agritourism efforts and work with Louisville-based educational institutions and tourism agencies to promote local and out-of-state tourism to the region’s farms.
6. Developing the restaurant promotion program, working closely with Louisville restaurateurs who have experience buying directly from farmers and promoting their
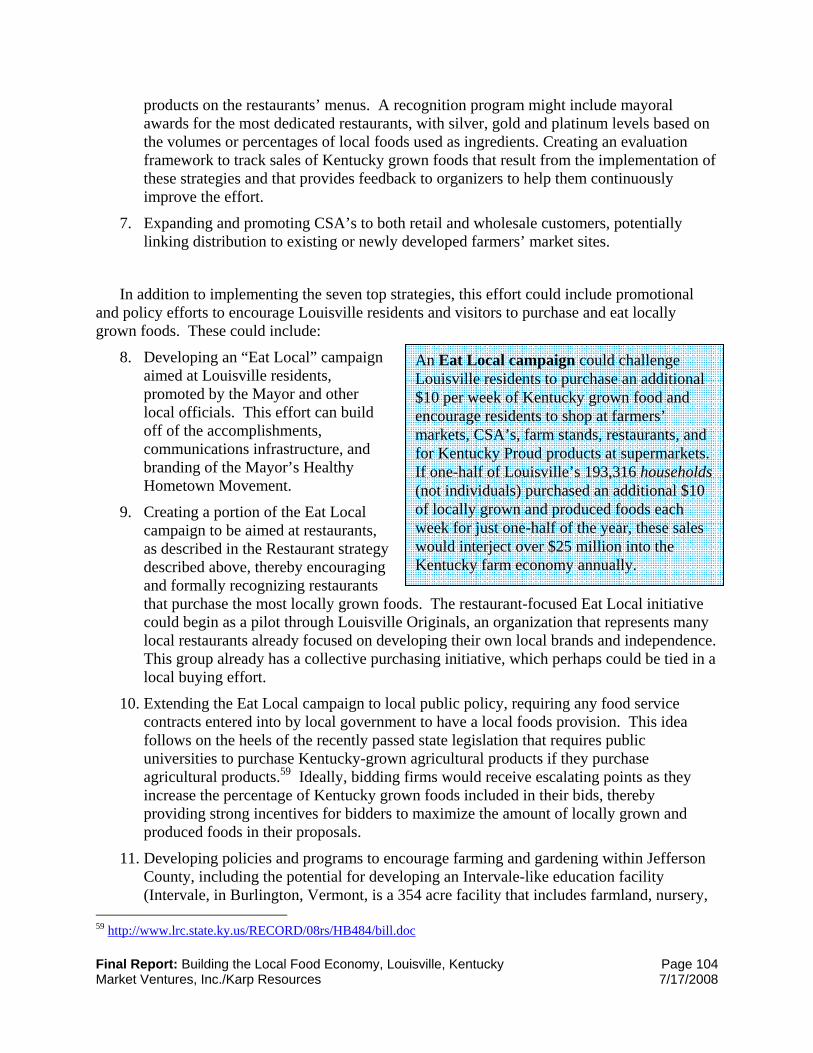
Final Report: Building the Local Food Economy, Louisville, Kentucky Page 104 Market Ventures, Inc./Karp Resources 7/17/2008
products on the restaurants’ menus. A recognition program might include mayoral awards for the most dedicated restaurants, with silver, gold and platinum levels based on the volumes or percentages of local foods used as ingredients. Creating an evaluation framework to track sales of Kentucky grown foods that result from the implementation of these strategies and that provides feedback to organizers to help them continuously improve the effort.
7. Expanding and promoting CSA’s to both retail and wholesale customers, potentially linking distribution to existing or newly developed farmers’ market sites.
In addition to implementing the seven top strategies, this effort could include promotional and policy efforts to encourage Louisville residents and visitors to purchase and eat locally grown foods. These could include:
8. Developing an “Eat Local” campaign aimed at Louisville residents, promoted by the Mayor and other local officials. This effort can build off of the accomplishments, communications infrastructure, and branding of the Mayor’s Healthy Hometown Movement.
9. Creating a portion of the Eat Local campaign to be aimed at restaurants, as described in the Restaurant strategy described above, thereby encouraging and formally recognizing restaurants that purchase the most locally grown foods. The restaurant-focused Eat Local initiative could begin as a pilot through Louisville Originals, an organization that represents many local restaurants already focused on developing their own local brands and independence. This group already has a collective purchasing initiative, which perhaps could be tied in a local buying effort.
10. Extending the Eat Local campaign to local public policy, requiring any food service contracts entered into by local government to have a local foods provision. This idea follows on the heels of the recently passed state legislation that requires public universities to purchase Kentucky-grown agricultural products if they purchase agricultural products.59 Ideally, bidding firms would receive escalating points as they increase the percentage of Kentucky grown foods included in their bids, thereby providing strong incentives for bidders to maximize the amount of locally grown and produced foods in their proposals.
11. Developing policies and programs to encourage farming and gardening within Jefferson County, including the potential for developing an Intervale-like education facility (Intervale, in Burlington, Vermont, is a 354 acre facility that includes farmland, nursery,
59 http://www.lrc.state.ky.us/RECORD/08rs/HB484/bill.doc
An Eat Local campaign could challenge Louisville residents to purchase an additional $10 per week of Kentucky grown food and encourage residents to shop at farmers’ markets, CSA’s, farm stands, restaurants, and for Kentucky Proud products at supermarkets. If one-half of Louisville’s 193,316 households (not individuals) purchased an additional $10 of locally grown and produced foods each week for just one-half of the year, these sales would interject over $25 million into the Kentucky farm economy annually.

Final Report: Building the Local Food Economy, Louisville, Kentucky Page 105 Market Ventures, Inc./Karp Resources 7/17/2008
compost production, trails, and wildlife corridors60). The Floyd’s Fork project, which includes both working and former farmland, might provide a good setting to create this type of project. The site could incorporate a new office for Jefferson County Cooperative Extension and provide facilities for educating both consumers and producers about local foods and the food system. This would be a particularly good location to encourage the production of farmstead cheeses, which are not being produced in quantity at present. It could also contain composting facilities. This facility would likely become a destination for agritourism activities as well.
12. Encouraging education about local foods and farming throughout the educational sector, encouraging elementary and secondary school groups to visit regional farms and integrate food, nutrition, and gardening into their academic programs. This effort could also include working with local universities to develop food- and agriculture-based curricula, as well as programs such as “farm projects” on campus where students can grow their own food, which can then be used by dining services or special events.
Organization
The organizational capacity to implement these tasks will likely take time to develop. Initially, the Local Food Economy Work Group can look toward the identification and assignment of existing resources, including personnel, as it continues to build local partnerships. This group will need to make decisions about how the work will get done and determine where it will focus its efforts.
Ideally, implementing the seven strategies recommended above will require an entity to organize the regional partnership, staff to provide leadership and conduct work tasks, and adequate resources to fund the initiative. The MVI/KR team recommends that an organizational “home” for local foods projects be identified that represents the approximately 23 county region in and around Louisville. One local model for this is the Kentuckiana Regional Planning & Development Agency (KIPDA), which is an association of local governments in a smaller (nine-county) region of southern Indiana and north central Kentucky. Ideally, this regional approach will include neighboring counties in Southern Indiana that can provide resources and investments to support their inclusion. A consistent supply of high quality foods, particularly for the higher volume, longer season strategies such as the public market, will require products from Indiana to complement the Kentucky farm products.
Depending on the range of strategies undertaken and the available resources, the staff will likely require a director, a farmers’ market/CSA organizer, a public interest broker, a marketing coordinator, and an office manager. If the organization becomes involved with farmers’ market site management, it will require supplemental staff. In addition to staff, the effort will require a marketing budget and office-related costs. Funds are also included to conduct detailed studies about the suggested regional processing and distribution facilities.
Several of the proposed strategies require capital investments, such as the indoor public market, the aggregation point facilities, and the meat and poultry processing facilities. These
60 http://www.intervale.org/index.shtml
Final Report: Building the Local Food Economy, Louisville, Kentucky Page 106 Market Ventures, Inc./Karp Resources 7/17/2008
strategies will likely require a mix of public and private funds and should have strong private sector leadership, supported by the proposed regional partnership.
Some of the seven proposed strategies offer opportunities for earned income to this organization. For example, the farmers’ market marketing and expansion strategy includes a proposed new fee schedule with vendors paying a percentage of sales, up to a set maximum. A portion of farmers’ market fees could therefore help fund the work of the organization. The public interest broker, once he/she establishes value to both buyers and sellers, should be able to introduce a fee equal to a small percentage of the transaction value. Agritourism promotion should be able to charge fees to participating farmers.

Final Report: Building the Local Food Economy, Louisville, Kentucky Page 107 Market Ventures, Inc./Karp Resources 7/17/2008
Section 10. Conclusion
The Louisville region has a significant opportunity to expand the quantity of locally grown foods sold in the city. The study identified tremendous interest in purchasing locally grown foods from all sectors of the local food economy, including consumers, restaurateurs, retailers, wholesalers, institutions, and distributors. The farmer focus groups revealed strong interest among the region’s farmers to expand their sales in Louisville, particularly by selling directly to consumers.
The MVI/KR team recommends that the Local Food Economy Work Group pursue a range of strategies to take advantage of this opportunity and expand the amount of Kentucky-grown foods being sold in Louisville. Four of the proposed strategies require a modest investment in personnel and programs in order to yield significantly higher sales for Kentucky growers: expanding and marketing the region’s farmers’ markets and CSAs, expanding ag tourism, and increasing restaurant purchases of Kentucky foods. Substantial capital investments will be needed for the other three strategies: creating a year-round, indoor public market, developing regional distribution hubs, and creating meat and poultry processing facilities. These three strategies can be addressed as public/private partnerships, with significant private sector leadership and investment. A new Eat Local campaign can encourage local residents and businesses to buy Kentucky foods, and will enhance all of the recommended strategies.
Louisville can lead the nation in creating a comprehensive approach to expanding sales of locally grown foods throughout its food economy. This effort will reinforce the city’s other innovative strategies, including its health and wellness initiatives, tourism promotion, business and job development, and enhancements to quality of life in downtown and throughout the city. The research, analysis and recommendations in this report should provide the foundation and strategic direction for expanding the sales of locally grown foods in the city.
Final Report: Building the Local Food Economy, Louisville, Kentucky Page 108 Market Ventures, Inc./Karp Resources 7/17/2008
Appendix A: Local Food Economy Work Group
The Honorable Jerry E. Abramson Mayor of Louisville The Honorable John Logan Brent Henry County Judge/Executive The Honorable Thomas L. Hardesty Mayor of Shelbyville The Honorable David Jenkins Spencer County Judge/Executive The Honorable Duane Murner Oldham County Judge/Executive The Honorable Rob Rothenburger Shelby County Judge/Executive The Honorable Randy K. Stevens Trimble County Judge/Executive Louise Allen Oldham County Planning & Zoning Wendell Berry Port Royal, KY Rob Frederick/Lois Mateus Brown-Forman Corporation Susan L. Hamilton Louisville Metro Economic Development Department Steve Moore Henry County Extension Agent J. David Morris Louisville Metro Economic Development Department Rusty Newton Shelby County Deputy Judge/Executive
Final Report: Building the Local Food Economy, Louisville, Kentucky Page 109 Market Ventures, Inc./Karp Resources 7/17/2008
Bryce A. Roberts Spencer County Extension Agent Steve Wilson (Mark King) Kentucky Bison Company/Museum Plaza Many thanks to the study’s funding partners: Kentucky Agricultural Development Fund Henry County Oldham County Shelby County Spencer County Trimble County City of Shelbyville Louisville/Jefferson County Metro Government Brown-Forman Corporation

Final Report: Building the Local Food Economy, Louisville, Kentucky Page 110 Market Ventures, Inc./Karp Resources 7/17/2008
Appendix B: Interview List
Farmers/Producers The Garreys Wendell Berry Ivor Chodowski Mike Salyers Sandy Corlett Greg Graft, Grateful Greens Alice Baesler (producer and President of Partnership for Family Farms) Jefferson focus group Washington focus group Trimble focus group Mercer focus group Oldham focus group Shelby focus group Spencer focus group Henry focus group Hardin focus group Distributors/Brokers Grasshoppers (Ivor, Berea, Sam) Stanley Brothers, Paul Hulsman Creation Gardens, Ron Turnier and Steve Turnier Netter's Produce, Ron Netter Allied Marketing, Rick Raque and David King Roby's Country Garden, Gary Osborne Manufacturers/Processors Hortons, Brian Notts Roby's Country Garden, Gary Osborne fb3, Sandy Nixon Restaurants/Food Service Churchill Downs, Gil Logan Proof, Michael Paley University of Louisville, Sonny Altman and Mitchell Payne Chartwells, Melissa Pompa & Sonny Altman JCPS (Cheryl Sturgeon, Julia Bauscher, Martha Dysart) IACP Louisville Originals Mark Williams Cathy Cary Government Mac Stone, KDA Sara Williamson, KDA
Janet Eaton, KDA, Farmers’ Market Coordinator Stephen Yates, KDA, Director of Agri Tourism Kyle Day, Ag Development Board Lisa Hite, Metro Parks Department

Final Report: Building the Local Food Economy, Louisville, Kentucky Page 111 Market Ventures, Inc./Karp Resources 7/17/2008
Donna Michael, Coop Extension Jefferson County Judge John Logan Brent Bruce Traughber, Louisville/Metro Economic Development Department Susan Hamilton, Louisville/Metro Economic Development Department Department of Health, Dr. Troutman, Lynn Silver, Josh Jennings, Leanne French Jennifer Clark, Active Louisville Other Produce Buyer Meeting (Fruit and Veg Conference) Tim Woods, UK Bob Perry, UK Rob Fredericks, Brown Forman Steve Wilson & Craig Greenberg, Museum Plaza/21C Lois Matteus/Augusta Holland, Tim Peters Mark King, consultant to Steve Wilson Sara Frischner
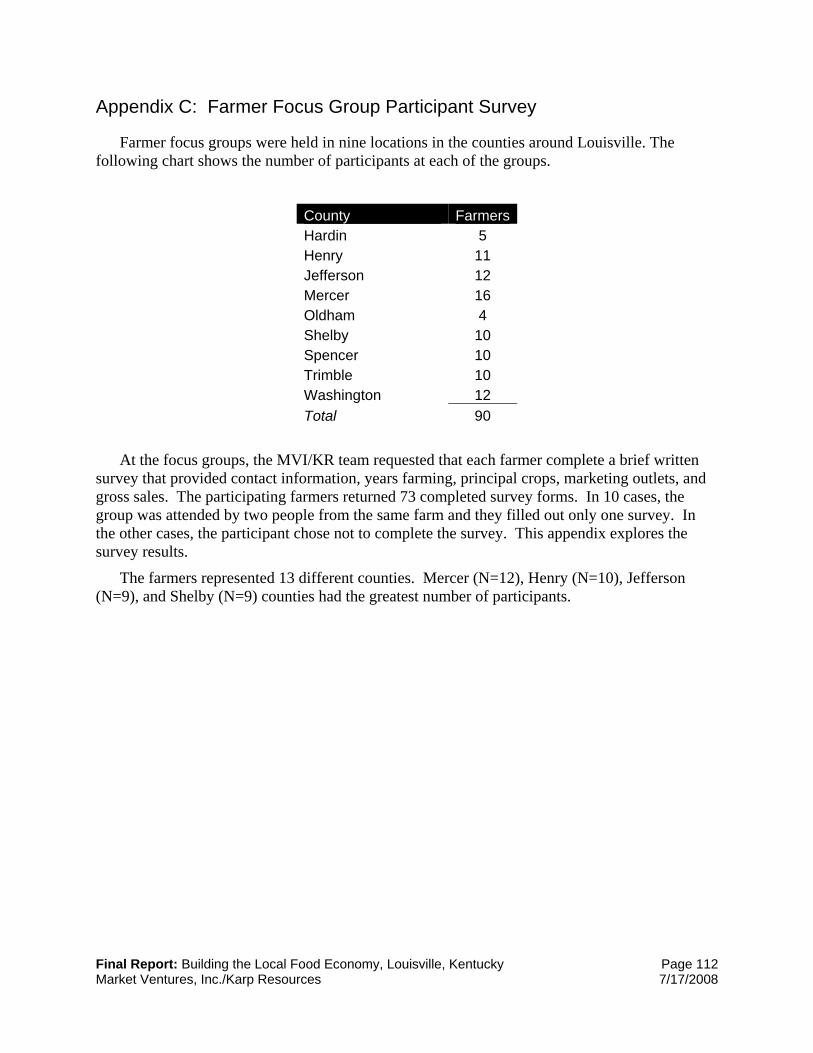
Final Report: Building the Local Food Economy, Louisville, Kentucky Page 112 Market Ventures, Inc./Karp Resources 7/17/2008
Appendix C: Farmer Focus Group Participant Survey
Farmer focus groups were held in nine locations in the counties around Louisville. The following chart shows the number of participants at each of the groups.
County FarmersHardin 5Henry 11Jefferson 12Mercer 16Oldham 4Shelby 10Spencer 10Trimble 10Washington 12Total 90
At the focus groups, the MVI/KR team requested that each farmer complete a brief written survey that provided contact information, years farming, principal crops, marketing outlets, and gross sales. The participating farmers returned 73 completed survey forms. In 10 cases, the group was attended by two people from the same farm and they filled out only one survey. In the other cases, the participant chose not to complete the survey. This appendix explores the survey results.
The farmers represented 13 different counties. Mercer (N=12), Henry (N=10), Jefferson (N=9), and Shelby (N=9) counties had the greatest number of participants.
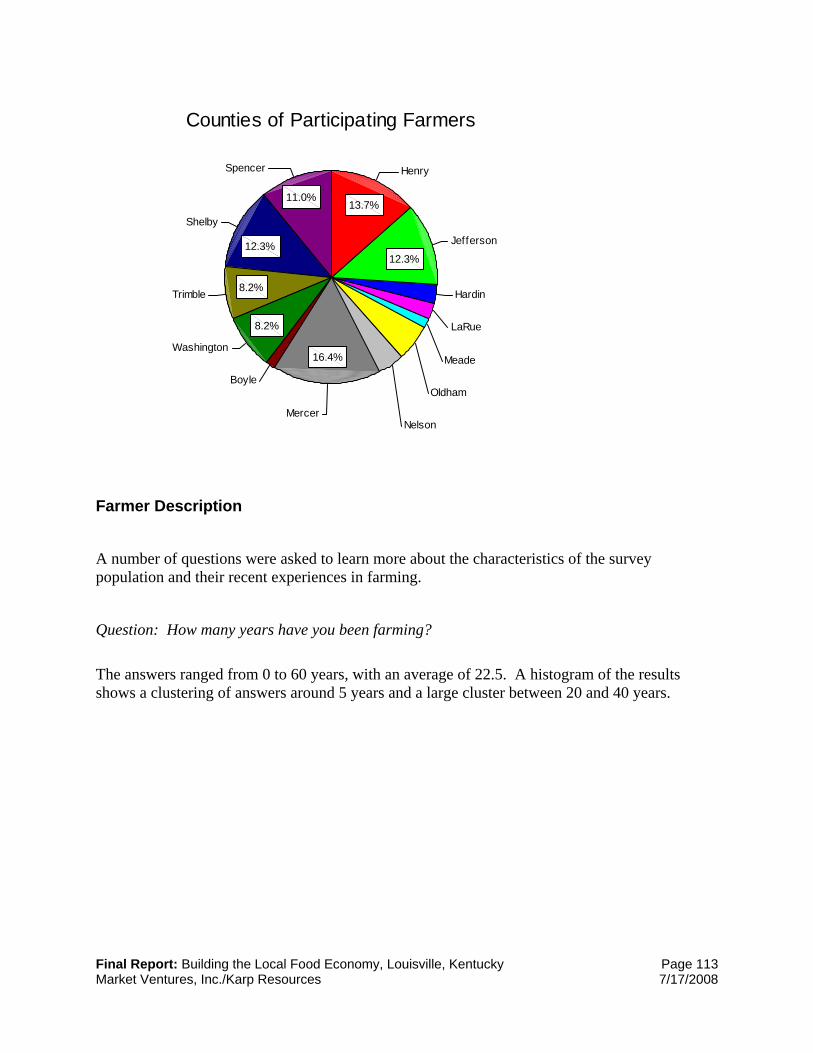
Final Report: Building the Local Food Economy, Louisville, Kentucky Page 113 Market Ventures, Inc./Karp Resources 7/17/2008
Counties of Participating Farmers
11.0%
12.3%
8.2%
8.2%
16.4%
12.3%
13.7%
Spencer
Shelby
Trimble
Washington
Boyle
MercerNelson
Oldham
Meade
LaRue
Hardin
Jefferson
Henry
Farmer Description
A number of questions were asked to learn more about the characteristics of the survey population and their recent experiences in farming.
Question: How many years have you been farming?
The answers ranged from 0 to 60 years, with an average of 22.5. A histogram of the results shows a clustering of answers around 5 years and a large cluster between 20 and 40 years.
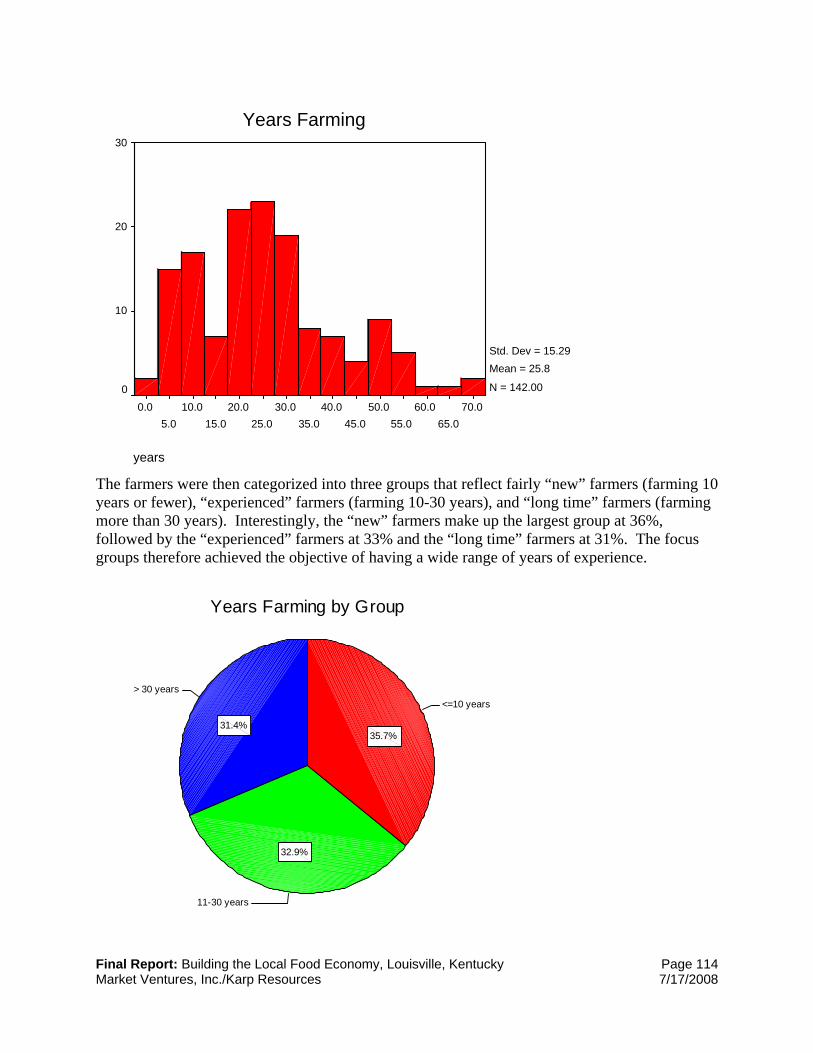
Final Report: Building the Local Food Economy, Louisville, Kentucky Page 114 Market Ventures, Inc./Karp Resources 7/17/2008
years
70.065.0
60.055.0
50.045.0
40.035.0
30.025.0
20.015.0
10.05.0
0.0
Years Farming30
20
10
0
Std. Dev = 15.29 Mean = 25.8
N = 142.00
The farmers were then categorized into three groups that reflect fairly “new” farmers (farming 10 years or fewer), “experienced” farmers (farming 10-30 years), and “long time” farmers (farming more than 30 years). Interestingly, the “new” farmers make up the largest group at 36%, followed by the “experienced” farmers at 33% and the “long time” farmers at 31%. The focus groups therefore achieved the objective of having a wide range of years of experience.
Years Farming by Group
31.4%
32.9%
35.7%
> 30 years
11-30 years
<=10 years
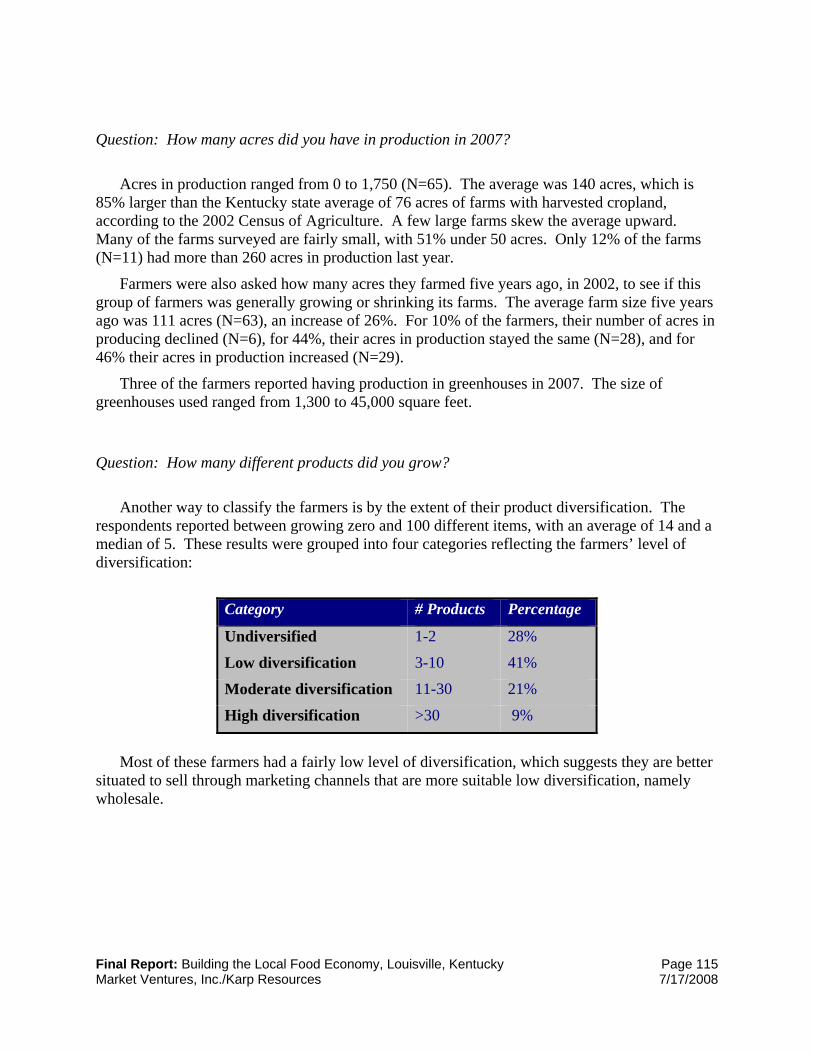
Final Report: Building the Local Food Economy, Louisville, Kentucky Page 115 Market Ventures, Inc./Karp Resources 7/17/2008
Question: How many acres did you have in production in 2007?
Acres in production ranged from 0 to 1,750 (N=65). The average was 140 acres, which is
85% larger than the Kentucky state average of 76 acres of farms with harvested cropland, according to the 2002 Census of Agriculture. A few large farms skew the average upward. Many of the farms surveyed are fairly small, with 51% under 50 acres. Only 12% of the farms (N=11) had more than 260 acres in production last year.
Farmers were also asked how many acres they farmed five years ago, in 2002, to see if this group of farmers was generally growing or shrinking its farms. The average farm size five years ago was 111 acres (N=63), an increase of 26%. For 10% of the farmers, their number of acres in producing declined (N=6), for 44%, their acres in production stayed the same (N=28), and for 46% their acres in production increased (N=29).
Three of the farmers reported having production in greenhouses in 2007. The size of greenhouses used ranged from 1,300 to 45,000 square feet.
Question: How many different products did you grow?
Another way to classify the farmers is by the extent of their product diversification. The
respondents reported between growing zero and 100 different items, with an average of 14 and a median of 5. These results were grouped into four categories reflecting the farmers’ level of diversification:
Category # Products Percentage
Undiversified 1-2 28%
Low diversification 3-10 41%
Moderate diversification 11-30 21%
High diversification >30 9%
Most of these farmers had a fairly low level of diversification, which suggests they are better
situated to sell through marketing channels that are more suitable low diversification, namely wholesale.
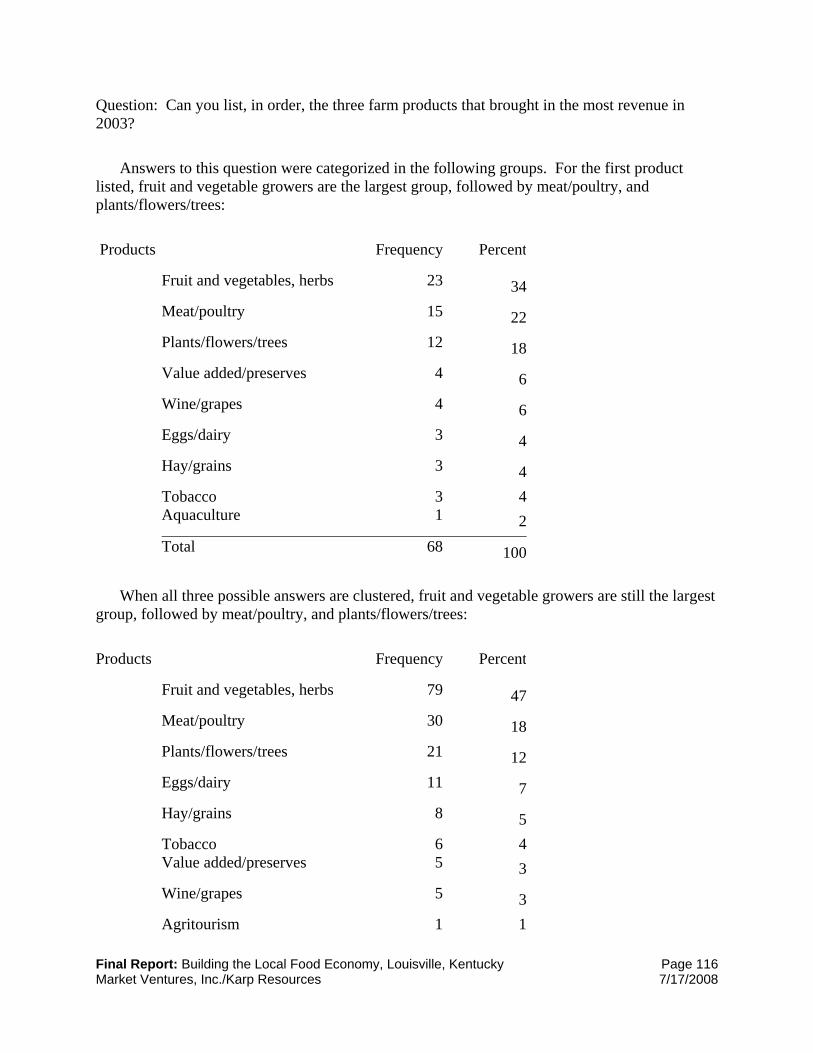
Final Report: Building the Local Food Economy, Louisville, Kentucky Page 116 Market Ventures, Inc./Karp Resources 7/17/2008
Question: Can you list, in order, the three farm products that brought in the most revenue in 2003?
Answers to this question were categorized in the following groups. For the first product
listed, fruit and vegetable growers are the largest group, followed by meat/poultry, and plants/flowers/trees:
Products Frequency Percent
Fruit and vegetables, herbs 23 34
Meat/poultry 15 22
Plants/flowers/trees 12 18
Value added/preserves 4 6
Wine/grapes 4 6
Eggs/dairy 3 4
Hay/grains 3 4
Tobacco 3 4 Aquaculture 1 2
Total 68 100
When all three possible answers are clustered, fruit and vegetable growers are still the largest
group, followed by meat/poultry, and plants/flowers/trees:
Products Frequency Percent
Fruit and vegetables, herbs 79 47
Meat/poultry 30 18
Plants/flowers/trees 21 12
Eggs/dairy 11 7
Hay/grains 8 5
Tobacco 6 4 Value added/preserves 5 3
Wine/grapes 5 3
Agritourism 1 1
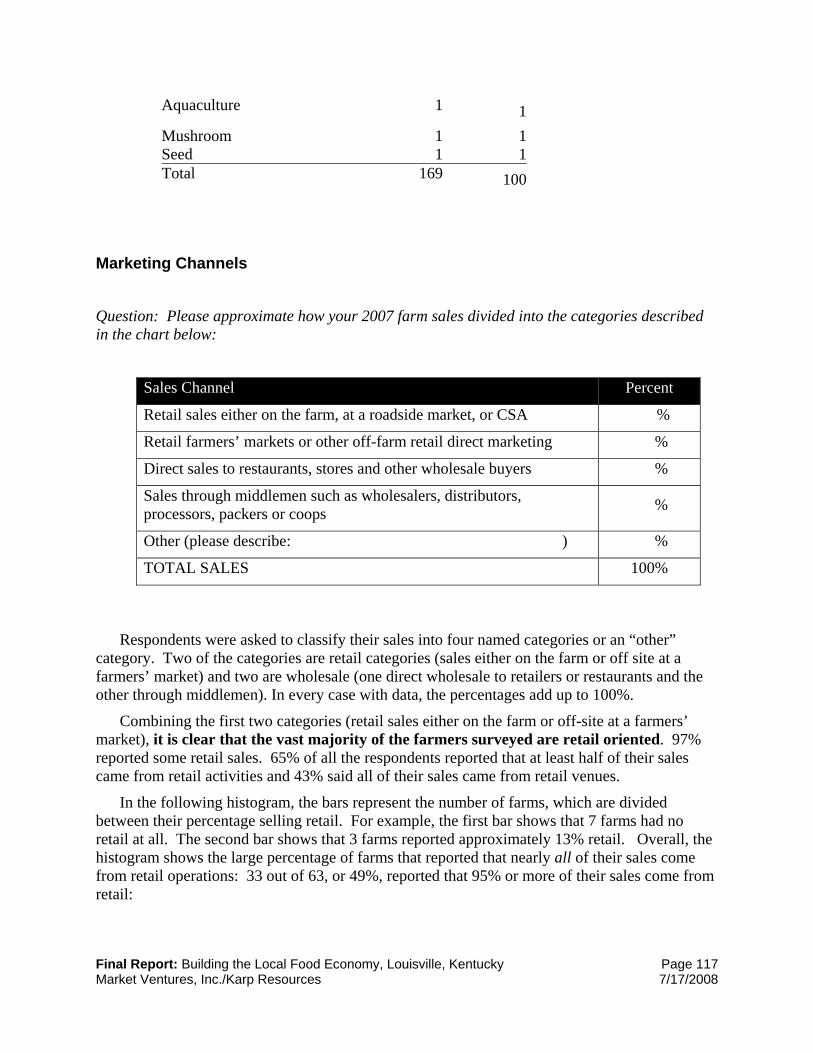
Final Report: Building the Local Food Economy, Louisville, Kentucky Page 117 Market Ventures, Inc./Karp Resources 7/17/2008
Aquaculture 1 1
Mushroom 1 1 Seed 1 1 Total 169 100
Marketing Channels
Question: Please approximate how your 2007 farm sales divided into the categories described in the chart below:
Sales Channel Percent
Retail sales either on the farm, at a roadside market, or CSA %
Retail farmers’ markets or other off-farm retail direct marketing %
Direct sales to restaurants, stores and other wholesale buyers %
Sales through middlemen such as wholesalers, distributors, processors, packers or coops %
Other (please describe: ) %
TOTAL SALES 100%
Respondents were asked to classify their sales into four named categories or an “other”
category. Two of the categories are retail categories (sales either on the farm or off site at a farmers’ market) and two are wholesale (one direct wholesale to retailers or restaurants and the other through middlemen). In every case with data, the percentages add up to 100%.
Combining the first two categories (retail sales either on the farm or off-site at a farmers’ market), it is clear that the vast majority of the farmers surveyed are retail oriented. 97% reported some retail sales. 65% of all the respondents reported that at least half of their sales came from retail activities and 43% said all of their sales came from retail venues.
In the following histogram, the bars represent the number of farms, which are divided between their percentage selling retail. For example, the first bar shows that 7 farms had no retail at all. The second bar shows that 3 farms reported approximately 13% retail. Overall, the histogram shows the large percentage of farms that reported that nearly all of their sales come from retail operations: 33 out of 63, or 49%, reported that 95% or more of their sales come from retail:
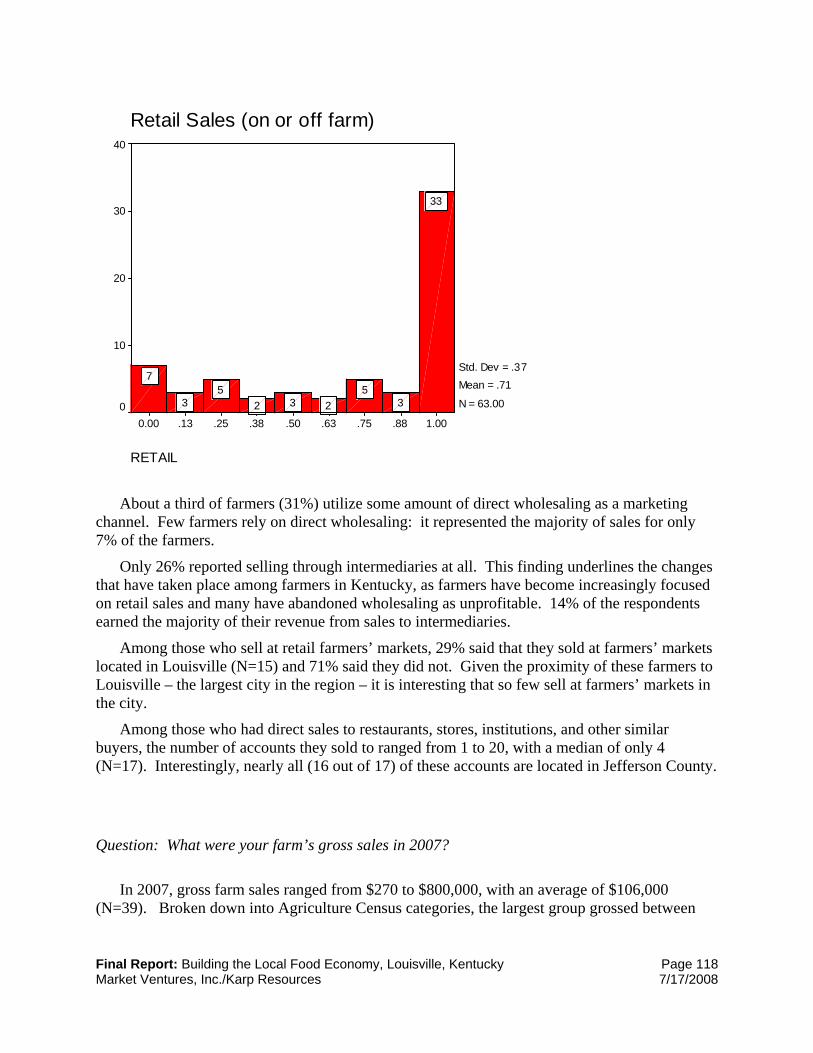
Final Report: Building the Local Food Economy, Louisville, Kentucky Page 118 Market Ventures, Inc./Karp Resources 7/17/2008
RETAIL
1.00.88.75.63.50.38.25.130.00
Retail Sales (on or off farm)40
30
20
10
0
Std. Dev = .37 Mean = .71
N = 63.00
33
35
2325
3
7
About a third of farmers (31%) utilize some amount of direct wholesaling as a marketing channel. Few farmers rely on direct wholesaling: it represented the majority of sales for only 7% of the farmers.
Only 26% reported selling through intermediaries at all. This finding underlines the changes that have taken place among farmers in Kentucky, as farmers have become increasingly focused on retail sales and many have abandoned wholesaling as unprofitable. 14% of the respondents earned the majority of their revenue from sales to intermediaries.
Among those who sell at retail farmers’ markets, 29% said that they sold at farmers’ markets located in Louisville (N=15) and 71% said they did not. Given the proximity of these farmers to Louisville – the largest city in the region – it is interesting that so few sell at farmers’ markets in the city.
Among those who had direct sales to restaurants, stores, institutions, and other similar buyers, the number of accounts they sold to ranged from 1 to 20, with a median of only 4 (N=17). Interestingly, nearly all (16 out of 17) of these accounts are located in Jefferson County.
Question: What were your farm’s gross sales in 2007?
In 2007, gross farm sales ranged from $270 to $800,000, with an average of $106,000
(N=39). Broken down into Agriculture Census categories, the largest group grossed between
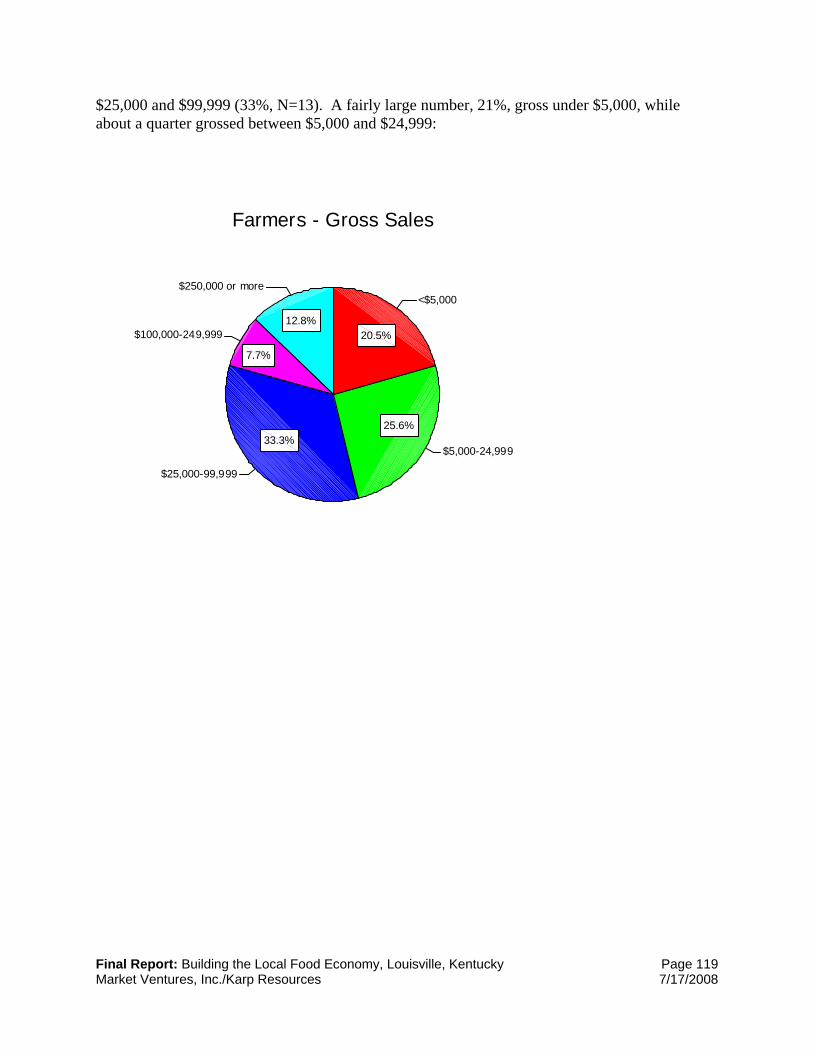
Final Report: Building the Local Food Economy, Louisville, Kentucky Page 119 Market Ventures, Inc./Karp Resources 7/17/2008
$25,000 and $99,999 (33%, N=13). A fairly large number, 21%, gross under $5,000, while about a quarter grossed between $5,000 and $24,999:
Farmers - Gross Sales
12.8%
7.7%
33.3%25.6%
20.5%
$250,000 or more
$100,000-249,999
$25,000-99,999
$5,000-24,999
<$5,000

Final Report: Building the Local Food Economy, Louisville, Kentucky Page 120 Market Ventures, Inc./Karp Resources 7/17/2008
Appendix D: Farmer Focus Group Results
Henry County Tuesday, March 4, 2008
Henry County Focus Group
Concept Score Farmers Market 14Meat Processing 13Indoor Public Market 10Restaurants 5Food Processing 5Agritourism 4Schools and Institutions 2CSA 2Create / Expand Distribution 2Branding / Packaging 2Wholesale Farmers Market 0New Farmer Development 0Supermarkets and Chain Buyers -23
• 10 farms, 11 farmers participated
• Farmers were very small in scale, with a range of sophistication in production and marketing.
• Very community minded—really wanted to know who they’re selling to
o Less interested in increasing revenue
• Content with current markets
• Strong interest in collective marketing of the county
• Interested in “growing new farmers”—tapping into Louisville’s human resources for new farmers and farm laborers
• Housing and labor needs for agricultural workers is key problem facing farmers interested in growing
• Disappointment in State Parks’ local food initiative has led to distrust of government food initiatives
• Zoning as barrier to agritourism (i.e. limits to number of hotels, bed and breakfasts, etc.)
• Strong interest in marketing to private schools, but not public
• Concern that there are too many farmers markets in Louisville—not enough farmers to support all markets simultaneously (markets are beginning to undermine each other)
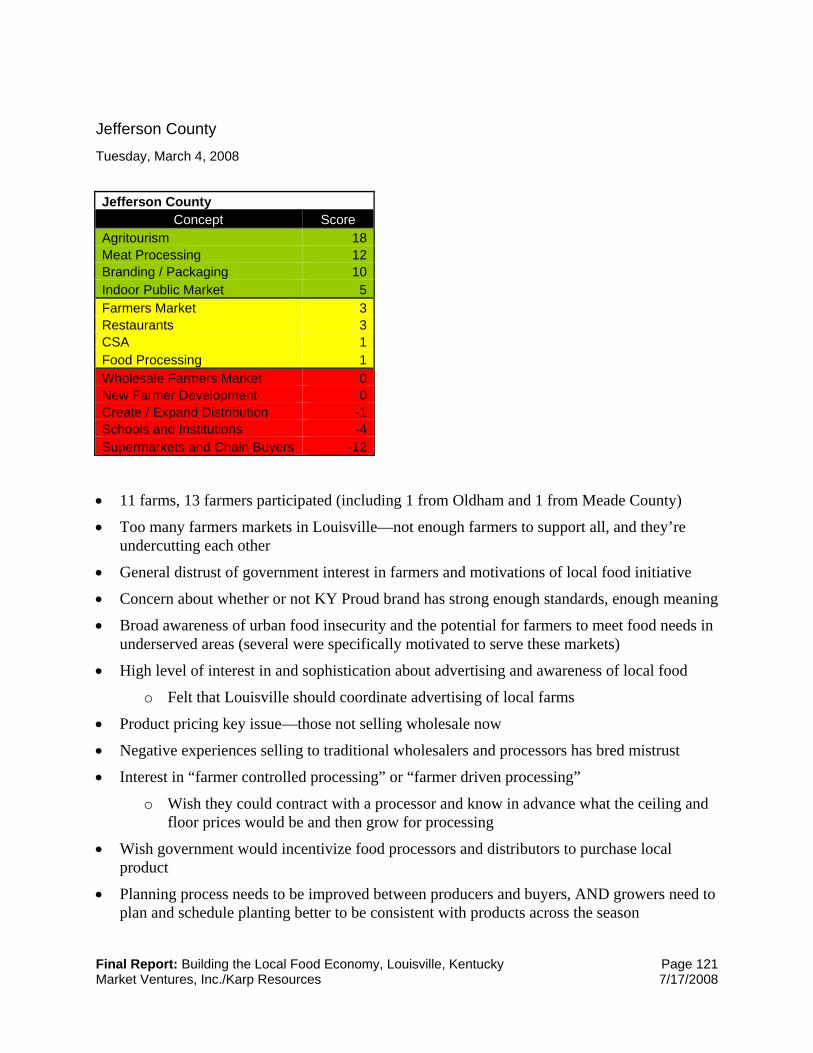
Final Report: Building the Local Food Economy, Louisville, Kentucky Page 121 Market Ventures, Inc./Karp Resources 7/17/2008
Jefferson County Tuesday, March 4, 2008
Jefferson County
Concept Score Agritourism 18Meat Processing 12Branding / Packaging 10Indoor Public Market 5Farmers Market 3Restaurants 3CSA 1Food Processing 1Wholesale Farmers Market 0New Farmer Development 0Create / Expand Distribution -1Schools and Institutions -4Supermarkets and Chain Buyers -12
• 11 farms, 13 farmers participated (including 1 from Oldham and 1 from Meade County)
• Too many farmers markets in Louisville—not enough farmers to support all, and they’re undercutting each other
• General distrust of government interest in farmers and motivations of local food initiative
• Concern about whether or not KY Proud brand has strong enough standards, enough meaning
• Broad awareness of urban food insecurity and the potential for farmers to meet food needs in underserved areas (several were specifically motivated to serve these markets)
• High level of interest in and sophistication about advertising and awareness of local food
o Felt that Louisville should coordinate advertising of local farms
• Product pricing key issue—those not selling wholesale now
• Negative experiences selling to traditional wholesalers and processors has bred mistrust
• Interest in “farmer controlled processing” or “farmer driven processing”
o Wish they could contract with a processor and know in advance what the ceiling and floor prices would be and then grow for processing
• Wish government would incentivize food processors and distributors to purchase local product
• Planning process needs to be improved between producers and buyers, AND growers need to plan and schedule planting better to be consistent with products across the season
Final Report: Building the Local Food Economy, Louisville, Kentucky Page 122 Market Ventures, Inc./Karp Resources 7/17/2008
• Haymarket—general agreement that the wholesaler/farmer shared space model had a lot of potential—a cleaner Haymarket with better management would be very appealing
• Meat processing located in Jefferson County would draw farmers back into the County and would reinvigorate farmer interest in the county
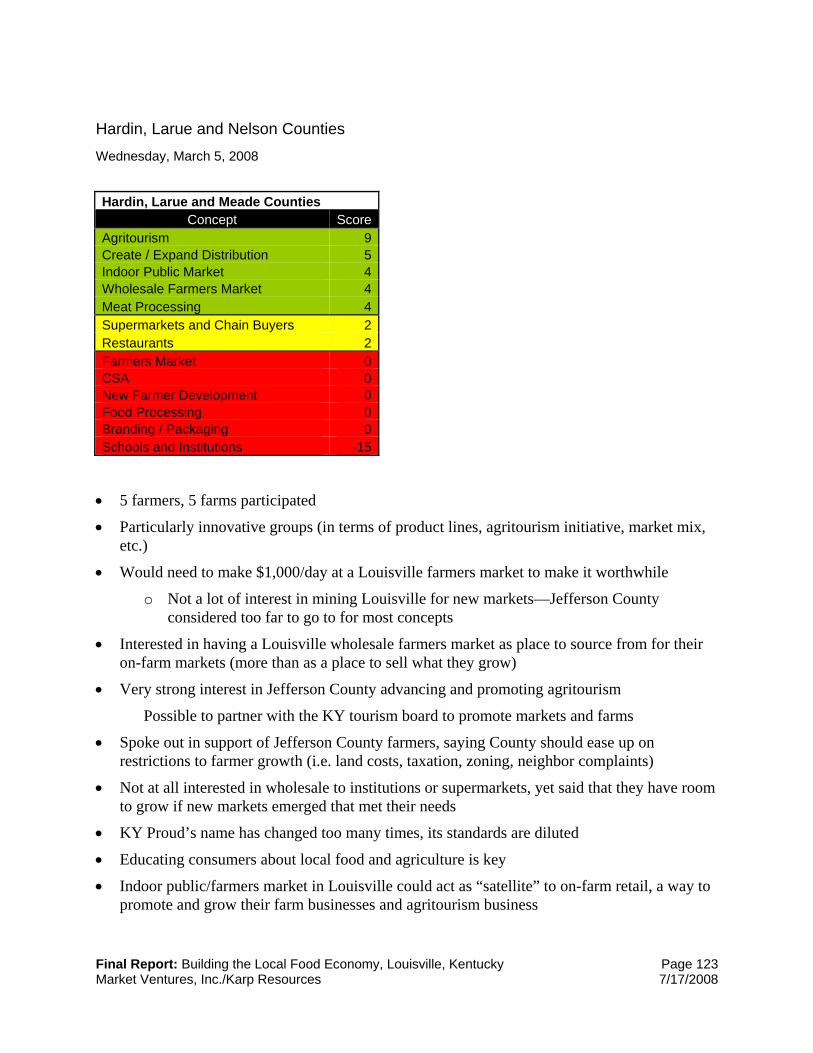
Final Report: Building the Local Food Economy, Louisville, Kentucky Page 123 Market Ventures, Inc./Karp Resources 7/17/2008
Hardin, Larue and Nelson Counties Wednesday, March 5, 2008
Hardin, Larue and Meade Counties
Concept ScoreAgritourism 9Create / Expand Distribution 5Indoor Public Market 4Wholesale Farmers Market 4Meat Processing 4Supermarkets and Chain Buyers 2Restaurants 2Farmers Market 0CSA 0New Farmer Development 0Food Processing 0Branding / Packaging 0Schools and Institutions -15
• 5 farmers, 5 farms participated
• Particularly innovative groups (in terms of product lines, agritourism initiative, market mix, etc.)
• Would need to make $1,000/day at a Louisville farmers market to make it worthwhile
o Not a lot of interest in mining Louisville for new markets—Jefferson County considered too far to go to for most concepts
• Interested in having a Louisville wholesale farmers market as place to source from for their on-farm markets (more than as a place to sell what they grow)
• Very strong interest in Jefferson County advancing and promoting agritourism
Possible to partner with the KY tourism board to promote markets and farms
• Spoke out in support of Jefferson County farmers, saying County should ease up on restrictions to farmer growth (i.e. land costs, taxation, zoning, neighbor complaints)
• Not at all interested in wholesale to institutions or supermarkets, yet said that they have room to grow if new markets emerged that met their needs
• KY Proud’s name has changed too many times, its standards are diluted
• Educating consumers about local food and agriculture is key
• Indoor public/farmers market in Louisville could act as “satellite” to on-farm retail, a way to promote and grow their farm businesses and agritourism business
Final Report: Building the Local Food Economy, Louisville, Kentucky Page 124 Market Ventures, Inc./Karp Resources 7/17/2008
• Processing facilities would be good if in their local community
• Hard to find workers who can “represent us well” (to buyers, at markets, etc.)

Final Report: Building the Local Food Economy, Louisville, Kentucky Page 125 Market Ventures, Inc./Karp Resources 7/17/2008
Oldham County Wednesday, March 5, 2008
Oldham County
Concept Score Indoor Public Market 9Farmers Market 3Agritourism 3Restaurants 2Create / Expand Distribution 2CSA 1Wholesale Farmers Market 1Supermarkets and Chain Buyers 0New Farmer Development 0Food Processing 0Meat Processing 0Branding / Packaging 0Schools and Institutions -9
• 3 farms, 4 farmers participated
• Improved coordination of Louisville farmers markets would help consumers find farmers and help farmers find new markets
o Current lack of coordination is a problem, farmers not assured of balance of vendors so they can’t plan what to grow accordingly
• Building consumer awareness is key
• More interested in “certification” than in branding
• Felt restaurants should “should stand on their own”, that government shouldn’t invest in them
• KY Proud has been effective in terms of rand recognition, but all wonder if its standards are meaningful
• Felt two indoor markets in dense population parts of the county would be better than one in downtown Louisville
• Downtown public market should be scaled and paced to match changing downtown demographics—phase it in
o combination of wholesale and retail, run at different days and times, would be ideal
• Liability issues limit agri-tourism potential
o General lack of interest in farm visitors, but interested in farmers visiting each others’ farms in coordinated way for education purposes
Final Report: Building the Local Food Economy, Louisville, Kentucky Page 126 Market Ventures, Inc./Karp Resources 7/17/2008
• Scale-ability: farmers enjoy the “hands-on” aspect of farming; scaling up would be a lifestyle shift that isn’t necessarily desirable
• Distrustful of third party– more likely to trust farmer-run distribution companies
• Meat processing—interested in increased capacity for value-add meat products and would utlize a facility in Jefferson County
o Concerned about animal stress in transport to further away facilities
• Processors should be priced for small scale orders
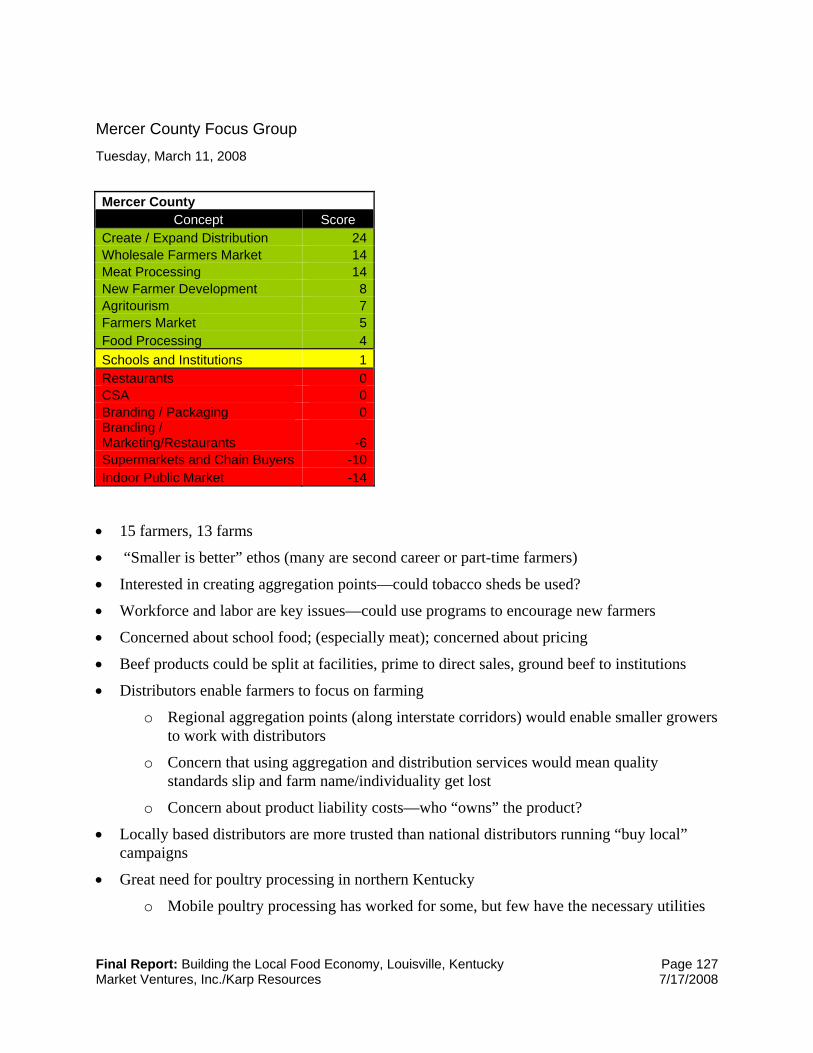
Final Report: Building the Local Food Economy, Louisville, Kentucky Page 127 Market Ventures, Inc./Karp Resources 7/17/2008
Mercer County Focus Group Tuesday, March 11, 2008
Mercer County
Concept Score Create / Expand Distribution 24Wholesale Farmers Market 14Meat Processing 14New Farmer Development 8Agritourism 7Farmers Market 5Food Processing 4Schools and Institutions 1Restaurants 0CSA 0Branding / Packaging 0Branding / Marketing/Restaurants -6Supermarkets and Chain Buyers -10Indoor Public Market -14
• 15 farmers, 13 farms
• “Smaller is better” ethos (many are second career or part-time farmers)
• Interested in creating aggregation points—could tobacco sheds be used?
• Workforce and labor are key issues—could use programs to encourage new farmers
• Concerned about school food; (especially meat); concerned about pricing
• Beef products could be split at facilities, prime to direct sales, ground beef to institutions
• Distributors enable farmers to focus on farming
o Regional aggregation points (along interstate corridors) would enable smaller growers to work with distributors
o Concern that using aggregation and distribution services would mean quality standards slip and farm name/individuality get lost
o Concern about product liability costs—who “owns” the product?
• Locally based distributors are more trusted than national distributors running “buy local” campaigns
• Great need for poultry processing in northern Kentucky
o Mobile poultry processing has worked for some, but few have the necessary utilities

Final Report: Building the Local Food Economy, Louisville, Kentucky Page 128 Market Ventures, Inc./Karp Resources 7/17/2008
o Facility should be located on interstate corridor
• Some have visited produce auctions and wonder if they would work in Louisville
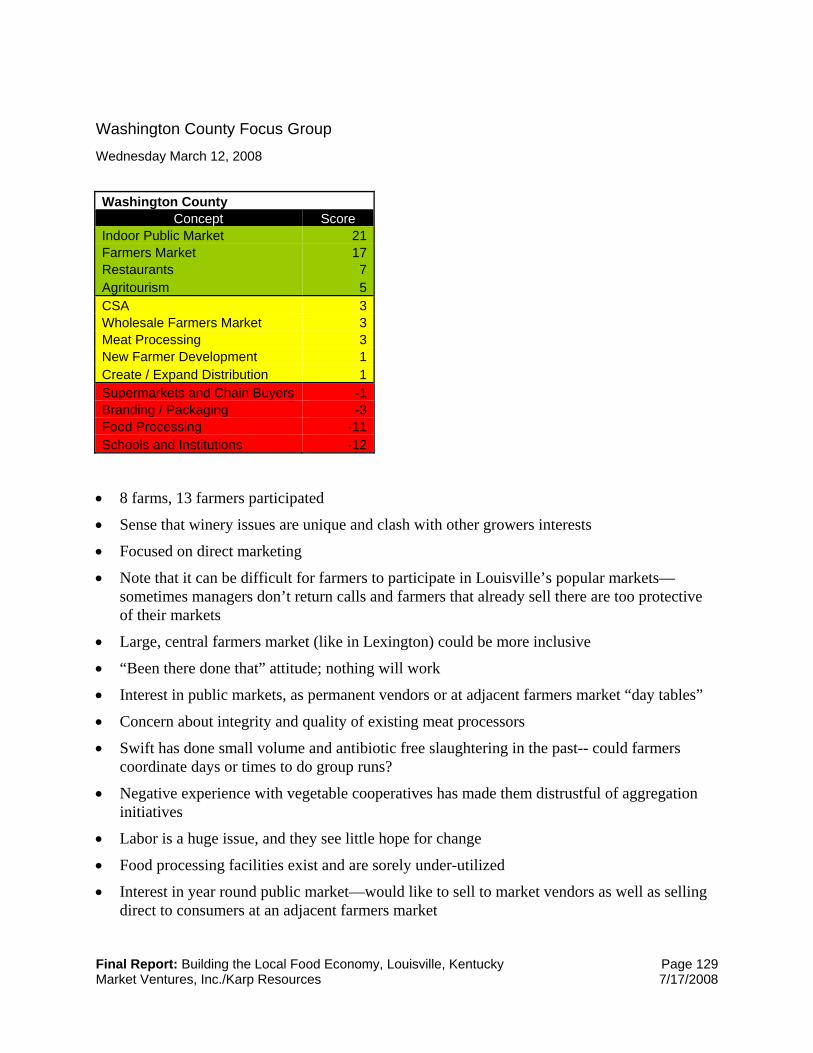
Final Report: Building the Local Food Economy, Louisville, Kentucky Page 129 Market Ventures, Inc./Karp Resources 7/17/2008
Washington County Focus Group Wednesday March 12, 2008
Washington County
Concept Score Indoor Public Market 21Farmers Market 17Restaurants 7Agritourism 5CSA 3Wholesale Farmers Market 3Meat Processing 3New Farmer Development 1Create / Expand Distribution 1Supermarkets and Chain Buyers -1Branding / Packaging -3Food Processing -11Schools and Institutions -12
• 8 farms, 13 farmers participated
• Sense that winery issues are unique and clash with other growers interests
• Focused on direct marketing
• Note that it can be difficult for farmers to participate in Louisville’s popular markets—sometimes managers don’t return calls and farmers that already sell there are too protective of their markets
• Large, central farmers market (like in Lexington) could be more inclusive
• “Been there done that” attitude; nothing will work
• Interest in public markets, as permanent vendors or at adjacent farmers market “day tables”
• Concern about integrity and quality of existing meat processors
• Swift has done small volume and antibiotic free slaughtering in the past-- could farmers coordinate days or times to do group runs?
• Negative experience with vegetable cooperatives has made them distrustful of aggregation initiatives
• Labor is a huge issue, and they see little hope for change
• Food processing facilities exist and are sorely under-utilized
• Interest in year round public market—would like to sell to market vendors as well as selling direct to consumers at an adjacent farmers market
Final Report: Building the Local Food Economy, Louisville, Kentucky Page 130 Market Ventures, Inc./Karp Resources 7/17/2008
• Concern that public market model won’t work as well for perishable products
• Wish more restaurants were using the KY Proud Restaurant Rewards program
• More campaigns promoting restaurants that buy local would be useful
• Supermarket sales volumes don’t seem appropriate for smaller growers (and distrust of aggregation and coop models makes that market less accessible)
• Wine and bourbon trails have been successful—this model could be expanded to include produce and other local farm products
Processing small volumes of meat at small facilities is cost-prohibitive
o Little trust with existing processors—farmers are concerned that they’re not getting meat from their own animals back
Wholesale farmers market wouldn’t work.
Produce Terminal is nearing extinction, Haymarket failed, and the pressures that ran them out of business are only greater now
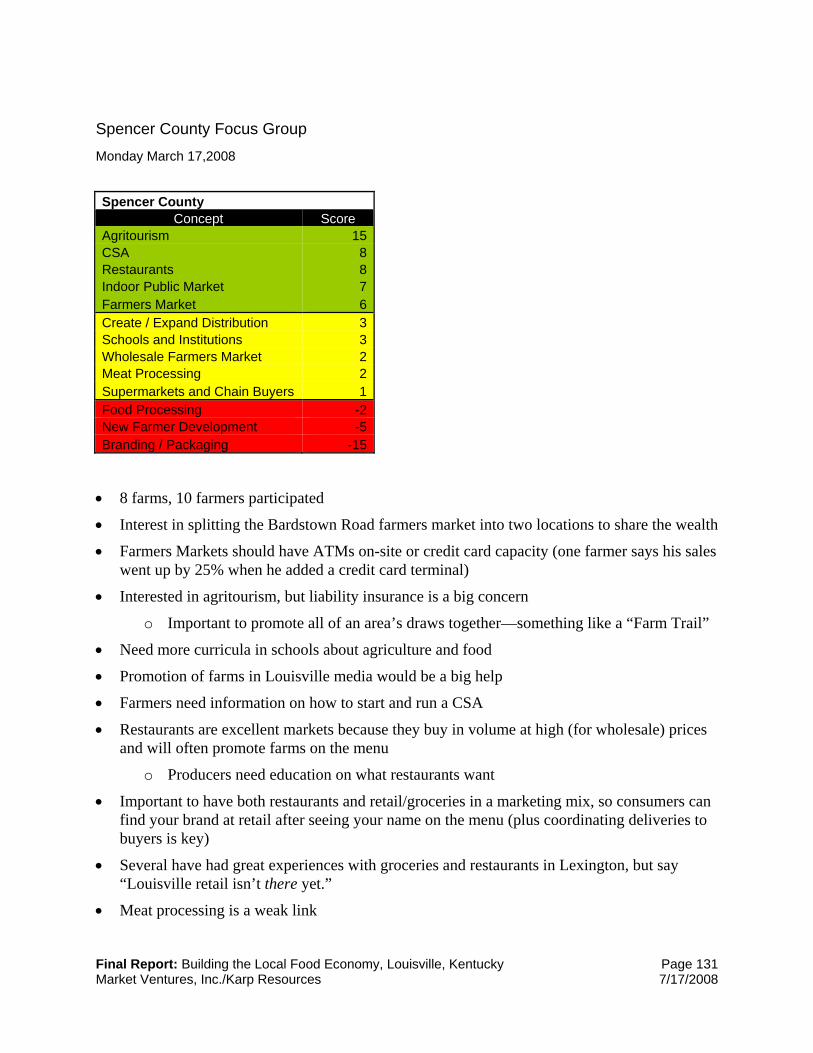
Final Report: Building the Local Food Economy, Louisville, Kentucky Page 131 Market Ventures, Inc./Karp Resources 7/17/2008
Spencer County Focus Group Monday March 17,2008
Spencer County
Concept Score Agritourism 15CSA 8Restaurants 8Indoor Public Market 7Farmers Market 6Create / Expand Distribution 3Schools and Institutions 3Wholesale Farmers Market 2Meat Processing 2Supermarkets and Chain Buyers 1Food Processing -2New Farmer Development -5Branding / Packaging -15
• 8 farms, 10 farmers participated
• Interest in splitting the Bardstown Road farmers market into two locations to share the wealth
• Farmers Markets should have ATMs on-site or credit card capacity (one farmer says his sales went up by 25% when he added a credit card terminal)
• Interested in agritourism, but liability insurance is a big concern
o Important to promote all of an area’s draws together—something like a “Farm Trail”
• Need more curricula in schools about agriculture and food
• Promotion of farms in Louisville media would be a big help
• Farmers need information on how to start and run a CSA
• Restaurants are excellent markets because they buy in volume at high (for wholesale) prices and will often promote farms on the menu
o Producers need education on what restaurants want
• Important to have both restaurants and retail/groceries in a marketing mix, so consumers can find your brand at retail after seeing your name on the menu (plus coordinating deliveries to buyers is key)
• Several have had great experiences with groceries and restaurants in Lexington, but say “Louisville retail isn’t there yet.”
• Meat processing is a weak link
Final Report: Building the Local Food Economy, Louisville, Kentucky Page 132 Market Ventures, Inc./Karp Resources 7/17/2008
o Need chicken processing in north central Kentucky—demand exists for it now and more farmers would raise chickens if processing were more available
• Several have had good experiences selling to Grasshoppers. It works for restaurants and it works for them (including the pricing).
• Farmers need someone between them and buyers to communicate consumer demand, and market and sell products
• Haymarket idea (mixing direct marketing and traditional wholesale) was so good, but it depends on finding the right management
• Louisville should support, promote and coordinate farmers markets—there might be too many.
• Cannery or increased food processing is needed, including places farmers to preserve their own products for direct sales and companies that produce locally branded canned or frozen products that farmers can sell into.
o Need a market for non-premium product

Final Report: Building the Local Food Economy, Louisville, Kentucky Page 133 Market Ventures, Inc./Karp Resources 7/17/2008
Shelby County Focus Group Tuesday March 18,2008
Shelby County
Concept Score Farmers Market 11Restaurants 9Meat Processing 9CSA 8Indoor Public Market 5Schools and Institutions 4Agritourism 4Food Processing 3Wholesale Farmers Market 2Create / Expand Distribution 1Supermarkets and Chain Buyers -3New Farmer Development -5Branding / Packaging -9
• 12 farmers participated
• Public market is desirable, particularly selling to non-farmer vendors (as opposed to manning a booth)—need quality controls in ensure that what’s sold as “local” is actually local
o Year-round marketplace is important.
o Concern about how it would impact existing farmers markets.
o Concern that people would not be willing to leave their neighborhoods to go to a central market (perception that “Louisville people don’t like to leave their neighborhoods”)
• Farmers markets in Louisville should be more like agritourism, more entertaining, more of a destination
o More coordinate management and promotion would help, but some feel the independent nature of the markets is important
• Meat and dairy processing are big needs
• Wish customers were not so used to cheap food—“value is not just what you pay”
o Some feel farmers need to work together in groups more often, to aggregate, brand and distribute product—others feel that a farm loses its identity when it feeds product into a brand (e.g. Rebekah Grace)
• Restaurants are excellent customers and promoters of small farms
• Farmers need to learn how to talk to chefs and ask what they want
Final Report: Building the Local Food Economy, Louisville, Kentucky Page 134 Market Ventures, Inc./Karp Resources 7/17/2008
• Enthusiasm about agritourism, but concern about liability insurance (though one farmers notes that insurance is a fixed cost that you just commit to and plan for)
o Think increasing fuel prices could mean more travel close to home, i.e. farms.
• Promoting nearby farms to Louisville residents would be very helpful

Final Report: Building the Local Food Economy, Louisville, Kentucky Page 135 Market Ventures, Inc./Karp Resources 7/17/2008
Trimble County Focus Group March 19, 2008
Trimble County
Concept Score Indoor Public Market 14Meat Processing 9Food Processing 8CSA 6Farmers Market 4Restaurants 4Create / Expand Distribution 4Agritourism 1Supermarkets and Chain Buyers 0Schools and Institutions 0New Farmer Development -2Wholesale Farmers Market -9Branding / Packaging -12
• 9 farmers, 6 farms participated
• Facilities for markets are important—better sales happen at better facilities because they feel like real places and draw broader audiences
• Food processing facilities are needed—medium scale to meet institutional needs and smaller scale for more “premium” products
o Concerned that farmers couldn’t meet the demand of a medium to large scale facility
• Year-round sales are key—indoor market and processing facility would help
• “Talking about fruits and vegetables is just nickels and dimes. If you want to talk dollars in Kentucky, you have to talk about beef.”
o Create a central-KY facility for meat/beef processing to keep KY raised animals in KY (would create jobs, benefit consumers, etc.)
Would travel up to 60 miles to a new facility
o Most beef producers from Trimble were going to an Indiana processing facility
• Cumberland Meats in Paint Lick, KY is processing sheep and goats—excellent model
• Perception that increased standards (or creating a brand that would many farms would feed into) would result in product uniformity, would undermine farmers’ efforts toward product differentiation, and would result in their product decreasing in value
• Wholesale prices will never be enough
• CSAs were universally loved as a dependable source of revenue

Final Report: Building the Local Food Economy, Louisville, Kentucky Page 136 Market Ventures, Inc./Karp Resources 7/17/2008
• Farmers need help connecting with chefs and knowing what they want
• Would be great to coordinate transportation together, aggregate product, lower costs on transportation, and time costs
o Very interested in idea of shared-use cooling/aggregation facility—could be located at Extension if time and other resources could be given to it
• Oversight/coordination for farmers markets would be useful—make it so there are farmers markets every day somewhere in the city but they aren’t competing with each other
• Need markets for “seconds” or lower grade product
• Interest in mobile markets and home delivery services
• Important to target the demographic that wants local food right now, strengthen that connection
Final Report: Building the Local Food Economy, Louisville, Kentucky Page 137 Market Ventures, Inc./Karp Resources 7/17/2008
Appendix E: CSA Resources
Madison Area Community Supported Agriculture Coalition MACSAC: www.macsac.org, 608-226-0300
MACSAC works to create a “sustainable, just, and locally based food system in Southern Wisconsin by promoting and supporting CSA farms, coordinating community and farmer education programs about the benefits of locally, sustainably grown foods.” The organization works with 34 farms that have go through a peer review application and interview process. Each provides traditional CSA vegetable shares.
MACSAC’s two employees and numerous volunteers promote local agriculture by arranging events, including open houses and a “Bike the Barns” bicycle farm tour that occurred last year for the first time. They have also published a successful CSA cookbook, From Asparagus to Zucchini: A Guide to Cooking Farm-Fresh Seasonal Produce. MACSAC has also lobbied to establish an innovative health insurance rebate for CSA members covered by four regional HMO’s. Participating HMO’s provide a cash rebate up to $200 off the cost of purchasing a CSA share from a MACSAC farm.
Just Food, New York City www.justfood.org, 212-645-9880
“Just Food is a non-profit organization that works to develop a just and sustainable food system in the New York City region.” Although the organization has since grown and developed additional programming, Just Food began as a resource for community groups wanting to start CSA sites in their neighborhood. A unique aspect of Just Food’s CSA model is the role of the “core group.” This is group of CSA members that act as managers for their CSA sites logistics. They recruit members, collect payment, manage weekly distribution, publish weekly newsletters, as well as other administrative tasks, all of which allow the farmer to focus on growing their products.
Just Food publishes the CSA in NYC Toolkit, which provides a step-by-step guide to starting a CSA site. They also provide monthly trainings for new CSA organizers, as well as coordinating an annual CSA conference. Farmers in Just Food’s program go through an application process and peer review before they are matched with a core group. Currently there are (number of) farmers working with 49 CSA sites throughout the city.
CSA Learning Center, Angelic Organics www.csalearningcenter.org; 815-389-8455
Final Report: Building the Local Food Economy, Louisville, Kentucky Page 138 Market Ventures, Inc./Karp Resources 7/17/2008
The Learning Center is the non-profit branch of Angelic Organics, a pioneering CSA farm in Illinois, which provides food for over 1,400 families. The Learning Center, “empowers people to create sustainable communities of soil, plants, animals and people through educational, creative, and experiential programs. Their primary focus is to provide training and educational resources for the next generation of sustainable farmers. They work closely with CRAFT (Collaborative Regional Alliance for Farmer Training), and other farm alliances to provide courses and events for new and future farmers.
The CSA Learning Center expanded its programming in 2002 to include urban agriculture initiatives. First they launched Roots & Wings, a youth gardening and leadership program in Rockford, and they started Growing Home, an urban farm in Chicago.
Final Report: Building the Local Food Economy, Louisville, Kentucky Page 139 Market Ventures, Inc./Karp Resources 7/17/2008
Appendix F: Downtown Agriculture Facility Pro Forma

Category
Number
Description and Limitations
Baked goods – bread and desserts*
2-3
At least one baked on premises. Products could include breads, rolls, bagels, biscuits, and muffins. The bakeries should include some baked dessert items, preferably ones that complement rather than compete directly with the dessert baker. The dessert bakers should specialize in some of the following products: brownies, cookies, cakes, sweet rolls, coffee cakes, doughnuts, pies, tarts, or turnovers.
Dairy/Cheese and Dairy/Dessert
2
Dairy products provided by a local dairy, such as specialty bottled milk, organic yogurt, butter, soy products, and other products not commonly available, such as goat’s milk. The cheese vendor should offer a wide variety of fresh and aged cheeses, perhaps focusing on a particular region or type of cheese. May sell crackers but no bread. The dairy/dessert vendor should be permitted to sell ice cream.
Deli 1-2 Deli can sell cold cuts, patés, sliced cheeses, fresh salads, condiments, and prepared sandwiches, but no bread except what is used for sandwiches. The Italian deli would include Italian meats, olives, and pasta.
Meat and poultry*
2-3
Beef, pork, and lamb (preferably no poultry, although could be specialty concept such as organic meat and poultry). Emphasis on uncooked, semi-prepared or smoked products. No cold cuts or food for on-premises eating. Butchering and other activities, such as preparing sausages, should be done on premises. Poultry vendor should sell both whole and cut up fresh poultry. Specialty poultry is desirable, such as free-range or game birds, or a stall that specializes in lines such as turkey products. A portion of their display may be fresh eggs and could have a rotisserie.
Produce*
2
Tenants should offer a wide range of fresh fruits and vegetables, including organics, with few prepackaged products.
Seafood*
1
Fresh and smoked seafood
Specialty and ethnic food
3-5
Products could include pasta/Italian specialties, Mexican and other ethnic foods, soup, candy, fresh squeezed juice, health foods/vitamins, coffees/teas, spices, condiments, and other specialty food products. A coffee stall could include an espresso bar with seating and simple cookies/biscotti.
Wine/beer
1
Focus on local wines and beer
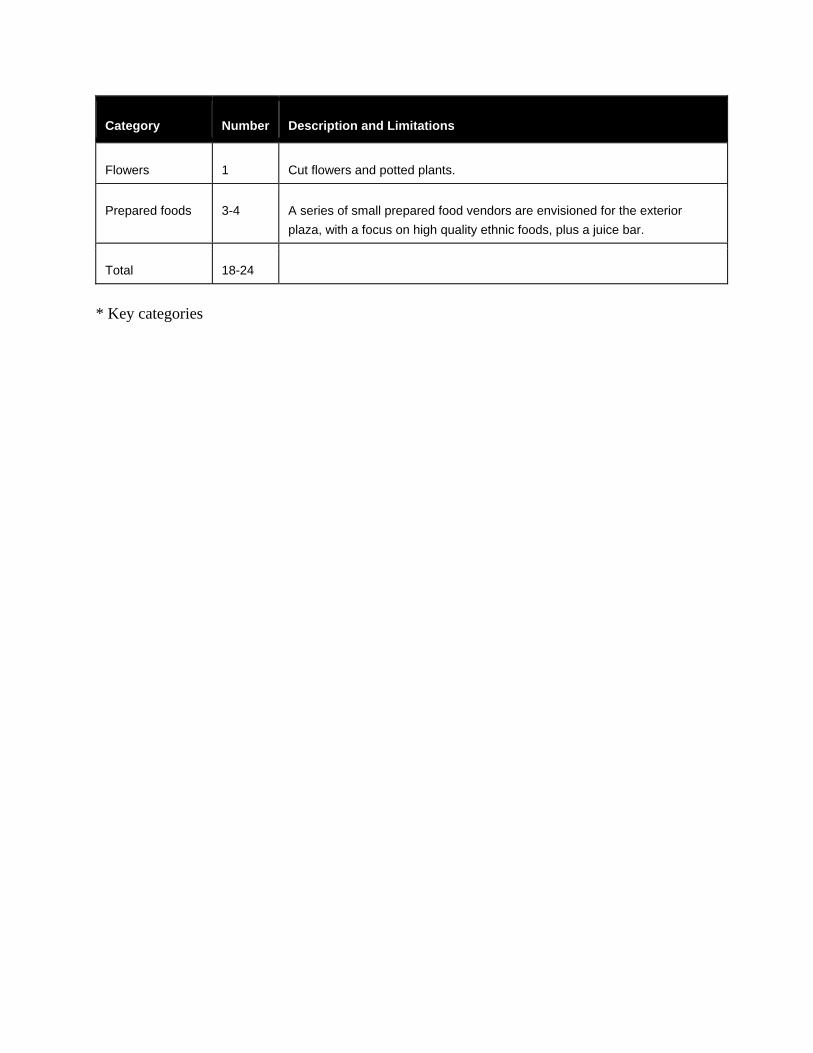
Category
Number
Description and Limitations
Flowers
1
Cut flowers and potted plants.
Prepared foods
3-4
A series of small prepared food vendors are envisioned for the exterior plaza, with a focus on high quality ethnic foods, plus a juice bar.
Total
18-24
* Key categories
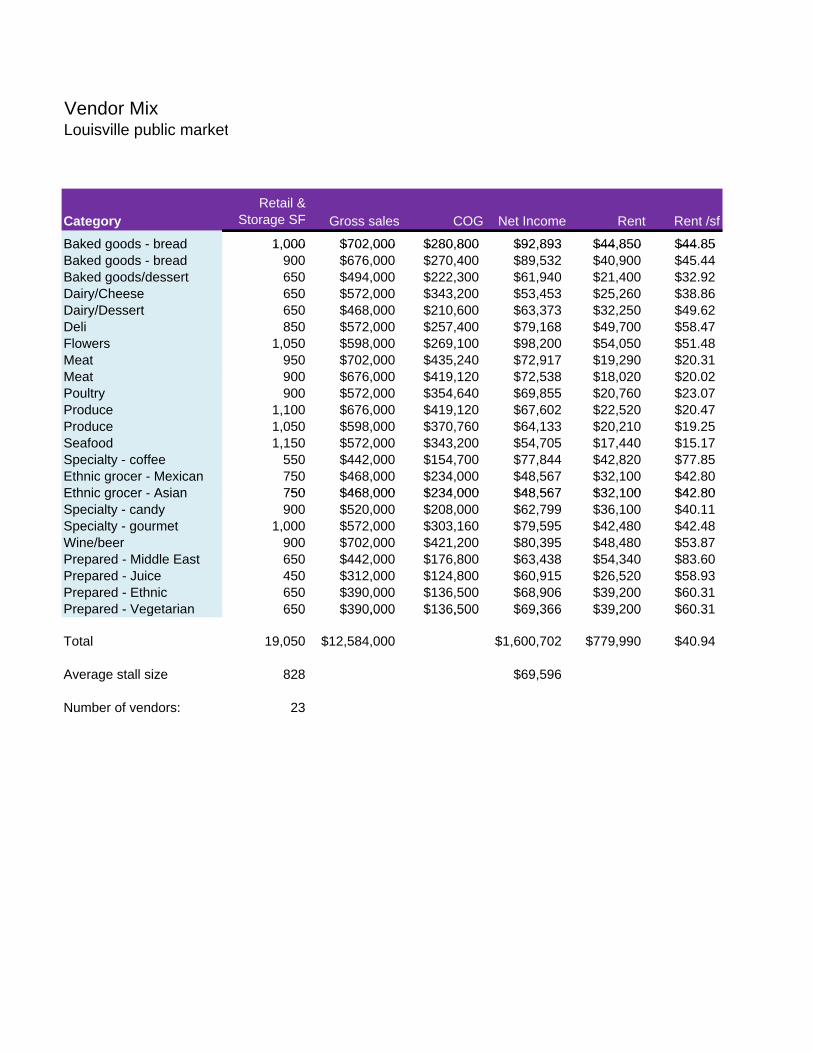
Vendor MixL i ill bli k tLouisville public market
CategoryRetail &
Storage SF Gross sales COG Net Income Rent Rent /sf
Baked goods - bread 1,000 $702,000 $280,800 $92,893 $44,850 $44.85Baked goods - bread 1,000 $702,000 $280,800 $92,893 $44,850 $44.85Baked goods - bread 900 $676,000 $270,400 $89,532 $40,900 $45.44Baked goods/dessert 650 $494,000 $222,300 $61,940 $21,400 $32.92Dairy/Cheese 650 $572,000 $343,200 $53,453 $25,260 $38.86Dairy/Dessert 650 $468,000 $210,600 $63,373 $32,250 $49.62Deli 850 $572,000 $257,400 $79,168 $49,700 $58.47Flowers 1,050 $598,000 $269,100 $98,200 $54,050 $51.48Meat 950 $702,000 $435,240 $72,917 $19,290 $20.31Meat 900 $676,000 $419,120 $72,538 $18,020 $20.02Poultry 900 $572,000 $354,640 $69,855 $20,760 $23.07Produce 1,100 $676,000 $419,120 $67,602 $22,520 $20.47Produce 1,050 $598,000 $370,760 $64,133 $20,210 $19.25Seafood 1,150 $572,000 $343,200 $54,705 $17,440 $15.17Specialty - coffee 550 $442,000 $154,700 $77,844 $42,820 $77.85Ethnic grocer - Mexican 750 $468,000 $234,000 $48,567 $32,100 $42.80Ethnic grocer Asian 750 $468 000 $234 000 $48 567 $32 100 $42 80Ethnic grocer - Asian 750 $468,000 $234,000 $48,567 $32,100 $42.80Specialty - candy 900 $520,000 $208,000 $62,799 $36,100 $40.11Specialty - gourmet 1,000 $572,000 $303,160 $79,595 $42,480 $42.48Wine/beer 900 $702,000 $421,200 $80,395 $48,480 $53.87Prepared - Middle East 650 $442,000 $176,800 $63,438 $54,340 $83.60Prepared - Juice 450 $312,000 $124,800 $60,915 $26,520 $58.93Prepared - Ethnic 650 $390,000 $136,500 $68,906 $39,200 $60.31Prepared - Vegetarian 650 $390,000 $136,500 $69,366 $39,200 $60.31p g 650 $390,000 $ 36,500 $69,366 $39, 00 $60 3
Total 19,050 $12,584,000 $1,600,702 $779,990 $40.94
Average stall size 828 $69,596
Number of vendors: 23
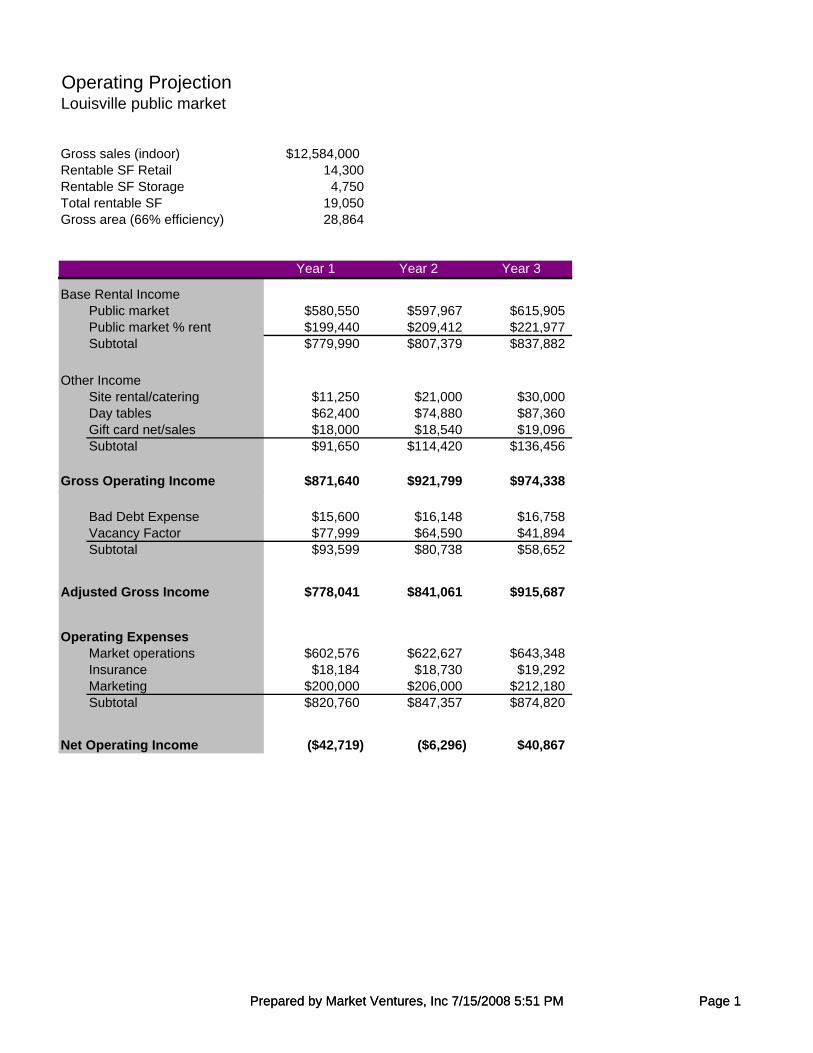
Operating ProjectionLouisville public market
Gross sales (indoor) $12,584,000Rentable SF Retail 14,300Rentable SF Storage 4,750Total rentable SF 19,050Gross area (66% efficiency) 28,864
Year 1 Year 2 Year 3
Base Rental IncomePublic market $580,550 $597,967 $615,905Public market % rent $199,440 $209,412 $221,977Subtotal $779,990 $807,379 $837,882
Other IncomeSite rental/catering $11,250 $21,000 $30,000Day tables $62,400 $74,880 $87,360Gift card net/sales $18,000 $18,540 $19,096Subtotal $91,650 $114,420 $136,456
Gross Operating Income $871,640 $921,799 $974,338
Prepared by Market Ventures, Inc 7/15/2008 5:51 PM Page 1
Bad Debt Expense $15,600 $16,148 $16,758Vacancy Factor $77,999 $64,590 $41,894Subtotal $93,599 $80,738 $58,652
Adjusted Gross Income $778,041 $841,061 $915,687
Operating ExpensesMarket operations $602,576 $622,627 $643,348Insurance $18,184 $18,730 $19,292Marketing $200,000 $206,000 $212,180Subtotal $820,760 $847,357 $874,820
Net Operating Income ($42,719) ($6,296) $40,867
Prepared by Market Ventures, Inc 7/15/2008 5:51 PM Page 1
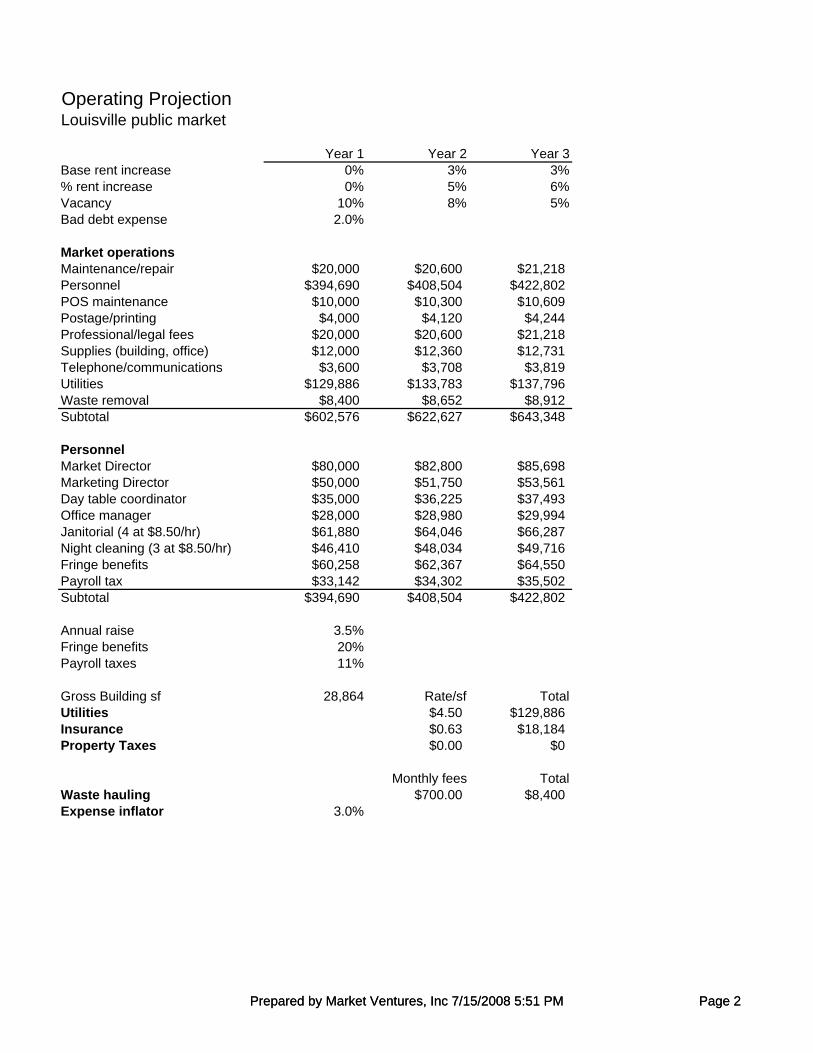
Operating ProjectionLouisville public market
Year 1 Year 2 Year 3Base rent increase 0% 3% 3%% rent increase 0% 5% 6%Vacancy 10% 8% 5%Bad debt expense 2.0%
Market operationsMaintenance/repair $20,000 $20,600 $21,218Personnel $394,690 $408,504 $422,802POS maintenance $10,000 $10,300 $10,609Postage/printing $4,000 $4,120 $4,244Professional/legal fees $20,000 $20,600 $21,218Supplies (building, office) $12,000 $12,360 $12,731Telephone/communications $3,600 $3,708 $3,819Utilities $129,886 $133,783 $137,796Waste removal $8,400 $8,652 $8,912Subtotal $602,576 $622,627 $643,348
PersonnelMarket Director $80,000 $82,800 $85,698Marketing Director $50,000 $51,750 $53,561
$ $ $
Prepared by Market Ventures, Inc 7/15/2008 5:51 PM Page 2
Day table coordinator $35,000 $36,225 $37,493Office manager $28,000 $28,980 $29,994Janitorial (4 at $8.50/hr) $61,880 $64,046 $66,287Night cleaning (3 at $8.50/hr) $46,410 $48,034 $49,716Fringe benefits $60,258 $62,367 $64,550Payroll tax $33,142 $34,302 $35,502Subtotal $394,690 $408,504 $422,802
Annual raise 3.5%Fringe benefits 20%Payroll taxes 11%
Gross Building sf 28,864 Rate/sf TotalUtilities $4.50 $129,886Insurance $0.63 $18,184Property Taxes $0.00 $0
Monthly fees TotalWaste hauling $700.00 $8,400Expense inflator 3.0%
Prepared by Market Ventures, Inc 7/15/2008 5:51 PM Page 2