lost youth · this is the fifth consecutive year that the violence policy center has published lost...
TRANSCRIPT

Lost YouthA County-by-County Analysis of 2013 California Homicide Victims Ages 10 to 24
N O V E M B E R 2 0 1 5
W W W . V P C . O R G
COPYRIGHT AND ACKNOWLEDGMENTS
Copyright © November 2015 Violence Policy Center
The Violence Policy Center (VPC) is a national non-profit educational organization that conducts research and public education on violence in America and provides information and analysis to policymakers, journalists, advocates, and the general public.
This study is funded by a grant from The California Wellness Foundation (TCWF). Created in 1992 as a private independent foundation, TCWF’s mission is to improve the health of the people of California by making grants for health promotion, wellness education and disease prevention.
Lost Youth was also supported by a generous gift from Junling Hu.
This study was authored by Marty Langley and Josh Sugarmann.
Violence Policy Center 1730 Rhode Island Avenue, NW, Suite 1014 Washington, DC 20036
(202) 822-8200 www.vpc.org
For a complete list of VPC publications with document links, please visit http://www.vpc.org/publications/
To learn more about the Violence Policy Center, or to make a tax-deductible contribution to help support our work, please visit www.vpc.org.

TABLE OF CONTENTS
Introduction: California Historical Data ........................................................................................................................... 1
Section One: 2013 California County-by-County Data ................................................................................................ 4
Section Two: Hispanic Victims .......................................................................................................................................... 9
Section Three: Black Victims .............................................................................................................................................. 10
Section Four: White Victims................................................................................................................................................11
Section Five: Asian/Pacific Islander Victims .................................................................................................................12
Conclusion ..........................................................................................................................................................................13
Appendix One: Youth and Young Adult Homicide Victims Ages 10 to 24 in the United States by State, Ranked by Rate, 2013 ..................................................................................................................................14
Appendix Two: Youth and Young Adult Homicide Victims Ages 10 to 24 in California by County, Ranked by Rate, 2013 ..................................................................................................................................16
Appendix Three: Youth and Young Adult Homicide Victims Ages 10 to 24 in California and Rates, Alphabetically by County, 2013 ...............................................................................................................18
Appendix Four: Youth and Young Adult Homicide Victims Ages 10 to 24 in California and Rates, Alphabetically by County, 2011 – 2013 .................................................................................................20
Appendix Five: Additional Information for California and the 10 Counties with the Highest Rates of Youth and Young Adult Homicide Victimization ............................................................................................ 22
California ...................................................................................................................................................... 22
Monterey County ....................................................................................................................................... 23
Madera County ...........................................................................................................................................24
San Francisco County ...............................................................................................................................25
Alameda County ........................................................................................................................................26
Merced County ............................................................................................................................................ 27
Solano County .............................................................................................................................................28
Stanislaus County .......................................................................................................................................29
Butte County ................................................................................................................................................30
Kern County ..................................................................................................................................................31
San Joaquin County .................................................................................................................................... 32

LOST YOUTH VIOLENCE POLICY CENTER | 1
INTRODUCTION: CALIFORNIA HISTORICAL DATA
Homicide is the second leading cause of death for California youth and young adults ages 10 to 24 years old.
In 2013, the most recent year for which complete data is available from the federal Centers for Disease Control and Prevention (CDC), homicides in California were outpaced only by unintentional injuries—the majority of which were motor vehicle fatalities—as the leading cause of death for this age group. Of the 613 homicides reported, 86 percent were committed with firearms. Nationally in 2013, California had the 17th highest homicide rate for youth and young adults ages 10 to 24.1 (Please see Appendix One for a chart ranking the states by homicide rate for this age group for the year 2013.)
Broken out by gender, homicide retains its number-two ranking for males and drops to number four for females for this age group in California. For males, of the 553 homicides reported, firearms were the weapon used in 87 percent of the killings. For females, of the 60 homicides reported, firearms were the weapon used in 72 percent of the killings.
When analyzed by race and ethnicity, however, the rankings become less uniform and the severe effects of homicide on specific segments of this age group increasingly stark.2 For blacks ages 10 to 24 in California in 2013, homicide was the leading cause of death. For Hispanics it was the second leading cause of death. For American Indian and Alaskan Natives it was the third leading cause of death. For whites and Asian/Pacific Islanders it was the fourth leading cause of death.
2013 LEADING CAUSES OF DEATH IN CALIFORNIA, BOTH SEXES AGES 10 TO 24, BY RACE
Hispanic Black White Asian/Pacific Islander
American Indian/ Alaska Native
1 Unintentional Injury Homicide Unintentional
InjuryUnintentional
InjuryUnintentional
Injury
2 Homicide Unintentional Injury Suicide Suicide Suicide
3 Suicide Suicide Malignant Neoplasms
Malignant Neoplasms Homicide
4 Malignant Neoplasms
Malignant Neoplasms Homicide Homicide Malignant
Neoplasms
5 Heart Disease Heart Disease Heart Disease Heart Disease *
* Beginning with 2008 data, the National Center for Health Statistics has begun suppressing data if fewer than 10 deaths are reported.
1 All leading cause of death data and state rankings calculated by the Violence Policy Center using the Centers for Disease Control and Prevention’s WISQARS (Web-Based Injury Statistics Query and Reporting System) database (http://www.cdc.gov/injury/wisqars/index.html).
2 Race and ethnicity are two separate designations. To calculate Hispanic ethnicity, for all races Hispanic ethnicity was excluded from race data (e.g., white non-Hispanic, black non-Hispanic, etc.). For the purposes of this study, these definitions will be presented without the modifying descriptions “non-Hispanic” and all races and ethnicity will be referred to as race.
2 | VIOLENCE POLICY CENTER LOST YOUTH
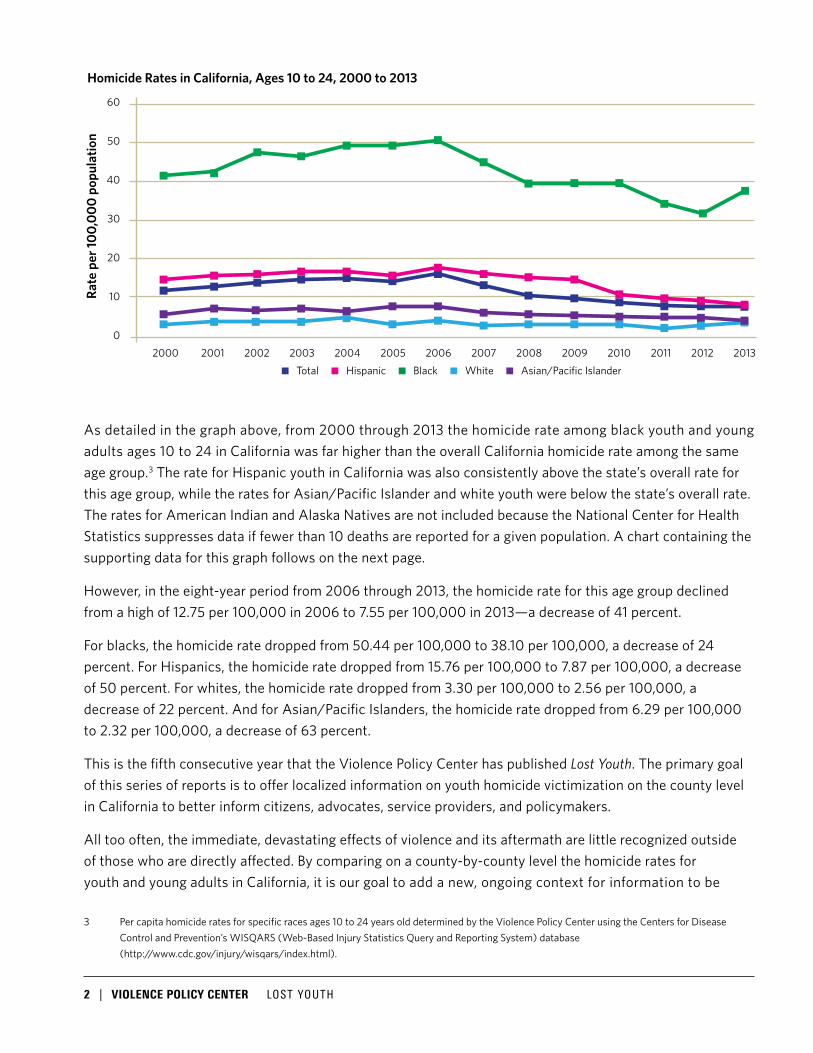
As detailed in the graph above, from 2000 through 2013 the homicide rate among black youth and young adults ages 10 to 24 in California was far higher than the overall California homicide rate among the same age group.3 The rate for Hispanic youth in California was also consistently above the state’s overall rate for this age group, while the rates for Asian/Pacific Islander and white youth were below the state’s overall rate. The rates for American Indian and Alaska Natives are not included because the National Center for Health Statistics suppresses data if fewer than 10 deaths are reported for a given population. A chart containing the supporting data for this graph follows on the next page.
However, in the eight-year period from 2006 through 2013, the homicide rate for this age group declined from a high of 12.75 per 100,000 in 2006 to 7.55 per 100,000 in 2013—a decrease of 41 percent.
For blacks, the homicide rate dropped from 50.44 per 100,000 to 38.10 per 100,000, a decrease of 24 percent. For Hispanics, the homicide rate dropped from 15.76 per 100,000 to 7.87 per 100,000, a decrease of 50 percent. For whites, the homicide rate dropped from 3.30 per 100,000 to 2.56 per 100,000, a decrease of 22 percent. And for Asian/Pacific Islanders, the homicide rate dropped from 6.29 per 100,000 to 2.32 per 100,000, a decrease of 63 percent.
This is the fifth consecutive year that the Violence Policy Center has published Lost Youth. The primary goal of this series of reports is to offer localized information on youth homicide victimization on the county level in California to better inform citizens, advocates, service providers, and policymakers.
All too often, the immediate, devastating effects of violence and its aftermath are little recognized outside of those who are directly affected. By comparing on a county-by-county level the homicide rates for youth and young adults in California, it is our goal to add a new, ongoing context for information to be
3 Per capita homicide rates for specific races ages 10 to 24 years old determined by the Violence Policy Center using the Centers for Disease Control and Prevention’s WISQARS (Web-Based Injury Statistics Query and Reporting System) database (http://www.cdc.gov/injury/wisqars/index.html).
60
50
40
30
20
10
02000 2001 2002 2003 2004 2005 2006 2007 2008 2009 2010 2011 2012 2013
■ Total ■ Hispanic ■ Black ■ White ■ Asian/Pacific Islander
Homicide Rates in California, Ages 10 to 24, 2000 to 2013Ra
te p
er 10
0,00
0 po
pula
tion

LOST YOUTH VIOLENCE POLICY CENTER | 3
presented and progress to be measured while at the same time helping support discussion, analysis, policy development, and action. Above all, this work is conducted in the belief that information aids in the development of sound prevention strategies—on the local, state, and national levels.
CALIFORNIA HOMICIDE RATES FOR VICTIMS AGES 10 TO 24 BY RACE, 2000 TO 2013 (ALL RATES PER 100,000 FOR RELEVANT POPULATION)
Year Hispanic Black White Asian/Pacific Islander Overall
2000 13.55 41.35 2.83 4.22 10.33
2001 14.16 42.05 3.35 5.59 11.03
2002 14.47 47.49 3.36 5.33 11.65
2003 14.80 47.17 3.23 5.54 11.77
2004 14.99 49.47 3.48 4.44 12.02
2005 14.53 49.42 2.93 6.03 11.85
2006 15.76 50.44 3.30 6.29 12.75
2007 14.27 45.02 2.25 4.42 11.14
2008 12.92 39.21 2.40 4.27 10.16
2009 12.00 39.54 2.29 3.34 9.67
2010 9.64 39.55 2.10 3.12 8.43
2011 9.18 34.76 1.60 3.09 7.73
2012 9.02 33.72 2.13 2.71 7.76
2013 7.87 38.10 2.56 2.32 7.55
4 | VIOLENCE POLICY CENTER LOST YOUTH
SECTION ONE: 2013 CALIFORNIA COUNTY-BY-COUNTY DATA
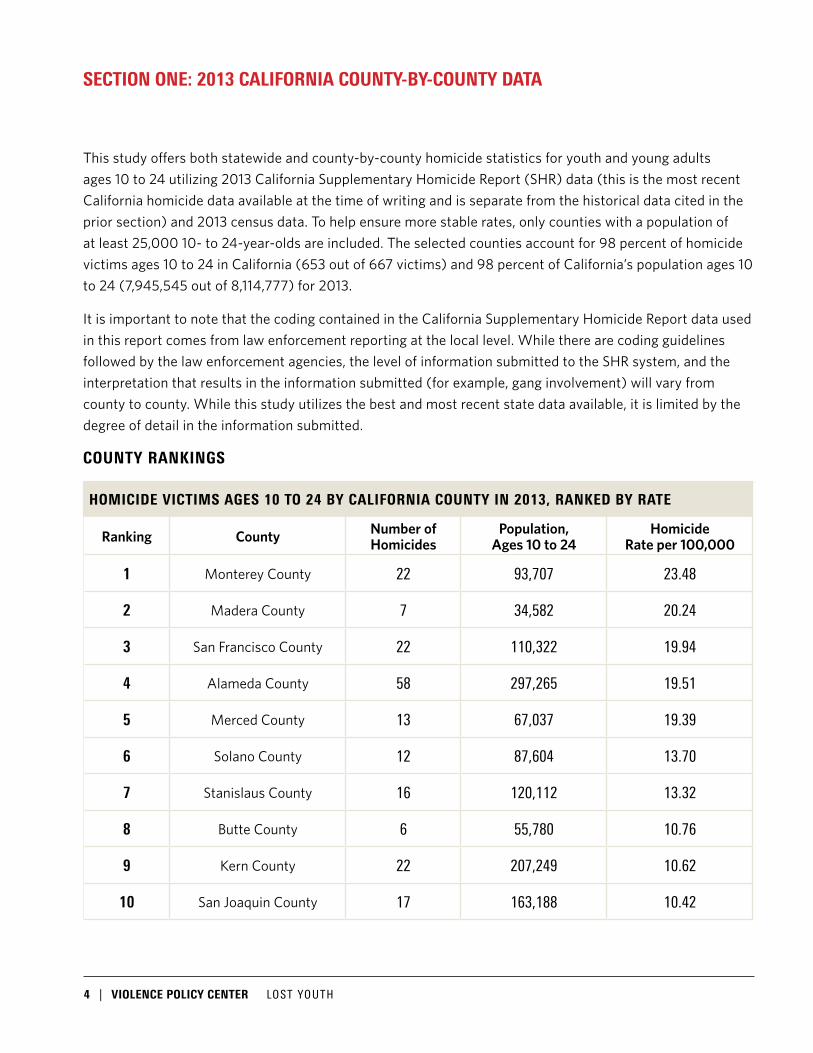
This study offers both statewide and county-by-county homicide statistics for youth and young adults ages 10 to 24 utilizing 2013 California Supplementary Homicide Report (SHR) data (this is the most recent California homicide data available at the time of writing and is separate from the historical data cited in the prior section) and 2013 census data. To help ensure more stable rates, only counties with a population of at least 25,000 10- to 24-year-olds are included. The selected counties account for 98 percent of homicide victims ages 10 to 24 in California (653 out of 667 victims) and 98 percent of California’s population ages 10 to 24 (7,945,545 out of 8,114,777) for 2013.
It is important to note that the coding contained in the California Supplementary Homicide Report data used in this report comes from law enforcement reporting at the local level. While there are coding guidelines followed by the law enforcement agencies, the level of information submitted to the SHR system, and the interpretation that results in the information submitted (for example, gang involvement) will vary from county to county. While this study utilizes the best and most recent state data available, it is limited by the degree of detail in the information submitted.
COUNTY RANKINGS
HOMICIDE VICTIMS AGES 10 TO 24 BY CALIFORNIA COUNTY IN 2013, RANKED BY RATE
Ranking County Number of Homicides
Population, Ages 10 to 24
Homicide Rate per 100,000
1 Monterey County 22 93,707 23.48
2 Madera County 7 34,582 20.24
3 San Francisco County 22 110,322 19.94
4 Alameda County 58 297,265 19.51
5 Merced County 13 67,037 19.39
6 Solano County 12 87,604 13.70
7 Stanislaus County 16 120,112 13.32
8 Butte County 6 55,780 10.76
9 Kern County 22 207,249 10.62
10 San Joaquin County 17 163,188 10.42
LOST YOUTH VIOLENCE POLICY CENTER | 5
Using the California SHR data, in 2013, the homicide rate among victims 10 to 24 years old in California was 8.22 per 100,000. In 2013, Monterey County ranked first as the county with the highest homicide rate among victims ages 10 to 24. Its rate of 23.48 per 100,000 was nearly three times the statewide rate. Monterey County was followed by Madera County (20.24 per 100,000), San Francisco County (19.94 per 100,000), Alameda County (19.51 per 100,000), and Merced County (19.39 per 100,000). The remaining counties that comprise the top 10 are detailed in the prior chart.
A chart listing the number and rate of homicide victims 10 to 24 years old by county and ranking each county by its homicide rate for this age group can be found in Appendix Two.
An alphabetical listing by county with identical information can be found in Appendix Three.
An alphabetical listing by county with data comparing the years 2011, 2012, and 2013 can be found in Appendix Four.
Additional 2013 data for California and the top 10 counties—gender and race of victim, type of weapon used, relationship of victim to offender, circumstances of the homicide, and location where the homicide took place—can be found in Appendix Five.
General statewide findings are summarized below.
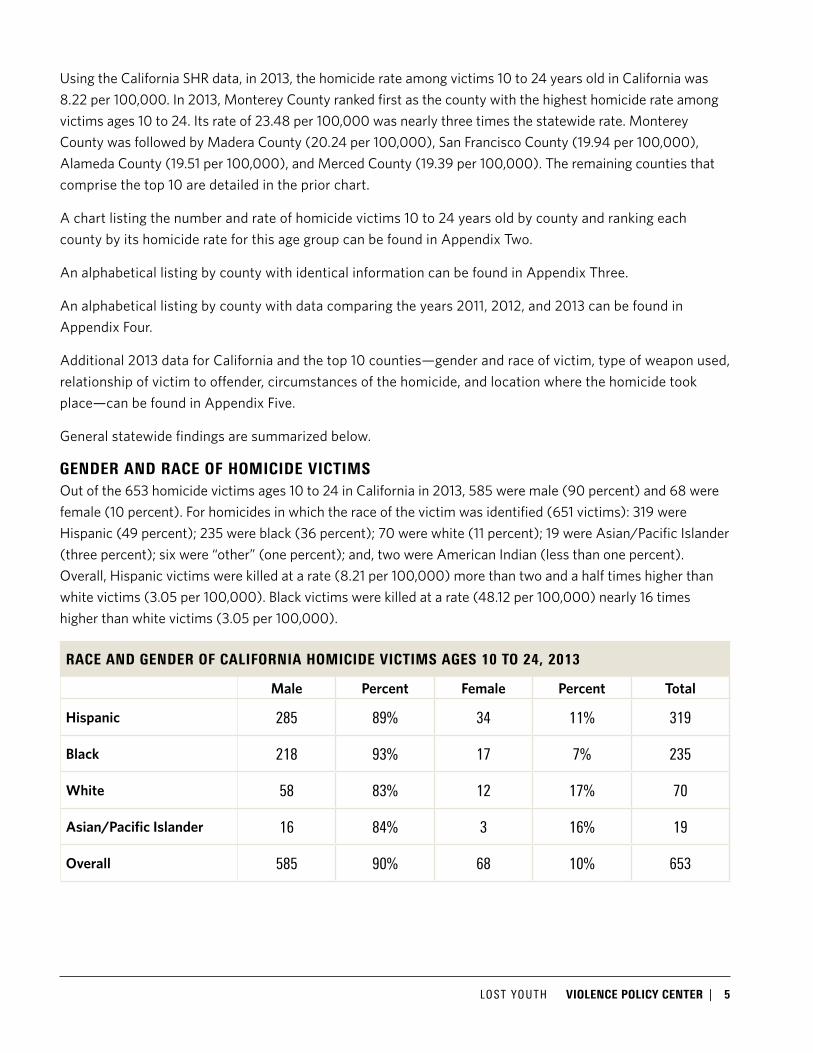
GENDER AND RACE OF HOMICIDE VICTIMS Out of the 653 homicide victims ages 10 to 24 in California in 2013, 585 were male (90 percent) and 68 were female (10 percent). For homicides in which the race of the victim was identified (651 victims): 319 were Hispanic (49 percent); 235 were black (36 percent); 70 were white (11 percent); 19 were Asian/Pacific Islander (three percent); six were “other” (one percent); and, two were American Indian (less than one percent). Overall, Hispanic victims were killed at a rate (8.21 per 100,000) more than two and a half times higher than white victims (3.05 per 100,000). Black victims were killed at a rate (48.12 per 100,000) nearly 16 times higher than white victims (3.05 per 100,000).
RACE AND GENDER OF CALIFORNIA HOMICIDE VICTIMS AGES 10 TO 24, 2013
Male Percent Female Percent Total
Hispanic 285 89% 34 11% 319
Black 218 93% 17 7% 235
White 58 83% 12 17% 70
Asian/Pacific Islander 16 84% 3 16% 19
Overall 585 90% 68 10% 653

6 | VIOLENCE POLICY CENTER LOST YOUTH
CALIFORNIA HOMICIDE RATES FOR VICTIMS AGES 10 TO 24 BY RACE AND GENDER, 2013 (ALL RATES PER 100,000 FOR RELEVANT POPULATION)
Male Female Overall
Hispanic 14.28 1.80 8.21
Black 86.76 7.17 48.12
White 4.88 1.09 3.05
Asian/Pacific Islander 3.28 0.64 1.99
VICTIM TO OFFENDER RELATIONSHIP Among youth and young adults in 2013, for homicides in which the victim to offender relationship could be identified, 46 percent (147 out of 317) were killed by a stranger. Thirty-eight percent (122 out of 317) were killed by someone they knew. Forty-eight additional victims (15 percent) were identified as gang members.4
For this age group, black, Hispanic, and Asian/Pacific Islander victims were more likely to be killed by a stranger than white victims. Forty-seven percent of all black victims were killed by a stranger (46 out of 98). Thirty-four percent of black victims (33 out of 98) were murdered by someone they knew. Nineteen additional victims (19 percent) were identified as gang members. Forty-seven percent of Hispanic victims were killed by strangers (73 out of 155). Thirty-four percent of Hispanic victims (53 out of 155) were murdered by someone they knew. An additional 19 percent of Hispanic victims (29 out of 155) were identified as gang members. Fifty-eight percent of Asian/Pacific Islander victims were killed by strangers (seven out of 12). Forty-two percent of Asian/Pacific Islander victims (five out of 12) were murdered by someone they knew. In comparison, 57 percent of white victims were murdered by someone they knew (26 out of 46) and 43 percent (20 out of 46) were killed by a stranger.
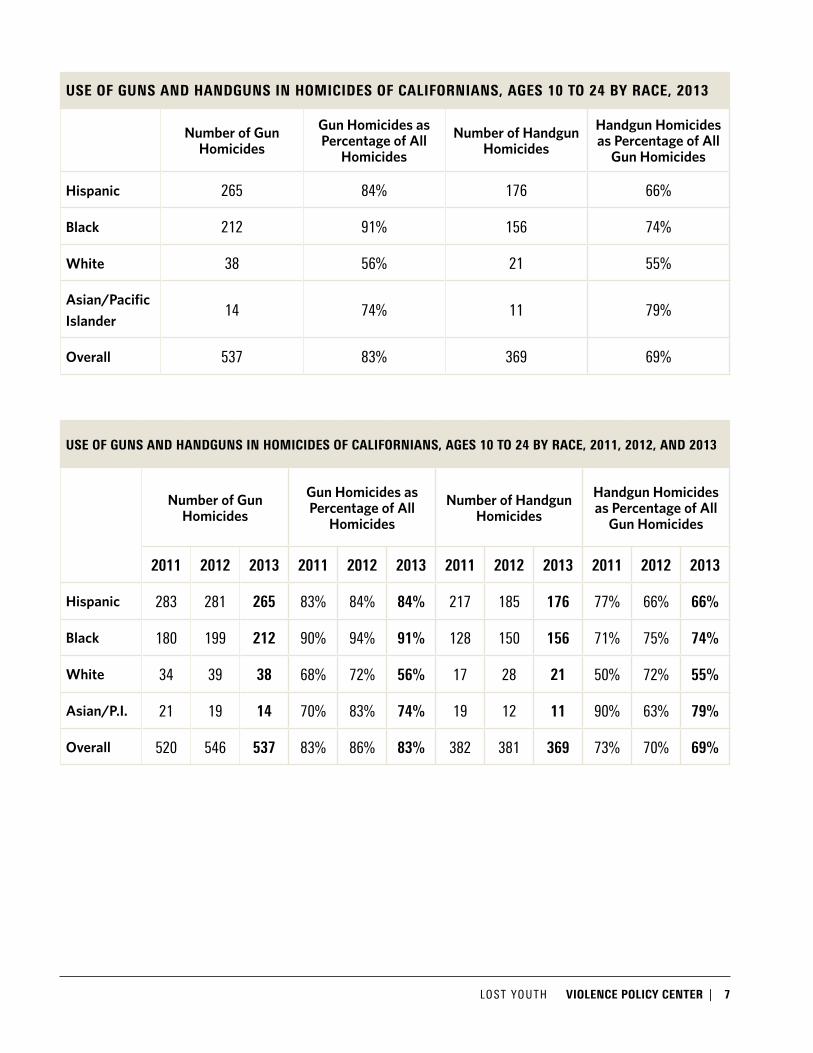
MOST COMMON WEAPONS Firearms—especially handguns—were the most common weapon used to murder youth and young adults in 2013. Of the 646 homicides for which the murder weapon could be identified, 83 percent of victims (537 out of 646) died by gunfire. Of these, 69 percent (369 out of 537) were killed with a handgun.
4 Information on gang activity is provided in two sections of the SHR data and is dependent on how local jurisdictions define and record such data. Although relationships are defined as victim to offender, because of potential inconsistencies in on-scene reporting a relationship may be coded as “gang member” if the victim of the homicide or the offender is believed to be a gang member. In the circumstance field, it may be coded as “gangland killing” or “gang killing” if the homicide is believed to be related to gang activity, whether or not the victim is a gang member.
LOST YOUTH VIOLENCE POLICY CENTER | 7
USE OF GUNS AND HANDGUNS IN HOMICIDES OF CALIFORNIANS, AGES 10 TO 24 BY RACE, 2013
Number of Gun Homicides
Gun Homicides as Percentage of All
Homicides
Number of Handgun Homicides
Handgun Homicides as Percentage of All
Gun Homicides
Hispanic 265 84% 176 66%
Black 212 91% 156 74%
White 38 56% 21 55%
Asian/Pacific Islander
14 74% 11 79%
Overall 537 83% 369 69%
USE OF GUNS AND HANDGUNS IN HOMICIDES OF CALIFORNIANS, AGES 10 TO 24 BY RACE, 2011, 2012, AND 2013
Number of Gun Homicides
Gun Homicides as Percentage of All
Homicides
Number of Handgun Homicides
Handgun Homicides as Percentage of All
Gun Homicides
2011 2012 2013 2011 2012 2013 2011 2012 2013 2011 2012 2013
Hispanic 283 281 265 83% 84% 84% 217 185 176 77% 66% 66%
Black 180 199 212 90% 94% 91% 128 150 156 71% 75% 74%
White 34 39 38 68% 72% 56% 17 28 21 50% 72% 55%
Asian/P.I. 21 19 14 70% 83% 74% 19 12 11 90% 63% 79%
Overall 520 546 537 83% 86% 83% 382 381 369 73% 70% 69%

8 | VIOLENCE POLICY CENTER LOST YOUTH
CIRCUMSTANCE The overwhelming majority of homicides of youth and young adults in 2013 were not related to any other felony crime. For the 446 homicides in which the circumstances between the victim and offender could be identified, 80 percent (356 out of 446) were not related to the commission of any other felony. Of these, 60 percent (213 out of 356) were gang-related.5
For all races, the majority of deaths were not related to the commission of any other felony.
For Hispanic victims, 85 percent (199 out of 233) were not related to the commission of any other felony. Of these, 66 percent (132 out of 199) were gang-related.
For black victims, 75 percent (114 out of 151) were not related to the commission of any other felony. Of these, 64 percent (73 out of 114) were gang-related.
For white victims, 63 percent (29 out of 46) were not related to the commission of any other felony. Of these, seven percent (two out of 29) were gang-related.
For Asian/Pacific Islander victims, 92 percent (11 out of 12) were not related to the commission of any other felony. Of these, 36 percent (four out of 11) were gang-related.
LOCATION In 2013, among youth and young adults for homicides in which the location could be determined, 52 percent (339 out of 647) occurred on a street, sidewalk, or in a parking lot. Seventeen percent (112 out of 647) occurred in the home of the victim or offender. Eleven percent (70 out of 647) occurred at another residence, and eight percent (50 out of 647) occurred in a vehicle.
For homicides in which the location could be determined, 62 percent of black victims (144 out of 234), 50 percent of Hispanic victims (159 out of 316), 47 percent of Asian/Pacific Islander victims (nine out of 19), and 35 percent of white victims (24 out of 69) were killed on a street, sidewalk, or in a parking lot.
For homicides in which the location could be determined, 35 percent of white victims (24 out of 69), 20 percent of Hispanic victims (62 out of 316), 11 percent of Asian/Pacific Islander victims (two out of 19), and nine percent of black victims (20 out of 234) were killed in the home of the victim or the offender.
Eleven percent of black victims (26 out of 234), 11 percent of Hispanic victims (34 out of 316), 11 percent of Asian/Pacific Islander victims (two out of 19), and 10 percent of white victims (seven out of 69) were killed at another residence.
Sixteen percent of Asian/Pacific Islander victims (three out of 19), eight percent of Hispanic victims (26 out of 316), eight percent of black victims (19 out of 234), and three percent of white victims (two out of 69) were killed in a vehicle.
5 Information on gang activity is provided in two sections of the SHR data and is dependent on how local jurisdictions define and record such data. Although relationships are defined as victim to offender, because of potential inconsistencies in on-scene reporting a relationship may be coded as “gang member” if the victim of the homicide or the offender is believed to be a gang member. In the circumstance field, it may be coded as “gangland killing” or “gang killing” if the homicide is believed to be related to gang activity, whether or not the victim is a gang member.
LOST YOUTH VIOLENCE POLICY CENTER | 9
SECTION TWO: HISPANIC VICTIMS
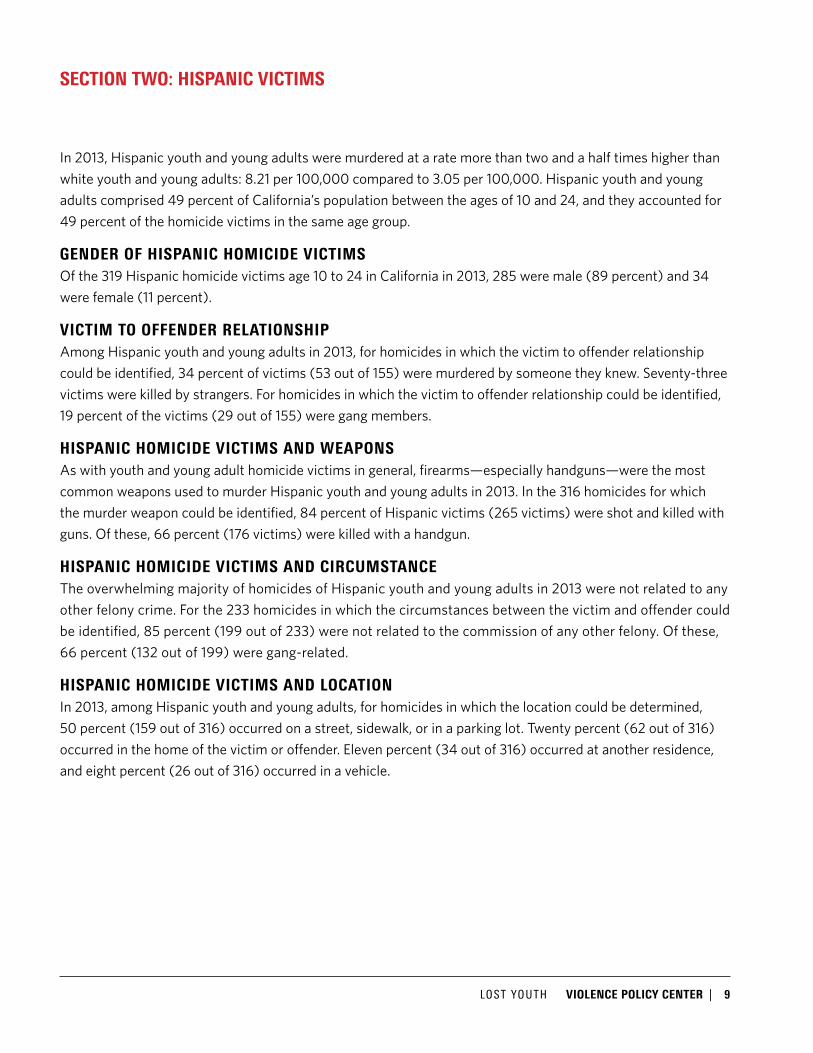
In 2013, Hispanic youth and young adults were murdered at a rate more than two and a half times higher than white youth and young adults: 8.21 per 100,000 compared to 3.05 per 100,000. Hispanic youth and young adults comprised 49 percent of California’s population between the ages of 10 and 24, and they accounted for 49 percent of the homicide victims in the same age group.
GENDER OF HISPANIC HOMICIDE VICTIMS Of the 319 Hispanic homicide victims age 10 to 24 in California in 2013, 285 were male (89 percent) and 34 were female (11 percent).
VICTIM TO OFFENDER RELATIONSHIP Among Hispanic youth and young adults in 2013, for homicides in which the victim to offender relationship could be identified, 34 percent of victims (53 out of 155) were murdered by someone they knew. Seventy-three victims were killed by strangers. For homicides in which the victim to offender relationship could be identified, 19 percent of the victims (29 out of 155) were gang members.
HISPANIC HOMICIDE VICTIMS AND WEAPONS As with youth and young adult homicide victims in general, firearms—especially handguns—were the most common weapons used to murder Hispanic youth and young adults in 2013. In the 316 homicides for which the murder weapon could be identified, 84 percent of Hispanic victims (265 victims) were shot and killed with guns. Of these, 66 percent (176 victims) were killed with a handgun.
HISPANIC HOMICIDE VICTIMS AND CIRCUMSTANCE The overwhelming majority of homicides of Hispanic youth and young adults in 2013 were not related to any other felony crime. For the 233 homicides in which the circumstances between the victim and offender could be identified, 85 percent (199 out of 233) were not related to the commission of any other felony. Of these, 66 percent (132 out of 199) were gang-related.
HISPANIC HOMICIDE VICTIMS AND LOCATION In 2013, among Hispanic youth and young adults, for homicides in which the location could be determined, 50 percent (159 out of 316) occurred on a street, sidewalk, or in a parking lot. Twenty percent (62 out of 316) occurred in the home of the victim or offender. Eleven percent (34 out of 316) occurred at another residence, and eight percent (26 out of 316) occurred in a vehicle.

10 | VIOLENCE POLICY CENTER LOST YOUTH
SECTION THREE: BLACK VICTIMS
In 2013, black youth and young adults were murdered at a rate nearly 16 times higher than white youth and young adults: 48.12 per 100,000 compared to 3.05 per 100,000. While black youth and young adults comprised six percent of California’s population between the ages of 10 and 24, they accounted for 36 percent of the homicide victims in the same age group.
GENDER OF BLACK HOMICIDE VICTIMS Of the 235 black homicide victims age 10 to 24 in California in 2013, 218 were male (93 percent) and 17 were female (seven percent).
VICTIM TO OFFENDER RELATIONSHIP Among black youth and young adults in 2013, for homicides in which the victim to offender relationship could be identified, 34 percent of victims (33 out of 98) were murdered by someone they knew. Forty-six victims were killed by strangers. For homicides in which the victim to offender relationship could be identified, 19 percent (19 out of 98) of the victims were gang members.
BLACK HOMICIDE VICTIMS AND WEAPONS As with youth and young adult homicide victims in general, firearms—especially handguns—were the most common weapons used to murder black youth and young adults in 2013. In the 233 homicides for which the murder weapon could be identified, 91 percent of black victims (212 victims) were shot and killed with guns. Of these, 74 percent (156 victims) were killed with a handgun.
BLACK HOMICIDE VICTIMS AND CIRCUMSTANCE The overwhelming majority of homicides of black youth and young adults in 2013 were not related to any other felony crime. For the 151 homicides in which the circumstances between the victim and offender could be identified, 75 percent (114 out of 151) were not related to the commission of any other felony. Of these, 64 percent (73 out of 114) were gang-related.
BLACK HOMICIDE VICTIMS AND LOCATION In 2013, among black youth and young adults, for homicides in which the location could be determined, 62 percent (144 out of 234) occurred on a street, sidewalk, or in a parking lot. Nine percent (20 out of 234) occurred in the home of the victim or offender. Eleven percent (26 out of 234) occurred at another residence, and eight percent (19 out of 234) occurred in a vehicle.
LOST YOUTH VIOLENCE POLICY CENTER | 11
SECTION FOUR: WHITE VICTIMS
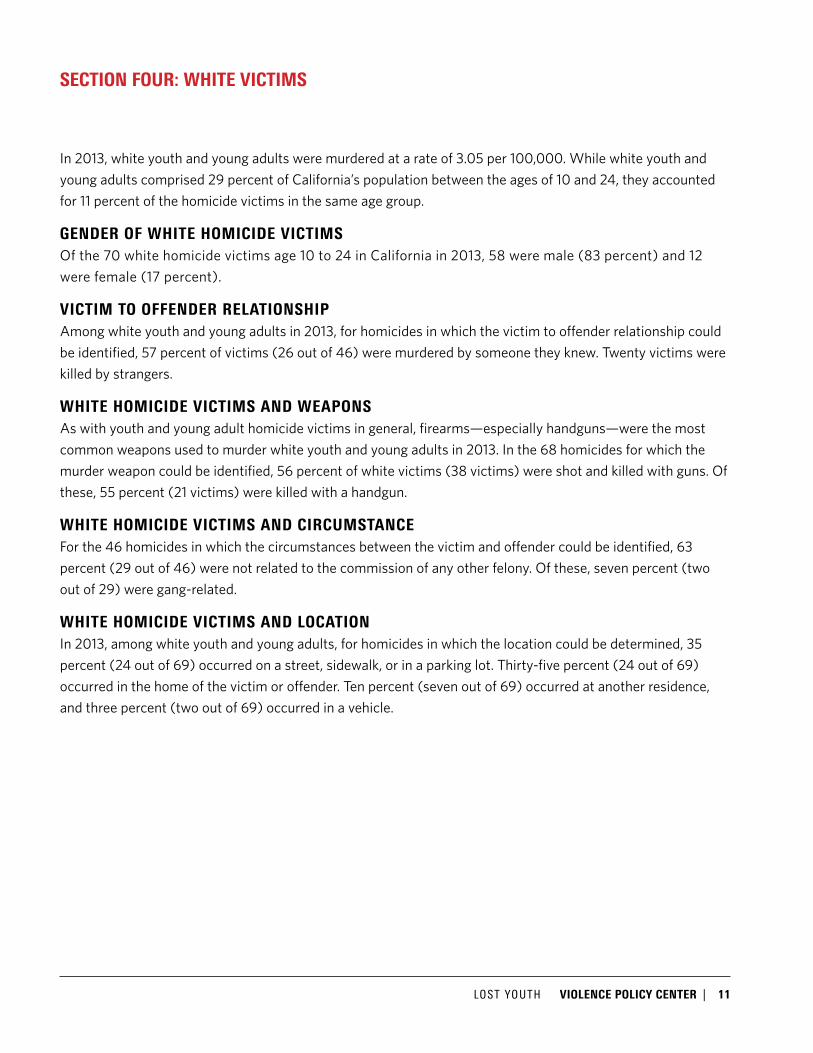
In 2013, white youth and young adults were murdered at a rate of 3.05 per 100,000. While white youth and young adults comprised 29 percent of California’s population between the ages of 10 and 24, they accounted for 11 percent of the homicide victims in the same age group.
GENDER OF WHITE HOMICIDE VICTIMS Of the 70 white homicide victims age 10 to 24 in California in 2013, 58 were male (83 percent) and 12 were female (17 percent).
VICTIM TO OFFENDER RELATIONSHIP Among white youth and young adults in 2013, for homicides in which the victim to offender relationship could be identified, 57 percent of victims (26 out of 46) were murdered by someone they knew. Twenty victims were killed by strangers.
WHITE HOMICIDE VICTIMS AND WEAPONS As with youth and young adult homicide victims in general, firearms—especially handguns—were the most common weapons used to murder white youth and young adults in 2013. In the 68 homicides for which the murder weapon could be identified, 56 percent of white victims (38 victims) were shot and killed with guns. Of these, 55 percent (21 victims) were killed with a handgun.
WHITE HOMICIDE VICTIMS AND CIRCUMSTANCE For the 46 homicides in which the circumstances between the victim and offender could be identified, 63 percent (29 out of 46) were not related to the commission of any other felony. Of these, seven percent (two out of 29) were gang-related.
WHITE HOMICIDE VICTIMS AND LOCATION In 2013, among white youth and young adults, for homicides in which the location could be determined, 35 percent (24 out of 69) occurred on a street, sidewalk, or in a parking lot. Thirty-five percent (24 out of 69) occurred in the home of the victim or offender. Ten percent (seven out of 69) occurred at another residence, and three percent (two out of 69) occurred in a vehicle.

12 | VIOLENCE POLICY CENTER LOST YOUTH
SECTION FIVE: ASIAN/PACIFIC ISLANDER VICTIMS
In 2013, Asian/Pacific Islander youth and young adults were murdered at a rate of 1.99 per 100,000. While Asian/Pacific Islander youth and young adults comprised 12 percent of California’s population between the ages of 10 and 24, they accounted for three percent of the homicide victims in the same age group.
GENDER OF ASIAN/PACIFIC ISLANDER HOMICIDE VICTIMS Of the 19 Asian/Pacific Islander homicide victims age 10 to 24 in California in 2013, 16 were male (84 percent) and three were female (16 percent).
VICTIM TO OFFENDER RELATIONSHIP Among Asian/Pacific Islander youth and young adults in 2013, for homicides in which the victim to offender relationship could be identified, 42 percent of victims (five out of 12) were murdered by someone they knew. Seven victims were killed by strangers.
ASIAN/PACIFIC ISLANDER HOMICIDE VICTIMS AND WEAPONS As with youth and young adult homicide victims in general, firearms—especially handguns—were the most common weapons used to murder Asian/Pacific Islander youth and young adults in 2013. In the 19 homicides for which the murder weapon could be identified, 74 percent of Asian/Pacific Islander victims (14 victims) were shot and killed with guns. Of these, 79 percent (11 victims) were killed with a handgun.
ASIAN/PACIFIC ISLANDER HOMICIDE VICTIMS AND CIRCUMSTANCE The overwhelming majority of homicides of Asian/Pacific Islander youth and young adults in 2013 were not related to any other felony crime. For the 12 homicides in which the circumstances between the victim and offender could be identified, 92 percent (11 out of 12) were not related to the commission of any other felony. Of these, 36 percent (four out of 11) were gang-related.
ASIAN/PACIFIC ISLANDER HOMICIDE VICTIMS AND LOCATION In 2013, among Asian/Pacific Islander youth and young adults, for homicides in which the location could be determined, 47 percent (nine out of 19) occurred on a street, sidewalk, or in a parking lot. Eleven percent (two out of 19) occurred in the home of the victim or offender. Eleven percent (two out of 19) occurred at another residence, and 16 percent (three out of 19) occurred in a vehicle.
LOST YOUTH VIOLENCE POLICY CENTER | 13
CONCLUSION
Homicide, and particularly gun homicide, continues to be one of the most pressing public health concerns in California among youth and young adults ages 10 to 24.
Effective violence prevention strategies must include measures that prioritize preventing youth and young adults from accessing firearms, especially handguns. With firearms accounting for 83 percent of homicides in the 10 to 24 age range in California and handguns accounting for 69 percent of all gun homicides, prevention strategies to limit exposure to firearms in this age range are of the utmost importance. Key components of such a strategy would be the identification of the make, model, and caliber of weapons most preferred by this age group as well as analyses identifying the sources of the weapons. It should be kept in mind that a large percentage of this age group—those under the age of 21—cannot legally purchase a handgun. It is also generally illegal for anyone under the age of 18 to possess a handgun.6 While most youth and young adults can neither buy nor possess a handgun, this in no way protects them from the emotional and psychological effects of gun violence. An ongoing need exists for the expansion of comprehensive violence intervention and prevention strategies that include a focus on the psychological well-being of witnesses and survivors of gun violence.
This year’s county-by-county rankings also point to the continuing urgent need for tailored, localized approaches to reducing youth homicide that integrate prevention and intervention while engaging local leaders and community stakeholders. At the same time, state and regional policies should incorporate elements necessary to help ensure effective community practices.
6 Federal law prohibits Federal Firearms License (FFL) holders from selling handguns to anyone under the age of 21. California law prohibits the sale of handguns by any person or corporation to anyone under the age of 21. Federal and California law prohibit the possession of handguns by anyone under the age of 18 with exceptions including hunting and competitive shooting. For exceptions see Cal. Penal Code § 29615 Sections (a)(1), (a)(2).
14 | VIOLENCE POLICY CENTER LOST YOUTH
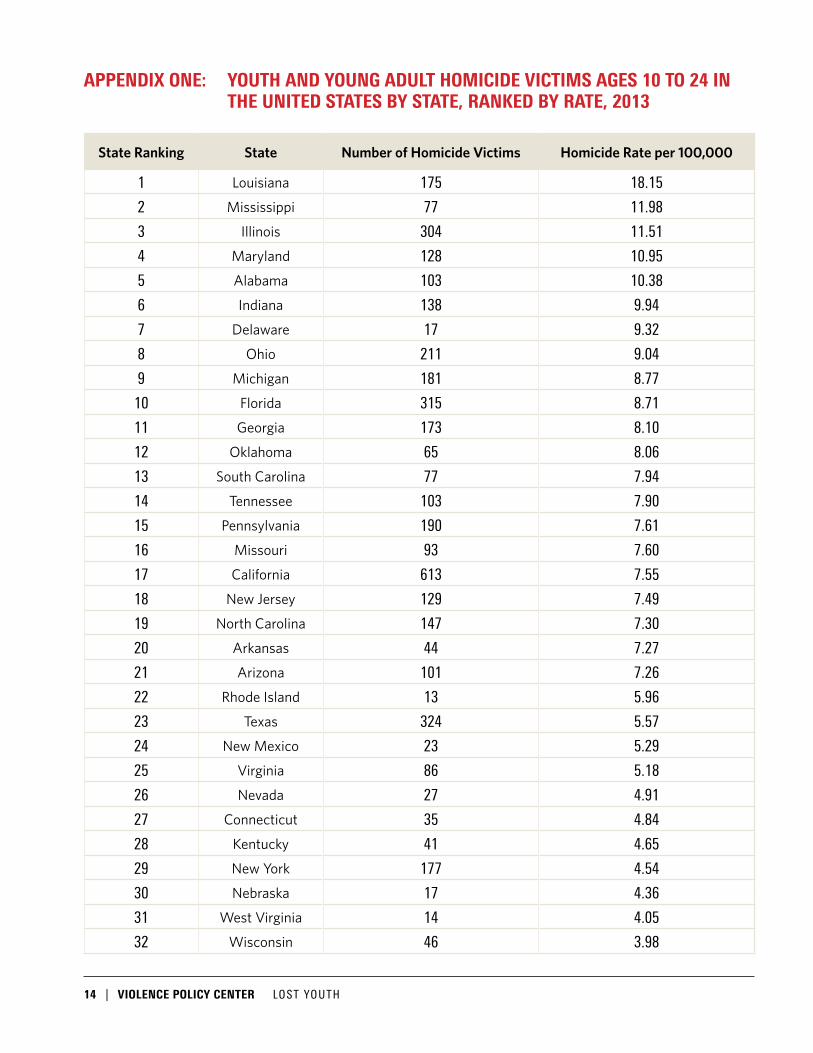
APPENDIX ONE: YOUTH AND YOUNG ADULT HOMICIDE VICTIMS AGES 10 TO 24 IN THE UNITED STATES BY STATE, RANKED BY RATE, 2013
State Ranking State Number of Homicide Victims Homicide Rate per 100,000
1 Louisiana 175 18.15
2 Mississippi 77 11.98
3 Illinois 304 11.51
4 Maryland 128 10.95
5 Alabama 103 10.38
6 Indiana 138 9.94
7 Delaware 17 9.32
8 Ohio 211 9.04
9 Michigan 181 8.77
10 Florida 315 8.71
11 Georgia 173 8.10
12 Oklahoma 65 8.06
13 South Carolina 77 7.94
14 Tennessee 103 7.90
15 Pennsylvania 190 7.61
16 Missouri 93 7.60
17 California 613 7.55
18 New Jersey 129 7.49
19 North Carolina 147 7.30
20 Arkansas 44 7.27
21 Arizona 101 7.26
22 Rhode Island 13 5.96
23 Texas 324 5.57
24 New Mexico 23 5.29
25 Virginia 86 5.18
26 Nevada 27 4.91
27 Connecticut 35 4.84
28 Kentucky 41 4.65
29 New York 177 4.54
30 Nebraska 17 4.36
31 West Virginia 14 4.05
32 Wisconsin 46 3.98

LOST YOUTH VIOLENCE POLICY CENTER | 15
State Ranking State Number of Homicide Victims Homicide Rate per 100,000
33 Washington 51 3.72
34 Kansas 23 3.71
35 Colorado 37 3.48
36 Massachusetts 43 3.21
37 Minnesota 34 3.16
38 Oregon 16 2.12
39 Iowa 10 1.56
Alaska fewer than 10 deaths* NAHawaii fewer than 10 deaths NAIdaho fewer than 10 deaths NAMaine fewer than 10 deaths NA
Montana fewer than 10 deaths NANew Hampshire fewer than 10 deaths NA
North Dakota fewer than 10 deaths NASouth Dakota fewer than 10 deaths NA
Utah fewer than 10 deaths NAVermont fewer than 10 deaths NAWyoming fewer than 10 deaths NAU.S. Total 4,453 6.91
* Beginning with 2008 data, the National Center for Health Statistics has begun suppressing data if fewer than 10 deaths are reported in a given state. Death counts and rates are not included for those states. They are, however, included in the U.S. total for deaths and rate.

16 | VIOLENCE POLICY CENTER LOST YOUTH
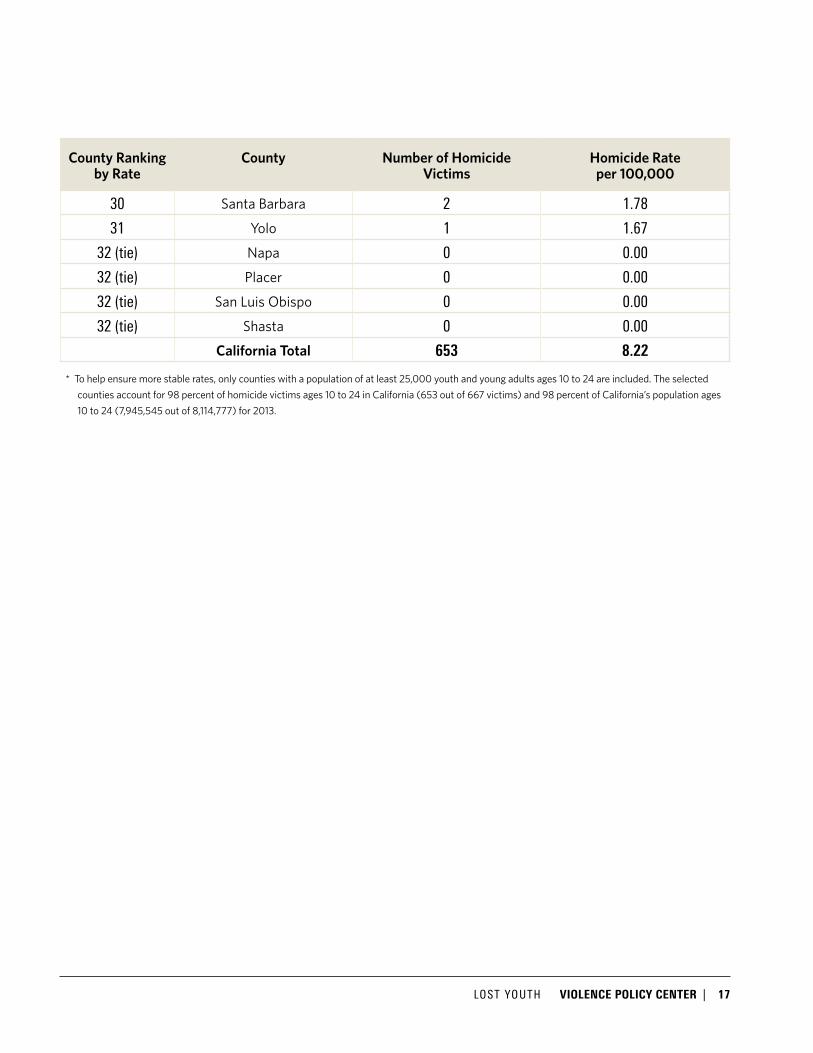
APPENDIX TWO: YOUTH AND YOUNG ADULT HOMICIDE VICTIMS AGES 10 TO 24 IN CALIFORNIA BY COUNTY, RANKED BY RATE, 2013
County Rankingby Rate
County Number of Homicide Victims
Homicide Rate per 100,000
1 Monterey* 22 23.48
2 Madera 7 20.24
3 San Francisco 22 19.94
4 Alameda 58 19.51
5 Merced 13 19.39
6 Solano 12 13.70
7 Stanislaus 16 13.32
8 Butte 6 10.76
9 Kern 22 10.62
10 San Joaquin 17 10.42
11 Los Angeles 214 10.10
12 Tulare 11 9.84
13 Sacramento 29 9.58
14 Ventura 17 9.48
15 Kings 3 8.63
16 Fresno 19 8.35
17 Contra Costa 18 8.32
18 San Bernadino 41 8.15
19 Santa Cruz 4 6.08
20 Santa Clara 18 5.12
21 San Mateo 6 4.75
22 San Diego 28 4.11
23 Riverside 20 3.79
24 Humboldt 1 3.42
25 Sonoma 3 3.21
26 Orange 20 3.07
27 El Dorado 1 2.95
28 Marin 1 2.47
29 Imperial 1 2.37
LOST YOUTH VIOLENCE POLICY CENTER | 17
County Rankingby Rate
County Number of Homicide Victims
Homicide Rate per 100,000
30 Santa Barbara 2 1.78
31 Yolo 1 1.67
32 (tie) Napa 0 0.00
32 (tie) Placer 0 0.00
32 (tie) San Luis Obispo 0 0.00
32 (tie) Shasta 0 0.00
California Total 653 8.22
* To help ensure more stable rates, only counties with a population of at least 25,000 youth and young adults ages 10 to 24 are included. The selected counties account for 98 percent of homicide victims ages 10 to 24 in California (653 out of 667 victims) and 98 percent of California’s population ages 10 to 24 (7,945,545 out of 8,114,777) for 2013.

18 | VIOLENCE POLICY CENTER LOST YOUTH
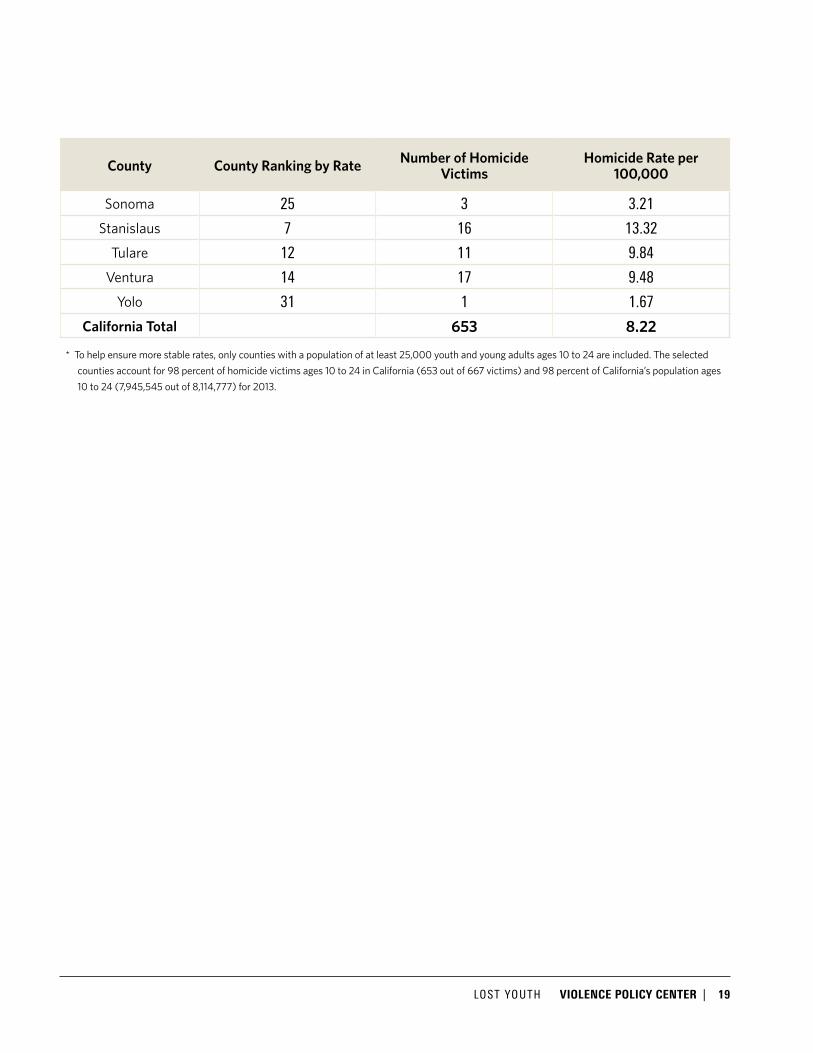
APPENDIX THREE: YOUTH AND YOUNG ADULT HOMICIDE VICTIMS AGES 10 TO 24 IN CALIFORNIA AND RATES, ALPHABETICALLY BY COUNTY, 2013
County County Ranking by Rate Number of Homicide Victims
Homicide Rate per 100,000
Alameda* 4 58 19.51
Butte 8 6 10.76
Contra Costa 17 18 8.32
El Dorado 27 1 2.95
Fresno 16 19 8.35
Humboldt 24 1 3.42
Imperial 29 1 2.37
Kern 9 22 10.62
Kings 15 3 8.63
Los Angeles 11 214 10.10
Madera 2 7 20.24
Marin 28 1 2.47
Merced 5 13 19.39
Monterey 1 22 23.48
Napa 32 (tie) 0 0.00
Orange 26 20 3.07
Placer 32 (tie) 0 0.00
Riverside 23 20 3.79
Sacramento 13 29 9.58
San Bernardino 18 41 8.15
San Diego 22 28 4.11
San Francisco 3 22 19.94
San Joaquin 10 17 10.42
San Luis Obispo 32 (tie) 0 0.00
San Mateo 21 6 4.75
Santa Barbara 30 2 1.78
Santa Clara 20 18 5.12
Santa Cruz 19 4 6.08
Shasta 32 (tie) 0 0.00
Solano 6 12 13.70
LOST YOUTH VIOLENCE POLICY CENTER | 19
County County Ranking by Rate Number of Homicide Victims
Homicide Rate per 100,000
Sonoma 25 3 3.21
Stanislaus 7 16 13.32
Tulare 12 11 9.84
Ventura 14 17 9.48
Yolo 31 1 1.67
California Total 653 8.22
* To help ensure more stable rates, only counties with a population of at least 25,000 youth and young adults ages 10 to 24 are included. The selected counties account for 98 percent of homicide victims ages 10 to 24 in California (653 out of 667 victims) and 98 percent of California’s population ages 10 to 24 (7,945,545 out of 8,114,777) for 2013.

20 | VIOLENCE POLICY CENTER LOST YOUTH
APPENDIX FOUR: YOUTH AND YOUNG ADULT HOMICIDE VICTIMS AGES 10 TO 24 IN CALIFORNIA AND RATES, ALPHABETICALLY BY COUNTY, 2011 - 2013
County Ranking by Rate
Number of Homicide Victims
Homicide Rate per 100,000
2011 2012 2013 2011 2012 2013 2011 2012 2013
Alameda 4 4 4 50 62 58 16.82 20.86 19.51
Butte 24 19 8 2 3 6 3.60 5.40 10.76
Contra Costa 5 8 17 31 24 18 14.74 11.41 8.32
El Dorado 30 (tie) 24 27 0 1 1 0.00 2.95 2.95
Fresno 11 11 16 20 21 19 8.64 9.08 8.35
Humboldt 30 (tie) 30 (tie) 24 0 0 1 0.00 0.00 3.42
Imperial 19 30 (tie) 29 2 0 1 4.65 0.00 2.37
Kern 17 13 9 12 16 22 5.79 7.71 10.62
Kings 13 18 15 3 2 3 8.42 5.61 8.63
Los Angeles 9 10 11 207 207 214 9.55 9.55 10.10
Madera 30 (tie) 17 2 0 2 7 0.00 5.68 20.24
Marin 28 30 (tie) 28 1 0 1 2.63 0.00 2.47
Merced 16 7 5 4 10 13 5.93 14.82 19.39
Monterey 3 1 1 16 22 22 16.96 23.32 23.48
Napa 30 (tie) 30 (tie) 32 (tie) 0 0 0 0.00 0.00 0.00
Orange 22 21 26 25 25 20 3.82 3.82 3.07
Placer 30 (tie) 30 (tie) 32 (tie) 0 0 0 0.00 0.00 0.00
Riverside 20 20 23 24 21 20 4.55 3.98 3.79
Sacramento 12 12 13 26 25 29 8.48 8.15 9.58
San Bernardino 14 22 18 39 19 41 7.65 3.73 8.15

LOST YOUTH VIOLENCE POLICY CENTER | 21
County Ranking by Rate
Number of Homicide Victims
Homicide Rate per 100,000
2011 2012 2013 2011 2012 2013 2011 2012 2013
San Diego 23 16 22 25 40 28 3.61 5.78 4.11
San Francisco 2 2 3 21 27 22 18.04 23.20 19.94
San Joaquin 1 3 10 35 36 17 21.29 21.90 10.42
San Luis Obispo 29 28 32 (tie) 1 1 0 1.50 1.50 0.00
San Mateo 15 26 21 9 3 6 7.26 2.42 4.75
Santa Barbara 27 27 30 3 1 2 2.67 1.78 1.78
Santa Clara 18 14 20 19 22 18 5.54 6.41 5.12
Santa Cruz 10 15 19 6 4 4 9.40 6.26 6.08
Shasta 30 (tie) 25 32 (tie) 0 1 0 0.00 2.90 0.00
Solano 6 6 6 12 13 12 13.71 14.85 13.70
Sonoma 21 29 25 4 1 3 4.24 1.06 3.21
Stanislaus 8 5 7 12 18 16 9.92 14.88 13.32
Tulare 7 9 12 15 12 11 13.43 10.75 9.84
Ventura 26 23 14 5 6 17 2.77 3.32 9.48
Yolo 25 30 (tie) 31 2 0 1 3.19 0.00 1.67
California Total 631 646 653 7.87 8.06 8.22
22 | VIOLENCE POLICY CENTER LOST YOUTH
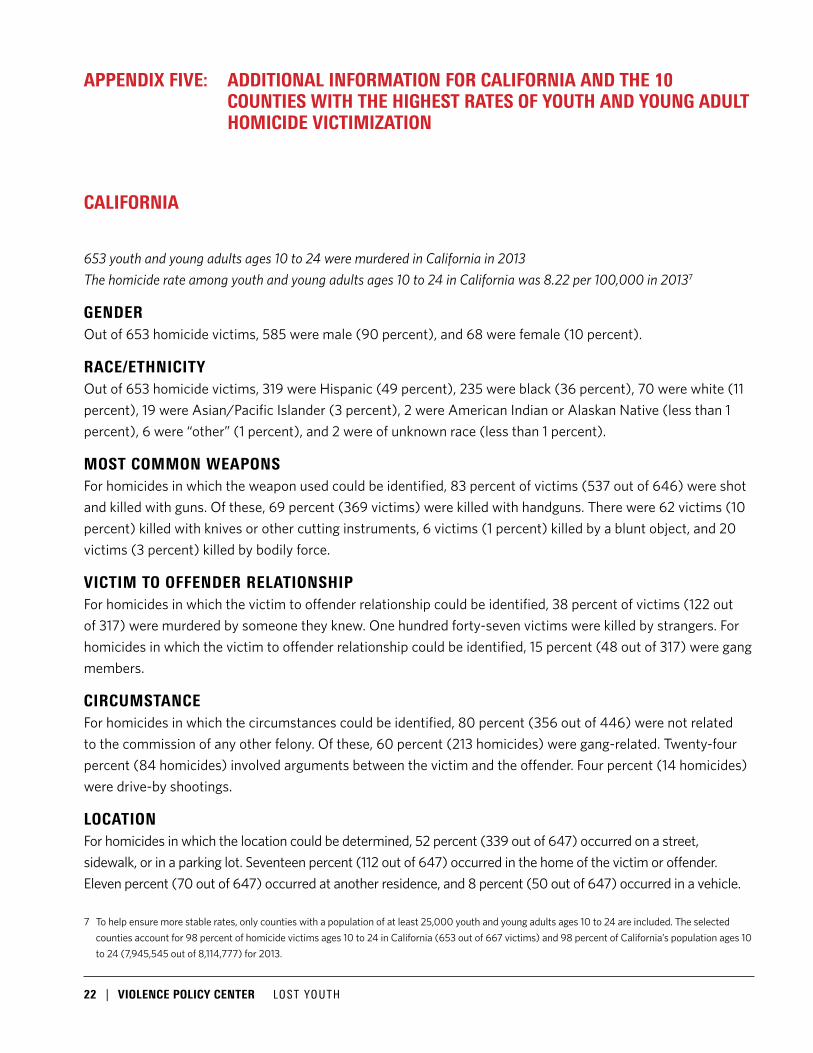
APPENDIX FIVE: ADDITIONAL INFORMATION FOR CALIFORNIA AND THE 10 COUNTIES WITH THE HIGHEST RATES OF YOUTH AND YOUNG ADULT HOMICIDE VICTIMIZATION
CALIFORNIA
653 youth and young adults ages 10 to 24 were murdered in California in 2013 The homicide rate among youth and young adults ages 10 to 24 in California was 8.22 per 100,000 in 20137
GENDER Out of 653 homicide victims, 585 were male (90 percent), and 68 were female (10 percent).
RACE/ETHNICITY Out of 653 homicide victims, 319 were Hispanic (49 percent), 235 were black (36 percent), 70 were white (11 percent), 19 were Asian/Pacific Islander (3 percent), 2 were American Indian or Alaskan Native (less than 1 percent), 6 were “other” (1 percent), and 2 were of unknown race (less than 1 percent).
MOST COMMON WEAPONS For homicides in which the weapon used could be identified, 83 percent of victims (537 out of 646) were shot and killed with guns. Of these, 69 percent (369 victims) were killed with handguns. There were 62 victims (10 percent) killed with knives or other cutting instruments, 6 victims (1 percent) killed by a blunt object, and 20 victims (3 percent) killed by bodily force.
VICTIM TO OFFENDER RELATIONSHIP For homicides in which the victim to offender relationship could be identified, 38 percent of victims (122 out of 317) were murdered by someone they knew. One hundred forty-seven victims were killed by strangers. For homicides in which the victim to offender relationship could be identified, 15 percent (48 out of 317) were gang members.
CIRCUMSTANCE For homicides in which the circumstances could be identified, 80 percent (356 out of 446) were not related to the commission of any other felony. Of these, 60 percent (213 homicides) were gang-related. Twenty-four percent (84 homicides) involved arguments between the victim and the offender. Four percent (14 homicides) were drive-by shootings.
LOCATION For homicides in which the location could be determined, 52 percent (339 out of 647) occurred on a street, sidewalk, or in a parking lot. Seventeen percent (112 out of 647) occurred in the home of the victim or offender. Eleven percent (70 out of 647) occurred at another residence, and 8 percent (50 out of 647) occurred in a vehicle.
7 To help ensure more stable rates, only counties with a population of at least 25,000 youth and young adults ages 10 to 24 are included. The selected counties account for 98 percent of homicide victims ages 10 to 24 in California (653 out of 667 victims) and 98 percent of California’s population ages 10 to 24 (7,945,545 out of 8,114,777) for 2013.

LOST YOUTH VIOLENCE POLICY CENTER | 23
MONTEREY COUNTY
22 youth and young adults ages 10 to 24 were murdered in Monterey County in 2013 The homicide rate among youth and young adults ages 10 to 24 in Monterey County was 23.48 per 100,000 in 2013 Ranked 1st in California among counties with a population of 10- to 24-year-olds 25,000 or greater
GENDER Out of 22 homicide victims, 21 were male (95 percent), and 1 was female (5 percent).
RACE/ETHNICITY Out of 22 homicide victims, 18 were Hispanic (82 percent), 2 were black (9 percent), 1 was white (5 percent), and 1 was Asian/Pacific Islander (5 percent).
MOST COMMON WEAPONS For homicides in which the weapon used could be identified, 91 percent of victims (20 out of 22) were shot and killed with guns. Of these, 25 percent (5 victims) were killed with handguns. There was 1 victim (5 percent) killed with a knife or other cutting instrument.
VICTIM TO OFFENDER RELATIONSHIP For homicides in which the victim to offender relationship could be identified, 11 percent of victims (1 out of 9) were murdered by someone they knew. Eight victims were killed by strangers.
CIRCUMSTANCE For homicides in which the circumstances could be identified, 94 percent (15 out of 16) were not related to the commission of any other felony. Of these, 87 percent (13 homicides) were gang-related. Seven percent (1 homicide) involved arguments between the victim and the offender.
LOCATION For homicides in which the location could be determined, 68 percent (15 out of 22) occurred on a street, sidewalk, or in a parking lot. Eighteen percent (4 out of 22) occurred in the home of the victim or offender. Five percent (1 out of 22) occurred in a vehicle.
24 | VIOLENCE POLICY CENTER LOST YOUTH
MADERA COUNTY
7 youth and young adults ages 10 to 24 were murdered in Madera County in 2013 The homicide rate among youth and young adults ages 10 to 24 in Madera County was 20.24 per 100,000 in 2013 Ranked 2nd in California among counties with a population of 10- to 24-year-olds 25,000 or greater
GENDER Out of 7 homicide victims, 7 were male (100 percent).
RACE/ETHNICITY Out of 7 homicide victims, 4 were Hispanic (57 percent), 1 was black (14 percent), and 2 were Asian/Pacific Islander (29 percent).
MOST COMMON WEAPONS For homicides in which the weapon used could be identified, 100 percent of victims (7 out of 7) were shot and killed with guns. Of these, 71 percent (5 victims) were killed with handguns.
VICTIM TO OFFENDER RELATIONSHIP For homicides in which the victim to offender relationship could be identified, no victims were murdered by someone they knew. Two victims were killed by strangers. For homicides in which the victim to offender relationship could be identified, 33 percent (1 out of 3) were gang members.
CIRCUMSTANCE For homicides in which the circumstances could be identified, 83 percent (5 out of 6) were not related to the commission of any other felony. Of these, 80 percent (4 homicides) were gang-related. Twenty percent (1 homicide) involved arguments between the victim and the offender.
LOCATION For homicides in which the location could be determined, 57 percent (4 out of 7) occurred on a street, sidewalk, or in a parking lot. Fourteen percent (1 out of 7) occurred in the home of the victim or offender. Twenty-nine percent (2 out of 7) occurred at another residence.
LOST YOUTH VIOLENCE POLICY CENTER | 25
SAN FRANCISCO COUNTY
22 youth and young adults ages 10 to 24 were murdered in San Francisco County in 2013 The homicide rate among youth and young adults ages 10 to 24 in San Francisco County was 19.94 per 100,000 in 2013 Ranked 3rd in California among counties with a population of 10- to 24-year-olds 25,000 or greater
GENDER Out of 22 homicide victims, 21 were male (95 percent), and 1 was female (5 percent).
RACE/ETHNICITY Out of 22 homicide victims, 5 were Hispanic (23 percent), 14 were black (64 percent), and 3 were white (14 percent).
MOST COMMON WEAPONS For homicides in which the weapon used could be identified, 91 percent of victims (20 out of 22) were shot and killed with guns. Of these, 100 percent (20 victims) were killed with handguns. There were 2 victims (9 percent) killed with knives or other cutting instruments.
VICTIM TO OFFENDER RELATIONSHIP For homicides in which the victim to offender relationship could be identified, 9 percent of victims (1 out of 11) were murdered by someone they knew. Eight victims were killed by strangers. For homicides in which the victim to offender relationship could be identified, 18 percent (2 out of 11) were gang members.
CIRCUMSTANCE For homicides in which the circumstances could be identified, 55 percent (6 out of 11) were not related to the commission of any other felony. Of these, 50 percent (3 homicides) were gang-related. Fifty percent (3 homicides) involved arguments between the victim and the offender.
LOCATION For homicides in which the location could be determined, 77 percent (17 out of 22) occurred on a street, sidewalk, or in a parking lot. Five percent (1 out of 22) occurred in the home of the victim or offender. Nine percent (2 out of 22) occurred in a vehicle.
26 | VIOLENCE POLICY CENTER LOST YOUTH
ALAMEDA COUNTY
58 youth and young adults ages 10 to 24 were murdered in Alameda County in 2013 The homicide rate among youth and young adults ages 10 to 24 in Alameda County was 19.51 per 100,000 in 2013 Ranked 4th in California among counties with a population of 10- to 24-year-olds 25,000 or greater
GENDER Out of 58 homicide victims, 53 were male (91 percent), and 5 were female (9 percent).
RACE/ETHNICITY Out of 58 homicide victims, 10 were Hispanic (17 percent), 44 were black (76 percent), 3 were white (5 percent), and 1 was Asian/Pacific Islander (2 percent).
MOST COMMON WEAPONS For homicides in which the weapon used could be identified, 97 percent of victims (56 out of 58) were shot and killed with guns. Of these, 71 percent (40 victims) were killed with handguns. There was 1 victim (2 percent) killed with a knife or other cutting instrument, and 1 victim (2 percent) killed by bodily force.
VICTIM TO OFFENDER RELATIONSHIP For homicides in which the victim to offender relationship could be identified, 34 percent of victims (10 out of 29) were murdered by someone they knew. Nineteen victims were killed by strangers.
CIRCUMSTANCE For homicides in which the circumstances could be identified, 70 percent (19 out of 27) were not related to the commission of any other felony. Of these, 53 percent (10 homicides) were gang-related. Thirty-seven percent (7 homicides) involved arguments between the victim and the offender. Five percent (1 homicide) were drive-by shootings.
LOCATION For homicides in which the location could be determined, 74 percent (43 out of 58) occurred on a street, sidewalk, or in a parking lot. Seven percent (4 out of 58) occurred in the home of the victim or offender. Five percent (3 out of 58) occurred at another residence.

LOST YOUTH VIOLENCE POLICY CENTER | 27
MERCED COUNTY
13 youth and young adults ages 10 to 24 were murdered in Merced County in 2013 The homicide rate among youth and young adults ages 10 to 24 in Merced County was 19.39 per 100,000 in 2013 Ranked 5th in California among counties with a population of 10- to 24-year-olds 25,000 or greater
GENDER Out of 13 homicide victims, 12 were male (92 percent), and 1 was female (8 percent).
RACE/ETHNICITY Out of 13 homicide victims, 9 were Hispanic (69 percent), 1 was black (8 percent), 2 were white (15 percent), and 1 was Asian/Pacific Islander (8 percent).
MOST COMMON WEAPONS For homicides in which the weapon used could be identified, 100 percent of victims (13 out of 13) were shot and killed with guns. Of these, 31 percent (4 victims) were killed with handguns.
VICTIM TO OFFENDER RELATIONSHIP For homicides in which the victim to offender relationship could be identified, no victims (0 out of 6) were murdered by someone they knew. Six were killed by strangers.
CIRCUMSTANCE For homicides in which the circumstances could be identified, 83 percent (5 out of 6) were not related to the commission of any other felony. Of these, 40 percent (2 homicides) were gang-related. Sixty percent (3 homicides) were drive-by shootings.
LOCATION For homicides in which the location could be determined, 23 percent (3 out of 13) occurred on a street, sidewalk, or in a parking lot. Fifteen percent (2 out of 13) occurred in the home of the victim or offender. Thirty-one percent (4 out of 13) occurred at another residence. Fifteen percent (2 out of 13) occurred in a vehicle.

28 | VIOLENCE POLICY CENTER LOST YOUTH
SOLANO COUNTY
12 youth and young adults ages 10 to 24 were murdered in Solano County in 2013 The homicide rate among youth and young adults ages 10 to 24 in Solano County was 13.70 per 100,000 in 2013 Ranked 6th in California among counties with a population of 10- to 24-year-olds 25,000 or greater
GENDER Out of 12 homicide victims, 11 were male (92 percent), and 1 was female (8 percent).
RACE/ETHNICITY Out of 12 homicide victims, 4 were Hispanic (33 percent), 4 were black (33 percent), and 4 were white (33 percent).
MOST COMMON WEAPONS For homicides in which the weapon used could be identified, 83 percent of victims (10 out of 12) were shot and killed with guns. Of these, 100 percent (10 victims) were killed with handguns. There was 1 victim (8 percent) killed with a knife or other cutting instrument.
VICTIM TO OFFENDER RELATIONSHIP For homicides in which the victim to offender relationship could be identified, 20 percent of victims (1 out of 5) were murdered by someone they knew. Four victims were killed by strangers.
CIRCUMSTANCE For homicides in which the circumstances could be identified, 50 percent (3 out of 6) were not related to the commission of any other felony. Of these, 100 percent (3 homicides) involved arguments between the victim and the offender.
LOCATION For homicides in which the location could be determined, 58 percent (7 out of 12) occurred on a street, sidewalk, or in a parking lot. Seventeen percent (2 out of 12) occurred in the home of the victim or offender. Eight percent (1 out of 12) occurred at another residence, and 8 percent (1 out of 12) occurred in a vehicle.

LOST YOUTH VIOLENCE POLICY CENTER | 29
STANISLAUS COUNTY
16 youth and young adults ages 10 to 24 were murdered in Stanislaus County in 2013 The homicide rate among youth and young adults ages 10 to 24 in Stanislaus County was 13.32 per 100,000 in 2013 Ranked 7th in California among counties with a population of 10- to 24-year-olds 25,000 or greater
GENDER Out of 16 homicide victims, 15 were male (94 percent), and 1 was female (6 percent).
RACE/ETHNICITY Out of 16 homicide victims, 11 were Hispanic (69 percent), 4 were white (25 percent), and 1 was Asian/Pacific Islander (6 percent).
MOST COMMON WEAPONS For homicides in which the weapon used could be identified, 81 percent of victims (13 out of 16) were shot and killed with guns. Of these, 77 percent (10 victims) were killed with handguns. There was 1 victim (6 percent) killed with a knife or other cutting instrument.
VICTIM TO OFFENDER RELATIONSHIP For homicides in which the victim to offender relationship could be identified, 25 percent of victims (2 out of 8) were murdered by someone they knew. Four victims were killed by strangers. For homicides in which the victim to offender relationship could be identified, 25 percent (2 out of 8) were gang members.
CIRCUMSTANCE For homicides in which the circumstances could be identified, 77 percent (10 out of 13) were not related to the commission of any other felony. Of these, 50 percent (5 homicides) were gang-related. Forty percent (4 homicides) involved arguments between the victim and the offender. Ten percent (1 homicide) were drive-by shootings.
LOCATION For homicides in which the location could be determined, 44 percent (7 out of 16) occurred on a street, sidewalk, or in a parking lot. Twenty-five percent (4 out of 16) occurred in the home of the victim or offender. Six percent (1 out of 16) occurred at another residence. Thirteen percent (2 out of 16) occurred in a vehicle.
30 | VIOLENCE POLICY CENTER LOST YOUTH
BUTTE COUNTY
6 youth and young adults ages 10 to 24 were murdered in Butte County in 2013 The homicide rate among youth and young adults ages 10 to 24 in Butte County was 10.76 per 100,000 in 2013 Ranked 8th in California among counties with a population of 10- to 24-year-olds 25,000 or greater
GENDER Out of 6 homicide victims, 5 were male (83 percent), and 1 was female (17 percent).
RACE/ETHNICITY Out of 6 homicide victims, 2 were Hispanic (33 percent), 2 were black (33 percent), and 2 were white (33 percent).
MOST COMMON WEAPONS For homicides in which the weapon used could be identified, 80 percent of victims (4 out of 5) were shot and killed with guns. Of these, 50 percent (2 victims) were killed with handguns. There was 1 victim (20 percent) killed with a knife or other cutting instrument.
VICTIM TO OFFENDER RELATIONSHIP For homicides in which the victim to offender relationship could be identified, 50 percent (2 out of 4) were murdered by someone they knew. Two victims were killed by strangers.
CIRCUMSTANCE For homicides in which the circumstances could be identified, 60 percent (3 out of 5) were not related to the commission of any other felony. Of these, 33 percent (1 homicide) were gang-related. Sixty-seven percent (2 homicides) involved arguments between the victim and the offender.
LOCATION For homicides in which the location could be determined, 17 percent (1 out of 6) occurred on a street, sidewalk, or in a parking lot. Fifty percent (3 out of 6) occurred in the home of the victim or offender. Seventeen percent (1 out of 6) occurred at another residence.
LOST YOUTH VIOLENCE POLICY CENTER | 31
KERN COUNTY
22 youth and young adults ages 10 to 24 were murdered in Kern County in 2013 The homicide rate among youth and young adults ages 10 to 24 in Kern County was 10.62 per 100,000 in 2013 Ranked 9th in California among counties with a population of 10- to 24-year-olds 25,000 or greater
GENDER Out of 22 homicide victims, 18 were male (82 percent), and 4 were female (18 percent).
RACE/ETHNICITY Out of 22 homicide victims, 10 were Hispanic (45 percent), 8 were black (36 percent), 3 were white (14 percent), and 1 victim (5 percent) was of unknown race.
MOST COMMON WEAPONS For homicides in which the weapon used could be identified, 73 percent of victims (16 out of 22) were shot and killed with guns. Of these, 50 percent (8 victims) were killed with handguns. There were 3 victims (14 percent) killed with knives or other cutting instruments, and 2 victims (9 percent) killed by bodily force.
VICTIM TO OFFENDER RELATIONSHIP For homicides in which the victim to offender relationship could be identified, 45 percent of victims (5 out of 11) were murdered by someone they knew. Six victims were killed by strangers.
CIRCUMSTANCE For homicides in which the circumstances could be identified, 82 percent (9 out of 11) were not related to the commission of any other felony. Of these, 67 percent (6 homicides) were gang-related. Twenty-two percent (2 homicides) involved arguments between the victim and the offender.
LOCATION For homicides in which the location could be determined, 43 percent (9 out of 21) occurred on a street, sidewalk, or in a parking lot. Twenty-four percent (5 out of 21) occurred in the home of the victim or offender. Five percent (1 out of 21) occurred at another residence, and 5 percent (1 out of 21) occurred in a vehicle.

32 | VIOLENCE POLICY CENTER LOST YOUTH
SAN JOAQUIN COUNTY
17 youth and young adults ages 10 to 24 were murdered in San Joaquin County in 2013 The homicide rate among youth and young adults ages 10 to 24 in San Joaquin County was 10.42 per 100,000 in 2013 Ranked 10th in California among counties with a population of 10- to 24-year-olds 25,000 or greater
GENDER Out of 17 homicide victims, 14 were male (82 percent), and 3 were female (18 percent).
RACE/ETHNICITY Out of 17 homicide victims, 8 were Hispanic (47 percent), and 9 were black (53 percent).
MOST COMMON WEAPONS For homicides in which the weapon used could be identified, 94 percent of victims (15 out of 16) were shot and killed with guns. Of these, 80 percent (12 victims) were killed with handguns. There was 1 victim (6 percent) killed with a knife or other cutting instrument.
VICTIM TO OFFENDER RELATIONSHIP For homicides in which the victim to offender relationship could be identified, 43 percent of victims (3 out of 7) were murdered by someone they knew. Three victims were killed by strangers. For homicides in which the victim to offender relationship could be identified, 14 percent (1 out of 7) were gang members.
CIRCUMSTANCE For homicides in which the circumstances could be identified, 20 percent (2 out of 10) were not related to the commission of any other felony. Of these, 50 percent (1 homicide) were gang-related. Fifty percent (1 homicide) were drive-by shootings.
LOCATION For homicides in which the location could be determined, 44 percent (7 out of 16) occurred on a street, sidewalk, or in a parking lot. Thirteen percent (2 out of 16) occurred in the home of the victim or offender. Nineteen percent (3 out of 16) occurred at another residence, and 6 percent (1 out of 16) occurred in a vehicle.

LOST YOUTH VIOLENCE POLICY CENTER | 33
1730 Rhode Island Avenue, NW Suite 1014
Washington, DC 20036
W W W . V P C . O R G