lorna bourke & anne-marie adams - jowr · corley and robinson (1997) reported gender...
TRANSCRIPT
Bourke, L.account fohttp://dx.d
Contact: BUnited Kin
CopyrightNo Deriva
Is it worbein
Lorna B
Liverpoo
Abstract: considerefor the difmonths) passessmenwriting: ncomplexitmeasuringphonologithe boys wexcept theany of thegenders ohierarchicmore specscale. Thithe varian
Keywords
., & Adams, A. (or girls being bedoi.org/10.17239
Bourke, L., Depangdom --- bourke
t: Earli | This artiative Works 3.0
differeking m
ng bette
Bourke & A
ol Hope Univer
Girls are more d gender differefferential rates oparticipated. Qunt scale from thenumber of wordty of the phrasesg their languaical, and centrawere more likelye grammatical ce measures of lanon the capacitcal regressions rcifically spoken s finding accordce in boys’ and
s: gender, worki
2011). Is it diffetter at writing th9/jowr-2012.03.
artment of [email protected].
cle is publishedUnported licens
ences inemoryer at wr
Anne-Marie
rsity & Liverpo
likely to outperfences in languagof progress. Sixtyualitative differee Early Years Fods, diversity of s/sentences wereage productional executive comy to perform signomplexity of sennguage ability. Fty and efficienrevealed that th
language compds well with thegirls’ writing ab
ng memory, spo
erence in languahan boys. Journa.03.5
hology, Liverpoo
d under Creative se.
n languy that acriting t
Adams
ool John Moore
form boys in thege and working
y-seven childrennces in writing
oundation Stage words, numbe
e also analysed.n and compremponents of wonificantly less wentences. InitiallyFurther, no signincy of their whe individual difprehension, pree literature that bility.
oken language, w
ge skills and woal of Writing Rese
ol Hope Univers
Commons Attri
uage skccount han bo
es University |
e development og memory skills n (31 males and
progress were Profile (EYFSP)
er of phrases/se. The children wehension skills orking memory. ell than the girlsy, no significant ficant difference
working memorfferences in gendicted performasuggests that la
writing
orking memory tearch, 3(3), 249-
ity, Hope Park L
bution-Noncom
ills andfor gir
oys?
United Kingd
of writing skills. as a possible e36 females) (M examined using. Quantitative m
entences and grwere also assesse
and the visThe results indon all measuresdifferences were
es were found bey functioning.
nder and languaance on the EYFnguage skills ca
that -277.
L16 9JD |
mmercial-
d rls
dom
This study explanation
M age 57.30 g a writing
measures of rammatical ed on tasks suo-spatial,
dicated that s of writing re found on etween the However,
age ability, FSP writing an mediate
BOURKE & ADAMS DIFFERENCES IN LANGUAGE SKILLS AND WORKING MEMORY | 250
In part driven by United Kingdom (UK) Government statistics, there is an overwhelming assumption in educational literature and practice that girls outperform boys in a number of key scholastic attainment areas, particularly writing (Barrs & Pidgeon, 2002; Daly, 2003). There is evidence to suggest that this pattern of performance on literacy-based tasks is extended to other countries (Machin & McNally, 2006; Martino & Kehler, 2007). Within the UK education system there are a number of Key Stages that guide the curriculum and assessment of pupils throughout their time at school. For example, the Foundation Stage of education (known as Early Years) was introduced in England and Wales in 2001 to enable children to attend an educational setting from the age of 3 years to prepare them for statutory schooling at age five (DfES, 2001). At the end of this stage there is a final observational assessment of each child’s performance in writing.
Nationally the gender gap is more pronounced on this scale, at 19 percentage points, than on any of the other achievement scales (e.g. reading, language, mathematics, personal, social and emotional development) that are administered (DCSF, 2010). On average 75% of girls aged 4-5 years are likely to be achieving the Government’s prescribed standards of 6 points or more out of 9 on this scale. In contrast, only 56% of boys achieved the same standard. That is, a larger proportion of girls at this stage of education are able to write for a variety of purposes, use phonics knowledge to write simple regular words and make phonetically plausible attempts at more complex words. In addition, they are more able to form captions and simple sentences with some punctuation. In 2002, Barrs and Pidgeon proposed that it become a national priority to address this issue and strategies should be formulated and adopted in order to improve boys’ achievement in writing. Despite this call and the implementation of associated intervention methods, the magnitude of the differential between boys and girls has been consistent since 2005 when results were first published for the Early Years Foundation Stage Profile (EYFSP). Further, this trend is apparent at all four Key Stages of the curriculum that span the eleven years of compulsory education in the UK (e.g. 5-16 years-of-age) (DCSF, 2010; Gorard, Rees & Salisbury, 2001; Machin & McNally, 2006; Ofsted, 1993;) and is irrespective of the methods used to identify problems in writing (Berninger, Neilsen, Abbott, Wijsman, & Raskind, 2008). Therefore, it seems appropriate, as Berninger et al (2008) suggest, that in order to improve the educational opportunities of boys systematic investigation is needed to precisely determine where those differences lie and what is likely to be the cause of them.
The purpose of the current study was firstly to examine the extent of the associations between measures of writing achievement using not only the more holistic EYFSP assessment scale for writing but also specific psycholinguistic measures of writing appropriate to the assessment of emergent writing development within school-based instruction (e.g. number and diversity of words, total number and grammatical complexity of phrases/sentences written). Secondly, the nature of the relationships between the writing measures and the linguistic and cognitive factors which are known to constrain or facilitate writing development at this stage of education were
251 | JOURNAL OF WRITING RESEARCH
investigated. They included expressive and verbal comprehension language skills and working memory capabilities. Thirdly, a more detailed exploration of the associated individual differences within groups of boys and girls on those factors in relation to writing was undertaken. Finally, the implications of the findings for classroom-based instruction are discussed.
One of the first aims of the instruction programme for young children in their Reception Year (aged 4-5 years) at school is to develop writing from drawing, scribbling and labelling pictures to making recognisable, letter-like symbols. Children who are able to move to this stage of development are likely to score 1-4 points on the EYFSP writing scale. This is indicative of the fact that they are writing out strings of letters with the purpose of communicating meaning but with little or no orthographic or phonological correspondence with the intended word. Progressing through this stage the children become increasingly proficient at representing all the sounds in a word with letters. This stage of spelling development corresponds to those children being awarded the optimal 6-8 points previously mentioned. They will be writing words, phrases or sentences and using phonetically plausible spellings for more complex words for a variety of purposes, including writing stories. It is not an expectation for children to be using punctuation consistently at this stage of education. However, exceptionally there are some children who are able to do this in order to delineate their phrase and sentence boundaries. A score of 9 points is reserved for this case. Although a reflection of the overall aims of the stage of education the children are undertaking, the writing scale does not fully encompass the finely detailed differences in writing development (e.g. movement from lemma to lexeme to grapheme) (Bourke & Adams, 2010; Dyson, 1992). This was beyond the scope of the current investigation. Nevertheless, the criteria reflect the full range of typically developing writers within the classroom. Therefore, it includes indicative measures of pre-writing skills, such as experimentation in mark-making (Qualifications and Curriculum Authority, 2008).
A number of theoretical explanations have been proposed to account for the well documented developmental lag in writing achievement between boys and girls. Of particular interest to the current study are the biological differences between boys and girls that might impact on their cognitive architecture and functioning and could lead to an effect on their academic performance at a later stage. Several reasons have been proposed to substantiate this link. For example, medical evidence indicates that boys are more at risk prenatally and during the process of birth, where they are more likely to suffer anoxia and other complications (Arnold, 1996). This might account, in part, for the greater incidence of boys who are diagnosed with a learning disability and who subsequently form the greater proportion of children labelled as having special education needs and dyslexia (see Shaywitz, Shaywitz, Fletcher & Escobar, 1990; Wadsworth, DeFries, Stevenson, Gilger & Pennington, 1992 for alternative accounts).
In addition, a greater proportion of boys are working towards the early learning goals rather than securely within them. According to the DCSF (2010), 7% of girls are performing at the very low end of the EYFSP writing scale and therefore, on average,
BOURKE & ADAMS DIFFERENCES IN LANGUAGE SKILLS AND WORKING MEMORY | 252
are likely to score 1-3 points on this compared to 15% of boys. As a consequence, more boys are demonstrating that they can use ‘‘some clearly identifiable letters to communicate the meaning that they are representing’’. Conceptually and developmentally this form of writing is very different from that of children who are able to write meaningful and identifiable words, phrases and/or sentences.
In an attempt to tease apart the multiple constraints faced by emergent writers, Berninger et al, (2008) suggested that they were, undoubtedly, neurodevelopmental, linguistic and cognitive in nature. They proposed that there was evidence indicating that there are differences in how boys (using right hemisphere geometric coding) and girls (using left hemisphere verbal coding) code letters in memory. It was thought that this might influence their orthographic and phonological coding preferences in reading and writing. Currently, there is a strong emphasis on phonological coding strategies within the school curriculum. It was suggested that if children could adopt a phonics strategy (speech-based coding and encoding skills) then they would become more proficient in utilising that knowledge across communication and literacy domains, including writing (Rose, 2006). The assessment scale for writing in the EYFSP assumes that those children who adopt this strategy for spelling are more accomplished writers than those who are reliant on the memorisation techniques based on visual storage and manipulation methods of coding information which tend to develop as they gain experience with the printed word (QCA, 2008, Treiman, 1993).
The notion that language development follows a maturational ‘timetable’, where girls progress at a faster rate than boys is indicative of a long held assumption that girls are presumed to have more advanced verbal reasoning and analytic skills. Reznick, Corley and Robinson (1997) reported gender differences in the rate of change in cognitive abilities that influence language development. The findings indicated that girls are likely to go through a period of rapid change between the ages of 14 and 20 months, whereas this is only matched by boys at a later time point, 20-24 months. A key index of language ability in the early years of language acquisition is productive vocabulary (Price, Eley, Stevenson, Saudino & Plomin, 2001). Hulle and Lemery (2004) proposed that vocabulary is a necessary precursor to word combination use, which formulates the emergence of syntactical understanding in typically developing children. They found that girls are more prepared than boys at age 24 months to enter a syntactical phase of development in spoken language skills.
However, it is evident that the pattern of differences on language-based tasks that could impact upon the subsequent literacy development of boys and girls is complex and varied (Hall & Coles, 1997). For example, Wolf and Gow (1985/1986) conducted an extensive review questioning the premise of girls’ superiority in all early language skills. Their longitudinal study confirmed asymmetries between the genders in language development. Additionally, girls in grades 1-3 (7-9 years) performed significantly better than boys on tasks that require rapid naming of objects and rapid naming of alternating stimuli. However, boys in grades 1-3 performed better than girls on three tasks requiring semantic retrieval (confrontation, naming, receptive vocabulary and semantic-
253 | JOURNAL OF WRITING RESEARCH
based generative naming) (see also Berninger & Fuller, 1992 for similar conclusions in relation to boys). Arnold (1996) concluded that girls are more sensitive to sound and are able to detect intonation patterns at an earlier stage and this then leads to an advantage in their language production skills.
Davies, Shanks and Davies (2004) reported that children who develop more slowly in specific aspects of language struggle in telling, understanding and writing stories. In addition, Catts and Kamhi (2005) propose that oral language deficits (e.g. morphological and syntactic awareness) co-occur with reading disability. Evidence supporting the interactive nature of speech-based processes and literacy has informed the development of instructional policy. Therefore, in addition to a systematic attempt to develop speech-based decoding skills (e.g. phonological awareness and spelling), there are timetabled opportunities for ‘talk for writing’ (e.g. vocabulary development and syntactic awareness).
More direct evidence of the relationship between the development of writing skills and language production was provided from a large scale study of secondary school students by McCutchen, Covill, Hoyne and Mildes (1994). They found that stronger writers performed higher on measures of general language ability, verbal fluency (e.g. the ability to retrieve category exemplars) and reading and performed a lexical decision task more quickly when compared to less skilled writers. Interestingly, although Berninger and Fuller (1992) originally suggested that efficacy of semantic retrieval was more related to writing than reading, they also reported that boys outperformed girls on the majority of the four verbal fluency tasks they administered to measure this. They concluded that boys cannot be assumed to have a global weakness in the area of language development. Further, verbal fluency tasks require the participant to generate as many category exemplars as possible. In doing so, these tasks also measure the efficacy with which search and retrieval strategies can be invoked in order to generate the exemplars. At the same time there is the requirement to monitor and inhibit items that do not come from the correct category and are not repetitions. This becomes crucial to the participants’ performance on the task, suggesting the relative importance of attentional resources in order to minimise distractibility (Baddeley, 1996).
Poorer performance on such tasks could provide a partial explanation of why, despite Berninger and Fuller’s (1992) finding, the co-occurrence of poorer language skills and boys’ attentional difficulties (e.g. ADD) have been noted by a number of researchers. For example, Stowe, Arnold and Ortiz (2000) found a significant interaction between gender, language skills and off-task disruptive classroom behaviour in preschoolers attending child care (see also NIHM, 2000; Willcutt et al, 2007; Zevenbergen & Ryan, 2009). That is, boys’ attention problems were significantly related to less developed expressive language skills. In contrast, the relationship between these two variables was not found to be significant for girls. Therefore, researchers have also suggested that there are common neurological bases for ADD and language difficulties (Baird, Stevenson & Williams, 2000) and that attentional difficulties may impede children’s language acquisition (e.g. Baird et al, 2000; Love & Thompson, 1988).
BOURKE & ADAMS DIFFERENCES IN LANGUAGE SKILLS AND WORKING MEMORY | 254
The likelihood of boys being diagnosed as suffering from attention deficit disorder (ADD) is three times that in girls and is indicative of a biological predisposition to the inability to sustain attention (Bauermeister et al, 2007; Graetz, Sawyer & Baghurst, 2005; Love & Thompson, 1988). Such children will have difficulty in focusing conscious, deliberate attention to organising and completing routine tasks. Whilst not suggesting that all boys regarded as underachieving fall within this diagnostic category, it is possible that some boys may be experiencing a milder but nonetheless academically debilitating form at the less severe end of an ADD continuum. The National Literacy Strategy (NLS) (DfES, 2001) provided guidelines to teachers to address the problem of boys’ underachievement in schools which were perceived to relate to the boys’ relative lack of time spent ‘on-task’ and poorer concentration levels (DfES, 2007; Jacob, 2002; Wood, 2000). The Government advice given suggested that teachers should develop specific strategies to ensure that boys are provided with clear short-term targets and were encouraged to meet these by sustaining their concentration levels (DfES, 2007). However, not withstanding this directive, the gender gap between boys and girls on writing assessments has remained.
The aforementioned research points towards a rationale for examining working memory resources that underpin some of the gender differences mentioned. It is well-established that there are close links between an individual’s ability to store and manipulate information effectively in working memory and the level of achievement on measures of vocabulary and language comprehension (Adams, Bourke, & Willis, 1999; Adams & Gathercole, 2000; Gathercole & Baddeley, 2003; Henry & MacLean, 2003). Research has also suggested that working memory contributes to individual and developmental differences in writing skills for children aged four years upwards (Alloway, Gatherole, Adams, Willis, Eaglen & Lamont, 2005a, 2005b; Bourke & Adams, 2003; Gathercole & Alloway, 2008; Swanson & Berninger, 1996). Although there are a number of different conceptualisations of working memory, there is general agreement that it comprises verbal and visuo-spatial subsystems that interact together with a processing component (central executive) to complete cognitive tasks related to the goals of current learning over a limited time span (e.g. Baddeley, 1986, 1996, 2000; Daneman & Carpenter, 1980; Engle, 2001, 2002; Just & Carpenter, 1992). Using directly comparable measures of working memory to the current study it has been found that children with better complex working memory spans (e.g. listening span) tend to produce more varied vocabulary, longer and more grammatically complex sentences, better text coherence and performance on statutory tests (Alloway et al, 2005b; Bourke & Adams, 2003; Gathercole & Pickering, 2000; McCutchen et al, 1994; Swanson & Berninger, 1996).
Complex span tasks place demands on the ability to store and process verbal information concurrently (Daneman & Carpenter, 1980; Just & Carpenter, 1992). Interpreted theoretically, this finding shows that less reliance on phonological storage capabilities through automaticity of some of the lower-level aspects of the writing process (e.g. handwriting and spelling which require orthographic and phonological
255 | JOURNAL OF WRITING RESEARCH
recoding in short-term memory) will make available more capacity for the efficient processing of higher-order processes (e.g. retrieving words, generating phrases/sentences which are translated into linguistic representations in memory) (Bourdin & Fayol, 1996; Hoskyn & Swanson, 2003; McCutchen, 1986; Olive, 2004). Children who are constrained by a greater proportion of their working memory resources being deployed to transcription processes will inevitably find greater difficulty in being able to write words and phrases meaningfully (Swanson & Berninger, 1996). With this in mind, there are clear directions within the writing instruction programme to focus on the automation of transcriptions skills (DfEE, 2001). Further, there is evidence to suggest that when specific interventions are used to minimise this potential cognitive overload for boys, it is effective. For example, Daly (2003) conducted case study analyses within schools, whereby boys were asked to produce a shorter piece of writing and this led to significant improvements in achievement levels. By being told to write shorter passages, fewer cognitive demands were placed on the working memory resources and task-relevant linguistic skills were drawn from more effectively.
More recently, Bourke and Adams (2010) have drawn attention to the relatively important role of visuo-spatial short-term memory in explaining group differences between those children who were able to meet the prescribed Early Years writing goals at age 4-5 years and those that could not (see also Alloway et al, 2005a; and Pickering & Gathercole, 2004 for similar findings for children with SEN). The main difference between the Early Years emergent writing stage and the later stages of writing development reviewed by other researchers is that visuo-spatial short-term memory is crucial for effective orthographic coding strategies that allow for the successful mapping of the correct grapheme code associated with the speech-based code involved in transcription. To some extent this will be reliant on the efficacy with which visual representations can be maintained and stored in short-term memory.
In conclusion, it is clear from previous research that writing development is dependent both on language ability and working memory resources (Gathercole & Alloway, 2008). Currently there is no published research investigating differences in the interaction of these factors between boys and girls in the context of emergent writing at the earliest stage of formal instruction and assessment. The present study aims to contribute to the debate within educational literature regarding gender differences in educational achievement in writing. It seeks to extend previous studies by examining not only the differences apparent in statutory writing assessments measuring holistic quality (e.g. EYFSP) but also psycholinguistic measures of writing at instructional level (e.g. word and phrase/sentence level). Secondly, the study aims to establish whether gender differences are also apparent in spoken language and standardised tests of general language development spoken language and working memory. It is predicted that girls will outperform boys on all measures of assessment but the differences will be particularly significant on writing, expressive language and central executive functioning (attentional resources). Finally, the extent to which the factors that underpin literacy (e.g. age, general cognitive ability and language measures) are associated with
BOURKE & ADAMS DIFFERENCES IN LANGUAGE SKILLS AND WORKING MEMORY | 256
working memory in the context of gender differences in writing development are examined.
1. Method
1.1 Participants
Sixty-seven children (31 males and 36 females) (M age 57.30 months) participated in this study. They were recruited from four schools within the Liverpool Education Authority representing low to high SES in the north western United Kingdom. Due to the time-consuming nature of the multiple assessments used in the study and to minimise disruption to the children’s education, the participants were examined in phases during their Reception Year of education. The writing task was performed at the end of the Reception Year as this time point coincided with the completion of the assessment profiles for the Early Years Foundation Stage. This is the point at which it could be determined whether or not the children were meeting the prescribed Government standards.
1.2 Materials and Procedures: Phase 1
1.2.1 Cognitive assessments All cognitive assessments were administered to the children individually in a quiet place in the school in three sessions. The children were assessed on three phonological short-term memory measures: Children’s Test of Nonword Repetition (Gathercole & Baddeley, 1996), word span and digit span. Visuo-spatial short-term memory assessments included visual pattern span (Wilson, Scott & Power, 1987) and Corsi Block Tapping Test (Issacs & Vargha-Khadem, 1989). Since the measures within each domain were highly intercorrelated (p < .001), composite phonological and visuo-spatial memory scores were obtained by converting each of the scores to a z score and calculating the mean. Central executive functioning was assessed using a complex listening span task and verbal fluency. Further measures included the British Peabody Vocabulary Scale II (BPVS II) (Dunn, Dunn, Whetton & Burley, 1997); Reynell Developmental Language Scales (Edwards et al., 1997),and the Wechsler Preschool and Primary Scale of Intelligence --- Revised (WPPSI-R) (Wechsler, 1996) from which a Performance IQ was obtained for each child.
1.2.2 Phonological short-term memory tests Nonword Repetition: The Children’s Test of Nonword Repetition consists of unfamiliar phonological forms such as ‘prindle’ and ‘barrazon’, with 10 items at each length from two to five syllables, which the child is asked to repeat. The repetition attempt was scored correct if the child produced the same sequence of phonemes and incorrect if phonemic differences were detected. The maximum score for this test is 40.

257 | JOURNAL OF WRITING RESEARCH
Word Span Task: From a set of 12 phonologically dissimilar single syllable words (cake, pig, box, fork, bag, bed, sun, egg, mouse, coat, duck, dog), blocks of four lists at each list length (e.g. 2, 3, 4, 5, 6, 7 words) were prepared. Items were read out at a rate of one item per second with immediate recall at the end of the list. The test was discontinued when the child was unable to recall correctly three out of the four possible lists presented in a particular block. Therefore, memory span for words was scored as the maximum list length within a block of lists which the child correctly repeated three out of the four possible lists presented.
Digit Span Task: Stimuli were the digits from 1-9 (excluding the bisyllabic digit 7). List construction, presentation and scoring were the same as for the word span task.
1.2.3 Visuo-spatial short-term memory tests Corsi Block Tapping Test: The child’s task was to replicate the sequence in which the experimenter had pointed to a subset of nine cubes randomly spaced on a board. Four sequences at each length were prepared from an initial sequence length of two blocks. Corsi Block span was recorded as the maximum sequence length at which three sequences were correctly reproduced.
Visual Pattern Span: A series of matrices in which half of the cells were randomly filled were presented to each child. In the initial matrix, two boxes were filled resulting in a (2 x 2 matrix). The task was made more complex by adding one filled and one unfilled box to the matrix. Four sets of matrices at each level of complexity were available for presentation and the children were given a booklet of blank matrices, in which to record their responses. The children were shown each matrix for 3 seconds and only after the pattern was removed from view were they required to make their response. Only matrices in which the correct boxes and no others were marked were considered correct. Visual pattern span was calculated as the greatest degree of complexity (number of filled cells) at which three patterns were correctly recalled.
1.2.4 Central executive Complex Listening Span: In this task the experimenter read out a series of incomplete sentences taken from Towse, Hitch and Hutton (1998) and asked the child to supply the missing final word. At the end of each set of sentences the children were asked to recall in the correct serial order, the words that they had supplied. After receiving a set of practice items the children were presented with an initial set size of two sentences (recall two words). Four sets of sentences were prepared at each span length (number of words to recall) which enabled the same criteria to be applied for continuation and cessation of testing as for the verbal memory span tasks. Because the children found this task difficult, assessing span as the number of sentences in which the child correctly recalled the final words in two sets of sentences produced a limited range of scores. A further score was therefore computed to capture the variation in performance demonstrated by the children. This score was the absolute span score, which is
BOURKE & ADAMS DIFFERENCES IN LANGUAGE SKILLS AND WORKING MEMORY | 258
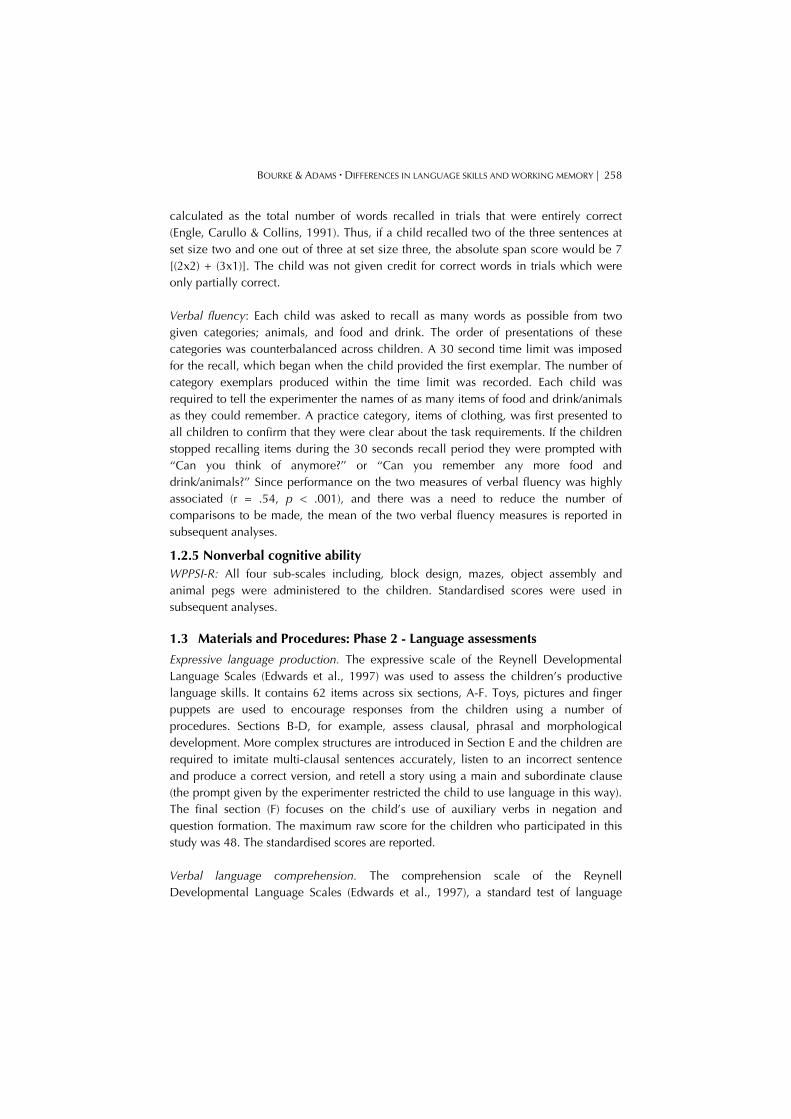
calculated as the total number of words recalled in trials that were entirely correct (Engle, Carullo & Collins, 1991). Thus, if a child recalled two of the three sentences at set size two and one out of three at set size three, the absolute span score would be 7 [(2x2) + (3x1)]. The child was not given credit for correct words in trials which were only partially correct.
Verbal fluency: Each child was asked to recall as many words as possible from two given categories; animals, and food and drink. The order of presentations of these categories was counterbalanced across children. A 30 second time limit was imposed for the recall, which began when the child provided the first exemplar. The number of category exemplars produced within the time limit was recorded. Each child was required to tell the experimenter the names of as many items of food and drink/animals as they could remember. A practice category, items of clothing, was first presented to all children to confirm that they were clear about the task requirements. If the children stopped recalling items during the 30 seconds recall period they were prompted with ‘‘Can you think of anymore?’’ or ‘‘Can you remember any more food and drink/animals?’’ Since performance on the two measures of verbal fluency was highly associated (r = .54, p < .001), and there was a need to reduce the number of comparisons to be made, the mean of the two verbal fluency measures is reported in subsequent analyses.
1.2.5 Nonverbal cognitive ability WPPSI-R: All four sub-scales including, block design, mazes, object assembly and animal pegs were administered to the children. Standardised scores were used in subsequent analyses.
1.3 Materials and Procedures: Phase 2 - Language assessments
Expressive language production. The expressive scale of the Reynell Developmental Language Scales (Edwards et al., 1997) was used to assess the children’s productive language skills. It contains 62 items across six sections, A-F. Toys, pictures and finger puppets are used to encourage responses from the children using a number of procedures. Sections B-D, for example, assess clausal, phrasal and morphological development. More complex structures are introduced in Section E and the children are required to imitate multi-clausal sentences accurately, listen to an incorrect sentence and produce a correct version, and retell a story using a main and subordinate clause (the prompt given by the experimenter restricted the child to use language in this way). The final section (F) focuses on the child’s use of auxiliary verbs in negation and question formation. The maximum raw score for the children who participated in this study was 48. The standardised scores are reported.
Verbal language comprehension. The comprehension scale of the Reynell Developmental Language Scales (Edwards et al., 1997), a standard test of language
259 | JOURNAL OF WRITING RESEARCH
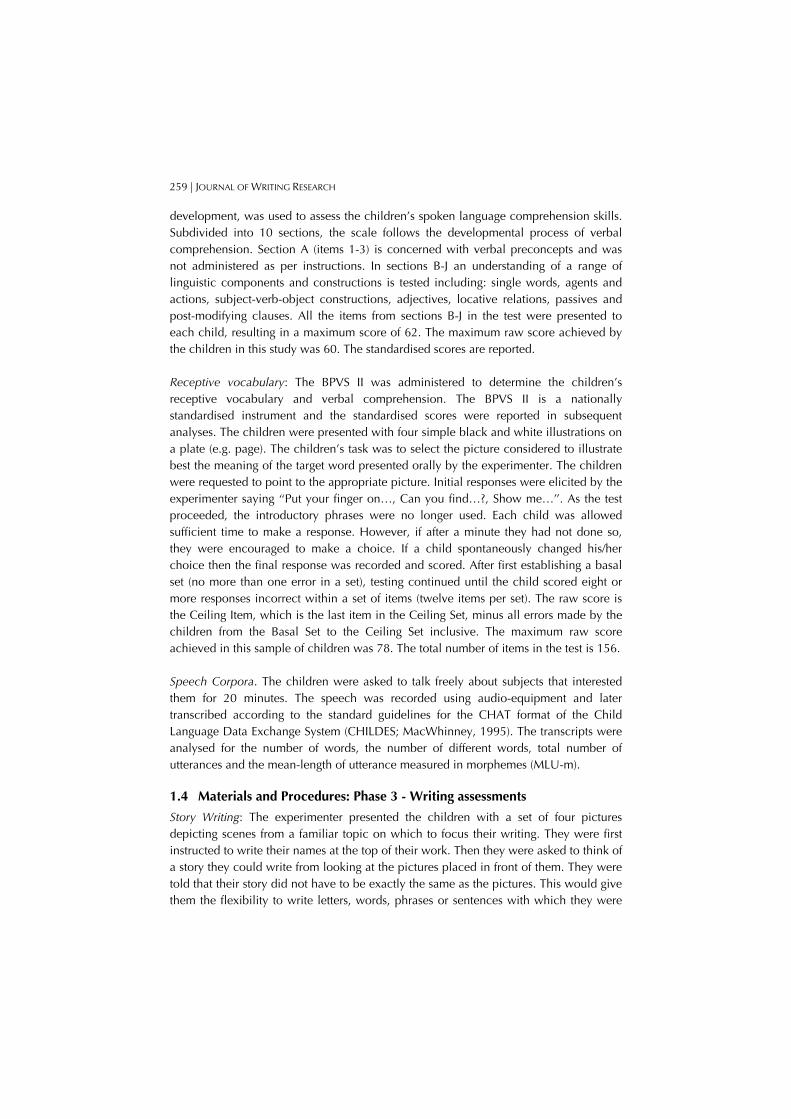
development, was used to assess the children’s spoken language comprehension skills. Subdivided into 10 sections, the scale follows the developmental process of verbal comprehension. Section A (items 1-3) is concerned with verbal preconcepts and was not administered as per instructions. In sections B-J an understanding of a range of linguistic components and constructions is tested including: single words, agents and actions, subject-verb-object constructions, adjectives, locative relations, passives and post-modifying clauses. All the items from sections B-J in the test were presented to each child, resulting in a maximum score of 62. The maximum raw score achieved by the children in this study was 60. The standardised scores are reported.
Receptive vocabulary: The BPVS II was administered to determine the children’s receptive vocabulary and verbal comprehension. The BPVS II is a nationally standardised instrument and the standardised scores were reported in subsequent analyses. The children were presented with four simple black and white illustrations on a plate (e.g. page). The children’s task was to select the picture considered to illustrate best the meaning of the target word presented orally by the experimenter. The children were requested to point to the appropriate picture. Initial responses were elicited by the experimenter saying ‘‘Put your finger on…, Can you find…?, Show me…’’. As the test proceeded, the introductory phrases were no longer used. Each child was allowed sufficient time to make a response. However, if after a minute they had not done so, they were encouraged to make a choice. If a child spontaneously changed his/her choice then the final response was recorded and scored. After first establishing a basal set (no more than one error in a set), testing continued until the child scored eight or more responses incorrect within a set of items (twelve items per set). The raw score is the Ceiling Item, which is the last item in the Ceiling Set, minus all errors made by the children from the Basal Set to the Ceiling Set inclusive. The maximum raw score achieved in this sample of children was 78. The total number of items in the test is 156.
Speech Corpora. The children were asked to talk freely about subjects that interested them for 20 minutes. The speech was recorded using audio-equipment and later transcribed according to the standard guidelines for the CHAT format of the Child Language Data Exchange System (CHILDES; MacWhinney, 1995). The transcripts were analysed for the number of words, the number of different words, total number of utterances and the mean-length of utterance measured in morphemes (MLU-m).
1.4 Materials and Procedures: Phase 3 - Writing assessments
Story Writing: The experimenter presented the children with a set of four pictures depicting scenes from a familiar topic on which to focus their writing. They were first instructed to write their names at the top of their work. Then they were asked to think of a story they could write from looking at the pictures placed in front of them. They were told that their story did not have to be exactly the same as the pictures. This would give them the flexibility to write letters, words, phrases or sentences with which they were
BOURKE & ADAMS DIFFERENCES IN LANGUAGE SKILLS AND WORKING MEMORY | 260
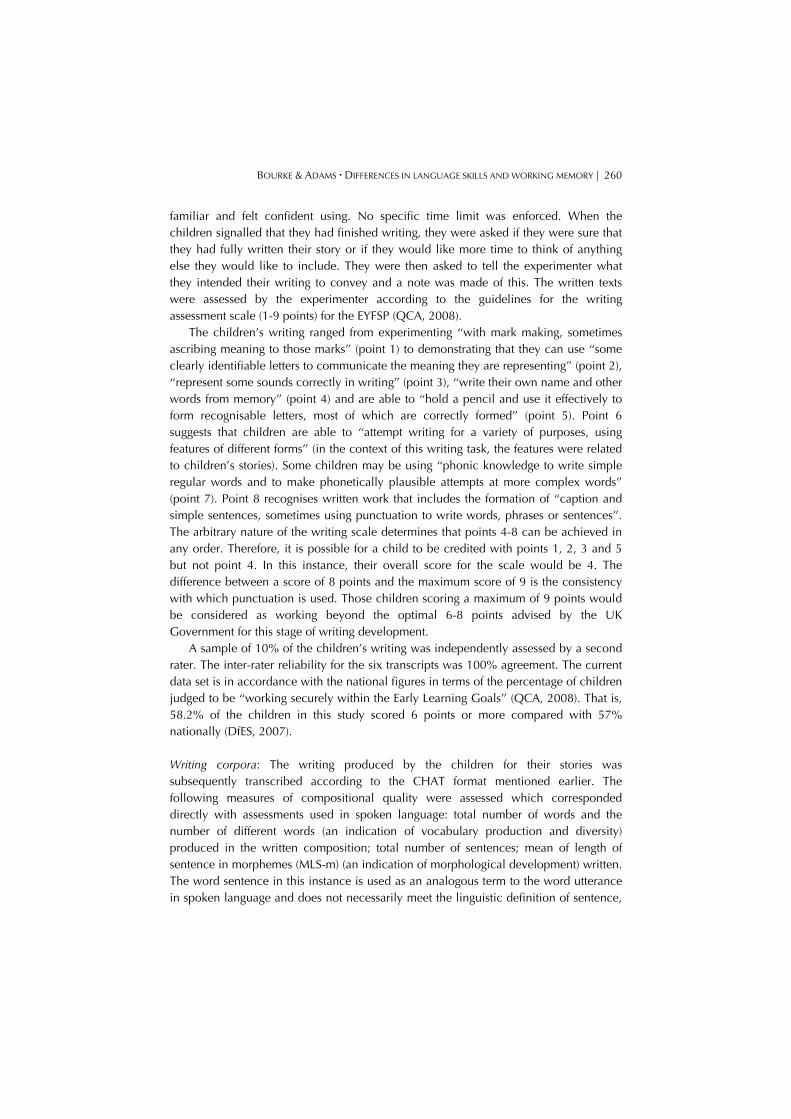
familiar and felt confident using. No specific time limit was enforced. When the children signalled that they had finished writing, they were asked if they were sure that they had fully written their story or if they would like more time to think of anything else they would like to include. They were then asked to tell the experimenter what they intended their writing to convey and a note was made of this. The written texts were assessed by the experimenter according to the guidelines for the writing assessment scale (1-9 points) for the EYFSP (QCA, 2008).
The children’s writing ranged from experimenting ‘‘with mark making, sometimes ascribing meaning to those marks’’ (point 1) to demonstrating that they can use ‘‘some clearly identifiable letters to communicate the meaning they are representing’’ (point 2), ‘‘represent some sounds correctly in writing’’ (point 3), ‘‘write their own name and other words from memory’’ (point 4) and are able to ‘‘hold a pencil and use it effectively to form recognisable letters, most of which are correctly formed’’ (point 5). Point 6 suggests that children are able to ‘‘attempt writing for a variety of purposes, using features of different forms’’ (in the context of this writing task, the features were related to children’s stories). Some children may be using ‘‘phonic knowledge to write simple regular words and to make phonetically plausible attempts at more complex words’’ (point 7). Point 8 recognises written work that includes the formation of ‘‘caption and simple sentences, sometimes using punctuation to write words, phrases or sentences’’. The arbitrary nature of the writing scale determines that points 4-8 can be achieved in any order. Therefore, it is possible for a child to be credited with points 1, 2, 3 and 5 but not point 4. In this instance, their overall score for the scale would be 4. The difference between a score of 8 points and the maximum score of 9 is the consistency with which punctuation is used. Those children scoring a maximum of 9 points would be considered as working beyond the optimal 6-8 points advised by the UK Government for this stage of writing development.
A sample of 10% of the children’s writing was independently assessed by a second rater. The inter-rater reliability for the six transcripts was 100% agreement. The current data set is in accordance with the national figures in terms of the percentage of children judged to be ‘‘working securely within the Early Learning Goals’’ (QCA, 2008). That is, 58.2% of the children in this study scored 6 points or more compared with 57% nationally (DfES, 2007).
Writing corpora: The writing produced by the children for their stories was subsequently transcribed according to the CHAT format mentioned earlier. The following measures of compositional quality were assessed which corresponded directly with assessments used in spoken language: total number of words and the number of different words (an indication of vocabulary production and diversity) produced in the written composition; total number of sentences; mean of length of sentence in morphemes (MLS-m) (an indication of morphological development) written. The word sentence in this instance is used as an analogous term to the word utterance in spoken language and does not necessarily meet the linguistic definition of sentence,
261 | JOURNAL OF WRITING RESEARCH
since children of this age use punctuation very infrequently to determine the beginning and end of sentences. Thus, sentence boundaries were determined using the following criteria: the starting of a new line to write the next part of the ‘‘story’’, use of when and and then as a connective to continue the story, and adding a new idea to the story. Similar criteria have been adopted in the transcription of spoken language corpora to ascertain agreement on utterance boundaries (CHILDES, MacWhinney, 1995). More formal punctuation (e.g. capital letters, full-stops, exclamation marks, question marks), although relatively rare in practice at this age, was also considered.
2. Results
First, partial correlations were conducted to determine the interrelationships within and between individual predictor variables (age, language and working memory) and the criterion measures (writing performance) controlling for nonverbal cognitive ability. Next multivariate analyses were computed to identify the specific effects of gender on all the variables assessed in the study. Finally, gender was entered into hierarchical regressions to identify the degree of independent variance that could be accounted for in each criterion writing measure (e.g. word and phrase/sentence level assessment and EYFSP writing scale) once the variance predicted by language and working memory had been considered.
2.1 Correlations between Age, Writing, Receptive and Expressive Language and Working Memory
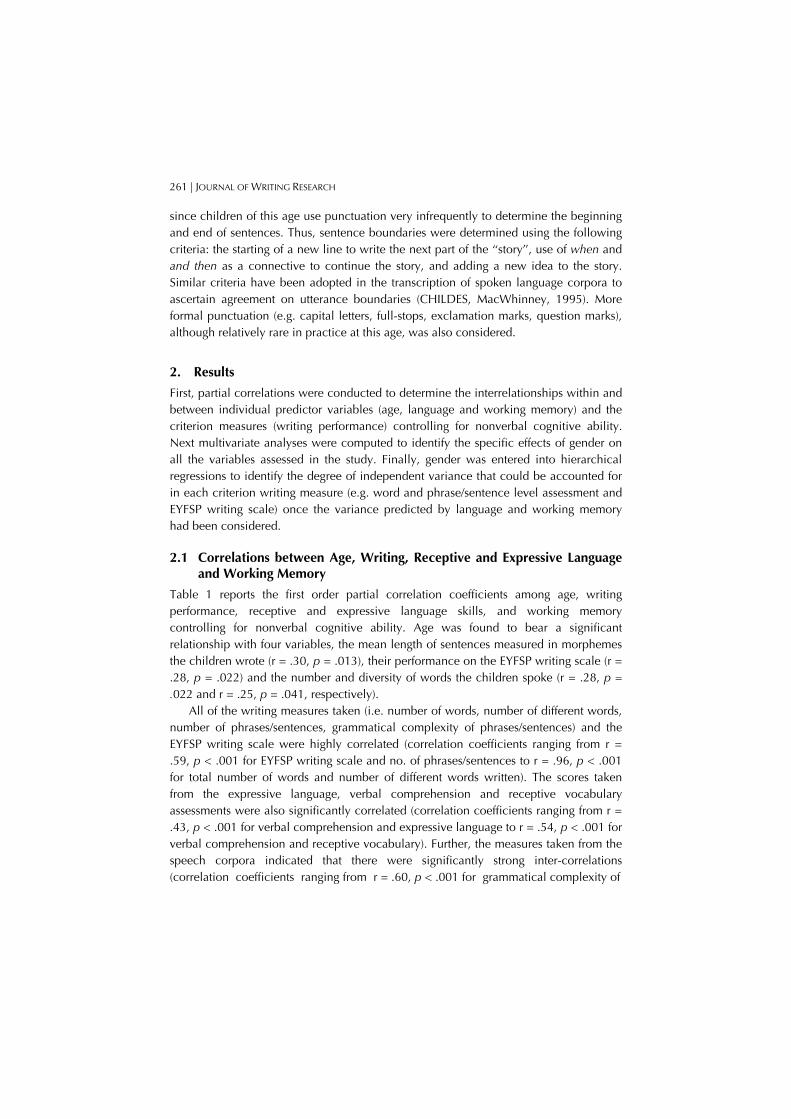
Table 1 reports the first order partial correlation coefficients among age, writing performance, receptive and expressive language skills, and working memory controlling for nonverbal cognitive ability. Age was found to bear a significant relationship with four variables, the mean length of sentences measured in morphemes the children wrote (r = .30, p = .013), their performance on the EYFSP writing scale (r = .28, p = .022) and the number and diversity of words the children spoke (r = .28, p = .022 and r = .25, p = .041, respectively).
All of the writing measures taken (i.e. number of words, number of different words, number of phrases/sentences, grammatical complexity of phrases/sentences) and the EYFSP writing scale were highly correlated (correlation coefficients ranging from r = .59, p < .001 for EYFSP writing scale and no. of phrases/sentences to r = .96, p < .001 for total number of words and number of different words written). The scores taken from the expressive language, verbal comprehension and receptive vocabulary assessments were also significantly correlated (correlation coefficients ranging from r = .43, p < .001 for verbal comprehension and expressive language to r = .54, p < .001 for verbal comprehension and receptive vocabulary). Further, the measures taken from the speech corpora indicated that there were significantly strong inter-correlations (correlation coefficients ranging from r = .60, p < .001 for grammatical complexity of
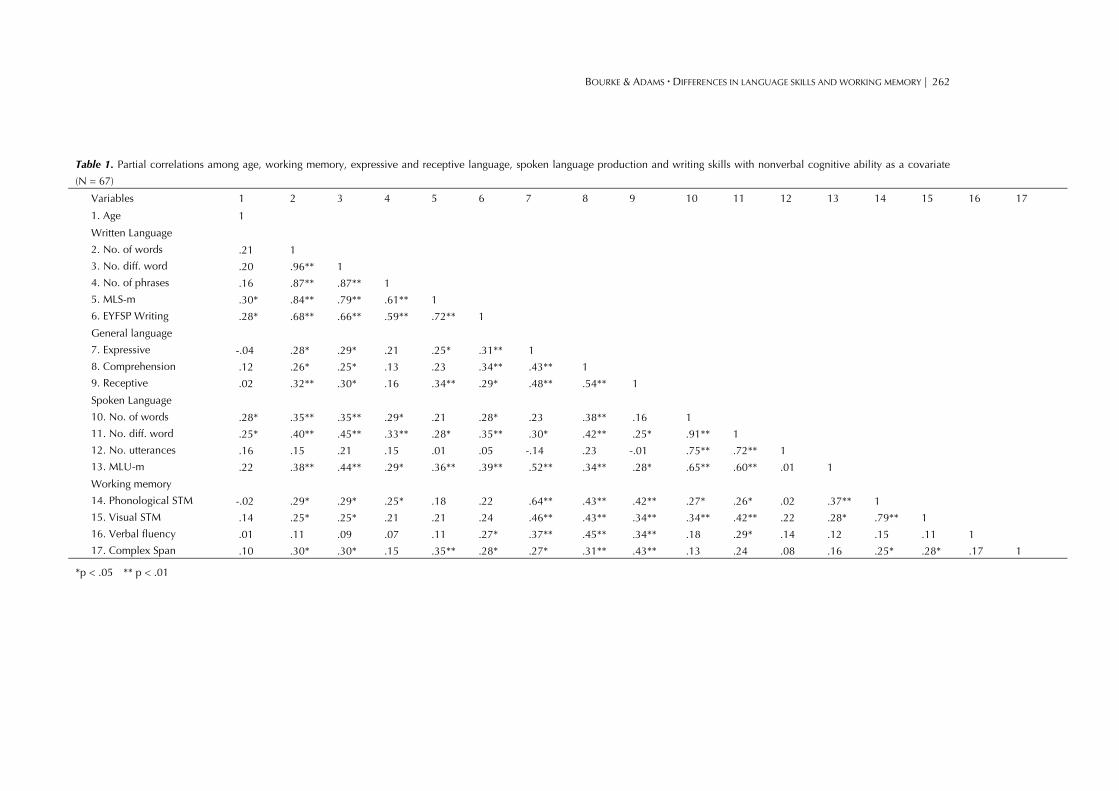
BOURKE & ADAMS DIFFERENCES IN LANGUAGE SKILLS AND WORKING MEMORY | 262
Table 1. Partial correlations among age, working memory, expressive and receptive language, spoken language production and writing skills with nonverbal cognitive ability as a covariate
(N = 67)
Variables 1 2 3 4 5 6 7 8 9 10 11 12 13 14 15 16 17
1. Age 1
Written Language
2. No. of words
3. No. diff. word
4. No. of phrases
5. MLS-m
6. EYFSP Writing
.21 1
.20 .96** 1
.16 .87** .87** 1
.30* .84** .79** .61** 1
.28* .68** .66** .59** .72** 1
General language
7. Expressive
8. Comprehension
9. Receptive
-.04 .28* .29* .21 .25* .31** 1
.12 .26* .25* .13 .23 .34** .43** 1
.02 .32** .30* .16 .34** .29* .48** .54** 1
Spoken Language
10. No. of words
11. No. diff. word
12. No. utterances
13. MLU-m
.28* .35** .35** .29* .21 .28* .23 .38** .16 1
.25* .40** .45** .33** .28* .35** .30* .42** .25* .91** 1
.16 .15 .21 .15 .01 .05 -.14 .23 -.01 .75** .72** 1
.22 .38** .44** .29* .36** .39** .52** .34** .28* .65** .60** .01 1
Working memory
14. Phonological STM
15. Visual STM
16. Verbal fluency
17. Complex Span
-.02 .29* .29* .25* .18 .22 .64** .43** .42** .27* .26* .02 .37** 1
.14 .25* .25* .21 .21 .24 .46** .43** .34** .34** .42** .22 .28* .79** 1
.01 .11 .09 .07 .11 .27* .37** .45** .34** .18 .29* .14 .12 .15 .11 1
.10 .30* .30* .15 .35** .28* .27* .31** .43** .13 .24 .08 .16 .25* .28* .17 1
*p < .05 ** p < .01
263 | JOURNAL OF WRITING RESEARCH
utterances and the diversity of vocabulary to r = .91, p < .001 for the total number of words spoken and the number of different words spoken) on all measures with the exception of the association between the number of utterances the children spoke and the grammatical complexity of those utterances (r = .01, p = .925). That is, it does not necessarily mean that if children are saying more,this will correspond to the syntactic quality of those utterances.
The composite z scores had been previously computed for the phonological and visuo-spatial short-term memory tasks as the measures within those domains were found to be significantly inter-correlated (e.g. nonword repetition and word span r = .59, p < .001, nonword repetition and digit span r = .37, p = .002, word span and digit span r = .54, p < .001, visuo-spatial pattern span and corsi blocks r =.39, p = .001). In terms of processing in working memory, surprisingly, there were no significant correlations between the measures of central executive functioning (e.g. verbal fluency and complex span r = .17, p = .166).
Measures of general language ability (i.e. expressive language, verbal comprehension and receptive vocabulary) were all significantly correlated with the number and diversity of words, the mean length of phrases/sentences measured in morphemes (except for verbal comprehension r = .23, p = .062) and the EYFSP writing scale scores. Most of the measures of spoken language taken from the speech corpora were significantly correlated with the writing assessments (correlation coefficients ranging from r = .28, p = .022 for number of words spoken and EYFSP writing scale to r = .45, p < .001 for the diversity of vocabulary the children spoke and wrote). The total number of utterances the children spoke was not significantly associated with any other of the writing measures. However, this was also the case for the total number of words the children spoke and the mean length of their phrases/sentences measured in morphemes (r = .21, p = .089). The dissociation of the number of utterances spoken both from the other measures of oral language production and indices of writing output implies that this measure is unreliable. Therefore, it was removed from further analyses.
Differential relationships between aspects of working memory and writing skill were found. Phonological short-term memory was highly correlated with the number and diversity of words the children wrote (r = .29, p = .016 and r = .29, p = .017, respectively) and significantly related to the number of phrases/sentences (r = .26, p = .036). Visuo-spatial short-term memory was significantly related to the number of words (r = .25, p = .040) and the diversity of vocabulary (r = .25, p = .041) the children wrote. This is partially indicative of the notion that the writing of words is both visually and phonologically mediated at this stage of literacy development. Verbal fluency (as a measure of the efficacy with which information can be searched and retrieved from LTM) was only associated with performance on the EYFSP writing scale (r = .27, p = .029). As it was not significantly associated with complex span (listening span) and other aspects of working memory, it was removed from further analyses. Complex span (measuring the capacity to both store and process phonological information) was
BOURKE & ADAMS DIFFERENCES IN LANGUAGE SKILLS AND WORKING MEMORY | 264
significantly related to all measures of writing with the exception of the total number of phrases/sentences the children wrote (r = .15, p = .230).
2.2 Analyses of Variance of Gender Differences in Writing, Language and Working Memory
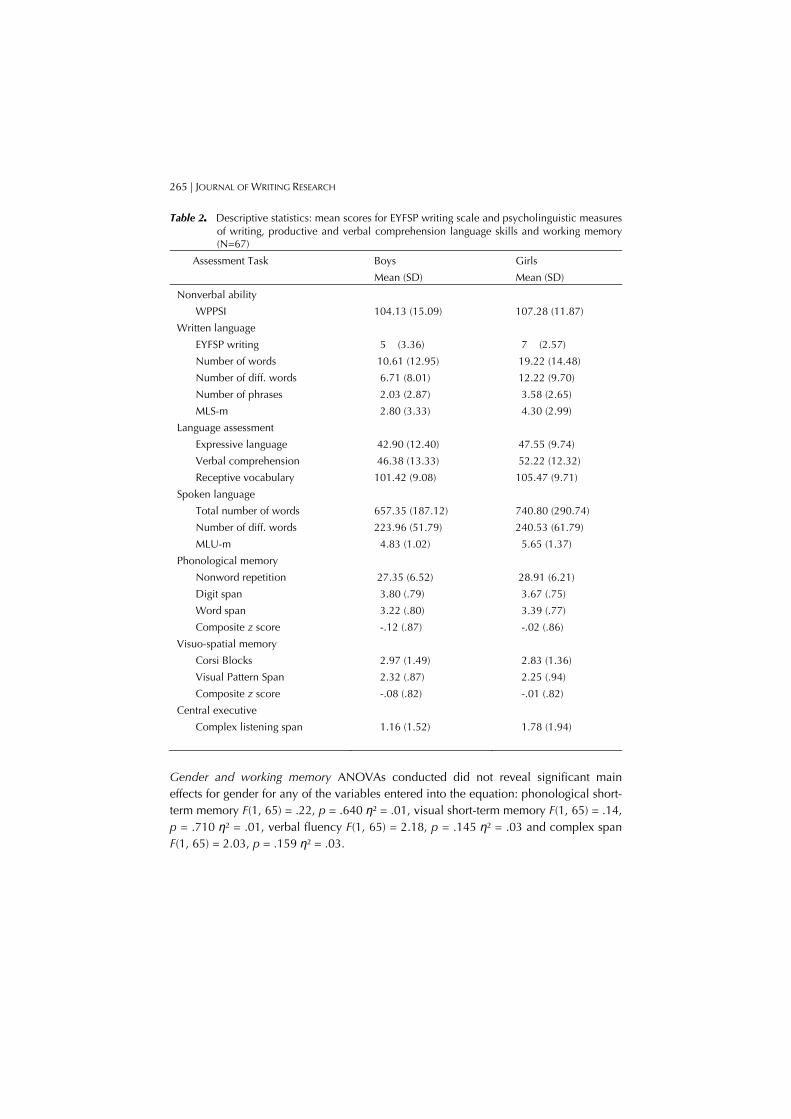
Since it was established that there were significant associations between language and working memory predictor and writing criterion variables, the sample was divided by gender in order to determine the differences between boys and girls on their achievement scores in those areas. Descriptive statistics for each of the measures assessed are shown in Table 2. Levels of performance in memory are comparable to previous studies (Adams & Gathercole, 2000; Siegel, 1994) and in line with standardised scores for language abilities. Table 2 indicates that boys are more likely to be performing at a lower level than is expected in writing in comparison to the girls at the end of the Early Years Foundation Stage of Education. However, it is evident that there is more variability in the scores that are obtained from the boys (e.g. EYFSP writing scale boys M =5, SD= 3.36 range 1-8 points and girls M = 7, SD = 2.57 range 3-9 points). Gender and writing One way ANOVAs were conducted in order to compare the performance of boys and girls in five measures of writing skill: EYFSP writing scale F(1,65) =11.25, p = .001 η²=.15, number of words F(1, 65) = 6.49, p = .013 η² = .09, number of different words F(1, 65) = 6.30, p = .015 η² = .09, total number of sentences F(1,65) = 5.28, p = .025 η² = .07 and mean length of phrases/sentence measured in morphemes F(1,65) = 3.78, p = .056 η² = .05. The findings reveal that girls achieve significantly higher results at this stage on all the measures of writing except grammatical complexity. The effect size index, η², suggests that there was a large effect size for the EYFSP writing scale and moderately large effect sizes for the number of words the children wrote and the diversity of their vocabulary. Nearly 15%, 9% and a further 9% respectively, of the variation in the associated scores for boys and girls on those measures can be accounted for by gender. Gender and language In order to test the assumption that general language (BPVS and Reynell Developmental Language Scales: Verbal Comprehension and Expressive Language), in particular, spoken language ability (word and phrase/sentence level measures derived from the speech corpora), could explain the differences between boys and girls writing performance, further ANOVAs were conducted. There was one significant main effect for gender in the grammatical complexity of the children’s utterances (MLU-m), F(1,65) = 7.49, p = .008 η² = .10. Girls spoke using more grammatically sophisticated sentences.
265 | JOURNAL OF WRITING RESEARCH
Table 2. Descriptive statistics: mean scores for EYFSP writing scale and psycholinguistic measures of writing, productive and verbal comprehension language skills and working memory (N=67)
Assessment Task
Boys
Mean (SD)
Girls
Mean (SD)
Nonverbal ability
WPPSI
104.13 (15.09)
107.28 (11.87)
Written language
EYFSP writing
Number of words
Number of diff. words
Number of phrases
MLS-m
5 (3.36)
10.61 (12.95)
6.71 (8.01)
2.03 (2.87)
2.80 (3.33)
7 (2.57)
19.22 (14.48)
12.22 (9.70)
3.58 (2.65)
4.30 (2.99)
Language assessment
Expressive language
Verbal comprehension
Receptive vocabulary
42.90 (12.40)
46.38 (13.33)
101.42 (9.08)
47.55 (9.74)
52.22 (12.32)
105.47 (9.71)
Spoken language
Total number of words
Number of diff. words
MLU-m
657.35 (187.12)
223.96 (51.79)
4.83 (1.02)
740.80 (290.74)
240.53 (61.79)
5.65 (1.37)
Phonological memory
Nonword repetition
Digit span
Word span
Composite z score
27.35 (6.52)
3.80 (.79)
3.22 (.80)
-.12 (.87)
28.91 (6.21)
3.67 (.75)
3.39 (.77)
-.02 (.86)
Visuo-spatial memory
Corsi Blocks
Visual Pattern Span
Composite z score
2.97 (1.49)
2.32 (.87)
-.08 (.82)
2.83 (1.36)
2.25 (.94)
-.01 (.82)
Central executive
Complex listening span
1.16 (1.52)
1.78 (1.94)
Gender and working memory ANOVAs conducted did not reveal significant main effects for gender for any of the variables entered into the equation: phonological short-term memory F(1, 65) = .22, p = .640 η² = .01, visual short-term memory F(1, 65) = .14, p = .710 η² = .01, verbal fluency F(1, 65) = 2.18, p = .145 η² = .03 and complex span F(1, 65) = 2.03, p = .159 η² = .03.
BOURKE & ADAMS DIFFERENCES IN LANGUAGE SKILLS AND WORKING MEMORY | 266
2.3 Regression Analysis for Writing Performance and Gender
Hierarchical regression analyses were conducted in order to examine the associations presented in Table 1 in more detail, and primarily to consider whether gender bore a unique association with writing performance once age, language and cognitive factors had been taken into account. In this technique, variables that are proposed to predict variance in a criterion variable are added to the model in a theoretically constrained order. At each stage in this process, the additional variance that they are able to explain when added to the regression analysis can be ascertained. In this way it is possible to identify variables that are able to make significant and independent contributions to the variance in the criterion variable.
Writing as the criterion variable To limit the number of variables in the analyses, composite measures of the writing, language and memory constructs were derived based on the relationships identified in the first order correlations after controlling for the contribution made by nonverbal cognitive ability on the variance in the predictor variables. The composite score for the first writing criterion variable included the mean z scores for the number of words, the diversity of vocabulary, the number of sentences and the mean-length of sentences measured in morphemes that the children included in their writing. The second writing criterion variable was the EYFSP writing scale. Although all other writing measures were highly inter-correlated with performance on the EYFSP writing scale, this was analysed separately as it is a more comprehensive measure of early writing development within the school context.
The predictor variables included two composite measures based on mean z scores for the standardised assessments of general language ability and the psycholinguistic measures obtained from the speech corpora. However, the total number of utterances the children spoke was not included as it was neither related to the mean length of utterances measured in morphemes, nor the writing measures. In the same way that the composite score measure of phonological memory was computed, a composite measure of visuo-spatial memory was created comprising the mean z scores for Corsi Blocks and Visual Pattern Span. Since the measures of central executive functions (e.g. verbal fluency and complex span) were not related to each other, it was not considered viable to incorporate these scores into a composite measure. The composite mean z scores for phonological and visuo-spatial short-term memory were further combined with the mean z score for the complex span task to form an overall score composite score for working memory.
In the following analyses, age was entered first to establish the degree of association between writing skill, language development, and memory that was independent of this factor. The composite measure comprising expressive language, verbal comprehension and receptive vocabulary was entered next in order to discount the variation in performance that could be attributed to this more general language variable. Spoken language measures were entered next to allow the contribution of directly comparable spoken language measures previously shown to be associated with writing to be
267 | JOURNAL OF WRITING RESEARCH
evaluated independently of general language ability. Working memory was entered in model 4 as this aspect of cognitive functioning has been consistently shown to underpin early language and literacy acquisition. Finally, gender was entered in model 5 to establish the degree to which this variable could predict an independent proportion of the variance in performance in writing at this stage of development once the contribution to the variance from the language and cognitive factors were taken into consideration. Alternative orderings were adopted to establish the degree of shared variance between significant predictors.
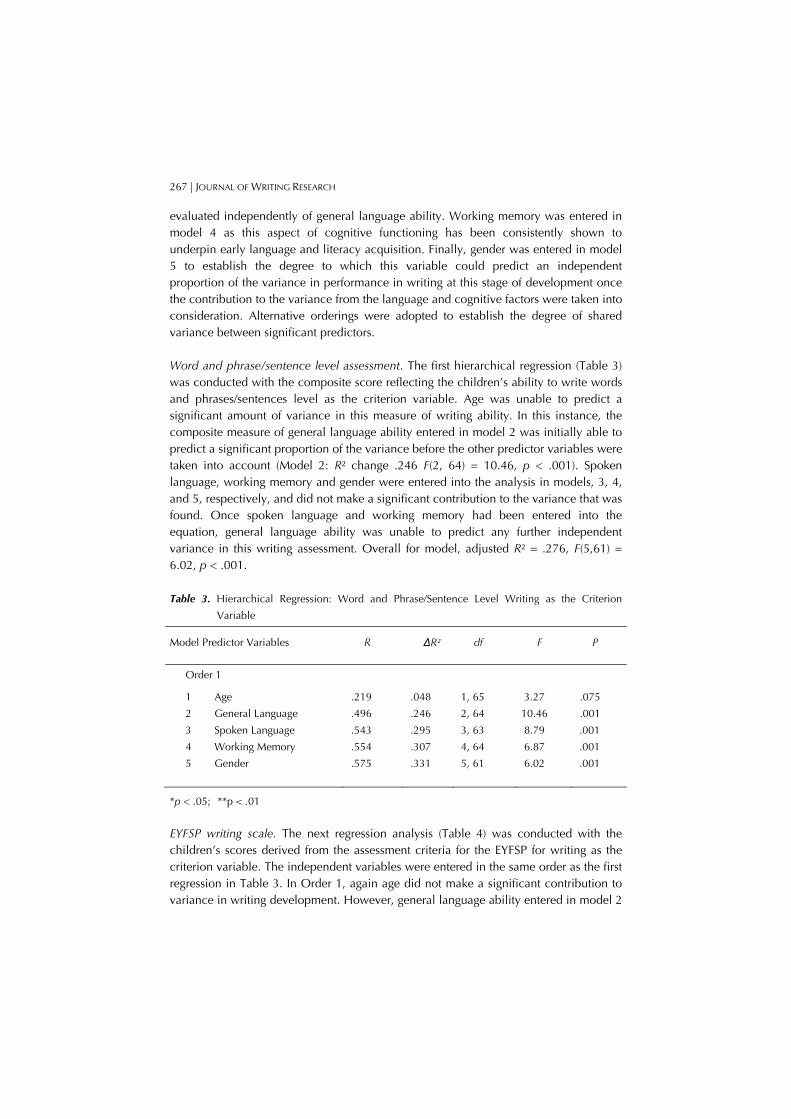
Word and phrase/sentence level assessment. The first hierarchical regression (Table 3) was conducted with the composite score reflecting the children’s ability to write words and phrases/sentences level as the criterion variable. Age was unable to predict a significant amount of variance in this measure of writing ability. In this instance, the composite measure of general language ability entered in model 2 was initially able to predict a significant proportion of the variance before the other predictor variables were taken into account (Model 2: R² change .246 F(2, 64) = 10.46, p < .001). Spoken language, working memory and gender were entered into the analysis in models, 3, 4, and 5, respectively, and did not make a significant contribution to the variance that was found. Once spoken language and working memory had been entered into the equation, general language ability was unable to predict any further independent variance in this writing assessment. Overall for model, adjusted R² = .276, F(5,61) = 6.02, p < .001. Table 3. Hierarchical Regression: Word and Phrase/Sentence Level Writing as the Criterion
Variable
Model Predictor Variables R ∆R² df F P
Order 1
1 Age
2 General Language
3 Spoken Language
4 Working Memory
5 Gender
.219
.496
.543
.554
.575
.048
.246
.295
.307
.331
1, 65
2, 64
3, 63
4, 64
5, 61
3.27
10.46
8.79
6.87
6.02
.075
.001
.001
.001
.001
*p < .05; **p < .01
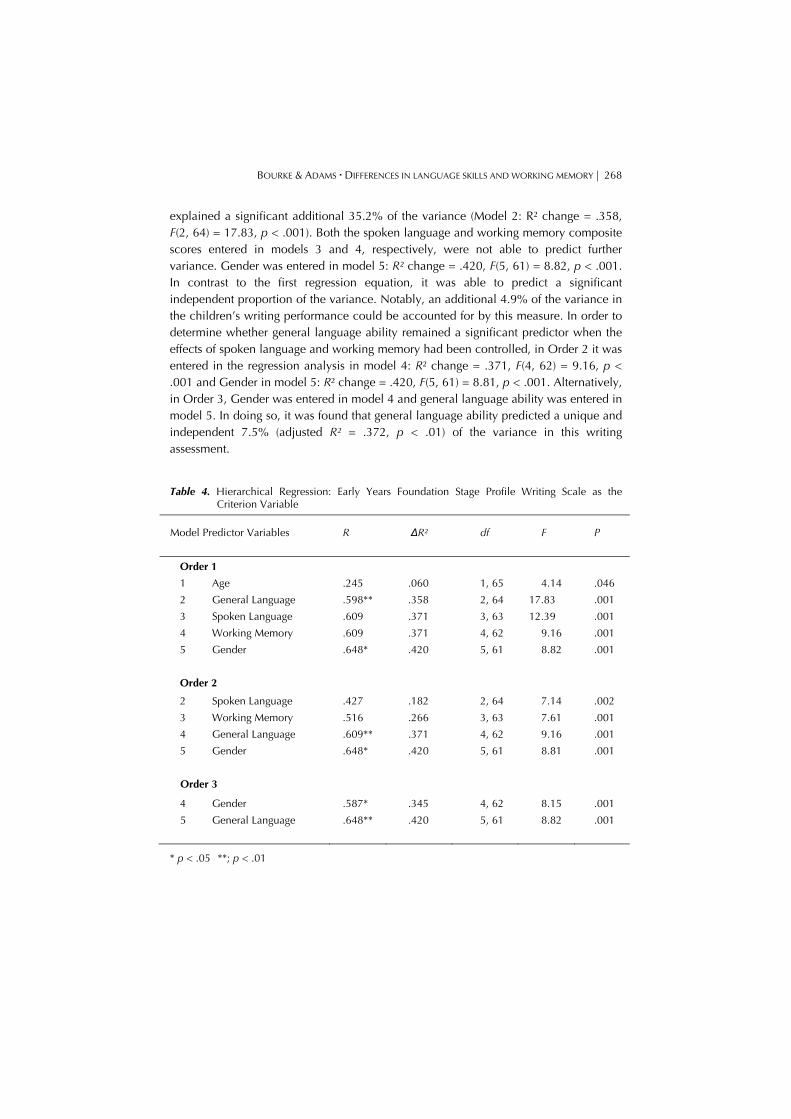
EYFSP writing scale. The next regression analysis (Table 4) was conducted with the children’s scores derived from the assessment criteria for the EYFSP for writing as the criterion variable. The independent variables were entered in the same order as the first regression in Table 3. In Order 1, again age did not make a significant contribution to variance in writing development. However, general language ability entered in model 2
BOURKE & ADAMS DIFFERENCES IN LANGUAGE SKILLS AND WORKING MEMORY | 268
explained a significant additional 35.2% of the variance (Model 2: R² change = .358, F(2, 64) = 17.83, p < .001). Both the spoken language and working memory composite scores entered in models 3 and 4, respectively, were not able to predict further variance. Gender was entered in model 5: R² change = .420, F(5, 61) = 8.82, p < .001. In contrast to the first regression equation, it was able to predict a significant independent proportion of the variance. Notably, an additional 4.9% of the variance in the children’s writing performance could be accounted for by this measure. In order to determine whether general language ability remained a significant predictor when the effects of spoken language and working memory had been controlled, in Order 2 it was entered in the regression analysis in model 4: R² change = .371, F(4, 62) = 9.16, p < .001 and Gender in model 5: R² change = .420, F(5, 61) = 8.81, p < .001. Alternatively, in Order 3, Gender was entered in model 4 and general language ability was entered in model 5. In doing so, it was found that general language ability predicted a unique and independent 7.5% (adjusted R² = .372, p < .01) of the variance in this writing assessment. Table 4. Hierarchical Regression: Early Years Foundation Stage Profile Writing Scale as the
Criterion Variable
Model Predictor Variables
R
∆R²
df
F
P
Order 1
1 Age
2 General Language
3 Spoken Language
4 Working Memory
5 Gender
.245
.598**
.609
.609
.648*
.060
.358
.371
.371
.420
1, 65
2, 64
3, 63
4, 62
5, 61
4.14
17.83
12.39
9.16
8.82
.046
.001
.001
.001
.001
Order 2
2 Spoken Language
3 Working Memory
4 General Language
5 Gender
.427
.516
.609**
.648*
.182
.266
.371
.420
2, 64
3, 63
4, 62
5, 61
7.14
7.61
9.16
8.81
.002
.001
.001
.001
Order 3
4 Gender
5 General Language
.587*
.648**
.345
.420
4, 62
5, 61
8.15
8.82
.001
.001
* p < .05 **; p < .01
269 | JOURNAL OF WRITING RESEARCH
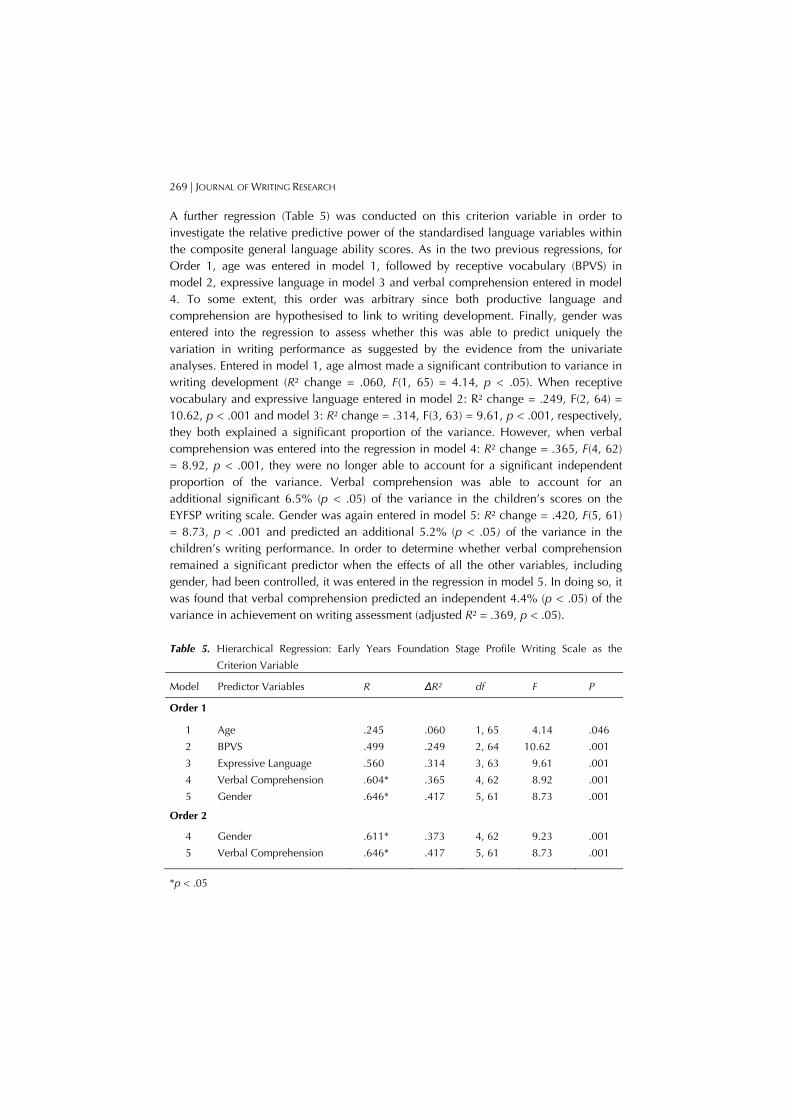
A further regression (Table 5) was conducted on this criterion variable in order to investigate the relative predictive power of the standardised language variables within the composite general language ability scores. As in the two previous regressions, for Order 1, age was entered in model 1, followed by receptive vocabulary (BPVS) in model 2, expressive language in model 3 and verbal comprehension entered in model 4. To some extent, this order was arbitrary since both productive language and comprehension are hypothesised to link to writing development. Finally, gender was entered into the regression to assess whether this was able to predict uniquely the variation in writing performance as suggested by the evidence from the univariate analyses. Entered in model 1, age almost made a significant contribution to variance in writing development (R² change = .060, F(1, 65) = 4.14, p < .05). When receptive vocabulary and expressive language entered in model 2: R² change = .249, F(2, 64) = 10.62, p < .001 and model 3: R² change = .314, F(3, 63) = 9.61, p < .001, respectively, they both explained a significant proportion of the variance. However, when verbal comprehension was entered into the regression in model 4: R² change = .365, F(4, 62) = 8.92, p < .001, they were no longer able to account for a significant independent proportion of the variance. Verbal comprehension was able to account for an additional significant 6.5% (p < .05) of the variance in the children’s scores on the EYFSP writing scale. Gender was again entered in model 5: R² change = .420, F(5, 61) = 8.73, p < .001 and predicted an additional 5.2% (p < .05) of the variance in the children’s writing performance. In order to determine whether verbal comprehension remained a significant predictor when the effects of all the other variables, including gender, had been controlled, it was entered in the regression in model 5. In doing so, it was found that verbal comprehension predicted an independent 4.4% (p < .05) of the variance in achievement on writing assessment (adjusted R² = .369, p < .05).
Table 5. Hierarchical Regression: Early Years Foundation Stage Profile Writing Scale as the
Criterion Variable
Model Predictor Variables R ∆R² df F P
Order 1
1 Age
2 BPVS
3 Expressive Language
4 Verbal Comprehension
5 Gender
.245
.499
.560
.604*
.646*
.060
.249
.314
.365
.417
1, 65
2, 64
3, 63
4, 62
5, 61
4.14
10.62
9.61
8.92
8.73
.046
.001
.001
.001
.001
Order 2
4 Gender
5 Verbal Comprehension
.611*
.646*
.373
.417
4, 62
5, 61
9.23
8.73
.001
.001
*p < .05
BOURKE & ADAMS DIFFERENCES IN LANGUAGE SKILLS AND WORKING MEMORY | 270
3. Discussion
The aim of the present study was to investigate systematically the relative impact of a number of cognitive factors known to account for individual differences in writing development on differences between boys and girls in their writing performance at the earliest stage of educational assessment. As predicted, the gender differences that are evident in the national data (DCSF, 2010) were found in this sample of young emergent writers’ attainment levels when applying criteria from the writing scale used within the Early Years Foundation Stage Profile.
On average, boys aged 4-5 years wrote well practised and memorised words, such as their own name and those of other members of their family, and captions, but were less able than girls to incorporate phonologically plausible attempts to spell novel words and phrases/sentences. Girls, on average, included more words and a wider range of vocabulary in their writing. They were also more likely to write more phrases/sentences. It appears that whilst girls demonstrated the extended mastery of written expression in clearly identifiable and quantifiable ways, boys were still becoming familiar with the foundations of transcription, which includes producing recognisable letters, sounds that might represent a word (e.g. drawing a picture of a gorilla and then placing ‘g’ underneath it), perhaps learning how to hold a pencil effectively to form those recognisable letters, and writing their own name (DCSF, 2008, p. 54). Therefore, although boys were mostly able to form letters and memorise some familiar combinations of them, in comparison to girls, fewer of them were able to integrate this knowledge when constructing words and phrases/sentences in novel and independent situations. The findings are consistent with previous research on gender differences with older children and children with writing disabilities (aged from 6-7 years) on measures, such as writing letters of the alphabet from memory, single word spelling, written expression in sentence, paragraph and essay construction (e.g. Berninger & Fuller, 1992; Berninger et al, 2008).
There is an exception to this pattern of results. No significant differences (although the findings approached significance) were found between boys and girls in the syntactical complexity of the phrases/sentences they wrote. That is, girls wrote more phrases/sentences, but this was not necessarily accompanied by a sophisticated knowledge of the spelling conventions required to represent grammatical complexity through morphological awareness within those sentences. In order to be able to code and analyse the number of morphemes employed in writing reliably, spelling has to be more precise. For example, the children would have had to incorporate the appropriate representation morphemic endings of words such as ing, ed, es. Analyses at word and phrase/sentence level would include those words that corresponded to the intended word either visually or phonetically, as well as words which were accurately spelled.
In an attempt to gain an understanding of the underlying reasons why young boys were generally less likely to perform at the levels girls were able to in their writing, measures were taken of the children’s memory storage and processing capabilities. On measuring boys’ and girls’ working memory functioning (e.g. the phonological short-
271 | JOURNAL OF WRITING RESEARCH
term memory and processing capabilities and visuo-spatial short-term memory), no significant differences were found in the cognitive resources they had available to support writing development. To some extent this was surprising, as working memory is known to underpin some of the skills that are involved in writing (Bourke & Adams, 2003; 2010; Olive, 2004).
Berninger et al (2008) pointed out that coding stimuli, orthographically or phonologically, would require storage and manipulation in short-term memory (visuo-spatial and phonological) to complete the tasks successfully. To support their conclusion that boys and girls differed in their orthographic coding skills, associated differences evident in their performance in these specific domains of working memory would be expected. Alternative, cognitive explanations for this finding are beyond the scope of this research and require a more in-depth investigation into the mediating skills/resources required for orthographic coding that move beyond the assumption of the involvement of working memory. In addition, for this population of children, any future exploration of writing skills would require measures taken at letter level, as well. This is implied within the EYFSP writing scale. Nevertheless, a more explicit measurement of this through experimental methods would allow insight to be gained into why girls progress at a faster rate in moving from letter formation to writing words and sentences.
The finding that there were no significant differences between boys and girls on the language measures assessed was more unexpected. This was despite the fact that Berninger et al (2008) could not find differences between girls and boys in their ability to code information phonologically (see also Berninger & Fuller, 1992; Wolf & Gow, 1985/86). It does suggest that boys should not be relatively advantaged or disadvantaged in comparison to girls with an education strategy promoting phonological awareness. However, it should be borne in mind that this is more likely to enhance reading skills than it is writing skills. Educational practices in literacy are based on the close relationships between speaking and writing (Rose, 2006). Focusing on the development of oral skills in the classroom should confer some benefits to writing. However, Beattie (2007) suggested that practices, such as, ‘‘talk for writing’’ that have been derived from this assumption, have over-simplified the complexity of the relationship within the school environment. For example, Kress (1994 suggested that taking knowledge of the sound-based representation of letters to one of visual representation of symbols is less straightforward than it would initially seem to be. Beattie (2007) proposed that some consideration should be given to whether the practice of ‘‘talk for writing’’ should continue and/or be undertaken using the same methods. As far as she could ascertain in relation to writing, boys know what they want to say. Subsequently, the difficulty emerges in transposing this into written form.
Since the univariate analyses did not directly consider the relative contribution made to the significant differences between boys and girls on their writing performance by individual differences in age, language skills and working memory, further explorations using hierarchical regressions were undertaken. Firstly, they revealed that
BOURKE & ADAMS DIFFERENCES IN LANGUAGE SKILLS AND WORKING MEMORY | 272
gender was not able to make an independent contribution to the variance in the psycholinguistic measures of writing once those factors were taken into account. The linguistic indices of the quality of writing were included, as there is the assumption that writing draws upon the same pool of cognitive resources as speech (Bourdin & Fayol, 1996); specifically that ideas for text are first translated into linguistic representations (Swanson & Berninger, 1996) and that the translation processes are affected by the ease with which linguistic information can be accessed and maintained (McCutchen, 1986. Nonetheless, writing is generally regarded as more demanding in terms of the processes involved in execution (Bourdin & Fayol, 1996). Further, although theoretically the writing task can be cognitively demanding for adults, translating ideas into text is likely to be a qualitatively different operation for children when they must struggle with low-level production concerns (e.g. mapping the correct symbolic representation [grapheme] of a sound in handwriting and spelling) than later when these sub-processes are more likely to be achieved automatically. Therefore, regardless of gender, mastery of writing should be more difficult that speaking. However, it is not clear from these findings why girls manage to accomplish this more easily than boys.
A different pattern emerges for the hierarchical regressions conducted for the EYFSP writing scale. Both gender and general language ability (receptive vocabulary, expressive language, and verbal comprehension) were found to account for an independent proportion of the variance in children’s performance on this measure. The writing rating scale represents a continuum that goes from those children who demonstrate very few of the competencies expected by the UK Government and are just beginning to grasp the link between sounds and symbols to convey their ideas, to those who exceed them by writing more than one sentence (QCA, 2008. Further exploration of the data revealed that the crucial language factor in explaining the independent variance in children’s writing skills was their verbal comprehension development. Some of the children performed extremely well on this and were able to complete some of the final section of the test which assessed the children’s ability to draw inferences based on their real world knowledge. In contrast, children with a lower level of attainment, although able use concepts other than nouns and verbs to relate attributes, such as colour, size and position of objects (toys) and negatives, to directions such as ‘‘Find a yellow pencil’’ and ‘‘Show me the smallest button’’, were less able to extend this to the assimilation of other parts of speech within the one sentence when responding. In terms of writing, this may confer an advantage that could be mediated by gender.
This aspect of language development is differentiated from the other measures of general language ability, as it requires a more sophisticated range of linguistic analyses undertaken by the children. Verbal comprehension could better characterise the difficulties involved in writing and the variation in language skills available to each gender. The maturational timetable for language highlighted by Reznick, Corley and Robinson (1997), whereby there is evidence to suggest that girls appear to be more advanced in their verbal reasoning skills at an earlier age, appears to be relevant here.
273 | JOURNAL OF WRITING RESEARCH
However, since the univariate analyses did not reveal a more specific gender difference on this variable, it is possible that verbal comprehension is reflecting the common variance with writing development that is more attributable to the sophisticated general processing and motivational skills that are required for both tasks.
Much of the research that has been carried out in relation to writing development has focused on children who are able to compose texts. At the earlier stage of writing that is demonstrated in this research, the children are grasping the letters, words and sentences that are required for writing. Although some children can write something that approximates text composition, for the majority of children this is not something that is expected within the current education system in the UK (DCFS, 2010). As Beattie (2007) suggests, we have to think carefully about why and how we expect strategies, such as ‘‘talk for writing’’, to improve the performance of writers. The prolificacy of adult male success in writing outside of educational contexts suggests that there may be a requirement for effective development through the school-based curriculum and assessment for instruction and guidance to move beyond recognising the effects of internal factors, such as attentional resources and spoken language skills. It seems that not only do adult males know what they want their writing to say, they are also very adept at doing this.
Recently, as the pattern of gender differences has become more consistent across researchers, Myhill (2000) and Daly (2003) have explored the attitudes expressed by students about writing and whether these attitudes could be attributed to gender differences. Primarily, they found that boys disliked adhering to a more formalised style of writing. Increasingly, there was evidence that boys with weaker handwriting also associated writing with failure and this lack of confidence in transcription resulted in less effort being maintained in academic tasks. This lack of confidence may be crucial in accounting for the differences between boys and girls in the value that they ascribe to the various elements of the writing process (Pajares & Valiante, 2001; Shell, Colvin, Bruning, 1995; Wigfield & Eccles, 1992). The ability to employ self-regulatory strategies (mediated by the central executive) could be affected by the degree of anxiety associated with the process of writing (Ashcraft, & Kirk, 2001; Dutke, & Stober, 2001; Elliman, Green, Rodgers & Finch, 1997). Hence, rather than differences in central executive processing (e.g. self-regulation and monitoring) being considered in isolation, a comprehensive investigation into the interaction between cognition, emotion and writing should be undertaken with young writers. There is a suggestion that the relationship between self-worth and writing is present at the earliest stages of writing development (Pajares & Valiante, 1997). The importance of self-efficacy in any cognitively-demanding cannot be underestimated (Eysenck, Deralshan, Santos, & Calvo, 2007). It is possible that the valuable lesson that girls are learning within the school environment, at an earlier stage than boys, is that they are good at language. This is then providing them with the motivation and the stamina to develop their transcription skills to the level of accuracy required to attain UK Government standards in writing at the end of their first stage of education (DFCS, 2010).
BOURKE & ADAMS DIFFERENCES IN LANGUAGE SKILLS AND WORKING MEMORY | 274
References Adams, A-M., Bourke, L.J., & Willis, C.S. (1999). Working memory and spoken language
comprehension in young children. International Journal of Psychology, 34(5/6), 364-373. doi: 10.1080/002075999399701
Adams, A-M., & Gathercole, S.E. (2000). Limitations in working memory: Implications for language development. International Journal of Language and Communication Disorders, 35(1), 95-117. doi: 10.1080/136828200247278
Alloway, T.P., Gathercole, S.E., Adams, A.M., & Willis, C., Eaglen, R., & Lamont, E. (2005a). Working memory and special educational needs. Educational and Child Psychology, 22, 56-67.
Alloway, T.P., Gathercole, S.E., Adams, A.M., & Willis, C., Eaglen, R., & Lamont, E. (2005b). Working memory and other cognitive skills as predictors of progress towards early learning goals at school entry. British Journal of Developmental Psychology, 23, 417-426. doi: 10.1348/026151005X26804
Arnold, R. (1996). Raising levels of achievement in boys. Slough: NFER/EMIE Ashcraft, M. H., & Kirk, E. P. (2001). The relationships among working memory, math anxiety and
performance. Journal of Experimental Psychology: General, 30(2), 224-237. doi: 10.1037/0096-3445.130.2.224
Baddeley, A.D. (1986). Working memory. Oxford: Oxford University Press. Baddeley, A.D. (1996). Exploring the central executive. The Quarterly Journal of Experimental
Psychology, 49A(1), 5-28. doi: 10.1080/713755608 Baddeley, AD. (2000). The episodic buffer: A new component of working memory? Trends in
Cognitive Sciences, 4(11), 417-423. doi: 10.1016/S1364-6613(00)01538-2 Baird, J., Stevenson, J. C., & Williams, D. C. (2000). The evolution of ADHD: A disorder of
communication? The Quarterly Review of Biology, 75, 17-35. doi: 10.1086/393256 Barrs, M. & Pidgeon, S. (2002). Boys and writing. London: CLPE Bartholomew, D.J. (2004). Measuring intelligence: Facts and fallacies. Cambridge: Cambridge
University Press. doi: 10.1017/CBO9780511490019 Bauermeister, J.J., Shrout, P.E., Chávez, L., Rubio-Stipee, M., Ramirez, R., Padilla, L., et al. (2007).
ADHD and gender: Are the risks and sequela of ADHD the same for boys and girls? Journal of Child Psychiatry, 48, 831-839. doi: 10.1111/j.1469-7610.2007.01750.x
Beattie, A. (2007). Exploring the value of dialogue in improving boys’ writing. Changing English, 14(2), 161-174. doi: 10.1080/13586840701442976
Bereiter, C., & Scardamalia, M. (1987). The Psychology of written composition. Hillsdale, NJ: L. Erlbaum Associates.
Berninger, V., & Fuller, F. (1992). Gender differences in orthographic, verbal, and compositional fluency: Implications for assessing writing disabilities in primary grade children. Journal of School Psychology, 30, 363-382. doi: 10.1016/0022-4405(92)90004-O
Berninger, V., Nielsen, K., Abbott, R., Wijsman, E., & Raskind, W. (2008). Gender differences in severity of writing and reading disabilities. Journal of School Psychology, 46, 151-172. doi: 10.1016/j.jsp.2007.02.007
Bourdin, B., & Fayol, M. (1996). Mode effects in a sentence production span task. Current Psychology of Cognition, 15, 245-264.
Bourke, L., & Adams, A-M. (2003). The relationship between working memory and early writing assessed at the word, sentence and text level. Educational and Child Psychology, 20(3), 19-36.
Bourke, L., & Adams, A-M. (2010). Cognitive constraints and the early learning goals in writing. Journal of Research in Reading, 33(1), 94-110. doi: 10.1111/j.1467-9817.2009.01434.x
Catts, H., & Kamhi, A. (Eds). (2005). The connections between language and reading disabilities. Mahwah, NJ: Lawrence Erlbaum Associates.
Daly, C. (2003). Yes he can --- Schools where boys write well. London: Ofsted
275 | JOURNAL OF WRITING RESEARCH
Daneman, M. & Carpenter, P.A. (1980). Individual differences in working memory and reading. Journal of Verbal Learning and Verbal Behaviour, 19, 450-466. doi: 10.1016/S0022-5371(80)90312-6
Davies, P., Shanks, B., & Davies, K. (2004). Improving narrative skills in young children with delayed language development. Educational Review, 56(3), 271-286. doi: 10.1080/0013191042000201181
Department for Children, Schools and Families (2008). The early years foundation stage profile handbook. London: National Assessment Agency
Department for Children, Schools and Families (2010). Early years foundation stage profile achievement by pupil characteristics, England 2008/09. London.
Department for Education and Employment (2001). The national literacy strategy: Developing early writing. London: DfEE Publications.
Department for Education and Skills (2001). The national Literacy strategy: Framework for teaching. Nottingham.
Department for Education and Skills (2004). Inclusion and pupil achievement. Newcastle. Department for Education and Skills. (2007). Gender and education: The evidence on pupils in
England. London. Dunn, L., Dunn, L., Whetton, C., & Burley, J. (1997). British picture vocabulary scale (2nd Ed.).
Windsor: NFER-Nelson. Dutke, S., & Stober, J. (2001). Test anxiety, working memory and cognitive performance:
Supportive effects of sequential demands. Cognition and Emotion, 15(3), 381-389. doi: 10.1080/02699930125922
Dyson, A.H. (1992). The social worlds of children learning to write in an urban primary school. New York: Teachers College Press.
Edwards, S., Fletcher, P., Garman, M., Hughes, A., Letts, C. & Sinka, I. (1997). The Reynell developmental language scales III. Windsor: NFER-NELSON.
Elliman, N. A., Green, M. W., Rogers, P. J., & Finch, G. M. (1997). Processing-efficiency theory and the working memory system: Impairments associated with subclinical anxiety. Personality and Individual Differences, 23, 31---35. doi: 10.1016/S0191-8869(97)00016-0
Engle, R.W. (2001). What is working memory capacity? In H.L. Roediger, J.S. Nairne, I. Neath, & A.M. Suprenant (Eds.), The nature of remembering: Essays in honor of Robert G. Crowder (pp. 297---314). Washington, DC: American Psychological Association Press. doi: 10.1037/10394-016
Engle, R.W. (2002). Working memory capacity as executive attention. Current Directions in Psychological Science, 11(1), 19-22 doi: 10.1111/1467-8721.00160
Engle, R.W., Carullo, J.J., & Collins, K.W. (1991). Individual differences in working memory for comprehension and following directions. Journal of Educational Research, 84, 253-262.
Eysenck, M. W., Derakshan, N., Santos, R., & Calvo, M. G. (2007). Anxiety and cognitive performance: Attentional control theory. Emotion, 7, 336-353. doi: 10.1037/1528-3542.7.2.336
Gathercole, S.E., & Alloway, T.P. (2008). Working memory and learning: A practical guide for teachers. London: Sage.
Gathercole, S.E., & Baddeley, A.D. (1996). The children's test of nonword repetition. London, UK: Psychological Corporation.
Gathercole, S.E., & Baddeley, A.D. (2003). Working memory and language. Hove: Psychology Press.
Gathercole, S.E., & Pickering, S.J. (2000). Working memory deficits in children with low achievements in the national curriculum at 7 years of age. British Journal of Educational Psychology, 70, 177-194. doi: 10.1348/000709900158047
Gorard, S., Rees, G., & Salisbury, J. (2001) Investigating the patterns of differential attainment of boys and girls at school, British Educational Research Journal, 27(2), 125-139. doi: 10.1080/01411920120037090
BOURKE & ADAMS DIFFERENCES IN LANGUAGE SKILLS AND WORKING MEMORY | 276
Graetz, B.W., Sawyer, M.G., & Baghurst, P. (2005). Gender differences among children with DSM-IV ADHD in Australia. Journal of the American Academy of Child and Adolescent Psychiatry, 44, 159-168. doi: 10.1097/00004583-200502000-00008
Hall, C., & Coles, M. (1997). Gendered readings: Helping boys develop as critical readers. Gender and Education, 8(3), 311-321.
Henry, L.A., & MacLean, M. (2003). Relationships between working memory, expressive vocabulary and arithmetical reasoning in children with and without intellectual disabilities. Educational and Child Psychology, 20(3), 51-63
Hoskyn, M., & Swanson, H.L. (2003). The relationship between working memory and writing in younger and older adults. Reading and Writing: An Interdisciplinary Journal, 16, 759-784. doi: 10.1023/A:1027320226283
Hulle, C.A., & Lemery, K.S. (2004). Genetic, environmental and gender effects in individual differences in toddler expressive language. Journal of Speech, Language and Hearing Research, 47, 904-912. doi: 10.1044/1092-4388(2004/067)
Issacs, E.B., & Vargha-Khadem, F. (1989). Differential course of development of spatial and verbal memory span: A normative study. British Journal of Developmental Psychology, 7, 377-380. doi: 10.1111/j.2044-835X.1989.tb00814.x
Jacob, B. (2002). Where the boys aren’t: Non-cognitive skills, returns to school and the gender gap in higher education. Economics of Education Review, 21, 589-598. doi: 10.1016/S0272-7757(01)00051-6
Just, M.A., & Carpenter, P.A. (1992). A capacity theory of comprehension: Individual differences in working memory. Psychological Review, 99, 122-149. doi: 10.1037/0033-295X.99.1.122
Kress, G. (1994). Learning to write (2nd Ed). New York: Routledge. Love, A.J., & Thompson, M.D. (1988). Language disorder and attention deficit disorders in young
children referred for psychiatric services: Analysis of prevalence and a conceptual synthesis. American Journal of Orthopsychiatry, 58, 52-64. doi: 10.1111/j.1939-0025.1988.tb01566.x
Machin, S., & McNally, S. (2006). Gender and student achievement. London: Centre for the Economics of Education.
MacWhinney, B. (1995). The CHILDES project (2nd Ed.). Mahwah, NJ: Erlbaum Martino, W., & Kehler, M. (2007). Gender-based literacy reform: A question of challenging or
recuperating gender binaries. Canadian Journal of Education, 30(2), 406-431. doi: 10.2307/20466644
McCutchen, D. (1986). Domain knowledge and linguistic knowledge in the development of writing. Discourse Processes, 10, 267-286. doi: 10.1080/01638538709544676
McCutchen, D., Covill, A., Hoyne, S.H., & Mildes, K. (1994). Individual differences in writing skill: Implications of translating fluency. Journal of Educational Psychology, 86, 256-266. doi: 10.1037/0022-0663.86.2.256
Myhill, D. (2000). Misconceptions and difficulties in the acquisition of meta-linguistic knowledge. Language and Education, 14(3), 151-163. doi: 10.1080/09500780008666787
National Institute of Mental Health (2000). Clinical trials: Attention deficit hyperactivity disorder( ADHD).
Ofsted (1993). Boys and English. London: HMSO Olive, T. (2004). Working memory in writing: Empirical evidence from the dual-task technique.
European Psychologist, 9(1), 32-42. doi: 10.1027/1016-9040.9.1.32 Pajares, F., & Valiante, G. (1997). The predictive and mediational role of the writing self-efficacy
beliefs of upper elementary students. Journal of Educational Research, 90, 353-360. doi: 10.1080/00220671.1997.10544593
Pajares, F., & Valiante, G. (2001). Gender differences in writing motivation and achievement of middle school students: A function of gender orientation. Contemporary Educational Psychology, 26, 366-381. doi: 10.1006/ceps.2000.1069
Price, T.S., Eley, T., Stevenson, P., Saudino, K., & Plomin, R. (2001). Genetic and environmental covariation between verbal and non-verbal cognitive development in infancy. Child Development, 71, 948-959. doi: 10.1111/1467-8624.00201
277 | JOURNAL OF WRITING RESEARCH
Qualifications and Curriculum Authority (2008). Early years foundation stage: Profile handbook. London: QCA.
Reznick, J. S., Corley, R., and Robinson, J. A. (1997). A longitudinal twin study of intelligence in the second year. Monographs of the Society for Research in Child Development, 62(1), 1-54. doi: 10.2307/1166193
Rose, J. (2006). Independent review of the teaching of early reading. Final report. Nottingham: DfES Publications.
Shaywitz, S., Shaywitz, B., Fletcher, J., & Escobar, M. (1990). Prevalence of reading disability in boys and girls. Results of the Connecticut longitudinal study. Journal of the American Medical Association, 264, 998-1002. doi: 10.1001/jama.1990.03450080084036
Shell, D. F., Colvin, C., & Bruning, R. H. (1995). Self-efficacy, attributions, and outcome expectancy mechanisms in reading and writing achievement: Grade-level and achievement-level differences. Journal of Educational Psychology, 87, 386-398. doi: 10.1037/0022-0663.87.3.386
Shore, D. (1995). Phonological recoding and self-teaching: Sine qua non of reading acquisition. Cognition, 55(2), 151-218. doi: 10.1016/0010-0277(94)00645-2
Smith, M. W., & Wilhelm, J. D. (2002). Reading don’t fix no Chevys: Literacy in the lives of young men. Portsmouth, NH: Heinemann.
Stowe, R. M., Arnold, D. H., & Ortiz, C. (2000). Gender differences in the relationship of language development to disruptive behavior and peer relationships in preschoolers. Journal of
Applied Developmental Psychology, 20, 521---536. doi: 10.1016/S0193-3973(99)00024-6 Swanson, H.L., & Berninger, V.W. (1996). Individual differences in children's working memory
and writing skill. Journal of Experimental Child Psychology, 63, 358-385. doi: 10.1006/jecp.1996.0054
Towse, J.N., Hitch, G.J., & Hutton, U. (1998). A re-evaluation of working memory capacity in children. Journal of Memory and Language, 39(2), 195-217. doi: 10.1006/jmla.1998.2574
Treiman, R. (1993). Beginning to spell: A study of first-grade children. New York: Oxford University Press.
Wadsworth, S. J., DeFries, J. C., Stevenson, J., Gilger, J. W., & Pennington, B. F. (1992). Gender ratios among reading disabled children and their siblings as a function of parental impairment. Journal of Child Psychology and Psychiatry, 33, 1229-1239. doi: 10.1111/j.1469-7610.1992.tb00941.x
Wechsler, D. (1996). Wechsler Pre-School and Primary Scale of Intelligence. Revised UK Edition. London: The Psychological Corporation.
Wigfield, A., & Eccles, J. (1992). The development of achievement task values: A theoretical analysis. Developmental Review, 12, 265 --- 310. doi: 10.1016/0273-2297(92)90011-P
Willcutt, E.G., Betjemann, R.S., Wadsworth, S.J., Wadsworth, S.J., Samuelsson, S., Corley, R., Defries, J.C., et al. (2007). Preschool twin study of the relation between attention-deficit/hyperactivity disorder and prereading skills. Reading and Writing, 20, 103-125. doi: 10.1007/s11145-006-9020-3
Wilson, J.T.L., Scott, J.H., & Power, K.G. (1987). Developmental differences in the span of visual memory for pattern. British Journal of Developmental Psychology, 5, 249-255. doi: 10.1111/j.2044-835X.1987.tb01060.x
Wolf, M., & Gow, D. (1985/1986). A longitudinal investigation of gender differences in language and reading development. First language, 6, 81-110. doi: 10.1177/014272378600601701
Wood, E.A (2000). The roots of under-achievement of boys in literacy in the early years. Paper presented to British Educational Research Association, University of Cardiff, September 2000.
Zevenbergen, A.A., & Ryan, M.M. (2009). Gender differences in the relationship between attention problems and expressive language and emerging academic skills in preschool-aged children. Early Child Development and Care, 180(10), 1337-1348. doi: 10.1080/03004430903059292

BOURKE & ADAMS DIFFERENCES IN LANGUAGE SKILLS AND WORKING MEMORY | 278